funding and structures for local economic growth · national audit act 1983 for presentation to the...
TRANSCRIPT

Funding and structures for local economic growth
Department for Communities and Local Government and Department for Business, Innovation & Skills
Reportby the Comptroller and Auditor General
HC 542 SESSION 2013-14 6 DECEMBER 2013

The National Audit Office scrutinises public spending for Parliament and is independent of government. The Comptroller and Auditor General (C&AG), Amyas Morse, is an Officer of the House of Commons and leads the NAO, which employs some 860 staff. The C&AG certifies the accounts of all government departments and many other public sector bodies. He has statutory authority to examine and report to Parliament on whether departments and the bodies they fund have used their resources efficiently, effectively, and with economy. Our studies evaluate the value for money of public spending, nationally and locally. Our recommendations and reports on good practice help government improve public services, and our work led to audited savings of almost £1.2 billion in 2012.
Our vision is to help the nation spend wisely.
Our public audit perspective helps Parliament hold government to account and improve public services.

Report by the Comptroller and Auditor General
Ordered by the House of Commons to be printed on 5 December 2013
This report has been prepared under Section 6 of the National Audit Act 1983 for presentation to the House of Commons in accordance with Section 9 of the Act
Amyas Morse Comptroller and Auditor General National Audit Office
3 December 2013
Department for Communities and Local Government and Department for Business, Innovation & Skills
HC 542 London: The Stationery Office £16.00
Funding and structures for local economic growth

Our study focuses on the government’s progress in implementing structures and funding to support a shift in responsibility for local economic growth to local bodies.
© National Audit Office 2013
The text of this document may be reproduced free of charge in any format or medium providing that it is reproduced accurately and not in a misleading context.
The material must be acknowledged as National Audit Office copyright and the document title specified. Where third party material has been identified, permission from the respective copyright holder must be sought.
Links to external websites were valid at the time of publication of this report. The National Audit Office is not responsible for the future validity of the links.
Printed in the UK for The Stationery Office Limited on behalf of the Controller of Her Majesty’s Stationery Office
2608075 12/13 PRCS

The National Audit Office study team consisted of: Edd Ainslee, Alex Burfitt, Sam Burford, Alex Knight, Rose Martin, Caroline Murray, Andy Nichols, Mark Parrett, Sarah Shakespeare, Matthew Taylor, David Timmins and Durk Zwaagstra, under the direction of Stephen Fitzgerald and Aileen Murphie.
This report can be found on the National Audit Office website at www.nao.org.uk/2013-local-growth
For further information about the National Audit Office please contact:
National Audit Office Press Office 157–197 Buckingham Palace Road Victoria London SW1W 9SP
Tel: 020 7798 7400
Enquiries: www.nao.org.uk/contact-us
Website: www.nao.org.uk
Twitter: @NAOorguk
Contents
Key facts 4
Summary 5
Part OneNew structures for local growth 14
Part TwoFunding for local economic growth 19
Part ThreeNew arrangements for local economic growth 26
Part FourCoordination, accountability and monitoring 35
Appendix OneOur audit approach 40
Appendix TwoOur evidence base 42
Appendix ThreeSpending on local growth programmes 44

4 Key facts Funding and structures for local economic growth
Key facts
39 Local Enterprise Partnerships approved by December 2011
24 Enterprise Zones operating by April 2012
8 City Deals agreed in principle in July 2012
32,000 jobs reported to have been created or safeguarded directly through the Regional Growth Fund by the end of 2012-13
£599 million (89 per cent)
capital element of the Growing Places Fund allocated to local projects by Local Enterprise Partnerships from the Department’s June 2013 survey
17 Local Enterprise Partnerships that the Department for Business, Innovation & Skills considers to have a ‘strong case’ to represent a functional economic area
54,000 original estimate of jobs to be created in Enterprise Zones by 2015, published by HM Treasury in 2011 based on information reported by Local Enterprise Partnerships
6,000 to 18,000 revised estimate by the Department for Communities and Local Government of jobs to be created in Enterprise Zones by 2015
39 per cent of successful bidders to the first round of the Regional Growth Fund had received their final contract nine months after the initial announcement of successful schemes
97 per cent of successful bidders to the third round of the Regional Growth Fund had received their final contract nine months after the announcement of successful schemes following government investment to speed up the programme
£3.9bn £1.2bn £53mour estimate of funding from central government 2011-12 to 2014-15 on the local growth schemes covered in this report
spent by departments in 2011-12 on the local growth schemes covered in this report
our estimate of funding actually paid to end beneficiaries in 2011-12 from the schemes in this report

Funding and structures for local economic growth Summary 5
Summary
1 In 2010, the government set out its plan for local economic growth in the White Paper Local growth: realising every place’s potential.1 The White Paper’s core objective is “to achieve strong, sustainable and balanced growth that is more evenly shared across the country and between industries”. The plans are part of the government’s national economic policy, set out by HM Treasury and the Department for Business, Innovation & Skills in the 2011 Plan for Growth.2
2 The 2010 White Paper described a new approach to local economic growth based on three main principles that reflect the government’s localism agenda which aims to devolve power to communities and ensure that “where the drivers of growth are local, decisions [are] made locally”:
• Shifting powers to local communities and businesses: principally through the closure of the Regional Development Agencies and the introduction of Local Enterprise Partnerships. The White Paper also discussed possible new arrangements for EU funds administered by the Regional Development Agencies.
• Promoting efficient and dynamic markets and increasing confidence to invest: through reforms to the planning system and the introduction of new incentives and powers for local authorities such as the New Homes Bonus, business rates retention and tax increment financing.
• Focused investment: initially through the Regional Growth Fund, and subsequently through the Growing Places Fund, Enterprise Zones and City Deals. The White Paper also referred to capital investment in infrastructure such as transport and communications.
1 HM Government, Local growth: realising every place’s potential, Cm 7961, October 2010.2 HM Treasury and the Department for Business, Innovation & Skills, The Plan for Growth, March 2011.

6 Summary Funding and structures for local economic growth
Scope of our report
3 This report focuses on the first and last of these three strands: focused investment through new programmes specifically designed to support growth in particular places, together with the role of the Local Enterprise Partnerships as the key strategic local growth bodies that oversee or play a significant role in the delivery of the new investment programmes. This report examines whether departments are implementing these new local growth programmes in a way that is likely to achieve the government’s objectives and provide value for money. We have considered:
• new structures for local economic growth (Part One);
• how funding is distributed (Part Two);
• progress in implementing new structures and funding (Part Three); and
• whether coordination, accountability and monitoring are adequate (Part Four).
4 We interviewed departmental officials and examined departmental data. Locally, we looked at six case studies and conducted 46 telephone interviews with local authorities and Local Enterprise Partnerships. We have also drawn on our previous report The Regional Growth Fund.3 We have not sought to assess the impact of these initiatives on long-term economic growth in terms of Gross Domestic Product or Gross Value Added, but looked for evidence of outputs such as jobs created. Our approach is set out in Appendices One and Two.
5 We plan to report in 2014 on progress made in implementing recommendations made by the NAO and the Committee of Public Accounts in 2012 about the Regional Growth Fund.
Background
6 Government plans for local growth have evolved and developed since the 2010 local growth White Paper as new initiatives and funds have been added. There is no single definition of local growth policy. For the purposes of this report we have examined the four largest new local growth programmes and Local Enterprise Partnerships, the key new strategic body, as follows:
Local Enterprise Partnerships
• Small, strategic partnerships, created by local businesses and civic leaders to provide the vision and leadership to drive growth locally.
Enterprise Zones
• Geographically-defined areas hosted by Local Enterprise Partnerships in which businesses can receive a range of incentives to start up or expand.
3 Comptroller and Auditor General, The Regional Growth Fund, Session 2012-13, HC 17, National Audit Office, May 2012.

Funding and structures for local economic growth Summary 7
The Growing Places Fund
• Comprises revolving investment funds overseen by Local Enterprise Partnerships providing support, predominantly through loans, to help provide short-term infrastructure projects and support local economic growth.
The Regional Growth Fund
• A competitive fund open to businesses, Local Enterprise Partnerships and local authorities that provides funding to encourage private sector enterprise and lever private sector investment.
City Deals
• Agreements between central government and cities that aim to give new powers, freedoms and funding mechanisms to local decision-makers.
7 We estimate that central government funding to support local economic growth, through the new initiatives covered in this report, is currently £3.9 billion over the four years to 2014-15. Government funding for these local growth programmes, where it is going to local authorities and Local Enterprise Partnerships, is mostly provided via the Department for Communities and Local Government.
8 The new local growth programmes sit within a broader significant body of ongoing spending that also supports local growth. This includes EU Structural Funds and spending by departments and local authorities on areas such as skills, transport and housing. While not within its scope, this report looks at the change in the overall level of this spend in order to set the new initiatives in context.
Key findings
Structural change
9 Since 2010, there has been a complete change in the structures and funding mechanisms to support local growth alongside devolution of powers to the local level. Local growth policy over decades has seen existing structures and funding regimes often replaced by new schemes. Since 2010, government has almost completely removed previous programmes for local growth and replaced them with a new set of structures and funding mechanisms, alongside new local freedoms and responsibilities (paragraph 1.4 and Figure 3).
New structures and funding for local growth
10 As a result of its deficit reduction objective, central government spending on the local economic growth programmes in this report has fallen (Figure 1 overleaf). Over the five-year period 2010-11 to 2014-15 the government will spend £6.2 billion on local growth programmes, including £2.4 billion spent via Regional Development Agencies and their legacy, and £3.9 billion spent on the new funds and structures covered in this report. In comparison, the Regional Development Agencies spent £11.2 billion over the five-year period 2005-06 to 2009-10 (paragraph 2.3).

8 Summary Funding and structures for local economic growth
Figure 1Changes to funding for local economic growth, 2011-12 to 2014-15
Notes
1 Reflects actual (before 2013-14) and forecast (2013-14 onwards) spending by departments on the new local growth programmes covered in this report; Regional Development Agency legacy spend is forecasts only. City Deal spend is estimates only. Recycling of funds used for loans is not reflected. The data is also at Appendix Three.
2 Wider growth-related spending by central and local government (see paragraphs 2.14 to 2.15) is shown as context but is not available for 2012-13 onwards.
Source: National Audit Office analysis of departmental data
Regional Development Agencies legacy
£5 million
Regional Growth Fund
£1,393 million
Regional Development Agencies legacy
£23 million
Regional Growth Fund
£529 million
Regional Development Agencies legacy
£66 million
Regional Growth Fund
£160 million
Regional Development Agencies
£1,461 million
Regional Development Agencies
£585 million
Regional Development Agencies legacy
£230 million
Local growth-related spending
2014-15
2013-14
2011-12
2010-11
Breakdown of direct central government funding for local economic growth through the new schemes covered in this report
0
£ billion
25 50 75
27
32
29
32
Wider departmental growth spending
Local government growth spending
Direct funding for local growth covered in this report
2012-13 24 29

Funding and structures for local economic growth Summary 9
Figure 1Changes to funding for local economic growth, 2011-12 to 2014-15
Notes
1 Reflects actual (before 2013-14) and forecast (2013-14 onwards) spending by departments on the new local growth programmes covered in this report; Regional Development Agency legacy spend is forecasts only. City Deal spend is estimates only. Recycling of funds used for loans is not reflected. The data is also at Appendix Three.
2 Wider growth-related spending by central and local government (see paragraphs 2.14 to 2.15) is shown as context but is not available for 2012-13 onwards.
Source: National Audit Office analysis of departmental data
Total
£1,714 million
City Deal Funding
£72 million
Enterprise Zone Funding
£223 million
Local Enterprise Partnerships (running costs)
£21 million
Total
£785 million
City Deal Funding
£118 million
Enterprise Zone Funding
£94 million
Local Enterprise Partnerships (running costs)
£21 million
Total
£273 million
City Deal Funding
£33 million
Enterprise Zone Funding
£8 million
Local Enterprise Partnerships (running costs)
£6 million
Total
£1,461 millionRegional Development Agencies
£1,461 million
Total
£2,016 million
Regional Growth Fund
£465 million
Local Enterprise Partnerships (running costs)
£6 million
Growing Places Fund
£730 million

10 Summary Funding and structures for local economic growth
11 The transition from the Regional Development Agencies to the new local growth landscape covered in this report shows a marked dip in funding. In 2012-13, £321 million was provided to end beneficiaries via the new growth programmes, alongside £66 million of Regional Development Agency legacy spending. This compares to £1.5 billion spent by the Regional Development Agencies two years previously in 2010-11, and estimated payments to end beneficiaries of £1.9 billion through the new local growth programmes in 2014-15. There are two main reasons for this dip. First, government closed the Regional Development Agencies rapidly, as planned to realise savings, but introduced the new local growth programmes gradually over a different time frame. Second, the Regional Growth Fund had a slow start and government has not allocated funding as quickly as originally planned (paragraphs 2.5 to 2.11).
12 In addition to direct spending on these local growth programmes, central and local government spent £52.7 billion on wider growth-related activity in 2012-13, a reduction of £11.4 billion (18 per cent) from 2010-11 (Figure 1). Central government reduced growth-related spending by bodies such as the Skills Funding Agency, Homes and Communities Agency, and UK Trade & Investment, by £4.5 billion (14 per cent) in 2011-12 and by a further £3.1 billion (11 per cent) in 2012-13. Local authorities also reduced their spending by £2.8 billion (9 per cent) on a range of services linked to local growth including housing and transport. Local growth spending by local authorities fell by a further £900 million (3 per cent) in 2012-13 (paragraphs 2.14 to 2.15).
Progress in creating the new structures and funds
13 The 2010 local growth White Paper committed the government to “ensuring an orderly transition from Regional Development Agencies to the new delivery landscape”. In our view, this has not been achieved. The government closed the Regional Development Agencies, and abolished certain functions or transferred them upwards to central departments and their agencies, effectively and as planned. However, government conceived and introduced the new programmes covered in this report, which are aimed at transferring responsibility downwards to the local level, gradually and over a different time frame (paragraphs 3.2 to 3.5).
14 The departments have made some headway and the new structures are moving towards implementation. Issues remain, however:
• Local Enterprise Partnerships are making progress though at different rates. Some partnerships continue to face significant capacity issues, a factor exacerbated by the recent step change in the demands placed upon them through introducing the Growth Deals and new responsibilities for EU Structural Funds. Government has responded with additional funds to build partnerships’ capacity (paragraphs 3.6 to 3.12).
• The government has established 24 Enterprise Zones, but they face a significant challenge to create the number of jobs expected. Job creation forecasts have changed from an initial expectation of 54,000 additional jobs by 2015 to an assessment of between 6,000 and 18,000. By July 2013, the Department for Communities and Local Government had agreed action plans with each Enterprise Zone setting out the key actions required to provide growth by 2015 (paragraphs 3.13 to 3.16).

Funding and structures for local economic growth Summary 11
• Local Enterprise Partnerships are allocating funding from the Growing Places Fund to local projects but evidence of outputs in terms of new jobs, houses and improved transport to date has been limited. Local Enterprise Partnerships allocated £599 million (89 per cent) of capital funds to 305 local infrastructure projects by mid-2013. However, those projects only spent an estimated £56 million and created 112 jobs in 2012-13 (paragraphs 3.17 to 3.19).
• The Regional Growth Fund has begun to create and safeguard jobs in 2011-12, but the slow start means that the fund now faces a heavily back-loaded spending profile. The Department for Business, Innovation & Skills has improved its central scheme management, reflected in improvements in the management of the third and fourth rounds. Nonetheless, the funding profile for 2013-14 and 2014-15 is challenging. The Department reported that the fund created 32,000 jobs by the end of 2012-13 against a target of 31,500. However, 40 schemes (21 per cent of operational schemes) achieved less than 25 per cent of their annual jobs targets (paragraphs 3.20 to 3.24).
15 The eight City Deals are at an early stage but are progressing well in establishing the right structures and processes. These initiatives have been welcomed in areas that have them, while other localities are keen to introduce the initiative in their areas. Central government is negotiating potential deals with 20 more areas and by the end of November 2013 had announced four of these deals (paragraph 3.25).
Coordination, accountability and monitoring
16 The government did not design the local economic growth initiatives covered in this report as a coordinated national programme with a common strategy, set of objectives and implementation plan; although it has made changes over time to help address this. The new initiatives covered in this report are each managed separately and there is joint working on each initiative. In June 2013, the government formed a local growth cabinet committee, chaired by the Deputy Prime Minister, to oversee initiatives affecting local economic growth. The cross-Whitehall local growth programme board has programme responsibility for Growth Deals (paragraphs 4.2 to 4.3).
17 The government does not have a clear plan to measure outcomes and evaluate performance and therefore show value for money across the programme. As a result, departments cannot be sure about where to direct their resources to achieve the most impact. Although individual initiatives monitor their progress it is not done in the same way across initiatives. Consequently, this does not present an overall comparable picture of performance. There is no shared evaluation framework or plans to introduce one (paragraphs 4.5 to 4.6).
18 The Department for Communities and Local Government is using its system of accountability for local authority spending for the new structures for local growth. However, the involvement of Local Enterprise Partnerships in decision-making presents risks which need to be managed (paragraphs 4.7 to 4.11).

12 Summary Funding and structures for local economic growth
19 Locally, it is not clear that the government has achieved its objective to “increase democratic accountability and transparency, and ensure that public expenditure is more responsive to the needs of local business and people”:
• The allocation of the Regional Growth Fund, the most substantial component of local growth funding, is decided centrally following a competitive process. While this may be responsive to local businesses it has no direct connection to the local democratic process. Increasing democratic accountability and transparency was never an objective for the Regional Growth Fund (paragraph 4.7).
• Links between Local Enterprise Partnerships, and therefore the Enterprise Zones, Growing Places Fund and the Growth Deals, and the local democratic process are complex and weak in certain instances (paragraphs 4.8 to 4.10).
• Local Enterprise Partnerships are not subject to the same transparency requirements as local authorities (paragraph 4.11).
Conclusion on value for money
20 Three years on from the 2010 White Paper, the new local growth landscape is taking shape and outputs are beginning to be delivered. However, a key government objective of ensuring an orderly transition to the new growth landscape has, in our view, not been achieved. The government closed the Regional Development Agencies and transferred certain functions upwards to central departments effectively, but introduced the new local programmes covered in this report gradually and over a different time frame. This is reflected in a significant dip in funding and outputs over this period. Furthermore, progress by Local Enterprise Partnerships has been mixed and job creation in Enterprise Zones and through the Growing Places Fund and Regional Growth Fund has been slow. Therefore, and without sufficient transparency or a comparable picture of performance across schemes, the new structures for achieving local economic growth have not yet demonstrated that they are capable of delivering value for money.
21 To secure value for money from existing schemes, and from the new £2 billion Growth Deals, central government needs to ensure that sufficient capacity is in place both centrally and locally to oversee initiatives, and make sure that timescales are realistic and that accountability is clear. Departments need to manage the range of local growth initiatives as a programme and address how they intend to evaluate performance and monitor outcomes across the programme as a whole. Otherwise departments have no basis for matching resources against priorities across the portfolio of initiatives to achieve best overall value for money.

Funding and structures for local economic growth Summary 13
Recommendations
22 The Departments for Communities and Local Government and Business, Innovation & Skills, should:
a Plan more effectively in future reorganisations of local growth programmes to avoid unnecessary dips in activity; for example to sequence effectively the closure of existing programmes and the introduction of new ones.
b Work with other departments and Local Enterprise Partnerships to understand the implications for local growth programmes of ongoing reductions in wider government spending, so that decisions on priorities for funding can be taken in context.
c Continue to monitor and develop the capability and capacity of Local Enterprise Partnerships as their role develops.
d Provide sufficient capacity centrally to ensure the effective and efficient delivery of funding initiatives including the Local Growth Fund.
e Draw on information needed by Local Enterprise Partnerships and cities to manage their business, and the work of the ‘What Works Centre’, to:
• develop project monitoring frameworks to allow genuine comparisons between different programmes based on consistently defined indicators; and
• monitor and evaluate, where technically possible, the collective impact of the range of local growth initiatives.
f Develop a strategy for evaluating the additionality of jobs created on Enterprise Zones, focused on understanding the effects on surrounding local economies of any job displacement linked to the zones.
g Review the current arrangements for the coordination, accountability and transparency of local growth programmes, in order to:
• manage and monitor local growth initiatives and structures as an overall programme;
• ensure that the system for accounting to Parliament for the central government funding for local growth is transparent and gives sufficient assurance; and
• work with Local Enterprise Partnerships to ensure that their local transparency arrangements are robust and meet the expectations placed on local authorities.
14 Part One Funding and structures for local economic growth
Part One
New structures for local growth
1.1 The government set out its policy for local economic growth in the 2010 White Paper Local growth: realising every place’s potential.4 It called for a: “more balanced economy [that] is not so dependent on a narrow range of sectors, is driven by private sector growth and has new business opportunities that are more balanced across the country and between industries”.
1.2 This part sets out:
• the economic and policy context of the White Paper; and
• details of the main new local growth structures and funds covered in this report.
Economic context
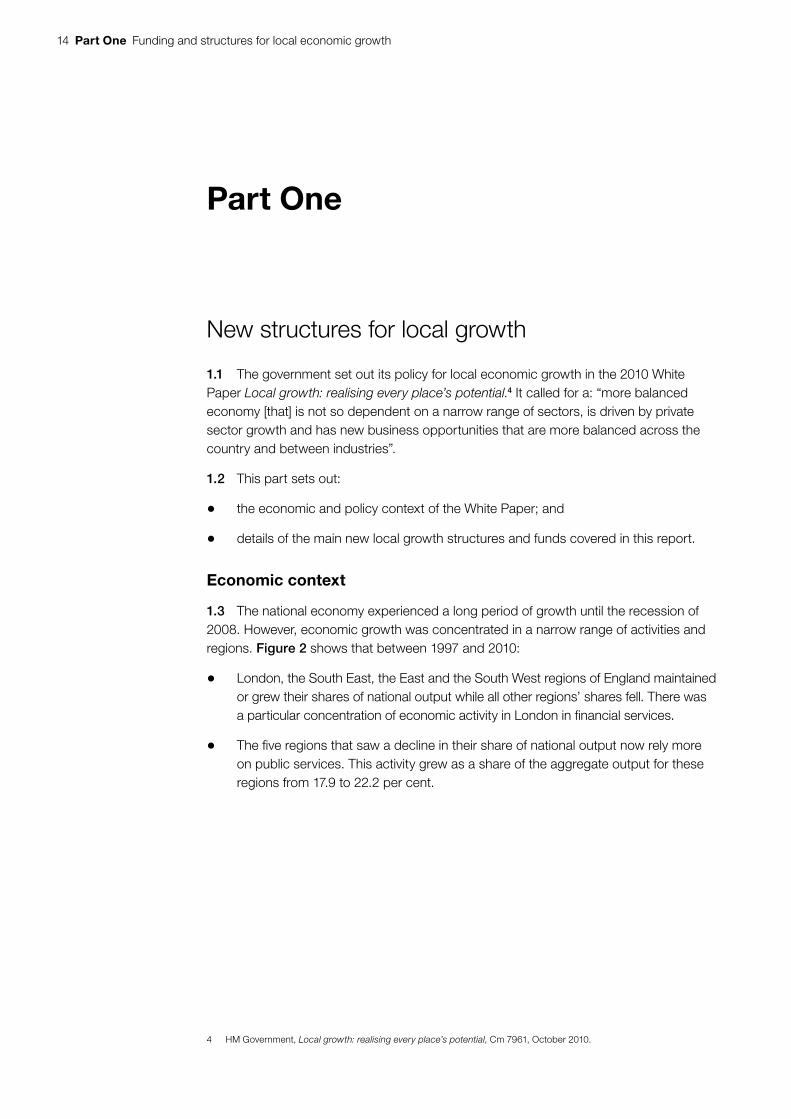
1.3 The national economy experienced a long period of growth until the recession of 2008. However, economic growth was concentrated in a narrow range of activities and regions. Figure 2 shows that between 1997 and 2010:
• London, the South East, the East and the South West regions of England maintained or grew their shares of national output while all other regions’ shares fell. There was a particular concentration of economic activity in London in financial services.
• The five regions that saw a decline in their share of national output now rely more on public services. This activity grew as a share of the aggregate output for these regions from 17.9 to 22.2 per cent.
4 HM Government, Local growth: realising every place’s potential, Cm 7961, October 2010.

Funding and structures for local economic growth Part One 15
Notes
1 Gross Value Added (GVA) measures the contribution to the economy of individual producers, industries or sectors. This figure uses workplace-based GVA by industry groups at current basic prices at NUTS1 level.
2 ‘Public services’ includes public administration and defence; compulsory social security; education; human health and social work. It includes both public and private sector providers involved in these activities.
Source: National Audit Office analysis of national statistics
All other sectors
Financial and insurance activities
Public services
Figure 2Percentage share of national workplace GVA1 by region and sector,2 1997 and 2010
Economic growth has been concentrated in a narrow range of activities and regions
Share of national GVA (%)
30
25
20
15
10
5
01997 2010
London
1997 2010
South East
1997 2010
East ofEngland
1997 2010
South West
1997 2010
North West
1997 2010
WestMidlands
1997 2010
Yorkshire and Humber
1997 2010
EastMidlands
1997 2010
North East
Region

16 Part One Funding and structures for local economic growth
The policy context
1.4 Addressing uneven economic growth between and within regions has been a focus of government policy for a number of years. Local growth policy has seen a sequence of initiatives over a number of decades where structures and funding regimes are often replaced by new schemes (Figure 3). The phase of change in place since 2010 is distinctive. It has entailed the almost complete removal of existing structures and funding for local growth, both locally and regionally, and their replacement with new structures and funding, local freedoms and responsibilities. In contrast, previous phases of change have tended to be incremental and overlapping. As we have reported previously, reorganisations can be poor value for money due to poorly-specified objectives, limited cost and benefit monitoring, and poor implementation planning.5,6 Such change also often entails unquantifiable non-financial costs in addition to financial costs.
New funding and structures
1.5 The changes since 2010 have come from:
• the government’s priority for deficit reduction, and its concerns over the Regional Development Agencies’ effectiveness, which meant that the agencies and other initiatives could not be funded at their previous level;7 and
• the government’s desire to establish “a new approach to local growth” based on devolving “real power to communities”8 and an expectation that new funding and structures will operate on a smaller scale and be more efficient.
Closing structures and funds
1.6 The government abolished Regional Development Agencies, urban regeneration companies and city development companies and abolished, withdrew funding from or did not reappoint other regional bodies and strategies. At the local level a range of programmes, including the Local Enterprise Growth Initiative, Local Authority Business Growth Incentive and the Working Neighbourhood Fund, have all ended since 2010.
5 Comptroller and Auditor General, Reorganising central government bodies, Session 2010–2012, HC 1703, National Audit Office, January 2012.
6 Comptroller and Auditor General, Reorganising central government, Session 2009-10, HC 452, National Audit Office, March 2010.
7 Department for Business, Innovation & Skills, Impact Assessment: Abolition of the Regional Development agencies, November 2011.
8 See footnote 4.

Funding and structures for local economic growth Part One 17
Figure 3Regular changes in initiatives for local growth
Source: National Audit Office analysis of departmental information
1114 31
34
5 7 13 15 17 2329
35
33
36
3732
2192
1 12 19 22 25 30
38
272624181610
3 6 8 20
28
1975 1980 1985 1990 1995 2000 2005 2010 2015
1 Urban Programme (expansion)2 Urban Development Corporations3 Urban Development Grant4 Derelict Land Grant5 Regional Development Grant (revision)6 Urban Regeneration Grant7 Regional Enterprise Grant8 City Grant9 Training and Enterprise Councils10 City Challenge11 English Partnerships12 Single Regeneration Budget13 Government Offices for the Regions
14 National Coalfields Programme15 Regional Development Agencies16 New Deal for Communities17 Enterprise Grant Scheme18 Urban Regeneration Companies19 Local Strategic Partnerships 20 Neighbourhood Renewal Fund 21 Housing Market Renewal Pathfinders22 Local Authority Business Growth incentive23 Selective Finance for Investment24 Working Neighbourhoods Fund 25 Local Area Agreements26 Local Enterprise Growth Initiative
27 City/Economic Development Companies28 Multi Area Agreements/City Region Pilots 29 Grants for Business Investment30 Future Jobs Fund31 Homes and Communities Agency32 Enterprise Zones (new phase)33 Local Enterprise Partnerships34 Regional Growth Fund35 City Deals36 Growing Places Fund37 Tax Increment Finance38 Business Rates Retention
Currently operational
Closed since 2010
Closed prior to 2010
4
Regional schemes/bodies
Local schemes/bodies

18 Part One Funding and structures for local economic growth
Switching from administrative regions to functional economic areas
1.7 The new approach involves efforts “to deliver economic development activities at the most appropriate level to maximise their impact”.9 The government intended that Local Enterprise Partnerships represent functional economic areas, defined by the Department for Communities and Local Government as an “area over which the local economy and its key markets operate”.10
New structures and funds
1.8 Government introduced a range of new initiatives designed to deliver local growth. The new funds and structures covered in this report are:
Local Enterprise Partnerships
• Created by local business and civic leaders, chaired by a business leader, to set the strategy and vision and take the decisions that will drive growth locally.
Enterprise Zones
• Sites within Local Enterprise Partnership areas where businesses receive incentives to start up or expand, including: simplified planning; a discount on business rates; and government support to provide superfast broadband. All business rate growth within the zone is retained in the local area for at least 25 years. In some areas government provides tax allowances on the costs of certain types of investment including plant and machinery.
The Growing Places Fund
• Investment funds, overseen by Local Enterprise Partnerships, for small infrastructure projects. Funding to local projects is mostly through loans with the repayments reinvested in new projects.
The Regional Growth Fund
• A competitive fund with four bidding rounds to date and a fifth under way. It is open to businesses (in all rounds), Local Enterprise Partnerships and local authorities (in the first four rounds). It provides funding to encourage private sector enterprise, lever in private investment and to support in particular those areas that are currently dependent on the public sector to make the transition to sustainable private sector-led growth.
City Deals
• Agreements negotiated between central government and cities which give local decision-makers new powers, freedoms and funding channels. The first wave of deals is with the eight largest cities outside London. Two City Deals are led by Local Enterprise Partnerships; the others by local authorities. The government is currently negotiating a second wave of City Deals with 20 areas.
9 See footnote 4.10 Department for Communities and Local Government, Functional Economic Market Areas: An economic note,
February 2010.

Funding and structures for local economic growth Part Two 19
Part Two
Funding for local economic growth
2.1 Government spending shapes local growth through a combination of general, ongoing public expenditure in areas such as housing and transport, and through focused investment programmes specifically designed to promote local growth. These focused local investment programmes were previously delivered via the Regional Development Agencies. Currently, they take place primarily through the five new structures and funding mechanisms covered in this report.11
2.2 This section examines the government’s progress in giving new funding to support local growth. We examined:
• changes in the level of local growth funding, and the government’s progress in making this funding available to the new schemes; and
• changes in wider government spending in areas such as transport, housing and skills that also support local growth.
Changes in central government funding for local growth
Profile of central government funding for local growth
2.3 In line with its deficit reduction plans, government has reduced funding for local growth programmes. Over the five-year period 2010-11 to 2014-15 the government will spend a total of £6.2 billion on local growth programmes, including £2.4 billion spent by Regional Development Agencies and £3.9 billion spent on the new funds and structures covered in this report. In comparison, the Regional Development Agencies spent £11.2 billion over the five-year period 2005-06 to 2009-10 (see Figure 4 overleaf and Appendix Three).
2.4 The Local Growth Fund will give £2 billion annually to Local Enterprise Partnerships from 2015-16. The fund will be made up of funding previously managed by central government, such as for skills, and funding previously allocated to local government, such as the New Homes Bonus and funding for local major transport schemes. The government also plans to give Local Enterprise Partnerships control over £5 billion of EU Structural Funds over the period 2014 to 2020. Local Enterprise Partnerships are currently planning how these funds would be prioritised.
11 Government also supports focused investments in local growth through EU Structural Funds, included in our analysis of wider growth-related spending by central government.

20 Part Two Funding and structures for local economic growth
2.5 Figure 4 shows that there has also been a marked dip in government funding over the period 2010-11 to 2014-15. Spending by the Regional Development Agencies began to fall in 2010-11. Direct spending by the Regional Development Agencies then fell to £585 million in 2011-1212 as they closed down, with a further £230 million spent in that year on activities transferred to other government departments and bodies. The Department for Business, Innovation & Skills estimates that a further £94 million will be spent on Regional Development Agency legacy activities over the period 2012-13 to 2014-15.
2.6 Spending of £1.2 billion on the new schemes in 2011-12, alongside spending linked to Regional Development Agencies, raised total spending on local growth programmes to £2 billion for that year. This compares with spending of £273 million the following year, and £785 million in 2013-14.
12 Excludes closure costs such as severance payments and transfer of assets.
Figure 4Government spending on Regional Development Agencies and new local growth funds and structures, 2005-06 to 2014-15 – payments by departments
Spend (£bn)
There has been a marked dip in government funding
Notes
1 Spending by Regional Development Agencies is from their annual reports and accounts and excludes closure costs.
2 Data for 2013-14 onwards is budget data. Earlier data is outturn.
3 Figures have been rounded.
Source: National Audit Office analysis of departmental data
2005-06 2006-07
2.5
2.0
1.5
1.0
0.5
0
Regional Development Agency spend (including legacy)
New schemes
2007-08 2008-09 2009-10 2010-11 2011-12 2012-13 2013-14 2014-15
2.2 2.3 2.3 2.2 2.2
1.51.2
0.8
0.0
0.1
0.2
1.7
0.0
0.8

Funding and structures for local economic growth Part Two 21
Profile of payments to end beneficiaries
2.7 Not all spending by departments on local growth programmes considered in this report goes directly to end beneficiaries. The government placed the £730 million from the Growing Places Fund in 2011-12 and £490 million from the Regional Growth Fund over 2011-12 and 2012-13 with intermediaries, including Local Enterprise Partnerships. Intermediaries then distribute funds to end beneficiaries, such as businesses, according to local priorities, through a variety of means including loans and grants.
2.8 Consequently, while the departments spent £1.2 billion on the new funds and structures in 2011-12, only £53 million reached end beneficiaries in that year (see Figure 5 overleaf and Appendix Three). An estimated £321 million reached end beneficiaries from the new funds and structures in 2012-13. This means that of the funding currently allocated by government to these programmes, a further £3.6 billion remains to be paid to local projects; £1 billion by intermediaries and the balance held by the departments.
Causes of the dip in funding to local growth programmes
2.9 As shown in Figures 4 and 5, 2012-13 is the low point in the dip in funding in the transition from Regional Development Agencies to the new funds and structures covered in this report. In addition to deficit reduction, there are two reasons for this marked dip.
2.10 First, government closed the Regional Development Agencies rapidly, but introduced the new local growth programmes gradually over a different time frame. The Regional Development Agencies ceased operation at the end of 2011-12, but Enterprise Zones, Growing Places Fund and the City Deals were not operational until 2012-13. Over 2011-12 and 2012-13, the Regional Growth Fund was the main source of funding from new programmes.
2.11 Second, the Department for Business, Innovation & Skills has allocated funding from the Regional Growth Fund more slowly than originally planned. We reported in 2012 that the fund had an ambitious spending profile with substantial spending planned in the first two years.13 The Department also had a range of capacity issues in delivering the first two rounds of the fund which they have addressed. As Figure 6 on page 23 shows, the Department allocated nearly all of the Regional Growth Fund available in 2011-12. However, in late 2012, the Department moved much of the planned spend for 2012-13 into later years.
13 Comptroller and Auditor General, The Regional Growth Fund, Session 2012-13, HC 17, National Audit Office, May 2012.

22 Part Two Funding and structures for local economic growth
Figure 5Government spending on Regional Development Agencies and new local growth funds and structures, 2005-06 to 2014-15 – payments to end beneficiaries
Spend (£bn)
An estimated £321 million reached end beneficiaries in 2012-13
Notes
1 Spending by Regional Development Agencies is from their annual reports and accounts and excludes closure costs.
2 £357 million of Regional Growth Fund currently remains with intermediaries. It is not included in this figure but has to be paid to end beneficiaries by the end of 2014-15.
3 Excludes £57 million in revenue funding via the Growing Places Fund as the Department for Communities and Local Government has not monitored its allocation to end beneficiaries.
4 Figures have been rounded.
Source: National Audit Office analysis of departmental data
2005-06 2006-07
2.5
2.0
1.5
1.0
0.5
0
RDA spend (including legacy)
New schemes (to end beneficiaries)
2007-08 2008-09 2009-10 2010-11 2011-12 2012-13 2013-14 2014-15
2.2 2.3 2.3 2.2 2.2
1.5
0.8
0.3
0.1
0.1
1.0
0.01.9
0.0

Funding and structures for local economic growth Part Two 23
Figure 6Regional Growth Fund spending profile compared with the original
Notes
1 These figures are in cash terms.
2 The June 2012 spending profile includes rounds one to three totalling £2.4 billion and is from our report: Comptroller and Auditor General, The Regional Growth Fund, Session 2012-13, HC 17, National Audit Office, May 2012.
3 The June 2013 spending profile includes rounds one to four and the ‘exceptional’ funds totalling £2.6 billion.
Source: National Audit Office analysis of departmental data
2011-12 2012-13 2013-14 2014-15 2015-160
200
400
600
800
1,000
1,200
£000
1,400
475 465
569
160
752
529
604
1,393
Profile in June 2012
Profile in June 2013
63
The Department has allocated funding from the Regional Growth Fund more slowly than originally planned

24 Part Two Funding and structures for local economic growth
Economically deprived areas
2.12 The government aims to develop an economy less dependent on the public sector with growth that is more evenly shared across the country. Figure 7 shows the geographic distribution of funding from the schemes in this report across the Local Enterprise Partnership areas and the locations of the eight wave one City Deals and 24 Enterprise Zones.
1
3
2
5
76
8
4
Figure 7Funding per capita from local growth initiatives covered in this report
Areas with highest growth funding tend to be in the North, major cities and the South West
Growth funding per head of population
< £69
£69–108.9
£109–149
> £149
Overlapping Local Enterprise Partnerships
City Deal
Enterprise Zone
Notes
1 Funding 2011-12 to 2014--15 per head of population aged 16 to 64 by Local Enterprise Partnership area.
2 Excludes ‘exceptional’ Regional Growth Fund, funding through national Regional Growth Fund programmes and all Enterprise Zone fundingexcept pinchpoint funding and business rates forgone in 2012-13.
Source: National Audit Offi ce analysis of departmental data
City Deals
1 Bristol
2 Birmingham
3 Nottingham
4 Sheffield
5 Leeds
6 Liverpool
7 Manchester
8 Newcastle

Funding and structures for local economic growth Part Two 25
2.13 The distribution reflects the aims of the Regional Growth Fund, the single largest component of funding. The fund aims to create private sector jobs and, in particular, to support those areas that have a higher proportion of public sector jobs. The distribution in Figure 7 shows that:
• areas with the lowest growth funding per head of working age population are in central and southern England. London Local Enterprise Partnership receives least; and
• areas with the highest growth funding tend to be in the North (such as the North East and Cumbria), major city regions (such as Liverpool, Birmingham and Solihull) and the South West.
Wider growth-related spending by central and local government
2.14 In addition to the local growth programmes covered in this report there is a significant broader body of spending that supports local growth. This includes EU Structural Funds and spending by central government departments and local authorities on areas such as skills, transport and housing. The Department for Communities and Local Government, for internal purposes, has identified a body of ‘spending on local growth’ by local authorities14 and central government.15 Using this definition, wider government spending on local growth fell by £11.4 billion (18 per cent) from £64.1 billion between 2010-11 and 2012-13 as follows:
• Central government cut its wider growth-related funding by £4.5 billion (14 per cent) in 2011-12, and by a further £3.1 billion (11 per cent) in 2012-13.
• Local authorities cut growth-related services by £2.8 billion (9 per cent) in 2011-12. They reduced spending on these activities by another £900 million (3 per cent) in 2012-13.
2.15 This decline in wider spending on local growth reflects the government’s deficit reduction objectives but has implications for the programmes covered in this report. A number of interviewees from Local Enterprise Partnerships noted that local authorities struggled to provide resources to support the partnerships.
14 This includes local authority spending on housing, transport, planning and development, environmental and cultural services plus capital spending on commercial activities. Funding through new schemes such as New Homes Bonus is included.
15 This includes departmental spending on the Skills Funding Agency, Higher Education Funding Council for England, Technology Strategy Board, UK Trade & Investment, Research Councils, Network Rail, Highways Agency and the Homes and Communities Agency. It also includes spending by the Department for Environment, Food & Rural Affairs on rural development and the green economy, by the Department for Work & Pensions on labour market and employment support programmes and by the Department for Energy & Climate Change on the Green Deal. Spending on Regional Development Agencies, Regional Growth Fund and Growing Places Fund is not included. Funding from the EU Structural Funds, including match funding from departments, is included.

26 Part Three Funding and structures for local economic growth
Part Three
New arrangements for local economic growth
3.1 The local growth White Paper committed the government to “ensuring an orderly transition from Regional Development Agencies to the new delivery landscape”.16 The impact assessment for abolishing the Regional Development Agencies identified “gaps in service delivery” as a possible non-financial cost from closing the agencies and the transition to new structures.17 This section examines the progress made in implementing the new schemes covered in this report. We considered:
• whether the government has achieved its objective of an orderly transition to the new local growth structures and funding; and
• progress of individual initiatives and whether they are well-placed to meet the government’s growth objectives.
Transition to the new arrangements
3.2 The Regional Development Agencies ceased operation in March 2012. Their closure, and the abolition of activities or their transfer to central departments and their agencies, was achieved as scheduled. The Department for Business, Innovation & Skills reported that “closure costs were budgeted at £464 million, but the actual costs were around £100 million less than anticipated”.18
3.3 Closing the agencies began in May 2010, when they were prevented from entering into new financial commitments without departmental approval. However, the Regional Development Agencies were still providing local growth services in 2010-11. In 2011-12, their activities reduced as they ceased providing services or transferred them to departments or successor bodies.
16 HM Government, Local growth: realising every place’s potential, Cm 7961, October 2010.17 Department for Business, Innovation & Skills, Impact Assessment: Abolition of the Regional Development agencies,
November 2011.18 Department for Business, Innovation & Skills, Closing the RDAs: Lessons from the RDA Transition and
Closure Programme, July 2012.

Funding and structures for local economic growth Part Three 27
3.4 However, a key part of the new delivery landscape is also to transfer decision-making to the local level. Figure 8 (overleaf) shows the timetable for closing the Regional Development Agencies against progress in establishing new structures and funds. It demonstrates that there was a gap between the closure of Regional Development Agencies and the gradual establishment of the new structures and funds covered in this report. While significant wider growth-related spending by central and local government, and EU Structural Funds, continued albeit at a reduced level, activity across the new funding streams and structures in 2011-12 was limited:
Local Enterprise Partnerships
• The government announced the invitation to establish new Local Enterprise Partnerships in June 2010. They were still largely in set-up mode in 2011-12 and 2012-13, establishing boards and producing growth plans.
Enterprise Zones
• The government announced the new Enterprise Zones in March 2011. They were operational from April 2012. The Department for Communities and Local Government reported that only 3,080 jobs were created in 2012-13. Seventy-five per cent of these jobs were from seven of the twenty-four zones, while six zones produced ten jobs or fewer.
Growing Places Fund
• The government announced the Growing Places Fund in September 2011. The Department for Communities and Local Government allocated funds to Local Enterprise Partnerships in late 2011-12. There was no expenditure from this fund on local schemes in 2011-12. From information provided to the Department by Local Enterprise Partnerships in its June 2013 survey, the fund is supporting 305 infrastructure projects, 159 of which are under way, and created 112 jobs in 2012-13.
Regional Growth Fund
• The government announced the Regional Growth Fund in October 2010 and four bidding rounds have been completed with the fifth currently under way. However, the Department reported that the scheme had generated only 2,145 new monitored gross jobs by the end of 2011-12. A total of 32,000 jobs had been generated by the end of 2012-13.
City Deals
• The government agreed the first wave of eight City Deals in principle in July 2012. Departments and cities were negotiating the details, and putting the necessary structures in place, for the remainder of 2012-13. A further 20 second-wave deals are in negotiation and should be operating by 2014-15.

28 Part Three Funding and structures for local economic growth
Figure 8Local growth landscape transition timeline
Source: National Audit Offi ce analysis of departmental data
2010-11 2011-12 2012-13 2013-14
Q1 Q2 Q3 Q4 Q1 Q2 Q3 Q4 Q1 Q2 Q3 Q4 Q1 Q2
Regional Development Agencies
Local Enterprise Partnerships
City Deals Wave 2
City Deals Wave 1
Regional Growth Fund 4
Regional Growth Fund 3
Regional Growth Fund 2
Regional Growth Fund 1
Growing Places Fund
Enterprise Zones
Largely operational
Early set-up/partially operational
Announcement/bidding phase
Closing down
Closed
There was a gap between the closure of Regional Development Agencies and the gradual establishment of the new structures and funds covered in this report

Funding and structures for local economic growth Part Three 29
3.5 Overall, 2011-12 and 2012-13 represent a gap in the transition from the Regional Development Agencies to the new local growth programmes. In our view, the White Paper’s objective of “an orderly transition from Regional Development Agencies to the new delivery landscape” has not been achieved. There was an efficient transfer of responsibilities upwards from the Regional Development Agencies, but this has not been the case for the transfer of responsibilities downwards to the local level. While it was intended that there would be reduction in funding due to deficit reduction,19 this was more marked than intended and the new local initiatives covered in this report did not start producing outputs as quickly as planned.
Progress of individual initiatives
Local Enterprise Partnerships
Set-up
3.6 Government invited local business and civic leaders to submit proposals to form Local Enterprise Partnerships. There are 39 Local Enterprise Partnerships that together cover the whole of England. The government announced the first 24 partnerships in October 2010 and approved the final partnership in December 2011. Progress in setting up the partnerships following their initial approval has been mixed; some were based on established partnerships while others were new. By March 2012, nine had published their growth plans.
3.7 The government intends Local Enterprise Partnerships to be strategic bodies that are not resource-intensive to run, with delivery implemented through partners. However, their role has expanded. Firstly through introducing the Growing Places Fund and the Enterprise Zones, over which they have responsibility, and latterly through introducing Growth Deals, where partnerships will take responsibility for substantial amounts of growth funding from 2015-16.
3.8 The government also intended that the partnerships reflect functional economic areas. However, there are questions over whether this has been achieved in all cases. The Department for Communities and Local Government concludes that there is no universal approach to defining functional economic areas.20 However, for the 39 Local Enterprise Partnerships it finally approved, based on their analysis, the Department for Business, Innovation & Skills judged that:
• seventeen made a strong case that they represented a functional economic area;
• sixteen made a plausible case;
• four made a weak case; and
• we have no information on two.
19 See footnote 17.20 Department for Communities and Local Government, Functional Economic Market Areas An economic note,
February 2010.

30 Part Three Funding and structures for local economic growth
3.9 In practice, in approving Local Enterprise Partnerships, government also considered other criteria: business leadership; local authority support; added value and ambition. The Departments for Communities and Local Government and for Business, Innovation & Skills are not monitoring how the economic coherence of the Local Enterprise Partnerships’ areas affects achieving the government’s growth objectives. However, in line with the approach set out in the 2010 White Paper, government has invited partnerships to propose boundary changes should they wish.
Progress
3.10 Several studies have reviewed the progress of Local Enterprise Partnerships.21 The Department for Business, Innovation & Skills has also gathered qualitative information about the progress of the partnerships over time, such as partnerships’ plans, the board’s strength, local authority commitment to the partnership and achievements. This information shows a mixed picture with partnerships making progress at different rates. Areas of concern include: weaknesses in local leadership; changes in board membership which impacts on decision-making; lack of a director or chief executive; not taking advantage of available funding; and insufficient administrative capacity. We found a similar range of issues during our fieldwork.
3.11 The progress of Local Enterprise Partnerships has been affected by their limited resources and capacity coupled with taking on more responsibilities for economic development. The government intended that partnerships’ capacity would come primarily from partner organisations; the majority of partnerships have fewer than ten staff.22 Some local interviewees expressed concern about relying on time given by local authority employees when local authority budgets are reducing. Partnerships highlighted the need for additional support to: enable board members to focus on their strategic roles; provide the capacity to engage with local partners and central government; and provide the skills needed to prepare bids for funding.
3.12 The government has responded to these concerns. Central government initially provided £5 million to help Local Enterprise Partnerships start up and a further £4 million to help them understand local issues and develop action plans. Central government also provided £24 million over the three years up to and including 2014-15 and a further £20 million over 2013-14 and 2014-15 to enable partnerships to build capacity and produce business plans. Each partnership has a senior official in a department who acts as a point of contact with central government. Government has set up a local growth ‘What Works Centre’ to provide decision-makers with better evidence.
21 All Party Parliamentary Group on Local Growth, Rising to the challenge: how LEPs can deliver local growth strategies, October 2013.
22 Centre for Urban Regional Development Studies, Newcastle University, The state of the LEPs – a national survey, presented at the State of the LEPs Seminar, March 2013.

Funding and structures for local economic growth Part Three 31
Enterprise Zones
Set-up
3.13 The Department for Communities and Local Government has approved 24 Enterprise Zones. This is a long-term programme intended to enable Local Enterprise Partnerships to attract investment and jobs. The financial incentives currently available are short term, which creates uncertainty for businesses. The business rates discount ends on 31 March 2015 and the tax allowance for building costs (available in 8 of the 24 zones) ends in March 2017.
Progress
3.14 Information from Enterprise Zones provided to the Department for Communities and Local Government in April and May 2013 suggests that of 175 sites which make up the zones, 91 (52 per cent) are likely to see development activity commence by 2015. The Department has concluded that, across all the Enterprise Zones, between 6,000 and 18,000 jobs could be secured by 2015. This compares to an initial estimate, drawing on information from Local Enterprise Partnerships in 2011 and published by HM Treasury, that the zones would create 54,000 jobs by 2015. The Department attributes this difference in part to tough market conditions which lasted longer than expected. By the end of 2012-13 the zones had created 3,080 jobs.
3.15 In response to information on progress, since January 2013, the Department has strengthened central governance and monitoring arrangements. By July 2013, the Department had agreed the first versions of action plans for each zone, setting out the actions needed to achieve growth by 2015. The government has also provided additional funding, through a local infrastructure fund and funding for improvements to local roads.
3.16 The extent to which jobs are ‘additional’, in that they would not have been created without the zones and that they are not displaced from nearby, will only become clear once the zones have been evaluated. However, the negative impact that job displacement can have on surrounding areas means that the starting locations of firms moving into the zones, and the implications for surrounding areas, should be subject to ongoing monitoring. Also, some schemes to create jobs in the zones have been funded through the Regional Growth Fund and other initiatives. The Department has not assessed whether reported jobs have been double-counted.

32 Part Three Funding and structures for local economic growth
Growing Places Fund
Set-up
3.17 The government announced the Growing Places Fund in September 2011 with £730 million made available to Local Enterprise Partnerships in two tranches in February and March 2012; £673 million in capital and £57 million in revenue funds. The strategic benefits of the fund, set out in the business case, include creation of jobs, more housing and improved transport.
Progress
3.18 The Department for Communities and Local Government has undertaken two surveys of Local Enterprise Partnerships in January and June 2013; the results are self-reported and have not been audited. While the survey is not mandatory, all Local Enterprise Partnerships responded, although they did not answer all questions and only a partial picture of the impact of the fund is captured. From the June survey the Department calculates that of the capital funds provided by government, Local Enterprise Partnerships have allocated £599 million (89 per cent) to local projects. Those local projects spent an estimated £56 million in 2012-13. Local Enterprise Partnerships have allocated 82 per cent of capital funds to projects as loans and will be able to reuse those funds as loans are repaid.23 The Department did not ask how the £57 million of revenue spend has been used.
3.19 The Department reported, from the June survey, that 305 projects are being supported including site preparation, transport infrastructure, housing, office and commercial floor space. Based on responses covering some 70 per cent of projects, the Department estimates that 217,000 jobs, 5,300 businesses and 77,000 houses will be created through the fund and at least 21 projects fund transport infrastructure. The Department reports that the fund had created 112 jobs in 2012-13 with no information on new businesses and houses or improved transport. The Department emphasises that the figures are ‘gross’ estimates. They do not consider, for example, how the addition of the fund could reduce development elsewhere.
23 Department for Communities and Local Government, The Growing Places Fund Investing in Infrastructure, November 2013.

Funding and structures for local economic growth Part Three 33
The Regional Growth Fund
Set-up
3.20 Announced in the June 2010 budget, the first four rounds of the fund currently total £2.6 billion, with £2.55 billion to be spent by 2014-15. The government announced a further £600 million for two further rounds starting in June 2013 and summer 2014. The private sector is expected to contribute. The ratio of private-to-public investment in bids, referred to as ‘leverage’, must be at least £1 of private investment per £1 from the fund.
3.21 We reported in 2012 that work on agreeing terms and conditions with applicants for the first two rounds took the Department for Business, Innovation & Skills longer than expected. It then took longer than planned for applicants to complete the necessary due diligence work.24 Departmental data shows that six months after the announcement of successful bids in each round only 12 per cent of round one and 30 per cent of round two bids had agreed final terms. The figures for 12 months were 69 per cent and 71 per cent respectively. As discussed above, these delays led to a re-profiling of the scheme in 2012.
3.22 The Departments for Communities and Local Government, and Business, Innovation & Skills allocated additional resources to progress bids more rapidly in later rounds. They also introduced a deadline of six months following the announcement of selected bidders by which final award negotiations had to be finalised. This appears to have improved the Departments’ ability to get to final contract. Departmental data for round three shows that 68 per cent of bids had agreed final terms within six months and 97 per cent had agreed final terms within nine months.
Progress
3.23 The Department for Business, Innovation & Skills stated in its Annual Monitoring Report for the fund that 32,000 monitored jobs25 were created or safeguarded by the end of 2012-13.26 The Department’s monthly monitoring data shows that the bulk of the new jobs were created in 2012-13 with only 2,145 created in 2011-12.
3.24 The Department reported the fund’s performance by the end of 2012-13 as slightly above the target of 31,500 monitored jobs (which excludes 5,300 jobs from withdrawn schemes). However, our analysis of departmental data indicates that 33 per cent of the 32,000 jobs created were from one scheme that claims to have exceeded its annual target by 9,138 jobs. While there were a further 55 schemes that exceeded their employment targets, 99 (51 per cent of all operational schemes) failed to meet their target, with 40 of these achieving less than 25 per cent of their annual target; a deficit of 8,525 jobs.
24 Comptroller and Auditor General, The Regional Growth Fund, Session 2012-13, HC 17, National Audit Office, May 2012.25 Monitored jobs are those directly within the control of the fund’s beneficiaries, as opposed to those derived in the wider
economy as a result of the investment.26 Department for Business, Innovation & Skills, Regional Growth Fund Annual Monitoring Report, July 2013.

34 Part Three Funding and structures for local economic growth
City Deals
3.25 The government set out its aims for City Deals in the December 2011 report Unlocking growth in cities,27 and agreed eight deals during 2012. Central government is now negotiating deals with a further 20 cities and by the end of November 2013 had announced the first four of these deals with: Preston, South Ribble and Lancashire; Thames Valley Berkshire; Greater Ipswich; and Southampton and Portsmouth. Each City Deal comprises a number of elements, including devolution of transport funding; investment in low carbon infrastructure, superfast broadband and skills development; and local retention of a higher proportion of business rates over a longer period. The Cabinet Office coordinates the City Deals policy and has reviewed progress in setting up the schemes regularly. The assessment in July 2013 concluded that, with respect to creating the necessary structures and processes, the majority of elements of the first eight City Deals are on track. It is too early to judge what the City Deals have achieved, though they were welcomed in our case study areas.
Growth Deals
3.26 The government is setting up Growth Deals with Local Enterprise Partnerships to operate from 2015-16. This includes the Local Growth Fund, set up in response to Lord Heseltine’s report No Stone Unturned in Pursuit of Growth,28 which provides £2 billion for 2015-16 (with an undertaking to continue this level of funding for five years). Funding will be allocated through a mix of allocation and competition, based on Local Enterprise Partnerships’ new multi-year plans. The partnerships’ plans will also link to £5 billion of EU Structural Funds for 2014 to 2020 and should reflect the range of resources which partnerships are able to draw on.
3.27 Growth Deals represent a substantial broadening of Local Enterprise Partnerships’ roles and create a potential local governance responsibility for partnerships via their strategic economic plans. Partnerships must show “evidence of agreed joint plans and teams on key economic development functions such as housing and transport, and up-to-date local plans that are aligned or jointly prepared by local planning authorities”.29 Local Enterprise Partnerships are working to a timetable to develop their plans and start implementing Growth Deals in April 2015.
27 HM Government, Unlocking growth in cities, December 2011.28 The Rt Hon Lord Heseltine of Thenford CH, No Stone Unturned in Pursuit of Growth, October 2012.29 HM Government, Growth Deals Initial Guidance for Local Enterprise Partnerships, July 2013.

Funding and structures for local economic growth Part Four 35
Part Four
Coordination, accountability and monitoring
4.1 This section examines the coordination, accountability and monitoring mechanisms for local growth programmes. The White Paper aimed to “increase democratic accountability and transparency, and ensure that public expenditure is more responsive to the needs of local business and people”.30 We considered whether there are:
• robust coordination, accountability and performance monitoring measures centrally; and
• adequate accountability and transparency measures locally.
Arrangements in central government
Coordination in central government
4.2 So far the government has managed local growth policies, structures and funding as a series of individual initiatives, each with its own governance arrangements involving several departments. Consequently, local bodies have had to coordinate a range of individual initiatives with different objectives, funding arrangements, timetables and reporting requirements. Local interviewees told us that departments have different approaches to localism and how far they devolve responsibility differs. This makes it difficult for local bodies to be clear about the policy framework within which they operate.
4.3 There is cross-departmental working as the governance for each initiative comprises representatives from the different departments involved. For example, the Regional Growth Fund programme board includes cross-departmental membership as does the board managing City Deals. However, we have seen no evidence that departments take a collective programme approach to investment decisions across the range of initiatives. More recently, the government has established a local growth cabinet committee, chaired by the Deputy Prime Minister, to oversee initiatives affecting local growth. A cross-departmental local growth programme board has been meeting since summer 2012 to help design strategy and identify gaps. Initially this board had no formal programme management responsibilities but has since overseen the development of the Local Growth Fund, which draws together some existing funding streams.
30 HM Government, Local growth: realising every place’s potential, Cm 7961, October 2010.

36 Part Four Funding and structures for local economic growth
Accountability in central government
4.4 A number of government departments have an interest in local growth. It is important therefore that departmental accountabilities are clear. Funding for Local Enterprise Partnerships, Enterprise Zones and City Deals, including the Growing Places Fund, and a proportion of the Regional Growth Fund not going direct to businesses, is routed to local authorities through the Department for Communities and Local Government. Its Accounting Officer is accountable for that funding. However, other departments retain policy interest, including the Departments for Business, Innovation & Skills, the Cabinet Office and HM Treasury. In practice, it is not clear who in central government is ultimately responsible for the success of local growth policy. The vision for local growth in the government’s 2010 White Paper has not been translated into measurable objectives against which to judge achievement and hold departments to account. This was never the intention and reflects the government’s intention to devolve responsibility to local bodies and allow them to decide on their own approaches. There is no plan to consider the long-term economic impacts of the new initiatives overall.
Performance monitoring
4.5 Government departments are monitoring the progress of each local growth initiative in different ways (Figure 9). The information they collect varies and is not comparable across initiatives, as they are designed to judge progress against the policy objectives of each initiative. Information is not adjusted to avoid double-counting between Enterprise Zones, the Regional Growth Fund, the Growing Places Fund and City Deals. This does not therefore present an overall comparable picture of progress of local growth initiatives. Some of the information is provided voluntarily, is incomplete and unvalidated.
4.6 The government is planning some changes to monitoring and evaluation. The Department for Business, Innovation & Skills has a strategy to evaluate the effectiveness of the Regional Growth Fund, and to take account of overlaps with other initiatives. A scoping study is under way. The government has set up a local growth ‘What Works Centre’ to provide decision-makers with better evidence. The City Deals senior officials group agreed to develop monitoring of key outputs and outcomes, using performance data that cities already publish. In negotiating Growth Deals, Local Enterprise Partnerships must set out proposals to monitor and evaluate progress as part of their multi-year strategic plans.31
31 See footnote 29.

Funding and structures for local economic growth Part Four 37
Local arrangements
Strengthening links to the local democratic process
4.7 Government has not set up the Regional Growth Fund with an objective to strengthen links to the local democratic process. Following a competitive process, over the first four rounds, the government has allocated an estimated £1 billion to schemes led by Local Enterprise Partnerships or local authorities and the remaining £1.6 billion directly to businesses. This approach may satisfy the government’s aim to be responsive to the needs of local business. However, it means that a large proportion of the funding available through the new schemes covered in this report falls outside the local democratic process.
Figure 9Central government monitoring of local growth initiatives
Initiatives Which department is monitoring?
What are they monitoring? Frequency and mechanism
Local Enterprise Partnerships
Business Innovation & Skills
Narrative assessment based on qualitative information
Every 2–3 months, departmental assessment
Enterprise Zones
Communities and Local Government
Progress including number of new jobs filled, new businesses and levels of investment in each zone
Quarterly, voluntary completion of template
Growing Places Fund
Communities and Local Government
Progress covering allocation timetable, spending, outputs (acquisitions, construction and housing) and outcomes (number of enterprises, housing and jobs)
Biannual, voluntary completion of template
Regional Growth Fund
Communities and Local Government and Business, Innovation & Skills
As set out in each award: Milestones, spending, private sector investment numbers of jobs created or safeguarded
Quarterly with monthly updates, as required in offer letters
City Deals Cabinet Office Narrative assessment of progress establishing structures and processes for each element of the City Deals
Every six weeks through discussions with cities
Source: National Audit Offi ce analysis of departmental documents

38 Part Four Funding and structures for local economic growth
Local accountability
4.8 The Department for Communities and Local Government’s accountability system statement describes its arrangements for securing the necessary assurance to be accountable to Parliament for its spending on local government.32 The statement emphasises the importance of local government systems to prevent failure, including democratic accountability and the specific responsibilities of appointed officers. Central government uses this system for the local growth programmes covered in this report.
4.9 However, local growth programmes may cover more than one local authority area. In some areas, not all local authorities can be members of a Local Enterprise Partnership board. Also, one or more local authorities may be nominated as being accountable for a Local Enterprise Partnership’s funding. This presents challenges because local authorities and their appointed officers can be asked to be accountable for spending outside their geographic area of responsibility. Partnership working between local authorities like this is not new but some areas are not as established as others. Furthermore, the partnerships are led by unelected business leaders.
4.10 The system may be undermined by responsibilities being unclear. From our telephone interviews with Local Enterprise Partnerships and local authorities, 34 out of 43 interviewees thought that the accountability arrangements were complex and 18 were unclear about them. This was reflected in the feedback we received during case study visits. The government is clear in the guidance for Growth Deals that local governance and accountability arrangements will be assessed as part of the process of agreeing deals with Local Enterprise Partnerships.
Local transparency
4.11 Local authorities have transparency obligations which Local Enterprise Partnerships do not. In July 2013, we examined the websites of the Local Enterprise Partnerships to assess the information published against recommended practice for local authorities (see Figure 10). We found that many partnerships do not meet the transparency standards to which local authorities are held.
32 Department for Communities and Local Government, Accounting Officer Accountability System Statement for local government, March 2012.

Funding and structures for local economic growth Part Four 39
Figure 10Transparency information available on Local Enterprise Partnership websites
Many partnerships do not meet the transparency standards to which local authorities are held
User input
Finance
Source: National Audit Office analysis of 39 Local Enterprise Partnership websites, July 2013
50 10 15 20 25 30 35 39
Accounts
Additional information on grants
Available grants listed
Complaints route
Contact information
Staff structure
Meeting agendas
Governance structure
Who is accountable for funding
Meeting minutes
Named senior staff
Number of Local Enterprise Partnerships
2
25
27
12
15
23
28
32
39
39
3
Organisational transparency

40 Appendix One Funding and structures for local economic growth
Appendix One
Our audit approach
1 This study examined whether the government’s programme for local economic growth was likely to achieve value for money. We reviewed:
• the implementation, design and coordination of initiatives introduced to promote local economic growth following the publication Local growth: realising every place’s potential,33 in October 2010;
• local progress to date, based on an in-depth analysis of six case studies and 46 telephone interviews; and
• the accountability, governance and monitoring arrangements for local growth funding.
2 We have not tried to assess the impact of these initiatives on economic growth as they are designed to work in the long term. The study focuses on the strategic issues and potential risks to value for money in implementing government policy for local economic growth.
3 Our audit approach is summarised in Figure 11. Our evidence base is summarised in Appendix Three.
33 HM Government, Local growth: realising every place’s potential, Cm 7961, October 2010.

Funding and structures for local economic growth Appendix One 41
Figure 11Our audit approach
Our evaluative criteria The coherence of the approach
within programmes.The clarity and robustness of accountability, monitoring and evaluation arrangements.
The capacity of central and local bodies to achieve growth.
Our evidence
(see Appendix Two for details)
We examined departmental and policy documents and interviewed officials.
We interviewed policy officials, local growth stakeholders and reviewed accountability and governance documents.
We analysed funding data, interviewed officials and reviewed departmental and local bodies’ documents.
The government’s objective The government set out broad objectives for local economic growth in its 2010 White Paper. The key elements of
the policy are “recognising that where the drivers of growth are local, decisions should be made locally” and a more balanced economy with less dependence on the public sector. The government also aimed to achieve an orderly transition from the old to the new growth landscape.
How this will be achieved Setting up new structures and initiatives. This included closing the Regional Development Agencies and creating
Local Enterprise Partnerships, Enterprise Zones and City Deals.
The government also sought to support investment in places and people to tackle the barriers to growth. This included establishing the Regional Growth Fund.
Our studyOur study focuses on the government’s progress in implementing structures and funding to support a shift in responsibility for local economic growth to local bodies. We looked at whether departments are implementing policies to achieve local economic growth in a way that is likely to meet the government objectives and be value for money.
Our conclusionsThe new local growth structures and funding are taking shape but in our view the orderly transition has not been achieved. This left a significant dip in growth-related funding and outputs. New structures for local economic growth have not yet shown that they are capable of being value for money.

42 Appendix Two Funding and structures for local economic growth
Appendix Two
Our evidence base
1 We reached our conclusions after analysing evidence that we collected between November 2012 and August 2013. We applied a range of quantitative and qualitative techniques in our examination.
2 We analysed the level and distribution of public funding available through various local growth initiatives, including:
• the Regional Growth Fund;
• the Growing Places Fund;
• the City Deals wave 1;
• the Enterprise Zones funds;
• local authority economic development expenditure; and
• Local Enterprise Partnership start-up, core and capacity funding.
3 We analysed nationally available data sets on a range of economic indicators.
4 We assessed the clarity and robustness of accountability and monitoring arrangements using our framework for assessing accountability, based on evidence from document review and interview evidence.

Funding and structures for local economic growth Appendix Two 43
5 We conducted six case study visits: two focused on Local Enterprise Partnerships; two focused on local authorities; and two focused on cities with City Deal. We interviewed a range of officials and stakeholders and reviewed supporting documentation. We chose these case studies on the basis of inclusion criteria including region, level of public funding, organisational structure and a range of economic indicators. We looked for evidence in the following areas: their role in promoting local economic growth; their capacity to achieve local economic growth; the accountability and governance arrangements; the funding streams available for local economic growth; progress; and how success is monitored and measured. We visited:
• East Riding of Yorkshire Council.
• Southwark Council.
• Cornwall and Isles of Scilly Local Enterprise Partnership.
• North Eastern Local Enterprise Partnership.
• Bristol.
• Nottingham.
6 We conducted 46 semi-structured telephone interviews with officials from 31 local authorities and 15 Local Enterprise Partnerships to see how growth initiatives are operating locally. Potential interviewees were categorised based on their local characteristics of deprivation, public sector employment and economic development spend per head. We then selected a representative sample of bodies from these categories based on their involvement with City Deals, whether they were urban or rural and their regional location. We conducted descriptive analysis of the case study and telephone interviews using a qualitative coding framework that was designed to draw out the key themes identified from responses.
7 We conducted semi-structured interviews with departmental officials at:
• the Cabinet Office
• HM Treasury
• the Department for Communities and Local Government
• the Department for Business, Innovation & Skills.
8 We set up an expert panel of prominent academics, policy officials and economic development practitioners to provide independent scrutiny and advice to the study team.

44 Appendix Three Funding and structures for local economic growth
Appendix Three
Spending on local growth programmes
Spend by Departments 2010-11 2011-12 2012-13 2013-14 2014-15 Total to 2014-15
Funds remaining
after 2014-15
Regional Growth Fund rounds 1–4 0 465 160 529 1,393 2,547 63
Of which paid to intermediaries 0 418 72 – – – –
Growing Places Fund 0 730 0 0 0 730 0
Of which paid to intermediaries 0 730 0 0 0 730 0
Enterprise Zones 0 0 8 94 223 325 0
City Deals 0 0 33 118 72 223 0
Local Enterprise Partnerships 0 6 6 21 21 54 0
Total spend by departments on new local growth programmes
0 1,201 207 762 1,709 3,879 63
Regional Development Agencies – direct spend 1,461 585 0 0 0 2,046 0
Regional Development Agencies – legacy spend 0 230 66 23 5 324 0
Total 1,461 2,016 273 785 1,714 6,249 63
Payments to end beneficiaries
Regional Growth Fund 0 47 218 529 1,393 2,187 63
Of which from intermediaries 0 3 130 – – – –
Growing Places Fund1 0 0 56 254 234 544 129
Of which from intermediaries2 0 0 56 254 234 544 129
Other new local growth programmes 0 6 47 233 316 602 0
Total payments to end beneficiaries from new local growth programmes
0 53 321 1,016 1,943 3,333 192
Regional Development Agencies – direct and legacy spend
1,461 815 66 23 5 2,370 0
Total 1,461 868 387 1,039 1,948 5,703 192
Notes
1 The department monitored the allocation of £673 million in capital funding from Local Enterprise Partnerships to local schemes. A further £57 million in revenue funding is not monitored and not recorded here.
2 Estimated based on the June 2013 survey and adjusted to remove ‘over-programming’ where partnerships allocate more than they have been awarded in the expectation that not all projects will go ahead.
3 Total payments to end beneficiaries from 2013-14 to 2015-16 will be larger as £357 million remained with Regional Growth Fund intermediaries at the end of 2012-13.
Source: National Audit Office analysis of departmental data

This report has been printed on Evolution Digital Satin and contains material sourced from responsibly managed and sustainable forests certified in accordance with the FSC (Forest Stewardship Council).
The wood pulp is totally recyclable and acid-free. Our printers also have full ISO 14001 environmental accreditation, which ensures that they have effective procedures in place to manage waste and practices that may affect the environment.
Design and Production by NAO Communications DP Ref: 10285-001

Published by TSO (The Stationery Office) and available from:
Online www.tsoshop.co.uk
Mail, telephone, fax and email TSO PO Box 29, Norwich NR3 1GN Telephone orders/general enquiries: 0870 600 5522 Order through the Parliamentary Hotline Lo-Call 0845 7 023474 Fax orders: 0870 600 5533 Email: [email protected] Textphone: 0870 240 3701
The Houses of Parliament Shop 12 Bridge Street, Parliament Square, London SW1A 2JX Telephone orders/general enquiries: 020 7219 3890 Fax orders: 020 7219 3866 Email: [email protected] Internet: http://www.shop.parliament.uk
TSO@Blackwell and other accredited agents
£16.00
9 780102 987225
ISBN 978-0-10-298722-5