future of healthcare - nawaloka
TRANSCRIPT

Nawaloka Hospitals PLC
Annual Report 2017/18
FUTURE OF HEALTHCARE


PB, 1
TH
E F
UT
UR
E O
F H
EA
LT
HC
AR
E –
For over three decades now, Nawaloka’s pioneering spirit has secured a leading position in Sri Lanka’s healthcare sector. We are proud of our reputation for professionalism, technological innovation and customer service. Our contributions towards better healthcare in the country continue to grow from strength to strength, enriching the lives of people.
As we navigate a “golden era” of innovation in healthcare, we are keenly aware that it is our ability to foresee the challenges of the future, prepare for exigencies, and respond to the consequences will ultimately empower us to create value in the short, medium and long term. It is this foresight that drives our success and allows us to make the bold claim that “Nawaloka is the Future of Healthcare”.
THE FUTURE OF HEALTHCARE

2,
Naw
alok
a H
osp
ital
s P
LC
|
A
nn
ual
Rep
ort 2
017/
18
CONTENTS
03 About this Report
05 About Nawaloka
06 Year at a Glance
08 Milestones
83 Business Partner Capital
89 Social and Environmental Capital
97 Environmental Capital
146 Senior Independent Director’s Statement
147 Chief Executive Officer’s and Head of Finance Statement of Responsibility
158 Statement of Changes in Equity
159 Cash Flow Statement
160 Notes to the Financial Statements
149 Financial Reports 2017/18
156 Statement of Financial Position
150 Independent Auditors’ Report
155 Statement of Profit or Loss and Other Comprehensive Income
205 Annexes
211 Quarterly Statistics
206 Independent Assurance Report
212 Ten Year Statistical Summary
214 Notice of Meeting
208 GRI Content Index
136 Annual Report of the Board of Directors
144 Related Party Transactions Review Committee
141 Remuneration Committee Report
145 Directors’ Responsibility in Financial Reporting
142 Audit Committee Report
106 Stewardship
113 Executive Clinical Management Team
106 Board of Directors
115 Corporate Governance
110 Management Team
132 Risk Management
37 Management Discussion And Analysis
37 Financial Capital
49 Investor Capital
41 Intellectual Capital
54 Customer Capital
67 Employee Capital
14 Business Model
14 Our Business Model
17 Operating Environment
23 Swot Analysis
24 Strategic Direction
10 Chairman/CEO’s Message
12 Director/General Manager’s Review
28 Stakeholders
35 Materiality

2, 3
Abo
ut T
his
Rep
ort
ABOUT THIS REPORT
This is the sixth consecutive integrated Annual Report of Nawaloka Hospitals PLC. This Report provides an overview of the the financial and non-financial information, key functions, strategic investments, and the main business lines of Nawaloka. Further, it includes material information on Nawaloka’s value creation process and outlines information on Nawaloka’s approach to strategy, governance, performance, and sustainability in a clear, comprehensive manner.
Nawaloka creates sustainable value for itself as well as to all its stakeholders. Nawaloka is also cognisant of the significance of sustainability and has seamlessly integrated sustainability reporting with financial reporting illustrating their intrinsic link and the Company’s integrated approach.
Reporting period Nawaloka Annual Report 2017/18 covers the 12-month period from 1 April 2017 to 31 March 2018.
This year’s Report follows a similar reporting format to the past report, and is consistent with the Company’s usual reporting cycle with regards to financial and sustainability reporting. The previous Annual Report covered the period from 1 April 2015 to 31 March 2016.
Report boundary and materiality The boundary of this Report comprises the activities of Nawaloka Hospitals PLC and its three subsidiaries – New Nawaloka Hospitals (Private) Limited, New Nawaloka Medical Centre (Private) Limited, Nawaloka Medicare (Private) Limited and Nawaloka Green Cross Laboratories (Private) Limited. This Report focuses on aspects that are material to the Company’s and its ability to create value over the short, medium, and long term. There are no significant changes in the scope and aspect boundaries and there were no restatements of information provided in previous chapters.
Compliance This Report is a reflection of the Company’s compliance with the laws and regulations of the Companies Act No. 07 of 2007 the subsequent amendments and Listing Rules of the Colombo Stock Exchange (CSE). The information presented in the report is in
compliance with all the necessary laws, regulatory measures and standards, and guidelines for voluntary disclosures.
This Report adheres to the recommendations and guidelines set out by the International Financial Reporting Standards (IFRS) and the Sri Lanka Accounting Standards (SLFRS/LKAS) applicable for financial periods beginning on or after 1 January 2012. The accounting policies adopted are detailed in the Financial Statements.
This integrated Annual Report draws on concepts, principles, and guidance given in the following, where applicable:
• Global Reporting Initiative (GRI) Sustainability Reporting Guidelines GRI Standards (www.globalreporting.org);
• The International Integrated Reporting Framework (IIRC) (www.theiirc.org);
• Smart Integrated Reporting MethodologyTM
(www.SmartAnnualReport.com).
Precautionary principle The Company applies the precautionary principle in relation to social and environmental sustainability. We are highly mindful of the impacts caused to society and environment by our actions and take necessary steps to mitigate such risks and the Company has taken necessary steps to mitigate environmental risks in operational planning and activities.
Queries
We welcome your comments or questions on this Annual Report. Please contact :
The Accountant Nawaloka Hospitals PLC No. 23, Deshamanya H K Dharmadasa Mawatha, Colombo 00200 Sri Lanka. Email: [email protected]: +94 11 557 7111

Naw
alok
a H
osp
ital
s P
LC
|
A
nn
ual
Rep
ort 2
017/
18
4,

4, 5
Abo
ut N
awal
oka
ABOUT NAWALOKA
Our foundation
Led by the founding philosophy of Arogya Parama Laba or “good health is the supreme wealth”, Nawaloka Hospitals PLC has been a voice of private healthcare since its inception in 1985. From our humble beginnings, we have expanded to become the preferred private healthcare institution of the country. Nawaloka was established undertaking the mission of “Healing with feeling” by our founder Chairman – late Deshamanya H K Dharmadasa.
Our pioneering spirit We were the first fully-fledged private hospital in Sri Lanka, thus we see ourselves as pioneers since we were at the forefront to contribute towards a thriving private healthcare system in Sri Lanka. Our pioneering spirit is evident in the way we have always discovered new means to improve lives, health, and well-being of our people. Following our vision “To be the hospital of tomorrow”, we continue to spearhead the private healthcare of the country by being cognisant of the latest trends in the industry, including the technological transformations, to serve our patient’s evolving needs. From facilities to infrastructure, we have introduced many cutting-edge initiatives to private health care: We were the first to introduce CT Scanners in Sri Lanka in 1987, we were the first private sector hospital to establish a dedicated Cardiothoracic Unit, and we instituted our very own Nurses Training School in September 1986.
Our commitment to the people
We believe in providing equal opportunities and access to quality healthcare for all Sri Lankans. To achieve this goal, we are committed to offer affordable, world-class healthcare to all our customers that come from every strata of society.
Our structure Nawaloka Hospitals PLC consists of three subsidiaries – New Nawaloka Hospitals (Private) Limited, New Nawaloka Medical Centre (Private) Limited, Nawaloka Medicare (Private) Limited and Nawaloka Green Cross Laboratories (Private) Limited. Nawaloka Hospitals was listed on the Colombo Stock Exchange in 2004.
New Nawaloka Hospitals (Pvt) Ltd.
New Nawaloka Medical Centre
(Pvt) Ltd.
Nawaloka Medicare (Pvt) Ltd.
Nawaloka Green Cross Laboratories
(Pvt) Limited
Fully Owned Subsidiaries
Nawaloka Hospitals PLC

6,
Naw
alok
a H
osp
ital
s P
LC
|
A
nn
ual
Rep
ort 2
017/
18
YEAR AT A GLANCE
Group Company
2017/18Rs.
2016/17Rs.
2017/18Rs.
2016/17Rs.
Income Statement Date
Revenue 7,955,278,613 6,299,910,436 3,568,770,483 2,568,162,863
Cost of services (3,551,349,412) (2,997,276,079) (1,532,151,922) (1,359,482,350)
Gross profit 4,403,929,201 3,302,634,357 2,036,618,561 1,208,680,513
Other operating income 198,816,074 70,375,782 534,238,431 169,209,127
Profit from operations 1,174,203,124 654,060,357 993,606,987 (12,864,992)
Net profit after taxation 179,958,539 240,874,683 453,607,982 (436,680,843)
Balance sheet data
Shareholders’ funds 4,258,504,793 4,434,605,437 1,274,086,896 974,254,815
Financial ratios
Gross profit ratio (%) 55 52 57 47
Net profit ratio (%) 2 4 13 (17)
Increase in revenue (%) 26 8 39 (9)
Return on Equity (%) 4.23 5.43 36 (45)
Current asset ratio (times) 0.67 0.83 1.37 1.30
Quick asset ratio (times) 0.56 0.73 1.31 1.24
Return on assets (%) 1 2 4 (5)
Debt/equity ratio 1.86 1.37 3.75 4.80
Earnings/(loss) per share (Rs.) (After share split) 0.13 0.17 0.32 (0.31)
Net assets per share (Rs.) (After share split) 3.02 3.15 0.90 0.69
Dividend per share (Rs.) 0.10 0.08 0.10 0.08
56
54
52
50
48
Gross profit margin (%)
2013/14 2014/15 2015/16 2016/17 2017/18
12
9
6
3
0
ROCE
2013/14 2014/15 2015/16 2016/17 2017/18
8,000
6,000
4,000
2,000
0
Revenue (Rs. Mn.)
2013/14 2014/15 2015/16 2016/17 2017/18
6,000
4,500
3,000
1,500
0
Profit before tax (Rs. Mn.)
2013/14 2014/15 2015/16 2016/17 2017/18
76,

6, 7
Yea
r at
a G
lanc
e –
Employee Capital
2,837No. of Employees (2016/17 – 2,363)
943New recruits in 2017
12,326 Hours of training
92.66% Highly satisfied employees
Customer Capital
30,031Patient admissions
538,202Channel appointments
1,122Foreign patient admissions
94%Customer satisfaction level
3,414ETU admissions
17,055Surgeries conducted in 2017
Intellectual Capital
LKR 835 Mn.Brand value
LKR 12,146 Mn.Enterprise value
A+Brand Finance rating
193Nurses with over 10 years of experience
Financial Capital
LKR 7,955 Mn.Revenue(2016/17 – Rs.6,300 Mn.)
55%Gross Profit Margin(2016/17 – 52%)
LKR 0.13Earnings Per Share(2016/17 – Rs. 0.17)
Business Partner Capital
917No. of Consultants(2016/17 – 503)
55No. of Foreign Suppliers(2015/16 – 54)
1,060No. of Local Suppliers(2015/16 – 756)
Social and Environmental Capital
LKR 11.34 Mn. Investment in School Development Projects(2016/17 – LKR 2.1 Mn.)
LKR 8.9 Mn.Investment in the community (2016/17 – LKR 3.9 Mn.)
38No. of Medical Camps (2016/17 – 12)
41No. of Awareness Programmes(2016/17 – 26)

8,
Naw
alok
a H
osp
ital
s P
LC
|
A
nn
ual
Rep
ort 2
017/
18
MILESTONES
1985-19901985• Established as the first fully-fledged private
hospital in Sri Lanka
• First Intensive Care Unit in a private hospital
1987• First CT Scanner in Sri Lanka
1991-20001992• First Mammography Unit in Sri Lanka
1993• First Minimally Invasive Laparoscopic Surgery
in Sri Lanka
1994• First Cardiac Catheterisation Laboratory in
Sri Lanka
• First Coronary Artery Bypass Surgery Unit in a private hospital
1995• First MRI Scanner in Sri Lanka
1998• We are the only Hospital to win the Sri Lankan
National Quality Award
2000• We became the only ISO-Certified Hospital
in Sri Lanka
• Awarded the ‘Baby-Friendly Hospital’ status from the WHO and United Nation Children’s Fund
2001-20102005• We made significant advances in Neuro
Surgery and Cardiac Surgery
• We introduced Laser Eye Surgery
• Together with our Indian affiliates, we introduced a very successful IVF Treatment Centre
2006• We commenced construction of the new
building providing modern surgical units
• Computerising the entire operation of the hospital
2007• First to introduce the Flat Panel – Angiography
System with state-of-the-art technology
• First to introduce a Comprehensive Polysomnography System
• Introduction of a state-of-the-art Pulmonary testing facility
2008• First to introduce the Arcadis Orbics Isocentric
Digital C-Arm X-Ray system for Orthopedics
• Introduction of Digital Video Endoscopy System
2009• First Private Hospital in Sri Lanka with 400 beds
• First Private Hospital to introduce ERCP (Endoscopic Retrograde Cholangiopancreatography)
• Installed the most technologically advanced Hemodialysis machine
• First Hospital to introduce ‘LED Lamps’ in Operating Theatres
2010• Introduced 16 slice CT Scanner with
all accessories
• New 4D Scanner for Radiology and Gynaecology
• Introduced Ultrasonic Defector
98,

8, 9
Mile
ston
es
2011-20172011• Commissioned first state-of-the-art 3 TESLA
MRI Scanner in Sri Lanka
• Awarded ISO 9001:2008 Certification
• Inaugurated Weight Management Centre
• Inaugurated Breast Cancer Screening Centre
• Single Balloon Enteroscope
• Doppler-Guided Hemorrhoid Artery Ligation and Rectal Anal Repair
2012• First Live Donor Liver Transplant surgery
in Sri Lanka
• Launch of Life Member Hospitality Card
2013• Vitro Retinal Eye Surgery
• Endovenous (Vericose) Laser Treatment – EVLT
• High Definition (HD) Arthroscopy System
• Infant, CPAP Ventilation for Paediatric Intensive Care Unit (PICU)
2014• We installed South Asia’s first and world’s
fastest, most accurate 640 slice CT Scanner
• Installed a Neuro Navigation System during the year
• Certified as a CarbonConscious® hospital, making it Sri Lanka’s FIRST hospital to achieve this distinction
• Applied for the JCI Accreditation
• Installed Advanced Lasik Eye Surgical Equipment for Eye Surgery
• Introduced C-Arm machine for theatre unit
2015• Commenced Regional Hospital operations
in Negombo
• Introduced Bone Marrow Transplant Unit
• Installed the most technologically advanced mammography machine
• Retained the ‘Gold’ Award in the healthcare sector at the Annual Report 2014 organised by CA Sri Lanka
• Only hospital to be recognised at the ACCA Business Award 2014
• Initiated the construction of Car Park Building
2016• Introduction of Fibro Scan to quantify
Liver Fibrosis
• Introduction of Self-Channelling Kiosk
• Installed a new Chemotherapy Machine
• Only Hospital to be recognised at the ACCA Sustainability Business Awards 2015
• Retained the ‘Gold’ Award in the healthcare sector at the Annual Report Awards 2015 organised by CA Sri Lanka
• Achieved 100% success rate in Bone Marrow Transplants
• Introduced Gold Standard Acu Pulse, a safe, simple CO2 laser
2017• Introduced Non-Invasive Fat Burner Machine
• Introduced ENT Console Unit
• Gold Winner at the ACCA Sustainability Reporting Awards 2016 – General Services (Utilities) category
• Retained the Gold Award in the healthcare sector at the Annual Reports Awards 2016 – Organised by CA Sri Lanka (6th Time)
• Introduced X-Ray Orthopantogram Unit for Dental
• Awarded ISO 9001:2015 Certification
• National Productivity Award – Special Commendation
• Upgraded the Cath-Lab with latest technology
2018• Introduced second MRI machine for
The Radiology Unit
• Gold Medal Winner at the ACCA Sustainability Business Awards 2017
• Retained the Gold Award in the Healthcare Sector at the Annual Report Awards 2017 Organised by ICASL
• Opened Nawaloka Medicare in Gampha.
• Silver Winner at the International ARC Awards 2017
• Asia Best CSR Practices Awards 2017 organised by CMO Asia
• Opened Nawaloka Premier Wellness Centre
• Nawaloka Specialist Centre initiated with new modular channelling system and 550 car parking facility

10,
Naw
alok
a H
osp
ital
s P
LC
|
A
nn
ual
Rep
ort 2
017/
18
CHAIRMAN/CEO’S MESSAGE
Dear Shareholders,
It is with great pleasure I welcome you to the 29th Annual General Meeting of Nawaloka Hospitals PLC and to present to you the Annual Report for the financial year 2017/18.
Since our inception 33 years ago, our strategy has always focused on being future-ready; it is embedded in our vision statement “To be the Hospital of Tomorrow”. Over the years, Nawaloka Hospitals PLC has garnered a reputation of being a pioneer in the healthcare sector of Sri Lanka. We were the first fully-fledged private healthcare institution in the country. In our three decades of operations, we have many pioneering initiatives and “firsts” in the private healthcare sector under our belt. It is through our pioneering spirit, preparedness to embrace innovations, the investments in cutting-edge, world-class medical equipment, and establishment of state-of-the-art facilities around the island that we hope to collectively find solutions to the burning healthcare issues of the present and the future today. That is why we boldly claim in the theme of this year’s Annual Report that “The Future of Healthcare is Here”.
At present, the advancements in technology as well as superior healthcare have led to longevity of life. Yet, it also results in an ageing population, an issue faced by all regions in the world. An issue that the present Sri Lankan social welfare and healthcare system is not equipped to handle. The founding philosophy of Nawaloka Hospitals; Arogya Parama Laba or “good health is the supreme wealth” continues to inspire us to provide world-class healthcare to Sri Lankans from all walks of life and leads us to collectively find solutions to the burning issues in healthcare today.
We unveiled our 14-floor, multi-storey car park and Specialist Centre in December 2017, an exceptional feat in the history of Nawaloka. The structure, architecturally designed and engineered to create a harmonious ambience, has over 550 parking facility and covers 203,653 sq.ft. which contributes to make Nawaloka Hospitals the single largest private hospital complex with 900,000 square feet of built-up area.

10, 11
Cha
irm
an/C
EO
’s M
essa
ge
Nawaloka invested Rs. 6.6 Bn. in the new building which will also house modular channelled consultation chambers, pharmacy, laboratory, radiology services and dedicated areas for wellness centres, diabetes, and renal care offering exceptional patient comfort and world-class healthcare needs all in one platform.
To fulfil our objective of taking Nawaloka to the periphery and supporting the proliferation of private healthcare beyond the urban centre, Nawaloka Negombo was established. To further expand our operations in the region, Nawaloka Medicare in Gampaha opened its doors in June 2017. Comprising state-of-the-art medical facilities and equipment, this institution will provide best of Nawaloka healthcare to the people of Gampaha.
Digital health technologies and advances in the field of medicine have brought future healthcare to the present. Though high capital investment is required to keep up with the latest trends in medicine, Nawaloka has always strived to provide the most modern, world-class care to our patients. Since the value of life is priceless, we see expenditure in medical technology as investing in the lives of our patients. We continued to improve the facilities in our Radiology Unit to make it the best in the island. We acquired the latest 1.5 T Philips Inginia MRI machine adding to the existing fleet of MRI machines. It provides high-quality digital images at remarkable speed which help consultants to diagnose with confidence to deliver the best, most accurate diagnosis. The immersive in-bore experience offers patients a comforting experience. We also refurbished our Cardiac Catheterisation Laboratory or Cath Lab which provides high-risk, elective, cardiac diagnostic procedures. The new machine is capable of taking digital X-ray images of all the coronary arteries in the heart.
During the year 2017/18 the Company generated a revenue of Rs. 7,955 Mn. which is a growth of 26% compared to last year and a net profit of Rs. 180 Mn. We also continue to receive commendations and awards to further extend our position as a leader in private healthcare. This year, we were rated as a leading hospital amongst Lanka Monthly Digest’s LMD top 100 entities. Our brand value stood at Rs. 835 Mn. while our enterprise value is Rs. 12,146 Mn. We also received an A+ rating from Brand Finance and retained the “Gold” Award in the healthcare sector for the sixth consecutive year at the CA Sri Lanka Annual Report Awards. We were also awarded the top award in the General Services and Utilities category for the second consecutive year at the Association of Chartered Certified Accountants (ACCA) Sustainability Reporting Awards 2017. These accolades are a testament to Nawaloka’s excellence in the private healthcare sector of the island.
In conclusion, I would like to extend my appreciation to our team of highly-skilled employees, the Board of Directors, consultants, and the Management who contributed to making this year exceptional for Nawaloka. I would also like to thank our customers for their continued trust, and our shareholders, and business partners for placing their confidence in our establishment.
Dr Jayantha Dharmadasa Chairman/Chief Executive Officer
23 May 2018

12,
Naw
alok
a H
osp
ital
s P
LC
|
A
nn
ual
Rep
ort 2
017/
18
DIRECTOR/GENERAL MANAGER’S REVIEW
Future of healthcareHealthcare is one of the fastest advancing sectors today and is facing a transformative period marked by diverging trends, digital technologies, and new biotechnological discoveries. Amidst these global challenges, the healthcare sector must be prepared to face unprecedented demands and embrace innovations to face the future that is already here. The digital healthcare ecosystem has developed at such a rapid pace making digitalisation the foremost trend in healthcare today. Internet access, smart phone penetration, medical technologies such as, artificial intelligence, robotics, genomics, telemedicine, e-consultation and prescriptions 3D printing of implantable devices and drugs and drone assisted medication delivery will take us to data driven healthcare faster.
Challenges to the world healthcare industryArtificial Intelligence will transform the world’s healthcare industry to a new dimension. Hospitals are a depository of valuable patient information. Digital data generated from medical equipment and software have enhanced understanding about health and diseases and led to the sharing of medical information, remote or peer support, and open access to clinical studies. Data mining is being used to predict disease patterns and trends. In the near future, such artificial intelligence will replace to some extent reporting of laboratory investigations, radiology investigations, such as, X-rays, and CT and MRI scans.
The Management has been continuously conscious of the changes in global trends and prepared ourselves today for the challenges of tomorrow. Nawaloka being the pioneering private sector healthcare leader in the country has introduced many ground breaking “firsts” in our milestones.
The Radiology Department, one of the best equipped in the country, possess the latest equipment like the world’s fastest 640 Slice CT scanner, capable of performing cardiac angiograms, digital X-ray machines, and two MRI scanners. The PACS (Picture Archiving and Communication System) is fully operational and it has greatly improved our diagnostic capabilities: short and long-term storage, retrieval, management, distribution and presentation of all radiological images and information management. PACS, by revealing patterns, trends, and correlations, has allowed improved diagnosis and even remote or peer support.
Care GiversThe population over 60 years of age will have increased to an estimated 2.1 billion by 2050. According to the “Ageing Population in Sri Lanka: Emerging Issues, Needs, and Policy Implications” published by the UNFPA, the process of ageing in Sri Lanka is somewhat rapid since 1980s and the percentage of age 60 years and above had doubled from 6.6 per cent in 1981 to 12.4% in 2012. The current figure is expected to double again to reach 24.8% in 2041. Therefore, the social

12, 13
Dir
ecto
r/G
ener
al M
anag
er’s
Rev
iew
welfare and health schemes in Sri Lanka should be adequately developed to address the needs of the ageing population of the country.
Nawaloka prepares to meet this challenge through developing our geriatric care. We have experienced and skilled Geriatric Consultants for elderly healthcare. Nawaloka Care Giver programme, a mobile health service where trained professionals visit homes to look after the elderly, has gone from strength to strength. We hope to expand this service in the future to help with screening efforts. The “NAGAI” Luxury Elders Care Unit is the first Elder Care facility within a Sri Lankan hospital. It is a sophisticated establishment that is dedicated to provide the highest level of care to the elderly.
Facing the NCDs threatNon-Communicable Diseases (NCDs), such as, Heart Disease, Diabetes, Cancers and Asthma, as well as the risk factors such as, Obesity, Smoking, High Sugar and Salt diets, and Alcoholism, remain detrimental to the lives of Sri Lankans and a key challenge in the healthcare sector. The World Bank notes that, NCDs are responsible for 85% of ill health, disability and early deaths in Sri Lanka. It is estimated that 2.5 million people suffer from NCDs at any given time while Rs. 300 Bn. is spent annually on NCD treatment.
Our response to assist with NCDs is “Prevention” where the Premier Wellness Centre has taken a systematic, company-wide approach to enhance our screening and early detection services. Moreover, the Nawaloka Premier Wellness Centre provides personalised healthcare in a homely environment, in the heart of Colombo 07. We hope to develop an Island-wide network of wellness centres to meet the growing demand and to cater to the needs of the ageing population of Sri Lanka. Our awareness programme are conducted free of charge by experienced healthcare professional islandwide. They help to disseminate much needed awareness among the general public about the importance of taking preventive measures to reduce risk factors of NCDs such as, tobacco use and excessive alcohol consumption along with an active lifestyle and improved diet. We also educate the public about Nawaloka’s state-of-the-art screening capabilities that use the latest technologies to extract accurate diagnosis. We will continue our efforts to educate the public about preventive measures and the availability of screening processes to eradicate the threat of NCDs.
Taking private healthcare to the peripheryWe are a strong advocate of the proliferation of the private healthcare sector, which is, at present, concentrated at urban centres, especially in Colombo. Nawaloka Hospital in Negombo is at present a well established private healthcare institution in the region providing healthcare to a wide spectrum of the population. We expanded our horizons to establish Nawaloka Medicare in Gampaha. This institution is already a reputed healthcare facility in the region. We hope to expand our operations further to other parts of Sri Lanka to provide high-quality private healthcare regionally.
We will continue in our efforts to improve the efficiency of diagnostics and provide smarter, faster screening processes which will deliver improved outcomes and take Sri Lankan healthcare to the future.
AppreciationsIt has been another extraordinary year for Nawaloka Hospitals PLC, and I would like to extend my deepest gratitude to our highly-qualified motivated and experienced team of healthcare professionals, who work tirelessly to provide the best of care possible to our patients.
Finally my deep appreciation goes to our customers, medical staff, business associates and other stakeholders for the continued loyalty and trust placed on Nawaloka Hospitals.
Vidya Jyothi Professor Lal Gotabhaya ChandrasenaDirector/General Manager23 May 2018

Naw
alok
a H
osp
ital
s P
LC
|
A
nn
ual
Rep
ort 2
017/
18
14,
OUR BUSINESS MODEL
Our business model outlines how the Company’s core purpose of providing superior healthcare to enhance the lives of all Sri Lankans is central to how our business operates. It also illustrates short, medium, and long-term value creation by delivering on profitability and growth, efficiency, operational excellence, and handling operational risks. It also identifies how we use resources and relationships to better serve our key stakeholders.
BUSINESS MODEL
Financial Capital• Revenue• Profitability• Working capital management• Capital structure
Intellectual Capital• Process development• Service enhancements
Investor Capital• Shareholders’ funds• Investor relations
Customer Capital• Service points• Products and services• Service standards• Internal processes• Online services
Financial Capital• 26% growth in Revenue• Return on Equity 4.23%• Return on Capital Employed 10%
Intellectual Capital• Service delivery• Effective systems & processes• Brand reputation
Investor Capital• Dividend per share
Rs. 0.10• Return on assets 1%• Market price of share Rs. 4.80
Customer Capital• Growth in Theatre Revenue 7%• Total No. of – Surgeries performed 17,055 – CT Scan 9,082 – MRI Scan 13,999• Customer loyalty
Inputs
Outputs/ Outcomes
Operating Environment
Process
Our Vision, Mission,
and Values
Our Strategic Direction

Bus
ines
s M
odel
– O
ur B
usin
ess
Mod
el
14, 15
Through our business model, various capitals are transformed to create value over time. “Internal” capital refers to capital owned by the business and capital that is not owned is termed “external” capital. The financial capital is reported in our Financial Statements while intellectual capital includes intangibles like brand image, corporate culture, integrity and specialised knowledge. Our external forms of capital focus on key stakeholders and comprise investors, customers, employees, business partners, society, and the environment.
Employee Capital• Diversity• Knowledge• Experience• Promotions• Salaries and other benefits• Recognition and rewards• Training
Business Partner Capital• Consultants• Suppliers• Strategic alliances
Social and Environmental Capital• Community development activities• Energy, emissions, waste and water management• Compliance• Material management
Employee Capital• Workforce 2,837• Employee satisfaction ratio 92.6%• Training hours per employee – 4 Hrs. 20 Mins.• Training programmes conducted – 133
Business Partner Capital• Number of suppliers 1,115• Number of
consultants 917• Growth of consultant registration 82%
Social and Environmental Capital• Community development under Nawaloka Sathkara – Rs. 11.3 Mn.• Certifications & standards; ISO 9001:2015, ISO 15189 SLAB Accreditation• Inventory management system to manage existing inventory
Our Business Operations
Risk Management
Corporate Governance
Corporate Social Responsibility

16,
Naw
alok
a H
osp
ital
s P
LC
|
A
nn
ual
Rep
ort 2
017/
18
“Our reception counter ensures that all customers receive timely, focused information”

16, 17
Bus
ines
s M
odel
– O
pera
ting
env
iron
men
t
OPERATING ENVIRONMENT
Global economy As the global financial crisis subside, the world economy strengthened in 2017 to reach a 3% growth rate while the global output has grown by 3.8% in 2017. This was mainly due to recovery in investment, manufacturing, trade, and as commodity-exporting developing economies benefit from firming commodity prices. The recently approved US tax policy changes will contribute to the global growth momentum with the global growth forecast revised to 3.9%.
The developed economies recorded an improved growth with the US growth up by 2.3%, Euro area with 2.4%, and Japan with 1.7%. In 2017, East and South Asia accounted for nearly half of global growth, with China alone contributing about one-third with 6.8%. The end of recessions in Argentina, Brazil, Nigeria, and the Russian Federation also contributed to the rise in the rate of global growth between 2016 and 2017.
The World Bank forecasts global economic growth to edge up to 3.1%. Emerging and developing Asia will grow at around 6.5% over 2018/19. Growth is expected to moderate gradually in China. India’s growth is expected to rise in 2018/19. Conversely, growth in Emerging Markets and Developing Economies (EMDEs) is expected to accelerate, reaching 4.5% in 2018 and an average of 4.7% in 2019/20. Advanced economies are expected to maintain the same growth level as in 2017, with an expected pickup in growth across advanced economies such as the United States, France, and Japan.
The year 2018 will be the first year since the financial crisis that the global economy will be operating at or near full capacity. With slack in the economy expected to dissipate, policy makers will need to look beyond monetary and fiscal policy tools to stimulate short-term growth and consider initiatives more likely to boost long-term potential.
10
8
6
4
2
0
202020192017 201820162010 20122011 2014 20152013
Global growth (%)
World Advance economies EMDEs
Source: Growth Economic Prospectus – World bank
10
8
6
4
2
0
Growth forecast for South Asia (%)
1990/08 average 2003/08 average June 2017 forecast
India Pakistan Bangladesh Sri Lanka SAR
’16 ’17 ’18 ’19 ’20 ’16 ’17 ’18 ’19 ’20’16 ’17 ’18 ’19 ’20’16 ’17 ’18 ’19 ’20’16 ’17 ’18 ’19 ’20

18,
Naw
alok
a H
osp
ital
s P
LC
|
A
nn
ual
Rep
ort 2
017/
18
Sri Lankan economy In 2017, Sri Lanka experienced a growth of 3.1%, much below the forecast. The growth was affected by natural disasters which hit the country in the first and second quarters including droughts, floods, and a dengue outbreak. The monetary policy was revised and tightened to mitigate the effects of inflation in the first half of 2017.
12
10
8
6
4
2
0
-2
Per cent
Activity-wise Contribution to GDP Growth
Agriculture Industries Services Taxes less Subsidies GDP Source: Department of Census & Statistics
2014 2015 2016 2017
The services sector was able to contribute 56.8% of growth particularly by telecommunication, financial services, human health, insurance and wholesale, and retail trade. Industrial activities with the share of 26.8% had a positive impact by recording a modest growth of 3.9% underpinned by construction, mining and quarrying, and manufacturing sectors. The natural disasters severely affected the agricultural sector. The rupee also depreciated against the US dollar owing to increased import expenditure, debt service payments, and a reduction in foreign investments in Government Securities.
Sri Lanka’s economic reform agenda is expected to maintain economic stability. The International Monetary Fund (IMF) sees the stabilising of Sri Lanka’s economy in 2018 with GDP expected to reach about 4%. The Inland Revenue Act passed in October 2017 will mobilise additional revenue that could support growth-enhancing spending, including infrastructure investment.
10
8
6
4
2
0
-2
Per cent
Headline Inflation (Year-on-Year)
Jan
14
Jan
15
Jan
16
Jan
17
Jan
18
Sep
14
Sep
15
Sep
16
Sep
17
Mar
14
Mar
15
Mar
16
Mar
17
Mar
18
Nov
14
Nov
15
Nov
16
Nov
17
May
14
May
15
May
16
May
17
Jul 1
4
Jul 1
5
Jul 1
6
Jul 1
7
CCPI (2006/07=100) CCPI (2013=100) NCPI (2013=100) Inflation Target Band
Source: Department of Census & Statistics / Central Bank of Sri Lanka

18, 19
Bus
ines
s M
odel
– O
pera
ting
env
iron
men
t
Impact of macro environment indicators on performance of Nawaloka Hospitals PLC
Key indicator Movement during the year Impact on the industry Level of impact
GDP per capita Increased by Rs. 58,169/- to Rs. 619,729/-
Due to the increase of purchasing power, people tend to move for private healthcare to get a better and faster service.
High
Government’s expenditure on healthcare
Recurrent Expenditure on healthcare increased by Rs. 5.9 Bn. and Capital expenditure on healthcare increased by Rs. 4.8 Bn. The total government expenditure on healthcare increased by Rs. 10.7 Bn.
Even though the investment has been increased, Government still cannot meet the increasing demand for healthcare. Hence this will create opportunity for private sector
High
Inflation Inflation rate has increased by 2.6% and currently stands at 6.6%
With the increase of inflation, cost of living goes up and reduce the affordability of people
Medium
Exchange rates Rupee against dollor has adversely fluctuated and rupee was depreciated by 4.71% compared to 2016 average exchange rate
Most of the hospital consumables such as drugs, surgical items are imported. Therefore cost of the consumables will increase.
High
Mid-year population
Increased by 241,000 Increase in population will result in increase of target market
High
Labour force Increased by 256,000 Increase in the labour force reduces labour shortage in the private healthcare sector
Medium
The Sri Lankan healthcare sectorAt the recently concluded Commonwealth Heads of Government Meeting (CHOGM), Bill Gates lauded the “high-quality” Sri Lankan healthcare sector. It is no secret that Sri Lanka boasts of one of the best healthcare systems in South Asia. In terms of life expectancy, low maternal, neonatal and under-five mortality rates, Sri Lanka easily matches the developed world. Sri Lanka is also on track to achieving many health related Millennium Development Goals (MDG) as well as providing universal health coverage, where healthcare services will be provided equally and equitably for all.
2.5
2.0
1.5
1.0
0.5
0
20172016201520142013
Government expenditure on health and education (As a percentage of GDP)
Education/GDP Health/GDP
Source: Ministry of Finance and Mass Media Department of Census and Statistics

Naw
alok
a H
osp
ital
s P
LC
|
A
nn
ual
Rep
ort 2
017/
18
20,
According to provisional data presented in the CBSL Annual Report 2017, the total Government expenditure for the health sector increased by Rs. 10.7 Bn. to Rs. 197 Bn. in 2017 from Rs. 186 Bn. in 2016. There are currently 612 Government hospitals operating in the State health sector with 3.6 beds for 1,000 persons in the country. According to the report, for every 1,054 persons there is one doctor and for every 627 persons there is one nurse in the State healthcare sector. The Ayurvedic or Sri Lankan traditional medicine sector, has also expanded from last year with 5,167 bed capacity.
Public healthcare sector 2017 2016
Government (No.)
Hospitals 612 610
Beds 76,774 76,829
Primary medical care units 506 475
Doctors 20,349 20,458
Assistant medical practitioners 910 1,011
Nurses 34,221 32,499
Attendants 9,218 8,268
Ayurvedic (No.)
Ayurvedic physicians 23,206 23,082
Total Government expenditure on health (Rs. Bn.) 196.8 186.1
Recurrent expenditure 161.3 155.4
Capital expenditure 35.5 30.7
Though the country had successfully eradicated malaria, Sri Lanka recorded the worst year in terms of patients and fatalities for dengue in 2017. The dengue epidemic reported 186,101 cases in 2017 and claimed 421 lives compared to 55,150 cases and 70 fatalities in 2016. As a percentage, 41.58% of these cases were reported from the Western Province. The Government has taken a number of measures to reduce the impact of dengue and a special dengue eradication programme will be conducted islandwide. Chronic Kidney Disease of unknown aetiology (CKDu) received attention from healthcare providers, academics and policymakers. There were 25,512 CKD/CKDu patients reported during the year from 11 high-risk districts. Measures have been implemented for the last few years to address the impact of the CKDu.
Sri Lanka, similar to the rest of the world, continues to struggle with Non-Communicable Diseases (NCDs), which has become the biggest challenge to the Nation and the healthcare sector. NCDs are caused mainly with rapid urbanisation, unplanned development, globalisation, a drastic change in the peoples’ lifestyles, and dietary patterns. The Government plans to manage NCDs through strengthening the Health Education Bureau’s (HEB) activities. As such, the HEB will collaborate with the Ministry of Education in addressing the threat of NCDs such as juvenile Diabetes, Asthma etc. The screening process for CKDu, Thalassemia, and HIV/AIDS will also be strengthened. The focus will be set on prevention through primordial, primary, secondary, and tertiary preventive strategies.
10
8
6
4
2
0
Non-communicable diseases (NCDs) in Sri Lanka (Total population) (%)
Heart diseases
High blood
pressure
Wheezing/Asthma
Diabetics High blood
cholesterol
Road accidents
Animal bites
Currently under treatments for mental illness
Source: Demographic & Health Survey (DHS) – 2016

Bus
ines
s M
odel
– O
pera
ting
env
iron
men
t
20, 21
Private sector
Healthcare and GDP growth are intrinsically linked. With the steady growth in the Sri Lankan economy resulting in the country moving towards middle-income status, the expectations and aspirations of citizens are also growing. The Sri Lankan private healthcare sector is a burgeoning industry that has experienced rapid growth over the past decade. Private healthcare is concentrated in Colombo and other urban areas, but the proliferation of the industry will facilitate the expansion of private hospitals to other urban towns of Sri Lanka. Sri Lankan private healthcare service providers possess state-of-the-art facilities and infrastructure to providing for all types of healthcare needs.
According to the Households Income and Expenditure Survey (HIES) – 2016 conducted by the Department of Census and Statistics, 14.6% and 15.7% of the households have received services from private and government hospitals in the form of out-patient treatment. This figure signifies the growing importance of the private healthcare sector in the country.
There were 181 private hospitals with the capacity of 5,792 beds were registered with the Private Health Services Regulatory Council (PHSRC) by end 2017.
The Government has undertaken the regulation of the private healthcare sector by making it mandatory for all private medical institutions to register with the PHSRC and undergo regular inspections to ensure the adherence of relevant national regulatory requirements and standards for patient care, treatment and conducting of preventive services.
Nawaloka Hospitals performance in the sector
Number of patient beds
0.61%
Nawaloka Hospital 471State Hospitals 76,774
Number of doctors
6.70%
Nawaloka Hospital 1,364State Hospitals 20,349
Number of nurses
2.54%
Nawaloka Hospital 870State Hospitals 34,221
Number of patient care assistants
2.27%
Nawaloka Hospital 209State Hospitals 9,218

Naw
alok
a H
osp
ital
s P
LC
|
A
nn
ual
Rep
ort 2
017/
18
22,
“Our newly-opened Specialist Centre has a car park with 550 parking facility which navigates vehicles using a parking facility sensory system as well as 15 modules comprising of consultation chambers, pharmacy, laboratory, radiology services, a dedicated areas for wellness centres, a supermarket, restaurant, a diabetic centre, and more”

Bus
ines
s M
odel
– S
WO
T a
naly
sis
22, 23
SWOT ANALYSIS
Strengths• Largest private healthcare provider in
the country with the highest number of consultants.
• Reputation as the pioneer of private healthcare in the country.
• Located in the heart of urban centres.
• Thirty-three years of healthcare experience in the sector.
• The “Nawaloka” brand name.
• Links with overseas medical bodies like Green Cross Laboratories South Korea.
• State-of-the-art medical equipment including the world’s fastest 640 Slice CT scanner, two high-tech MRI machines.
• Availability of full-time consultants for any emergency medical assistance.
• Qualified and trained panel of elite nurses.
• Multi-storey car park building with over 550 parking facility.
• Over 20% of market dominance in the sector.
• Fully-fledged Nurse Training School.
• Multiple awards and accolades.
Weaknesses• High maintenance cost
• High capital expenditure to upgrade the medical equipment.
• High staff turnover due to shortage of labour islandwide.
Opportunities• Medical Tourism.
• Increasing life expectancy.
• Demand for high-quality, premier private healthcare.
• Public–Private Partnership (PPP) programme to cater to the needs of patients.
• Increase in population and distribution of disposable income in the region which create demand for private healthcare in the region.
• Expansion of the existing laboratory and pharmaceutical distribution chain islandwide.
• Increased demand for wellness and healthier lifestyles leading to need of aspects such as weight management, aesthetic and cosmetic surgery.
Threats• Increasing cost of healthcare due to
VAT and changes in corporate taxes.
• Price controls for drugs and lab investigations.
• Adverse movement of USD to LKR exchange rate.
• High interest rates which lead to increase in cost of borrowing.
• Rapid growth of medical technology which lead to high capital investments.
Nawaloka Hospital

Naw
alok
a H
osp
ital
s P
LC
|
A
nn
ual
Rep
ort 2
017/
18
24,
STRATEGIC DIRECTION
Safety of patient careSince the success of our hospital depends on the trust that we have built over the years with our customers, providing world-class patient care is essential for us. Hence, we take all steps to improve the safety of our patients care services by providing required trainings for our clinical and non-clinical staff, ensuring proper storage of drugs, assuring regular maintenance of medical equipment and defining protocols.
Increasing the range of servicesNawaloka prides itself being a pioneer in the healthcare sector of the country, which is why we ensure that we are at the forefront of the latest, innovative developments of the global healthcare milieu. We constantly improve our product offering and streamline our services to cater to the changing needs of customers as well as to provide new value for existing customers.
In 2017, we invested in a new MRI machine to meet the current and future needs. There were also improvements made to upgrade the Cathlab services. The Marketing Department and Bio Medical Department are researching on new products and services to add to our already extensive portfolio.
We will continue to add value to our products and services by offering our customers with the most modern healthcare products and services to be on a par with the best healthcare services in the world.
Improve patient experience and satisfaction We regularly monitor the satisfaction rates of our customers through our feedback system as well as the customer satisfaction surveys. We take immediate corrective actions to improve our system. Accordingly, we train our staff on-the-job as well as off-the-job on customer service and provide proper orientations for the newly recruited employees. Further, we continue enhancing our Information Technology services to provide improved customer services (More details are on page 44).
The Company invested to construct a car park facility which could facilitate 550 parking facility. The project was successfully completed during the financial year and opened to serve our customers in December 2017. Further, in our Specialist Centre, we have introduced a modular channelling concept for patient convenience. In addition to that, car parking and channelling services, which also includes a bank, a supermarket, a cafeteria, and several other facilities.

Bus
ines
s M
odel
– S
trat
egic
dir
ecti
on
24, 25
Achieving Financial StabilityIt is crucial to have a sound, steady, and healthy financial capital and management to help the efficient allocation of resources and distribution of risk across the Company. Thus, we maintain a proper financial structure and cost management strategies to achieve financial stability. Our efficient working capital management system and the investment strategies help to improve the financial stability of the Company.
Enhance access to high-quality healthcare Sri Lankan private sector healthcare services are mainly concentrated in the urban centres of the country, especially in Colombo and the Western Province. To ensure equitable access to high-quality private healthcare, Nawaloka is committed to expand our operations islandwide to enhance the accessibility to our customers. As a first step in implementing this strategy, we opened Nawaloka Hospital Negombo, which has been a huge success. We are planning to further expand our hospitals network to the other parts of the country.
Negombo hospital has achieved 400,000 customers and treated more than 6,300 inward patients during the reporting period. We have also expanded our services through the establishment of the Premier Wellness Centre in Colombo 7, as well as Nawaloka Medicare in Gampaha to increase the accessibility of our quality healthcare.
Nawaloka Premier Centre is located in Colombo 7.
Nawaloka Hospital – Negombo celebrated the third successful anniversary.

26,
Naw
alok
a H
osp
ital
s P
LC
|
A
nn
ual
Rep
ort 2
017/
18
Our improved website (www.nawaloka.com) also provides greater accessibility to our customers as it facilitates online bill payments, online service bookings, e channelling services, and etc.
The Nawaloka website provides advanced customer friendly features that enable faster service to our online clientele.
New partnerships The Company entered into a partnership with Green Cross Laboratory Korea which is one of the leading clinical laboratory service providers in Korea. With more than 30 years of accumulated know-how, Green Cross Laboratory Korea provide more than 1,200 tests and test combinations, ranging from routine tests to highly esoteric molecular and genetic assays. Therefore, we also were able to add new tests to our test menu and now growing the branch network at a rapid pace.
Prompt response to the needyAs the time is an important factor in an emergency, we always assure timely access to care to our patients. In our call management system, Ambulance and Emergency Treatment Units have given the highest priority. Moreover, our Emergency Treatment Unit is located at the nearest entrance of the hospital. As the hospital is fully covered with the emergency alert system and our emergency team can reach any hospital location within a few seconds, we assure timely access to care.

26, 27
Bus
ines
s M
odel
– S
trat
egic
dir
ecti
on
Strategic objectives and achievements in 2017
Aspect Objective Performance in 2017/18 Status
Customers To achieve an Average Customer Satisfaction Index of 90%
Average Customer Satisfaction Index for the year is 94%
Successfully achieved
To increase the percentage of calls answered within 1 minute to 85%
Calls answered within 1 minute is 87% Successfully achieved
To reduce the number of customer complaints to 400
There were 498 customer complaints during the year
Not achieved
To achieve an average discharge time of 30 minutes
Average discharge time is 20 minutes Successfully achieved
To achieve an average check in time of 30 minutes
Average check in time is 30 minutes Successfully achieved
Employees To improve the average training hours per employee per year to 4 hours and 15 minutes
Average training hours per employee per year is 4 hours and 20 minutes.
Successfully achieved
To increase the employee engagement rate to 52%
Employee engagement rate is 48%. Not achieved
To achieve an employee satisfaction index score of more than 90%
Employee satisfaction index score is 92.6%
Successfully achieved
To increase the employee retention ratio to 80%
Employee retention ratio for the year is 80.4%
Successfully achieved
Social and environmental capital
To increase investment in school development projects to Rs. 10 Mn.
Company invested Rs. 11.3 Mn. in school development projects
Successfully achieved
To conduct a minimum of 20 medical camps during the year
38 Medical camps have been conducted Successfully achieved
Invest at least 0.2% of turnover on community development activities.
0.25% of turnover, invested in community development activities
Successfully achieved
To conduct at least 25 awareness programmes during the year
30 awareness programmes have been conducted
Successfully achieved
Financial To achieve a revenue growth of 20% compared to the previous year’s revenue
Revenue growth for the year compared to previous year is 26%
Successfully achieved
To achieve a gross profit margin of 53% Gross Profit Margin is 55% Successfully achieved
To achieve a net profit margin of 6% Net Profit Margin is 2% Not achieved
To achieve a 6% Return on Equity ratio (ROE)
Return on Equity for the year is 4.23% Not achieved

28,
Naw
alok
a H
osp
ital
s P
LC
|
A
nn
ual
Rep
ort 2
017/
18
“Nawaloka Cosmetic Unit offers the a range of services like phototherapy, skin rejuvenation, scar removal, laser hair removal, and many more using the most recent surgical techniques employed to provide minimally invasive surgery reducing postoperative complications in a safe, secure environment”

28, 29
Bus
ines
s M
odel
– S
take
hold
ers
STAKEHOLDERS
Nawaloka, being the premier private healthcare establishment in the country, impacts a wide range of individuals, groups, and organisations which form our stakeholder groups including groups and individuals that fundamentally impact our operations and our business as a whole. The flow of relationships and influence that we share with our stakeholders will impact our business. Identifying stakeholder values and expectations to cater to their needs is vital part of the stakeholder engagement process. Our primary stakeholders are investors, customers, business partners, employees, society and the environment, in which we operate as well as regulators and Government authorities.
Nawaloka Hospital
Customers
EmployeesSociety
SuppliersConsultants
Regulators and Legislation
Investors
Health
Life Care
Stakeholder engagement Over the years, we have formed deep, dynamic, and interdependent relationships with our stakeholders. We have always been committed to consider the myriad perspectives of our stakeholders to forge positive, proactive relationships. The stakeholder groups that are identified are grouped accordingly to increase the efficiency and impact of our efforts to meet their needs.
Stakeholder needs change due to the evolving sociopolitical, economic, and environment contexts.
There is a robust process in place for stakeholders that includes a four-fold approach: Identification of stakeholder interests, planning stakeholder activities, engagement with stakeholders, and evaluation and reporting. Through this process we have aligned stakeholder interests with our interests. The process is a collaborative effort where the feedbacks from our stakeholders become invaluable. For example, we collaborate with the patient community and other stakeholders to evaluate ways to expand access to medicine. These interactions form a central part of our strategy formation and our corporate governance framework. Thus, there is regular, transparent communication with our key stakeholders to ensure they are well-informed.

Naw
alok
a H
osp
ital
s P
LC
|
A
nn
ual
Rep
ort 2
017/
18
30,“Our highly-qualified team of consultants, nursing staff, medical staff, and other administrative staff are committed to delivering world-class medical care”

Bus
ines
s M
odel
– S
take
hold
ers
30, 31
Stakeholder engagement process
Feedback
Evaluation and reporting
Engagement with
stakeholders
Planning stakeholder
activities
Identification of stakeholder
interests
Stakeholder engagement
Stakeholder Stakeholder interest Planning stakeholder activities
Engagement with stakeholders Evaluation and reporting
Customers New services and technologies introduced
Innovation – New packages, new tests, new modern medical treatments
Public relationship officer, social media, corporate website above the line and below the line marketing
Repeat customers
Level of customer satisfaction
Number of customer complaints
Quality of the services received
Service excellence of the hospital
Periodic customer satisfaction survey feedback system
Customer complaints management
Responding to concerns raised through email and letters
Meetings by public relationship officers
Availability of services Advantages in terms of pricing, time consumption, and quality
Continuous monitoring of processes for improvements
Communication through social media, call centre, corporate website, customer support desk
Employees Skill development Human Resource Development Plan
Monthly and weekly Inbound and Outbound Training
Post meeting feedback evaluation
Employee turnover
Employee satisfaction surveys
Employee comments and suggestions
Operational issues Employee engagement Meetings and workshopsCommunicating operational updates via emails
Employee benefits Rewards and recognition
Quarterly performance appraisal
Employee suggestions and complaints
Grievance handling Grievance Committee One to one discussions
Risk involved in workplace Establishing occupational health and safety policy and employee welfare
Employee forums
Training and awareness programmes
Social events Enhancing employee motivation
Employee get-together
Cricket fiesta
Annual trip

32,
Naw
alok
a H
osp
ital
s P
LC
|
A
nn
ual
Rep
ort 2
017/
18
“Our Cashier Team performs all transactions with highest accuracy and excellent customer service”

32,
Bus
ines
s M
odel
– S
take
hold
ers
33
Stakeholder Stakeholder interest Planning stakeholder activities
Engagement with stakeholders Evaluation and reporting
Regulators and legislation
Legal and regulatory compliance
Establishment of the Legal Department
Ongoing dialogue and review
Press releases
Number of litigations
Compensation paid for non-compliance
Adherence to all mandatory regulations
Filling reports and returns
Submission of reports
Adherence to environmental regulations
Suppliers Expected quality and quantity, prices, delivery terms, payment method, credit period
Stringent supplier chain management policy.
Ongoing dialogue with suppliers and tender committee meetings.
Number of repeat purchases
Quality Complaints
Credit days
On time delivery
Stock out percentage
New Orders Tender procedure Tender committee
Invite suppliers via news paper and emails
Society Contribution to the society Community development and capacity building
Sponsorships
Contributing to improve public facilities such as sanitary and water supply
Number of feedback
Comments on social media
Adverse publicity on public media
Education and literacy Awareness programme
Health promotional campaign
Health and nutritional development of society
Press conferences
Medical campaign
Investors Financial and non-financial performance and improvement of CSR activities
Detailed financial management and operational management
Improving effectiveness and efficiency
Announcements to stock exchange
Annual General Meeting
Quarterly Reports and Annual Report
Weekly Management meetings
Budgets
Internal controls
New improvements. Innovations – New Packages and new test
Communication through above the line and below the line advertising
Changes and improvement of governance
Corporate Governance Practices
Compliance to Code of Best Practices on Corporate Governance.
Consultants Time schedules for consultation
Contribution to the Hospital
Consultant payments
Additional medical facilities required
Enhancing facilities to consultants
Service excellence of the hospital
Individual meetings Ongoing dialogues
Consultant forum
Consultant feedback evaluation

34,
Naw
alok
a H
osp
ital
s P
LC
|
A
nn
ual
Rep
ort 2
017/
18
“Partnership with Green Cross Laboratories South Korea has allowed us to provide the best facilities and international exposure in diagnostics”

34, 35
Bus
ines
s M
odel
– M
ater
ialit
y
MATERIALITY
The material aspects of Nawaloka represent matters that have the most impact on our ability to create and sustain value in the short, medium, and long-term. We identify material issues by analysing if the issue has the potential to substantially impact our commercial viability organisational goals, and the relationship with stakeholders. The material issues form a part of our strategic direction and planning.
A material topic can be of significance to the Hospital and its stakeholders. Our two-dimensional materiality matrix maps and places the economic, social and environmental aspects which are considered material to both Nawaloka and its stakeholder.
The Management approach of Nawaloka takes into consideration all relevant contextual factors in formulating of strategy. The Board and the Management reviews the issues annually by considering all socio-economic, and environmental context. This process is further clarified in the Management Discussion and Analysis section where all the capitals are discussed.
Sig
nifi
can
ce to
Sta
keh
old
ers
Significance to Nawaloka
Medium High Very High
Med
ium
Hig
hV
ery
Hig
h
205 Anti-corruption307 Environmental compliance403 Occupational health and safety404 Training and education406 Non-discrimination408 Child labour413 Local communities416 Customer health and safety418 Customer privacy419 Socio-economic compliance
302 Energy303 Water304 Biodiversity305 Emissions306 Effluents and waste
201 Economic performance206 Anti-competitive behaviour401 Employment417 Marketing and labelling
203 Indirect economic impacts204 Procurement practices301 Materials405 Diversity and equal opportunity407 Freedom of association and collective bargaining409 Forced or compulsory labour410 Security practices412 Human rights assessment415 Public policy
402 Labour/Management relations
202 Market presence
200: Economic 300: Environmental 400: Social

Naw
alok
a H
osp
ital
s P
LC
|
A
nn
ual
Rep
ort 2
017/
18
“Our SLAB accredited laboratory services provide highly accurate diagnostic services to patients while adhering to the highest standards of customer service, and convenience”

Man
agem
ent D
iscu
ssio
n an
d A
naly
sis
– Fi
nanc
ial C
apit
al
37
MANAGEMENT DISCUSSION AND ANALYSIS
FINANCIAL CAPITAL
Financial capital comprises of the funds needed by a company to procure property, plant and equipment and other inventories for the provision of goods or services for value creation. Broadly, funds are raised from equity and debt and are converted to other forms of capitals through the business model. The following is a review of Nawaloka Hospitals PLC’s economic performance in 2017/18. A review of other capitals is given thereafter. This review should be read in the context of the challenges and opportunities presented by the operating environment as detailed above.
In 2017/18, Nawaloka Hospitals PLC recorded the highest ever revenue in the history of the Company. This contributed significantly to an impressive improvement in profit before tax (PBT), but there is a significant decrease reflected in profit after tax for the year consequent to the substantial increase in the income tax rates and tax provisions, following the enactment of the new Inland Revenue Act.
Aspect Measure 2017/18 2016/17 2015/16
Revenue Turnover (Rs. Mn.) 7,955 6,300 5,860
Profitability Gross profit margin (%) 55 52 50
Net profit margin (%) 2 4 4
Working capital management Current ratio (times) at the end 0.67 0.83 0.89
Quick asset ratio (times) at the end 0.56 0.73 0.70
Capital structure Debt/equity at the end 1.86 1.37 1.27
Interest cover (times) 1.90 1.66 1.71
Review of Financial Performance The Group’s revenue has increased to Rs. 7,955 Mn., an increment of 26% compared to previous year. The revenue was Rs. 6,300 Mn. in the year 2016/17. The Group has achieved a Gross Profit Margin of 55%, which was an increase of 3%. The Net Profit for the reporting year is Rs. 180 Mn. This was a decline of 25% mainly due to the deferred tax adjustments as a result of change in corporate tax rates. Corporate tax of 12% that was applicable to the Hospital sector was increased to 28% with effect from 1 April 2018. Last year company achieved a Net Profit of Rs. 241 Mn.
Accordingly, Earnings Per Share (EPS) dropped to Rs. 0.13 in comparison to previous year’s Earnings Per Share of Rs. 0.17. The number of shares in issue was constant over the year.
Turnover The Group achieved the highest turnover in the history of Nawaloka of Rs. 7,955 Bn. recording a 26% growth. Growth in all business lines of the Group including channelling services, laboratory investigations, operating theatre services, radiology and diagnostics services contributed to this impressive growth in revenue. Another major contributor to this growth is the incorporation of Nawaloka Green Cross Laboratories (Private) Limited operation’s income to the Group’s revenue. The integration of Nawaloka Green Cross Laboratories (Private) Limited as a fully-owned subsidiary of Nawaloka Hospitals PLC contributed to 9% revenue growth of the total growth of 26%.
Income from channelling increased due to the higher number of channeling services provided. The Group was able to increase the Call Centre bookings during the period. Moreover, the Group expects further growth, in the future, in Channel Services through the more convenient features available at our Specialist Centre.
The Group partnered with Green Cross Laboratory Korea in year 2017. This enabled the Company to achieve wide test menu and reduced turnaround time, which was an influential factor for the higher turnover.
36,

38,
Naw
alok
a H
osp
ital
s P
LC
|
A
nn
ual
Rep
ort 2
017/
18
The Theatre is one of the most successful department in our hospital. As a result of the constant improvements to the Theatre Unit, the revenue from theatre services grew by 7% compared to the previous year. Currently the theatre complex comprises of 14 theatres.
The income from the radiology department increased by 9%. The company has added a 1.5 TESLA MRI machine to enhance the capacity, thus enabling the company to increase the Radiology revenue. Further the company installed another X-Ray machine and two Ultra Sound machines to support the growth of the department.
8,000
6,000
4,000
2,000
0
2013/14 2014/15 2015/16 2016/17 2017/18
Revenue (Rs. Mn.)
Revenue composition (%)
A. Inward 45%
B. OPD 55%
B
A
55% of the Hospital’s revenue was generated through outpatients whilst the balance 45% was generated from in-house patients.
Other operating incomeOther operating income for the year increased by 183% (Rs. 128 Mn.) over the previous year. Last year other operating income was Rs. 70 Mn. and company achieved Rs. 199 Mn. as other operating income for the period of 2017/18. This increase was due to effective utilisation of excess resources.
200
150
100
50
0
2013/14 2014/15 2015/16 2016/17 2017/18
Other operating income (Rs. Mn.)
ExpensesStaff costs increased by 22% during the year to Rs. 1,583 Mn. from Rs. 1,300 Mn. in the previous year. This was due to the salary revisions made at the beginning of the period and absorption of staff cost of Nawaloka Green Cross Laboratories (Private) Limited, for the post acquisition period.

38, 39
Man
agem
ent D
iscu
ssio
n an
d A
naly
sis
– Fi
nanc
ial C
apit
al
Administration expenses increased by 37% over the previous year expense of Rs. 1,282 Mn. and currently stands at Rs. 1,762 Mn. During the year, other operating expenses decreased to Rs. 83 Mn. Last year, other operating expenses were Rs. 137 Mn. and it has dropped by 39% in the current year.
During the year, net financial costs increased by 57% to Rs. 617 Mn. from Rs. 393 Mn. recorded in the previous year. Mainly the increase in borrowings for the Specialist Centre and the increase in interest rates evidenced this increment. Total borrowings (both long term and short term) increased by Rs. 1,916 Mn. during the year and the Average Weighted Lending Rate (AWLR) which was 13.2% at the beginning of the year increased to 14.04% by the end of the year. Interest cover ratio increased to 1.9 times from previous year’s 1.66 times, along with the increase of operating profit, despite the increase in finance costs.
Review of financial positionAssets base
Total assets base of the Group increased by 20% (Rs. 2,936 Mn.) compared to the previous year’s asset base of Rs. 14,348 Mn. and currently stands at Rs. 17,284 Mn. Out of this Rs. 2,936 increment, Rs. 2,686 Mn. is due to the net changes in Property Plant and Equipment. During the year Group invested Rs. 3,328 Mn. on additions of Property Plant and Equipment. This includes Rs. 2,377 Mn. invested in building construction and Rs. 649 Mn. invested in Medical Equipment. During the year we invested in purchasing of new medical equipment such as MRI Scanner, Electromyography, Digital Slit Lamp for eye center, Epiq 07 Echo machine and two ambulances to improve the services to our customers.
Assets base (%)
2016/17%
2017/18%
A. Free hold land 2 2B. Buildings constructed on free hold land 6 5C. Buildings constructed on lease hold land 26 62D. Work in-progress 41 8E. Fixtures and fittings 2 2F. Plant and machinery 0 0G. Motor vehicles 2 1H. Hospital equipment 2 2I. Medical equipment 17 16J. Computer equipment 1 1K. Furniture fittings 1 1
C
A B
D
GH
FE
J KI
2016/17
AJ K B
CD
E
I
GH
F
2017/18
Capital structure
During the year 2017/18, Debt to Equity ratio of the group increased to 1.86 from previous year’s Debt to equity ratio of 1.37. The long term borrowings of the group increased by 31% compared to previous year, due to the borrowings for Specialist Centre. This investment will bring more revenue for the company in future.
The Current Asset ratio for the year is 0.67 times, which was a drop compared to the previous year’s Current Asset ratio of 0.83 times. This is due to the increase of Current Liabilities by Rs. 1,276 Mn. which was a result of short term loan payables.
Accordingly, Quick Asset ratio also decreased to 0.56 times from previous year’s Quick Asset ratio of 0.73 times.

Naw
alok
a H
osp
ital
s P
LC
|
A
nn
ual
Rep
ort 2
017/
18
Statement of Value Added Value generated and distributed
2017/18 Rs.
2016/17 Rs.
2015/16 Rs.
2014/15 Rs.
2013/14Rs.
Value added
Revenue 7,955,278,613 6,299,910,436 5,860,218,161 4,602,433,640 3,993,473,302
Less: cost of materials and services obtained (4,971,304,767) (3,526,074,553) (3,646,563,430) (2,983,613,751) (2,418,803,334)
Add: other income 198,816,074 70,375,782 94,495,240 65,199,571 64,194,796
3,182,789,920 2,844,211,655 2,308,149,971 1,684,019,460 1,638,864,764
Distribution value added
To employees
Salaries, wages, incentive and other benefits 1,583,472,211 1,299,957,507 1,151,309,690 968,758,629 832,696,146
Total employees 1,583,472,211 1,299,957,507 1,151,309,690 968,758,629 832,696,146
To lenders
Interest on loans and leases 617,006,242 392,868,166 372,317,361 285,092,829 202,170,943
Total interest on loans and leases 617,006,242 392,868,166 372,317,361 285,092,829 202,170,943
To Government
Taxation 377,238,343 61,280,520 109,218,200 9,176,683 83,783,780
Total Government 377,238,343 61,280,520 109,218,200 9,176,683 83,783,780
To provision
Results of associate companies – – – – –
Impairment profit/loss – – – – –
Revaluation deficit – – – – –
Total provision – – – – –
To expansion and growth
Depreciation 640,223,166 537,296,651 469,423,205 351,695,092 303,447,828
Retained profit/(loss) (35,150,042) 552,808,820 205,881,515 69,296,227 216,766,067
Total expansion and growth 605,073,124 1,090,105,472 675,304,720 420,991,319 520,213,895
Total value generated and distributed 3,182,789,920 2,844,211,667 2,308,149,971 1,684,019,460 1,638,864,764
4,000
3,000
2,000
1,000
0
2013/14 2014/15 2015/16 2016/17 2017/18
Total value generated and distributed (Rs. Mn)
Financial assistance received from the GovernmentA tax exemption was granted to Nawaloka Medicare (Pvt) Ltd., for six years commencing either from two years of commencement of business or the first year in which profit is reported. A tax exemption was granted to the new Nawaloka Medicare Centre for 10 years commencing from 2009.

Man
agem
ent D
iscu
ssio
n an
d A
naly
sis
– In
telle
ctua
l cap
ital
41
INTELLECTUAL CAPITAL
Intellectual capital constitutes of intangible resources when managed systematically creates value and enhance performance. It is generally agreed that intellectual capital comprises human capital, relational capital, and structural capital. In the healthcare, which is a knowledge-intensive sector, the most valuable resources that form the intellectual capital are the knowledge, skills, and experience of healthcare professionals together with internal capabilities, and external relationships. It can also extend to the encompass external elements such as brand, stakeholder relations, and reputation in the community.
As the pioneer of private healthcare sector, Nawaloka possesses 33 years of expertise and knowledge in the sector that supports our highly-skilled employees. The perception of the Nawaloka brand and our reputation among Sri Lankans facilitate our business as well as our relationships with stakeholders and experience in the sector along with employees. There are also systems of knowledge, such as databases, routines, manuals, IT infrastructure, and corporate culture that lead to innovations, and foster efficiency by supporting the quality and quantity of our business and services offered. Our strategy towards for value creation is based on the interdependent processes of collaboration and differentiation which leads to stakeholder satisfaction and value.
Employee expertise and accumulated knowledgeOur highly-skilled employees, since Nawaloka’s inception, have accumulated a store of organisational knowledge as well as expertise, and a level of professionalism that is second to none in the field. Being a pioneer in the industry by introducing various state-of-the-art medical equipment, such as the CT Scanner, MRI Scanner, the latest 640-Slice CT Scanner, 4D Ultra Sound Scanner, and the Fibro Scanner. Therefore, our employees gained world-class experience and expertise in handling and operating the latest technological advances in medicine.
Nawaloka hospitals was successful in retaining the tacit knowledge through high level of employee retention.
Staff with over 10 years of experience (Nos.)
2014/15 2015/16 2016/17 2017/18
Nurses 256 267 165 187
Employees 497 528 418 497
40,

42,
Naw
alok
a H
osp
ital
s P
LC
|
A
nn
ual
Rep
ort 2
017/
18
“Smartpick Supermarket located on the first floor provides convenience to our customers in catering their day-to-day grocery needs”

42, 43
Man
agem
ent D
iscu
ssio
n an
d A
naly
sis
– In
telle
ctua
l cap
ital
Experience of the Senior Management
Senior Management designations Years of experience in the field
Medical Superintendent 16
Chief Nursing Officer 40
Senior Manager - Operations 30
Head of Finance and Corporate Planning 11
Senior Coordinating Officer and Maintenance Manager 33
Senior Coordinating Officer 33
Head of Information Technology 20
Head of Human Resources 14
Head of Marketing 12
Senior Coordinating Officers 37
Electrical and Medical Engineer 13
Structural capital Our systems and policies
We are aware that our business activities have an impact on many aspects. Over the history of our Company, we have developed specific systems, policies, processed to ensure the smooth management of all our relationships. Our policies and framework stem from our tacit knowledge, skills, and experience. We have set up in place various policies and processes like the Procurement Policy, Credit Policy, ISO Policy, Human Resource Policies, Risk Management Policies, Policies for Database Management and information security, and etc.
Procurement policyOur procurement policy is transparent, evidence-based, and delivers all our key business objectives. Correct procurement practises can lead improvement in quality, cost effectiveness, and achievement of key objectives. The procurement policy set up in place ensures that all necessary materials, equipment, and services are available when needed. It also follows the regulatory requirements and practices.
The following are measures we have adopted to our procurement policy to enable our Company to make a direct contribution towards patient care and streamline our processes:
• Maintain an updated vendor master file and implement supplier selection criteria.
• Assess and continuously monitor supplier agreements to ensure they have proper licenses to operate.
• Clearly identify procurement staff’s roles and responsibilities and ensure that they are adequately trained.
• Assess suppliers according to defined environmental parameters and conduct regular audits to keep their standing updated.
• Give priority to suppliers with sound environmental and labour policies.
• Review at least three quotations prior to making a purchase decision to ensure an equal opportunity to all suppliers.
• In addition, the procurement staff are given performance goals, objectives and sustainable procurement aspects for which they are held accountable through their personal development evaluations and assessments.

Naw
alok
a H
osp
ital
s P
LC
|
A
nn
ual
Rep
ort 2
017/
18
44,
IT capabilities and developmentsAs information technology is integrated into the healthcare industry, patients and healthcare providers experience the benefits of convenient access to medical records, and other advancements which has greatly improved the quality of patient care. At Nawaloka, we have invested in the latest technology to offer the best possible care to each patient.
Our in-house ERP system has consolidated all process effectively to prevent errors and helps our employees to become more efficient. We also use reliable, secure solutions to track and record our patient’s confidential information. Our lab system identifies patients who need extra medical support and timely alerts are give. The following are some of the initiatives we have taken over the last year:
• UPIN (Unique Patient Identification Number) UPIN system has been introduced to the company where it saves all patient data in the system with UPIN Number. This Makes it convenient for both patients and doctors/consultants for treatments.
• Picture Archiving and Communication System (PACS) PACS is a medical imaging technology used for storing, retrieving, presenting, and sharing radiology images produced by various medical hardware modalities, such as X-ray, CT scan, MRI and ultrasound machines. PACS is an important tool for digitising, archiving and transmission of the image in a cost-effective way. Nawaloka Hospitals PLC possesses PACS and iFlexmed Workstation, which have improved the efficiency of the Radiology Unit. Radiologist can now access our images remotely.
• Voice recognition Nawaloka uses speech and voice recognition to operate devices, perform commands, and various other tasks. Consultant voices are recorded in digital format and coverted to text/report format whenever required.
• Printing reports through KIOSK We introduced KIOSK machines in the hospital premises which allow patients to access their own lab reports any time by entering their details to the KIOSK machine and obtain printouts of their reports.
• Car park management system Our newly-opened Car Park Complex utilises the latest technology to provide a seamless experience to our customers using parking facilities. The system involves a range of hardware and software for visitor management, automated payment machines, cash desks and validation systems, customer loyalty solutions and parking sensors. The Management system has led to optimised parking, better management of traffic, integrated payment methods, increased safety, decreased cost, and a better brand image.

Man
agem
ent D
iscu
ssio
n an
d A
naly
sis
– In
telle
ctua
l cap
ital
44, 45
Corporate culture
The corporate culture that permeates at Nawaloka was created and maintained throughout our history focuses on patient satisfaction, teamwork, quality, and efficiency. Our Vision, Mission, our values, and our policies and practices form basis of our corporate culture. We possess an employee-friendly organisation culture that transforms into improvement in customer service and innovation. There are performance-based incentives and a clear path for career progression provided to our employees which contributes to motivates them to provide high-quality patient care. To ensure a great working experience, we provide our employees with flexible working hours, educational reimbursement, accommodation, uniforms, sponsorships and seminars, and etc.
Hospitality Card offers various benefits to our loyal customers with the option of adding/redeeming points.
KIOSK machine allows patients to access their lab reports with a touch of a button.
The Nawaloka brand and its reputation
Since our inception in 1985, Nawaloka has become a household name for all Sri Lankans. Over the years our brand has gone from strength to strength to cement our position as the most-trusted healthcare service provider in the country. Throughout our journey, we have been awarded with various accolades which has contributed to the way the Nawaloka brand is perceived in Sri Lanka. Our brand has also become synonymous with innovation and pioneering in the private healthcare sector. Our marketing campaigns and promotional strategies contribute to the enhancement of our brand equity each year.
In 2017, we were rated as a leading hospital amongst Lanka Monthly Digest’s LMD top 100 entities. Our brand value stood at Rs. 835 Mn. while our enterprise value is Rs. 12,146 Mn. We also received an A+ rating from Brand Finance. The following awards were bestowed on Nawaloka in 2017:

46,
Naw
alok
a H
osp
ital
s P
LC
|
A
nn
ual
Rep
ort 2
017/
18
“Our ultimate target is to provide a world-class healthcare service with a faster response”

46, 47
Man
agem
ent D
iscu
ssio
n an
d A
naly
sis
– In
telle
ctua
l cap
ital
ACCA Sustainability Reporting Awards 2017Nawaloka Hospitals was awarded “Winner” in the General Services and Utilities category at the ACCA Sustainability Reporting Awards 2017 for the second consecutive year. The awards are organised by the Association of Chartered Certified Accountants (ACCA) Sri Lanka. The ACCA Sustainability Reporting Awards aim to reward Sri Lanka’s most transparent, accountable and responsible corporates. The awards are judged based on global criteria developed by the ACCA which is the Global Reporting Initiative (GRI) Guidelines for Sustainability Reporting.
CA Sri Lanka Annual Report Award 2017 Nawaloka Hospitals won the “Gold Award” in the Healthcare category at the 53rd Annual Report Awards, organised by The Institute of Chartered Accountants of Sri Lanka. This is the seventh consecutive Gold Award won by Nawaloka Hospitals.
International Arc Awards 2017 Our Annual Report 2017 was awarded a “Silver” award under the category of International Healthcare and Diverse Business at the recently concluded ARC Awards 2017. This award is a testament to the international recognition that our organisation has received.
07th Asia Best CSR Practices Award 2017 - Community Development and Concern for HealthAt the 7th Asia Best CSR Practices Awards 2017 organised by the CMO Asia Council, Nawaloka Hospitals came away with awards for Community Development and Concern for Health. These awards illustrates our commitment towards community development while contributing to universal healthcare.
Relational Capital Relational capital is an intangible asset which forms a part of the intellectual capital of a company. It can be defined as our formal and informal relationships with external stakeholders, information and knowledge sharing, stakeholder engagement practices, business relationships, etc. For more information on how Nawaloka manages its relational capital please refer to stakeholder engagement on page 31 and investor and customer capitals on pages 49 and 54.

Naw
alok
a H
osp
ital
s P
LC
|
A
nn
ual
Rep
ort 2
017/
18
48,
“Our theatre complex has the largest number of theatres in the private healthcare sector equipped to carry out any form of complex surgeries at any given time”

Man
agem
ent D
iscu
ssio
n an
d A
naly
sis
– In
vest
or C
apit
al
48, 49
INVESTOR CAPITAL
We maintain strong, transparent relationships with our investors. We regularly engage with our investors to further develop our relationship. They are cognisant of the operations of the Company, and its investment proposition through various forms of engagement methods.
Throughout our 33 years in operation in the private healthcare sector, we have created value through financial and non-financial means to deliver value to our key stakeholders.
Ordinary share information
Market price per share (Rs.) 31 March 2018 31 December 2017 30 September 2017 30 June 2017 31 March 2017
High 4.80 5.20 4.90 4.80 4.70
Low 4.50 4.60 4.50 4.50 4.20
Closing 4.60 4.60 4.60 4.70 4.70
Market activity
2017/18 2016/17
Highest price 5.20 5.00
Lowest price 4.50 3.40
Year end price 4.60 4.70
Number of shares transactions 1,794 3,774
Number of shares traded 24,125,215 50,507,539
Share turnover (Rs.) 111,711,724 222,227,787
Shares held by public % 34.21 34.21
Key financial activity over five years
Group Company
2017/18 2016/17 2015/16 2014/15 2013/14 2017/18 2016/17 2015/16 2014/15 2013/14
Financial ratios
Return on equity (%) 4.23 5.43 5.16 2.25 5.35 36 (45) (9) 5.31 6.32
Current assets ratio 0.67 0.83 0.89 1.03 1.11 1.37 1.30 1.83 1.62 1.12
Quick assets ratio 0.56 0.73 0.7 0.80 0.85 1.31 1.24 1.75 1.53 1.01
Return on assets (%) 1 2 2 1 3 4 (5) (2) (2) (2)
Debt/Equity ratio 1.86 1.37 1.27 0.84 0.58 3.75 4.80 3.21 1.78 1.20
Earnings/(Loss) per share (Rs.) 0.13 0.17 0.15 0.06 0.15 0.32 (0.31) (0.09) 0.06 0.08
Net assets per share (Rs.) 3.02 3.15 2.83 2.76 2.77 0.90 0.69 1.04 1.20 1.21
Dividend per share (Rs.) 0.10 0.08 0.07 0.06 0.05 0.10 0.08 0.07 0.06 0.05

Naw
alok
a H
osp
ital
s P
LC
|
A
nn
ual
Rep
ort 2
017/
18
50,
Top 20 shareholders of Nawaloka Hospitals PLC as at 31 March 2018
Name Number of shares %
1. Mr H K J Dharmadasa 462,736,182 32.832. Nawaloka Construction Company (Private) Limited 441,778,880 31.343. Mr K D D Perera 387,003,632 27.464. Employees’ Provident Fund 6,186,379 0.445. Ms A G Dharmadasa 5,066,686 0.366. Mrs P Nanayakkara 5,066,666 0.367. Mr V R Ramanan 3,400,000 0.248. Mr L Hettiarachchi 3,188,000 0.239. Mr A G Dharmadasa 3,004,026 0.2110. Nawaloka Developments (Private) Limited 2,814,932 0.2011. Mrs C S Dharmadasa 2,581,866 0.1812. Mr U H Palihakkara 2,570,941 0.1813. Mr K S Warusavitarana 2,500,066 0.1814. Tranz Dominion, LLC 1,719,990 0.1215. Ranatunga Motors (Private) Limited 1,337,598 0.1016. Mr V K L Sugumar 1,099,998 0.0817. Mr G C Goonetilleke 1,090,000 0.0818. Cocoshell Activated Carbon Company Limited 922,398 0.0719. Dr S Salgado 799,998 0.0520. Mr K C Vignarajah 722,746 0.05
Total shares 1,335,590,984 94.76Balance 73,914,612 5.24Total number of shares 1,409,505,596 100.00
Directors shareholding as at 31 March 2018
Name Number of shares
Mr H K J Dharmadasa 462,736,182
Mr R T Wijetilleke 33,332
Deshabandu Tilak de Zoysa 218,000
Prof Lal Chandrasena 601,198
Mr U H Dharmadasa 3,360
Mr A G Dharmadasa 3,004,026
Ms A G Dharmadasa 5,066,686
Mr Damian Sunil Abeyratna NIL
Mr T K Bandaranayake NIL
Mr Victor Rajamanner Ramanan 3,400,000
Mr Palitha Mendis Kumarasinghe, P.C. NIL
Shares held by the public as at 31 March 2018 In calculating the shares held by the public as at 31 March 2018, the Shares held by the Directors, their spouses, shares held by Nawaloka Construction Company (Private) Limited, Nawaloka Developments (Private) Limited, Shares held jointly by Mr H K J Dharmadasa/Seylan Bank PLC and shares held by Mr Victor R. Ramanan and the holders of 10% and more than 10% shares wherever applicable have been excluded considering the level of influence over the reporting entity.

Man
agem
ent D
iscu
ssio
n an
d A
naly
sis
– In
vest
or C
apit
al
50,
51
Name of the shareholder (other than by the public) Number of shares
Mr H K J Dharmadasa 462,736,182Mr R T Wijetilleke 33,332Deshabandu Tilak de Zoysa 218,000Prof Lal Chandrasena 601,198Mr U H Dharmadasa 3,360Mr A G Dharmadasa 3,004,026Ms A G Dharmadasa 5,066,686Mrs C S Dharmadasa 2,581,866Mrs Prithiva Nanayakkara 5,066,666ChandulaLasith Perera 13,332Nawaloka Construction Company (Private) Limited 441,778,880Nawaloka Developments (Private) Limited 2,814,932Mr H K U Dharmadasa 532Mrs S D Chandrasena 48,000Mr Victor R Ramanan 3,400,000
Total number of shares held – Other than by the public 927,366,992
Percentage 65.79 %Shares held by the Public 482,138,604Percentage 34.21 %
1,409,505,596Number of public shareholders 6,506
Range of shareholders
As at 31 March 2018 Number of shareholders
Number of shares Percentage of shareholding
1 – 500 2,183 327,307 0.02
501 – 5,000 2,360 5,181,302 0.37
5,001 – 10,000 683 5,171,615 0.37
10,001 – 20,000 532 8,087,112 0.57
20,001 – 30,000 273 7,191,570 0.51
30,001 – 40,000 129 4,550,854 0.32
40,001 – 50,000 70 3,329,004 0.24
50,001 – 100,000 128 9,714,205 0.69
100,001 – 1,000,000 130 32,806,785 2.33
1,000,001 and above 18 1,333,145,842 94.58
Total 6,506 1,409,505,596 100.00
Composition of shareholders
Number ofshareholders
as at 31 March 2018
Total holding
% Number ofshareholders
as at 31 March 2017
Total holding
%
Category
Institutional shareholders 40 454,628,407 32.25 52 459,084,646 32.57
Individual shareholders 6,466 954,877,189 67.75 6,648 950,420,950 67.43
Total 6,506 1,409,505,596 100.00 6,700 1,409,505,596 100.00
Non-resident shareholders 12 1,836,554 0.13 19 1,972,334 0.14
Resident shareholders 6,494 1,407,669.042 99.87 6,681 1,407,533,262 99.86
Total 6,506 1,409,505,596 100.00 6,700 1,409,505,596 100.00

52,
Naw
alok
a H
osp
ital
s P
LC
|
A
nn
ual
Rep
ort 2
017/
18
“Operating theatres possess state-of-the-art equipment and are manned by a team of clinical professionals specialising in a range of surgical disciplines”

52, 53
Man
agem
ent D
iscu
ssio
n an
d A
naly
sis
– In
vest
or C
apit
al

54,
Naw
alok
a H
osp
ital
s P
LC
|
A
nn
ual
Rep
ort 2
017/
18
CUSTOMER CAPITAL
For over three decades, we have been inspired by our founding mission of “Healing with Feeling”. When a patient walks in through our doors, it is an act of trust. We value that trust and place the utmost importance in delivering a superior, world-class healthcare experience to each an every customer.
Preserving the lives of our patients and their well-being forms the cornerstone of our strategy. In pursuance of this objective, we have built meaningful relationships with our customers over time by staying true to value life above everything else and providing a superior patient-care experience. Cognisant of the profound impact a healthcare professional, be it a nurse, doctor, receptionist, or other workers, may have on a customer, we have inculcated the values of professionalism as well as empathy in our healthcare professionals.
We provide cutting-edge healthcare through investments in innovative medical technology. Nawaloka was always at the forefront of the private sector healthcare with pioneering initiatives and a number of “firsts” in the sector. Our pioneering initiatives, advanced technology, stringent quality standards, comfortable patient facilities, state-of-the-art infrastructure, highly-qualified staff, and other facility upgrades have led to the improvement of customer value.
Our customers hail from all segments of society with diverse expectations. Our highly-skilled, well-trained, dynamic healthcare professionals cater to the challenging, changing needs of our customers. Our team understands that empathy is at the heart of healthcare, and acts with an understanding each patient’s unique set of requirements. Age analysis of customers during the year 2017/18 (%)
A. Below 6 6
B. 6 to 18 years 8
C. 19 to 35 years 21
D. 36 to 50 years 23
E. 51 to 66 years 27
F. 67 to 80 years 12
G. More than 80 years 3
AB
C
D
G
E
F
Geographical segmentation of customers (%)
Range %
North Central 3.7
Eastern 1.5
Uva 0.6
Central 14.9
North western 7.8
Western 44.3
Southern 23.2
Sabaragamuwa 3.7
Northern 0.3

54, 55
Man
agem
ent D
iscu
ssio
n an
d A
naly
sis
– C
usto
mer
Cap
ital
31,000
30,000
29,000
28,000
27,000
26,000
2017/182016/172015/162013/14 2014/15
Patient admissions (Nos.)
60,000
48,000
36,000
24,000
12,000
0
3,500
3,500
2,100
1,400
700
0
MarchFebruaryJanuaryDecemberApril JuneMay August October NovemberSeptemberJuly
Monthly analysis of patient admissions and channel appointment (Nos.)
1,500
1,200
900
600
300
0
2017/182016/172015/162013/14 2014/15
Foreign patient admissions (Nos.)
Our core business lines We have identified and integrated six core business sectors in creating value. Our business model is geared to generate revenue from the following sectors:
• Emergency Treatment Unit and OPD service
• Channelling services
• Laboratory services
• Theatres
• Radiology Unit
• Pharmaceutical services
Emergency Treatment Unit and OPD service
Our Emergency Treatment Unit (ETU) is staffed 24/7 with a multidisciplinary team of specialists to treat patients that need urgent medical help with acute illnesses or injuries. Our ETU offers high-quality, modern facilities which includes 11 fully-equipped beds and our ETU staff is highly-trained with over 30 years of experience to handle any emergency requirement with knowledge and experience required for prevention, diagnosis, and management of any urgent medical issue. Our ambulance service is equipped with seven ambulances with life-saving equipment. We have invested in two more ambulances, in addition to the seven in our possession during the year. In 2017, 3,414 patients were admitted to the ETU and most of the patients were fully recovered.

Naw
alok
a H
osp
ital
s P
LC
|
A
nn
ual
Rep
ort 2
017/
18
“Our ETU offers high-quality, modern facilities which includes 11 fully-equipped beds and our ETU staff is highly trained with over 30 years of experience to handle any emergency requirement”
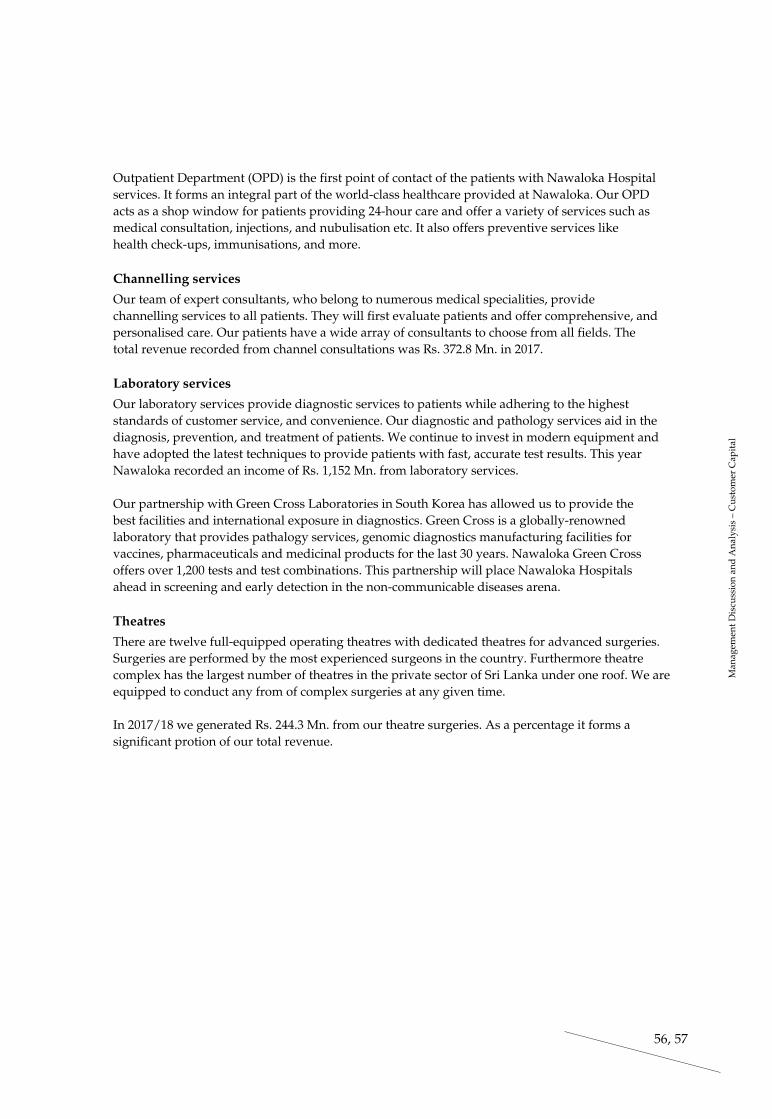
Man
agem
ent D
iscu
ssio
n an
d A
naly
sis
– C
usto
mer
Cap
ital
57
Outpatient Department (OPD) is the first point of contact of the patients with Nawaloka Hospital services. It forms an integral part of the world-class healthcare provided at Nawaloka. Our OPD acts as a shop window for patients providing 24-hour care and offer a variety of services such as medical consultation, injections, and nubulisation etc. It also offers preventive services like health check-ups, immunisations, and more.
Channelling services
Our team of expert consultants, who belong to numerous medical specialities, provide channelling services to all patients. They will first evaluate patients and offer comprehensive, and personalised care. Our patients have a wide array of consultants to choose from all fields. The total revenue recorded from channel consultations was Rs. 372.8 Mn. in 2017.
Laboratory services
Our laboratory services provide diagnostic services to patients while adhering to the highest standards of customer service, and convenience. Our diagnostic and pathology services aid in the diagnosis, prevention, and treatment of patients. We continue to invest in modern equipment and have adopted the latest techniques to provide patients with fast, accurate test results. This year Nawaloka recorded an income of Rs. 1,152 Mn. from laboratory services.
Our partnership with Green Cross Laboratories in South Korea has allowed us to provide the best facilities and international exposure in diagnostics. Green Cross is a globally-renowned laboratory that provides pathalogy services, genomic diagnostics manufacturing facilities for vaccines, pharmaceuticals and medicinal products for the last 30 years. Nawaloka Green Cross offers over 1,200 tests and test combinations. This partnership will place Nawaloka Hospitals ahead in screening and early detection in the non-communicable diseases arena.
Theatres
There are twelve full-equipped operating theatres with dedicated theatres for advanced surgeries. Surgeries are performed by the most experienced surgeons in the country. Furthermore theatre complex has the largest number of theatres in the private sector of Sri Lanka under one roof. We are equipped to conduct any from of complex surgeries at any given time.
In 2017/18 we generated Rs. 244.3 Mn. from our theatre surgeries. As a percentage it forms a significant protion of our total revenue.
56,

Naw
alok
a H
osp
ital
s P
LC
|
A
nn
ual
Rep
ort 2
017/
18
58,
Radiology Unit
Our Radiology Unit offers a wide range of diagnostic medical imaging services using state-of-the-art equipment and highly skilled staff. Our certified radiologists and our technologists provide exceptional care in a comfortable and compassionate environment. Over the years, we have invested heavily in the latest medical equipment like 640-slice CT Scanners and 3 TESLA MRI Scanners to improve our Radiology Unit. Company has invested in another 1.5 TESLA MRI Machine to cater to the increased demand. Nawaloka is the only private hospital that owns two MRI machines. This investment led to the reduction of patient waiting time. In 2017, our Radiology Unit contributed Rs. 680 Mn. to the total revenue.
Pharmaceutical services
We have six pharmacies in our hospital. In tandem with our professional healthcare services, we also provide range of pharmaceutical services to our customers through our six on-site pharmacies. There are three pharmacies in our hospital premises, open 24 hours that offer safe, efficient dispensing of medication. Our pharmaceutical staff provides information regarding drugs and dosages to patients and they work in collaboration with the medical team. Pharmaceutical services recorded to an income of Rs. 2,351 Mn. in 2017.
Our new ventures We constantly update our products and services to ensure that we are at the forefront of the latest, innovative developments of the global healthcare sector. We constantly review and strive to improve our product offering to cater to the evolving needs of our customers. The following are the new improvements we implemented during the year:
Cardiac Catheterisation Laboratory (Cath Lab)
During the year, we refurbished our Cath Lab which provides high-risk, elective, cardiac diagnostic procedures. Our skilled team of consultants, cardiologists, nurses, and radiographers can carry out a number of procedures including:
• Coronary angiography
• Coronary angioplasty
• Diagnosis and treatment of adult congenital heart disease
• Diagnosis of pulmonary vascular disorders
Upgraded machines allow us to take digital pictures of superior quality in low X-ray radiation. Further, the interior of the Cath Lab was also refurbished to provide better comfort and care to our patients. The improvements in the Cath Lab will greatly increase patient care.
Latest MRI machine
We continue to invest in the Radiology Unit to make it the best in the country. To achieve that goal, we acquired the latest 1.5 TESLA MRI machine which provides high-quality digital images at a remarkable speed which help consultants to diagnose with confidence to deliver the best, most accurate diagnosis. The advanced diagnostic solutions increase the capabilities on MRI to cover emerging clinical indications in neurology, oncology, and cardiology. The immersive in-bore experience offers patients a comforting experience and voice guidance can be given through the headphones, helps patients to relax and hold still for better image quality.

Man
agem
ent D
iscu
ssio
n an
d A
naly
sis
– C
usto
mer
Cap
ital
58, 59
Nawaloka Medicare Gampaha
To enhance the quality access to healthcare to all regions and not just for the urban centres, Nawaloka branched out and established Nawaloka Medicare in Gampaha. It is a medical institution of excellence that has integrated modern diagnostic and curative facilities. Comprising of state-of-the-art medical facilities and equipment, this institution will provide best of Nawaloka healthcare to the people in the Gampaha region.
Nawaloka Medicare in Gampaha is equipped with a 24/7 Emergency Treatment Unit, 24-hour pharmacy, 24-hour lab services, 24x7 ambulance service, OPD services, channeling services, ECG, echo, EX ECG, X-ray, Dental Unit, Eye Care Unit, and a fully-fledged Maternity Care Unit.
Currently Nawaloka Medicare serves many customers, and we are hoping that in time, it will be a thriving medical institution in the Gampha region.
Nawaloka Medicare Gampaha was established in June 2017 with all modern diagnostic facilities.
Nawaloka Car Park and Speciality Centre The 14-floor, multi-storey car park and Specialist Centre opened its doors to the public in December 2017. This is one of the most impressive landmarks in the history of Nawaloka. The structure, designed to create a harmonious ambience, has over 550 parking facility and covers 200,000 sq.ft. which contributes to make Nawaloka Hospitals the single largest private hospital complex with 420,000 square feet of built-up area.
Specialist Centre has 15 modules comprising of consultation chambers, pharmacy, laboratory, radiology services, a dedicated areas for wellness centres, a supermarket, children play area, bank, restaurant, a diabetic centre, and more catering to every healthcare need through one platform. Each floor is designed and planned to enhance the customer experience. This new complex has taken Nawaloka Hospital to the forefront of the private healthcare sector of the country.
Nawaloka Cosmetic Unit
Nawaloka Cosmetic Unit offers the a range of services using the most recent surgical techniques employed to provide minimally invasive surgery reducing postoperative complications in a safe secure environment. All our professionals: consultant dermatologists, plastic surgeons, and oculoplastic surgeons are certified physicians and have extensive experience in the field.

Naw
alok
a H
osp
ital
s P
LC
|
A
nn
ual
Rep
ort 2
017/
18
Customer touchpoints
Gampaha
NegomboKegalle
Nuwara Eliya
Ratnapura
Badulla
Kandy
MataleKurunegala
Puttalam
MannarVavuniya
Mullaitivu
Killinochchi
Jaffna
Anuradhapura
Trincomalee
Polonnaruwa
Batticaloa
Ampara
Colombo
Kalutara
Galle Matara
Weligama
Hambantota
Moneragala
Colombo DistrictMoratuwaKoralawallaRatmalanaBoralesgamuwaKalubowilaMattakkuliyaAthurugiriyaThalagala JuntionThalawatugodaMattakkuliyaMulleriyawaThotalangaThalwatta
Galle DistrictKarapitiyaGintotaDevetaMorawakaMapalagama HikkaduwaImaduwaKotapolaUdugamaAmbalangodaAhangamaDeniyayaThawalama Balapitiya WeligamaNeluwa ElpitiyaPitabaddara
Ratnapura DistrictAvissawellaMinnanaDalaThalduwaPanukarapitiyaKalawanaYatiyantotaEheliyagodaHangamuwaKarawanellaKiriellaKuruwitaRuwanwellaIngiriyaDehiowitaKithulgalaNivithigala
Hambantota DistrictDikwellaWalasgalaRannaBeliattaGatamannaWeerakatiyaKirindaEmbilipitiyaDondraWalasmullaSooriyawewaHakmanaMiddeniyaHambantotaGandaraHungamaAmbalantota
Batticaloa DistrictKattankudy KalmunaiSainthamaruthu Nintavur SammanthuraiKokadicholai
Trincomalee DistrictEravur ChenkaladySanthyveli ValaichchenaiPesalai Ottamavady
Jaffna DistrictPoint PedroNelliyadiPutturChankanaiMoolaiKokuvilKondavilThirunelveliPasayurMain StreetJaffna TownNallurThondamanaru
Kalutara DistrictBulathsinhalaRaigamaEgaloyaWadduwaAgalawatta Bandaragama PimburaKalutaraGovinnaMahavilaAluthgamaHoranaEluvilaDargatownPokunuvitaNagodaAtalugamaGorakapolaMathugamaMillaniyaHoranaWathara
Gampaha DistrictSeeduwaKatunayakePitipanaPohorathotaKochchikadeMukalangamuwa

Man
agem
ent D
iscu
ssio
n an
d A
naly
sis
– C
usto
mer
Cap
ital
61
Customer care Good customer care extends to enhancing our patients experience. We understand that patients are often in vulnerable, stressful situations in need of hospitality and consideration and the attitudes and manners of our team has a big impact on patient satisfaction. Even the smallest interaction matters. The best possible method to judge patient satisfaction is through feedback. There is a mechanism in place to evaluate, measure, and enhance our operations and customer expectations.
Our Call Centre conducts two-way communication between the hospital and its customers. This type of direct communication has created great value and enhanced customer experience. Our Call Centre handled over 1.7 million inquiries through the phone with an average call answering time of one minute. We also recorded a customer satisfaction level of 94% in 2017/18.
We have implemented the following measures in our hospitals to keep track of customer satisfaction.
• The SMILE customer feedback application can be used by our patients to provide their feedback through just a click on a tab. These tabs are located in various customer touchpoints.
We use latest IT platforms for prompt customer feedback.
100
80
60
40
20
0
Annual customer satisfaction summary 2017-18 (%)
Mar. 2018
Dec. 2017
Jan. 2018
Feb. 2018
Nov. 2017
Oct. 2017
Mar. 2017
May 2017
Apr. 2017
Jun.2017
Aug.2017
Sep. 2017
Jul.2017
Fully satisfied % Partially satisfied % Dissatisfied %
• Our customers can also use our social media networks to raise any concerns about the healthcare services provided at Nawaloka.
• We have a Public Relationship Officer in place who visits regularly to assess the level of customer satisfaction. Any complaints may be directed to these officers.
60,

Naw
alok
a H
osp
ital
s P
LC
|
A
nn
ual
Rep
ort 2
017/
18
“Cognisant of the profound impact a healthcare professional, be it a nurse, doctor, receptionist, or other workers, may have on a customer, we have inculcated the values of professionalism as well as empathy in our healthcare professionals”

Man
agem
ent D
iscu
ssio
n an
d A
naly
sis
– C
usto
mer
Cap
ital
63
1 minAverage time taken
to answer
87%Calls answered within
average time 1,744,253Total calls received
4,779No. of daily calls16,272
94%Customer
satisfaction rate
Quality assurance
Over the years we are in the process of improving the customer service. We continue to implement new measures and develop existing methods to enhance the quality of our services. We follow international standards; Nawaloka Hospitals PLC was the first to be awarded the ISO 9001:2008 Sri Lanka Quality Award and National Excellence Award. We also received ISO 9001:2015 Certification. Further, the Nawaloka Laboratory is accredited and certified for ISO 15189 by Sri Lanka Accreditation Board.
We proudly claim the title of being the first hospital in the country receiving ISO 9001:2015 Quality Award.
Quality related data is reviewed regularly by the Quality Improvement and Patient Safety Committee. We have an effective Quality Management Programme in place to achieve customer satisfaction. The Quality Assurance Department maintains and analyses all data pertaining to patient safety and infection control to ensure safety of the patients and staff members.
Product responsibility
We conform to all necessary safety features and legislation related to product safety and labelling. Our customers are fully informed about the properties of our products and their conditions of use. We also take great responsibility in the procurement of third-party products like pharmaceuticals. We ensure that these products are procured from high-quality, reliable suppliers.
63,

64,
Naw
alok
a H
osp
ital
s P
LC
|
A
nn
ual
Rep
ort 2
017/
18
During the year under review, there were no incidents of non-compliance with regulations and voluntary codes concerning marketing communications, including advertising, promotion, and sponsorship by type of outcomes.
Marketing Communications
Our marketing communications strategy and implementation process is geared to add value through content that informs our prospective customers of service options and features. When communicating externally we take utmost care to portray the true identity of Nawaloka Hospitals PLC to the general public. We also ensure to comply with all the regulatory requirements and Code of Conduct in our communications.
There is a mechanism in place to monitor all our communications like medical camps for public, TV and radio advertising, print media, PR activities, and sponsorships. The Marketing Division along with other relevant departments ensure that our communications adheres to standards and are ethical.
Our Marketing Department carried out the following campaigns and awareness programmes during the year:
• A segment aimed at educating and creating awareness on various health issues and the services offered by Nawaloka Hospitals was conducted in the TV programme.
• The Specialist Centre was promoted through TV, radio, and press.
• A campaign was launched covering the opening of the Premier Wellness Centre, Specialist Centre, and the procurement of the new MRI machine.
• A team from Nawaloka participated in the Medicare Exhibition at BMICH and Medicare Exhibition in Jaffna.
• Vesak celebration was conducted under the patronage of His Excellency President Maithripala Sirisena.
Free medical camp at Jaffna.
During the year under review, there were no incidents of non-compliance with regulations and voluntary codes concerning marketing communications, including advertising, promotions, and sponsorships.
During the year new features were added to our website to facilitate our customers who reach us remotely through digital means. The payment gateway, E-chanelling screen, medical packages, and consultant time schedules were updated while adding a number of user-friendly options.
Sale of banned and disrupted products
Nawaloka Hospitals PLC does not provide services or products which are against the laws of the country. We strictly abide by the relevant Codes of Conduct and Regulatory Codes in doing so. There were no incidents of non-compliance pertaining to the sale of banned or disputed products during the year in review.

64, 65
Man
agem
ent D
iscu
ssio
n an
d A
naly
sis
– C
usto
mer
Cap
ital
Standards used for patients’ health and safety At Nawaloka, we promote high standards of patient safety by engaging, educating, and equipping patient care teams to ensure adherence to evidence-based safe practices and the use of relevant clinical performance indicators to eliminate preventable harm. We recognise that our main priority is the health and safety of our patients. We take stringent measures to prevent any harm or danger to our patients while receiving care at Nawaloka. We strictly comply with regulations on health and safety, food and hygiene, and all the relevant voluntary codes to avert any incidents that compromise the safety of our customers.
All our new services undergo a stringent audit and assessment before they are introduced to the market. Safeguarding customer privacy is one of the top priorities of Nawaloka, the Internal Audit Division of Nawaloka conducts checks periodically to identify potential risk exposure and to identify any potential threats. Nawaloka Hospital Negombo obtained OHSAS 18001: Occupational Health and Safety Assessment Series Certification.
During the year, there were no recorded incidents of non-compliance pertaining to patient health and safety.
Maintaining customer privacy We realise that information pertaining to health is highly personal, and therefore, needs to be protected whenever a patient uses our services. We believe in clear and transparent communication between our customers which leads to maintaining privacy. Nawaloka Hospitals PLC conforms to the norms are regulations pertaining to customer information, its storage and use. Our systems and processes, IT in particular are designed to deliver protection at all times. We are pleased to record that there were no complaints regarding breach of customer privacy and losses of customer data during the year under review.
Our clinical staff, nurses and general employees are continuously given training on ethical behaviour to ensure confidentiality
Electronic Diagnosis Card system to store information
Strict enforcement of access controls such as
passwords and biometricsElectronic medical records (EMR) to store the patient’s information.
Anti-corruption/Anti-competitive behaviour/Compliance We are aware that corruption in the healthcare sector can lead to dire consequences and have taken strong measures to prevent corruption, and unethical behaviour and practices. We have setup good governance practices to eliminate exposure to corruption. Nawaloka’s Risk Management Committee is responsible for monitoring and preventing corruption. We have formulated a proper framework to ensure ethical business practices in all our operations.
During the year under review, there were no incidents related to the non-compliance of regulations and voluntary codes concerning anti-corruption and compliance.

Naw
alok
a H
osp
ital
s P
LC
|
A
nn
ual
Rep
ort 2
017/
18
“Our pharmaceutical staff provides information regarding drugs and dosages to patients and they work in collaboration with the medical team”

Man
agem
ent D
iscu
ssio
n an
d A
naly
sis
– E
mpl
oyee
cap
ital
67
EMPLOYEE CAPITAL
Our team is composed of highly dedicated, loyal professionals who help maintain the legacy that Nawaloka has created over the last 33 years. They are the heart of executing our strategy founded on our vision, mission, and values. Our team works to reinforce the corporate culture that permeates throughout Nawaloka and grapples with the rapidly evolving healthcare sector to keep up with changing expectations of our customers.
Our employees form a close-knit team whose only objective is to deliver the best care possible to our customers. In providing exemplary healthcare, our team values the notion of empathy above everything else. They truly embody our mission of “Healing with feeling”.
We have enjoyed meaningful relationships with our employees over the years through various, effective engagement methods. From recruitment, training, executing everyday tasks, to long-term retention there is a clear strategy in place. Through our training programmes, we expose our team to global best practices in the medical field as well as working with the latest technological advances in the field.
Moreover, Nawaloka Hospitals PLC has a reputation in the industry of being a diverse, equal opportunity employer that does not discriminate on gender, race, ethnicity, sex, religion, or disability. We adhere to the highest ethical practices and human rights in dealing with our team, and we provide a safe, healthy working environment.
Workforce profileThe diverse nature of our team is evident in our workforce composition. The multiple perspectives that emerge from a diverse workforce help us to create a collaborative, cohesive working culture. Our workforce is 2,837 strong in 2017/18. Staff level has gone-up due to establishment of the Speciality Centre, Nawaloka Medicare in Gampaha, and our Premier Wellness Centre.
3,000
2,400
1,800
1,200
600
0
2017/182016/172015/162014/152013/14
No. of Employees (Nos.)
Gender analysis
Male - 737
26%Female - 2,100
74%
Our winning team comprises of 74% of female employees and 26% male employees.
66,
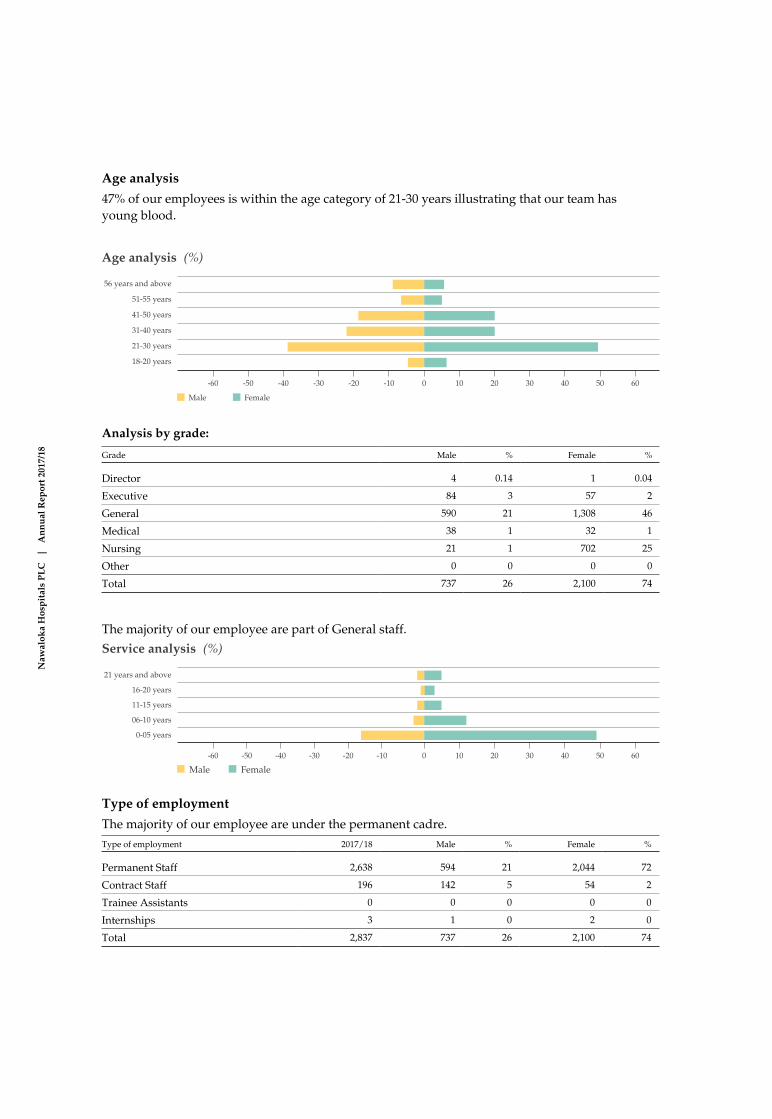
68,
Naw
alok
a H
osp
ital
s P
LC
|
A
nn
ual
Rep
ort 2
017/
18
Age analysis
47% of our employees is within the age category of 21-30 years illustrating that our team has young blood.
56 years and above
51-55 years
41-50 years
31-40 years
21-30 years
18-20 years
10 20 30 40 60500-10-20-30-40-60 -50
Age analysis (%)
Male Female
Analysis by grade:
Grade Male % Female %
Director 4 0.14 1 0.04
Executive 84 3 57 2
General 590 21 1,308 46
Medical 38 1 32 1
Nursing 21 1 702 25
Other 0 0 0 0
Total 737 26 2,100 74
The majority of our employee are part of General staff.
21 years and above
16-20 years
11-15 years
06-10 years
0-05 years
10 20 30 40 60500-10-20-30-40-60 -50
Service analysis (%)
Male Female
Type of employment
The majority of our employee are under the permanent cadre. Type of employment 2017/18 Male % Female %
Permanent Staff 2,638 594 21 2,044 72
Contract Staff 196 142 5 54 2
Trainee Assistants 0 0 0 0 0
Internships 3 1 0 2 0
Total 2,837 737 26 2,100 74
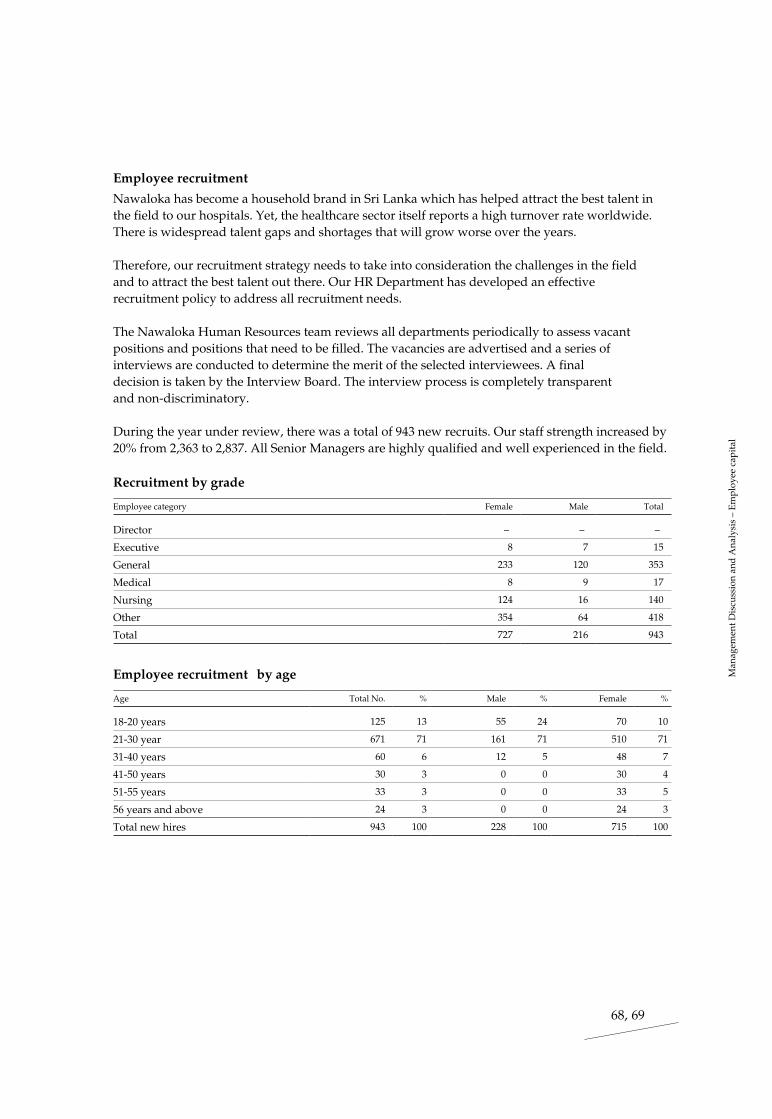
68, 69
Man
agem
ent D
iscu
ssio
n an
d A
naly
sis
– E
mpl
oyee
cap
ital
Employee recruitment
Nawaloka has become a household brand in Sri Lanka which has helped attract the best talent in the field to our hospitals. Yet, the healthcare sector itself reports a high turnover rate worldwide. There is widespread talent gaps and shortages that will grow worse over the years.
Therefore, our recruitment strategy needs to take into consideration the challenges in the field and to attract the best talent out there. Our HR Department has developed an effective recruitment policy to address all recruitment needs.
The Nawaloka Human Resources team reviews all departments periodically to assess vacant positions and positions that need to be filled. The vacancies are advertised and a series of interviews are conducted to determine the merit of the selected interviewees. A final decision is taken by the Interview Board. The interview process is completely transparent and non-discriminatory.
During the year under review, there was a total of 943 new recruits. Our staff strength increased by 20% from 2,363 to 2,837. All Senior Managers are highly qualified and well experienced in the field.
Recruitment by grade
Employee category Female Male Total
Director – – –
Executive 8 7 15
General 233 120 353
Medical 8 9 17
Nursing 124 16 140
Other 354 64 418
Total 727 216 943
Employee recruitment by age
Age Total No. % Male % Female %
18-20 years 125 13 55 24 70 10
21-30 year 671 71 161 71 510 71
31-40 years 60 6 12 5 48 7
41-50 years 30 3 0 0 30 4
51-55 years 33 3 0 0 33 5
56 years and above 24 3 0 0 24 3
Total new hires 943 100 228 100 715 100

Naw
alok
a H
osp
ital
s P
LC
|
A
nn
ual
Rep
ort 2
017/
18
“The 3 TESLA (3T) MRI scanner provides high-quality digital images at remarkable speed which help consultants to diagnose with confidence to deliver the best, most accurate diagnosis”

Man
agem
ent D
iscu
ssio
n an
d A
naly
sis
– E
mpl
oyee
cap
ital
71
Recruitment by regionLocation/Region Total %
Central 37 4
Western 593 63
Eastern 18 2
North Central 18 2
North Western 115 12
Sabaragamuwa 33 3
Southern 75 8
Uva 34 4
Northern 20 2
Total 943 100
Training and development
As the healthcare industry develops so does the specialisation of different parts of the industry, therefore continuous professional development is paramount to our success in a highly competitive environment. We realise that employee training opportunities are essential to our growth and it provides a rewarding working environment to our team. Our training programmes are aimed at providing our employees sound knowledge in technically complex specialities which covers a wide array of topics from patient care, healthcare trends, treatments and techniques to fields such as radiology. Our appraisal system helps us identify the areas that need more focus. Since, every year we invest in state-of-the-art medical technology, we provide our employees with training to handle such equipment. There also exists work-based learning at individual and departmental level.
Training need analysis
Design of training course
Delivery of training
Evaluation of training
In 2017/18, there was a total of 12,326 hours of training for Nawaloka employees. There were diversified programmes introduced such as emergency training, CPR, customer care, language skills, fire and safety, etc. Wide range of training programmes that were conducted focused on all the staff, the nursing staff, new recruits, and clinical staff of Nawaloka.
We faced a number of challenges when introducing and conducting training programmes like limited time and resources and to cater to the diverse requirements of our diverse workforce. Yet, we were able to satisfactorily conduct professional development programmes which will contribute to the professionalism of our team.
70,

Naw
alok
a H
osp
ital
s P
LC
|
A
nn
ual
Rep
ort 2
017/
18
2016/1710,031
Training hours Training hours
2017/1812,326
Training programmes conducted during the year
Training programme Target group No. of participants
Duration (hours)
Total training hours
Awareness Call Centre 33 12 198
Awareness Nursing Assistant 24 3 72
BLS/CPR Home Nurse 27 14 189
BLS/CPR Patient Care Assistant 24 14 168
BLS/CPR Nursing 76 49 532
BLS/Pro CPR Nurses Training School 72 42 504
Caregiver Training Home Nursing 183 168 1,281
Customer Relations Front Office Staff 300 20 1,000
Customer Relations Cashier 30 2 60
Customer Relations Channel 37 4 74
Customer Relations Clinic Asst. 20 7 140
Customer Relations Front Office 15 2 30
Customer Relations Laboratory 17 2 34
Customer Relations Nursing 50 2 100
Customer Relations Security 30 2 60
Emergency All Staff 17 2 34
Emergency Medical Response Program Clinical Staff 44 42 308
English Language All Staff 175 36 350
English Language All Staff 5 2 10
Fire Safety All Staff 591 60 3,369
Fire Safety Kitchen Staff 28 3 84
Fire Safety Nurses Training School 25 4 100
Fire Safety Warden 91 16 364
Home Nursing Nursing 22 4 88
Lecture – Antibiotics Clinical Staff 67 1 67
Lecture ENT Clinical Staff 83 1 83
Lecture Heart Clinical Staff 87 1 87
New Hire Orientation All 420 84 2,940
Total 2,593 599 12,326

Man
agem
ent D
iscu
ssio
n an
d A
naly
sis
– E
mpl
oyee
cap
ital
73
Employee retention and turnover Employee turnover in healthcare is the second highest among all sectors. A study by Compdata Surveys of 11,000 healthcare employers with more than 11 Mn. employees found the average turnover in healthcare jobs in 2017 was 20.6%, up from 15.6% in 2010. Being a service-intensive industry, employees have a direct impact on providing high-quality, empathetic care to patients.
We understand that this is an ongoing complication which is costing the industry a large amount of money spent on recruitment and training, as well as time. We, at Nawaloka, have taken several initiatives to lower the turnover rate and to retain employees for a longer period of time.
Our retention process starts at recruitment itself where we monitor and analyse potential recruits by evaluating experience, qualification, reference checks, and etc. before we hire them. There is also a probation period to determine whether the recruit is a perfect fit for the working culture of Nawaloka.
We also provide myriad benefits and scope for professional growth which facilitates in building a long-term, interdependent relationship with our employees. We attract the new generation of workers while retaining the experienced older generation.
Our employee engagement programmes are directed towards fostering a healthy relationship between us and our team. They include employee satisfaction surveys and feedback, financial and non-financial benefits, bonus programmes, and employee reward schemes to motivate and incentivise our employees.
Employee engagement Research shows that there is a significant link between the employee engagement with patient experience, patient safety, reduction of patient mortality, and high financial margins. At Nawaloka, we have made employee engagement an utmost priority.
50
40
30
20
10
0
Strongly dissatisfiedDissatisfiedNeutralSatisfiedStrongly satisfied
Employee satisfaction survey 2017 (%)
This survey proves that 92.66% of the employees are strongly satisfied, satisfied, or neutral.
72,

74,
Naw
alok
a H
osp
ital
s P
LC
|
A
nn
ual
Rep
ort 2
017/
18
“Our ultrasound machines generate high quality images with a full spectrum of all available functions, enabling us to provide an unmatched service to our patients”

74, 75
Man
agem
ent D
iscu
ssio
n an
d A
naly
sis
– E
mpl
oyee
cap
ital
Employees performance evaluation
The performance of the employees are evaluated at each quarter and marks are allocated accordingly under particular categories:
Category % of Employees Evaluated
Male Female
Job-related knowledge and Skills 82 81
Quality of work (Neatness, accuracy, creativeness, and timely action) 79 84
Reliability (Dependability on him/her) 77 81
Work attitude (Cooperation, sense of responsibility etc.) 84 83
Leadership (Ability to get a job done) 85 86
Inter-personal relationship (Ability to get on with the Staff) 82 81
Public relations (Positive relationship with customer) 87 86
General conduct (Observation of rules and regulations) 81 81
Carrier development (Learning through experience) 81 81
Punctuality (Unauthorised leave and absenteeism records ) 81 81
Nawaloka “Best Employee”
Employee recognition programmes are a proven way to boost employee engagement and increase retention in the sector. At Nawaloka, we realise the importance of giving due recognition to our committed employees. The Nawaloka “Best Employee” programme is conducted every year to encourage and reward excellence. The “Best Employees” receive certificates and awards. They are also considered for promotions and salary increments.
All confirmed permanent employees
Prior Evaluation from Head of the Department
Highest mark form Evaluation in 4th Quarter
Judge Board Evaluation Face-to-face Interview with
Judges as final step
From 100 marks, 50% for average four quarters
performance evaluation and other 50% for other criteria
considered

Naw
alok
a H
osp
ital
s P
LC
|
A
nn
ual
Rep
ort 2
017/
18
Parental leave
All female employees of Nawaloka Hospitals PLC are entitled to parental (maternity) leave. Parental leave will be granted in accordance with the Shop and Office Act and we facilitate their return to work without any constraints.
In 2017, our 1,987 female employees were entitled to parental leave while 88 employees took parental leave, of which 55 returned to work at the end of the period and 84 returned to work after the end of their parental leave. The return to work and retention rates of employees who took parental leave in 2017 stands at 65%.
Benefits and rewards
We are aware that the key to success in a highly competitive sector is the optimal motivation of our human capital. We invest in our people by providing added incentives and benefits to make Nawaloka the best possible work place for our team.
We offer cash benefits, recreation and entertainment benefits, and social and development activities to our employees to improve their well-being. These benefits are available to all grades.
Benefits Permanent Employees
Contract Employees
Guaranteed cash and allowances
Fuel/Travelling Allowance Applicable Applicable
Hostel facility and allowances Applicable Not Applicable
Variable pay
Performance Bonus Applicable Applicable
Sales Incentives Applicable Applicable
Overtime Applicable Applicable
Reimbursable expense
Other perquisites
Holiday Bungalow/Annual Trip Applicable Applicable
Medical Insurance Scheme (OPD, In house, Life, Personal Accident Cover) Applicable Applicable
Leave Applicable Applicable
Retirals
EPF/ETF/Gratuity Applicable Not Applicable
Cash benefits
• Fixed monthly salary, annual bonuses on the overall performance of the Company, performance-based incentives, and festival advances.
• Travelling allowances, fuel allowances, vehicle allowances, staff loans at concessionary interest rates and reimbursement of membership fees.
• Employee-defined benefit plans.
• Marriage allowance.
• Insurance coverage.
• Hostel benefit.
• Scholarships for children of employees who passed GCE O/L, GCE A/L and entered university.

Man
agem
ent D
iscu
ssio
n an
d A
naly
sis
– E
mpl
oyee
cap
ital
77
Recreation and entertainment benefits
Nawaloka Hospital Annual Cricket Match.
• Annual trip.• Staff meals at cost and dry ration packs.• Foreign training.• Weekly refreshment.
Social development activities
Donation of text books Aluthwela South College Diyathalawa
• Book donations.• Dry ration distribution.• Free Medical Camps• Free Surgeries
Subsidised medical entitlement
Being in the healthcare industry, we want to provide the best possible healthcare to our team. With that in mind, a Medical Card for all hospital services is issued for every employee who completes six months of service.
Medication entitlement
Year Value of drugs issues to staff (Rs.) No. of staff who used medicine cards
2017/18 3,320,234 1,968
2016/17 3,892,471 1,657
2015/16 4,963,301 1,689
2014/15 4,218,957 1,856
Number of employees admitted under the General Insurance Scheme
Year No. of Employees Admitted
2017/18 537
2016/17 541
2015/16 622
2014/15 622
2013/14 498
76,

78,
Naw
alok
a H
osp
ital
s P
LC
|
A
nn
ual
Rep
ort 2
017/
18
“Picture Archiving and Communication (PAC System) facilitates our consultants with the ability to remotely access radiology images of patients using their smart phones or PCs”

78, 79
Man
agem
ent D
iscu
ssio
n an
d A
naly
sis
– E
mpl
oyee
cap
ital
Number of death donations (Welfare Fund)
Year No. of employees used
2017/18 38
2016/17 27
2015/16 12
RemunerationWe follow a fair, transparent remuneration policy at Nawaloka Hospitals PLC. Remuneration is determined depending on the contribution the employees make to the Company. Our attractive remuneration packages are offered based on skill, experience, qualification, and level of responsibility.
Collective Bargaining and Freedom of AssociationFreedom of association is the right of people to come together, to form or join informal or formal groups, for the purpose of collective action. We have recognised that freedom of association is a reflection of employee engagement.
We encourage and uphold our employees’ right to freedom of association and collective bargaining.
All permanent staff members deal with collective bargaining agreements. Due to the effective transparent policies in place, there were no incidents of violation of freedom of association of employees and collective bargaining during the reporting period.
Minimum Notice Period regarding changes in operations
There were no significant changes in operations during the year under review. The following policies are followed regarding operational changes:
Type of change Minimum Notice Period
Transfer Immediate or 2 weeks
Terminations 1 Month
Retirements 3 Months
Dismissal Immediate
Resignation 1 Month
Conducive working environmentAt Nawaloka, we have created an accommodating and conducive working environment that increases job satisfaction and productivity. Our team is encouraged, accepted, and kept satisfied which motivates them to perform better. We also actively encourage our employees to present suggestions that may improve our organisation. Every year, employee suggestions are entertained and some are implemented by the Management. In 2018, there were 46 organisation-oriented, 6 employee-oriented, and 19 patient-oriented suggestions.
Category No. of ideas
No. of ideas implemented
Organisation oriented 46 24
Employee oriented 6 2
Patient oriented 19 8

Naw
alok
a H
osp
ital
s P
LC
|
A
nn
ual
Rep
ort 2
017/
18
Health and safetyAt Nawaloka we have a comprehensive health and safety policy in place to demonstrate our full commitment to employee health and safety. We strive to create a safe, healthy working environment for our employees. Being a part of the healthcare industry, the risk of exposure to occupational hazards is higher relatively to other industries. To mitigate and prevent all occupational hazards Nawaloka has developed a comprehensive process which includes the following:
• Hazard identification
• Mitigation framework to identify risks
• Risk assessment
• Prioritise and manage risk
Whenever a new service is launched, it is assessed through the above processes to ensure its safety. Moreover, our employees are provided with necessary training to avoid occupational hazards. We have also implemented the following preventive measures to reduce health and safety hazards in the workplace:
• Provision of surgical gloves and masks to staff members
• Providing training on handling medical instruments
• Training nurses on hygiene factors
• Setting up triage counters manned by qualified and experienced nurses to make an initial determination about the nature and severity of a patient’s illness/injury
• Adopting special surgical prevention policies
• Regular supervision by senior medical personnel
• Overall supervision by Medical Superintendent
• Regular monitoring by the Medical Risk Management Committee
Description % from workforce
Lost Days Absenteeism Rate from workforce (%)
Injuries Male 0.06 8 0.00074
Female 0.20 87 0.008
Diseases Male – – –
Female 0.03 66 0.003
Employee grievance handlingNawaloka strives to create a safe, happy, healthy, engaging working environment to motivate our employees. Yet, we recognise that issues and grievances can arise at any point. Therefore, we have formulated a system where our employees can directly communicate their grievances to us through a methodical, systematic manner. We are committed to handle all employee grievances before they escalate in a timely, efficient, impartial manner. The following are some of the grievances that were raised during the year:
Identified and filed grievances Priority Solution
Employee accommodation High Enhance hostel facilities
Employee vehicle parking High Car Park Complex
Staff meals Moderate Meals provided at concessionary rates
Long shifts High Flxible shifts

Man
agem
ent D
iscu
ssio
n an
d A
naly
sis
– E
mpl
oyee
cap
ital
81
Whistle-blowing PolicyThere exists a proactive framework in Nawaloka to address the occurrence of frauds and other illegal activities which covers prevention, early detection, reporting, monitoring, recovery, and follow-up actions. Nawaloka’s whistle-blowing policy allows our employees to raise their concerns in confidence.
Equal opportunity employer As evidenced by our workforce, Nawaloka possesses a diverse, inclusive workforce that does not discriminate on the grounds of sex, marital status, race, colour, creed, religion, physical disability, mental health, learning difficulty, age or sexual orientation. We provide equal opportunities to all our employees in every domain.
Gender equity in remunerationThere is a transparent remuneration process in place which offers equitable remuneration irrespective of gender differences. Our remuneration policy is unbiased and the following measures are implemented to ensure non-discrimination:
• Through our mission, vision, and values, we have cultivated a non-discriminatory working culture at Nawaloka and provide our employees with equal opportunity.
• The Hospital has a performance-driven culture where rewards are based on merit.
• Our staff and Management have zero-tolerance of discrimination.
• Our Grievance Management Committee addresses all employee grievances.
Adhering to Human RightsThe principles of human rights, outlined by the International Labour Organisation (ILO) and the United Nation’s Universal Declaration of Human Rights, underpin all the systems and processes of Nawaloka.
Nawaloka Hospitals PLC maintains the principles of human rights which includes freedom of association, right to collective bargaining, elimination of child labour, and sexual harassment. We also follow best practices on working hours, minimum working age limit, and health and safety measures at the workplace. No grievances pertaining to human rights were recorded during the year under review.
Child labourFollowing our human rights policy, Nawaloka Hospitals PLC does not engage in any form of child labour or employment. The HR Department has imposed stringent screening measures to our recruitment process which prevents the under-age recruitments. Documents such as Grama Niladari certificates, police reports, referees reports, character certificates, and educational certificates are scrutinised prior to recruitment. There were no reported cases of child labour reported during the year under purview.
80,

Naw
alok
a H
osp
ital
s P
LC
|
A
nn
ual
Rep
ort 2
017/
18
“The Eye Care Centre provides comprehensive medical and surgical eye care for our patients”

Man
agem
ent D
iscu
ssio
n an
d A
naly
sis
– B
usin
ess
part
ner
capi
tal
83
BUSINESS PARTNER CAPITAL
Since our inception, we have established a number of long-lasting, interdependent partnerships with those who understand the core values of our business and share our vision to make Nawaloka the “Hospital of Tomorrow”.
As a giant in the private healthcare sector, we attract the highest number of visiting consultants from the healthcare community. Our consultants understand our mission to provide exemplary patient care, and work collaboratively to reach organisational goals. We have also built relationships with general and pharmaceutical suppliers in Sri Lanka and abroad.
Business partner profile
Aspect Measure 2017/18 2016/17 2015/16 2014/15
Business partner profile
No. of consultants 917 503 369 365
No. of local suppliers (Pharmacy and general) 1,060 756 532 410
No. of foreign suppliers (Pharmacy and general) 55 54 43 9
Relationship with business partners
No. of new suppliers registered (Pharmacy and general during the year) 305 235 156 37
1,000
800
600
400
200
0
2017/182016/172015/162014/15
Growth in consultants (Nos.)
750
600
450
300
150
0
2017/182016/172014/15 2015/162013/14
Composition of suppliers (Nos.)
Suppliers general Suppliers pharmacy
More than 5 years registered consultant 369. It is 40% of the total consultants.
82,

Naw
alok
a H
osp
ital
s P
LC
|
A
nn
ual
Rep
ort 2
017/
18
“Lasik Laser Eye Surgery performed at our Hospitals is able to cure refractive vision problems. We have effectively completed more than 1400 such surgeries”

Man
agem
ent D
iscu
ssio
n an
d A
naly
sis
– B
usin
ess
part
ner
capi
tal
85
Technological knowledge and excellenceHealthcare is one of the industries that transforms at a rapid pace due to technological advances. Everyday, innovative products, services, and equipment are introduced to the sector. Nawaloka, as a pioneer in the industry, integrates all cutting-edge diagnostic technology, pharmaceuticals, surgical procedures, and medical devices to provide world-class care to our patients.
Our partnerships with innovative businesses and accomplished professionals have contributed to knowledge excellence and its delivery to our customers. Over the years, we have made partnerships with businesses that are technologically accomplished like Green Cross Laboratories South Korea.
Ethical business partnerships As an ethical business entity, we take measures to ensure that we do business with other ethical business entities. Especially in forming our partnerships, we strictly adhere to ethical practices and establish links with those who share our vision. We ensure that our business partners, especially consultants, are not professionally negligent since they are dealing with human lives. Our partners also comply with the relevant regulatory requirements and engage in sustainable practices.
Managing expectations The key to fruitful partnership is clear communication and the proper management of our partners’expectations. We have established a system where regular feedback is given to us, especiallyfrom our consultants, to ensure operational excellence. We have set up a “Weekly Feedback Form Process” with the consultants where they are able to directly communicate and give their feedback to the senior management concerning their issues. We have found that this process has led more meaningful relationships between the consultants and our Management.
Grievance management in the supply chainThe procurement of quality goods and services is at the heart of our operations, especially in our sector where supply of medical goods and services has to be uninterrupted. Our medical equipment is procured from reputed global brands to ensure high quality. The relationships we have formed with our suppliers over the years have created value and improved overall business efficiency. We have formulated a proper procurement management strategy where we address supplier grievances at an early stage. There is a feedback system which ensures regular, productive communications with our suppliers to avoid grievances that can impact the timely delivery of essential goods and services.
Local suppliersAs a reputed and a responsible corporate entity operating in Sri Lanka, we understand that we have a major role to play in contributing to the development of the community. Our business ventures are geared towards supporting the National economy. In our procurement, we strive to support local suppliers as much as possible to contribute to their growth, which in turn will stimulate the local economy and lead to lower logistics and labour costs.
84,

Naw
alok
a H
osp
ital
s P
LC
|
A
nn
ual
Rep
ort 2
017/
18
Payments to suppliers
Year Payments to suppliers
2017/18 5,367,905,384
2016/17 5,363,251,698
2015/16 5,264,013,098
2014/15 4,717,575,898
2013/14 3,941,313,127
6,000
4,800
3,600
2,400
1,200
0
2017/182016/172015/162014/152013/14
Payments to suppliers (Nos.)
Further, most of the medical equipment are bought from renowned brands to ensure the quality. No. of global brands, such as Philips, Toshiba, Carl zeiff, Cannon, GE, and etc.
External initiativesWe have established links with the island’s leading healthcare organisations and associations. Our memberships and affiliations with the following bodies help us to interact with other players in the sector as well as engaging in fruitful dialogues with the leader of the field of healthcare. The Private Hospitals Association of Sri Lanka
• The Institute of Chartered Accountants of Sri Lanka (Accredited Training Partner)
• The Association of Accounting Technicians of Sri Lanka (Accredited Training Partner)
• Employees Federation of Ceylon
• Certified Management Accountants of Sri Lanka
• Institute of Certified Professional Managers of Sri Lanka
Nawaloka Guardian International (Private) Limited As mentioned in our General Manager’s review, Sri Lanka’s ageing population will almost double within the next three decades and the present social welfare and healthcare system in the country is not adequate to handle this growing threat. Nawaloka has taken a number of measures to face the challenge of an ageing population and to provide much needed, high-quality healthcare to our elders. With that objective in mind, Nawaloka Guardian International Luxury Elder Care (NAGAI)was incorporated two years ago.

Man
agem
ent D
iscu
ssio
n an
d A
naly
sis
– B
usin
ess
part
ner
capi
tal
87
NAGAI is the first elders care facility within a Sri Lankan hospital. It is a state-of-the-art elders’ home that has redefined the concept of retirement homes with facilities and luxurious amenities akin to a 5-Star hotel and worldclass healthcare facilities to keep our elders happy, healthy, and dignified.
In developing this facility, we brought in expertise from Japan, a country long-renowned for advanced, specialised elder care methods. The care givers at NAGAI are trained according to the principles of Japanese hospitality and care. Experienced and strictly vetted staff prepaires customised daily schedules for residents at NAGAI, depending on their individual preferences and medical care requirements. NAGAI is committed to ensure the best for Sri Lankan senior citizens for all their needs, be they physical, psychological, or emotional.
Nawaloka Premier CentreNawaloka Premier Wellness Centre, Colombo 07, established to provide luxury and personalised care in the heart of Colombo. The ease of access and the exclusive service and healthcare provided at the Nawaloka Premier Centre have led to the Centre to become a haven for the customers.
The treatments are administered under high exclusively, like setting in a highly specialised manner. The services include, medical check ups and other screening tests like USS, ECG, ECHO along with modern treatment options like physiotherapy, 3D LIPO Surgeries, and etc. There are also weight-loss programmes and exercise scheduling available. Our reputed team of consultants from all medical specialities cater to all medical requirements assisted by other healthcare professionals, a fully-automated laboratory, and a well-stocked pharmacy.
86,

88,
Naw
alok
a H
osp
ital
s P
LC
|
A
nn
ual
Rep
ort 2
017/
18
“Our Childcare Unit possesses a warm, child-friendly, and caring atmosphere”

88, 89
Man
agem
ent D
iscu
ssio
n an
d A
naly
sis
– So
cial
and
env
iron
men
tal c
apit
al
SOCIAL AND ENVIRONMENTAL CAPITAL
Serving the Nation for the last 33 years as the premier private healthcare organisation of the country, Nawaloka has come to understand that how we conduct business is everyone’s business. Over the years, we pursue “shared value” where we create economic value that also creates value for society. Our coherent community development strategies have led to maximising our positive impact on the society and environment we operate in.
Aspect Measure 2017/18 2016/17 2015/16
Corporate social responsibility
No. of school development projects 5 5 3
Investment in school development (Rs. Mn.) 11.34 2.1 1.4
No of medical camps 38 12 10
No of awareness programmes 41 26 21
Investments in the community
Charity and donations (Rs. Mn.) 10.8 3.9 3.6
No. of jobs created 943 206 52
Corporate social responsibility
We believe it is our ethical responsibility, as a responsible corporate, to contribute to the well-being of the communities and society in general. In pursuance of this goal, our strategies are aligned with our social and environmental activities. Each year, we undertake a large number of social and environmental projects such as:
• Charity and donations
• Awareness programmes
• Medical camps
• Supporting education
• Supporting sport
• Drinking water and sanitary facilities
• Spiritual development
• School infrastructure development
“Nawaloka Sathkara” is the yacht which guides us to reach out to the helpless and the needy. Under its banner, we conduct programmes that are aimed at uplifting the community and preserving the environment.
Supporting sportsSports carry many psychological and social benefits for children and teaches important life skills. Studies have found that children greatly benefit from engaging in sports. Nawaloka Sathkara, our CSR yacht, decided to invest in developing rural school playgrounds to uplift sports for rural children. As a first step of this project, we developed the playground of B/Kadurugamuwa Mihindu College to the delight of schoolchildren and their parents. We will continue to look for opportunities to contribute to other rural schools.

Naw
alok
a H
osp
ital
s P
LC
|
A
nn
ual
Rep
ort 2
017/
18
Supporting educationWe consider it our solemn duty to uplift rural education by any means necessary. With that goal in mind, we selected several rural schools to contribute books and other equipment. We donated books subscribed by the syllabi and other books for the libraries of Aluthwela South College, B/Kadurugamuwa Mihindu College, B/Yahalabadda College, B/Horadoruwwa Sri Jinarathana College and B/Karagahawela Sri Premananda College. We also provided computers to facilitate the students’ IT education.
Medical camps and social awareness programmeEach year, under Nawaloka sathkara, we conduct medical camps and awareness programmes islandwide. The objective of these programmes is to promote awareness of serious medical issues as well as to provide free healthcare services to those in need and in dire poverty. These programmes are aimed at helping those with financial constraints, who cannot afford medical check ups and those who find it difficult to access hospital services.
The following medical camps and social awareness programmes were implemented during the year:
• Free medical camp held at the Nawaloka Medical Centre – Gampaha
• Free medical camp and Awareness programme held at the Nawaloka hospitals PLC
• Free medical camp at BMICH
• Free medical camp and awareness programme at Nawaloka Premier Centre
• Free medical camp at Nawaloka Hospital, Negombo
40
32
24
16
8
0
12,500
10,000
7,500
5,000
2,500
0
2017/182016/172015/16
Medical campaigns (Nos.)
No. of participants No. of camps
4,000
3,200
2,400
1,600
800
0
50
40
30
20
10
0
2017/182016/172015/16
Awareness programmes (Nos.)
No. of participants No. of programmes

Man
agem
ent D
iscu
ssio
n an
d A
naly
sis
– So
cial
and
env
iron
men
tal c
apit
al
91
Drinking water and sanitary facilitiesThe availability of safe drinking water and hygienic sanitary facilities are an essential part of human health. Nawaloka Sathkara took up the challenge of providing sanitary infrastructure facilities and safe drinking water to selected rural schools. This is an ongoing project from which around 35 schools islandwide were benefited. During the year, five more schools were selected in the Bandararawela District. A preliminary study carried around in the area revealed the inadequacies when it came to drinking water and sanitary facilities. The following schools were aided under this project. While our main focus was hygiene, clean water, and sanitation, we also focused on other facilities that were lacking in these schools.
Aluthwela South College
Aesthetic room for Aluthwela South College.
• 2,000 Litre water tank• Construction of two sink basins for
drinking water• Doors for the rest room • Construction of an Aesthetic Room. • Two new computers • Library books
B/Kadurugamuwa Mihindu College
Construction of school building at Kadurugamuwa Mihindu College.
• Construction of two sink basins for drinking water (for the Primary and the Secondary)
• Separate water supply line for the existing water tank in the Secondary section
• Construction of a room for physical education and dancing.
• Play area for the Primary School.
90,

Naw
alok
a H
osp
ital
s P
LC
|
A
nn
ual
Rep
ort 2
017/
18
“We have performed over 2,500 DEXA Bone Density Tests for diagnosis of osteoporosis”

Man
agem
ent D
iscu
ssio
n an
d A
naly
sis
– So
cial
and
env
iron
men
tal c
apit
al
93
B/Yahalabadda College
Drinking water facility for Yahalabadda College.
• 2,000 litre water tank• Renovation of the water supply line • Construction of two sink basins for
drinking water• Renovation of existing toilets • Construction of library shelves • Construction of safety fences• Construction of three-flag pole base
B/Horadoruwwa Sri Jinarathana College
Donation of computers for computer lab – Horadoruwwa Sri Jinarathana Collage
• Renovation of the water supply line• Construction of two sink basins for
drinking water• Construction of new toilets • Renovation of the Buddha Shrine’s roof• Provided a new curtain for the stage • Two new computers
B/Karagahawela Sri Premananda College
Construction of the Shrine Room at Karagahawela College.
• Renovation of existing toilets • Painting of the Primary Section• Construction of a space for music• Construction of a space for dancing• Construction of a Buddha Shrine
92,

94,
Naw
alok
a H
osp
ital
s P
LC
|
A
nn
ual
Rep
ort 2
017/
18
Charity and donations
• Monthly financial contributions to Crippled Children’s Aid Association of Sri Lanka.
• Financial contributions for Punarjeewa Heart Centre.
• Financial contributions for flood victims.
• Supply of bulbs for the Sri Jinarathana Bikku Abyasa Vidyalaya.
• Sponsorship for printing educational materials for students of Law College.
• Financial contributions for International White Cane Festival.
• Financial contributions for The School of Deaf and Blind.
• Monthly donations to the Gangarama Temple for their Poya Day programmes.
Spiritual developmentWe recognise that spirituality is an important dimension of the holistic development of young children since spiritual development may contribute to a moral system that promotes charity, compassion, and justice. As an annual practice, we support spiritual development in young children.
In 2017, we renovated two Buddha Shrines at B/Horadoruwwa Sri Jinarathana College and B/Karagahawela Sri Premananda College.
We also made financial contributions for spiritual programmes islandwide like Dansal, Dramas, and Bhakthi Gee programmes.
School infrastructure developmentUnder Nawaloka Sathkara, we undertook several school infrastructure development programmes. Our focus area for this year was Bandarawela. Our preliminary studies helped to identify underprivileged schools who were in need of assistance. The following projects were carried out:
We carried out construction of a space for dance and other performing arts, including physical education for B/Kadurugamuwa Mihindu College. Previously, the students had used the school grounds to practice such activities. Similar spaces were constructed in B/Karagahawela Sri Premananda College and Aluthwela South College.
Indirect economic impactAs the first fully-fledged private sector healthcare institution in the country, we have played a critical role in local economic development by generating direct and indirect employment, and income for other businesses in the community.

94, 95
Man
agem
ent D
iscu
ssio
n an
d A
naly
sis
– So
cial
and
env
iron
men
tal c
apit
al
At Nawaloka, we provide our patients with world-class care using the latest technological innovations in medicine. Our consultants are true professionals who are able to work anywhere in the world. Thus, we prevent the outflow of patients who travel abroad for medical care.
Sri Lanka is also gradually becoming a hub for medical tourism. Nawaloka is well-positioned to take advantage of this new trend, and we have already reaped many of the benefits that medical tourism has to offer. Medical tourism draws a number of foreign nationals to our shores which positively impact our economy. Our nursing school too provides much-needed expertise to the healthcare sector.
Nawaloka Nursing Training School (NTS)
The Nawaloka Nursing Training School was established with the objective of offering comprehensive training which focuses on practice to deliver safe, effective, and empathetic care. The School welcomes students from around Sri Lanka who has a passion to join the community of healthcare professionals. We use modern teaching methodologies and our trainees are exposed to a hands-on approach and to the latest technological advances in healthcare. They are also trained to use modern medical equipment which is a vital skill for a 21st Century healthcare professional.
Capping Ceremony of Nursing Training School.
ComplianceAs a pioneer in healthcare, Nawaloka touches the people’s heart with their higher valued services cause it seeks the patient’s smile in the hospital, none of complains was occurred during the serving sector specially in administrations.
Nawaloka awarded ISO:9001;2015, as the administration of the hospitals healthcare services covering outpatients, inpatient care, nutrition, surgical and intensive care, paramedical services, and pharmacy.

Naw
alok
a H
osp
ital
s P
LC
|
A
nn
ual
Rep
ort 2
017/
18
“Prevention is better than cure. Our Mammogram Unit provides early detection of Breast Cancer which goes a long way in saving the lives of patients”

Man
agem
ent D
iscu
ssio
n an
d A
naly
sis
– E
nvir
onm
enta
l cap
ital
97
ENVIRONMENTAL CAPITAL
Aspect Measure 2017/18 2016/17 2015/16
Energy management Total energy consumption 9,774,537.00 7,988,953.00 7,415,890.86
Total consumption Total water consumption 219,147.00 216,776.00 169,171.00
Water consumption per employee 77.25 91.74 78.43
Material management Total linen order quantity 2,100 1,460 3,550
Total linen expense per patient 217.31 481.27 520.85
Waste management Total wastage 175,000.00 102,735.00 87,160.00
Total incinerator disposal per ltr. 2.50 2.58 2.78
As a responsible corporate citizen committed to safeguard nature, Nawaloka’s value creation process has been set-up to ensure that we make minimal negative impact on the environment. Through our activities directed at environmental preservation and through our exemplary corporate governance practices, we set an example to all corporates in the field of healthcare.
The following diagram illustrates Nawaloka’s Management approach towards environmental factors. Our Environmental Management System draws on the four components of Material, Water, Wastage, and Energy and fuel management.
Environmental Management System
Material management
Waste management
Water management
Energy and fuel management
Energy and fuel management Nawaloka, as a fully-fledged, state-of-the-art private hospital operating 24x7, is an energy intensive Organisation. Our energy consumption can be discussed under the two categories of fuel and electricity. We have taken all possible measures to adopt energy saving methods in our operations.
Electricity
We are committed to preserve electricity and have embraced company-wide stringent measures. Our employees are constantly educated on the importance of saving energy and we have implemented several programmes to spread awareness about the best possible methods of energy saving. We have employed internal auditors to randomly carry out investigations to minimise the wastage of energy in our buildings. The Company place every effort to save energy irrespective of the increasing demand for the services. We continue our efforts to control energy irrespective of growing occupancy for patient rooms and 24x7 uninterrupted service which consumes a lot of energy.
96,

Naw
alok
a H
osp
ital
s P
LC
|
A
nn
ual
Rep
ort 2
017/
18
Revenue per energy unit of the Company is as follows:
Month Revenue per energy unit
April 2017 729
May 2017 687
June 2017 765
July 2017 844
August 2017 785
September 2017 746
October 2017 766
November 2017 853
December 2017 857
January 2018 936
February 2018 923
March 2018 939
Speciality centre has used VRS Air-Conditioning system to reduce the energy consumption. Further building is using LED lights to reduce the consumption.
1,000
800
600
400
200
0
March2018
February 2018
January2018
December 2017
April2017
June2017
May2017
August2017
October2017
November2017
September2017
July2017
Revenue per energy unit (Nos.)
Water managementMany parts of the world are water stressed, and the ever-increasing population intensifies the problem.
We understand that water is a precious resource and prudent use of this natural resource is essential from a resource conservation perspective. As a leading hospital in the healthcare sector, we realise the importance of monitoring our water usage for better management.
We utilise water from three sources: Natural water (from wells), National water supply, and purified Bottled water. For drinking; we use bottled water as well as water from the National supply. Our non-potable water requirement is fulfilled by the National water supply. We possess a systematic drainage system for better water management.
We use the following measures to reduce water consumption:
• Monitoring water leakages.
• Fixing water meters for high water usage areas for proper monitoring and management.
• Insulation done for the chilled water line to reduce the loss in cooling.
• Charts are displayed to monitor the monthly water consumption, to motivate employees towards the conservation of water.

Man
agem
ent D
iscu
ssio
n an
d A
naly
sis
– E
nvir
onm
enta
l cap
ital
99
Water consumption
Month Revenue generated per water unit
April 2017 32,649.29
May 2017 38,861.72
June 2017 32,681.47
July 2017 39,910.24
August 2017 35,202.09
September 2017 30,943.35
October 2017 35,214.73
November 2017 37,008.74
December 2017 35,997.93
January 2018 40,291.52
February 2018 34,344.14
March 2018 44,615.66
50,000
40,000
30,000
20,000
10,000
0
March2018
February 2018
January2018
December 2017
April2017
June2017
May2017
August2017
October2017
November2017
September2017
July2017
Revenue per water unit (Nos.)
MaterialsWe utilise medical and non-medical materials in our hospital operations and under our material management process we procure environmentally-friendly products from our local suppliers. There is a methodical process in identifying reputed suppliers who satisfy our standards and expectations. We also concern with the usable period of the items as well when they are purchased. The following initiatives were implemented under material management:
• Introduction of the Inventory Management System to manage our existing inventory and to reuse materials.
• Introduction of a paperless system to reduce paper use.
• Implementation of the 5S Concept to reduce wastage and material costs.
• Introduction of the Lean Management System which utilises a set of operating philosophies and methods that helps to create maximum value for patients by reducing waste.
• Implementation of the 3R Concept (Reduce, Reuse, and Recycle) to reduce wastage and material costs.
The Inventory Management System has delivered instant results in identifying unwanted, excess materials in wards and other locations in the hospital. The materials are then divided as reusable and Non-reusable. The reusable material is repaired and reused. Meanwhile, hospital encourages to create a paperless environment inside the hospital for its documentaries. With the introduction of this concept most of the manual work are computerised to reduce the usage of papers.
98,

100,
Naw
alok
a H
osp
ital
s P
LC
|
A
nn
ual
Rep
ort 2
017/
18
“Our healthcare professionals practice active listening, empathic responses, and well-timed questions to provide optimal treatment”

100,
Man
agem
ent D
iscu
ssio
n an
d A
naly
sis
– E
nvir
onm
enta
l cap
ital
101
We have also successfully carried out the 5S Concept to improve our internal efficiency. This has contributed to the reduction of waste and the efficient management of materials.
Reduce, Reuse, and Recycle (3R) are the three essential components of environmentally-responsible consumer behaviour.
Total weight or volume of materials used
Type of material
Category
Quantity
2017/18 2016/17 2015/16
A4 Stationery 3,329 3,496 4,741
CR books Stationery 602 4,633 4,794
Dermal paper Stationery 106,580 106,368 128,563
Files Stationery 16,066 1,613 7,427
Photocopy papers Stationery 65 86 97
Plastic Grocery 318 347 353
Polythene Grocery 47 74 51
Garbage bags Grocery 107,100 57,482 49,207
Empty bottles Grocery 1,512 1,817 2,489
Shopping bags Food items 132,228 17,804 10,779
Mattress cover Linen 0 1 7
Rubber gloves Miscellaneous 0 4 30
Measuring cups – plastic Patient items 211 231 250
Blade Patient items 518 692 935
Waste managementThe shortage of landfill space, and waste incineration facilities, and the increasing environmental awareness of the general population are causing waste disposal management to become more critical. We realise that the proper management of waste is paramount to the preservation of the environment and effective waste management reduces costs and contributes to a healthier and cleaner world.
We generate significantly a high solid waste. Therefore, we have a state-of-the-art waste disposal system to ensure safe and effective waste disposal.
Our team is trained regularly on the handling of general materials as well as hazardous materials. The implementation of the 3R Concept has also helped in the management of waste. Our garbage separation system ensures responsible disposal. As mentioned above, usage of paper is minimised and we are moving towards a paperless organisation. The implementation of 5S concept has also increased efficiency in our operations.

102,
Naw
alok
a H
osp
ital
s P
LC
|
A
nn
ual
Rep
ort 2
017/
18
“Our room complex is designed to meet all needs of the patient while providing the convenience of a home to ensure a pleasant stay and a speedy recovery”

102, 103
Man
agem
ent D
iscu
ssio
n an
d A
naly
sis
– E
nvir
onm
enta
l cap
ital
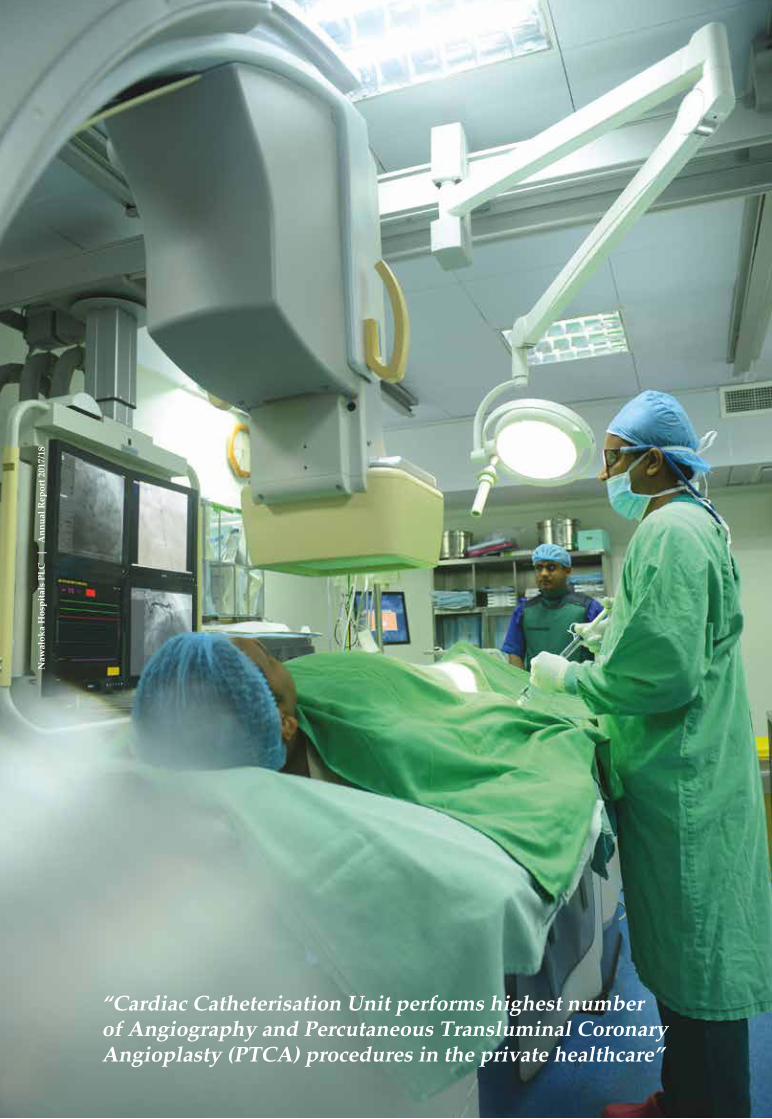
Naw
alok
a H
osp
ital
s P
LC
|
A
nn
ual
Rep
ort 2
017/
18
“Cardiac Catheterisation Unit performs highest number of Angiography and Percutaneous Transluminal Coronary Angioplasty (PTCA) procedures in the private healthcare”

Man
agem
ent D
iscu
ssio
n an
d A
naly
sis
– E
nvir
onm
enta
l cap
ital
105
The different types of waste-generated by Nawaloka are as follows:
• Clinical waste – potentially dangerous and carries a high risk of infection to the general public and employees.
• Laboratory waste – includes chemicals used in the pathological laboratory, microbial cultures and clinical specimens, slide, culture dish, needle, syringes, as well as radioactive waste such as Iodine-125, Iodine-131 etc.
• Non-clinical waste – includes organic material, paper, polythene or plastic, which have not been in contact with the body fluid of a patient.
• Kitchen waste – includes food waste and waste water used for food preparation.
Emissions
The Central Environment Protection License is obtained and hospital is operated within the environmental guidelines. The incinerator is used to dispose clinical waste. The details are as follows.
Item 2017/18 2016/17 2015/16
Waste (Kg)
Diesel (Ltr)
Per L/Per Kg Waste (Kg)
Diesel (Ltr)
Per L/Per Kg Waste(Kg)
Diesel (Ltr)
Per L/Per Kg
April 9,200 3,680 2.5 7,260 2,616 2.78 7,235 2,614 2.77
May 10,700 4,280 2.5 7,210 2,598 2.78 7,265 2,616 2.78
June 12,600 5,040 2.5 7,175 2,586 2.77 7,360 2,652 2.75
July 14,600 5,840 2.5 7,660 2,760 2.78 7,325 2,640 2.77
August 14,600 5,840 2.5 9,130 3,560 2.56 7,460 2,688 2.78
September 13,500 5,400 2.5 8,800 3,520 2.50 7,110 2,562 2.78
October 15,200 6,080 2.5 10,400 4,160 2.50 7,375 2,658 2.77
November 15,700 6,280 2.5 8,900 3,560 2.50 7,160 2,580 2.78
December 16,800 6,720 2.5 8,950 3,580 2.50 7,225 2,601 2.78
January 16,950 6,780 2.5 9,050 3,620 2.50 7,360 2,652 2.78
February 16,450 6,580 2.5 8,300 3,320 2.50 7,060 2,544 2.78
March 18,700 7,480 2.5 9,900 3,960 2.50 7,225 2,601 2.78
Compliance with environmental regulationsNawaloka Hospitals PLC is an ISO Certified Company that has won many social accreditations for environmental preservation. Our value creation model has been set-up with a view of making zero negative impact on the environment. As a responsible, environmentally-friendly corporate, we comply with all the necessary regulatory requirements.
104,

Naw
alok
a H
osp
ital
s P
LC
|
A
nn
ual
Rep
ort 2
017/
18
106
STEWARDSHIP
BOARD OF DIRECTORS
Dr Jayantha DharmadasaChairman & CEO – Executive Director
Deshabandu Tilak de ZoysaSenior Independent, Non-Executive Director
Mr Ugitha Harshith DharmadasaExecutive Director
Mr Palitha Kumarasinghe PCIndependent Non-Executive Director
Mr Rienzie Theobald WijetillekeIndependent Non-Executive Director and Vice-Chairman
Mr Tissa K BandaranayakeSenior Independent Non-Executive Director
Mr Anisha DharmadasaExecutive Director
Mr Victor R. RamananNon-Executive Director
Vidya Jyothi Professor Lal GotabhayaChandrasenaDirector/General Manager, Executive Director
Mr D Sunil AbeyRatnaIndependent Non-Executive Director
Ms Ashani Givanthi DharmadasaExecutive Directress

Stew
ard
ship
– B
oard
of D
irec
tors
107
Dr Jayantha Dharmadasa
Chairman and CEO – Executive Director
Dr Jayantha Dharmadasa has been the Chairman of the Company since 2011 and businessman by profession and counts over 41 years of experience in Executive Management and 32 years in the healthcare industry. He is a Fellow Member of the Institute of Certified Professional Managers (FCPM) and the Chairman of Nawaloka Hospitals PLC, Nawaloka Aviation (Private) Limited, Nawaloka Polysacks Sharjah, Sasiri Polysacks (Private) Limited, Nawaloka Construction Company (Private) Limited, Nawaloka Petroleum (Private) Limited, Koala (Private) Limited, New Ashford International (Private) Limited, Nawaloka Medical Centre (Private) Limited, Nawaloka Green Cross Laboratories (Private) Limited, Nawaloka Engineering Co. (Private) Limited, Nawaloka Agri (Private) Limited, Nation Lanka Finance PLC, Ceyoka (Private) Limited, Nawaloka College of Higher Studies (Private) Limited, East West Marketing (Private) Limited, Nawaloka Steel Industries (Private) Limited, Millennium Housing Developers PLC, Alcobronze (Private) Limited and JDC Graphic Systems (Private) Limited.
Dr Jayantha Dharmadasa holds a Honorary Doctorate from Swinburne University of Technology Australia. He is the Honorary Consul-General of the Republic of Singapore in Sri Lanka. He was a Director of Sri Lanka Telecom PLC, Former President and also Vice-President of Sri Lanka Cricket and a past President of the Asian Cricket Council. He was the Former Chairman of the National Film Corporation.
Mr Rienzie Theobald WijetillekeFCIB (UK), FIB (Sri Lanka) CCMI (UK)Independent Non-Executive Director and Vice-Chairman
Mr Rienzie T Wijetilleke has been a Director of the Company since 2003 and appointed as Vice-Chairman in August 2011. He is a Fellow of the Chartered Institute of Bankers, United Kingdom and also Fellow of the Institute of Bankers Sri Lanka and Companion of the Chartered Management Institute, UK.
In late 2010, Mr Wijetilleke completed 50 years as a banker and in 2011 retired from the position of Chairman, HNB. He is a past Chairman and Director of the Colombo Stock Exchange. He is also the Settler and the Main Trustee of “The Rehabilitation of Buddhist Temples Foundation” (Incorporation) Act No. 17 of 2014.
Vidya Jyothi Professor Lal Gotabhaya Chandrasena
Director/General Manager, Executive Director
Professor Chandrasena has been a Director of the Company since 2003. He is a Clinical Biochemist by profession and counts 24 years of University Academic Service and 30 years experience in Hospital and Healthcare Administration and Laboratory Sciences. He is the Emeritus Professor of Biochemistry and Clinical Chemistry, Faculty of Medicine, University of Kelaniya.
Professor Chandrasena has a Doctorate in Philosophy from the University of Liverpool (UK) and a Bachelor of Science (Hons) from the University of Liverpool (UK). He is a Fellow of the Institute of Chemistry, Ceylon and is a Chartered Chemist, Fellow of the Royal Society of Chemistry (UK), Fellow of the National Academy of Sciences of Sri Lanka and Post Doctoral Fellow, Colorado State University, USA. He is also a Fellow member of the Institute of Certified Professional Managers and holds a certificate in Hospital Administration from the Indian Institute of Management, Ahamadabad.
He is also a Director of Nawaloka Hospitals International (Private) Limited, International Medical Institute (Private) Limited, Nawaloka College of Higher Studies (Private) Limited, Nawaloka Guardian International (Private) Limited, Nawaloka Hospitals Research and Education Foundation, Nawaloka – Green Cross Laboratories (Private) Limited.
He is presently the President of the Association of Private Hospitals and Nursing Homes, and a Member of the Private Health Services Regulatory Council – Ministry of Health. He is also the President of the Association for Clinical Biochemistry, Sri Lanka. He was conferred the title “Vidya Jyothi” in 2017 by His Excellency The President of Sri Lanka.
Deshabandu Tilak de ZoysaFCMI (UK), FPRI (SL)Senior Independent, Non-Executive Director
A well-known figure in the Sri Lankan business community, Tilak de Zoysa, FCMI (UK) FPRI (SL), Honorary Consul for Croatia and Global Ambassador for HelpAge International was conferred the title of “Deshabandu” by His Excellency the President of Sri Lanka in recognition of his services to the country and was the recipient of “The Order of the Rising Sun. Gold Rays with Neck Ribbon” conferred by His Majesty the Emperor of Japan. He is also a recipient of the LMD lifetime Achievers’ Award 2017.
In addition to being the Chairman of the Supervisory Board (AMW) and advisor to the Al-Futtaim Group of Companies in Sri Lanka, he chairs Carsons Cumberbatch PLC, Associated CEAT (Private) Limited, Amaya Hotels and Resorts USA (Radisson), Jetwing Zinc Journey Lanka (Private) Limited, Trinity Steel (Private) Limited, CG Corp Global Sri Lanka, Dutch Lanka Trailer Manufacturers (TATA Group), HelpAge Sri Lanka and YMBA Colombo.
He is also the Vice-Chairman of CEAT Kelani Holdings (Private) Limited, Orient Insurance Limited and serves on the boards of several listed and private companies which include TAL Lanka Hotels PLC (Taj), TAL Hotels and Resorts Limited, Nawaloka Hospitals PLC, Associated Electrical Corporation Limited, INOAC Polymer Lanka (Private) Limited, Cinnovation INC, GVR Lanka (Private) Limited and Varun Beverages Lanka (Private) Limited (Pepsi).
Mr Tilak de Zoysa is a past Chairman of the Ceylon Chamber of Commerce, the National Chamber of Commerce of Sri Lanka, HelpAge International (UK) and served as a Member of the Monetary Board of Sri Lanka (2003-2009).

Naw
alok
a H
osp
ital
s P
LC
|
A
nn
ual
Rep
ort 2
017/
18
108
Mr Tissa K BandaranayakeFCA, BScSenior Independent Non-Executive Director
Mr Tissa K Bandaranayake joined the Company as a Director in 2009. He is a Fellow of The Institute of Chartered Accountants of Sri Lanka and graduated with a BSc from the University of Ceylon.
He has more than 45 years of commercial and professional experience. He was with Ernst & Young, Sri Lanka for 27 years until retirement as a Senior Partner in April 2009, managing a large portfolio of clients both local and multinational in various industries.
He is a Director of Brown & Co. PLC., Samson International PLC, Laugfs Gas PLC, Harischandra Mills PLC, Renuka Foods PLC, Renuka Holdings PLC, Overseas Realty (Ceylon) PLC., and Micro Holdings (Private) Limited. He also serves as an Advisor/Consultant to the Board of Directors of Noritake Lanka Porcelain (Private) Limited.
Mr Bandaranayake was a past Chairman of the Audit Faculty of The Institute of Chartered Accountants of Sri Lanka and a past President of the Practising Chartered Accountants’ Forum. He is also a Vice-President of National Stroke Association of Sri Lanka, Technical Coordinator of the Rotary Foundation Cadre of Technical Advisers – Financial Audit for the period 2018-2021. He was the Rotary International District Governor for Sri Lanka 1999-2000. He currently serves as the Chairman of the Quality Assurance Board of Sri Lanka comprising representatives of the private sector and regulatory agencies.
Mr D Sunil AbeyRatnaPhD (UH-USA), FCA (SL), FCMA (SL), FCMA (UK), CMA (Aust.) Independent Non-Executive Director
Mr D Sunil AbeyRatna counts over 41 years of experience in the fields of finance, audit, and tax. He is a fellow of The Institute of Chartered Accountants of Sri Lanka, the Institute of Management accountants of UK and Certified Management Accountants of Sri Lanka. He is also a member of the Certified Management Accountants of Australia and has a Doctorate in Philosophy from the University of Honolulu USA.
He is the sole proprietor of AbeyRatna & Co – Chartered Accountants and a Director of AGN International Limited - WAA region which is the 4th largest independent accounting association in the world based in over 108 countries and 478 office locations.
He is also a Director of KBSL Limited, Carplan Limited, KIA Motors (Lanka) Limited, Agarapatana Plantations (Private) Limited, and Kotagala Plantations (Private) Limited and the Managing Director of Lankem Tea and Rubber Plantations (Private) Limited.
Mr Ugitha Harshith Dharmadasa
Executive Director
Mr Harshith Dharmadasa has been a Director of the Company since 2000. He has 23 years of experience in Executive Management.
He is the Chairman of Millennium Housing Developers PLC. He is also the Managing Director of Ceyoka (Private) Limited, Nawaloka Trading (Private) Limited, Nawaloka Agri (Private) Limited, Ceyoka Engineering (Private) Limited, Nawaloka MEP Concepts (Private) Limited, Koala (Private) Limited, East West Marketing (Private) Limited, Nawaloka Steel Industries (Private) Limited, Ceylon Nutrinut Holding (Private) Limited and Nawaloka Construction Company (Private) Limited.
Mr H. Dharmadasa is also a Director of Nawaloka Holdings (Private) Limited, Nawaloka Hospitals PLC., Nawaloka College of Higher Studies (Private) Limited, Nawaloka Guardian International (Private) Limited, Nawaloka Medicare (Private) Limited, Nation Lanka Finance PLC, and JDC Printing Technologies (Private) Limited.
Mr Anisha Dharmadasa
Executive Director
Mr Anisha Dharmadasa has been a Director of the Company since 2000. He has 21 years of experience in Executive Management.
Mr Anisha Dharmadasa is a Director of Nawaloka Medical Centre (Private) Limited, Waves Destinations (Private) Limited, Nawaloka Holdings (Private) Limited, Nawaloka Hospitals PLC, New Ashford International (Private) Limited, Nawaloka Engineering (Private) Limited, International Medical Institute (Private) Limited, Nawaloka Petroleum (Private) Limited, Nawaloka Guardian International (Private) Limited, Nawaloka Medicare (Private) Limited, Nawaloka Construction Company (Private) Limited, Quincy (Private) Limited, Sasiri Polysacks (Private) Ltd, Nawaloka Green Cross Laboratories (Private) Limited, JDC Printing Technologies (Private) Limited, JDC Graphics Systems (Private) Limited, Unifold (Private) Limited, JDC Inks & Chemicals (Private) Limited and Nawaloka Institute of Healthcare (Private) Limited. Mr Anisha Dharmadasa is also the Chairman of Sikure Security Services (Private) Limited and Nixon Distribution Services (Private) Limited.
Ms Ashani Givanthi Dharmadasa
Executive Directress
Ms Givanthi Dharmadasa has been a Directress of the Company since 2003 and has 17 years of experience in Executive Management. She is a Directress of Nawaloka Holdings (Private) Limited, Nawaloka Hospitals PLC, Nawaloka Medicare (Private) Limited, Nawaloka Air Services (Private) Limited, Nawaloka Aviation (Private) Limited, Redline Services (Private) Limited, Redline Design & Printing (Private) Limited, Redline International (Private) Limited, Alcobronz (Private) Limited, Nawaloka Green Cross Laboratories (Private) Limited, Nawaloka Hospital Research & Education Foundation, JDC Printing Technologies (Private) Limited, JDC Graphics Systems (Private) Limited, Unifold (Private) Limited, JDC Inks & Chemicals (Private) Limited, Nawaloka Professional Academy (Private) Limited, and Nawaloka Institute of Healthcare (Private) Limited.

Stew
ard
ship
– B
oard
of D
irec
tors
109
Mr Palitha Kumarasinghe PC
Independent Non-Executive Director
Mr P Kumarasinghe is a leading President’s Counsel specialised in civil commercial litigations. He had his education at Mahinda College, Galle and thereafter entered into Sri Lanka Law College in 1979. He was enrolled as an Attorney-at-Law on 27 September 1982. Having dwelled in the Chambers of Mr Romesh de Silva, President’s Counsel, Mr Kumarasinghe is in active practice in the District Court of Colombo, Commercial High Court of the Western Province, and the Superior Courts. He has an extensive commercial law practice and he is the Counsel for a large number of banks and finance houses. He was made a President’s Counsel in 2006 by the President.
He was a Vice-President and Executive Committee Member of the Bar Association and Chairman of various Committees inclusive of National Law Conference, Ethics & Professional Conduct and Continuing Legal Education.
He was once the President of Colombo Law Society. He served in the Public Service Commission for a period of six years and was a Member of Council Legal Education (2010-2015) and its Board of Studies, Chairman of Environment Council (2010-2013) and Member of Advisory Commission on Intellectual Property (2001-2004). He also served as the Chairman of Disciplinary Committee of Sri Lanka Cricket, from 2012 to 2016, the Chairman of Legal Advisory Committee 2012-2015 and the Chairman of the Governance Committee (2012). He was an Independent Non-Executive Director of Laugfs Gas PLC, from 2012 till end 2017. He is presently a Trustee of Kalutara Bodhi Trust.
Mr Victor R. RamananVictor Ramanan is a Sri Lankan born British National residing in London. Being Educated in Sri Lanka and the UK, Victor is a B.Sc. Graduate and holds a Diploma in Software Engineering, Business Administration and Sales Techniques (UK).
He is a versatile marketer and administrator with more than 30 years of hands on experience working in many countries including United Kingdom, Kuwait, Dubai, Bahrain, Germany, France, USA, and Sri Lanka. He has worked in areas such as IT, HR, Marketing, and Business Development of which more than 17 years has been in the fields of Oil, Gas, Logistics and Real Estate sectors.
Presently holds positions as a Director and Deputy Chairman in the following companies:
• Nawaloka College of Higher Studies (NCHS) - Deputy Chairman
• Millennium Housing Developers PLC - Deputy Chairman
• Nawaloka Hospitals PLC - Director
• Nation Lanka Finance PLC - Director
• Ideal Getaways (Private) Limited - Director
• Jilani Group (Dubai) - Director

Naw
alok
a H
osp
ital
s P
LC
|
A
nn
ual
Rep
ort 2
017/
18
110
Mr Nalaka Niroshana
Head of Finance and Corporate Planning
Mr Nalaka Niroshana is an Associate Member of the Chartered Institute of Management Accountants – UK, an Associate Member of Chartered Global Management Accountants and a Member of Certified Professional Managers. He is a graduate from the University of Sri Jayewardenepura. He joined Nawaloka Hospitals in 2011 and has over 11 years of executive experience in diversified conglomerates in Sri Lanka.
MANAGEMENT TEAM
Dr Uthpala Malawara Arachchi
Medical Superintendent
Dr Uthpala Malawara Arachchi graduated with MBBS from Faculty of Medical Sciences, University of Sri Jayewardenepura in 2002. He holds a MSc in Medical Administration awarded by the Postgraduate Institute of Medicine and a Diploma in Occupational Health and Safety from the University of Colombo. He has served as a Medical Officer-in-Charge in many Government institutions. From 2007 to 2009, he was attached to the National Health Service, United Kingdom in the field of Medical Administration. He joined Nawaloka Hospitals as a Medical Superintendent in 2014. He has over 16 years of experience in clinical and medical administration. He is an Occupation Heath and Safety Physician for many corporates.
Mrs S R M Jayarathne
Chief Nursing Officer
Mrs R M Jayarathne graduated as a staff nurse from the Nursing Training School, Colombo. Certified in intensive care, cardiothoracic, coronary care, organ transplant management, dialysis, endoscopy, and ward administration. Has over 40-year experience in the National Hospital Colombo, Ministry of Health Oman, and University Hospital of Wales Cardiff.
Mr Indika Prasath Balasuriya
Head of Information Technology
Mr I P Balasuriya has obtained a MSc in IT from the University of KEELE (UK) in 2005, and is a Member of BCS, CSSL and CPM. He has also followed the NIBM Diploma in IT. He has over 20 years of experience in the fields of Project Management, ERP Project Consulting, Application Development, Implementation and User Training. He has experience with multinational companies as well. He joined Nawaloka Hospitals in 2008.
Mr Chaminda Rupasena
Head of Human Resources
Mr C Rupasena is a holder of BSc in Business Administration (Human Resources Management) Special Degree from the University of Sri Jayewardenepura. He is an Attorney-at-Law, Notary Public, Commissioner for Oaths and is a Registered Company Secretary. He also holds a Diploma in Psychological Counselling and has over 14 years of experience in Human Resources Management.
Mr Thenuka Dissanayaka
Finance ManagerMr Thenuka Dissanayaka is a member of the Chartered Accountants of Sri Lanka (ACA), an Associate member of Certified Management Accountants (ACMA), a Member of Certified Professional Managers (ACPM) and Senior Accounting Technician (SAT). He is a graduate from University of Sri Jayewardenepura. He joined Nawaloka Hospitals in 2013.

Stew
ard
ship
– M
anag
emen
t Tea
m
111
Mr K S B Ekanayake
Electrical and Mechanical Engineer
Mr K S B Ekanayake holds a Diploma in Electrical Engineering from the University of Moratuwa. He has work experience of over 13 years as an electrical engineer. He joined Nawaloka Hospitals in 2016 as an Electrical and Mechanical Engineer.
Mrs Nishanthi Somaratne
Head of Marketing
Mrs N. Somaratne has over 12 years of experience in the field of marketing. She has completed a B Com (Hons.) Degree majoring in Management and Marketing from the Monash University Australia. She has also completed a professional Post Graduate Diploma in Marketing from the Chartered Institute of Marketing.
Mr Upatissa Mannapperuma
Senior Coordinating Officer and Maintenance Manager
Mr U Mannapperuma obtained his National Certificate of Technology from the University of Moratuwa in 1980. In 1983 he joined the Maintenance Division of Nawaloka Hospitals. He is certified in Hospital Management from Japan Overseas Health Administration Centre, Yokohama in 1995. He has 33 years of experience in the healthcare industry.
Mr M D Ariyawansa
Senior Coordinating Officer
Mr M D Ariyawansa obtained his Diploma in Business Management from the National Institute of Business Management in 1983. He joined Nawaloka Hospitals in 1985 as an Executive Officer and worked in several business units at the Hospital. He has obtained a Certificate in Hospital Management from Japan Overseas Health Administration Centre, Yokohama in 1999. He is presently the Senior Coordinating Officer responsible for coordinating public relations functions of the strategic business units. He has 33 years of experience in the healthcare industry.
Mr Kanishka Warusavitarana
Senior Manager – Operations
Mr Warusavitarana is a Member of the Association of Accounting Technicians, Sri Lanka. He joined Nawaloka Hospitals in 1988. He has eight years of experience in a reputed firm of Chartered Accountants and 30 years experience in the healthcare industry.
Mr Gayan Wanniarachchi
Manager – Finance and Operations – Mr Gayan Wanniarachchi is a member of Chartered Accountants of Sri Lanka (ACA), a member of Certified Professional Managers (CPM), a member of Certified Management Accountants (CMA), and a Senior member of Association of Accounting Technicians of Sri Lanka (AAT). He joined Nawaloka Hospitals in 2012.

Naw
alok
a H
osp
ital
s P
LC
|
A
nn
ual
Rep
ort 2
017/
18
112
Mr G A Varghese
Biomedical Engineer
Mr Varghese obtained a Diploma in Biomedical Engineering, Computer Science, Network Technology, and Computer SW/HW. He was employed in Middle East as a Biomedical Engineer since 1988 and has 25 years of experience in the field. He Joined Nawaloka Hospital in 2014 as a Biomedical Engineer.
Mrs R V N Rupasinghe
Lobby Manager
Mrs Rupasinghe joined Nawaloka Hospitals in 1991. She has obtained Certificates in Customer Service, Contact Centre Management, Public Relation and Interpersonal Skills by the Graduate School of Management. She is presently the Lobby Manager of Nawaloka with 27 years of experience in the Healthcare industry.
Ms Arosha Koggala Wellala
Legal Officer
Ms Arosha Koggala Wellala holds a Masters Degree (LLM) from the University of Wales. She holds a Bachelor’s Degree (LLB) from University of Colombo. She is a Registered Company Secretary, Notary Public and Commissioner for Oaths. She is an Attorney-at-Law of the Supreme Court for nearly 15 years. She joined Nawaloka Hospitals in 2009.
Deshabandu Dr M Allan Gerreyn
Food and Beverage Manager/ Executive Chef
Dr Allan Gerreyn joined Nawaloka Hospitals PLC in 2003 and has 35 years of experience in the hotel industry. He received his Deshabandu title in 2014 from Nanaguna Foundation. He has won five Crown Awards in food hygiene for five consecutive years from 2012
Mr Madumal Bandara Moragoda
Executive Housekeper
Mr Madumal Bandara Moragoda is a associate member of Sri Lanka Housekeepers Association, Member of Asia Housekeepers Association, Member of Ceylon Hotel School Graduations Association (CHSGA), and is a Graduate from Sri Lanka Institute of Tourism and Hotel Management (SLITHM). He also has a Diploma in Tourism and Hospitality Management from the American Hotel Motel Association. He has 25 years of experience as an Executive Housekeeper in national and international hotel chains. He joined Nawaloka in 2012.
Mr Anura Samaradiwakara
Senior Co-ordinating Officer
Mr A Samaradiwakara is working as the Senior Coordinating Officer at Nawaloka Hospitals since 2003. He has more than 37 years of experience in the services sector.

Stew
ard
ship
– E
xecu
tive
Clin
ical
Man
agem
ent T
eam
113
EXECUTIVE CLINICAL MANAGEMENT TEAM
Dr Maiya GunasekeraMBBS, FRCS (Eng.), FICS, FRCS (Ed.), MS (Surgery), FIAGES, FCS (Sri Lanka)
Consultant Surgeon General Surgery/Gastroenteroscopy/Laparoscopy and Endoscopy
Consultant-in-Charge of Surgical Service
Dr Vajira TennekoonMBBS, MD, FRCP, FRACP, FCCP
Consultant Chest Specialist/Physician and Physician-in-Charge Medical Intensive Care Unit
Dr W A M GunasekeraMB, MRCP (UK), FRCP (Lon.), FCCP
Consultant Physician and Physician – in-Charge Ward Medical Services
Dr Duminda PathiranaMBBS (Col.), DCH (Col.), MD (Col.), MRCP (UK), MRCP, CH (UK), FCCP
Consultant Paediatrician
Dr Harindu WijesingheMBBS, MD, MRCP (UK)
Consultant Rheumatologist Specialist in Sports Medicine
Dr Chandima De Mel
MD FRCP (Lond.), FCCP, M.Phil (Lond.), D.Path
Consultant Physician
Dr Sandeep K SharmaMD (Anaesthesiology)
Consultant Cardiac Anaesthetist and Intensivist
Dr Hemant Digambar WaikarMBBS, MD, DA (ANAE), PDCC (CARDIAC AND NEURO ANAESTHESIA)
Consultant Cardiac Anaesthetist
Dr A G JayakrishnanMS, FRCSI, FRCS (CTh)
Chief Cardiothoracic, Vascular and Transplant Surgeon

Naw
alok
a H
osp
ital
s P
LC
|
A
nn
ual
Rep
ort 2
017/
18
114
Dr Punsith GunewardeneMBBS (Colombo), MS (Colombo)
Consultant Neurosurgeon
Dr Mrs D MaruthiniMBBS, DGO, MS (COL.), MRCOG (UK), MD (UK)
Consultant Subspecialist in Reproductive Medicine and Surgery Consultant Obstetrician and Gynaecologist
Dr Chandana KanakaratnaMBBS (SL), MD (SL), FRCP (LONDON), MSC Geriatric Medicine (UK), Diploma in Geri.Med (London), Diploma in Geri.Med (Glasgow), Board Certification in General Medicine (SL), CCT General Medicine (UK), CCT Geriatric Medicine (UK)
Consultant Physician, Consultant Geriatrician (Geriatric Physician)
Dr Radika KarunarathneMBBS (Colombo)
MD (Radiology), FRANZCR
Consultant Resident Radiologist
Dr P Prakash PriyadharshanMMBS MD MRCP (UK) MRCPS (GLASGOW)
Consultant Cardiologist Special Interest – Cardiac Imagine
Dr M T D LakshanMBBS MS DOHNS FEB ORL-HNS FRCSEd ORL – HNS
Consultant ENT and Head and Neck Surgeon
Dr Mrs Roshan Zeirideen ZaidMBBS (SL), MRCOG (UK), DFSRH (UK), CCT (UK), FMAS (Ind.), DMAS (IND.), FART (IND.)
Resident Consultant Obstetrician, Gynaecologist Laparoscopic Surgeon, and Fertility Specialist

Stew
ard
ship
– C
orpo
rate
Gov
erna
nce
115
CORPORATE GOVERNANCE
Governance in healthcare can be broadened to include both financial and non-financial elements as there is a societal aspect associated with providing healthcare. Nawaloka Hospitals PLC has created a framework through which our Company is continuously accountable to improve the quality of the services we provide. Our Director Board and Management team are committed to uphold the highest standards of corporate governance to ensure great transparency, protection of the interests of our shareholders, and create an environment where excellence in clinical care will flourish to deliver consistent shareholder value.
Clinical governance standards Nawaloka advocates a transparent, democratic, and participatory governance standards that improves our organisational performance leading to better service, improving healthcare and patient safety, and securing stakeholder and public trust.
We regularly ensure that our controls and processes are up to date with global best practices in clinical standards to provide world-class healthcare services to our customers. The standards followed at Nawaloka Hospitals ensure that our staff, clinicians, health professionals, and users of health services are provided with the following assistance:
• Develop and implement clinical governance processes and systems within the Hospital.
• Increase organisational awareness of clinical governance and contribute to the development and implementation of clinical governance systems and processes.
• Assist clinicians and Management to embed clinical governance within the organisational culture.
• Assist Nawaloka Hospitals PLC to demonstrate improved accountability for the delivery of safe, high quality healthcare services through the implementation of clinical governance systems and processes.
Clinical Governance is defined as:This is a framework through which the Hospital is accountable for continuous improvement of the quality of its services and safeguarding high standards of care by creating an environment in which excellence in clinical care will flourish.
The seven key elements of Clinical Governance are discussed below:
1. Education and training The presence of a resourceful human capital in the form of highly-skilled, well-trained, experienced team of employees is essential to delivering high-quality, safe healthcare. The employees at Nawaloka undergo various training programmes every year, and they continue to undertake continuous professional development which improves the delivery or care and skill sets. Our Human Resources Department follows strict measures to ensure that the high standards of Nawaloka are maintained by our experienced team of employees. There are robust recruitment and selection policies, guidelines, and procedures to ensure that professional qualifications and experience meet minimum requirements.
Our clinical staff is encouraged to engage in professional support in the workplace in appraisals, and utilise training programmes to ensure continuous development.
Shareholders
Board of Directors
Group Executive Committee
Regulators
Audit Committee Risk Committee
Remuneration and Nominations
Committees
Strategic Committee Sustainability Committee
Related Party Committee
External Audit
Internal Audit
Naw
alok
a H
osp
ital
s P
LC
|
A
nn
ual
Rep
ort 2
017/
18
116
The Management verifies and approves competencies, standards, and qualifications. This validation process is in place to justify that the competencies, standards or qualifications are authentic or evidence-based.
Validation processes at individual levels include (but are not limited to) the following elements:
• Verifying that the individual is registered with or accredited by the relevant bodies.
• Verifying that the individual has evidence of Continuing Professional Development (CPD).
• Continuing Professional Development: This includes the ongoing and regular education and research activities linked to the responsibilities and needs of the clinicians employed by the Hospital.
2. Clinical audit There is a systemic methodology in place to evaluate, and audit the efficiency and the effectiveness of Nawaloka’s systems and processes. These audits perform regular reviews of service provisions and monitoring and evaluation of evidence-based practice, use of guidelines, clinical pathways, models of care, and cost-effective health service delivery.
Nawaloka conducts ongoing evaluation of organisational and clinical performance, the reporting of which become pivotal to providing safe, quality clinical care. The following processes are used in auditing, monitoring and evaluation:
• The application of the results of independent international and local audits to our patient population and the identification of areas of improvement.
• The use of case studies to highlight specific issues that are then generalised within our patient population.
The clinical meetings held every month, with the presence of all Medical Officers and nurses, is a forum where the results of the audits are discussed. The forum facilitates the exchanging of information and opinions which will improve clinical practice. Every forum is chaired by a clinician, who is responsible for raising awareness about the proceedings of the meetings and its outcome. The Medical Superintendent (MS) or other senior administrative staff to attend meetings when required. They will provide the necessary administrative support to carry out the measures finalised in the meetings. The following key criteria are covered in the local audits:
• Respond to newly-published local pathways.
• Respond to newly-published national evidence.
• Respond to newly-available drug or other therapy (if recommended by the relevant Authority).
• Respond to a clinically significant event or substantiated complaint.
• Provide a balance across a range of specialties (i.e. clinicians should not at all focus on a narrow range of conditions).
• Provide a general update in an area of the clinician’s own expertise.
The Medical Superintendent is designated to:
• Manage the agenda of clinical meetings.
• To ensure that the areas selected at clinical meetings meet the criteria of knowledge transfer.
• To arrange for a clinical evaluation to be presented on any topic that is causing particular concern either locally or more widely.
The papers presented at the monthly meetings are readily available to the participants through email. The responsibility usually falls on to the clinician who presents the paper.
3. Clinical effectivenessClinical effectiveness involves three aspects: obtaining evidence, implementing treatment based on the evidence, and evaluating the change of practice. With respect to obtaining evidence, health providers may use evidence-based practice, such as current research, patient preference, and clinical experience.
The clinicians at Nawaloka are expected to work within formalities and protocols that have been developed for specific conditions:
• Clinical standards incorporate clinical guidelines, pathways and local practice protocols. These standards may be set by bodies such as the Sri Lanka Medical Council, which is the authoritative body of the Ministry of Health in setting clinical standards and the Sri Lanka Medical Association.
• Clinical indicators are measures or benchmarks that enable the Hospital to compare them against similar health services. To facilitate health system improvement clinical indicators must be meaningful and reflect clinical practice standards.
Our clinicians are expected to be aware of the latest trends in healthcare by referring to healthcare literature. This ensures that they are aware of global best practices which helps them to provide better care to our patients.

Stew
ard
ship
– C
orpo
rate
Gov
erna
nce
117
4. Patient and public involvement – Openness Nawaloka practices an open, transparent policy in all operations while respecting patient privacy and confidentiality. There is an open communication strategy in place for where information can be exchanged. regarding our governance strategy and structure or other information pertinent to healthcare professionals, our stakeholders, and any interested parties.
We value the opinion of all our stakeholders, which is why we have implemented various mechanisms to enable our stakeholders to engage with identifying needs and improvements. We are also committed to cooperate and engage with other healthcare institutions, local authority organisations, and any organisation which has an interest in our operations.
• The Hospital website – promotes regular and ad hoc services, along with information about the staff, the complaints procedure and a comment facility.
• Patient Reference Group – Group representatives of the Hospital’s demographic make-up conducts annual patient survey and scrutinises the Hospital’s response to the views expressed by patients.
• Complaints – all patient complaints are analysed regularly for learning points and for patterns. Complaints about clinical care are shared immediately with the clinician concerned and those that give rise to clinical learning points are shared more widely at a clinical meeting.
• Suggestions – a suggestion box with forms to complete is available at the waiting area.
The Hospital aims to co-operate at all times ina spirit of openness with other healthcare providers,local authority organisations, and any organisationwhich has an interest in our operations.
5. Risk management The goal of clinical governance is congruent with the goal of risk management, which refers to effective, efficient healthcare and patient safety. Risk management is a process to identify potential faults due to human error. Hospitals require risk management to reduce inefficiency, to improve cost effectiveness, and to consider patient safety.
Nawaloka has an efficient risk management mechanism where risks are both proactively and reactively recognised. Nawaloka’s risk management includes: incident management, monitoring of adverse events, clinical investigations, analysis, and clinical audits to
ensure quality improvement of health service delivery. All staff is encouraged to discuss any incident that has or could pose a risk. The experience gained through incidents is shared across the Hospital and actions are reviewed and followed-up until fully-implemented. Clinical incidents are referred to a clinical meeting, to facilitate a detailed discussion in a confidential environment.
To maximise learning opportunities lessons should be shared within the Hospital. Some aspects of clinical risk management are:
• Reporting, monitoring, and trend analysis of incidents and adverse events: This incorporates activities such as learning from local incidents or patterns of incidents, including near hits and management of serious adverse events and maintaining a risk register and monitoring medico-legal cases.
• Sentinel event reporting, monitoring, and clinical investigation: Defines the process for identification, reporting and investigating sentinel events in line with Quality and Patient Safety Committee.
• Analysis of risk profile: including the identification, investigation, analysis and evaluation of clinical risks and the selection of the most appropriate method of correcting, eliminating or reducing identifiable risks.
The key policies relating to minimising risk for patients are:
• Patients’ Bill of Rights
• Consent Policy
• Infection Control Policy
• Identification of Patients
• Verbal Policy
• High Alert Medication Policy
• Correct Site, Correct Procedure, Correct Patient Surgery
• Patient Falls Policy
6. Information management Information management is of paramount importance to delivering high-quality healthcare, especially with the digitalisation of the sector. Nawaloka understands the value of managing information, maintaining records which leads to improvements in patient care decisions and to increase overall efficiency.
Information management in of paramount importance to delivering high-quality healthcare, especially with the digitalisation of the sector. Nawaloka understands the value of managing information, maintaining records which leads to improvements in patient care decisions and to increase overall efficiency.

Naw
alok
a H
osp
ital
s P
LC
|
A
nn
ual
Rep
ort 2
017/
18
118
Our clinicians are requested to record details of their consultations in such a way that:
• is easily understood by colleagues and by the patient, if requested
• reflects exactly what takes place in the consultation, including any discussion relating to risk, e.g. consent, offer of a chaperone
• provides clear information about the agreed care plan
• uses codes and templates as agreed within the Hospital to enable effective searching of patient data
• EMR (Electronic Medical Records) with UPIN. This helps us retrieve patient information on the system with no hassle of paper documents
Customer privacy and data protection is a vital part of our organisation. We will use patient data for purposes that are outlined in the Data Protection Policy. We maintain a strict confidence policy when using such data for governance purposes. Patient records are often scrutinised by internal audits and case studies.
7. Human ResourcesEffective human resource management practices positively influences outcomes related to organisational loyalty, service delivery, and patient care. Thus, it is a crucial element in clinical governance to promote healthcare quality and safety. Our highly-qualified team of consultants, nursing staff, medical staff, and other administrative staff is committed to delivering world-class medical care. There are regular reviews conducted to ensure that the standard of care offered is of high standard. In the recruitment process, we thoroughly examine the capabilities of potential MOs or nurses. The tasks are designed in such a way that they demonstrate awareness of clinical governance principals. We also adhere to the best practices and accepted policies and protocols in the management of human resources to ensure all our employees are oriented towards providing outstanding care to our patients.
Governance Structure of Nawaloka Hospitals PLCCorporate governance is the framework of rules and practices by which a Board of Directors ensures accountability, fairness, and transparency in a company’s relationship with all its stakeholders (financiers, customers, management, employees, Government and the community).
The Corporate Governance framework consists of;
1. Explicit and implicit contracts between the Company and the stakeholders for distribution of responsibilities, rights, and rewards.
2. Procedures for reconciling the sometimes conflicting interests of stakeholders in accordance with their duties, privileges and roles.
3. Procedures for proper supervision, control and information flows to serve as a system of checks-and-balances.
Good corporate governance is globally accepted as being fundamental to an organisation’s competitiveness, growth and sustainability. There is great attention on Board of Directors to discharge their duties with high ethical values and accountability in their commitment to good governance practices. Strong business ethics, sound policies and procedures, effective and efficient monitoring systems are considered as ingredients of good corporate governance system.
It is vital that the Hospital conducts its business within the highest standards of corporate governance. The governance structure of Nawaloka Hospitals PLC is designed to satisfy the legitimate claims of all stakeholders and to fulfil the Hospital’s economic, environmental and social responsibilities in an accountable, sustainable and transparent manner.
The business activities of the Hospital are conducted by adhering to the highest standards which are based on the best contemporary principles and practices whilst conforming to all applicable laws and regulations. The major external steering instruments on Governance could be identified as follows:
• Companies Act No. 07 of 2007.
• Code of Best Practice on Corporate Governance issued jointly by The Institute of Chartered Accountants of Sri Lanka and the Securities and Exchange Commission of Sri Lanka.
• Listing Rules of the Colombo Stock Exchange.
• Sri Lanka Accounting and Auditing Standards Act No. 15 of 1995.
• The Board of Directors, being the highest governance body of the Hospital, ensures alignment of the Hospital’s business strategy to sustainable business performance, whilst creating value to stakeholders.
The Hospital’s Governance Structure portrayed above (Refer page 110) demonstrates the linkage mechanism that ensures alignment of business strategy and direction through effective engagement and communication with its stakeholders, Board of Directors, Board Subcommittees and Management.

Stew
ard
ship
– C
orpo
rate
Gov
erna
nce
119
The Board comprises five Executive Directors including the Chairman, five Independent Non-Executive Directors and one Non-Executive Director, as shown below, who are professional experts in business and administrative matters in multiple industrial fields in which they have achieved excellence. Their contribution is the main driving force in guiding the Hospital to achieve excellence.
Dr H K Jayantha Dharmadasa (Chairman/CEO) Executive DirectorMr Rienzie T Wijetilleke (Non-Executive Vice-Chairman) Independent Non-Executive DirectorDeshabandu Tilak De Zoysa Senior Independent Non-Executive DirectorProfessor Lal Chandrasena (General Manager) Executive DirectorMr Tissa K Bandaranayake Senior Independent Non-Executive DirectorMr Ugitha Harshith Dharmadasa Executive DirectorMr Anisha Dharmadasa Executive DirectorMs Ashani Dharmadasa Executive DirectorMr D Sunil AbeyRatna Independent Non-Executive DirectorMr Palitha Kumarasinghe PC Independent Non-Executive DirectorMr Victor Rajamanner Ramanan Non-Executive Director
The Hospital has in place a number of mandatory and voluntary Board Subcommittees to fulfil regulatory requirements and ensure good governance of its activities. These Committees meet regularly to consider and discuss matters falling within their respective Charters and their recommendations are duly communicated to the Main Board. These Committees consist of Executive Directors and Non-Executive Directors in varying proportions as set out above.
The main responsibilities of the Board are as follows:
• Formulate the mission, overall business policy and strategy, provide directions and establish goals for the Management, set priorities and standards for the Management and the conduct of the business.
• Appoint the Chief Executive Officer, determine the remuneration of senior executives and report to the shareholders on their stewardship.
• Ensure that adequate internal controls and the highest ethical standards are maintained.
• Report to the shareholders quarterly on the performance of the Hospital.
• Be conscious of the commitment for the Hospital to be environmentally friendly by placing emphasis on complying with relevant regulations.
• Establish clinical governance procedures and continue to improve the same.
• Approve/review the Hospital’s annual, quarterly and monthly programmes for the patient safety, quality and care.
• Establish a mechanism to monitor the Hospital’s programmes for the patient safety, quality and care.
• Review on a monthly basis and act on reports of the patient safety, quality and care.
Given below are the ways and means of the Board engaging with the shareholders and employees in order to communicate relevant information to them:
Shareholders
• Annual General Meeting and Extraordinary General Meetings to deliberate on matters which are relevant and are of concern to the general membership.
• Access to the Board and the Company Secretaries.
• The Hospital’s website which is accessible to all stakeholders and the general public.
• Interim reports on financial performance.
Employees
• The Board of Directors includes one employee Director namely Vidya Jyothi Professor Lal Gotabhaya Chandrasena the Director/General Manager who bridges the communication gap between the rest of the employees and the Board.
• The Hospital’s Board of Directors and Board subcommittees conduct effective dialogue with the members of the Corporate Management on matters pertaining to the overall strategic direction of the Hospital.
• Staff is subjected to performance appraisal which is conducted quarterly. This is a well-established process and has become an ideal forum for employees to engage in aligning with strategic objectives of the Hospital.
The Board meets on a monthly basis and ad hoc meetings are held as and when required. At these meetings, the Board reviews the exposure to key business risk, the strategic direction of the Hospital, targets and budgets, progress made towards achieving those budgets, capital expenditure programmes, reports on patient safety, quality and care, Sentinel Events Monitoring Report and Customer/Patient Satisfaction Report.

Naw
alok
a H
osp
ital
s P
LC
|
A
nn
ual
Rep
ort 2
017/
18
120
The Board has delegated the primary authority to implement policies and achieve the strategic objectives of the Hospital to the Chairman/Chief Executive Officer (CEO) and the Director/General Manager. The responsibilities of the Director/General Manager are as follows:
• Recommend policies, strategic plans, and budgets to the Board of Directors.
• The Hospital’s overall, day-to-day operations.
• Financial Management.
• Quality Management.
• Compliance with applicable laws and regulations.
• Respond to any reports from inspection and regulatory agencies.
• Systems to manage and to control human, financial and other resources.
The Chairman/CEO and the Director/General Manager exercise this authority within the policy framework established by the Board and the ethical framework and business practices inherent to the Hospital, in accordance with best practices in dealing with employees, customers, suppliers, consultants and the community at large.
The Chairman/CEO and the Director/General Manager (Director/General Manager) review in detail the monthly performance, budgets, capital expenditure proposals and business strategies prior to recommending them to the Board.
In addition, monthly presentations and review of operations are conducted by the Senior Management team including the Chairman/CEO and the Director/General Manager. This review covers the operations for the current month and the year to date, clinical audit and review reports, clinical indicator reports, clinical incident monitoring report as well as future projections and the liquidity position of the Company.
Conflict of InterestThe Governance Structure of the Hospital ensures that the Directors take all necessary steps to avoid conflict of interest, in their activities with and commitments to, other organisations or related parties. In pursuance of the requirements under the Sections 192 and 193 of the Companies Act No. 07 of 2007, the Directors duly disclose the financial accommodation made.
We, as pioneers in Modern Healthcare Industry, strictly adhere to the relevant regulatory benchmarks and confirm compliance with the following during the year:
1. Companies Act No. 07 of 2007
2. The Code of Best Practice on Corporate Governance issued jointly by The Institute of Chartered Accountants of Sri Lanka and the Securities and Exchange Commission of Sri Lanka.
3. Sri Lanka Accounting and Auditing Standards Act No. 15 of 1995.
4. Listing Rules of the Colombo Stock Exchange
5. Recommendations of the UK Corporate Governance Code as practicable in the context of the nature of business risks and profiles.
Corporate Governance Structure
Nawaloka Hospital PLC
Shareholders
Board of Directors (5 ED/5 INED/ 1 NED)
New Nawaloka Hospital (Pvt) Ltd.New Nawaloka Medical Centre (Pvt) Ltd.Nawaloka Medicare (Pvt) Ltd.Nawaloka Green Cross Laboratories(Pvt) Ltd.
Fully-owned Subsidiary
Board Subcommittees (Refer page 135)

Stew
ard
ship
– C
orpo
rate
Gov
erna
nce
121
Corporate Governance Principle SEC and CA Sri Lanka Code Reference
Adoption Status
Level of Compliance by the Nawaloka Hospitals PLC
A. DirectorsA.1 The BoardPresence of an effective Board to Direct, Lead and Control the Company.
Meeting A.1.1 Adopted During the financial year 2017/18, there were 11 Board meetings held towards reviewing the contemporary organisational strategy.
Decisions in relevance to the Organisation’s strategy were made as and when required.
All meetings are called well in advance and Directors are expected to participate at the meetings.
Attendance of the Board of Directors:
Name of Director Number ofMeetingsAttended
Attendance
%
Dr H K J Dharmadasa 11 100
Mr Rienzie T Wijetilleke 10 91
Deshabandu Tilak de Zoysa 9 82
Vidya Jyothi Prof-Lal Chandrasena 11 100
Mr Tissa K Bandaranayake 9 82
Mr U H Dharmadasa 11 100
Mr A G Dharmadasa 10 91
Ms A G Dharmadasa 9 82
Mr D Sunil AbeyRatna 11 100
Mr Palitha Kumarasinghe, PC 10 91
Mr Victor R Ramanan 10 91
Board Responsibilities A.1.2 Adopted The Board possesses the required skills and qualifications in the following:
• Setting strategic direction and monitoring its effective implementation.
• The Non-Executive Directors collaborating with the Executive Directors to evaluate the systems of risk management, internal control and compliance.
• The Management appoints the External Auditors of the Company.
• The Non-Executive Directors are provided with the opportunity to criticise and question the actions of the Board especially related to the integrity of the financial reporting process.
• The Non-Executive Directors ensure that the strategies fall under the scope of ethical standards.

Naw
alok
a H
osp
ital
s P
LC
|
A
nn
ual
Rep
ort 2
017/
18
122
Corporate Governance Principle SEC and CA Sri Lanka Code Reference
Adoption Status
Level of Compliance by the Nawaloka Hospitals PLC
Rules and Regulations A.1.3 Adopted The Board collectively acted in accordance with the rules and regulations of the country which are applicable to the Company.
The following rules and regulations are adhered to in relevance to Corporate Governance by the Company:
• Companies Act No. 07 of 2007.
• Listing Rules of CSE (Colombo Stock Exchange).
• The Code of Best Practice on Corporate Governance as published by the SEC (Securities and Exchange Commission of Sri Lanka) and The Institute of Chartered Accountants of Sri Lanka the CA Sri Lanka.
• Recommendations of the UK Corporate Governance Code as practicable in the context of the nature of business risks and profiles.
Company Secretaries A.1.4 Adopted All Directors have direct access to the Company Secretaries which is a firm consisting of members of the Legal Profession and qualified Company Secretaries comprising a Senior Attorney-at-Law and several Associates who are also Attorneys-at-Law.
The Company Secretaries ensure the effective circulation of information among Executive and Non-Executive Directors.
The Company Secretaries facilitate the Board meetings and the Annual General Meeting.
Independent Judgement A.1.5 Adopted The Directors are welcome to bring their independent professional judgements towards the decision-making process.
The Board will create a forum to discuss the suggestions and select the best solution for the Company.
Adequate time and Effort
A.1.6 Adopted The Chairman and the members dedicate adequate time for their duties.
All Board meetings are organised well in advance. The Company Secretaries ensure that all requested information is delivered to the Directors for their independent judgement.
In addition to the Board meetings, the Directors attend to the following Subcommittee meetings:
• Audit Committee
• Remuneration Committee
• Nomination Committee
• Related Party Transaction Review Committee
• Risk Management Committee
• Strategic Planning Committee
• Sustainability Committee
Training A.1.7 Adopted New Directors are provided with adequate inductions and grooming for their Director roles. All Directors have well recognised the need for continuous training and expansion of knowledge and skills required to effectively perform their duties.

Stew
ard
ship
– C
orpo
rate
Gov
erna
nce
123
Corporate Governance Principle SEC and CA Sri Lanka Code Reference
Adoption Status
Level of Compliance by the Nawaloka Hospitals PLC
A.2 The Chairman and Chief Executive Officer
The code requires clear division of responsibilities of the Chairman and Chief Executive Officer.
Division of responsibilities of the Chairman and Chief Executive Officer
A.2.1 Adopted Role of the Chairman and Chief Executive Officer is held by one and the same person. The Chief Executive Officer's role includes developing and implementing high-level strategies and implementing major corporate decisions.
The Board unanimously agrees to the role of the Chairman and CEO being handled by one person, due to –
1. Exposure he has in the operations of the relevant Company which makes him the ideal CEO.
2. The superior skills he possesses in mediating communication between the Management and the shareholders.
The Chairman will act as the main pivot of communication between the Board of Directors and the shareholders.
As the role of the Chairman and Chief Executive Officer is not separated. Deshabandu Tilak De Zoysa has been appointed as Senior Independent Director (SID) in compliance with A.2.1.
A.3 Chairman's Role
The Chairman's role for good Corporate Governance.
The Chairman is responsible for an effective Board. The Chairman should ensure effective discharge of Board functions.
A.3.1 Adopted The Chairman is responsible for leadership of the Board. The Chairman facilitates the effective contribution and performance of all Board members whilst identifying any development needs of the Board.
He plays the role as a mediator of communication among the shareholders and the Management towards resolving issues of concern.
Further, the Chairman ensures that the balance of power between Executive Directors and Non-Executive Directors is adequate.
A.4 Financial Acumen
The Board to ensure the availability within it of those with sufficient financial acumen and knowledge to offer guidance on matters of finance.
Availability of sufficient financial acumen
A.4 Adopted The Board is consistently endowed with sufficient financial acumen as three of the Board members have sound financial knowledge and hold fellowships of respective professional accounting bodies.
A.5 Board Balance
It is preferred that the Board has a balance of Executive Directors and Non-Executive Directors such that no individual or small group of individuals can dominate the Board's decision-making.
Adequate number of Non-Executive Directors
A.5.1 Adopted The Board consists of eleven Directors out of which six Directors are Non-Executive Directors. This has ensured that no additional powers are vested by an individual or small group of individuals to dominate the Board. Furthermore, the composition of Non-Executive Directors exceeds the required 1/3 proportion of the Board.
Adequate number of Independent Non-Executive Directors
A.5.2 Adopted The Board consists of five Independent Non-Executive Directors out of six Non-Executive Directors.

Naw
alok
a H
osp
ital
s P
LC
|
A
nn
ual
Rep
ort 2
017/
18
124
Corporate Governance Principle SEC and CA Sri Lanka Code Reference
Adoption Status
Level of Compliance by the Nawaloka Hospitals PLC
Independency of Directors
A.5.3 Adopted All five Independent Non-Executive Directors are free from any material relationship with the Company which ensures their independence is not compromised.
Signed declaration of independence by the Non-Executive Directors
A.5.4 Adopted All Non-Executive Directors have made written submissions to declare their level of independence.
Declaration in the Annual Report
A.5.5 Adopted The Board has determined the Independence and Non-Independence of the Non-Executive Directors based on the declaration and all other available information.
No circumstances have arisen for the determination of independence by the Board, beyond the criteria set out in the Code.
The following Non-Executive Directors have been declared as the Independent Non-Executive Directors:
Mr Rienzie T WijetillekeDeshabandu Tilak De ZoysaMr Tissa K BandaranayakeMr D Sunil AbeyRatnaMr Palitha Kumarasinghe PC
Alternate Director A.5.6 N/A During the course of the year there had not been any appointments of Alternate Directors.
Senior Independent Director
A.5.7 Adopted Deshabandu Tilak De Zoysa has been appointed as the Senior Independent Director (SID), as the role of the Chairman and Chief Executive Officer is not separated.
Confidential Discussion with Senior Independent Director
A.5.8 Adopted The Senior Independent Director has made himself available for any material discussion with any of the Directors.
Meeting with the Chairman and Non-Executive Directors
A.5.9 Adopted The Chairman meets with the Non-Executive Directors when the need arises.
Recording of concerns in Board minutes
A.5.10 Adopted All concerns arisen had been resolved unanimously, resulting in the requirement for recording such concerns in minutes being limited.
A.6 Supply of Information
The Board should be fully equipped with timely information to discharge their duties.
Timely Information A.6.1 Adopted The Management has provided the Board with the required information to discharge their duties effectively.
Additional information is dispersed by the Management as and when required.
Board Papers A.6.2 Adopted The Board paper is sent seven days in advance of the Board meeting for initial preparation.

Stew
ard
ship
– C
orpo
rate
Gov
erna
nce
125
Corporate Governance Principle SEC and CA Sri Lanka Code Reference
Adoption Status
Level of Compliance by the Nawaloka Hospitals PLC
A.7 Appointments to the Board
Presence of a formal and transparent procedure for the appointment of new Directors to the Board.
Nomination Committee A.7.1 Adopted The Nomination Committee makes recommendations to the Board for all new appointments. The Nomination Committee will consist of the following:
Deshabandu Tilak De Zoysa – Chairman (Senior Independent Non-Executive Director)Mr Tissa K Bandaranayake – Member (Senior Independent Non-Executive Director)Mr D Sunil AbeyRatna – Member (Independent Non-Executive Director)
Assessment of Board Composition
A.7.2 Adopted The Board as a whole annually assesses the composition of the Board to ascertain whether combined knowledge and experience of the Board match with the strategic demands faced by the Company.
New Board Members will be appointed as and when the need arises.
Disclosure to Shareholders
A.7.3 Adopted The Board has disclosed the appointments of new Directors to the shareholders with the material information.
A.8 Re-election
All Directors should be required to submit themselves for re-election at regular intervals and at least once in every three years.
Appointment of Non-Executive Directors
A.8.1 Adopted Re-election procedure of the Board of Directors has been performed as per the Articles of Association of the Company.
Election of the Directors A. 8.2 Adopted The Directors are appointed at the Annual General Meeting.
A.9 Appraisal of Board Performance
The Board should appraise their own performance in order to ensure that the Board responsibilities are satisfactorily discharged.
Appraisal of Board Performance
A.9.1 Adopted The Board’s performance is assessed annually against preset targets relating to self-evaluation of individual performance and collective performance of the Board as a whole.
Appraisal of self-performance
A.9.2 Adopted Please refer above comment. (A.9.1)
Performance criteria A.9.3 Adopted Please refer above comment. (A.9.1)
A.10 Disclosure of Information in Respect of Directors
The shareholders are to be kept advised of relevant details in respect of Directors.
Disclosure in Annual Report
A.10.1 Adopted Please refer pages 106 to 109 for the profiles of the Directors.
A.11 Appraisal of the Chief Executive Officer
The Board should be required to evaluate annually the performance of the Chief Executive Officer.
Targets A.11.1 Adopted In each financial year, the Board has set short-term, medium-term and long-term targets with the consultation of the Chief Executive Officer along with its objectives. This includes financial and non-financial targets.
Evaluation of the Targets A.11.2 Adopted There is an ongoing process of evaluating the performance of the Chief Executive Officer in achieving the set targets.

Naw
alok
a H
osp
ital
s P
LC
|
A
nn
ual
Rep
ort 2
017/
18
126
Corporate Governance Principle SEC and CA Sri Lanka Code Reference
Adoption Status
Level of Compliance by the Nawaloka Hospitals PLC
B. Directors' RemunerationB.1 Remuneration Procedure
Establish a formal and transparent procedure for developing policy on executive remuneration and for fixing the remuneration packages of individual Directors.
Remuneration Committee
B. 1.1 Adopted The Company has established a Remuneration Committee to make recommendations to the Board within the agreed Terms of Reference for compensating the Executive Directors. Refer page 141 .
Composition of the Remuneration Committee
B. 1.2 Adopted The Remuneration Committee comprises the following Non-Executive Directors:Refer page 141.
B. 1.3 Adopted Deshabandu Tilak De Zoysa – Chairman(Senior Independent Non-Executive Director)Mr Tissa K Bandaranayake – Member (Senior Independent Non-Executive Director)Mr D Sunil AbeyRatna – Member (Independent Non-Executive Director)
Remuneration of the Non-Executive Directors
B. 1.4 Adopted The Board collectively decides the remuneration of the Non-Executive Directors. Non-Executive Directors receive a fee for their presence in the Board as well as in the Committees.
Advices to the Chairman and the Chief Executive Officer
B. 1.5 Adopted The Chairman and the Chief Executive Officer obtain advice from the Remuneration Committee in relevance to the procedure in compensating the Executive Directors. The Remuneration Committee consults the Chairman in relevance to the remuneration of other Executive Directors and if required access to professional advice from within and outside the Company.
B.2 The Level and Make-up of Remuneration
Ensure adequate level of remuneration to retain and motivate the Directors both Executive and Non-Executive to operate the Company effectively. Further, a proportion of the Executive Directors' remuneration should be structured to link rewards to the achievement of corporate objectives.
Remuneration for Executive Directors
B. 2.1 Adopted The Company is mindful of adequate remuneration to the Executive Directors to retain and motivate them. The Remuneration package has been designed to enhance the value of the shareholders through achieving the Company's short-term, medium-term and the long-term objectives.
Comparison between similar companies
B. 2.2 Adopted The Remuneration Committee decides the remuneration taking into consideration the comparative levels of remuneration paid by other similar companies.
Comparison of remuneration across the Group
B. 2.3 Adopted Consistent reviews are made in relevance to information related to executive remuneration to ensure that the Company is on a par with the market/industry rates as well as it is aligned to the strategic objectives of the Company.
Performance-based remuneration to the Executive Directors
B. 2.4 Adopted The Company provides compensation which is variable to the performance of the allocated responsibilities of the Executives.
Executive Share Option Schemes
B. 2.5 N/A The Company has not offered any share option schemes during the financial year under review.

Stew
ard
ship
– C
orpo
rate
Gov
erna
nce
127
Corporate Governance Principle SEC and CA Sri Lanka Code Reference
Adoption Status
Level of Compliance by the Nawaloka Hospitals PLC
Deciding the performance-related remuneration
B. 2.6 Adopted The Company has taken into consideration the guidelines given in Schedule D in decisions pertaining to performance remuneration related.
Early termination of Director
B. 2.7 N/A Not applicable to the Board except to the CEO whose terms of employment are governed by the contract of service.
Early termination of Director not included in the contract
B. 2.8 N/A Refer above comment.
Remuneration to the Non-Executive Directors
B. 2.9 Adopted Non-Executive Directors receive a fee in line with the market price. No share option scheme has been offered to the Non-Executive Directors.
B.3 Disclosure of Remuneration
Disclosure of the Remuneration policy in the Annual Report.
Disclosure of Remuneration
B. 3.1 Adopted The Remuneration Committee is headed by a Non-Executive Director. Please refer to the comment on B. 1.3 for further information. Refer page 141.
Remuneration policy focuses on the compensation to employees for the services provided and to retain employees with skills required to effectively manage the operations.
C. Relations with ShareholdersC.1 Constructive Use and Conduct of General Meetings
The Board to use the Annual General Meeting to communicate with the shareholders and encourage their participation.
Use of proxy votes C.1.1 Adopted The Company has a mechanism to record the proxy votes and proxy votes lodged for each resolution.
Separate Resolutions C.1.2 Adopted The Company proposes separate resolutions for each substantial item towards providing shareholders the opportunity to cast their votes separately in relevance to the above items.
Availability of the Chairmen of Audit, Remuneration and Nomination Committees
C.1.3 Adopted The Chairmen of Audit, Remuneration and Nomination Committees are made available by the Company to clarify any queries, especially at the time of the Annual General Meeting.Refer page 139 – Board Subcommittees.
Notice of Meeting C.1.4 Adopted The Annual Report is sent to each shareholder well in advance for their early preparation for the Annual General Meeting. All queries are clarified at the Annual General Meeting.
Procedures of voting at General Meetings
C.1.5 Adopted Voting procedures at the General Meetings have been communicated to the shareholders.
C.2 Communications with Shareholders
The Board should implement effective communication with the shareholders.
Communication Channels
C.2.1 Adopted The Board engages with the shareholders in the following ways to communicate relevant information.
Communication Methodology
C.2.2 Adopted Annual General Meetings and Extraordinary General Meetings to address matters which are relevant and of concern to the General Membership.

Naw
alok
a H
osp
ital
s P
LC
|
A
nn
ual
Rep
ort 2
017/
18
128
Corporate Governance Principle SEC and CA Sri Lanka Code Reference
Adoption Status
Level of Compliance by the Nawaloka Hospitals PLC
Implementation C.2.3 Adopted – Access to the Board and the Company Secretaries.
– The Hospital's website which is accessible to all stakeholders and the general public.
– Interim Reports – www.cse.lk
Responsibility of communication
C.2.4C.2.5C.2.6
Adopted The Board of Directors includes one Employee Director namely, the Director General Manager and the Company Secretaries to bridge the communication gap between the rest of the shareholders and the Board.
Shareholder Matters C.2.7 Adopted Please refer C. 2.4
C.3 Major Transactions
Disclosure of all material transactions to the shareholders which would materially alter/vary the Company's net assets base or in the case of a company with subsidiaries, the consolidated Group net assets base.
Shareholder Matters C.3.1 Adopted All material transactions have been disclosed to the shareholders.
D. Accountability and AuditD.1 Financial Reporting
To present a balanced and understandable assessment of the Company's financial position, performance and prospects.
Statutory Reporting D.1.1 Adopted Adhering to the statutory and legal requirements, the Company has published the following reports to disclose relevant information to the stakeholders:
– Quarterly Financial Statements
– Annual Reports
The Company has strictly complied with the requirements of the Companies Act No. 07 of 2007 and amended hereto. The Financial Statements are prepared based on the International Financial Reporting Standards (IFRS).
Directors’ Report D.1.2 Adopted Refer pages 136 to 140.
Auditors’ Report D.1.3 Adopted Refer pages 150 to 153.
Management Discussion and Analysis
D.1.4 Adopted Refer pages 37 to 105.
Declaration by the Board that the business is a going concern
D.1.5 Adopted Refer page 140 to 145.
Summon an Extraordinary General Meeting to notify loss of capital
D.1.6 Adopte Likelihood of such circumstances is remote; if such a situation arises an Extraordinary General Meeting would be summoned to inform the shareholders.

Stew
ard
ship
– C
orpo
rate
Gov
erna
nce
129
Corporate Governance Principle SEC and CA Sri Lanka Code Reference
Adoption Status
Level of Compliance by the Nawaloka Hospitals PLC
D.2 Internal Controls
The Board should maintain a sound system of internal controls to safeguard the shareholders’ investments and the Company assets.
Review of the Internal Control System
D.2.1 Adopted The Board continuously evaluates the effectiveness of the internal control system in the Company to safeguard the shareholder investment.
The Board of Directors is satisfied with the presence of the level of internal controls in business operations.
Refer page 143 – Internal Controls and Internal Audit.
Need for Internal Audit Function
D.2.2 Adopted An in-house internal audit functions in the Company.
Regular Reviews of Internal Controls
D.2.3 Adopted Our internal audit function carries out regular reviews, spot audits to identify the effectiveness of the internal controls established.
D.3 Audit Committee
The Board is required to establish formal and transparent arrangements for considering as to how they should select and apply accounting policies, financial reporting and internal control principles and maintaining appropriate relationship with the Company's Auditors.
Composition of Audit Committee
D.3.1 Adopted The Audit Committee comprised four Independent Non-Executive Directors:
Mr Tissa K Bandaranayake – Chairman (Senior Independent Non-Executive Director)Mr Rienzie T Wijetilleke – Member (Independent Non-Executive Director)Deshabandu Tilak De Zoysa – Member (Senior Independent Non-Executive Director)Mr D Sunil AbeyRatna – Member(Independent Non-Executive Director)
Duties of Audit Committee
D.3.2 Adopted The Audit Committee continuously evaluates the independence, effectiveness and objectivity of the Auditors.Further, the Committee evaluates the nature of the non-audit services carried out by the Auditors.

Naw
alok
a H
osp
ital
s P
LC
|
A
nn
ual
Rep
ort 2
017/
18
130
Corporate Governance Principle SEC and CA Sri Lanka Code Reference
Adoption Status
Level of Compliance by the Nawaloka Hospitals PLC
Terms of Reference of the Audit Committee
D.3.3 Adopted The Audit Committee is guided by the Committee Charter which is reviewed annually.
The Committee assists the Board to oversee the following aspects:
– Preparation, presentation and adequacy of disclosures in the Financial Statements.
– Compliance with financial reporting requirements, information requirements of the Companies Act No. 07 of 2007 and other financial reporting related regulations and requirements.
– Ensuring that the Internal Control System of the Company is effective.
– Ability to continue as a going concern in the foreseeable future.
– Assessing the independence and performance of the Company’s External Auditors.
Disclosure D.3.4 Adopted Refer pages 142 to 144.
D.4 Code of Business Conduct and Ethics –
The Company to develop a Code of Ethics for Directors and members of the Senior Management team and promptly disclose if there are any waivers of the Code for Directors and others.
Code of Business Conduct and Ethics
D.4.1 Adopted The Company has developed a Code of Business Conduct and Ethics focusing on the following important areas:
– Integrity
– Objectivity
– Professional competence and due care
– Confidentiality
– Fair dealing
– Encouraging the reporting of any illegal or unethical behaviour
– Conflict of interest
– Bribery and corruption
– Entertainment and gifts
– Integrity of Financial Statements
– Corporate opportunities
– Protection and proper use of the Company assets
– Compliance with rules and regulations
All our Directors and Senior Executives have declared their commitment to operate in adherence to these principles.

Stew
ard
ship
– C
orpo
rate
Gov
erna
nce
131
Corporate Governance Principle SEC and CA Sri Lanka Code Reference
Adoption Status
Level of Compliance by the Nawaloka Hospitals PLC
Affirmation of the Code of Business Conduct and Ethics (Report by the Chairman affirming that there were no incidents involving the breach of mentioned ethical policies)
D.4.2 Adopted Refer the Chairman's Report in pages 10 to 11.
D.5 Corporate Governance Disclosures
The Directors are required to disclose the extent to which the Company adheres to established principles and practices of Good Corporate Governance.
Disclosure of Corporate Governance
D.5.1 Adopted The Report in pages 115 to 131 provides a detailed disclosure on our Corporate Governance practices.
E. Institutional InvestorsE.1 Shareholder Voting
The institutional shareholders are required to make considered use of their votes and should be encouraged to ensure that their voting intentions are translated into practice.
Dialogue with the Shareholders
E.1.1 Adopted – The Annual General Meeting provides a platform for effective communication with the shareholders.
– All concerns of the shareholders are recorded in the minutes of the meeting and addressed thereafter.
– The Board reviews the minutes of the meetings and ensures that the shareholders’ issues are resolved systematically.
E.2 Evaluation of Governance Disclosure
The Company should encourage institutional investors to provide due diligence to all relevant factors in the Board Structure and Composition.
F. Other InvestorsF.1 Investing/Divesting Decision
Individual Shareholders F.1 Adopted Individual shareholders are encouraged to carry out adequate analysis or seek out independent advice for matters related to investing/divesting decisions.
F.2 Shareholder Voting
Individual Shareholder Voting
F.2 Adopted Individual shareholders are encouraged to participate at General Meetings and exercise their voting rights.

Naw
alok
a H
osp
ital
s P
LC
|
A
nn
ual
Rep
ort 2
017/
18
132
RISK MANAGEMENT
The process of identification, analysis, and acceptance or mitigation of uncertainty in business decisions can be interpreted as risk management. By its nature, healthcare service providers are exposed to a multitude of risks. In addition to the conventional risks such as credit and market, hospitals are significantly exposed to operational risks arising from diagnostic errors, surgical mishaps, medication issues, hazardous conditions, and privacy breaches which may lead to losses and liabilities. Given the disastrous consequences of such situations if they were to occur, highest priority needs to be accorded to identify and manage such risks with a formal organisational framework of consistent and thorough systems and processes.
We, at Nawaloka Hospitals consider identifying and managing the unexpected situations as an essential daily concern. Consistent and thorough processes are the hallmark of our successful risk management framework.
Risk management strategy of Nawaloka Hospitals takes a bottom-up approach, which encourages employees at all levels to participate in the risk management process. In addition, Nawaloka constantly reviews and updates the risk management process on a regular basis and thus, believes it to be a common thread, throughout the entire Hospital.
Three Lines of DefenceThe Company has deployed the “Three lines of defence” governance model which facilitates accountability and transparency through clear identification and segregation of roles as given below:
Board of Directors
Senior Management/ Risk Committee Audit Committee
Operational Management
Control of Risk Confirmation of Control
Overview of Control
Risk Management
Internal Audit
Sound internal control system which creates employees accountable for the risks accepted during the course of business.
Risk Management, compliance and other supporting functions such as finance, security, quality assurance and human resource management
Internal and external audit which provides an independent assurance to the Board over the first and second lines of defence

Stew
ard
ship
– R
isk
Man
agem
ent
133
Risk Management CommitteeThe Risk Management Committee of Nawaloka Hospital has been established with a clear mandate with the objective of ensuring that proper risk management policies and procedures are in place. The Committee comprises 8 members and is chaired by Professor Lal Chandrasena who is the Director/General Manager of Nawaloka Hospitals PLC.
Board Members of the Risk Management Committee
• Professor Lal Chandrasena – Chairman (DGM/ED)
• Mr U Harshith Dharmadasa – Member (ED)
• Mr A G Dharmadasa – Member (ED)
• Ms A G Dharmadasa – Member (ED)
• Mr Nalaka Niroshana – Member (Head of Finance and Corporate Planning)
• Dr Uthpala Malawara Arachchi – Member (Medical Superintendent)
• Mrs R M Jayarathne – Member (Chief Nursing Officer)
• Mr Kanishka Warusavitarana – Member (Senior Manager- Operations)
The Committee conducts monthly meetings to oversee and approve risk management, internal compliance and control policies and practices of the Company.
The committee has identified below risks for the hospital and mitigating strategies as follows:
Types of Risks
Financial Risk
Credit Risk Human Resources Risk
Information Technology Risk
Procurement Risk
Reputation Risk
Technological Obsolescence Risk
Asset Risk
Legal and Regulatory Environment Risk
Clinical Risk
Intellectual Property Risk
Competition Risk
Operational Risk

Naw
alok
a H
osp
ital
s P
LC
|
A
nn
ual
Rep
ort 2
017/
18
134
Risk Management initiatives
Identified risk Impact Response
Financial Risk:This includes risks related to funding structure, Investments, credits, currency and interest rate movements.
As financial strength is the blood of the Company, inadequate finance management could impact on the continuity of the Hospital.
• Timely and appropriate decisions on funding, investing, and dividend payments.
• Efficient working capital management.
• Use of compatible concepts in financing and investing.
• Negotiation of favourable credit terms and discounts.
• Appropriate funding strategies.
Operational Risk:Risk of direct and indirect losses resulting from inadequate or failure of internal processes, people and systems.
As the operational risk is combined with the natural course of business activities of the entity customer dissatisfaction will be the main impact of operational risk. It will increase the clinical risk as well.
• Review and continuously update controls according to the changes in business operations.
• Regularly analyse causes for the deviations and losses and take action to improve systems and controls to prevent recurrence in the future.
• Revise and implement business continuity planning.
• Carrying out effective and objective independent internal audits.
• Timely implementation of recommendations given by internal audit.
Clinical Risk:Risks relating to the quality of patient care.
As a health care service provider, clinical risk is the most significant risk to a Hospital. Failure to maintain the clinical risk will lead to customer dissatisfaction and will also mediate several other risks such as reputational risk and legal risk.
• Create and maintain high quality medical and safety standards.
• Identify any potential risk to involved parties and take preventive action.
• Adhere to set protocols.
• Carrying out ISO internal/external audits to maintain ISO procedures.
• Provision of fully-fledged training programmes to clinical staff.
Human Resources Risk: Risks that can arise from employee negligence, conflict of interest, fraud and mismanagement, or due to lack of employee trainings.
Failure to oversee the Human Resource Risk will result in higher labour turnover, human errors and omission and absenteeism. It will influence the continuity of business activities.
• Proper HR and Remuneration policies.
• Providing training and developing staff skills and knowledge.
• Succession planning.
• Job rotation and staff training for multiple skills.
• Improving decision-making processes by motivating employees.
• Maintaining and reviewing employee health and safety statistics
Information Technology Risk:Risks that can arise due to failure in IT systems.
Increased usage of technology can lead to increased levels of complexity and threats such as security breaches, system failures, and malicious attacks.
• Service level maintenance agreements for hardware and software.
• Implementation of firewalls and virus protection.
• Online and offline backup procedures for application data storage.
• Mirror data storage.
• Alternative connections for servers.
• Hardware backup.
• Regular health checks of the systems and networks.
• Error logs and user logs maintenance.
• Ad hoc backup restorations.
• Implementation of disaster recovery plan.

Stew
ard
ship
– R
isk
Man
agem
ent
135
Identified risk Impact Response
Reputation Risk:This risk is the threat to the good name and standing of the business.
Damages to the firm's reputation could result in loss of revenue, increased operating, capital or regulatory costs destruction of shareholder value and reduce number of customers.
• Proper management of financial, human resource and clinical risks
• Maintain regular and effective communication with shareholders and other stakeholders.
• Maintain constant improvement in the quality of the output of the Company
Legal and Regulatory Environment Risk:Risk arises due to non compliances.
Non compliance with the applicable laws and regulations could lead to penalties, loss of reputation and cancellation of trading licence.
• Ensure compliance with all applicable laws and regulations.
• Obtain legal advice where necessary.
• Reliability.
• Maintain an accurate patient data base.
Disaster Risk:Impact on the Company’s assets due to theft, natural disasters or human error.
Incapability to ensure the security of assets and the information of the Company could lead to financial losses as well as legal and reputational risks.
• Appropriate insurance covers for identified risks.
• Backup Policy.
Technological Obsolescence Risk:The impact of changing technology on the Company’s operations.
Failure to embrace the latest technology could result in loss of customers, falls in revenue and profits.
• Competent biomedical team to keep abreast with developments in medical equipment and introduce new technology to maintain high technological standards and continuous investment in medical equipment.
• Regular monitoring of developments and innovations in healthcare industry and adopting the latest technology as the pioneer.
Procurement Risk:Risk of purchasing inferior products.
Failure to maintain procurement procedure could result in customer dissatisfaction, high maintenance costs, high replacement costs and damages to the Company name.
• Define quality parameters.
• Establish relationship with multiple suppliers.
• Negotiate for better prices and discounts.
• Set standards for procurement process.
Credit Risk:Includes defaults by debtors and other parties who obtain credit from the Hospital.
Credit risks could bring threat to the liquidity position, profitability, and the cash flows of the Company.
• Evaluate the creditworthiness and credit policies of companies before granting credit.
• Carrying out timely collections from patients.
• Strengthening the debt collection process.
Intellectual Property Risk:This includes the unauthorised usage of company’s brand name and other confidential data by other parties.
Inability to oversee the Intellectual Property Risk could cause damages to the brand name, loss of ownership and threaten the confidentiality and competitiveness.
• Being vigilant on the use of our brand and image by unscrupulous parties.
• Brand Registration.
• Ensure proper internal controls.
• Obtaining legal advices whenever necessary.
• Ensure proper IT data protection.
Competition Risk:The possibility of revenue fluctuation caused by changes in market variables and actions of competitors.
Failure to oversee the competition could lead to loss of customers and loss of market.
• Enhance service quality.
• Maintain excellent customer relationship.
• Monitor competitor activities.

Naw
alok
a H
osp
ital
s P
LC
|
A
nn
ual
Rep
ort 2
017/
18
136
ANNUAL REPORT OF THE BOARD OF DIRECTORS
The Directors have pleasure in presenting to the members, their Report together with the Audited Financial Statements for the year ended 31 March 2018.
The details set out herein provide the pertinent information required under the Companies Act No. 07 of 2007, the Listing Rules of the Colombo Stock Exchange and recommendations in adherence with best accounting practices.
Legal form Nawaloka Hospitals PLC is a Public Listed Company with limited liability incorporated in Sri Lanka on 1 July 1982 under the Companies Ordinance No. 51 of 1938 and re-registered on 7 September 2007 under the provisions of the Companies Act No. 07 of 2007, with the Company Re-Registration No. PQ 78. Since 2004 its Shares are quoted in the Colombo Stock Exchange. This information is disclosed as required by Section 168 of the Companies Act No. 07 of 2007, which also requires the following information to be disclosed:
Principal business activitiesNature of the business of the Company and the Group are described below as required by Section 168 (1) (a) of the Companies Act No. 07 of 2007. There has been no material change to the activities of the Company or any of its subsidiaries during the period under review, subject to what is stated below.
CompanyThe principal activities of the Company is providing of healthcare and hospital services.
SubsidiariesNew Nawaloka Hospitals (Private) LimitedThis is a Private Company with limited liability incorporated in Sri Lanka under the provisions of the Companies Act No. 17 of 1982 and re-registered under the New Companies Act No. 07 of 2007. It is also domiciled in Sri Lanka and is a wholly-owned subsidiary of Nawaloka Hospitals PLC.
New Nawaloka Medical Centre (Private) LimitedThis too is a Private Company with limited liability incorporated in Sri Lanka under the provisions of the Companies Act No. 17 of 1982 and re-registered under the New Companies Act No. 07 of 2007. It is also domiciled in Sri Lanka and is a wholly-owned subsidiary of Nawaloka Hospitals PLC.
Nawaloka Green Cross Laboratories (Private) LimitedA new Private Company with limited liability was incorporated in Sri Lanka in the year 2017 under the provisions of the New Companies Act No. 07 of 2007. It is domiciled in Sri Lanka and is a wholly-owned subsidiary of Nawaloka Hospitals PLC. Green Cross Laboratories of South Korea will provide technical advice to Nawaloka Green Cross Laboratories (Private) Limited for Laboratory Services.
Nawaloka Medicare (Private) LimitedThis is a Private Company with limited liability incorporated in Sri Lanka in the year 2014 under the provisions of the Companies Act No. 07 of 2007. It is also domiciled in Sri Lanka and is a wholly-owned subsidiary of Nawaloka Hospitals PLC.
Note:
Nawaloka Metropolis Laboratories (Private) LimitedThe Company was established in the year 2005 along with Metropolis India to provide laboratory services in which Nawaloka Hospitals PLC held 50% of shares in that Company. The joint venture came to an end on 31 March 2017 and Nawaloka Hospitals PLC divested itself of its 50% Shares in that Company.
Review of business/future developmentA review of the business of the Company and the Group and its performance during the year are contained in the Chairman’s Review/Chief Executive Officer’s Performance Review and of the Director/General Manager’s Operational and Management Review at pages 10, 11, 12 and 13 respectively of this Report. These reviews form an integral part of this Report and together with the Financial Statements described in detail of the state of affairs of the Company and the Group.
Financial StatementsThe Financial Statements which include the Statement of Comprehensive Income, Statement of Financial Position, Statement of Changes in Equity, Cash Flow Statements and Notes to the Financial Statements are given at pages 155 to 203 and have been prepared in conformity with the Sri Lanka Accounting Standards and the requirements of Section 168 (1) (b) of the Companies Act No. 07 of 2007 and the Listing Rules of the Colombo Stock Exchange.

Stew
ard
ship
– A
nnua
l Rep
ort o
f the
Boa
rd o
f Dir
ecto
rs
137
Auditors’ reportThe Financial Statements for the period under review were audited by Messrs KPMG (Chartered Accountants) for the year ended 31 March 2018 and the Independent Auditor’s Report issued thereon appears at pages 150 to 153 of this Annual Report as required by Section 168 (1) (c) of the Companies Act No. 07 of 2007.
Financial results
Group Company
(All figures in Sri Lanka Rupees) 2017/18 Rs.
2016/17 Rs.
2017/18 Rs.
2016/17 Rs.
Profit before taxation 557,196,882 302,155,201 457,031,564 (397,596,642)
Less: Taxation (377,238,343) (61,280,520) 3,423,582 (39,084,200)
Net profit after taxation 179,358,539 240,874,683 453,607,982 (436,680,842)
Profit attributable to equity holders of the Company (35,150,042) 552,808,820 640,782,680 (378,979,907)
Earnings per share 0.13 0.17 0.32 (0.31)
Accounting policies and changes during the yearThe Accounting Policies adopted in the preparation of Financial Statements of the Company and the Group are given at pages 160 to 171 of this Annual Report as required by Section 168 (1) (d) of the Companies Act. There have been no changes in the accounting policies adopted by the Company during the period under review other than the depreciation rates.
Entries in the interests registerThe Interests Register is maintained by the Company, as required by Section 168 (1) (e) of the Companies Act No. 07 of 2007.
Directors’ remuneration and other benefitsDirectors’ remuneration and other benefits of Directors are given at Note 8 to the Financial Statements at page 174 as required by Section 168 (1) (f) of the Companies Act No. 07 of 2007.
DonationsTotal donations made by the Group during the year amounted to Rs. 10,876,634 Mn. and is being disclosed as required by Section 168 (1) (g) of the Companies Act No. 07 of 2007 and this expenditure was incurred upon the mandate conferred upon the Board by the Shareholders at the last Annual General Meeting.
Shareholders’ fundsAfter the above mentioned appropriation, the total Group Shareholders’ funds as at 31 March 2018, stood at Rs. 4,258,504,793. The total Shareholders’ Funds of the Group as at 31 March 2017 stood at Rs. 4,434,605,437. The movements are shown in the Statement of Changes in Equity.
Interim dividendInterim dividend of Rs. 0.10 per share was paid in July 2017.
Directorate The Directors, who served on the Board during the financial year are the following and this information is provided as required by Section 168 (1) (h) of the Companies Act No. 07 of 2007:

Naw
alok
a H
osp
ital
s P
LC
|
A
nn
ual
Rep
ort 2
017/
18
138
Name of Director Executive/Non-Executive status
Status of Independence
Dr Jayantha Dharmadasa – Chairman & Chief Executive Officer Executive
Mr Rienzie T Wijetilleke – Non-Executive Vice-Chairman Non-Executive IndependentDeshabandu Tilak de Zoysa – Senior Independent Director Non-Executive IndependentVidya Jyothi Prof Lal Chandrasena – General Manager ExecutiveMr Tissa K Bandaranayake – Senior Independent Director Non-Executive IndependentMr U Harshith Dharmadasa ExecutiveMr A G Dharmadasa ExecutiveMs A G Dharmadasa ExecutiveMr D Sunil AbeyRatna Non-Executive IndependentMr Palitha Kumarasinghe, PC Non-Executive IndependentMr V R Ramanan Non-Executive
The qualifications and experience of each of the Directors are given in the individual profiles of the Board of Directors at pages 106 to 109 of the Annual Report.
Appointments and resignationsNew appointments to the Board are based on the collective decision of the Board. In making new appointments, the Board considers the composition of the Board in order to assess whether they have the right mix of skills, experience and competence in the management of the Company.
The information of new appointments and resignations to the Board of Directors of the Company are shown as an integral part of the Annual Report of the Board of Directors, in compliance with Section 168 (1) (h) of the Companies Act No. 07 of 2007.
New appointmentsThere were in fact no new appointments to the Board during the financial year under review.
Recommendations for re-electionIn terms of Article 74 of the Articles of Association of the Company, Deshabandu Tilak De Zoysa, Mr Tissa K Bandaranayake, Mr Palitha Kumarasinghe, PC and Mr V R Ramanan who retire from the Board by rotation at the forth coming Annual General Meeting and being eligible for re-election, offer themselves for re-election.
Further, Mr Rienzie T Wijetilleke who has attained the age of 70 and being eligible for re-election in terms of Section 211 of the Companies Act No. 07 of 2007 also offers himself to be re-appointed as a Director of the Company.
Further, Deshabandu Tilak De Zoysa who has attained the age of 70 and being eligible for re-election in terms of Section 211 of the Companies Act No. 07 of 2007 also offers himself to be re-appointed as a Director of the Company.
Furthermore, Mr Tissa K Bandaranayake who has attained the age of 70 and being eligible for re-election in terms of Section 211 of the Companies Act No. 07 of 2007 also offers himself to be re-appointed as a Director of the Company.
Moreover, Mr D Sunil AbeyRatna who has attained the age of 70 and being eligible for re-election in terms of Section 211 of the Companies Act No. 07 of 2007 also offers himself to be re-appointed as a Director of the Company.
Independent DirectorsMr Rienzie T Wijetilleke, Deshabandu Tilak De Zoysa who were appointed as Independent Directors of the Company on 16 October 2013, have served on the Board continuously for a period of nine years, and thus the Board Resolved on the 30th November 2012 as required by Rule 7.10.3 (b) that despite the said two Independent Directors serving up on the Board for more than nine years they are yet regarded as Independent Directors in terms of Rule 7.10.4 [read with sub-rules (a) to (h)] of the Revised Rules of the Colombo Stock Exchange.
Mr Tissa K Bandaranayake, Mr D Sunil AbeyRatna and Mr Palitha Kumarasinghe, PC were appointed as Independent Directors of the Company on 27 May 2009, 28 February 2012 and 24 March 2016 respectively.

Stew
ard
ship
– A
nnua
l Rep
ort o
f the
Boa
rd o
f Dir
ecto
rs
139
Board subcommitteesThe three Board Subcommittees established by the Board continue to oversee matters relating to policy and governance. A “Related Party Transactions Review Committee” was established to comply with the new directives issued by the Securities and Exchange Commission to ensure that the interests of shareholders as a whole are taken into account by a listed entity when entering into related party transactions. The composition of the Subcommittees during the Financial year under review are as follows:
Board audit committee members
Mr Tissa K Bandaranayake – Chairman (INED)Mr Rienzie T Wijetilleke – Member (INED)Deshabandu Tilak De Zoysa – Member (INED)Mr D Sunil AbeyRatna – Member (INED)
Remuneration committee members
Deshabandu Tilak De Zoysa – Chairman (INED)Mr Tissa K Bandaranayake – Member (INED)Mr D Sunil AbeyRatna – Member (INED)
Nomination committee members
Deshabandu Tilak De Zoysa – Chairman (INED)Mr Tissa K Bandaranayake – Member (INED)Mr D Sunil AbeyRatna – Member (INED)
Related party transactions review committee members
Mr Tissa K Bandaranayake – Chairman (INED)Deshabandu Tilak De Zoysa – Member (INED)Mr D Sunil AbeyRatna – Member (INED) VidyaJyothi Professor Lal Chandrasena – Member (ED)Mr Palitha Kumarasinghe, PC – Member (INED)
Board members of the risk management committee
VidyaJyothi Professor Lal Chandrasena – Chairman (DGM/ED)Mr U Harshith Dharmadasa – Member (ED)Mr A G Dharmadasa – Member (ED)Ms A G Dharmadasa – Member (ED)
Strategic planning committee
Dr Jayantha Dharmadasa – Chairman/CEOVidyaJyothi Professor Lal Chandrasena – Member (ED)Mr U Harshith Dharmadasa – Member (ED)Mr A G Dharmadasa – Member (ED)
Sustainability committee
Dr Jayantha Dharmadasa – Chairman/CEOVidya Jyothi Prof Lal Chandrasena – Member (ED)Mr U Harshith Dharmadasa – Member (ED)Mr A G Dharmadasa – Member (ED)
DGM – Director General ManagerED – Executive DirectorINED – Independent Non-Executive Director
Directors’ meetingsDetails of meetings which comprise Board meetings, the Board’s Subcommittee meetings namely the Audit Committee, Remuneration Committee, Strategic Planning Committee, Nomination Committee, Related Party Transactions Review Committee and Risk Management Committee are dealt with at pages 133, 143 and 144 of this Annual Report.
Directors’ shareholdingThe aggregate shareholding of the Directors for the year ended 31 March 2018 and the previous year, are as follows:
2017/18Ordinary
2016/17Ordinary
Dr Jayantha Dharmadasa 462,736,182
Mr Rienzie T Wijetilleke 33,332
Deshabandu Tilak de Zoysa 218,000
VidyaJyothi Prof Lal Chandrasena 601,198
Mr U H Dharmadasa 3,360
Mr A G Dharmadasa 3,004,026
Ms A G Dharmadasa 5,066,686
Mr Damian Sunil AbeyRatna NIL
Mr Tissa K Bandaranayake NIL
Mr V R Ramanan 3,400,000
Mr Palitha Kumarasinghe, PC NIL
Related party transactionsThe Directors have also disclosed the transactions if any, that could be classified as “Related Party Transactions” in terms of LKAS 24 – “Related Party Disclosures” and thus complied with the CSE Listing Rules. Related Party Transactions are given in Note 34 to the Financial Statements.
Directors’ interestsThe Interests Register is maintained by the Company as per the Companies Act No. 07 of 2007.
Capital expenditureDetails of Property, Plant & Equipment and their movements in the Company and the Group during the year, are listed in Note 13 to the accounts at pages 178 to 182.

Naw
alok
a H
osp
ital
s P
LC
|
A
nn
ual
Rep
ort 2
017/
18
140
Stated capitalThe Stated Capital of the Company is 1,409,505,596 ordinary shares. There were no changes in the Stated Capital during the year.
Stated capital Group Company
2017/18Rs.
2016/17Rs.
2017/18Rs.
2016/17Rs.
Issued and fully paid
At the beginning of the year 1,207,388,876 1,207,388,876 1,207,388,876 1,207,388,876
At the end of the year 1,207,388,876 1,207,388,876 1,207,388,876 1,207,388,876
Share informationThe composition of shareholders and the information relating to share trading, net assets and market value per share are given on pages 48 to 51 of this Annual Report.
Major shareholdersThe 20 largest shareholders of the Company as at 31 March 2018 are given at page 51 of this Annual Report.
Employment policyThe Company’s Employment Policy is totally non-discriminatory and equal opportunities are given to all employees irrespective of ethnic, race, origin, religion, political opinion, gender or marital status.
The Company applies “equal opportunity policy” in selection, training, development, and promotion opportunities, ensuring that all decisions are based on merit and qualification.
The employees are always encouraged to discuss issues relating to operations and to make suggestions to improve performance.
The number of persons employed by the Group as at 31 March 2018 was 943
Group revenueThe Revenue of the Group was Rs. 7,955,278,613 (2017 – Rs. 6,300 Mn.). The analysis thereof is given in Note 6 to the Financial Statements.
Stock exchange listingThe Company was listed on the Main Board of the Colombo Stock Exchange in the year 2004.
Going concernThe Board firmly believes that the Company and its subsidiaries have sufficient resources to continue in operational existence for a very long foreseeable future. Therefore, Financial Statements of the Group have been prepared on the principle of a “Going Concern”.
Events occurring after the reporting dateThere are no significant events that have occurred after the reporting date which would have any material effect on the Company or on the Group that require adjustments to or disclosure in the Financial Statements, except as qualified by the Auditors.
Appointment of auditorsMessrs KPMG (Chartered Accountants) who are willing to continue in office are recommended for reappointment, at a remuneration to be decided by the Board of Directors.
The fees paid to the Auditors are disclosed in Note 8 to the Financial Statements.
As far as the Directors are aware, the Auditors do not have any relationship (other than that of an Auditor) with the Company or any of its subsidiaries other than those disclosed above. The Auditors also do not have any interest in the Company or its subsidiaries as required by Section 168 (1) (j) of the Companies Act No. 07 of 2007.
For and on behalf of the Board,
Dr Jayantha Dharmadasa
Chairman/Chief Executive Officer
Vidya Jyothi Prof Lal Chandrasena
Director/General Manager
By Order of the Board,
Sgd.
M & A Company Secretaries (Private) Limited
23 May 2018

Stew
ard
ship
– R
EM
UN
ER
AT
ION
CO
MM
ITT
EE
RE
POR
T
141
REMUNERATION COMMITTEE REPORT
Formation, composition and structureThe Remuneration Committee is a Subcommittee, appointed by and responsible to the Board of Directors and consists of three Independent Non-Executive Directors:
Deshabandu Tilak De Zoysa Chairman (Independent Non-Executive Director)
Mr Tissa K Bandaranayake Member (Independent Non-Executive Director)
Mr D Sunil AbeyRatna Member (Independent Non-Executive Director)
The Committee meetings held during the financial year are subject to the following criteria:
Duties and responsibilitiesThe Remuneration Committee review and recommend the policy on remuneration of the Executive Staff and the Specific remuneration package for the Executive Directors while considering the following:
1. Determining the compensation of the Chairman and the Board of Directors, while ensuring that no Director is involved in setting their own remuneration or any other benefit.
2. Establishing transparent procedure to determine remuneration for Executives and Directors. In this context, the Remuneration Committee took into account:
a. Competition;
b. Qualifications and experience;
c. Market information ; and
d. Business performance, in declaring the overall remuneration policy of the Group.
3. Recommending to the Board of Directors all senior management appointments.
4. Approving remuneration levels at each designation of senior management.
5. Maintain competitive and attractive remuneration packages to senior managers and ensure that it is in par with the industry levels.
6. Recommending to the Board of Directors the promotions of Key Management Personnel.
7. Decisions with regard to remuneration, increments, incentive and bonus payments are based on the evaluation of performance against targets.
8. Make direction regarding to the statutory payments made by the Company on behalf of its employees.
ChallengesIn a highly competitive environment attracting and retaining high calibre executives is a key challenges faced by the Group.
Evaluation of the effectiveness of the committeeThe Board reviews and update the Committee Charter annually. The minutes of meetings and other reports from the Remuneration Committee are submitted to the Board of Directors, and in addition, plans have been initiated for the Non-Committee members to evaluate the Committee on an annual basis by way of a checklist.
Deshabandu Tilak De Zoysa
Chairman
23 May 2018

Naw
alok
a H
osp
ital
s P
LC
|
A
nn
ual
Rep
ort 2
017/
18
142
AUDIT COMMITTEE REPORT
In keeping with the Code of Best Practice on Corporate Governance and the requirements of the Securities and Exchange Commission for public limited companies, Nawaloka Hospitals PLC has established an Audit Committee whose functions, authority and duties have been clearly identified in the Audit Committee Charter. This Charter integrates all the requirements of the Security and Exchange Commission and Code of Best Practice on Corporate Governance.
The role of the Audit Committee is to oversee the financial reporting system of the Company with a view to safeguard the interests of all the stakeholders and ensuring that it has been extended to its subsidiaries. This includes selecting and applying appropriate accounting policies for the purpose of financial reporting, ensuring sound internal control principles and its effective implementation, ensuring the integrity of Financial Statements and maintaining an appropriate independent relationship with the Company’s Auditors.
Formation and Composition of the CommitteeThe Audit Committee was established by the Board with a formal and transparent arrangement and it comprises of four Independent Non- Executive Directors.
The Chairman of the Audit Committee is Mr Tissa K Bandaranayake, who is an Independent Non-Executive Director, a fellow member of The Institute of Chartered Accountants of Sri Lanka and a former Senior Partner of Messrs Ernst & Young, Chartered Accountants with expert knowledge in Accounting and Finance.
Members of the Audit Committee
Name of Director Non-Executive Independent
Mr Tissa K Bandaranayake - Chairman √ √
Mr Rienzie T Wijetilleke √ √
Deshabandu Tilak De Zoysa √ √
Mr D Sunil AbeyRatna √ √
Broad Purpose of the Audit CommitteeThe Audit Committee assisted the Board in the following manner:
• Ensuring that the preparation, presentation and adequacy of disclosure in the Financial Statements are in accordance with LKAS/SLFRS and with the requirement of the Companies Act No. 07 of 2007 and other relevant financial reporting related regulatory requirements.
• Reviewing the appropriateness of the procedure in place for the identification, evaluation and management of business risks whilst seeing that the systems of internal control with regard to all functions are adequate and functioning properly.
• Assessing the Company’s ability to continue as a going concern in the foreseeable future and also in addition, ensuring compliance with Laws and Company policies.
• Overseeing of the independence and performance of the Company’s External Auditors.
Duties and Responsibilities In brief, the duties and responsibilities performed by the Audit Committee are as follows:
External Audit • Recommending the re-appointment of Messrs KPMG, Chartered Accountants, as Auditors of Nawaloka Hospitals PLC for the financial year ending 31 March 2019.
• Examine any non-audit work performed by the Auditors and the fees thereon to ensure that their objectivity and independence is not impaired.
• Reviewing the scope and result of the audit and its effectiveness.• Discussing with the External Auditors before commencement of the audit and at the conclusion
of the audit, in relation to audit plan, key audit issues and their resolution, management responses and the remuneration of the Auditors.
• With the introduction of the new Audit report this year, the Audit Committee has introduced a process to discuss the areas which are identified as key Audit Matters by KPMG for reporting in the audit report, at the audit planning and completion stages.
Compliance with Laws, Regulations and Company policies
• Reviewing the Quarterly Financial Statements and discussing with the Management.• Reviewing the extent of compliance with the laws of the country, governmental regulations,
listing rules and established policies of the Company.
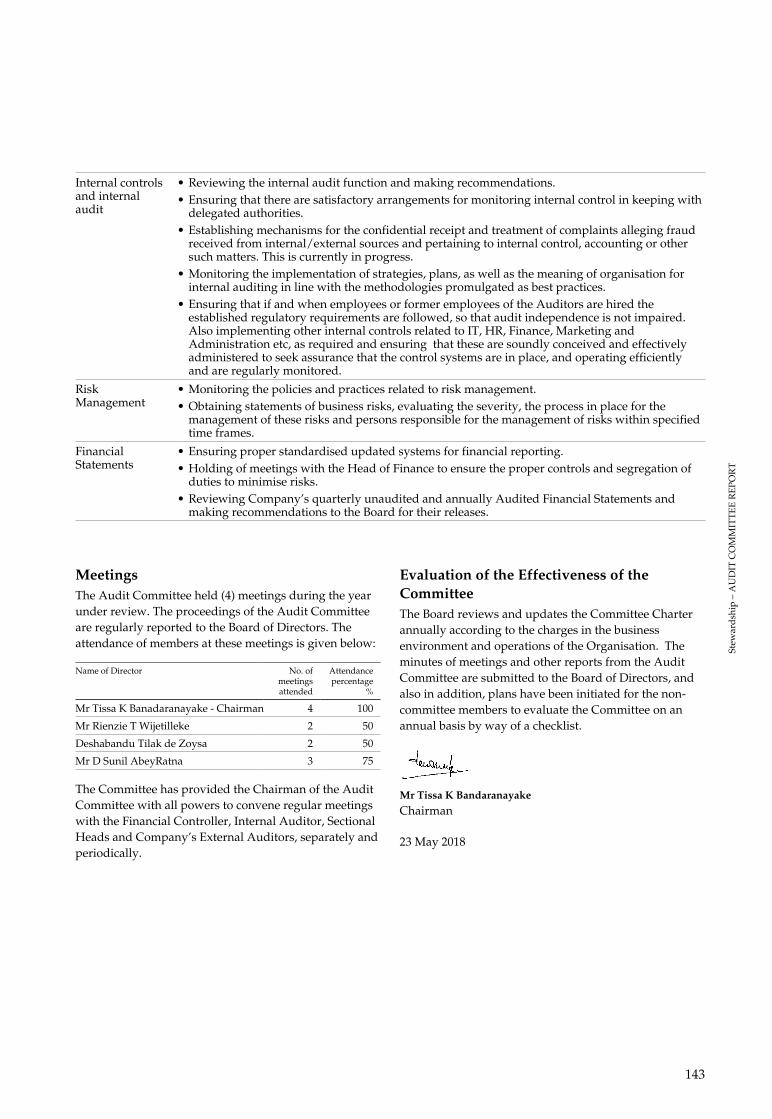
143
Stew
ard
ship
– A
UD
IT C
OM
MIT
TE
E R
EPO
RT
Internal controls and internal audit
• Reviewing the internal audit function and making recommendations.• Ensuring that there are satisfactory arrangements for monitoring internal control in keeping with
delegated authorities.• Establishing mechanisms for the confidential receipt and treatment of complaints alleging fraud
received from internal/external sources and pertaining to internal control, accounting or other such matters. This is currently in progress.
• Monitoring the implementation of strategies, plans, as well as the meaning of organisation for internal auditing in line with the methodologies promulgated as best practices.
• Ensuring that if and when employees or former employees of the Auditors are hired the established regulatory requirements are followed, so that audit independence is not impaired. Also implementing other internal controls related to IT, HR, Finance, Marketing and Administration etc, as required and ensuring that these are soundly conceived and effectively administered to seek assurance that the control systems are in place, and operating efficiently and are regularly monitored.
Risk Management
• Monitoring the policies and practices related to risk management.• Obtaining statements of business risks, evaluating the severity, the process in place for the
management of these risks and persons responsible for the management of risks within specified time frames.
Financial Statements
• Ensuring proper standardised updated systems for financial reporting.• Holding of meetings with the Head of Finance to ensure the proper controls and segregation of
duties to minimise risks.• Reviewing Company’s quarterly unaudited and annually Audited Financial Statements and
making recommendations to the Board for their releases.
MeetingsThe Audit Committee held (4) meetings during the year under review. The proceedings of the Audit Committee are regularly reported to the Board of Directors. The attendance of members at these meetings is given below:
Name of Director No. of meetings attended
Attendance percentage
%
Mr Tissa K Banadaranayake - Chairman 4 100
Mr Rienzie T Wijetilleke 2 50
Deshabandu Tilak de Zoysa 2 50
Mr D Sunil AbeyRatna 3 75
The Committee has provided the Chairman of the Audit Committee with all powers to convene regular meetings with the Financial Controller, Internal Auditor, Sectional Heads and Company’s External Auditors, separately and periodically.
Evaluation of the Effectiveness of the Committee The Board reviews and updates the Committee Charter annually according to the charges in the business environment and operations of the Organisation. The minutes of meetings and other reports from the Audit Committee are submitted to the Board of Directors, and also in addition, plans have been initiated for the non-committee members to evaluate the Committee on an annual basis by way of a checklist.
Mr Tissa K Bandaranayake
Chairman
23 May 2018

Naw
alok
a H
osp
ital
s P
LC
|
A
nn
ual
Rep
ort 2
017/
18
144
RELATED PARTY TRANSACTIONS REVIEW COMMITTEE
Composition of the CommitteeThe Board appointed a’ Related Party Transactions Review Committee (RPTRC), comprising one Executive Director and three Independent Non-Executive Directors, as stipulated by the Code of Best Practices on Related Party Transactions, issued by the Colombo Stock Exchange (CSE). The RPTRC as at the end of the financial year comprised of the following members:
Mr Tissa K Bandaranayake Chairman (Independent Non-Executive Director)
Deshabandu Tilak de Zoysa Member (Independent Non-Executive Director)
Mr D Sunil AbeyRatna Member (Independent Non-Executive Director)
Mr Palitha Kumarasinghe, PC Member (Independent Non-Executive Director)
VidyaJyothi Prof. Lal Chandrasena Member (Executive Director)
Terms of Reference of the CommitteeThe RPTRC was formed by the Board at the end of 2014, to assist the Board in reviewing all Related Party Transactions (RPT) carried out by the Group, by adopting the Code of Best Practice on Related Party Transactions, as issued by the CSE, which is mandatory from 1st January 2016.
The mandate of the Committee includes inter alia the following:
• Ensuring that the Company has identified and recorded the list of its related parties, consistent with the definition of related parties as detailed in the CSE Regulations.
• Updating the Board of Directors on the RPT of each of the related parties of the Group.
• Making immediate market disclosures on applicable RPT, as required by Section 9 of the Continuing Listing requirements of the CSE.
• Making appropriate disclosures on RPT in the Annual Report, as required by Section 9 of the Continuing Listing Requirements of the CSE.
The Committee scheduled quarterly meetings to review and report to the Board, on matters involving RPT falling under its Terms of Reference.
Activities in 2017/2018All related party transactions which took place during the financial year 2017/18 were reviewed by the members of the Committee at the Committee meetings held on 9/8/2017, 8/11/2017, 8/2/2018 and 21/05/2018 and the Committee is of the opinion that the transactions are on normal commercial terms, and are not prejudicial to the interests of the entity and its minority shareholders. At a Committee meeting held on 8 November 2017,the members noted that the non-recurrent related party transaction that Nawaloka Hospitals PLC has entered into with Nawaloka construction company (private) Limited has exceeded the threshold during the quarter of July to September 2017 and the Committee accordingly directed to the company secretaries to make an immediate disclosure to CSE as per the Listing rules section 9.3.1 As Nawaloka Hospitals PLC is the 100% shareholder of Nawaloka Construction Company(private) Limited,the two directors of Nawaloka Hospitals PLC signed consenting to the transaction in writing in lieu of a special resolution as per section 185 of the Company Act No. 07 of 2007.
Proceedings of the Committee meetings were regularly reported to the Board of Directors.
The Members of the Committee were of the opinion that, other than the above, no other Related Party Transaction had exceeded the limits prescribed in the Listing Rule Section 9. Thus Shareholder approval by way of a Special Resolution was not required.
Mr Tissa K. BandaranaykeChairman
23 May 2018

Stew
ard
ship
– D
IRE
CT
OR
S’ R
ESP
ON
SIB
ILIT
Y IN
FIN
AN
CIA
L R
EPO
RT
ING
145
The responsibility of the Directors in relation to the Financial Statements is set out in the following statement:
The Board of Directors of Nawaloka Hospitals PLC are responsible under Section 148 of the Companies Act No. 07 of 2007 for keeping proper accounting records which have been disclosed with reasonable accuracy, at all times, the financial position of the Company and of the Group and to enable them to ensure that the Financial Statements comply with, inter alia the Companies Act No. 07 of 2007.
In preparing these Financial Statements, the Directors of the Company have to comply with the requirements specified in Sections 150 (1), 151(1), 152 (1) and 153 (1) of the Companies Act No. 07 of 2007. In accordance therewith the Directors of the Company and the Group maintain proper Books of Accounts of all the transactions and prepare Financial Statements that give a true and fair view of the state of affairs of the Company at the date of the Statement of Financial Position and the Profit or Loss for the year ending on that date of the Statement of Financial Position.
Accordingly, the Directors are of the view that –
(1) Appropriate accounting policies have been selected and applied in a consistent manner and material departures if any, have been disclosed and explained;
(2) All applicable and relevant Accounting Standards have been followed; and
(3) They have exercised due and proper judgement and estimates which are reasonable and prudent.
The Financial Statements of the Company and the Group have been certified by the Company’s Chief Financial Officer, the person responsible for its preparation, as required by the Act. Financial Statements of the Company and the Group have been signed by two Directors on 23 May 2018 as required by Sections 150 (1) (c) and 152 (1) (c) of the Companies Act. Accordingly, the Board of Directors wish to confirm that they have complied with all the requirements of the Companies Act No. 07 of 2007 and have also met all the requirements under Section 07 of the Listing Rules of the Colombo Stock Exchange.
DIRECTORS’ RESPONSIBILITY IN FINANCIAL REPORTING
The Directors also have taken reasonable steps to safeguard the assets of the Company and to prevent and detect frauds and other irregularities. In this regard, the Directors have instituted an effective and comprehensive system of internal controls and an effective system of monitoring its effectiveness, internal audit being one of them. The Board has been provided additional assurance on the reliability of the Financial Statements through a process of independent and objective reviews conducted by the Audit Committee. The Report of the Audit Committee is at pages 142 to 143 of this Annual Report.
The Directors are also of the view that the Company has adequate resources to continue in business for the foreseeable future and have applied the “Going Concern” basis in preparing these Financial Statements.
The Directors are confident that they have discharged their responsibility as set out in the Statement.
Compliance report
The Directors also confirm that to the best of their knowledge, all taxes, duties and levies payable by the Company, all contributions, levies and taxes payable on behalf of and in respect of the Employees of the Company and other known statutory dues as were due and payable by the Company as at the date of the Statement of Financial Position have been paid or where necessary provided for, in arriving at the financial results for the year under review.
Further, all documents required by the Companies Act No. 07 of 2007 to be filed with the Registrar-General of Companies have been duly filed and compliance has been made with all the other legal requirements in connection with the said Companies Act and all dividend cheques have been dispatched on the due date.
By order of the Board,
Sgd.
M & A Company Secretaries (Private) Limited
23 May 2018

Naw
alok
a H
osp
ital
s P
LC
|
A
nn
ual
Rep
ort 2
017/
18
146
The Securities and Exchange Commission and the Institute of Chartered Accountants of Sri Lanka have put out the Code of Best Practice on Corporate Governance 2013 (the Code) and recommends that a Senior Independent Director (SID) who is a Non-Executive Officer of the Company, be appointed in the event the Chairman and the Chief Executive Officer is the same person of the Board. This has been observed in the Company as the Chairman is the CEO as well.
As a member of the Audit Committee and the Related Party Transactions Review Committee I have also been entrusted with the additional task, as a Senior Independent Non-Executive Director, to make my services available for advice and guidance to the Board including the Chairman, External and Internal Auditors of the Company so that at all times the principles of good governance is observed.
Sgd.
Mr Rienzie T Wijetilleke,Senior Independent Director
23 May 2018
SENIOR INDEPENDENT DIRECTOR’S STATEMENT

147
Stew
ard
ship
– C
HIE
F E
XE
CU
TIV
E O
FFIC
ER
’S A
ND
HE
AD
OF
FIN
AN
CE
ST
AT
EM
EN
T O
F R
ESP
ON
SIB
ILIT
Y
The Financial Statements of Nawaloka Hospitals PLC (the Company) and the Consolidated Financial Statements of the Company and its Subsidiaries (the Group) as at 31 March 2018 are prepared and presented in conformity with the requirements of the following:
• Sri Lanka Accounting Standards issued by The Institute of Chartered Accountants of Sri Lanka (CA Sri Lanka),
• Companies Act No. 07 of 2007
• Sri Lanka Accounting and Auditing Standards Act No. 15 of 1995,
• Listing Rules of the Colombo Stock Exchange (CSE), and
• Code of Best Practice on Corporate Governance issued by CA Sri Lanka
The formats used in the preparation of the Financial Statements and disclosures made comply with the specified formats prescribed by the CBSL. The Group presents the financial results to its shareholders on a quarterly basis.
The significant accounting policies have been consistently applied by the Group.Application of Significant Accounting Policies and estimates that involve a high degree of judgement and complexity were discussed with the Board Audit Committee(BAC) and the Company’s External Auditors. We confirm that to the best of our knowledge, the Financial Statements, Significant Accounting Policies and other financial information included in this Annual Report, fairly present in all material respects the financial condition, results of the operations and the Cash Flows of the Group during the year under review. We also confirm that the Group has adequate resources to continue in operation and have applied the Going Concern basis in preparing these Financial Statements.
We are responsible for establishing, implementing and maintaining Internal Controls and Procedures within the Company and all of its Subsidiaries. We ensure that effective Internal Controls and Procedures are in place, ensuring material information relating to the Group are made known to us for safeguarding assets, preventing and detecting fraud and/or error as well as other irregularities, which is reviewed, evaluated and updated on an ongoing basis. We have evaluated the Internal Controls and Procedures of the Group for the financial period under review and are satisfied that there were no significant deficiencies and weaknesses in the design or operation of the Internal Controls and Procedures, to the best of our knowledge. We confirm, based on our evaluations that there were no significant deficiencies and material weaknesses in the design or operation of internal controls and fraud that involves management or other employees. The Company’s Internal Audit
CHIEF EXECUTIVE OFFICER’S AND HEAD OF FINANCE STATEMENT OF RESPONSIBILITY
Department also conducts periodic reviews to ensure that the Internal Controls and Procedures are consistently followed.
The Financial Statements of the Group were audited by Messrs KPMG, Chartered Accountants and their Report is given on page 150 to 153. The BAC pre-approves the audit and non-audit services provided by Messrs KPMG, in order to ensure that the provision of such services does not impair KPMG’s independence and objectivity.
The BAC,reviewed the Internal Audit Programmes and External Audit plan, the efficiency of Internal Control Systems and procedures and also reviewed the quality of Significant Accounting Policies and their adherence to Statutory and Regulatory requirements, the details of which are given in the ‘Board Audit Committee Report’ appearing on pages 142 to 143. To ensure independence, the External Auditors and the Internal Auditors have full and free access to the members of the BAC to discuss any matter of substance. However, there are inherent limitations that should be recognised in weighing the assurances provided by any system of internal control and accounting.
It is also declared and confirmed that the Group and the Company have complied with and ensured compliance with the guidelines for the audit of listed companies where mandatory compliance is required.
We confirm that to the best of our knowledge:
• The Company and the Group have complied with all applicable laws and regulations and guidelines and there is no material litigation against the Company/Group.
• All taxes, duties, levies and all statutory payments by the Company/ Group and all contributions, levies and taxes payable on behalf of and in respect of the employees of the Company/ Group as at 31 March 2018 have been paid, or where relevant provided for.
Dr Jayantha Dharmadasa
Chairman/Chief Executive Officer
Mr Nalaka Niroshana
Head of FinanceColombo
23 May 2018


149
FINANCIAL REPORTS 2017/18Independent Auditors’ Report 150 - 153Statement of Profit or Loss and Other Comprehensive Income 155Statement of Financial Position 156 - 157Statement of Changes in Equity 158Cash Flow Statement 159Notes to the Financial Statements 160 - 173
Financial Calendar2015/16 2016/17 2017/18 2018/19
1st Quarter Results 14 August 2015 15 August 2016 14 August 2017 August 2018
2nd Quarter Results 15 November 2015 11 November 2016 15 November 2017 November 2018
3rd Quarter Results 15 February 2016 14 February 2017 14 February 2018 February 2019
4th Quarter Results 30 May 2016 30 May 2017 5 June 2018 May 2019
Annual Report June 2016 June 2017 June 2018 June 2019
Annual General Meeting 30 June 2016 30 June 2017 29 June 2018 30th June 2019

150
Naw
alok
a H
osp
ital
s P
LC
|
A
nn
ual
Rep
ort 2
017/
18
INDEPENDENT AUDITORS’ REPORT
To the Shareholders of Nawaloka Hospitals PLC
Report on the Audit of the Financial Statements
OpinionWe have audited the Financial Statements of Nawaloka Hospitals PLC (“the Company”) and the Consolidated financial statements of the Company and its subsidiaries (“the Group”), which comprise the statement of financial position as at March 31, 2018, and the statement of profit or loss and other comprehensive income, changes in equity and cash flows for the year then ended, and notes to the financial statements, including a summary of significant accounting policies as set out on pages 160 to 171 of this Annual Report.
In our opinion, the accompanying Financial Statements of the Company and the Group give a true and fair view of the financial position of the Company and the Group as at March 31 2018, and of their financial performance and cash flows for the year then ended in accordance with Sri Lanka Accounting Standards.
Basis for OpinionWe conducted our audit in accordance with Sri Lanka Auditing Standards (SLAuSs). Our responsibilities under those standards are further described in the Auditor’s Responsibilities for the Audit of the Financial Statements section of our report. We are independent of the Group in accordance with the Code of Ethics issued by CA Sri Lanka (Code of Ethics), and we have fulfilled our other ethical responsibilities in accordance with the Code of Ethics. We believe that the audit evidence we have obtained is sufficient and appropriate to provide a basis for our opinion.
Key Audit MattersKey audit matters are those matters that, in our professional judgement, were of most significance in our audit of the Company Financial Statements and the Consolidated Financial Statements of the current year. These matters were addressed in the context of our audit of the Company Financial Statements and the Consolidated Financial Statements as a whole, and in forming our opinion thereon, and we do not provide a separate opinion on these matters.
• Revenue recognition – Refer to Note 3.14 (page – 167-168) – accounting policy and Note 6 to the Financial Statements.
The Revenue of the Group for the year ended 31st March 2018 was Rs. 7,955 Mn.
M.R. Mihular FCA P.Y.S. Perera FCA C.P. Jayatilake FCAT.J.S. Rajakarier FCA W.W.J.C. Perera FCA Ms. S. Joseph FCAMs. S.M.B. Jayasekara ACA W.K.D.C Abeyrathne FCA S.T.D.L. Perera FCAG.A.U. Karunaratne FCA R.M.D.B. Rajapakse FCA Ms. B.K.D.T.N. Rodrigo FCAR.H. Rajan ACA M.N.M. Shameel ACA
Principals - S.R.I. Perera FCMA(UK), LLB, Attorney-at-Law, H.S. Goonewardene ACA Ms. C.T.K.N. Perera ACA

151
Ind
epen
den
t Aud
itor
s’ R
epor
t
Risk Description Our response
Revenue may be recognised using judgement, not in accordance with the Group’s accounting policies relevant accounting standards or in the wrong accounting period.
Our audit procedures included –
• obtaining an understanding of and testing the key controls in respect of the Group’s revenue recognition basis and allocation among Group entities.
• testing of invoices raised to patients on a sample basis, to ensure revenue is recognised and measured in accordance with the contractual terms of the contracts and the Group’s accounting policies.
• assessing the appropriateness of the recognition of revenue on a gross or net basis.
• and carrying out substantive testing in respect of revenue cut off around the year end date.
• assessing the adequacy of financial statements disclosures.
• Carrying value of inventories – Refer to Note 3.6 (page – 164) – accounting policy and Note 17 to the Financial Statements
The Group carried inventories of Rs. 556 Mn as at March 31, 2018, at the lower of cost or net realisable value.
Risk Description Our response
Valuation of inventory involves judgement and estimates due to the nature of products and stringent quality requirements.
Due to allocation and sale of inventories within Group operations based on the business model, both existence and valuation of inventories are key areas of focus.
Our audit procedures included; assessing adequacy and consistency of provisioning for inventories at the reporting date with the Group’s inventory provision policy.
• On a sample basis, comparing the carrying amounts of the Group’s inventories with net realisation value of those inventories.
• Testing the existence of inventories through physical verification as at year end and validating the cost allocation within Group entities.
• Recoverability of Trade Receivables – Refer to Note 3.8.1 (page – 165) – accounting policy and Note 17 to the Financial Statements
The Group’s trade receivables as at 31 March 2018 was Rs. 608 Mn.
Risk Description Our response
Assessment of recoverability of the Group’s trade receivables involves based on management judgement. The historical payment patterns and other information relating to the creditworthiness of customers.
Inherent subjectivity is involved in making judgements in relation to credit risk exposures to determine the recoverability of trade receivables.
Our audit procedures included –
• Testing the Group’s credit control procedures, including the controls around credit terms, and reviewing the payment history and financial information pertaining to the customers.
• Testing the receipt of cash after the year end relating to 31 March 2018 balances; and
• Testing the adequacy of the Group’s impairment provisions against trade receivables by assessing the judgements made and the historical trading experience with the relevant customers.
• Assessing the adequacy of the Group’s disclosures on page 183 about the degree of estimation involved in arriving at the impairment provision.

152
Naw
alok
a H
osp
ital
s P
LC
|
A
nn
ual
Rep
ort 2
017/
18
Other Information Management is responsible for the other information. The other information comprises the information included in the Annual Report, but does not include the Financial Statements and our auditor’s report thereon.
Our opinion on the Financial Statements does not cover the other information and we do not express any form of assurance conclusion thereon.
In connection with our audit of the financial Statements, our responsibility is to read the other information and, in doing so, consider whether the other information is materially inconsistent with the Financial Statements or our knowledge obtained in the audit or otherwise appears to be materially misstated. If, based on the work we have performed, we conclude that there is material misstatement of other information, we are required to report that fact. We have nothing to report in this regard.
Responsibilities of Management and Those Charged with Governance for the Financial StatementsManagement is responsible for the preparation of Financial Statements that give a true and fair view in accordance with Sri Lanka Accounting Standards, and for such internal control as management determines is necessary to enable the preparation of Financial Statements that are free from material misstatement, whether due to fraud or error.
In preparing the Financial Statements, Management is responsible for assessing the Group’s ability to continue as a going concern, disclosing, as applicable, matters related to going concern and using the going concern basis of accounting unless Management either intends to liquidate the Group or to cease operations, or has no realistic alternative but to do so.
Those charged with governance are responsible for overseeing the Company’s and the Group’s financial reporting process.
Auditor’s Responsibilities for the Audit of the Financial StatementsOur objectives are to obtain reasonable assurance about whether the Financial Statements as a whole are free from material misstatement, whether due to fraud or error, and to issue an Auditor’s report that includes our opinion. Reasonable assurance is a high level of assurance, but is not a guarantee that an audit conducted in accordance with SLAuSs will always detect a material misstatement when
it exists. Misstatements can arise from fraud or error and are considered material if, individually or in the aggregate, they could reasonably be expected to influence the economic decisions of users taken on the basis of these Financial Statements.
As part of an audit in accordance with SLAuSs, we exercise professional judgement and maintain professional skepticism throughout the audit. We also:
• Identify and assess the risks of material misstatement of the Financial Statements, whether due to fraud or error, design and perform audit procedures responsive to those risks, and obtain audit evidence that is sufficient and appropriate to provide a basis for our opinion. The risk of not detecting a material misstatement resulting from fraud is higher than for one resulting from error, as fraud may involve collusion, forgery, intentional omissions, misrepresentations, or the override of internal control.
• Obtain an understanding of internal control relevant to the audit in order to design audit procedures that are appropriate in the circumstances, but not for the purpose of expressing an opinion on the effectiveness of the Company and the Group’s internal control.
• Evaluate the appropriateness of accounting policies used and the reasonableness of accounting estimates and related disclosures made by Management.
• Conclude on the appropriateness of management’s use of the going concern basis of accounting and, based on the audit evidence obtained, whether a material uncertainty exists related to events or conditions that may cast significant doubt on the Group’s ability to continue as a going concern. If we conclude that a material uncertainty exists, we are required to draw attention in our auditor’s report to the related disclosures in the Financial Statements or, if such disclosures are inadequate, to modify our opinion. Our conclusions are based on the audit evidence obtained up to the date of our Auditor’s report. However, future events or conditions may cause the Group to cease to continue as a going concern.
• Evaluate the overall presentation, structure and content of the Financial Statements, including the disclosures, and whether the Financial Statements represent the underlying transactions and events in a manner that achieves fair presentation.
• Obtain sufficient appropriate audit evidence regarding the financial information of the entities or business activities within the Group to express an opinion on the consolidated Financial Statements. We are responsible for the direction, supervision and performance of the group audit. We remain solely responsible for our audit opinion.

153
Ind
epen
den
t Aud
itor
s’ R
epor
t
We communicate with those charged with governance regarding, among other matters, the planned scope and timing of the audit and significant audit findings, including any significant deficiencies in internal control that we identify during our audit.
We also provide those charged with governance with a statement that we have complied with ethical requirements in accordance with the Code of Ethics regarding independence, and to communicate with them all relationships and other matters that may reasonably be thought to bear on our independence, and where applicable, related safeguards.
From the matters communicated with those charged with governance, we determine those matters that were of most significance in the audit of the Financial Statements of the current period and are therefore the key audit matters. We describe these matters in our Auditor’s report unless law or regulation precludes public disclosure about the matter or when, in extremely rare circumstances, we determine that a matter should not be communicated in our report because the adverse consequences of doing so would reasonably be expected to outweigh the public interest benefits of such communication.
Report on Other Legal and Regulatory RequirementsAs required by Section 163 (2) of the Companies Act No. 07 of 2007, we have obtained all the information and explanations that were required for the audit and, as far as appears from our examination, proper accounting records have been kept by the Company.
CA Sri Lanka membership number of the engagement partner responsible for signing this Independent Auditor’s report is FCA 2294.
Chartered Accountants Colombo, Sri Lanka
23rd May 2018

154
Naw
alok
a H
osp
ital
s P
LC
|
A
nn
ual
Rep
ort 2
017/
18
8,750
7,000
5,250
3,500
1,750
0
20182017
Revenue (Rs. Mn)
5,000
4,000
3,000
2,000
1,000
0
20182017
Gross profit (Rs. Mn)
250
200
150
100
50
0
20182017
Profit after tax (Rs. Mn)
625
500
375
250
125
0
20182017
Profit before tax (Rs. Mn)
0.20
0.16
0.12
0.08
0.04
0
20182017
Earnings per share (Rs.)
26.2% 2018 – 7,955
2017 – 6,300
33.3% 2018 – 4,404
2017 – 3,303
24.8% 2018 – 180
2017 – 241
84.4% 2018 – 557
2017 – 302
23.5% 2018 – 0.13
2017 – 0.17

Stat
emen
t of P
rofit
or
Los
s an
d O
ther
Com
preh
ensi
ve In
com
e
STATEMENT OF PROFIT OR LOSS AND OTHER COMPREHENSIVE INCOME
Group Company
For the year ended 31 March Note 2018 Rs.
2017Rs.
2018 Rs.
2017Rs.
Revenue 6 7,955,278,613 6,299,910,436 3,568,770,483 2,568,162,863
Cost of services (3,551,349,412) (2,997,276,079) (1,532,151,922) (1,359,482,350)
Gross profit 4,403,929,201 3,302,634,357 2,036,618,561 1,208,680,513
Other income 7 198,816,074 70,375,782 534,238,431 169,209,127
Staff cost 8 (1,583,472,211) (1,299,957,507) (676,365,402) (612,960,707)
Administrative expenses (1,761,824,773) (1,282,339,261) (845,736,430) (668,654,180)
Other operating expenses (83,245,167) (136,653,014) (55,148,175) (109,139,744)
Profit from operations 8 1,174,203,124 654,060,357 993,606,985 (12,864,991)
Net finance expenses 9 (617,006,242) (392,868,166) (536,575,421) (384,731,651)
Share of profits of equity accounted investee, net of tax –
40,963,012 – –
Profit/(loss) before tax 557,196,882 302,155,203 457,031,564 (397,596,642)
Income tax expenses 10 (377,238,343) (61,280,520) (3,423,582) (39,084,200)
Profit/(loss) for the year, attributable to equity holders of the Company 179,958,539 240,874,683 453,607,982 (436,680,842)
Other comprehensive income
Acturian Gain/(Loss) from valuation of Defined Benefit plan 27 (9,863,694) 12,896,688 (5,436,979) 12,032,425
Revaluation of Property Plant and Equipments 25 (2,451,238) 341,579,922 (2,451,238) 53,536,819
Related Taxes 10 (202,793,652) (42,542,473) (4,937,085) (7,868,309)
Other comprehensive income/(loss) for the year, net of tax (215,108,584) 311,934,137 (12,825,302) 57,700,935
Total comprehensive income/(loss) for the year (35,150,043) 552,808,820 440,782,680 (378,979,907)
Earnings/(loss) per share 11 0.13 0.17 0.32 (0.31)
Notes form an integral part of these Financial Statements.
Figures in brackets indicate deductions.
155

156
Naw
alok
a H
osp
ital
s P
LC
|
A
nn
ual
Rep
ort 2
017/
18
STATEMENT OF FINANCIAL POSITION
Group Company
As at 31 March Note 2018 Rs.
2017Rs.
2018 Rs.
2017Rs.
Assets
Non-current assets
Property, plant and equipment 13 13,641,936,088 10,956,260,541 2,144,159,352 2,463,426,034
Leasehold right over land 14 219,004,788 221,999,161 46,780,317 47,707,431
Investment property 15 – – 192,417,100 192,417,100
Investment in subsidiaries 16 – – 2,016,985,376 2,016,985,376
Total non-current assets 13,860,940,876 11,178,259,702 4,400,342,145 4,720,535,941
Current assets
Inventories 17 556,576,848 392,274,375 279,254,062 177,733,926
Trade and other receivables 18 608,872,498 704,668,480 455,255,273 415,210,841
Deposits and advances 19 328,723,888 152,417,824 234,050,081 120,614,299
Receivable from related parties 20 270,598,111 644,775,455 3,960,771,974 2,420,674,454
Short-term investments 21 1,344,188,073 994,669,945 1,148,453,310 810,427,387
Cash and cash equivalents 22 177,722,754 144,348,684 65,399,058 119,151,979
3,286,682,172 3,033,154,763 6,143,183,758 4,063,812,886
Assets classified as held for sale 23 136,693,775 136,693,775 2,500,000 2,500,000
Total assets 17,284,316,823 14,348,108,240 10,546,025,903 8,786,848,827
Equity and liabilities
Capital and reserves
Stated capital 24 1,207,388,876 1,207,388,876 1,207,388,876 1,207,388,876
Revaluation reserve 25 1,083,455,968 1,291,462,692 38,201,724 47,112,401
Retained earnings/Accumulated losses 1,967,659,949 1,935,753,869 28,496,296 (280,246,462)
Total equity 4,258,504,793 4,434,605,437 1,274,086,896 974,254,815
Non-current liabilities
Debentures 26 1,494,265,886 1,488,820,927 1,494,265,886 1,488,820,927
Employee benefits 27 226,814,276 185,742,508 177,345,876 161,288,200
Deferred taxation 28 961,346,322 394,786,162 147,660,951 139,300,283
Borrowings 29 5,146,678,509 3,920,477,024 2,962,816,497 2,885,919,684
Finance leases 30 92,000,000 100,000,000 – –
Total non-current liabilities 7,921,104,993 6,089,826,621 4,782,089,210 4,675,329,094

157
Stat
emen
t of F
inan
cial
Pos
itio
n
Group Company
As at 31 March Note 2018 Rs.
2017Rs.
2018 Rs.
2017Rs.
Current liabilities
Trade and other payables 31 992,870,633 804,741,707 825,614,512 728,394,387
Unclaimed dividends 4,265,486 3,429,123 4,265,460 3,429,123
Current tax liabilities 32 16,890,277 16,310,706 – –
Payable to related parties 33 196,954,049 218,121,349 192,248,820 204,248,265
Borrowings 29 2,275,560,740 1,585,642,845 2,129,033,676 1,193,521,260
Finance leases 30 8,000,000 8,000,000 – –
Bank overdrafts 22 1,610,165,852 1,187,430,452 1,338,687,329 1,007,671,883
Total current liabilities 5,104,707,037 3,823,676,182 4,489,849,797 3,137,264,918
Total liabilities 13,025,812,030 9,913,502,803 9,271,939,007 7,812,594,012
Total equity and liabilities 17,284,316,823 14,348,108,240 10,546,025,903 8,786,848,827
Net assets per share 3.02 3.15 0.90 0.69
Notes form an integral part of these Financial Statements.Figures in brackets indicate deductions.
It is certified that the Financial Statements have been prepared and presented in compliance with the requirements of the Companies Act No. 07 of 2007.
Mr Nalaka Niroshana
Head of Finance
The Board of Directors is responsible for the preparation and presentation of these Financial Statements. Approved and signed for and on behalf of the Board of Directors,
Dr Jayantha Dharmadasa Vidya Jyothi Prof Lal Chandrasena
Chairman/Chief Executive Officer Director/General Manager
Colombo
23 May 2018

158
Naw
alok
a H
osp
ital
s P
LC
|
A
nn
ual
Rep
ort 2
017/
18
STATEMENT OF CHANGES IN EQUITY
For the year ended 31 March 2018 Stated Capital
Rs.
Revaluation Reserve
Rs.
Retained Earnings/
Accumulated losses Rs.
Total Equity
Rs.
Group
Balance as at 1 April 2016 1,207,388,876 990,872,361 1,796,636,725 3,994,897,962
Profit for the year – – 240,874,683 240,874,683
Other comprehensive income (net of tax) – 300,590,331 11,343,806 311,934,137
Total comprehensive income – 300,590,331 252,218,489 552,808,820
Transaction with the owners of the company
Dividends paid – – (113,101,345) (113,101,345)
Balance as at 31 March 2017 1,207,388,876 1,291,462,692 1,935,753,869 4,434,605,437
Balance as at 1 April 2017 1,207,388,876 1,291,462,692 1,935,753,869 4,434,605,437
Profit for the year – – 179,958,539 179,958,539
Other comprehensive income (net of tax) – (208,006,724) (7,101,860) (215,108,584)
Total comprehensive income – (208,006,724) 172,856,679 35,150,043
Transaction with the owners of the company
Dividends paid – – (140,950,599) (140,950,599)
Balance as at 31 March 2018 1,207,388,876 1,083,455,968 1,967,659,949 4,258,504,793
Company
Balance as at 1 April 2016 1,207,388,876 – 258,947,189 1,466,336,065
Loss for the year – – (436,680,842) (436,680,842)
Other comprehensive income (net of tax) 47,112,401 10,588,534 57,700,935
Total comprehensive income – 47,112,401 (426,092,308) 378,979,907
Transaction with the owners of the company
Dividends paid – – (113,101,343) (113,101,343)
Balance as at 31 March 2017 1,207,388,876 47,112,401 (280,246,462) 974,254,815
Balance as at 1 April 2017 1,207,388,876 47,112,401 (280,246,462) 974,254,815
Profit for the year – – 453,607,982 453,607,982
Other comprehensive income (net of tax) – (8,910,677) (3,914,625) (12,825,302)
Total comprehensive income – (8,910,677) 449,693,357 440,782,680
Transaction with the owners of the Company
Dividends paid – – (140,950,599) (140,950,599)
Balance as at 31 March 2018 1,207,388,876 38,201,724 28,496,296 1,274,086,896
Notes form an integral part of these Financial Statements.
Figures in brackets indicate deductions.

159
Cas
h Fl
ow S
tate
men
t
CASH FLOW STATEMENT
Group Company
For the year ended 31 March Note 2018 Rs.
2017Rs.
2018 Rs.
2017Rs.
Cash flows from operating activitiesProfit/(loss) before tax 557,196,882 302,155,203 457,031,566 (397,596,642)
Adjustments for :Depreciation and amortisation 8 643,217,539 540,272,942 343,899,211 344,323,558 Finance cost 9 769,466,865 451,644,537 668,523,522 428,507,299 Interest income 9 (147,015,664) (58,776,371) (126,503,142) (43,775,648)Share of profit of equity accounted investee net of tax – (40,963,012) – – Provision for employee benefits 27 44,775,883 38,783,188 30,555,005 28,830,776 Provision for bad and doubtful debts 8 11,051,702 1,756,074 10,540,874 1,756,074 Provision for doubtful related party receivable 8 – 21,738,120 – 21,738,120 Provision for deemed interest tax – 26,668,154 – 26,668,154 Provision for slow moving inventories 8 – 1,330,269 – 1,330,269 Dividend income 7 – – (424,999,976) (113,100,000)Impairment provision for equity accounted investee classified as held for sale – 22,500,000 – –
Operating profit before working capital changes 1,878,693,207 1,307,109,104 959,047,060 298,681,960 Changes in working capital(Increase)/decrease in inventories (164,302,473) 15,512,438 (101,520,136) (34,933,961)Decrease in debtors, deposits and advances (91,561,785) (117,741,529) (164,021,087) (68,570,420)Increase/(decrease) in related party balances 364,471,029 192,434,293 (1,452,113,887) 25,950,723 Increase in creditors and other payables 188,128,926 291,821,403 97,220,125 278,052,060
296,735,697 382,026,605 (1,620,434,985) 200,498,402
Cash generated from/(used in) operating activities 2,175,428,904 1,689,135,709 (661,387,925) 499,180,362 Interest paid (764,021,906) (446,928,117) (663,078,563) (423,790,878)Gratuity paid 27 (25,028,794) (24,381,782) (19,934,308) (21,762,585)Current tax paid 32 (12,892,264) (22,552,242) – – Net cash generated from/(used in) operating activities 1,373,485,940 1,195,273,568 (1,344,400,796) 53,626,899
Cash flows from investing activitiesPurchase of property, plant and equipment 13 (3,328,349,950) (3,142,115,491) (126,139,733) (324,315,431)Proceeds from investment in land – 500,000,000 – – Interest received 147,015,664 29,055,852 126,503,142 18,933,043 Investment in short term deposits (349,518,128) (566,783,571) (338,025,923) (489,107,906)Dividend received – – 424,999,976 113,100,000 Net cash (used in)/from investing activities (3,530,852,414) (3,179,843,210) 87,337,462 (681,390,294)
Cash flows from financing activitiesProceeds from long term borrowings 29/30 3,487,688,245 2,704,448,257 2,410,000,189 1,311,994,217 Repayments of long term borrowings and leases 29/30 (1,579,568,865) (803,022,438) (1,397,590,960) (748,397,638)Dividends paid (140,114,236) (113,101,345) (140,114,262) (113,101,343)Net cash from financing activities 1,768,005,144 1,788,324,474 872,294,967 450,495,236
Net decrease in cash & cash equivalents during the year (389,361,330) (196,245,168) (384,768,367) (177,268,159)Cash and cash equivalents at the beginning of the year (1,043,081,768) (846,836,600) (888,519,904) (711,251,745)Cash and cash equivalents at the end of the year (Note 22) (1,432,443,098) (1,043,081,768) (1,273,288,271) (888,519,904)
Analysis of cash and cash equivalents at the end of the year Cash at bank and in hand 177,722,754 144,348,684 65,399,058 119,151,979 Bank overdraft (1,610,165,852) (1,187,430,452) (1,338,687,329) (1,007,671,883)
(1,432,443,098) (1,043,081,768) (1,273,288,271) (888,519,904)
Notes form an integral part of these Financial Statements.
Figures in brackets indicate deductions.

160
Naw
alok
a H
osp
ital
s P
LC
|
A
nn
ual
Rep
ort 2
017/
18
NOTES TO THE FINANCIAL STATEMENTS
1. Reporting entity
1.1 Corporate information Nawaloka Hospitals PLC (“Company”) is a quoted public company with limited liability incorporated in Sri Lanka under the provisions of the Companies Act No. 07 of 2007 and the ordinary shares of the company are listed on the Colombo Stock Exchange.
The registered office and the principal place of business of the Company is located at No. 23, Deshamanya H K Dharmadasa Mawatha, Colombo 02.
1.2 Consolidated Financial StatementsThe Consolidated Financial Statements as at and for the year ended 31 March 2018, comprise the Company (Parent Company) and its Subsidiaries (together referred to as the “Group” and individually as “Group entities”).
The Company does not have an identifiable parent of its own. The Company is the ultimate parent of the Group.
1.3 Principal business activities, nature of operations of the Group and ownership by the Company in its subsidiariesThe principal business activities of the Company is to provide health and laboratory services.
Entity Principal business activity
Ownership as at
31 March 2018
Ownership as at
31 March 2017
New Nawaloka Hospitals (Pvt) Ltd.
Providing health care services
100% 100%
New Nawaloka Medical Centre (Pvt) Ltd.
100% 100%
Nawaloka Medicare (Pvt) Ltd. 100% 100%
Nawaloka Green Cross Laboratories (Pvt) Ltd. (incorporated on 6 April 2017)
Providing clinical laboratory services
100% 100%
There were no significant changes in the nature of principal activities of the Company and the Group during the financial year under review.
Nawaloka Metropolis Laboratories (Pvt) Ltd., which was a 50:50 Joint venture investment between Nawaloka Hospitals PLC and Metropolis Health Services (India) Private Ltd., ceased to be a joint venture w.e.f. 31 March 2017.
1.4 Number of Employees
Company 614 (2017 – 596)
Group 2,837 (2017 – 2,363)
2. Basis of Preparation
2.1 Statement of ComplianceThe consolidated Financial Statements of the Group and the separate Financial Statements of the Company, have been prepared and presented in accordance with the Sri Lanka Accounting Standards (SLFRSs and LKASs), laid down by the Institute of Chartered Accountants of Sri Lanka (CA Sri Lanka) and in compliance with the requirements of the Companies Act No. 07 of 2007 and provide appropriate disclosures as required by the Listing Rules of the CSE.
These Financial Statements, except for information on cash flows have been prepared following the accrual basis of accounting.
Details of the Group’s Significant Accounting Policies followed during the year are given in Notes 3.1 to 3.23 on pages 162 to 170.
2.2 Responsibility for Financial StatementsThe Board of Directors of the Company is responsible for the preparation and presentation of the Financial Statements of the Group and the Company as per the provisions of the Companies Act No. 07 of 2007 and Sri Lanka Accounting Standards.
The Board of Directors acknowledges their responsibility for Financial Statements as set out in the “Annual Report of the Board of Directors”, “Statement of Directors’ Responsibility” and the certification on the Statement of Financial Position on pages 136, 145 and 147, respectively.
These Financial Statements include the following :
i. a Statement of Profit or Loss and Other Comprehensive Income. Refer page 155;
ii. a Statement of Financial Position. Refer pages 156 and 157;
iii. a Statement of Changes in Equity. Refer page 158;
iv. a Statement of Cash Flows. Refer page 159;
v. Notes to the Financial Statements comprising Significant Accounting Policies and other explanatory information. Refer pages 160 to 203.
2.3 Approval of Financial Statements by the Board of DirectorsThe Financial Statements of the Group and the Company for the year ended March 31, 2018 (including comparatives for 2017), were approved and authorised for issue by the Board of Directors in accordance with Resolution of the Directors on May 23, 2018.

161
Not
es to
the
Fina
ncia
l Sta
tem
ents
2.4 Functional and presentation currencyItems included in the Financial Statements of each of the Group’s entities are measured using the currency of the primary economic environment in which the entities operate (“the functional currency”). These Financial Statements are presented in Sri Lankan Rupees, which is the Company’s functional and presentation currency. All financial information presented in Rupees has been rounded to the nearest Rupee.
2.5 Use of judgements and estimates
In preparing these Financial Statements, management has made judgements, estimates and assumptions that affect the application of the Group’s accounting policies and the reported amounts of assets, liabilities, income and expenses. Actual results may differ from these estimates.
Estimates and underlying assumptions are reviewed on an ongoing basis. Revisions to estimates are recognised prospectively.
2.5.1 Assumptions and estimation uncertaintiesInformation about assumptions and estimation uncertainties that have a significant risk of resulting in a material adjustment to the carrying amounts of assets and liabilities within the year ended 31 March 2018 is included in the following notes:
• Note 27.5 – measurement of defined benefit obligations: key actuarial assumptions;
• Note 28 – recognition of deferred tax assets: availability of future taxable profit against which tax losses carried forward can be used;
• Note 3.3.3 – measurement of the useful lifetime of property, plant and equipment
• Notes 3.12 – recognition and measurement of provisions and contingencies: key assumptions about the likelihood and magnitude of an outflow of resources; and
• Note 3.9 – identification and measurement of impairment.
2.6 Going concernThe management has made an assessment of its ability to continue as a going concern and is satisfied that it has the resources to continue in business for the foreseeable future. Furthermore, management is not aware of any material uncertainties that may cast significant doubt upon the Group’s/Company’s ability to continue as a going concern. Therefore, the Financial Statements continue to be prepared on a going concern basis.
2.7 Basis of measurementThe Financial Statements have been prepared on the historical cost basis except for the following items, which are measured on an alternative basis on each reporting date:
Items Measurement Basis
Building on lease hold land
Fair value
Net defined benefit (asset) liability
Fair value of plan assets less the present value of the defined benefit obligation, limited as explained in Note 3.1.3
2.8 Materiality and aggregationEach material class of similar item is presented separately in the Financial Statements. Items of dissimilar nature or function are presented separately, unless they are immaterial as permitted by the LKAS 1 – “Presentation of Financial Statements”.
2.9 Comparative informationThe Financial Statements for the comparative periods comprise results for the 12 month period from 1 April 2017 to 31 March 2018. In this circumstance, the comparative information for the Statement of Financial Position, Statement of Profit or loss and other Comprehensive Income, Statement of Changes in Equity and Cash Flow Statement and related notes are comparable with the current period.
The previous year figures and phrases have been rearranged wherever necessary to conform to current year’s presentation.
2.10 OffsettingFinancial assets and financial liabilities are offset and the net amount reported in the Statement of Financial Position, only when there is a legally enforceable right to offset the recognised amounts and there is an intention to settle on a net basis or to realise the assets and settle the liabilities simultaneously. Income and expenses are not offset in the Income Statement, unless required or permitted by an Accounting Standard or Interpretation and as specifically disclosed in the Significant Accounting Policies of the Company.
3. Significant Accounting PoliciesThe Group/Company has consistently applied the following accounting policies to all periods presented in these Financial Statements.

162
Naw
alok
a H
osp
ital
s P
LC
|
A
nn
ual
Rep
ort 2
017/
18
Set out below is an index of the significant accounting policies, the details of which are available on the pages that follow:
Note Reference
Note Page reference
3.1 Basis of Consolidation 162
3.2 Foreign currency translation 163
3.3 Property, Plant and Equipment 163
3.4 Leased Assets 164
3.5 Investment Property 164
3.6 Inventories 164
3.7 Assets held for sale 164 and 165
3.8 Financial Instruments 165
3.9 Impairment 166
3.10 Stated Capital 166
3.11 Revaluation Reserve 166
3.12 Provisions 167
3.13 Employee Benefits 167
3.14 Revenue Recognition 167 and 168
3.15 Expenditure Recognition 168
3.16 Income Tax Expenses 168 and 169
3.17 Related party transactions 169
3.18 Events after the reporting date 169
3.19 Earnings Per Share 169
3.20 Dividends on Ordinary Shares 169
3.21 Segmental Information 170
3.22 Cash Flow Statement 170
3.23 Fair Value Measurement 170
3.1 Basis of consolidation
3.1.1 Business combinationsThe Group accounts for business combinations using the acquisition method when control is transferred to the Group. The consideration transferred in the acquisition is generally measured at fair value, as are the identifiable net assets acquired. Any goodwill that arises is tested annually for impairment. Any gain on a bargain purchase is recognised in profit or loss immediately. Transaction costs are expensed as incurred, except if related to the issue of debt or equity securities.
The consideration transferred does not include amounts related to the settlement of pre-existing relationships. Such amounts are generally recognised in profit or loss.
3.1.2 SubsidiariesSubsidiaries are entities controlled by the Group. The Group controls an entity when it is exposed to, or has rights to, variable returns from its involvement with the entity and has the ability to affect those returns through its power over the entity. The Financial Statements of subsidiaries are included in the consolidated financial statements from the date on which control commences until the date on which control ceases.
3.1.3 Non-controlling interestsNCI are measured initially at their proportionate share of the acquiree’s identifiable net assets at the date of acquisition.
Changes in the Group’s interest in a subsidiary that do not result in a loss of control are accounted for as equity transactions.
3.1.4 Loss of controlWhen the Group loses control over a subsidiary, it derecognises the assets and liabilities of the subsidiary, and any related NCI and other components of equity. Any resulting gain or loss is recognised in profit or loss. Any interest retained in the former subsidiary is measured at fair value when control is lost.
3.1.5 Transactions eliminated on consolidationIntra-group balances and transactions, and any unrealised income and expenses arising from intra-group transactions, are eliminated. Unrealised gains arising from transactions with equity-accounted investees are eliminated against the investment to the extent of the Group’s interest in the investee. Unrealised losses are eliminated in the same way as unrealised gains, but only to the extent that there is no evidence of impairment.
3.1.6 Interests in equity-accounted investeesThe Group’s interests in equity-accounted investees comprise interests in joint venture.
A joint venture is an arrangement in which the Group has joint control, whereby the Group has rights to the net assets of the arrangement, rather than rights to its assets and obligations for its liabilities.
Interests in the joint venture are accounted for using the equity method. They are initially recognised at cost, which includes transaction costs. Subsequent to initial recognition, the consolidated Financial Statements include the Group’s share of the profit or loss and OCI of equity-accounted investees, until the date on which significant influence or joint control ceases.

163
Not
es to
the
Fina
ncia
l Sta
tem
ents
3.2 Foreign currency translationTransactions in foreign currencies are translated into the respective functional currencies of Group companies at the exchange rates at the dates of the transactions.
Monetary assets and liabilities denominated in foreign currencies are translated into the functional currency at the exchange rate at the reporting date. Non-monetary assets and liabilities that are measured at fair value in a foreign currency are translated into the functional currency at the exchange rate when the fair value was determined. Non-monetary items that are measured based on historical cost in a foreign currency are translated at the exchange rate at the date of the transaction. Foreign currency differences are generally recognised in profit or loss.
Assets and bases of valuationAssets classified as current assets on the Statement of Financial Position are cash and bank balances and those which are expected to be realised in cash during the normal operating cycle or within one year from the reporting date whichever is shorter. Assets other than the current assets are those, which the Company intends to hold beyond a period of one year from the reporting date.
3.3 Property, plant and equipment
3.3.1 Recognition and measurementItems of property, plant and equipment are measured at cost, which includes capitalised borrowing costs, less accumulated depreciation and any accumulated impairment losses.
If significant parts of an item of property, plant and equipment have different useful lives, then they are accounted for as separate items (major components) of property, plant and equipment.
Any gain or loss on disposal of an item of property, plant and equipment is recognised in profit or loss.
RevaluationThe Group applies the Revaluation Model for the entire class of building on leasehold property for measurement after initial recognition. Such properties are carried at revalued amounts, being their fair value at the date of revaluation, less any subsequent accumulated depreciation on buildings and any accumulated impairment losses charged subsequent to the date of valuation. Building on leasehold land of the Group are revalued by independent professional valuers every three-five years or more frequently if the fair values as are substantially different from carrying amounts to ensure that the carrying amounts do not differ from the fair values as at the reporting date.
On revaluation of an asset, any increase in the carrying amount is recognised in Revaluation Reserve in Equity through OCI or used to reverse a previous loss on revaluation of the same asset, which was charged to the Income Statement. In this circumstance, the increase is recognised as income only to the extent of the previous write down in value. Any decrease in the carrying amount is recognised as an expense in the Income Statement or charged to Revaluation Reserve in equity through OCI, only to the extent of any credit balance existing in the Revaluation Reserve in respect of that asset. Any balance remaining in the Revaluation Reserve in respect of an asset, is transferred directly to retained earnings on retirement or disposal of the asset.
3.3.2 Subsequent expenditureSubsequent expenditure is capitalised only if it is probable that the future economic benefits associated with the expenditure will flow to the Group.
3.3.3 DepreciationDepreciation is calculated to write off the cost of items of property, plant and equipment less their estimated residual values using the straight-line method over their estimated useful lives, and is generally recognised in profit or loss. Leased assets are depreciated over the shorter of the lease term and their useful lives unless it is reasonably certain that the Group will obtain ownership by the end of the lease term. Land is not depreciated.
The estimated useful lives of property, plant and equipment for current and comparative periods are as follows:
Category Rate
Buildings leasehold land Over the lease period
Fixtures and Fittings 10%
Plant and Machinery 20%
Hospital Equipment 10%
Medical Equipment 10%
Motor Vehicles 20%
Furniture and Fittings 10%
Computer Equipment 25%
Depreciation methods, useful lives and residual values are reviewed at each reporting date and adjusted if appropriate.

164
Naw
alok
a H
osp
ital
s P
LC
|
A
nn
ual
Rep
ort 2
017/
18
3.3.4 Capital Work-in-ProgressThese are expenses of a capital nature directly incurred in the construction of buildings, major plant and machinery and system development, awaiting capitalisation. These are stated in the Statement of Financial Position at cost less any accumulated impairment losses. Capital work-in-progress is transferred to the relevant asset when it is in the location and condition necessary for it to be capable of operating in the manner intended by the Management (i.e., available for use).
3.3.5 Borrowing CostAll borrowing costs are recognized as an expense in a period in which they are incurred except those that are directly attributable to the construction or development of property, plant and equipment which are capitalized a s a part of the cost of that asset during the period of construction or development.
3.4 Leased assetsLeased in terms of which the Group/Company assumes substantially all of the risks and rewards of ownership are classified as finance leases. On initial recognition, the leased asset is measured at an amount equal to the lower of its fair value and the present value of the minimum lease payments. Subsequent to initial recognition, the asset is accounted for in accordance with the accounting policy applicable to property, plant and equipment.
The corresponding principal amount payable to the lessor is shown as a liability. Lease payments are apportioned between the finance charges and reduction of the lease liability so as to achieve balance of the liability.
The cost of improvements to leasehold property is capitalised, disclosed as leasehold improvements, and depreciated over the unexpired period of the lease or the estimated useful life of the improvements, whichever is shorter.
Other leases are operating leases and are not recognised in the Group’s Statement of Financial Position.
Lease payments Payments made under operating leases are recognised in profit or loss on a straight-line basis over the term of the lease. Lease incentives received are recognised as an integral part of the total lease expense, over the term of the lease.
Minimum lease payments made under finance leases are apportioned between the finance expense and the reduction of the outstanding liability. The finance expense is allocated to each period during the lease term so as to produce a constant periodic rate of interest on the remaining balance of the liability.
Leasehold Right Over LandLeasehold right over land are capitalised and amortised over the lease term in accordance with the pattern of benefits provided.
3.5 Investment propertyInvestment property is property held either earn rental income or for capital appreciation or for both, but not for sale in the ordinary course of business, use in the production or supply of goods or services or for administrative purposes.
Investment property is measured at cost less accumulated depreciation and any accumulated impairment losses. When the use of a property changes such that it is reclassified as property, plant and equipment, its carrying value at the date of reclassification becomes its cost for subsequent accounting.
3.6 InventoriesInventories have been valued at lower of cost and net realisable value after making due allowance for obsolete items. The First-In First-Out (FIFO) basis is adopted to arrive at the cost of inventories.
Net realisable value is the price at which inventories can be sold in the normal course of business after allowing for cost of realisation and/or cost of conversion from their existing state to saleable condition.
3.7 Assets Held-for-sale Non-current assets, or disposal groups comprising assets and liabilities, are classified as held-for-sale if it is highly probable that they will be recovered primarily through sale rather than through continuing use.

165
Not
es to
the
Fina
ncia
l Sta
tem
ents
Such assets, or disposal groups, are generally measured at the lower of their carrying amount and fair value less costs to sell. Any impairment loss on a disposal group is allocated first to goodwill, and then to the remaining assets and liabilities on a pro rata basis, except that no loss is allocated to inventories, financial assets, deferred tax assets, employee benefit assets, investment property or biological assets, which continue to be measured in accordance with the Group’s other accounting policies. Impairment losses on initial classification as held-for-sale or held-for-distribution and subsequent gains and losses on remeasurement are recognised in profit or loss.
Once classified as held-for-sale, intangible assets and property, plant and equipment are no longer amortised or depreciated, and any equity-accounted investee is no longer equity accounted.
3.8 Financial instrumentsThe Group classifies non-derivative financial assets into the following categories: financial assets at FVTPL, held-to-maturity financial assets, loans and receivables and available-for-sale financial assets.
The Group classifies non-derivative financial liabilities into the following categories: financial liabilities at FVTPL and other financial liabilities.
3.8.1 Non-derivative financial assets and financial liabilities – recognition and derecognitionThe Group initially recognises loans and receivables and debt securities issued on the date when they are originated. All other financial assets and financial liabilities are initially recognised on the trade date when the entity becomes a party to the contractual provisions of the instrument.
The Group derecognises a financial asset when the contractual rights to the cash flows from the asset expire, or it transfers the rights to receive the contractual cash flows in a transaction in which substantially all of the risks and rewards of ownership of the financial asset are transferred, or it neither transfers nor retains substantially all of the risks and rewards of ownership and does not retain control over the transferred asset. Any interest in such derecognised financial assets that is created or retained by the Group is recognised as a separate asset or liability.
The Group derecognises a financial liability when its contractual obligations are discharged or cancelled, or expire.
Financial assets and financial liabilities are offset and the net amount presented in the statement of financial position when, and only when, the Group currently has a legally enforceable right to offset the amounts and intends either to settle them on a net basis or to realise the asset and settle the liability simultaneously.
3.8.2 Non-derivative financial assets – Measurement
Loans and receivablesThese assets are initially measured at fair value plus any directly attributable transaction costs. Subsequent to initial recognition, they are measured at amortised cost using the effective interest method.
Loans and receivables comprise cash and cash equivalents, and trade and other receivables.
Cash and cash equivalentsCash and cash equivalents comprise cash balances, placement in government securities and placements in repurchase agreements with maturities of three months or less from the acquisition date that are subject to on insignificant risk of changes in their fair value, and are used by the Company and the Group in the management of its short-term commitments.
3.8.3 Non-derivative financial liabilities – Measurement A financial liability is classified as at FVTPL if it is classified as held for trading or is designated as such on initial recognition. Directly attributable transaction costs are recognised in profit or loss as incurred. Financial liabilities at FVTPL are measured at fair value and changes therein, including any interest expense, are recognised in profit or loss.
Other non-derivative financial liabilities are initially measured at fair value less any directly attributable transaction costs. Subsequent to initial recognition, these liabilities are measured at amortised cost using the effective interest method. Other financial liabilities comprise loans and borrowings, refundable rental and other deposits, bank overdrafts, and trade and other payables.
Bank overdrafts that are repayable on demand and form an integral part of the Company’s and the Group’s cash management are included as a component of cash and cash equivalents for the statement of cash flows.

166
Naw
alok
a H
osp
ital
s P
LC
|
A
nn
ual
Rep
ort 2
017/
18
3.9 Impairment
3.9.1 Non-derivative financial assets Financial assets classified as “loans and receivables” are assessed at each reporting date to determine whether there is objective evidence that it is impaired. A financial asset is impaired if there is objective evidence of impairment as a result of one or more events that occurred after the initial recognition of the asset, and that loss event(s) had an impact on the estimated future cash flows of that asset that can be estimated reliably.
DebenturesThis represent the funds borrowed by the Group for long term funding requirements. Subsequent to initial recognition these are measured at their amortised cost using the EIR method, except when the Group designates them at fair value through profit or loss. Interest paid/payable is recognized in profit or loss.
Financial Assets Measured at Amortised CostThe Company and the Group considers evidence of impairment for financial assets measured at amortised cost (loans and receivables and held-to-maturity financial assets) on specific assets. Accordingly, all individually significant assets are assessed for specific impairment. An impairment loss in respect of a financial asset measured at amortised cost is calculated as the difference between its carrying amount and the present value of the estimated future cash flows discounted at the asset’s original effective interest rate. Losses are recognised in profit or loss and reflected in an allowance account against loans and receivables or held-to-maturity investment securities. Interest on the impaired asset continues to be recognised. When an event occurring after the impairment was recognised causes the amount of impairment loss to decrease, the decrease in impairment loss is reversed through profit or loss.
3.9.2 Non-financial assetsThe carrying amounts of the Company’s and the Group’s non-financial assets, other than inventories are reviewed at each reporting date to determine such indication exists, and then the asset’s recoverable amount is estimated. An impairment loss is recognised if the carrying amount of an asset or cash-generating unit (CGU) exceeds its recoverable amount.
The recoverable amount of an asset or CGU is the greater of its value in use and its fair value less costs to sell. In assessing value in use, the estimated future cash flows are discounted to their present value using a pre-tax discount rate that reflects current market assessments of the asset or CGU. For impairment testing, assets are grouped together into the smallest group of assets that generates cash inflows from continuing use that are largely independent of the cash inflows of other assets or CGUs.
Impairment losses are recognised in profit or loss. Impairment losses recognised in respect of CGUs are allocated to reduce the carrying amounts of the assets in the CGU (group of CGUs) on a pro rata basis.
An impairment loss is reversed only to the extent that the asset’s carrying amount does not exceed the carrying amount that would have been determined, net of depreciation or amortisation, if no impairment loss had been recognised.
3.10 Stated capitalIncremental costs directly attributable to the issue of ordinary shares are recognised as a deduction from equity. Income tax relating to transaction costs of an equity transaction is accounted for in accordance with LKAS 12.
3.11 Revaluation ReservesRevaluation reserve related to the revaluation of property, plant and equipment
Liabilities and provisionsLiabilities classified as Current Liabilities in the Statement of Financial Position are those, which will fall due for payment on demand or within one year from the reporting date.
Liabilities classified as Non-Current Liabilities in the Statement of Financial Position are those, which will fall due for payment after one year from the reporting date.

167
Not
es to
the
Fina
ncia
l Sta
tem
ents
3.12 ProvisionsA provision is recognised if, as a result of a past event, the Group has a present legal or constructive obligation that can be estimated reliably, and it is probable that an outflow of economic benefits will be required to settle the obligation. Provisions are determined by discounting the expected future cash flows at a pre-tax rate that reflects current market assessments of the time value of money and the risks specific to the liability. The unwinding of the discount is recognised as finance cost.
Contingent Liabilities and Contingent AssetsA contingent liability is a possible obligation that arises from past events whose existence will be confirmed by the occurrence or non-occurrence of one or more uncertain future events beyond the control of the Group or a present obligation that is not recognised because it is not probable that an outflow of resources will be required to settle the obligation. A contingent liability also arises in extremely rare cases where there is a liability that cannot be recognised because it cannot be measured reliably. The Group does not recognise a contingent liability but discloses its existence in the Financial Statements.
A contingent asset is a possible asset that arises from past events whose existence will be confirmed by the occurrence or non-occurrence of one or more uncertain future events beyond the control of the Group. The Group does not recognise contingent assets but discloses its existence where inflows of economic benefits are probable, but not virtually certain. In the acquisition of subsidiaries by the Group under business combinations, contingent liabilities assumed are measured initially at their fair value at the acquisition date, irrespective of the extent of any minority interest.
3.13 Employee benefits
3.13.1 Short-term benefitsShort term employee benefit obligations are measured on an undiscounted basis and are expensed as the related services are provided.
3.13.2 Defined contribution planEmployees’ Provident Fund and Employees’ Trust Fund is a post-employment benefit plan under which an entity pays fixed contribution into a separate entity and will have no legal or constructive obligation to pay further amounts.
All the employees who are eligible for Employees’ Provident Fund and Employees’ Trust Fund are covered by relevant contribution funds in line with the respective statutes. Employer’s contribution to the defined contribution plans are recognised as an expense in the Statement of Comprehensive Income when incurred.
3.13.3 Defined Benefit plan – Employee benefitsThe liability recognised in the Statement of Financial Position in respect of defined benefit plan is the present value of the defined benefit obligation at the reporting date. Benefits falling due more than 12 months after the reporting date are discounted to present value. The defined benefit obligation is calculated annually by Independent Actuaries using Projected Unit Credit (PUC) method as recommended by LKAS 19 - “Employee Benefits”.
• Actuarial gains and losses in the period in which they occur have been recognised in the Statement of Other Comprehensive Income.
• The Gratuity liability is not externally funded.
Gratuity liability is computed from the first year of service for all employees in conformity with Sri Lanka Accounting Standards 19 – “Employee Benefit”.
However, under the Payment of Gratuity Act No. 12 of 1983, the liability to an employee arises only on completion of five years of continued service.
The Company is liable to pay gratuity in terms of the relevant statute.
Statement of comprehensive income
3.14 Revenue recognitionThe Group revenue represents services provided on health care services (including laboratory services), to customers outside the Group and sales within the Group which are intended for internal consumption.
Revenue is recognised to the extent that it is probable that the economic benefits will flow to the Group and that revenue and associated costs incurred or to be incurred can be reliably measured. Revenue is measured at the fair value of the consideration received or receivable, net of trade discounts and sales taxes and after eliminating sales within the Group.
The specific criteria set on the next page are used for the purpose of recognition of revenue.

168
Naw
alok
a H
osp
ital
s P
LC
|
A
nn
ual
Rep
ort 2
017/
18
3.14.1 Rendering of services
Healthcare serviceRevenue primarily comprises fees charged for inpatient and outpatient hospital services. Services include charges for accommodation, theatre, medical professional services, equipment, radiology, laboratory and pharmaceutical goods used. Revenue is recorded and recognised during the period in which the hospital service is provided, based upon the estimated amounts due from patients and/or medical funding entities. Unbilled revenue is recorded for the service where the patients are not discharged and invoice is not raised for the service.
The service revenues are presented net of related doctor fees and diagnostic charges in cases where the Group is not the primary obligor and does not have the pricing latitude.
3.14.2 Sale of goodsPharmacy Sales are recognised when the risk and reward of ownership is passed to the customer. Revenue is measured at the fair value of the consideration received or receivable, taking into account contractually defined terms of payment and excluding taxes or duties collected on behalf of the government. Revenue is reduced for rebates and loyalty points granted upon purchase and are stated net of returns and discounts wherever applicable.
3.14.3 Dividend Income Dividend income is recognised in profit or loss on the date that the Group’s right to receive payment is established.
3.14.4 Other Income Other income is recognised on an accrual basis.
Net gains and losses of a revenue nature on the disposal of property, plant and equipment and other non-current assets including investments have been accounted for in the assets.
3.14.5 Rent Income Rental income is recognised in the profit or loss on accrual basis.
3.15 Expenditure recognition
3.15.1 Operating expensesAll expenditure incurred in the running of the business and in maintaining the property, plant and equipment in a state of efficiency has been charged to the statement of comprehensive income in arriving at the profit or loss for the year.
3.15.2 Finance income and expenseInterest income and expenses are recognised in profit or loss using the effective interest method. The effective interest rate is the rate that exactly discounts the estimated future cash receipts or payments through the expected life of the financial asset or liabilities (or, where appropriate, a shorter period) to the carrying amount of the financial asset or liabilities. When calculating the effective interest rate, the Group estimates future cash flows considering all contractual terms of the financial instrument, but not future credit losses.
The calculation of the effective interest rate includes all transaction costs and fees and points paid or received that are an integral part of the effective interest rate. Transaction costs include incremental costs that are directly attributable to the acquisition or issue of a financial asset or liability.
3.16 Income Tax ExpensesIncome tax expense comprises current and deferred tax. Income tax expense is recognised in the Income Statement, except to the extent it relates to the items recognised directly in Equity or in OCI.
3.16.1 Current taxationCurrent tax comprises the expected tax payable or receivable on the taxable income or loss for the year and any adjustment to the tax payable or receivable in respect of previous years, The amount of current tax payable or receivable is the best estimate of the tax amount expected to be paid or received that reflects uncertainty related to income taxes, if any. It is measured using the tax rates enacted or substantively enacted at the reporting date.
Provision for taxation is based on the profit for the year adjusted for taxation purposes in accordance with the provisions of the Inland Revenue Act No. 10 of 2006, as amended by subsequent legislation.

169
Not
es to
the
Fina
ncia
l Sta
tem
ents
The Company is liable for income tax at the rate of 12% on the taxable profits.
Company Tax rate
New Nawaloka Hospitals (Pvt) Ltd.
12% on the taxable profits
New Nawaloka Medical Centre (Pvt) Ltd.
Exempt from income tax for a period of ten years commencing from year of assessment 2008/09 in terms of the agreement entered into with the Board of Investment (BOI) of Sri Lanka
Nawaloka Green Cross Laboratories (Pvt) Ltd.
28% on the taxable profits
Nawaloka Medicare (Pvt) Ltd.
Exempt from income tax for a period of six year started from where profit making Financial year or after loss making 2 years whichever is earlier
Income on other sources is liable for taxation at the rate of 28% (2016/17 - 28%).
3.16.2 Deferred taxDeferred tax is provided on the balance sheet liability method for all temporary differences as at the balance sheet date between the tax bases of assets and liabilities and their carrying amounts of assets and liabilities for financial reporting purposes. The balance in the deferred taxation account represents income tax applicable to the difference between the written down values for tax purpose of the assets on which tax depreciation has been claimed and the net book value of such asset, offset by the provision for employee benefit which is deductible for tax purpose only on payment.
Deferred tax assets, including those related to temporary tax effect of income tax losses and credits available to be carried forward are recognised only to the extent that it is probable that future taxable profit will be available against which the assets can be utilised. Deferred tax assets are reviewed at each reporting date and are reduced to the extent that it is no longer probable that the related tax benefit will be realized.
3.16.3 Tax exposuresIn determining the amount of current and deferred tax, the Group takes into account the impact of uncertain tax positions and whether additional taxes and interest may be due. This assessment relies on estimates and assumptions and may involve a series of judgements about future events. New information may become available that causes the Group to change its judgement regarding the adequacy of existing tax liabilities; such changes to tax liabilities will impact tax expense in the period that such a determination is made.
3.16.4 Withholding Tax on Dividends
Distributed by Subsidiaries Dividend distributed out of taxable profit of the subsidiaries attracts a 10% deduction at source and is not available for setoff against the tax liability of the Company. Thus, the withholding tax deducted at source is added to the tax expense of the Subsidiary Companies and Joint Venture Company in the Group Financial Statements as a consolidation adjustment.
3.17 Related party transactionsDisclosure has been made in respect of the transactions in which one party has the ability to control or exercise significant influence over the financial and operating policies/decisions of the other, irrespective of whether a price is charged.
3.18 Events after the reporting dateEvents after the reporting date are those events favorable and unfavorable that occur between the reporting date and the date when the Financial Statements are authorised for issue.
3.19 Earnings per shareThe Group presents basic and diluted earnings per share (EPS) data for its ordinary shares.
Basic EPS is calculated by dividing the profit or loss attributable to ordinary shareholders of the Company by the weighted average number of ordinary shares outstanding during the period, adjusted for own shares held. Diluted EPS is determined by adjusting the profit or loss attributable to ordinary shareholders and the weighted average number of ordinary shares outstanding, adjusted for own shares held, for the effects of all dilutive potential ordinary shares, which comprise convertible notes and share options granted to employees.
3.20 Dividends on ordinary sharesDividends on ordinary shares are recognised as a liability and deducted from equity when they are approved by the Company’s shareholders. Interim dividends are deducted from equity when they are declared and are no longer at the discretion of the Company.

170
Naw
alok
a H
osp
ital
s P
LC
|
A
nn
ual
Rep
ort 2
017/
18
3.21 Segmental informationAn operating segment is a component of the Group/Company that engages in business activities from which it may earn revenues and incur expenses, including revenues and expenses that relate to transactions with any of the Group/Company’s other components. All operating segments’ operating results are reviewed regularly by the Group’s CEO to make decisions about resources to be allocated to the segment and assess its performance, and for which discrete financial information is available.
3.22 Cash Flow StatementThe Cash Flow Statement has been prepared using the Indirect Method of preparing Cash Flows in accordance with the Sri Lanka Accounting Standard (LKAS) 7 – “Cash Flow Statements”.
Cash and cash equivalents comprise short term, highly liquid investments that are readily convertible to known amounts of cash and are subject to an insignificant risk of changes in value. The cash and cash equivalents include cash in-hand, balances with banks and short term deposits with banks.
For cash flow purposes, cash and cash equivalents are presented net of bank overdrafts.
3.23 Fair value measurement“Fair value” is the price that would be received to sell an asset or paid to transfer a liability in an orderly transaction between market participants at the measurement date in the principal or, in its absence, the most advantageous market to which the Group has access at that date. The fair value of a liability reflects its non-performance risk.
A number of the Group’s accounting policies and disclosures require the measurement of fair values, for both financial and non-financial assets and liabilities.
When one is available, the Group measures the fair value of an instrument using the quoted price in an active market for that instrument. A market is regarded as active if transactions for the asset or liability take place with sufficient frequency and volume to provide pricing information on an ongoing basis.
If there is no quoted price in an active market, then the Group uses valuation techniques that maximise the use of relevant observable inputs and minimise the use of unobservable inputs. The chosen valuation technique incorporates all of the factors that market participants would take into account in pricing a transaction.
If an asset or a liability measured at fair value has a bid price and an ask price, then the Group measures assets and long positions at a bid price and liabilities and short positions at an ask price.
The best evidence of the fair value of a financial instrument on initial recognition is normally the transaction price – i.e., the fair value of the consideration given or received. If the Group determines that the fair value on initial recognition differs from the transaction price and the fair value is evidenced neither by a quoted price in an active market for an identical asset or liability nor based on a valuation technique for which any unobservable inputs are judged to be insignificant in relation to the measurement, then the financial instrument is initially measured at fair value, adjusted to defer the difference between the fair value on initial recognition and the transaction price. Subsequently, that difference is recognised in profit or loss on an appropriate basis over the life of the instrument but no later than when the valuation is wholly supported by observable market data or the transaction is closed out.
4. New Accounting StandardsA number of new standards and amendments to standards have been issued but not became effective as at Reporting date. Accordingly, these Accounting Standards have not been applied in preparing these Financial Statements.

171
Not
es to
the
Fina
ncia
l Sta
tem
ents
New or amended Standard Summary of the Requirement Possible impact on consolidated Financial Statements
SLFRS 9 – FinancialInstruments
SLFRS 9, issued in 2014, replaces the existing guidance in LKAS 39 Financial Instruments: Recognition and Measurement.
SLFRS 9 contents three principle classification categories for financial assets i,e measured at amortised cost, fair value through Other Comprehensive Income (FVOCI) and fair value through profit or loss (FVTPL). SLFRS 9 replaces the “incurred loss” model in LKAS 39 with an “expected credit loss” model.
The standard also introduces the new presentation requirements and extensive new disclosure requirements.
SLFRS 9 is effective for annual reporting periods beginning on or after 1 January 2018.
The Group is assessing the potential impact on its financial statements resulting from the application of SLFRS 9.
This standard is not expected to have a significant impact on the financial statements on adoption.
SLFRS 15 – Revenue from Contracts with Customers
SLFRS 15 establishes a comprehensive framework for determining whether, how much and when revenue is recognised. New qualitative and quantitative disclosure requirement aim to enable Financial Statements users to understand the nature, amount, timing and uncertainty of revenue and cashflows rising from contracts with customers.
Entity is apply five-step model to determine when to recognize revenue and at what amount. The model specifies the revenue is recognised when or as an entity transfers control of goods and services to a customer at the amount which the entity expect to be entitled. Depending on whether certain criteria are met, revenue is recognised.
It replaces existing revenue recognition guidance, including LKAS 18 Revenue, and LKAS 11 Construction Contacts.
SLFRS 15 is effective for annual reporting periods beginning on or after 1 January 2018
The Group is assessing the potential impact on its financial statements resulting on adoption of SLFRS 15.
SLFRS 16 – Leases SLFRS 16 eliminates the current dual accounting model for lessees which distinguishes between On-Balance Sheet finance leases and Off-Balance Sheet operating leases. Instead, there will be a single On-Balance Sheet accounting model that is similar to current finance lease accounting.
SLFRS 16 is effective for reporting periods beginning on or after 1 January 2019.
The Group is assessing the impact on its Financial Statements resulting on adoption of SLFRS 16.

172
Naw
alok
a H
osp
ital
s P
LC
|
A
nn
ual
Rep
ort 2
017/
18
5. Operating segments
5.1 Basis for segmentationThe Group has the following strategic divisions, which are its reportable segments. These divisions offer different products and services, and are managed separately because they require different technology and marketing strategies.
The following summary describes the operations of each reportable segment:
Reportable segments Operations
Hospital services Provision of hospital services to inpatient and outpatient
Pharmaceutical Sale of pharmaceuticals
Laboratories Provision of laboratories services
Radiology services Provision of radiographically services
The Group’s Chief Executive Officer reviews the internal management reports of each division at least quarterly.
Segment performance is evaluated based on operating profits or losses which in certain respect, are measured differently from operating profits or losses in the consolidated financial statements. Income taxes are managed on a Group basis and are not allocated to operating segments.
The following table presents the income, profit, asset and liability information on the Group’s strategic business divisions for the year ended March 31, 2018 and comparative figures for the year ended 31 March 2017:
Geographic allocation of Segment information Colombo Gampaha Unallocated/ eliminations Total
2018 Rs.
2017 Rs.
2018 Rs.
2017 Rs.
2018 Rs.
2017 Rs.
2018 Rs.
2017 Rs.
External operating income
Revenue 6,957,611,750 5,644,670,048 997,666,863 655,240,388 – – 7,955,278,613 6,299,910,436
Other income 190,837,329 67,497,317 7,978,745 2,878,465 198,816,074 70,375,782
Total operating income 7,148,449,080 5,712,167,365 1,005,645,608 658,118,853 – – 8,154,094,688 6,370,286,218
Depreciation and amortisation 582,080,781 459,907,276 92,474,769 80,383,748 – – 643,217,539 540,272,942
Segment profit (loss) before tax 409,600,116 239,676,447 147,596,770 62,478,754 – – 557,196,886 302,155,201
Income tax expenses (377,238,343) (61,280,520)
Net profit for the year 179,958,543 240,874,681
Segment assets 15,853,739,518 13,110,411,499 1,399,377,037 1237696742 – – 17,253,116,555 14,348,108,241
Segment liabilities 12,810,427,507 8,675,806,062 141,202,298 164,585,736 – – 12,994,611,760 9,913,502,804
Hospital services Pharmaceutical Laboratories Radiology services Unallocated/eliminations Total
2018Rs.
2017Rs.
2018Rs.
2017Rs.
2018Rs.
2017Rs.
2018Rs.
2017Rs.
2018Rs.
2017Rs.
2018Rs.
2017Rs.
External operating income
Revenue 3,773,448,526 3,249,354,339 2,350,698,896 2,056,605,350 1,151,650,626 436,562,613 679,480,565 557,388,134 – – 7,955,278,613 6,299,910,436
Other income 198,816,074 70,375,782 198,816,074 70,375,782
Total operating income 3,773,448,526 3,249,354,339 2,350,698,896 2,056,605,350 1,151,650,626 436,562,613 679,480,565 557,388,134 198,816,074 70,375,782 8,154,094,688 6,370,286,218
Depreciation and amortisation 643,217,539 540,272,942
Profit (loss) before tax 557,196,886 302,155,201
Income tax expenses (377,238,343) (61,280,520)
Net profit for the year 179,958,543 240,874,683

173
Not
es to
the
Fina
ncia
l Sta
tem
ents
5. Operating segments
5.1 Basis for segmentationThe Group has the following strategic divisions, which are its reportable segments. These divisions offer different products and services, and are managed separately because they require different technology and marketing strategies.
The following summary describes the operations of each reportable segment:
Reportable segments Operations
Hospital services Provision of hospital services to inpatient and outpatient
Pharmaceutical Sale of pharmaceuticals
Laboratories Provision of laboratories services
Radiology services Provision of radiographically services
The Group’s Chief Executive Officer reviews the internal management reports of each division at least quarterly.
Segment performance is evaluated based on operating profits or losses which in certain respect, are measured differently from operating profits or losses in the consolidated financial statements. Income taxes are managed on a Group basis and are not allocated to operating segments.
The following table presents the income, profit, asset and liability information on the Group’s strategic business divisions for the year ended March 31, 2018 and comparative figures for the year ended 31 March 2017:
Geographic allocation of Segment information Colombo Gampaha Unallocated/ eliminations Total
2018 Rs.
2017 Rs.
2018 Rs.
2017 Rs.
2018 Rs.
2017 Rs.
2018 Rs.
2017 Rs.
External operating income
Revenue 6,957,611,750 5,644,670,048 997,666,863 655,240,388 – – 7,955,278,613 6,299,910,436
Other income 190,837,329 67,497,317 7,978,745 2,878,465 198,816,074 70,375,782
Total operating income 7,148,449,080 5,712,167,365 1,005,645,608 658,118,853 – – 8,154,094,688 6,370,286,218
Depreciation and amortisation 582,080,781 459,907,276 92,474,769 80,383,748 – – 643,217,539 540,272,942
Segment profit (loss) before tax 409,600,116 239,676,447 147,596,770 62,478,754 – – 557,196,886 302,155,201
Income tax expenses (377,238,343) (61,280,520)
Net profit for the year 179,958,543 240,874,681
Segment assets 15,853,739,518 13,110,411,499 1,399,377,037 1237696742 – – 17,253,116,555 14,348,108,241
Segment liabilities 12,810,427,507 8,675,806,062 141,202,298 164,585,736 – – 12,994,611,760 9,913,502,804
Hospital services Pharmaceutical Laboratories Radiology services Unallocated/eliminations Total
2018Rs.
2017Rs.
2018Rs.
2017Rs.
2018Rs.
2017Rs.
2018Rs.
2017Rs.
2018Rs.
2017Rs.
2018Rs.
2017Rs.
External operating income
Revenue 3,773,448,526 3,249,354,339 2,350,698,896 2,056,605,350 1,151,650,626 436,562,613 679,480,565 557,388,134 – – 7,955,278,613 6,299,910,436
Other income 198,816,074 70,375,782 198,816,074 70,375,782
Total operating income 3,773,448,526 3,249,354,339 2,350,698,896 2,056,605,350 1,151,650,626 436,562,613 679,480,565 557,388,134 198,816,074 70,375,782 8,154,094,688 6,370,286,218
Depreciation and amortisation 643,217,539 540,272,942
Profit (loss) before tax 557,196,886 302,155,201
Income tax expenses (377,238,343) (61,280,520)
Net profit for the year 179,958,543 240,874,683
Geographic allocation of segment information (%)
bb
aa 2018 2017
a. Colombo 87% 90%
b. Gampaha 13% 10%
2018 2017
Operating Segments – Group’s Strategic Business Divisions (%)
d d
aa
b
b
cc 2018 2017
a. Hospital Services 47% 51%
b. Pharmaceutical 30% 33%
c. Laboratories 14% 7%
d. Radiology services 9% 9%
2018 2017

174
Naw
alok
a H
osp
ital
s P
LC
|
A
nn
ual
Rep
ort 2
017/
18
6. RevenueGroup Company
For the year ended 31 March 2018Rs.
2017Rs.
2018Rs.
2017Rs.
Hospital revenue 5,009,294,054 4,243,305,086 1,953,338,082 1,556,503,541
Pharmacy revenue 2,350,698,896 2,056,605,350 1,615,432,401 1,011,659,322
Laboratory revenue 595,285,663 – – –
7,955,278,613 6,299,910,436 3,568,770,483 2,568,162,863
7. Other Income
Dividend income – – 424,999,976 113,100,000
Sundry income 164,955,274 64,463,269 79,164,405 50,746,615
Rent income 33,860,800 5,912,513 30,074,050 5,362,512
198,816,074 70,375,782 534,238,431 169,209,127
8. Profit from OperationsThe operating profit has been arrived after charging all expenses including the following:
Group Company
For the year ended 31 March 2018Rs.
2017Rs.
2018Rs.
2017Rs.
Personnel Expenses (Note 8.1) 1,583,472,211 1,299,957,507 676,365,402 612,960,707
Emoluments paid to Directors 75,539,899 80,774,760 75,539,899 80,774,760
Auditor's remuneration - audit and audit related services
2,420,000 2,220,000 900,000 775,000
Depreciation and amortisation 643,217,539 540,272,942 343,899,211 344,323,558
Charge/(reversal) of provision for bad debts 11,051,702 1,756,074 10,540,874 1,756,074
Provision for doubtful related party receivable – 21,738,120 – 21,738,120
Provision for slow moving inventory – 1,330,269 – 1,330,269
Charity and donation 10,876,634 4,832,416 10,876,634 4,832,416
Impairment provision for equity accounted investee classified as assets held for sale
– 22,500,000 – –
8.1 Personnel expenses
Staff costs 1,386,645,170 1,143,439,575 575,827,361 521,817,172
Employees' Provident Fund 127,498,798 94,187,446 55,975,025 49,850,207
Employees' Trust Fund 31,855,205 23,547,298 14,008,012 12,462,552
Provision for employee benefits 44,775,883 38,783,188 30,555,005 28,830,776
1,583,472,211 1,299,957,507 676,365,402 612,960,707
Personnel expenses reported above also includes amounts paid to and contribution made on behalf of executive directors.

175
Not
es to
the
Fina
ncia
l Sta
tem
ents
9. Net finance expenses Finance Income
Group Company
For the year ended 31 March 2018Rs.
2017Rs.
2018Rs.
2017Rs.
Finance Income
Interest on fixed deposits 147,015,664 58,776,371 126,503,142 43,775,648
Finance Expenses Overdraft interest 125,022,192 66,382,907 108,074,992 53,962,155
Debenture interest 218,087,239 217,358,700 218,087,239 217,358,700
Lease & loan interest 416,288,962 166,105,857 333,410,935 156,059,730
Bank charges 4,623,513 1,797,073 3,505,397 1,126,714
764,021,906 451,644,537 663,078,563 428,507,299
617,006,242 392,868,166 536,575,421 384,731,651
10. Income tax expensesGroup Company
For the year ended 31 March 2018Rs.
2017Rs.
2018Rs.
2017Rs.
Amounts recognised in profit or loss
Current tax expense
Income tax on current year profit (Note 10.1) 13,471,835 18,680,733 – –
Under/(over) provision during prior year – (4,583,423) – –
13,471,835 14,097,310 – –
Deferred tax expense
(Reversal from)/transfer to deferred taxation (Note 28) (44,491,851) 47,183,210 (137,091,582) 39,084,200
Impact on rate change 408,258,359 – 146,515,164 –
363,766,508 47,183,210 3,423,582 39,084,200
377,238,343 61,280,520 3,423,582 39,084,200

176
Naw
alok
a H
osp
ital
s P
LC
|
A
nn
ual
Rep
ort 2
017/
18
10.1 Reconciliation of accounting profits and taxable profits
Group Company
For the year ended 31 March 2018Rs.
2017Rs.
2018Rs.
2017Rs.
Profit/(loss) before tax 557,196,882 302,155,201 457,031,564 (397,596,642)
Aggregate expenses disallowed for tax 686,178,107 666,803,113 450,695,117 509,316,316
Aggregate income not liable for tax (2,629,073) (59,223,342) (427,629,049) (141.554.171)
Aggregate deductible expenses for tax (1,519,914,548) (646,694,379) (353,594,491) (355,599,245)
Adjustments for tax losses 229,291,875 400,755,219 – 400,755,219
(Profit)/loss exempt from tax 224,493,595 (526,095,447) – –
Tax loss utilised during the year (44,276,100) (15,321,477) (44,276,100) (15,321,477)
Qualifying payment paid during the year (82,227,042) – (82,227,042) –
Taxable income for the year 48,113,696 122,378,890 – –
Income tax @ 12 % – 14,685,467 – –
Income tax @ 28% 13,471,835 3,995,266 – –
13,471,835 18,680,733 – –
Group Company
For the year ended 31 March 2018Rs.
2017Rs.
2018Rs.
2017Rs.
10.2 Reconciliation of tax losses Tax losses brought forward 1,080,662,309 695,228,567 1,080,662,309 695,228,567
Tax loss utilised during the year (44,276,100) (15,321,477) (44,276,100) (15,321,477)
(Profit)/loss for the year of assessment 229,291,875 400,755,219 400,755,219
Tax loss carried forward 1,265,678,084 1,080,662,309 1,036,386,209 1,080,662,309

177
Not
es to
the
Fina
ncia
l Sta
tem
ents
10.3 Amount recognised in OCIGroup Company
For the year ended 31 March 2018Rs.
2017Rs.
2018Rs.
2017Rs.
Deferred Tax Impact on Defined benefits plan actuarial (Gain)/losses 2,761,834 (1,552,882)
1,522,354 (1,443,891)
Deferred Tax Impact on revaluation reserve 686,347 (40,989,591) 686,347 (6,424,418)
Deferred Tax Impact on rate Change (206,241,833) – (7,145,786) –
(202,793,652) (42,542,473) (4,937,085) (7,868,309)
The new Inland Revenue Act No. 24 of 2017 will become effective from 1 April 2018. Consequently, as of 1 April 2018 the corporate tax rate relating to the Group (unless exempted by BOI) will be change from 12% to 28%. This change resulted in a loss of Rs. 408 Mn and Rs. 206 Mn related to the re-measurement of deferred tax assets and liabilities of the Group of the profit or loss and total comprehensive income respectively.
11. Earnings/(loss) per share The Group’s earnings/(Loss) per share is based on the profit/(loss) attributable to the ordinary shareholders and the weighted average number of ordinary shares outstanding during the year.
Group Company
As at 31 March 2018Rs.
2017Rs.
2018Rs.
2017Rs.
Profit/(loss) for the year 179,958,539 240,874,683 453,607,982 (436,680,842)
Weighted average number of ordinary shares in issue during the year 1,409,505,596 1,409,505,596 1,409,505,596 1,409,505,596
Earnings/(loss) per share 0.13 0.17 0.32 (0.31)
Diluted earnings per share There was no dilution of ordinary shares outstanding. Therefore, diluted earnings per share is the same as basic earnings/(loss) per share.

178
Naw
alok
a H
osp
ital
s P
LC
|
A
nn
ual
Rep
ort 2
017/
18
12. Classification of financial assets and financial liabilities The table below provides a reconciliation between line items in the Statement of Financial Position and categories of financial assets and financial liabilities of the Group and the Company:
Group Company
Loans and receivables Other amortised cost Total Loans and receivables Other amortised cost Total
2018Rs.
2017 Rs.
2018Rs.
2017 Rs.
2018Rs.
2017 Rs.
2018Rs.
2017 Rs.
2018Rs.
2017 Rs.
2018Rs.
2017 Rs.
Financial assets
Trade and other receivables 608,922,498 704,668,480 – – 608,922,498 704,668,480 455,255,273 415,210,841 – – 455,255,273 415,210,841
Deposits and advances 328,723,888 152,417,823 – – 328,723,888 152,417,823 234,050,081 120,614,299 – – 234,050,081 120,614,299
Receivable from related parties 270,598,111 644,775,455 – – 270,598,111 644,775,455 3,960,771,974 2,420,674,454 – – 3,960,771,974 2,420,674,454
Short term investments 1,344,188,073 994,669,945 – – 1,344,188,073 994,669,945 1,148,453,310 810,427,387 – – 1,148,453,310 810,427,387
Cash and cash equivalents 177,722,754 144,348,684 – – 177,722,754 144,348,684 65,399,058 119,151,979 – – 65,399,058 119,151,979
Total financial assets 2,730,105,324 2,640,880,387 – – 2,730,105,324 2,640,880,387 5,863,929,696 3,886,078,960 – – 5,863,929,696 3,886,078,960
Financial liabilities
Debentures – – 1,494,265,886 1,488,820,927 1,494,265,886 1,488,820,927 – – 1,494,265,886 1,488,820,927 1,494,265,886 1,488,820,927
Borrowings – – 7,422,239,249 5,506,119,869 7,422,239,249 5,506,119,869 – – 5,091,850,173 4,079,440,944 5,091,850,173 4,079,440,944
Finance leases – – 100,000,000 108,000,000 100,000,000 108,000,000 – – – – – –
Trade and other payables – – 992,870,633 804,741,707 992,870,633 804,741,707 – – 825,614,512 728,394,387 825,614,512 728,394,387
Unclaimed dividends – – 4,265,486 3,429,123 4,265,486 3,429,123 – – 4,265,460 3,429,123 4,265,460 3,429,123
Payable to related companies – – 196,954,049 218,121,349 196,954,045 218,121,349 – – 192,248,820 204,248,265 192,248,820 204,248,265
Bank overdrafts – – 1,610,165,852 1,187,430,452 1,610,165,852 1,187,430,452 – – 1,338,687,329 1,007,671,883 1,338,687,329 1,007,671,883
Total financial liabilities – – 11,815,832,151 9,308,663,427 11,815,832,151 9,308,663,427 – – 8,946,932,180 7,512,005,529 8,946,932,180 7,512,005,529
13. Property, Plant and Equipment
13.1 Group
Freehold land
Rs.
Buildingsconstructed onFreehold land
Rs.
Buildingsconstructed onleasehold land
Rs.
Work in progress
Rs.
Fixture and fittings
Rs.
Plant and machinery
Rs.
Motor vehicles
Rs.
Hospitalequipment
Rs.
Medical equipment
Rs.
Computerequipment
Rs.
Furniture fittings
Rs.
Total 2018
Rs.
Total 2017
Rs.
Cost/ Valuation
Balance as at 1 April 252,102,750 632,262,542 2,886,104,994 4,503,591,631 455,383,111 116,957,355 486,399,992 495,099,873 4,140,274,496 186,784,867 128,157,911 14,283,109,522 11,135,775,747
Additions – 31,651,561 44,080,708 2,300,516,023 62,760,149 3,400,000 40,092,371 74,585,270 649,016,357 71,873,129 50,374,382 3,328,349,950 3,142,115,491
Transfers – – 5,618,064,200 (5,738,665,691) 20,019,610 – 32,998,918 150,000 8,181,332 59,251,631 – –
Revaluation – – (2,451,237) – – (2,451,237) 341,579,422
Transfer of accumulated depreciation on revalued assets balance as at 31 March 2018 – – – – – – – – – – – – (336,361,138)
Balance as at 31 March 252,102,750 663,914,103 8,545,798,665 1,065,441,963 538,162,870 120,357,355 526,492,363 602,684,061 4,789,440,853 266,839,328 237,783,924 17,609,008,235 14,283,109,522
Accumulated Depreciation
Balance as at 1 April – 25,184,227 – – 237,127,953 76,054,681 273,821,365 235,841,027 2,290,318,428 128,464,799 60,036,501 3,326,848,981 3,125,913,468
Charge for the year – 10,879,126 106,198,041 – 38,773,890 11,409,104 49,049,294 46,413,132 321,712,399 36,689,609 19,098,571 640,223,166 537,296,651
Transfer of accumulated depreciation on assets revalued – – – – – – – – – – – – (336,361,138)
Balance as at 31 March – 36,063,353 106,198,041 – 275,901,843 87,463,785 322,870,659 282,254,159 2,612,030,827 165,154,408 79,135,072 3,967,072,147 3,326,848,981
Carrying Value – – – – – – – – – – – – –
As at 31 March 2018 252,102,750 627,850,750 8,439,600,624 1,065,441,963 262,261,027 32,893,570 203,621,704 320,429,902 2,177,410,026 101,684,920 158,648,852 13,641,936,088 –
As at 31 March 2017 252,102,750 607,078,315 2,886,104,994 4,503,591,631 218,255,158 40,902,674 212,578,627 259,258,846 1,849,956,068 58,320,068 68,121,410 – 10,956,260,541

179
Not
es to
the
Fina
ncia
l Sta
tem
ents
12. Classification of financial assets and financial liabilities The table below provides a reconciliation between line items in the Statement of Financial Position and categories of financial assets and financial liabilities of the Group and the Company:
Group Company
Loans and receivables Other amortised cost Total Loans and receivables Other amortised cost Total
2018Rs.
2017 Rs.
2018Rs.
2017 Rs.
2018Rs.
2017 Rs.
2018Rs.
2017 Rs.
2018Rs.
2017 Rs.
2018Rs.
2017 Rs.
Financial assets
Trade and other receivables 608,922,498 704,668,480 – – 608,922,498 704,668,480 455,255,273 415,210,841 – – 455,255,273 415,210,841
Deposits and advances 328,723,888 152,417,823 – – 328,723,888 152,417,823 234,050,081 120,614,299 – – 234,050,081 120,614,299
Receivable from related parties 270,598,111 644,775,455 – – 270,598,111 644,775,455 3,960,771,974 2,420,674,454 – – 3,960,771,974 2,420,674,454
Short term investments 1,344,188,073 994,669,945 – – 1,344,188,073 994,669,945 1,148,453,310 810,427,387 – – 1,148,453,310 810,427,387
Cash and cash equivalents 177,722,754 144,348,684 – – 177,722,754 144,348,684 65,399,058 119,151,979 – – 65,399,058 119,151,979
Total financial assets 2,730,105,324 2,640,880,387 – – 2,730,105,324 2,640,880,387 5,863,929,696 3,886,078,960 – – 5,863,929,696 3,886,078,960
Financial liabilities
Debentures – – 1,494,265,886 1,488,820,927 1,494,265,886 1,488,820,927 – – 1,494,265,886 1,488,820,927 1,494,265,886 1,488,820,927
Borrowings – – 7,422,239,249 5,506,119,869 7,422,239,249 5,506,119,869 – – 5,091,850,173 4,079,440,944 5,091,850,173 4,079,440,944
Finance leases – – 100,000,000 108,000,000 100,000,000 108,000,000 – – – – – –
Trade and other payables – – 992,870,633 804,741,707 992,870,633 804,741,707 – – 825,614,512 728,394,387 825,614,512 728,394,387
Unclaimed dividends – – 4,265,486 3,429,123 4,265,486 3,429,123 – – 4,265,460 3,429,123 4,265,460 3,429,123
Payable to related companies – – 196,954,049 218,121,349 196,954,045 218,121,349 – – 192,248,820 204,248,265 192,248,820 204,248,265
Bank overdrafts – – 1,610,165,852 1,187,430,452 1,610,165,852 1,187,430,452 – – 1,338,687,329 1,007,671,883 1,338,687,329 1,007,671,883
Total financial liabilities – – 11,815,832,151 9,308,663,427 11,815,832,151 9,308,663,427 – – 8,946,932,180 7,512,005,529 8,946,932,180 7,512,005,529
13. Property, Plant and Equipment
13.1 Group
Freehold land
Rs.
Buildingsconstructed onFreehold land
Rs.
Buildingsconstructed onleasehold land
Rs.
Work in progress
Rs.
Fixture and fittings
Rs.
Plant and machinery
Rs.
Motor vehicles
Rs.
Hospitalequipment
Rs.
Medical equipment
Rs.
Computerequipment
Rs.
Furniture fittings
Rs.
Total 2018
Rs.
Total 2017
Rs.
Cost/ Valuation
Balance as at 1 April 252,102,750 632,262,542 2,886,104,994 4,503,591,631 455,383,111 116,957,355 486,399,992 495,099,873 4,140,274,496 186,784,867 128,157,911 14,283,109,522 11,135,775,747
Additions – 31,651,561 44,080,708 2,300,516,023 62,760,149 3,400,000 40,092,371 74,585,270 649,016,357 71,873,129 50,374,382 3,328,349,950 3,142,115,491
Transfers – – 5,618,064,200 (5,738,665,691) 20,019,610 – 32,998,918 150,000 8,181,332 59,251,631 – –
Revaluation – – (2,451,237) – – (2,451,237) 341,579,422
Transfer of accumulated depreciation on revalued assets balance as at 31 March 2018 – – – – – – – – – – – – (336,361,138)
Balance as at 31 March 252,102,750 663,914,103 8,545,798,665 1,065,441,963 538,162,870 120,357,355 526,492,363 602,684,061 4,789,440,853 266,839,328 237,783,924 17,609,008,235 14,283,109,522
Accumulated Depreciation
Balance as at 1 April – 25,184,227 – – 237,127,953 76,054,681 273,821,365 235,841,027 2,290,318,428 128,464,799 60,036,501 3,326,848,981 3,125,913,468
Charge for the year – 10,879,126 106,198,041 – 38,773,890 11,409,104 49,049,294 46,413,132 321,712,399 36,689,609 19,098,571 640,223,166 537,296,651
Transfer of accumulated depreciation on assets revalued – – – – – – – – – – – – (336,361,138)
Balance as at 31 March – 36,063,353 106,198,041 – 275,901,843 87,463,785 322,870,659 282,254,159 2,612,030,827 165,154,408 79,135,072 3,967,072,147 3,326,848,981
Carrying Value – – – – – – – – – – – – –
As at 31 March 2018 252,102,750 627,850,750 8,439,600,624 1,065,441,963 262,261,027 32,893,570 203,621,704 320,429,902 2,177,410,026 101,684,920 158,648,852 13,641,936,088 –
As at 31 March 2017 252,102,750 607,078,315 2,886,104,994 4,503,591,631 218,255,158 40,902,674 212,578,627 259,258,846 1,849,956,068 58,320,068 68,121,410 – 10,956,260,541

180
Naw
alok
a H
osp
ital
s P
LC
|
A
nn
ual
Rep
ort 2
017/
18
13.1.1 The buildings constructed on leasehold lands of the Group were revalued at Rs. 3,494 Mn. By Mr P B Kalugalagedara, Chartered valuer in 31 March 2017 and the value of these assets has been reflected in the Financial Statements at the revalued amounts.
13.1.2 Freehold land reflects a land extent of 20.2 perches is situated at No. 15, Nelson lane, Kollupitiya, Colombo 03 and a land extent of 1019.1 perches is situated in No. 169, Colombo Road, Negombo.
13.1.3 There were no restriction to the title of property, plant and equipment of the Company and Group, as at the reporting date. Further no assets were pledged under security.
13.1.4 Details of fully depreciated assets in property, plant and equipment are as follows:
Group Company
As at 31 March 2018 2017 2018 2017
Fixture and fittings 106,930,449 82,348,791 26,677,890 2,064,875
Plant and machinery 54,001,945 62,678,495 11,332,408 13,564,726
Motor vehicles 186,571,685 154,126,887 132,587,947 125,458,325
Hospital equipment 81,327,021 82,564,782 52,232,890 54,622,546
Medical equipment 1,208,163,073 1,057,835,421 469,926,840 265,845,234
Computer equipment 95,939,177 50,364,785 78,419,427 31,658,792
Furniture fittings 14,454,191 11,064,879 13,489,092 9,264,475
1,747,387,541 1,500,984,040 784,666,494 502,478,973
13.2 Company
Freehold land
Rs.
Work in progress
Rs.
Buildingsconstructed onleasehold land
Rs.
Fixture and fittings
Rs.
Plant and machinery
Rs.
Motor vehicles
Rs.
Hospitalequipment
Rs.
Medical equipment
Rs.
Computerequipment
Rs.
Furniture fittings
Rs.
Total 2018
Rs.
Total 2017
Rs.
Cost
Balance as at 1 April 42,188,000 99,983,078 616,426,238 200,997,178 11,332,408 400,099,655 322,214,923 2,497,010,993 122,235,010 75,819,510 4,388,306,993 4,082,531,947
Additions – – 4,473,214 4,294,637 – 38,376,304 5,588,923 37,198,051 5,349,453 30,859,151 126,139,733 324,315,431
Transfers – (99,983,078) – – – – – – – – (99,983,078) 53,536,819
Adjustment to revaluation – – (2,451,238) – – – – – – – (2,451,238) –
Transfer of accumulated depreciation on assets revalued – – – – – – – – – – – (72,077,204)
Balance as at 31 March 42,188,000 – 618,448,214 205,291,815 11,332,408 438,475,959 327,803,846 2,534,209,044 127,584,463 106,678,661 4,412,012,410 4,388,306,993
Accumulated Depreciation
Balance as at 1 April – – – 98,653,446 11,332,408 208,572,859 155,002,120 1,319,060,776 93,315,273 38,944,077 1,924,880,959 1,653,544,370
Charge for the year – – 21,668,123 17,611,898 – 46,276,850 27,175,230 208,007,360 14,511,992 7,720,644 342,972,097 343,413,793
Transfer of accumulated depreciation on assets revalued – – – – – – – – – – – (72,077,204)
Balance as at 31 March – – 21,668,123 116,265,344 11,332,408 254,849,709 182,177,350 1,527,068,136 107,827,265 46,664,721 2,267,853,056 1,924,880,959
Carrying Value `
As at 31 March 2018 42,188,000 – 596,780,091 89,026,471 – 183,626,252 145,626,496 1,007,140,908 19,757,198 60,013,940 2,144,159,354 –
As at 31 March 2017 42,188,000 99,983,078 616,426,238 102,343,732 – 191,526,796 167,212,803 1,177,950,217 28,919,737 36,875,433 – 2,463,426,034
13.2.1 The buildings constructed on leasehold lands of the Company were revalued By Mr P B Kalugalagedara, Chartered valuer on 31 March 2017.
13.2.2 Freehold land with a land extent of 20.2 perches is situated at No. 15, Nelson lane, Kollupitiya, Colombo 03.

181
Not
es to
the
Fina
ncia
l Sta
tem
ents
13.1.1 The buildings constructed on leasehold lands of the Group were revalued at Rs. 3,494 Mn. By Mr P B Kalugalagedara, Chartered valuer in 31 March 2017 and the value of these assets has been reflected in the Financial Statements at the revalued amounts.
13.1.2 Freehold land reflects a land extent of 20.2 perches is situated at No. 15, Nelson lane, Kollupitiya, Colombo 03 and a land extent of 1019.1 perches is situated in No. 169, Colombo Road, Negombo.
13.1.3 There were no restriction to the title of property, plant and equipment of the Company and Group, as at the reporting date. Further no assets were pledged under security.
13.1.4 Details of fully depreciated assets in property, plant and equipment are as follows:
Group Company
As at 31 March 2018 2017 2018 2017
Fixture and fittings 106,930,449 82,348,791 26,677,890 2,064,875
Plant and machinery 54,001,945 62,678,495 11,332,408 13,564,726
Motor vehicles 186,571,685 154,126,887 132,587,947 125,458,325
Hospital equipment 81,327,021 82,564,782 52,232,890 54,622,546
Medical equipment 1,208,163,073 1,057,835,421 469,926,840 265,845,234
Computer equipment 95,939,177 50,364,785 78,419,427 31,658,792
Furniture fittings 14,454,191 11,064,879 13,489,092 9,264,475
1,747,387,541 1,500,984,040 784,666,494 502,478,973
13.2 Company
Freehold land
Rs.
Work in progress
Rs.
Buildingsconstructed onleasehold land
Rs.
Fixture and fittings
Rs.
Plant and machinery
Rs.
Motor vehicles
Rs.
Hospitalequipment
Rs.
Medical equipment
Rs.
Computerequipment
Rs.
Furniture fittings
Rs.
Total 2018
Rs.
Total 2017
Rs.
Cost
Balance as at 1 April 42,188,000 99,983,078 616,426,238 200,997,178 11,332,408 400,099,655 322,214,923 2,497,010,993 122,235,010 75,819,510 4,388,306,993 4,082,531,947
Additions – – 4,473,214 4,294,637 – 38,376,304 5,588,923 37,198,051 5,349,453 30,859,151 126,139,733 324,315,431
Transfers – (99,983,078) – – – – – – – – (99,983,078) 53,536,819
Adjustment to revaluation – – (2,451,238) – – – – – – – (2,451,238) –
Transfer of accumulated depreciation on assets revalued – – – – – – – – – – – (72,077,204)
Balance as at 31 March 42,188,000 – 618,448,214 205,291,815 11,332,408 438,475,959 327,803,846 2,534,209,044 127,584,463 106,678,661 4,412,012,410 4,388,306,993
Accumulated Depreciation
Balance as at 1 April – – – 98,653,446 11,332,408 208,572,859 155,002,120 1,319,060,776 93,315,273 38,944,077 1,924,880,959 1,653,544,370
Charge for the year – – 21,668,123 17,611,898 – 46,276,850 27,175,230 208,007,360 14,511,992 7,720,644 342,972,097 343,413,793
Transfer of accumulated depreciation on assets revalued – – – – – – – – – – – (72,077,204)
Balance as at 31 March – – 21,668,123 116,265,344 11,332,408 254,849,709 182,177,350 1,527,068,136 107,827,265 46,664,721 2,267,853,056 1,924,880,959
Carrying Value `
As at 31 March 2018 42,188,000 – 596,780,091 89,026,471 – 183,626,252 145,626,496 1,007,140,908 19,757,198 60,013,940 2,144,159,354 –
As at 31 March 2017 42,188,000 99,983,078 616,426,238 102,343,732 – 191,526,796 167,212,803 1,177,950,217 28,919,737 36,875,433 – 2,463,426,034
13.2.1 The buildings constructed on leasehold lands of the Company were revalued By Mr P B Kalugalagedara, Chartered valuer on 31 March 2017.
13.2.2 Freehold land with a land extent of 20.2 perches is situated at No. 15, Nelson lane, Kollupitiya, Colombo 03.

182
Naw
alok
a H
osp
ital
s P
LC
|
A
nn
ual
Rep
ort 2
017/
18
13.3 Borrowing costs amounting to Rs. 372 Mn. and Rs. 203 Mn. relating to the Group and Company respectively were capitalised during the year.
13.4 Valuation techniques and sensitivity of the fair value measurement of building constructed on leasehold building Valuation techniques and sensitivity of the fair value measurement of the buildings constructed on leasehold land of the Group. Description of the above valuation techniques together with narrative descriptions on sensitivity of the fair value measurement to changes in significant unobservable inputs are tabulated below:
Significant unobservable valuation inputs Sensitivity of the fair value measurement to inputs
Valuation technique
Market comparable method
This method considers the selling price of a similar property within a reasonably recent period of time in determining the fair value of the property being revalued. This involves evaluation of recent active market prices of similar assets, making appropriate adjustments for differences in size, nature, location, condition of specific property. In this process, outlier transactions, indicative of particularly motivated buyers or sellers are too compensated for since the price may not adequately reflect the fair market value.
Price per square foot for building Estimated fair value would increase (decrease) if;Price per square foot would increase (decrease)Depreciation rate for building would decrease (increase)
Depreciation rate for building
Investment method
This method involves the capitalisation of the expected rental income at an appropriate rate of years purchased currently characterised by the real estate market.
Gross annual rentals Estimated fair value would increase (decrease) if;Gross Annual Rentals would increase (Decrease) Years purchase would increase (decrease)Void purchase would decrease (increase)
Years purchase(present value of 1 unit per period)Void period
13.5 Title restriction on property, plant and equipmentThere were no restriction existed on the title of the property, plant and equipment of the Group as at the reporting date.
13.6 Property, plant and equipment pledged as security for liabilities There were no items of property, plant and equipment pledged as securities for liabilities as at the reporting date.
14. Leasehold right over land Group Company
As at 31 March 2018Rs.
2017Rs.
2018Rs.
2017Rs.
Balance as at beginning of the year 221,999,161 224,975,452 47,707,431 48,617,196
Amortisation for the year (2,994,373) (2,976,291) (927,114) (909,765)
Balance as at the end of the year 219,004,788 221,999,161 46,780,317 47,707,431
14.1 Remaining leasehold periods for the lease lands as at 31 March 2018 are as follows:
Nawaloka Hospitals PLC 53 years
New Nawaloka Hospitals ( Pvt ) Ltd. 74 years
New Nawaloka Medical Center ( Pvt ) Ltd. 85 years
14.2 The leasehold properties with a land extent of 511.80 perches are located in No. 23, Deshamanya H K Dharmadasa Mawatha, Colombo 2.

183
Not
es to
the
Fina
ncia
l Sta
tem
ents
15. Investment property
Company
As at 31 March 2018Rs.
2017Rs.
Investment property – Land 192,417,100 192,417,100
192,417,100 192,417,100
15.1 Investment property reflects lands leased out to Nawaloka Medicare (Pvt) Ltd. by Nawaloka Hospitals PLC on a 99 year lease agreement. Nawaloka Medicare (Pvt) Ltd. commenced its operations during 2014/15.
15.2 The Company has earned rental income of Rs. 1,917,410/- for the year ended 31 March 2018. (2017 – Rs. 1,917,410/-).
15.3 During the year, Director’s valuation was carried out for the investment properties and market value at the investment property has not changed materially over the year.
15.4 No investment properties of the Company were pledged as security for liability as at the reporting date.
15.5 There were no restrictions to the title of the investment properties of the Company as at the reporting date.
16. Investment in subsidiaries
Company
As at 31 March 2018Rs.
2017Rs.
New Nawaloka Hospitals (Pvt) Ltd. 245,933,056 245,933,056
Nawaloka Medicare (Pvt) Ltd. 1,071,052,320 1,071,052,320
New Nawaloka Medical Centre (Pvt) Ltd. 700,000,000 700,000,000
2,016,985,376 2,016,985,376
Assessment of ImpairmentThe Board of Directors had assessed the potential impairment loss of investment in Subsidiary as at 31 March 2018. Based on the assessment, no impairment provision has been made in the Financial Statements as at the reporting date in respect of Investment in Subsidiary based on the internal assessment carried out by the Directors.
17. InventoriesGroup Company
As at 31 March 2018Rs.
2017Rs.
2018Rs.
2017Rs.
Pharmaceuticals items 514,456,688 377,406,217 274,929,872 174,455,155
General stocks 21,541,919 18,198,427 7,654,459 6,609,040
Regent stock 23,908,510 – – –
559,907,117 395,604,644 282,584,331 181,064,195
Provision for slow moving inventories (3,330,269) (3,330,269) (3,330,269) (3,330,269)
556,576,848 392,274,375 279,254,062 177,733,926

184
Naw
alok
a H
osp
ital
s P
LC
|
A
nn
ual
Rep
ort 2
017/
18
18. Trade and other receivablesGroup Company
As at 31 March 2018Rs.
2017Rs.
2018Rs.
2017Rs.
Trade receivables 583,311,673 645,592,369 457,806,922 384,992,389
Provision for bad and doubtful debts (18.1) (58,975,877) (47,924,175) (51,684,302) (41,143,428)
524,335,796 597,668,194 406,122,620 343,848,961
ESC recoverable 79,018,606 51,272,284 44,422,192 29,009,049
Other debtors 5,518,096 55,728,002 4,710,461 42,352,831
608,872,498 704,668,480 455,255,273 415,210,841
18.1 Provision for bad and doubtful debts
Group Company
As at 31 March 2018Rs.
2017Rs.
2018Rs.
2017Rs.
Balance at the beginning of the year 47,924,175 46,168,101 41,143,428 39,387,355
Provision for the yar 11,051,702 1,756,074 10,540,874 1,756,073
Balance at the end of the year 58,975,877 47,924,175 51,684,302 41,143,428
19. Deposits and advancesGroup Company
As at 31 March 2018Rs.
2017Rs.
2018Rs.
2017Rs.
Import control 61,326,157 1,429,365 17,413,178 937,594
Staff loans 17,603,291 16,242,191 17,032,566 17,015,784
Pre-payments 26,233,329 33,716,605 15,226,516 33,716,605
Other deposit and advances 223,561,111 101,029,663 184,377,821 68,944,316
328,723,888 152,417,824 234,050,081 120,614,299

185
Not
es to
the
Fina
ncia
l Sta
tem
ents
20. Receivables from related partiesGroup Company
As at 31 March 2018Rs.
2017Rs.
2018Rs.
2017Rs.
Battaramulla Medical Centre 7,295,137 323,860 8,883,270 1,831,048
Bernards Philknit (Ceylon) (Pvt) Ltd. 25,200,000 – 10,200,000 –
Dehiwala Medical Centre – 10,848 – 10,847
East West Marketing (Pvt) Ltd. 21,125,502 21,764,176 1,513,221 2,151,894
Ja-Ela Medical Centre 192,599 189,936 192,599 189,936
Kandana Medical Centre 1,467,889 223,157 1,467,889 223,157
Kiribathgoda Medical Centre 44,144,768 4,734,256 48,954,409 8,252,397
Karapitiya Medical Centre 9,849,064 9,789,063 9,849,064 9,789,062
Panadura Medical Centre 48,995,778 44,310,391 48,995,778 44,310,391
Sasiri Polysacks (Pvt) Ltd. – 3,400,000 – 3,400,000
Kottawa Medical Centre 1,410,600 1,024,808 1,464,632 1,042,136
Moratuwa Medical Centre – 3,190 – 3,190
Mount Lavinia Medical Centre 1,982 403,848 1,982 403,848
Nawaloka Aviation (Pvt) Ltd. 814,978 150,000 814,978 150,000
Nawaloka College of Higher Studies (Pvt) Ltd. 76,508,396 71,693,700 76,508,396 71,693,700
Nawaloka Construction Company (Pvt) Ltd. 19,039,790 483,784,789 – 12,207,543
Nawaloka Medicare (Pvt) Ltd. – – 16,961,202 8,436,210
Sarjah Polysacks (Pvt) Ltd. 22,429,200 22,429,200 22,429,200 22,429,200
New Nawaloka Hospitals (Pvt) Ltd. – – 721,317,462 413,177,741
New Nawaloka Medical Centre (Pvt) Ltd. – – 2,999,095,464 1,840,431,921
Nawaloka Care (Pvt) Ltd. 7,862,832 2,278,353 7,862,832 2,278,353
M Branch (Pvt) Ltd. 4,997,716 – 4,997,716 –
Nawaloaka Research and Educational Centre 1,000,000 – 1,000,000 –
292,336,231 666,513,575 3,982,510,094 2,442,412,574
Provision for doubtful receivables (21,738,120) (21,738,120) (21,738,120) (21,738,120)
270,598,111 644,775,455 3,960,771,974 2,420,674,454
21. Short-term investmentsGroup Company
As at 31 March 2018Rs.
2017Rs.
2018Rs.
2017Rs.
Fixed deposits 1,344,188,073 994,669,945 1,148,453,310 810,427,387
Short term investment allocation
Hatton National Bank PLC 564,682,630 474,669,945 418,402,867 335,427,387
DFCC Bank PLC 251,362,943 225,000,000 251,362,943 225,000,000
Commercial Bank PLC 328,142,500 295,000,000 278,687,500 250,000,000
Sampath Bank PLC 200,000,000 – 200,000,000 –
1,344,188,073 994,669,945 1,148,453,310 810,427,387

186
Naw
alok
a H
osp
ital
s P
LC
|
A
nn
ual
Rep
ort 2
017/
18
22. Cash and cash equivalents
Group Company
As at 31 March 2018Rs.
2017Rs.
2018Rs.
2017Rs.
Cash at bank 148,207,238 139,857,301 35,883,542 114,660,596
Cash in hand 29,515,516 4,491,383 29,515,516 4,491,383
Cash and cash equivalents in the Statement of Financial Position 177,722,754 144,348,684 65,399,058 119,151,979
Bank overdrafts used for cash management purposes (1,610,165,852) (1,187,430,452) (1,338,687,329) (1,007,671,883)
Cash and cash equivalents in the Statement of Cash Flows (1,432,443,098) (1,043,081,768) (1,273,288,271) (888,519,904)
Bank overdraftNawaloka Hospitals PLC Balance as at
31.03.2018Rs.
Balance as at31.03.2017
Rs.
LimitRs.
Interestrate
%
Hatton National Bank (929,061,798) (879,945,018) 540,000,000 AWPLR+1.5% Corporate guarantee of New Nawaloka Hospitals (Pvt) Ltd. for Rs. 75 Mn.
DFCC Bank – (88,875,523) 90,000,000 AWPLR+0.75% Joint and several guarantees of Directors – Mr H K J Dharmadasa, Mr Ugitha Harshith Dharmadasa and Mr Anisha Givantha Dharmadasa
Sampath Bank (364,510,932) (38,851,342) 230,000,000 AWPLR+1.5% Overdraft Agreement for Rs. 50,000,000/-.
Joint and Several Guarantee of Mr H K J Dharmadasa, Mr U H Dharmadasa and Mr A G Dharmadasa – Directors of the Company for Rs. 50,000,000/-.
New Nawaloka Hospitals (Pvt) Ltd.
Hatton National Bank (163,050,712) (90,200,217) 150,000,000 AWPLR+1.25% Existing Primary Concurrent Mortgage Bond for Rs. 390 Mn. (HNB – Rs. 260 Mn., Seylan – Rs. 130 Mn.) Over Leasehold Nawaloka Hospital premises.
Nawaloka Medicare (Pvt) Ltd.
(73,869,889) (89,558,352)
Nawaloka Green Cross Laboratories (Pvt) Ltd.
(34,557,922) – –
23. Assets held for saleGroup Company
As at 31 March 2018Rs.
2017Rs.
2018Rs.
2017Rs.
Assets held for sale 136,693,775 136,693,775 2,500,000 2,500,000
136,693,775 136,693,775 2,500,000 2,500,000
Nawaloka Hospitals PLC signed a Memorandum of understanding (MOU) with Metropolis Healthcare Ltd. (JV Partner) on 31 March 2017 to dispose 250,000 ordinary shares of Nawaloka Metropolis Laboratories (Pvt) Ltd. held by Nawaloka Hospitals PLC to Nawaloka Metropolis Laboratories (Pvt) Ltd. for a consideration of Rs. 136,693,775.
The Group has assessed the recoverability of asset held for sale as at 31 March 2018. Based on the internal assessment, the Directors are of the view that there is no impairment on asset held for sale as at 31 March 2018.

187
Not
es to
the
Fina
ncia
l Sta
tem
ents
24. Stated capitalGroup Company
As at 31 March 2018Rs.
2017Rs.
2018Rs.
2017Rs.
1,409,505,596 ordinary shares 1,207,388,876 1,207,388,876 1,207,388,876 1,207,388,876
25. Revaluation reserveGroup Company
As at 31 March 2018Rs.
2017Rs.
2018Rs.
2017Rs.
Balance as at 1 April 1,291,462,692 990,872,361 47,112,401 –
Adjustments made during the year (2,451,238) 341,579,922 (2,451,238) 53,536,819
Deferred tax impact on revaluation gain 686,347 (40,989,591) 686,347 (6,424,418)
Deferred tax impact on rate change (206,241,833) – (7,145,786) –
Balance as at 31 March 1,083,455,968 1,291,462,692 38,201,724 47,112,401
The revaluation reserve relates to revaluation of buildings on leasehold lands and represents the fair value changes of the buildings on leasehold lands as at the date of revaluation.
26. DebenturesGroup/Company
As at 31 March 2018Rs.
2017Rs.
Debentures 1,494,265,886 1,488,820,927
During the financial year 2013/14, the Company has issued 15 Mn. rated unsecured redeemable debentures at a par value of Rs. 100/- and its allocation is as follows:
Class Issue Coupon rate
%
Listing status
Interest payable frequency
Issued date
Maturity date
Quantity
Nos.
Consideration received
Rs.
Value as at 31 March
2018Rs.
Value as at 31 March
2017Rs.
ComparativeGovernmentBonds rates
%
Yield to maturity
%
A Public 14.15 Listed Quarterly 9.30.2013 9.30.2018 10,427,900 1,042,790,000 1,045,931,717 1,036,186,759 8.65 11.09
B Public 14.15 Listed Quarterly 9.30.2013 9.30.2019 2,696,000 269,600,000 265,244,661 267,244,661 11.17 13.33
D Public 14.35 Listed Quarterly 9.30.2013 9.30.2021 1,645,500 164,550,000 160,628,539 162,628,539 11.55 11.96
E Public 14.40 Listed Quarterly 9.30.2013 9.30.2022 120,000 12,000,000 11,648,596 11,848,596 11.77 12.14
F Public 14.45 Listed Quarterly 9.30.2013 9.30.2023 110,600 11,060,000 10,812,373 10,912,373 11.80 12.47
15,000,000 1,500,000,000 1,494,265,886 1,488,820,927
26.1 Market Summary
Class Highest Lowest Last traded.
Traded quantity
Last traded date
A – – – – –
B 111.80 – 111.80 1,000,000 16 November 2015
D – – – – –
E – – – – –
F – – – – –
26.2 Purpose of the issuePurpose of the debenture issue is for funding the construction multi storied building with car park facilities, channelling, out patient department and indoor admission facilities adjoining the existing hospital building and to restructure the balance sheet by re-financing the existing loans.
26.3 Credit ratingsICRA Lanka Ltd., has affirmed Nawaloka Hospitals PLC’s long and short-term corporate credit ratings as SLA which is read as [SL] A(-).

188
Naw
alok
a H
osp
ital
s P
LC
|
A
nn
ual
Rep
ort 2
017/
18
27. Employee benefitsGroup Company
As at 31 March 2018Rs.
2017Rs.
2018Rs.
2017Rs.
Present value of defined benefit obligations 226,814,276 185,742,508 177,345,876 161,288,200
27.1 Movement in the Present Value of Defined Benefit Obligations (PV DBO)
Liability for defined benefit obligation at 1 April 185,742,508 184,237,790 161,288,200 166,252,434
Current service cost (Note 15.2) 21,111,466 18,634,699 11,200,422 10,543,008
Interest cost (Note 15.2) 23,664,417 20,148,489 19,354,583 18,287,768
Actuarial (gain)/losses on PV DBO (Note 15.3) 9,863,694 (12,896,688) 5,436,979 (12,032,425)
Payments made (25,028,794) (24,381,782) (19,934,308) (21,762,585)
Transferred from Nawaloka Metropolis Laboratories (Pvt) Ltd. 11,460,985 – – –
Liability for defined benefit obligation at 31 March 226,814,276 185,742,508 177,345,876 161,288,200
27.2 Amount recognised in income statement
Group Company
For the Year ended 31 March 2018Rs.
2017Rs.
2018Rs.
2017Rs.
Company service cost 21,111,466 18,634,699 11,200,422 10,543,008
Interest cost 23,664,417 20,148,489 19,354,583 18,287,768
44,775,883 38,783,188 30,555,005 28,830,776
27.3 Amounts recognised in other comprehensive income
Group Company
For the year ended 31 March 2018Rs.
2017Rs.
2018Rs.
2017Rs.
Actuarial (gain)/losses recognised during the year 9,863,694 (12,896,688) 5,436,979 (12,032,425)
27.4 The Group obtains on actuarial valuation performed by Mr Piyal Gunathilaka, an Independent Qualified Actuary every three years using projected unit credit method. During the period, where full actuarial valuation is not carried out, As at each reporting date the Group reestimates the impact due to changes in assumptions used in the valuation and make appropriate adjustments to the employee benefit liability as advised by the actuary. The last valuation was performed as at 31 March 2016.

189
Not
es to
the
Fina
ncia
l Sta
tem
ents
27.5 Actuarial assumptions
Group
For the year ended 31 March 2018 2017
Retirement age 55 Years 55 Years
Discount rate 11.00% 12.00%
Salary increment rate 8% 8%
27.6 Sensitivity analysisReasonably possible changes at the reporting date to one of the relevant actuarial assumptions, holding other assumptions constant, would have affected the defined benefit obligation by the amounts shown below:
Group Company
As at 31 March 2018Rs.
2017Rs.
2018Rs.
2017Rs.
1% Increase in discount rate 217,684,087 213,364,749 170,241,321 160,094,126
1% decrease in discount rate 236,772,879 200,636,376 185,088,113 172,964,081
1% increase in salary increment rate 239,848,649 199,623,705 187,735,733 172,778,065
1% decrease in salary increment rate 214,690,285 214,344,715 167,667,916 160,159,514
27.7 The above provision is not externally funded.
28. Deferred taxationGroup Company
As at 31 March 2018Rs.
2017Rs.
2018Rs.
2017Rs.
Deferred tax assets (416,770,100) (96,513,245) (339,844,984) (93,849,406)
Deferred tax liabilities 1,378,116,422 491,299,407 487,505,935 233,149,689
Net deferred tax liability 961,346,322 394,786,162 147,660,951 139,300,283

190
Naw
alok
a H
osp
ital
s P
LC
|
A
nn
ual
Rep
ort 2
017/
18
28.1 Movement in deferred tax balances
For the year end 31 March 2018 Group Company
Net balances as at1 April
Rs.
Recognised inprofit or loss
Rs.
Recognised inOCI
Rs.
Net balances as at 31 March
Rs.
Deferred taxassets
Rs.
Deferred taxliabilities
Rs.
Net balances as at1 April
Rs.
Recognised inprofit or loss
Rs.
Recognised inOCI
Rs.
Net balances as at 31 March
Rs.
Deferred taxassets
Rs.
Deferred taxliabilities
Rs.
Deferred tax liabilities
Property, plant and equipment 491,299,407 681,261,529 205,555,486 1,378,116,422 – 1,378,116,422 233,149,689 247,896,806 6,459,439 487,505,934 – 487,505,934
Deferred tax assets
Employee benefits (22,018,423) (37,599,980) (2,761,834) (62,380,237) (62,380,237) – (19,354,584) (28,779,907) (1,522,354) (49,656,845) (49,656,845) –
Tax loss carried forward (74,494,822) (279,895,041) – (354,389,863) (354,389,863) – (74,494,822) (215,693,317) – (290,188,139) (290,188,139) –
Net tax liabilities/(assets) 394,786,162 363,766,508 202,793,652 961,346,322 (416,770,100) 1,378,116,422 139,300,283 3,423,582 4,937,085 147,660,951 (339,844,984) 487,505,934
For the year end 31 March 2017 Group Company
Net balances as at1 April
Rs.
Recognised inprofit or loss
Rs.
Recognised inOCIRs.
Net balances as at 31 March
Rs.
Deferred taxassets
Rs.
Deferred taxliabilities
Rs.
Net balances as at1 April
Rs.
Recognised inprofit or loss
Rs.
Recognised inOCIRs.
Net balances as at 31 March
Rs.
Deferred taxassets
Rs.
Deferred taxliabilities
Rs.
Deferred tax liabilities
Property, plant and equipment 414,747,052 34,009,882 42,542,473 491,299,407 – 491,299,407 199,927,963 25,353,417 7,868,309 233,149,689 – 233,149,689
Deferred tax assets
Employee benefits (22,056,676) 38,253 – (22,018,423) (22,018,423) – (19,950,292) 595,708 – (19,354,584) (19,354,584) –
Tax loss carried forward (87,629,897) 13,135,075 – (74,494,822) (74,494,822) – (87,629,897) 13,135,075 – (74,494,822) (74,494,822) –
Net tax liabilities/(assets) 305,060,479 47,183,210 42,542,473 394,786,162 (96,513,245) 491,299,407 92,347,774 39,084,200 7,868,309 139,300,283 (93,849,406) 233,149,689
28.2 Analysis of recognised deferred tax Group Company
As at 31 March 2018 2017 2018 2017
Temporarydifference
Rs.
Tax effect
Rs.
Temporary difference
Rs.
Tax effect
Rs.
Temporary difference
Rs.
Tax effect
Rs.
Temporary difference
Rs.
Tax effect
Rs.
Property, plant and equipment 4,939,447,950 1,378,116,422 4,094,161,725 491,299,407 1,741,092,623 487,505,934 1,942,914,074 233,149,689
Employee benefits (222,786,559) (62,380,237) (183,486,854) (22,018,423) (177,345,876) (49,656,845) (161,288,200) (19,354,584)
Tax loss carried forward (1,265,678,084) (354,389,863) (620,790,183) (74,494,822) (1,036,386,209) (290,188,139) (620,790,183) (74,494,822)
3,450,983,307 961,346,322 3,289,884,687 394,786,163 527,360,538 147,660,951 1,160,835,691 139,300,283
Deferred Tax AssetsDeferred tax assets are recognised in respect of tax losses to the extent that it is probable that future taxable profits will be available against such tax losses can be utilised judgement is required to determine the amount of deferred tax assets that can be recognised based upon the likely timing and level of future taxable profits, together with future tax planning strategies.
Rate changeThe new Inland Revenue Act No. 24 of 2017 will become effective from 1 April 2018. Consequently as of 1 April 2018, the corporate tax rate relating to the Group (unless exempted by BOI) has been changed from 12% to 28%. This change resulted in a loss of Rs. 408 Mn. and Rs. 206 Mn. related to the re-measurement of deferred tax assets and liabilities of the Group of the profit or loss total comprehensive income respectively.

191
Not
es to
the
Fina
ncia
l Sta
tem
ents
28.1 Movement in deferred tax balances
For the year end 31 March 2018 Group Company
Net balances as at1 April
Rs.
Recognised inprofit or loss
Rs.
Recognised inOCI
Rs.
Net balances as at 31 March
Rs.
Deferred taxassets
Rs.
Deferred taxliabilities
Rs.
Net balances as at1 April
Rs.
Recognised inprofit or loss
Rs.
Recognised inOCI
Rs.
Net balances as at 31 March
Rs.
Deferred taxassets
Rs.
Deferred taxliabilities
Rs.
Deferred tax liabilities
Property, plant and equipment 491,299,407 681,261,529 205,555,486 1,378,116,422 – 1,378,116,422 233,149,689 247,896,806 6,459,439 487,505,934 – 487,505,934
Deferred tax assets
Employee benefits (22,018,423) (37,599,980) (2,761,834) (62,380,237) (62,380,237) – (19,354,584) (28,779,907) (1,522,354) (49,656,845) (49,656,845) –
Tax loss carried forward (74,494,822) (279,895,041) – (354,389,863) (354,389,863) – (74,494,822) (215,693,317) – (290,188,139) (290,188,139) –
Net tax liabilities/(assets) 394,786,162 363,766,508 202,793,652 961,346,322 (416,770,100) 1,378,116,422 139,300,283 3,423,582 4,937,085 147,660,951 (339,844,984) 487,505,934
For the year end 31 March 2017 Group Company
Net balances as at1 April
Rs.
Recognised inprofit or loss
Rs.
Recognised inOCIRs.
Net balances as at 31 March
Rs.
Deferred taxassets
Rs.
Deferred taxliabilities
Rs.
Net balances as at1 April
Rs.
Recognised inprofit or loss
Rs.
Recognised inOCIRs.
Net balances as at 31 March
Rs.
Deferred taxassets
Rs.
Deferred taxliabilities
Rs.
Deferred tax liabilities
Property, plant and equipment 414,747,052 34,009,882 42,542,473 491,299,407 – 491,299,407 199,927,963 25,353,417 7,868,309 233,149,689 – 233,149,689
Deferred tax assets
Employee benefits (22,056,676) 38,253 – (22,018,423) (22,018,423) – (19,950,292) 595,708 – (19,354,584) (19,354,584) –
Tax loss carried forward (87,629,897) 13,135,075 – (74,494,822) (74,494,822) – (87,629,897) 13,135,075 – (74,494,822) (74,494,822) –
Net tax liabilities/(assets) 305,060,479 47,183,210 42,542,473 394,786,162 (96,513,245) 491,299,407 92,347,774 39,084,200 7,868,309 139,300,283 (93,849,406) 233,149,689
28.2 Analysis of recognised deferred tax Group Company
As at 31 March 2018 2017 2018 2017
Temporarydifference
Rs.
Tax effect
Rs.
Temporary difference
Rs.
Tax effect
Rs.
Temporary difference
Rs.
Tax effect
Rs.
Temporary difference
Rs.
Tax effect
Rs.
Property, plant and equipment 4,939,447,950 1,378,116,422 4,094,161,725 491,299,407 1,741,092,623 487,505,934 1,942,914,074 233,149,689
Employee benefits (222,786,559) (62,380,237) (183,486,854) (22,018,423) (177,345,876) (49,656,845) (161,288,200) (19,354,584)
Tax loss carried forward (1,265,678,084) (354,389,863) (620,790,183) (74,494,822) (1,036,386,209) (290,188,139) (620,790,183) (74,494,822)
3,450,983,307 961,346,322 3,289,884,687 394,786,163 527,360,538 147,660,951 1,160,835,691 139,300,283
Deferred Tax AssetsDeferred tax assets are recognised in respect of tax losses to the extent that it is probable that future taxable profits will be available against such tax losses can be utilised judgement is required to determine the amount of deferred tax assets that can be recognised based upon the likely timing and level of future taxable profits, together with future tax planning strategies.
Rate changeThe new Inland Revenue Act No. 24 of 2017 will become effective from 1 April 2018. Consequently as of 1 April 2018, the corporate tax rate relating to the Group (unless exempted by BOI) has been changed from 12% to 28%. This change resulted in a loss of Rs. 408 Mn. and Rs. 206 Mn. related to the re-measurement of deferred tax assets and liabilities of the Group of the profit or loss total comprehensive income respectively.

192
Naw
alok
a H
osp
ital
s P
LC
|
A
nn
ual
Rep
ort 2
017/
18
29. BorrowingsGroup Company
As at 31 March 2018Rs.
2017Rs.
2018Rs.
2017Rs.
DFCC Bank loan 228,858,167 313,445,406 228,858,167 313,445,406
BOC 1,128,160,659 682,144,395 1,128,160,659 682,144,395
Commercial Bank 1,938,250,947 1,141,706,143 1,938,250,947 1,107,929,843
Sampath Bank PLC 1,540,220,400 1,848,201,300 1,540,220,400 1,848,201,300
Nations Lanka PLC 23,000,000 41,000,000 23,000,000 41,000,000
Hatton National Bank loans 2,563,749,076 1,479,622,625 233,360,000 86,720,000
7,422,239,249 5,506,119,869 5,091,850,173 4,079,440,944
Borrowings falling due within one year 2,275,560,740 1,585,642,845 2,129,033,676 1,193,521,260
Borrowings falling due after one year 5,146,678,509 3,920,477,024 2,962,816,497 2,885,919,684
7,422,239,249 5,506,119,869 5,091,850,173 4,079,440,944
29.1 Borrowings
Group Company
For the year end 31 March 2018Rs.
2017Rs.
2018Rs.
2017Rs.
Opening balance as at 1 April 5,506,119,869 3,596,694,050 4,079,440,944 3,515,844,365
Loans obtained during the year 3,487,688,245 2,704,448,257 2,410,000,189 1,311,994,217
Loans paid during the year (1,571,568,865) (795,022,438) (1,397,590,960) (748,397,638)
Closing balance as at 31 March 7,422,239,249 5,506,119,869 5,091,850,173 4,079,440,944
29.2 Details of loans obtained by the Group are set out below:
Financial institution
Repayment terms
Principal
Rs.
Interestrate
%
Security Annualrepayment
Rs.
Balance as at 31.03.2018
Rs.
Long-term loan Nawaloka Hospitals PLC
DFCC Bank 59 equal monthly installments of Rs. 7,503,114/-
450,000,000 AWPLR+1.25% Primary concurrent mortgage over leasehold rights of the land and building situated at Sir James Peiris Mawatha and Sugathodaya Mawatha owned by Nawaloka Hospitals PLC and New Nawaloka Hospitals (Pvt) Ltd.
Joint and several guarantees of Directors – Mr H K J Dharmadasa, Mr Ugitha Harshith Dharmadasa and Mr Anisha Givantha Dharmadasa
75,293,915 194,818,163
DFCC Bank 60 equal monthly installments of Rs. 833,334/-
100,000,000 AWPLR+1.25% Primary concurrent mortgage over leasehold rights of the land and building situated at Sir James Peiris Mawatha and Sugathodaya Mawatha owned by Nawaloka Hospitals PLC and New Nawaloka Hospitals (Pvt) Ltd.
Joint & several Guarantees of Directors-Mr H K J Dharmadasa,Mr Ugitha Harshith Dharmadasa and Mr Anisha Givantha Dharmadasa.
9,293,324 34,040,004
Bank of Ceylon To be repaid 60 equal installments
363,000,000 AWPLR+0.5% Joint and several guarantees of Directors – Mr H K J Dharmadasa, Mr Ugitha Harshith Dharmadasa and Mr Anisha Givantha Dharmadasa.
52,492,778 55,977,977
Bank of Ceylon 60 equal monthly installments of Rs. 3,166,667/-
190,000,000 AWPLR+0.5% Joint and several guarantees of Directors – Mr H K J Dharmadasa, Mr Ugitha Harshith Dharmadasa and Mr Anisha Givantha Dharmadasa.
33,490,958 72,182,682

193
Not
es to
the
Fina
ncia
l Sta
tem
ents
Financial institution
Repayment terms
Principal
Rs.
Interestrate
%
Security Annualrepayment
Rs.
Balance as at 31.03.2018
Rs.
Sampath Bank 60 equal monthly installments of Rs. 9,166,667/-
550,000,000 AWPLR+1% Loan agreement for Rs. 550,000,000/-, corporate guarantee of Nawaloka Construction Company (Pvt) Ltd. for Rs. 550,000,000/-
100,833,700 339,165,900
Sampath Bank 72 equal monthly installments of Rs. 13,888,889/-
1,000,000,000 AWPLR+1% Loan agreement for Rs. 1,000,000,000/-
Assignment over credit card receivables for Rs. 1,000,000,000/- including the receivables of the existing hospital operations and the car park, channelling centre and new rooms of the proposed building complex.
Corporate Guarantee of the New Nawaloka Hospitals (Pvt) Ltd. for Rs. 1 Bn.
152,768,000 750,016,000
Sampath Bank 36 equal monthly installments of Rs. 1,083,300/-
39,000,000 AWPLR+1% Loan agreement for Rs. 39,000,000/- Primary Mortgage Bond over machinery for Rs. 39,000,000/-
5,417,700 –
Sampath Bank 72 equal monthly installments of Rs. 6,994,500/-
500,000,000 AWPLR+1% Loan Agreement for Rs. 500,000,000/-
Assignment over credit card receivables for Rs. 1,000,000,000/- and Rs. 500,000,000/- including the receivables of the existing Hospital Operations and the car park, channeling centre and new rooms of the New Building Complex.
48,961,500 451,038,500
Commercial Bank
First 24 months Rs. 12,500,000, Next 35 months 19,400,000 and Final Rs. 21,000,000 installments
1,200,000,000 AWPLR+1% Primary mortgage Bond over debit and credit card sales for Rs. 1,200,000,000/- to be executed over the card sales of the total hospital operations, corporate guarantee from New Nawaloka Hospitals (Pvt) Ltd. for Rs. 500,000,000/- to be signed by the Directors of the Company, corporate guarantee from New Nawaloka Medical Centre (Pvt) Ltd. for Rs. 500,000,000/- to be singed by the directors of the Company, General Terms and Conditions relating to Term Loan for Rs. 1,000,000,000/- to be signed by the Directors of the Company.
93,915,023 1,015,612,265
Commercial Bank
To be decided on a case by case ranging from 3 to 60 months in equal monthly installments
476,849,479 AWPLR+1% “An agreement to MortgAGE Bond No. FCC/16/90 over machinery for Rs. 125,000,000/- dated 23/09/2016 executed by the company. An agreement to mortgage to be executed for Rs. 175,000,000/- over relevant machinery.”
55,006,938 421,842,541
Commercial Bank
5 years in 59 monthly installments
USD 3,200,000 LIBOR+4.5% Clean 4,699,883 500,796,141
HNB Short term loan 260,000,000 FD rate+1.5% Lien over fixed deposit No.003300082684 for Rs. 292.0 Mn of the Company.
86,720,000 –
Bank of Ceylon Money market loan
1,000,000,000 AWPLR (monthly
review)
Joint & several Guarantees of Directors Mr H K J Dharmadasa, Mr Ugitha Harshith Dharmadasa and Mr Anisha Givantha Dharmadasa.
– 1,000,000,000
HNB Short term loan 275,000,000 AWPLR+1.75% Clean 41,640,000 233,360,000
Nation Lanka PLC
– – – None 18,000,000 23,000,000
5,091,850,173

194
Naw
alok
a H
osp
ital
s P
LC
|
A
nn
ual
Rep
ort 2
017/
18
Financial institution
Repayment terms
Principal
Rs.
Interestrate
%
Security Annualrepayment
Rs.
Balance as at 31.03.2018
Rs.
New Nawaloka Hospitals (Pvt) Ltd.
HNB 60 equal monthly installments of Rs. 3,333,400
200,000,000 AWPLR+1.25% Join and Several guarantee of Mr H K J Dharmadasa, Mr U H Dharmadasa and Mr A G Dharmadasa.
Existing Primary Concurrent Mortgage Bond for Rs. 390.0 Mn. (HNB – Rs. 260.0 Mn., Seylan Rs. 130.0 Mn.) over leasehold Nawaloka Hospitals premises.
40,000,800 –
HNB 48 equal monthly installments of Rs. 416,000/-
20,000,000 AWPLR+1.25% Join and Several guarantee of Mr H K J Dharmadasa, Mr U H Dharmadasa and Mr A G Dharmadasa.
Existing Primary Concurrent Mortgage Bond for Rs. 390.0 Mn. (HNB – Rs. 260.0 Mn., Seylan Rs. 130.0 Mn.) over leasehold Nawaloka Hospitals premises.
4,992,000 7,520,000
HNB 48 equal monthly installments of Rs. 136,000/-
6,500,000 AWPLR+1.25% Existing Primary Concurrent Mortgage Bond for Rs. 390.0 Mn. (HNB – Rs. 260.0 Mn., Seylan Rs. 130.0 Mn.) over leasehold Nawaloka Hospitals premises.
1,632,000.00 2,556,000
HNB 60 equal monthly installments
400,000,000 AWPLR + 1.75% Existing Primary Concurrent Mortgage Bond for Rs. 390 Mn (HNB - Rs. 260 Mn, Seylan - Rs. 130 Mn) over leasehold Nawaloka Hospitals Premises.
56,928,522 320,313,076
330,389,076
New Nawaloka Medical Centre (Pvt) Ltd.
HNB 59 equal monthly installments ofRs. 16,660,000/-
1,000,000,000 AWPLR+1.25% Corporate guarantee of Nawaloka Hospitals for Rs. 1,000.0 Mn.
Corporate guarantee of New Nawaloka Hospitals (Pvt) Ltd. for Rs. 1,000.0 Mn.
– 1,000,000,000
HNB To be settled in full out of the proposed term Loan of Rs. 1.0 Bn.
200,000,000 AWPLR+2% Board resolution 200,000,000 –
HNB To be settled in full out of the proposed term Loan of Rs. 1.0 Bn.
80,000,000 AWPLR+1.75% Clean 80,000,000 –
HNB To be settled in full out of the proposed termLoan of Rs. 1.0 Bn.
85,000,000 AWPLR+1.75% Clean 85,000,000 –
HNB To be repaid in 7 years in 59 equal monthly installments of Rs. 16.66 Mn each and a final installment of Rs. 17.06 Mn
1,000,000,000 AWPLR+1.75% Corporate Guarantee from Nawaloka Hospitals PLC and New Nawaloka Hospitals (Pvt) Ltd. for Rs. 1 Bn each.
– 1,000,000,000
2,000,000,000

195
Not
es to
the
Fina
ncia
l Sta
tem
ents
30. Finance leasesGroup
As at 31 March 2018Rs.
2017Rs.
Opening balance as at 1 April 108,000,000 116,000,000
Lease paid during the year (8,000,000) (8,000,000)
Closing balance as at 31 March 100,000,000 108,000,000
Finance Lease Payable within one Year 8,000,000 8,000,000
Finance Lease Payable between 1 to 5 Years 40,000,000 40,000,000
Finance Lease Payable more than five years 52,000,000 60,000,000
100,000,000 108,000,000
31. Trade and other payablesGroup Company
As at 31 March 2018Rs.
2017Rs.
2018Rs.
2017Rs.
Trade payables 756,625,316 662,703,759 717,561,510 638,023,073
Doctors payable 12,937,355 1,507,284 3,479,717 1,507,284
Other payables 223,307,962 140,530,664 104,573,285 88,864,030
992,870,633 804,741,707 825,614,512 728,394,387
32. Current tax liabilityGroup Company
As at 31 March 2018Rs.
2017Rs.
2018Rs.
2017Rs.
Balance as at 1 April 16,310,706 24,765,638 – –
Under/(over) provision during prior year – (4,583,423) – –
Provision for the year 13,471,835 18,680,733 – –
Current tax paid during the year (12,892,264) (22,552,242) – –
Balance as at 31 March 16,890,277 16,310,706 – –
33. Payable to related partiesGroup Company
As at 31 March 2018Rs.
2017Rs.
2018Rs.
2017Rs.
Nawaloka Metropolis Laboratories (Pvt) Ltd. 165,753,782 202,866,585 160,328,714 192,011,548
Nawaloka Green Cross Laboratories (Pvt) Ltd. – – 5,899,352 –
Mountlavinia Medical Centre 4,072,742 2,491,914 – –
Nawaloka Aviation (Pvt) Ltd 1,106,771 526,134 – –
Nawaloka Guardian International (Pvt) Ltd 26,020,754 12,236,716 26,020,754 12,236,716
196,954,049 218,121,349 192,248,820 204,248,265
34. Related party transactionsThe Group carries out transactions in the ordinary course of its business with parties who are Defined as related parties in Sri Lanka Accounting Standard 24 – “Related Party disclosures”, the details of which are reported below. The pricing applicable to such transactions is based on the assessment of risk and pricing model of the Group and is comparable with what is applied to transactions between the Group and its unrelated customers.
Key Management Personnel (KMP)KMP are those persons having authority and responsibility for planning, directing and controlling the activities of the entity directly or indirectly.

196
Naw
alok
a H
osp
ital
s P
LC
|
A
nn
ual
Rep
ort 2
017/
18
KMP of the CompanyThe Board of Directors of the Company has been classified as KMP of the company.
KMP of the Group As the Company is the ultimate parent of the subsidiaries listed out on page 5, the Board of Directors of the Company has the authority and responsibility for planning, directing and controlling the activities of the Group directly or indirectly. Accordingly, the Board of Directors of the Company is also KMP of the Group. Therefore, officers who are only Directors of the subsidiaries and not of the Company have been classified as KMP only for that respective subsidiary.
34.1 Compensation of key management personnel
Group Company
For the year end 31 March 2018Rs. 000
2017Rs. 000
2018Rs. 000
20117Rs. 000
Short-term employee and post – employment benefits 75,540 80,775 75,540 80,775
Other long-term benefits – – – –
Termination benefits – – – –
Share-based payments – – – –
75,540 80,775 75,540 80,775
Post employment benefits are contributed only for executive directors.
34.2 Transactions with Key Management Personnel
Group Company
As at 31 March 2018Rs. 000
2017Rs. 000
2018Rs. 000
2017Rs. 000
Loans Granted – 6,800 – 6,800
– 6,800 – 6,800
34.3 Transactions with subsidiaries – Company
Name of the Company New Nawaloka Hospitals (Pvt) Ltd.
New Nawaloka Medical Centre (Pvt) Ltd.
Nawaloka Green Cross Laboratories (Pvt) Ltd.
Nawaloka Medicare (Pvt) Ltd.
For the year end 31 March 2018Rs. 000
2017Rs. 000
2018Rs. 000
2017Rs. 000
2018Rs. 000
2017Rs. 000
2018Rs. 000
2017Rs. 000
Shareholding 100% 100% 100% 100% 100% – 100% 100%
2018Rs. ’000
2017Rs. ’000
2018Rs. ’000
2017Rs. ’000
2018Rs. ’000
2017Rs. ’000
2018Rs. ’000
2017Rs. ’000
Opening balance due (to)/from subsidiaries 413,178 245,811 1,840,432 425,808 – – 8,436 17,770
Provision of services 7,821 6,345 326,781 302,382 498,245 – (5,342) (10,029)
Cost of pharmaceutical and general stores 821,673 792,759 514,609 419,861 3,409 – 22,456 18,930
Fund transfer (521,354) (631,736) 317,274 692,380 (507,553) – (8,589) (18,235)
Closing balance due (to)/ from subsidiaries 721,317 413,178 2,999,095 1,840,432 (5,899) – 16,961 8,436
Also refer note 20 and 33.

197
Not
es to
the
Fina
ncia
l Sta
tem
ents
34.4 Recurrent related party transactionsThere were no recurrent related-party transactions which in aggregate value exceeds 10% of the consolidated revenue of the Company as at 31 March 2018 except the transactions between New Nawaloka Hospitals (Pvt) Ltd. and New Nawaloka Medical Centre (Pvt) Ltd. which are fully-owned subsidiaries of the Company. The two subsidiaries are situated in the same premises and operated under the Nawaloka Hospitals brand name with the Company. Therefore, revenue and the expenses could occur mutually. However, the net transactions value does not exceed the 10% of the Consolidated revenue of the Company.
35. Comparative information
To facilitate comparison, relevant balances pertaining to the previous year, have been reclassified to conform to current year’s classification and presentation.
36. Commitments
36.1 Capital CommitmentsThere are no material commitments except for disclosed below:
Nawaloka Hospitals construct a multi-storied building with car park facilities, Channelling, Out Patient Department and Indoor admission facilities adjoining the existing hospital building of the subsidiary and Rs. 116,456,536 to be invested.
36.2 Operating lease commitments There were no operating leases in the Group as at reporting date.
37. Contingent LiabilitiesThere are no material contingent liabilities as at the reporting date which require adjustment to or disclosure in the Financial Statements.
38. Events after the Reporting DateNo circumstances have arisen since the reporting period end which would require adjustment to or disclosure.
39. Directors’ ResponsibilitiesThe Board of Directors is responsible for the preparation and presentation of these Financial Statements according to the Sri Lanka Accounting Standards and Company’s Act No 07 of 2007.
40. Accounting Classifications and Fair Values
Assets for which fair value approximates carrying valueFor financial assets and liabilities with short-term maturities or with short-term repricing intervals, it is assumed that the carrying amounts approximate to their fair value. This assumption is also applied to demand deposits and savings deposits which do not have a specific maturity.
The following methods and assumptions were used to estimate the fair values:
• Cash and short-term deposits, trade and other receivables, trade and other payables approximate their carrying amounts largely due to the short-term maturities of these instruments.
• Long-term loans and finance leases approximate their carrying amount.
Fair value HierarchyThe Group uses the following hierarchy for determining and disclosing the fair value of financial instruments by valuation techniques:
Level 1: Quoted (unadjusted) prices in active markets for identical assets or liabilities.
Level 2: Other techniques for which all inputs that have a significant effect on the recorded fair value are observable, either directly or indirectly.
Level 3: Techniques that use inputs that have a significant effect on the recorded fair value that are not based on observable market data

198
Naw
alok
a H
osp
ital
s P
LC
|
A
nn
ual
Rep
ort 2
017/
18
40.1 Fair Value Vs Carrying Amount
Group Company
31 March 2018 Loans and Receivables
Other financial liabilities
Rs.
Total carrying amount
Rs.
Fair value
Rs.
Level 1 Level 2 Level 3 Loans and Receivables
Other financial liabilities
Rs.
Total carrying amount
Rs.
Fair value
Rs.
Level 1 Level 2 Level 3
Cash and cash equivalents
177,722,754 – 177,722,754 177,722,754 – – 177,722,754 65,399,058 – 65,399,058 65,399,058 – – 65,399,058
Trade and other receivables
608,872,498 – 608,872,498 608,872,498 – – 608,872,498 455,255,273 – 455,255,273 455,255,273 – – 455,255,273
Deposits and advances
328,723,888 – 328,723,888 328,723,888 – – 328,723,888 234,050,081 – 234,050,081 234,050,081 – – 234,050,081
RPT Receivable 270,598,111 – 270,598,111 270,598,111 – – 270,598,111 3,960,771,974 – 3,960,771,974 3,960,791,974 – – 3,960,771,974
Short term investments
1,344,188,073 – 1,344,188,073 1,344,188,073 – – 1,344,188,073 1,148,453,310 – 1,148,453,310 1,148,453,310 – – 1,148,453,310
2,730,105,324 – 2,730,105,324 2,730,105,324 – – 2,730,105,324 5,863,929,696 – 5,863,929,696 5,863,929,696 – – 5,863,929,696
Debentures – 1,494,265,886 1,494,265,886 1,494,265,886 – – 1,494,265,886 – 1,494,265,886 1,494,265,886 1,494,265,886 – – 1,494,265,886
Borrowings – 7,422,239,249 7,422,239,249 7,422,239,249 – – 7,422,239,249 – 5,091,850,173 5,091,850,173 5,091,850,173 – – 5,091,850,173
Finance lease – 100,000,000 100,000,000 100,000,000 – – 100,000,000 – – – – – – –
Trade and other payables
– 987,941,629 987,941,629 987,941,629 – – 987,941,629 – 825,614,512 825,614,512 825,614,512 – – 825,614,512
RPT Payable – 196,954,049 196,954,049 196,954,049 – – 196,954,049 – 192,248,820 192,248,820 192,248,820 – – 192,248,820
Unclaimed dividend
– 4,265,486 4,265,486 4,265,486 – – 4,265,486 – 4,265,460 4,265,483 4,265,483 – – 4,265,483
Overdraft – 1,610,165,852 1,610,165,852 1,610,165,852 – – 1,610,165,852 – 1,338,687,329 1,338,687,329 1,338,687,329 – – 1,338,687,329
– 11,815,832,151 11,815,832,151 11,815,832,151 – – 11,815,832,151 – 8,946,932,180 8,946,932,180 8,946,932,180 – – 8,946,932,180
31 March 2017 Loans and receivables
Other financial liabilities
Rs.
Total carrying amount
Rs.
Fair value
Rs.
Level 1 Level 2 Level 3 Loans and receivables
Other financial liabilities
Rs.
Total carrying amount
Rs.
Fair value
Rs.
Level 1 Level 2 Level 3
Cash and cash equivalents
144,348,684 – 144,348,684 144,348,684 – – 144,348,684 119,151,979 – 119,151,979 119,151,979 – – 119,151,979
Trade and other receivables
704,668,480 – 704,668,480 704,668,480 – – 704,668,480 415,210,841 – 415,210,841 415,210,841 – – 415,210,841
Deposits and advancess
152,417,824 – 152,417,824 152,417,824 – – 152,417,824 120,614,299 – 120,614,299 120,614,299 – – 120,614,299
RPT Receivable 644,775,455 – 644,775,455 644,775,455 – – 644,775,455 2,420,674,454 – 2,420,674,454 2,420,674,454 – – 2,420,674,454
Short Term Investments
994,669,945 – 994,669,945 994,669,945 – – 994,669,945 810,427,387 – 810,427,387 810,427,387 – – 810,427,387
2,640,880,388 – 2,640,880,388 2,640,880,388 – – 2,640,880,388 3,886,078,960 – 3,886,078,960 3,886,078,960 – – 3,886,078,960
Debentures – 1,488,820,927 1,488,820,927 1,488,820,927 – – 1,488,820,927 – 1,488,820,927 1,488,820,927 1,488,820,927 – – 1,488,820,927
Borrowings – 5,506,119,869 5,506,119,869 5,506,119,869 – – 5,506,119,869 – 4,079,440,944 4,079,440,944 4,079,440,944 – – 4,079,440,944
Finance Lease – 108,000,000 108,000,000 108,000,000 – – 108,000,000 – – – – – – –
Trade and other payables
– 804,741,707 804,741,707 804,741,707 – – 804,741,707 – 728,394,387 728,394,387 728,394,387 – – 728,394,387
RPT Payable – 218,121,349 218,121,349 218,121,349 – – 218,121,349 – 204,248,265 204,248,265 204,248,265 – – 204,248,265
Unclaimed Dividend
– 3,429,123 3,429,123 3,429,123 – – 3,429,123 – 3,429,123 3,429,123 3,429,123 – – 3,429,123
Overdraft – 1,187,430,452 1,187,430,452 1,187,430,452 – – 1,187,430,452 – 1,007,671,883 1,007,671,883 1,007,671,883 1,007,671,883
– 9,316,663,427 9,316,663,427 9,316,663,427 – – 9,316,663,427 – 7,512,005,529 7,512,005,529 7,512,005,529 – – 7,512,005,529

199
Not
es to
the
Fina
ncia
l Sta
tem
ents
40.1 Fair Value Vs Carrying Amount
Group Company
31 March 2018 Loans and Receivables
Other financial liabilities
Rs.
Total carrying amount
Rs.
Fair value
Rs.
Level 1 Level 2 Level 3 Loans and Receivables
Other financial liabilities
Rs.
Total carrying amount
Rs.
Fair value
Rs.
Level 1 Level 2 Level 3
Cash and cash equivalents
177,722,754 – 177,722,754 177,722,754 – – 177,722,754 65,399,058 – 65,399,058 65,399,058 – – 65,399,058
Trade and other receivables
608,872,498 – 608,872,498 608,872,498 – – 608,872,498 455,255,273 – 455,255,273 455,255,273 – – 455,255,273
Deposits and advances
328,723,888 – 328,723,888 328,723,888 – – 328,723,888 234,050,081 – 234,050,081 234,050,081 – – 234,050,081
RPT Receivable 270,598,111 – 270,598,111 270,598,111 – – 270,598,111 3,960,771,974 – 3,960,771,974 3,960,791,974 – – 3,960,771,974
Short term investments
1,344,188,073 – 1,344,188,073 1,344,188,073 – – 1,344,188,073 1,148,453,310 – 1,148,453,310 1,148,453,310 – – 1,148,453,310
2,730,105,324 – 2,730,105,324 2,730,105,324 – – 2,730,105,324 5,863,929,696 – 5,863,929,696 5,863,929,696 – – 5,863,929,696
Debentures – 1,494,265,886 1,494,265,886 1,494,265,886 – – 1,494,265,886 – 1,494,265,886 1,494,265,886 1,494,265,886 – – 1,494,265,886
Borrowings – 7,422,239,249 7,422,239,249 7,422,239,249 – – 7,422,239,249 – 5,091,850,173 5,091,850,173 5,091,850,173 – – 5,091,850,173
Finance lease – 100,000,000 100,000,000 100,000,000 – – 100,000,000 – – – – – – –
Trade and other payables
– 987,941,629 987,941,629 987,941,629 – – 987,941,629 – 825,614,512 825,614,512 825,614,512 – – 825,614,512
RPT Payable – 196,954,049 196,954,049 196,954,049 – – 196,954,049 – 192,248,820 192,248,820 192,248,820 – – 192,248,820
Unclaimed dividend
– 4,265,486 4,265,486 4,265,486 – – 4,265,486 – 4,265,460 4,265,483 4,265,483 – – 4,265,483
Overdraft – 1,610,165,852 1,610,165,852 1,610,165,852 – – 1,610,165,852 – 1,338,687,329 1,338,687,329 1,338,687,329 – – 1,338,687,329
– 11,815,832,151 11,815,832,151 11,815,832,151 – – 11,815,832,151 – 8,946,932,180 8,946,932,180 8,946,932,180 – – 8,946,932,180
31 March 2017 Loans and receivables
Other financial liabilities
Rs.
Total carrying amount
Rs.
Fair value
Rs.
Level 1 Level 2 Level 3 Loans and receivables
Other financial liabilities
Rs.
Total carrying amount
Rs.
Fair value
Rs.
Level 1 Level 2 Level 3
Cash and cash equivalents
144,348,684 – 144,348,684 144,348,684 – – 144,348,684 119,151,979 – 119,151,979 119,151,979 – – 119,151,979
Trade and other receivables
704,668,480 – 704,668,480 704,668,480 – – 704,668,480 415,210,841 – 415,210,841 415,210,841 – – 415,210,841
Deposits and advancess
152,417,824 – 152,417,824 152,417,824 – – 152,417,824 120,614,299 – 120,614,299 120,614,299 – – 120,614,299
RPT Receivable 644,775,455 – 644,775,455 644,775,455 – – 644,775,455 2,420,674,454 – 2,420,674,454 2,420,674,454 – – 2,420,674,454
Short Term Investments
994,669,945 – 994,669,945 994,669,945 – – 994,669,945 810,427,387 – 810,427,387 810,427,387 – – 810,427,387
2,640,880,388 – 2,640,880,388 2,640,880,388 – – 2,640,880,388 3,886,078,960 – 3,886,078,960 3,886,078,960 – – 3,886,078,960
Debentures – 1,488,820,927 1,488,820,927 1,488,820,927 – – 1,488,820,927 – 1,488,820,927 1,488,820,927 1,488,820,927 – – 1,488,820,927
Borrowings – 5,506,119,869 5,506,119,869 5,506,119,869 – – 5,506,119,869 – 4,079,440,944 4,079,440,944 4,079,440,944 – – 4,079,440,944
Finance Lease – 108,000,000 108,000,000 108,000,000 – – 108,000,000 – – – – – – –
Trade and other payables
– 804,741,707 804,741,707 804,741,707 – – 804,741,707 – 728,394,387 728,394,387 728,394,387 – – 728,394,387
RPT Payable – 218,121,349 218,121,349 218,121,349 – – 218,121,349 – 204,248,265 204,248,265 204,248,265 – – 204,248,265
Unclaimed Dividend
– 3,429,123 3,429,123 3,429,123 – – 3,429,123 – 3,429,123 3,429,123 3,429,123 – – 3,429,123
Overdraft – 1,187,430,452 1,187,430,452 1,187,430,452 – – 1,187,430,452 – 1,007,671,883 1,007,671,883 1,007,671,883 1,007,671,883
– 9,316,663,427 9,316,663,427 9,316,663,427 – – 9,316,663,427 – 7,512,005,529 7,512,005,529 7,512,005,529 – – 7,512,005,529

200
Naw
alok
a H
osp
ital
s P
LC
|
A
nn
ual
Rep
ort 2
017/
18
41. Financial Risk Management
OverviewThe Company has exposure to the following risks to arising from financial instruments:• Credit risk• Liquidity risk• Market risk• Operation risk
This note of presents information about the Company’s exposure to each of the above risks, the group’s objectives, policies and processes for measuring and managing risk, and the Company’s management of capital.
Risk Management FrameworkThe Board of Directors has overall responsibility for the establishment and oversight of the Company’s risk management framework.
The Company’s risk management policies are established to identify and analyse the risk faced by the Company, to set appropriate risk limit and controls, and to monitor risk and adherence to limits. Risk management policies and systems are reviewed regularly to reflect changes in market conditions and the Company’s activities. The Company, through its training and management standards and procedures, aims to develop a disciplined and constructive control environment in which all employees understand their roles and obligations.
The Company Audit Committee monitors the process through which business risks are identified for action by management and for the Board’s attention and monitors the effectiveness of the Company’s internal controls. The Audit Committee is assisted in its role by Internal Audit. Internal Audit undertakes both regular and ad hoc reviews of controls and procedures, the results of which are reported to the Audit Committee.
Credit Risk Credit risk is the risk of financial loss to the Company if a customer or counterparty to a financial instrument fails to meet its contractual obligations, and arises principally from the Company’s receivables from customers and investment securities.
The total carrying amount of the credit risk pertaining to the Company as at 31 March 2018 is the summation of balances under the following categories of financial assets. The maximum credit risk of the Company is limited to the carrying value of these financial assets as at 31 March 2018.
Company
As at 31 March2018
As at 31 March2017
Trade and other receivables 455,255,273 415,210,841
Deposits and advances 234,050,081 120,614,299
Receivable from related parties 3,960,771,974 2,420,674,454
Short-term investments 1,148,453,310 810,427,387
Cash and cash equivalents 65,399,058 119,151,979
5,863,929,696 3,886,078,960

201
Not
es to
the
Fina
ncia
l Sta
tem
ents
Trade and other receivablesThe Company’s exposure to credit risk is influenced mainly by the individual characteristics of each customer. However, Management also considers the demographics of the Company’s customer base, including the default risk of the industry and country in which customers operate, as these factors may have an influence on credit risk.
The Company establishes an allowance for impairment that represents its estimate of incurred losses in respect of trade and other receivables.
At 31 March 2018, the maximum exposure to credit risk for trade and other receivables by type of counterparty was as follows:
As at 31 March 2018
As at 31 March 2017
Local government 40,877,565 38,322,918
Insurance companies 117,752,148 108,356,540
Other corporate clients 211,987,293 198,038,332
Other 84,638,267 70,493,051
455,255,273 415,210,841
At 31 March 2018, the ageing of trade and other receivables that were not impaired was as follows:
2017/18 2016/17
Gross
Rs.
ImpairmentlossRs.
Gross
Rs.
ImpairmentlossRs.
Neither past due nor impaired – – – –
Past due 0-6 months 353,750,771 – 296,958,829 –
Past due 6-12 months 48,690,394 24,184,337 29,368,888 13,725,865
Past due 12-18 months 28,143,357 13,978,700 19,542,015 9,133,170
Past due > 18 months 27,222,400 13,521,265 39,122,657 18,284,393
457,806,922 51,684,302 384,992,389 41,143,428
Management believes that the unimpaired amounts that are past due by more than 360 days are still collectible in full, based on historical payment behaviour and extensive analysis of customer credit risk, including underlying customers’ credit ratings if they are available.
Cash and Cash Equivalents and Short-Term InvestmentsThe Company held cash and cash equivalents of 177,722,754 at 31 March 2018 (2017: 65,399,058). The cash and cash equivalents are held with bank and financial institution counterparties, which are rated highly rated, based on ratings.
Liquidity RiskLiquidity risk is the risk that the Group will encounter difficulty in meeting the obligations associated with its financial liabilities that are settled by delivering cash or another financial asset. The Group’s approach to managing liquidity is to ensure , as far as possible, that it will always have sufficient liquidity to meet its liabilities when due, under both normal and stressed conditions, without incurring unacceptable losses or risking damage to the Group’s reputation.
The Group maintains the level of its cash and cash equivalents at an amount in excess of expected cash outflows on financial liabilities (other than trade payables) over the succeeding 60 days. The Group also monitors the level of expected cash inflows on trade and other receivables together with expected cash outflows on trade and other payables. In addition, the Group maintains Rs. 915 Mn overdraft facility that is unsecured. Interest would be payable at market rate.
The disclosure shows net cash flow amounts for derivatives that are net cash settled and gross cash inflow and outflow amount for derivatives that have simultaneous gross cash settlement. It is not expected that cash flows included in the maturity analysis would occur significantly earlier or at significantly different amount.
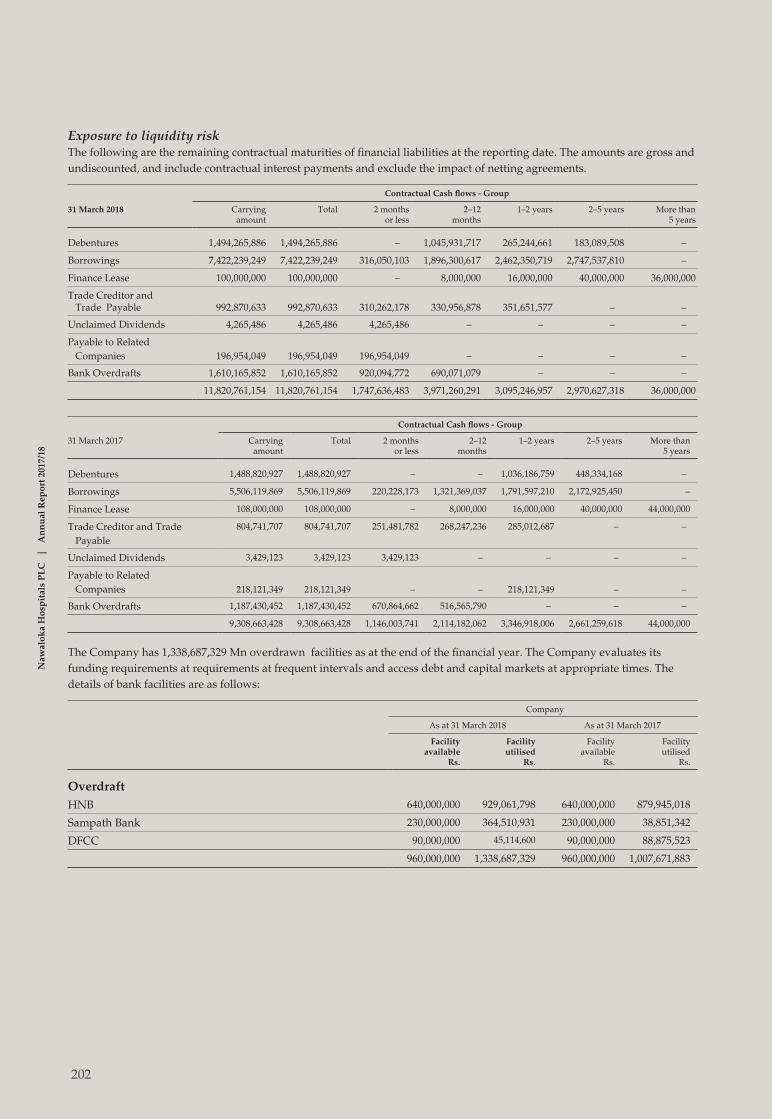
202
Naw
alok
a H
osp
ital
s P
LC
|
A
nn
ual
Rep
ort 2
017/
18
Exposure to liquidity riskThe following are the remaining contractual maturities of financial liabilities at the reporting date. The amounts are gross and undiscounted, and include contractual interest payments and exclude the impact of netting agreements.
Contractual Cash flows - Group
31 March 2018 Carrying amount
Total 2 monthsor less
2–12months
1–2 years 2–5 years More than5 years
Debentures 1,494,265,886 1,494,265,886 – 1,045,931,717 265,244,661 183,089,508 –
Borrowings 7,422,239,249 7,422,239,249 316,050,103 1,896,300,617 2,462,350,719 2,747,537,810 –
Finance Lease 100,000,000 100,000,000 – 8,000,000 16,000,000 40,000,000 36,000,000
Trade Creditor and Trade Payable 992,870,633 992,870,633 310,262,178 330,956,878 351,651,577 – –
Unclaimed Dividends 4,265,486 4,265,486 4,265,486 – – – –
Payable to Related Companies 196,954,049 196,954,049 196,954,049 – – – –
Bank Overdrafts 1,610,165,852 1,610,165,852 920,094,772 690,071,079 – – –
11,820,761,154 11,820,761,154 1,747,636,483 3,971,260,291 3,095,246,957 2,970,627,318 36,000,000
Contractual Cash flows - Group
31 March 2017 Carrying amount
Total 2 monthsor less
2–12months
1–2 years 2–5 years More than5 years
Debentures 1,488,820,927 1,488,820,927 – – 1,036,186,759 448,334,168 –
Borrowings 5,506,119,869 5,506,119,869 220,228,173 1,321,369,037 1,791,597,210 2,172,925,450 –
Finance Lease 108,000,000 108,000,000 – 8,000,000 16,000,000 40,000,000 44,000,000
Trade Creditor and Trade Payable
804,741,707 804,741,707 251,481,782 268,247,236 285,012,687 – –
Unclaimed Dividends 3,429,123 3,429,123 3,429,123 – – – –
Payable to Related Companies 218,121,349 218,121,349 – – 218,121,349 – –
Bank Overdrafts 1,187,430,452 1,187,430,452 670,864,662 516,565,790 – – –
9,308,663,428 9,308,663,428 1,146,003,741 2,114,182,062 3,346,918,006 2,661,259,618 44,000,000
The Company has 1,338,687,329 Mn overdrawn facilities as at the end of the financial year. The Company evaluates its funding requirements at requirements at frequent intervals and access debt and capital markets at appropriate times. The details of bank facilities are as follows:
Company
As at 31 March 2018 As at 31 March 2017
Facility available
Rs.
Facility utilised
Rs.
Facility available
Rs.
Facility utilised
Rs.
OverdraftHNB 640,000,000 929,061,798 640,000,000 879,945,018
Sampath Bank 230,000,000 364,510,931 230,000,000 38,851,342
DFCC 90,000,000 45,114,600 90,000,000 88,875,523
960,000,000 1,338,687,329 960,000,000 1,007,671,883

203
Not
es to
the
Fina
ncia
l Sta
tem
ents
Market RiskMarket risk is the risk that changes in market prices, such as foreign exchange rates, interest rates and equity prices will affect the Company’s income or the value of its holdings of financial instruments. The objective of market risk management is to manage and control market risk exposures within acceptable parameters, while optimising the return.
Currency RiskThe Company is exposed to currency risk on receipts, payments and borrowings that are denominated in a currency other than Sri Lankan Rupees. In respect of other monetary assets and liabilities denominated in foreign currencies, the Company’s policy is to ensure that its net exposure is kept to an acceptable level by buying or selling foreign currencies at spot rates when necessary to address short-term imbalances.
Interest Rate RiskThe Company does not account for any fixed rate financial assets and liabilities at fair value through profit or loss, and the Company does not designate derivatives as hedging instruments under a fair value hedge accounting model. Therefore a change in interest rates at the reporting date would not affect profit or loss.
The interest rate profile of the Company’s interest-bearing financial instruments as reported to the management of the Company is as follows:
Nominal Amount
As at 31 March 2018
As at 31 March 2017
Fixed rate instrumentsFinancial Assets 4,624,056,573 2,956,499,594
Financial Liabilities 2,490,373,924 2,424,892,702
7,114,430,497 5,381,392,296
Variable-rate instrumentsFinancial Assets 1,213,852,368 929,579,366
Financial Liabilities 6,430,537,502 5,087,112,827
7,644,389,871 6,016,692,192
Capital ManagementThe Board’s policy is to maintain a strong capital base so as to maintain investor, creditor and market confidence and to sustain development of the business. Capital consists of ordinary shares, retained earnings and revaluation reserve of the Group. The Board of Directors monitors the return on capital as well as the level of dividends to ordinary shareholders. Operational risk Operational risk arises due to inadequate or failed internal processes, people and systems or from external events. Operational risk events which include legal and regulatory implications could lead to financial and reputational losses to the Group. The Operational Risk Management framework of the Company has been defined under the Board-approved Operational Risk Management Policy. Operational risk is managed by establishing an appropriate internal control system that requires a mechanism for segregation of related responsibilities within the Company, and a detailed testing and verification of the Company’s overall operational systems, and achieving a full harmony between internal and external systems and establishing a fully independent back-up facility for business continuity planning.


205
Ann
exes
ANNEXESIndependent Assurance Report 206GRI Content Index 208Quarterly Statistics 211 Ten Year Statistical Summary 212Notice of Meeting 214Form of Proxy 215

206
Naw
alok
a H
osp
ital
s P
LC
|
A
nn
ual
Rep
ort 2
017/
18
INDEPENDENT ASSURANCE REPORT
Independent Assurance Report to Nawaloka Hospitals PLCWe have been engaged by the Directors of Nawaloka Hospitals PLC (“the Company”) to provide reasonable assurance and limited assurance in respect of the Sustainability Indicators as identified below for the year ended 31 March 2018. The Sustainability Indicators are included in the Nawaloka Hospitals PLC’s Integrated Annual Report for the year ended 31st March 2018 (the “Report”).
The Reasonable Assurance Sustainability Indicators covered by our reasonable assurance engagement are:
Assured Sustainability Indicators Integrated Annual Report Page
Financial Highlights presented under “Year at a Glance”
6
The Limited Assurance Sustainability Indicators covered by our limited assurance engagement are:Limited assurance sustainability indicators Integrated
Annual Report page
Non-Financial Highlights presented under “Year at a Glance”
7
Information provided on following stakeholder groups:
– Shareholders – Financial Capital and Investor capital
37-40, 49-51
– Customers – Customer Capital and Intellectual Capital
54-65,41-47
– Environment and Society – Social and Environmental Capital
89-105
– Employees – Employee Capital 67-81
– Suppliers – Business Partner Capital 83-87 Our conclusions: Our conclusion has been formed on the basis of, and is subject to, the matters outlined in this Report.
We believe that the evidence we have obtained is sufficient and appropriate to provide a basis for our conclusions.
Reasonable assurance sustainability indicators In our opinion, the Reasonable Assurance Sustainability Indicators, as defined above, for the year ended 31st March 2018 are, in all material respects, prepared and presented in accordance with the GRI Standards. Limited assurance sustainability indicators Based on the limited assurance procedures performed and the evidence obtained, as described below, nothing has come to our attention that causes us to believe that the Limited Assurance Sustainability Indicators, as defined above, for the year ended 31st March 2018, have not in all material respects, been prepared and presented in accordance with the GRI Standards.
Management’s responsibility Management is responsible for the preparation and presentation of the Reasonable Assurance Sustainability Indicators and the Limited Assurance Sustainability Indicators in accordance with the GRI Standards.
These responsibilities includes establishing such internal controls as management determines are necessary to enable the preparation of the Reasonable Assurance Sustainability Indicators and the Limited Assurance Sustainability Indicators that are free from material misstatement whether due to fraud or error.
Management is responsible for preventing and detecting fraud and for identifying and ensuring that the Company complies with laws and regulations applicable to its activities.
Management is also responsible for ensuring that staff involved with the preparation and presentation of the description and Report are properly trained, information systems are properly updated and that any changes in reporting encompass all significant business units.
Our responsibility Our responsibility is to express a reasonable assurance conclusion on the Company’s preparation and presentation of the Reasonable Assurance Sustainability Indicators and a limited assurance conclusion on the preparation and presentation of the Limited Assurance Sustainability Indicators included in the Report, as defined above.
M.R. Mihular FCA P.Y.S. Perera FCA C.P. Jayatilake FCAT.J.S. Rajakarier FCA W.W.J.C. Perera FCA Ms. S. Joseph FCAMs. S.M.B. Jayasekara ACA W.K.D.C Abeyrathne FCA S.T.D.L. Perera FCAG.A.U. Karunaratne FCA R.M.D.B. Rajapakse FCA Ms. B.K.D.T.N. Rodrigo FCAR.H. Rajan ACA M.N.M. Shameel ACA
Principals - S.R.I. Perera FCMA(UK), LLB, Attorney-at-Law, H.S. Goonewardene ACA Ms. C.T.K.N. Perera ACA

207
Ind
epen
den
t Ass
uran
ce R
Epo
rt
We conducted our assurance engagement in accordance with Sri Lanka Standard on Assurance Engagements SLSAE 3000: Assurance Engagements other than Audits or Reviews of Historical Financial Information (SLSAE 3000) issued by the Institute of Chartered Accountants of Sri Lanka.
We have complied with the independence and other ethical requirements of the Code of Ethics issued by the Institute of Chartered Accountants of Sri Lanka.
SLSAE 3000 requires that we plan and perform the engagement to obtain reasonable assurance about whether the Reasonable Assurance Sustainability Indicators are free from material misstatement and limited assurance about whether the Limited Assurance Sustainability Indicators are free from material misstatement.
Reasonable assurance over Reasonable Assurance Sustainability Indicators The procedures selected in our reasonable assurance engagement depend on our judgment, including the assessment of the risks of material misstatement of the Reasonable Assurance Sustainability Indicators whether due to fraud or error.
In making those risk assessments, we have considered internal control relevant to the preparation and presentation of the Reasonable Assurance Sustainability Indicators in order to design assurance procedures that are appropriate in the circumstances, but not for the purposes of expressing a conclusion as to the effectiveness of the Company's internal control over the preparation and presentation of the Report.
Our engagement also included assessing the appropriateness of the Reasonable Assurance Sustainability Indicators, the suitability of the criteria, being the GRI Standards, used by the Company in preparing and presenting the Reasonable Assurance Sustainability Indicators within the Report, obtaining an understanding of the compilation of the financial and non-financial information to the sources from which it was obtained, evaluating the reasonableness of estimates made by the Company, and re-computation of the calculations of the Reasonable Assurance Sustainability Indicators.
Limited assurance on the assured sustainability indicators Our limited assurance engagement on the Limited Assurance Sustainability Indicators consisted of making enquiries, primarily of persons responsible for the preparation of the Limited Assurance Sustainability Indicators, and applying analytical and other procedures, as appropriate. These procedures included:
• interviews with senior management and relevant staff at corporate and selected site level concerning sustainability strategy and policies for material issues, and the implementation of these across the business;
• enquiries of management to gain an understanding of the Company's processes for determining material issues for the Company's key stakeholder groups;;
• enquiries of relevant staff at corporate and selected site level responsible for the preparation of the Limited Assurance Sustainability Indicators;
• enquiries about the design and implementation of the systems and methods used to collect and report the Limited Assurance Sustainability Indicators, including the aggregation of the reported information;
• comparing the Limited Assurance Sustainability Indicators to relevant underlying sources on a sample basis to determine whether all the relevant information has been appropriately included in the Report;
• reading the Limited Assurance Sustainability Indicators presented in the Report to determine whether they are in line with our overall knowledge of, and experience with, the sustainability performance of the Company;
• reading the remainder of the Report to determine whether there are any material misstatements of fact or material inconsistencies based on our understanding obtained as part of our assurance engagement.
The procedures performed in a limited assurance engagement vary in nature and timing from, and are less in extent than for, a reasonable assurance engagement, and consequently the level of assurance obtained in a limited assurance engagement is substantially lower than the assurance that would have been obtained had a reasonable assurance engagement been performed. Accordingly, we do not express a reasonable assurance conclusion on the Limited Assurance Sustainability Indicators.
Purpose of our report In accordance with the terms of our engagement, this assurance report has been prepared for the Company for the purpose of assisting the Directors in determining whether the Company's Reasonable and Limited Assurance Sustainability Indicators are prepared and presented in accordance with the GRI Standards and for no other purpose or in any other context.
Restriction of use of our report Our report should not be regarded as suitable to be used or relied on by any party wishing to acquire rights against us other than the Company, for any purpose or in any other context. Any party other than the Company who obtains access to our report or a copy thereof and chooses to rely on our report (or any part thereof) will do so at its own risk. To the fullest extent permitted by law, we accept or assume no responsibility and deny any liability to any party other than the Company for our work, for this independent assurance report, or for the conclusions we have reached.
CHARTERED ACCOUNTANTS
23rd May 2018 Colombo

208
Naw
alok
a H
osp
ital
s P
LC
|
A
nn
ual
Rep
ort 2
017/
18
GRI CONTENT INDEX
GRI Standard/Disclosure Page No. Report commentary title
GRI 102: General Disclosures 2016
Organisational profile
102-1 Name of the organisation 211 Corporate information
102-2 Activities, brands, products and services 55-59 Customer capital
102-3 Location of headquarters 213 Corporate information
102-4 Location of operations 213 Corporate information
102-5 Ownership and legal form 213 Corporate information
102-6 Markets served 60 Customer touch points
102-7 Scale of the organisation 5 About Nawaloka
102-8 Information on employees and other workers 67 Employee capital
102-9 Supply chain 83 Business partner capital
102-10 Significant changes to the organisation and its supply chain 5 About Nawaloka
102-11 Precautionary Principle or approach 3 About this report
102-12 External initiatives Business partner capital
102-13 Membership of associations 86 Business partner capital
Strategy
102-14 Statement from senior decision-maker 10-11 Chairman/Ceo’s Message
102-15 Key impacts, risks, and opportunities 132 Risk management
Ethics and integrity
102-16 Values, principles, standards, and norms of behavior 45 Institutional capital
102-17 Mechanisms for advice and concerns about ethics 81 Human capital
Governance
102-18 Governance structure 118 Governance Structure of Nawaloka Hospitals PLC
102-19 Delegating authority 35 Management approach (Materiality)
102-20 Executive-level responsibility for economic, environmental, and social topics 106 Board of Directors
102-22 Composition of the highest governance body and its committees 106 Stewardship
102-23 Chair of the highest governance body 106 Stewardship
102-24 Nominating and selecting the highest governance body 106 Stewardship
102-26 Role of highest governance body in setting purpose, values, and strategy 118
Governance Structure of Nawaloka Hospitals PLC
102-35 Remuneration policies Remuneration and nomination committee report. (Stewardship) And notes to the Financial Reports
102-36 Process for determining remuneration141
Remuneration and nomination committee report. (Stewardship)
Stakeholder engagement
102-40 List of stakeholder groups 29 Stakeholders
102-41 Collective bargaining agreements 79 Employee capital
102-42 Identifying and selecting stakeholders 29 Stakeholders (Business model)
102-43 Approach to stakeholder engagement 29 Stakeholders
102-44 Key topics and concerns raised 29 Stakeholders
Reporting practice
102-45 Entities included in the consolidated financial statements 3 Report boundary and materiality
102-46 Defining report content and topic boundaries 3 Report boundary and materiality
102-47 List of material topics 35 Materiality
102-48 Restatements of information 3 Report boundary and materiality

209
GR
I Con
tent
Ind
ex
GRI Standard/Disclosure Page No. Report commentary title
102-49 Changes in reporting 3 Report boundary and materiality
102-50 Reporting period 3 Report period
102-51 Date of most recent report 3 Report period
102-52 Reporting cycle 3 Report period
102-53 Contact point for questions regarding the report 3 About this report
102-54 Claims of reporting in accordance with the GRI Standards 3 About this report
102-55 GRI content index 207 GRI content index
102-56 External assurance 205 Independent Assurance Report
GRI 103: Management Approach 2016
103-1 Explanation of the material topic and its Boundaries 3 Report boundary and materiality
103-2 The management approach and its components 35 Management approach (Materiality)
GRI 200: Economic
GRI 201: Economic performance 2016
201-1 Direct economic value generated and distributed 37 Financial capital
201-3 Defined benefit plan obligations and other retirement plans 73 Employee capital
201-4 Financial assistance received from government 40 Financial capital
GRI 202: Market presence 2016
202-2 Proportion of senior management hired from the local community 69 Employee capital
GRI 203: Indirect Economic Impacts
203-1 Infrastructure investments and services supported 89 Social and Environmental Capital
203-2 Significant indirect economic impacts 89 Social and Environmental Capital
GRI 204: Procurement practices 2016
204-1 Proportion of spending on local suppliers 86 Business partner capital
GRI 205: Anti-corruption 2016
205-2 Communication and training about anti-corruption policies and procedures 65 Customer capital
205-3 Confirmed incidents of corruption and actions taken 65 Customer capital
GRI 206: Anti-competitive Behaviour
206-1 Legal actions for anti-competitive behaviour, anti-trust, and monopoly practices 65 Customer capital
GRI 301: Materials
301-1 Materials used by weight or volume 101 Environmental Capital
301-2 Recycled input materials used 97 Environmental Capital
301-3 Reclaimed products and their packaging materials 97 Environmental Capital
GRI 302: Energy
302-1 Energy consumption within the organisation 97 Environmental Capital
302-4 Reduction of energy consumption 97 Environmental capital
302-5 Reductions in energy requirements of products and services 97 Environmental capital
GRI 303: Water
303-1 Water withdrawal by source 97 Environmental Capital

210
Naw
alok
a H
osp
ital
s P
LC
|
A
nn
ual
Rep
ort 2
017/
18
GRI Standard/Disclosure Page No. Report commentary title
GRI 304: Biodiversity
304-2 Significant impacts of activities, products, and services on biodiversity 97 Environmental capital
GRI 305: Emissions
305-2 Energy indirect (Scope 2) GHG emissions 105 Environmental capital
305-3 Other indirect (Scope 3) GHG emissions 105 Environmental capital
GRI 306: Effluents and Waste
306-2 Waste by type and disposal method 105 Environmental capital
GRI 308: Supplier Environmental Assessment
308-1 New suppliers that were screened using environmental criteria 99 Environmental capital
401-1 New employee hires and employee turnover69
Recruitment(Employee capital)
401-2 Benefits provided to full-time employees that are not provided to temporary or part-time employees 76 Employee capital
401-3 Parental leave 76 Employee capital
GRI 402: Labour/Management relations 2016
402-1 Minimum notice periods regarding operational changes 79 Employee capital
GRI 403: Occupational health and safety 2016
403-2 Types of injury and rates of injury, occupational diseases, lost days, and absenteeism, and number of work-related fatalities 80 Employee capital
403-4 Health and safety topics covered in formal agreements with trade unions 80 Employee capital
GRI 404: Training and education 2016
404-1 Average hours of training per year per employee 71 Training and development
404-2 Programmes for upgrading employee skills and transition assistance programs 71 Training and development
GRI 405: Diversity and equal opportunity 2016
405-1 Diversity of governance bodies and employees 67-70 Employee capital
GRI 407: Freedom of association and collective bargaining 2016
407-1 Operations and suppliers in which the right to freedom of association and collective bargaining may be at risk 79 Employee capital
GRI 408: Child labour 2016
408-1 Operations and suppliers at significant risk for incidents of child labour 81 Employee capital
GRI 412: Human Rights Assessment
412-2 Employee training on human rights policies or procedures 81 Employee capital
GRI 413: Local communities 2016
413-1 Operations with local community engagement, impact assessments, and development programs 89
Social andEnvironmental capital
GRI 417: Marketing and labelling 2016
417-1 Requirements for product and service information and labelling 63 Customer capital
417-2 Incidents of non-compliance concerning product and service information and labelling 63 Customer capital
417-3 Incidents of non-compliance concerning marketing communications 64 Customer capital

211
Qua
rter
ly S
tati
stic
s
QUARTERLY STATISTICS
As at 2017/18 2016/17
(Rs. ’000) 31.03.2018 31.12.2017 30.09.2017 30.06.2017 31.03.2017 31.12.2016 30.09.2016 30.06.2016
Balance sheet data
Total non-current assets 13,860,941 13,768,373 12,907,932 12,034,663 11,178,260 10,888,125 10,218,952 9,798,348
Shareholders’ funds 4,258,505 4,509,570 4,489,832 4,518,383 4,434,605 4,050,871 4,000,791 4,040,226
For the three months ended Total 31.03.2018 31.12.2017 30.09.2017 30.06.2017 Total 31.03.2017 31.12.2016 30.09.2016 30.06.2016
Income statement data
Revenue 7,955,279 2,149,573 1,976,064 2,008,261 1,821,381 6,299,910 1,590,953 1,648,963 1,599,452 1,460,642
Gross profit 4,403,929 1,484,871 932,683 1,042,158 944,217 3,302,634 927,815 834,148 807,669 733,002
Net profit before tax 557,196 191,780 56,735 183,404 125,277 302,155 60,093 109,411 84,323 48,328
Market price per share (Rs.) 31.03.2018 31.12.2017 30.09.2017 30.06.2017 31.03.2017 31.12.2016 30.09.2016 30.06.2016
Ordinary share information
Nominal value per share Rs. 1.00
High 4.80 5.20 4.90 4.80 4.70 4.80 4.80 5.00
Low 4.50 4.60 4.50 4.50 4.20 4.30 4.60 3.40
Closing 4.60 4.60 4.60 4.70 4.70 4.50 4.60 4.10
31.03.2018 31.12.2017 30.09.2017 30.06.2017 31.03.2017 31.12.2016 30.09.2016 30.06.2016
Financial measures
Return on shareholders’ funds (%) (0.84) 0.44 2.50 1.85 1.86 2.15 2.10 1.20
Net assets per share (Rs.) 3.02 3.20 3.19 3.21 3.15 2.87 2.84 2.87

212
Naw
alok
a H
osp
ital
s P
LC
|
A
nn
ual
Rep
ort 2
017/
18
TEN YEAR STATISTICAL SUMMARY
2017/18 2016/17 2015/16 2014/15 2013/14 (Restated)
2012/13 2011/12 2010/11 2009/10 2008/09
Group
Income Statement Data
Revenue 7,955,278,613 6,299,910,436 5,860,218,161 4,602,433,640 3,993,473,302 4,222,907,733 3,710,878,442 3,233,035,096 2,884,449,093 2,512,350,553
Cost of services (3,551,349,412) (2,997,276,079) (2,906,572,342) (2,331,583,775) (1,910,510,751) (2,013,392,367) (1,823,670,511) (1,645,969,580) (1,442,227,937) (1,306,238,370)
Gross profit 4,403,929,201 3,302,634,357 2,953,645,819 2,270,849,865 2,082,962,551 2,209,515,366 1,887,207,931 1,587,065,516 1,442,221,156 1,206,112,183
Other operating income 198,816,074 70,375,782 94,495,240 65,199,571 64,194,796 44,047,999 30,210,657 38,603,398 19,811,729 10,337,940
Profit from operations 1,174,203,124 654,060,357 637,208,825 352,342,610 475,165,536 599,414,193 459,028,530 324,001,074 415,343,605 294,511,336
Net profit after taxation 179,958,539 240,874,683 206,034,228 87,470,836 208,953,909 452,260,028 270,686,563 1,070,722,130 97,411,122 (108,502,591)
Balance Sheet Data
Shareholders’ funds 4,258,504,793 4,434,605,437 3,994,897,962 3,887,681,839 3,902,955,947 3,756,665,160 3,170,442,180 2,970,230,897 1,903,329,941 1,963,001,143
Financial Ratios
Gross Profit Ratio(%) 55 52 50 49 52 52 51 49 50 48
Net Profit Ratio(%) 2 4 4 2 5 11 7 33 3 (4)
Increase in Revenue(%) 26 8 27 15 -5 14 15 12 15 12
Return on Equity (%) 4.23 5.43 5.16 2.25 5 12 9 36 5 (6)
Current Asset Ratio 0.67 0.83 0.89 1.03 1.11 0.71 0.58 0.43 0.74 0.62
Quick Asset Ratio 0.56 0.73 0.70 0.80 0.85 0.48 0.42 0.29 0.63 0.51
Return on assets (%) 1 2 2 1 3 8 5 24 2 (3)
Debt/Equity Ratio 1.86 1.37 1.27 0.84 0.58 0.25 0.28 0.23 0.63 0.60
Earnings/(Loss) per share (After Share split) 0.13 0.17 0.15 0.06 0.15 0.32 0.19 0.76 0.14 (0.15)
Net Assets Per Share (Rs) (After Share split) 3.02 3.15 2.83 2.76 2.77 2.67 2.25 2.11 2.70 2.79
Dividend per share (Rs) 0.10 0.08 0.07 0.06 0.05 0.05 0.05 - - -
Company
Income Statement Data
Revenue 3,568,770,483 2,568,162,863 2,833,195,719 2,497,830,914 2,112,827,471 2,082,532,459 1,806,857,492 1,608,036,836 1,459,181,099 1,607,719,271
Cost of services (1,532,151,922) (1,359,482,350) (1,490,055,615) (1,229,903,547) (957,537,962) (988,218,793) (876,040,195) (767,116,507) (747,982,289) (837,431,514)
Gross profit 2,036,618,561 1,208,680,513 1,343,140,104 1,267,927,367 1,155,289,509 1,094,313,666 930,817,297 840,920,329 711,198,810 770,287,757
Other operating income 534,238,431 169,209,127 86,694,974 152,643,920 132,467,166 116,017,261 124,673,860 72,280,970 19,388,776 9,247,622
Profit from operations 993,606,987 (12,864,992) 201,126,820 375,219,106 291,176,935 313,518,573 226,817,202 147,845,400 115,917,282 81,389,336
Net profit after taxation 453,607,982 (436,680,843) (127,565,499) 89,938,006 107,751,965 254,942,375 152,363,098 98,822,914 19,315,469 8,694,800
Balance Sheet Data
Shareholders’ funds 1,274,086,896 974,254,815 1,466,336,065 1,693,759,266 1,704,925,831 1,660,056,411 1,496,177,022 1,414,289,204 1,350,703,926 1,331,388,457
Financial Ratios
Gross Profit Ratio (%) 57 47 47 51 55 53 52 52 49 48
Net Profit Ratio (%) 13 (17) (5) 4 5 12 8 6 1 1
Increase in Revenue (%) 39 (9) 13 18 1 15 12 10 (13) (4)
Return on Equity (%) 36 (45) (9) 5.31 6 15 10 7 1 1
Current Asset Ratio 1.37 1.30 1.83 1.62 1.12 0.53 0.57 0.61 0.92 1.03
Quick Asset Ratio 1.31 1.24 1.75 1.53 1.01 0.48 0.53 0.57 0.89 1.00
Return on assets (Rs.) 4 (5) (2) 2 2 7 5 5 1 0
Debt/Equity Ratio 3.75 4.80 3.21 1.78 1.20 0.16 0.2 0.2 0.27 0.29
Earnings/(Loss) per share (After Share split) 0.32 (0.31) (0.09) 0.06 0.08 0.18 0.11 0.07 0.03 0.01
Net Assets Per Share (Rs.) (After Share split) 0.90 0.69 1.04 1.20 1.21 1.18 1.06 1 1.92 1.89
Dividend per share (Rs.) 0.10 0.08 0.07 0.06 0.05 0.05 0.05 – – –

213
Ten
Yea
r St
atis
tica
l Sum
mar
y
2017/18 2016/17 2015/16 2014/15 2013/14 (Restated)
2012/13 2011/12 2010/11 2009/10 2008/09
Group
Income Statement Data
Revenue 7,955,278,613 6,299,910,436 5,860,218,161 4,602,433,640 3,993,473,302 4,222,907,733 3,710,878,442 3,233,035,096 2,884,449,093 2,512,350,553
Cost of services (3,551,349,412) (2,997,276,079) (2,906,572,342) (2,331,583,775) (1,910,510,751) (2,013,392,367) (1,823,670,511) (1,645,969,580) (1,442,227,937) (1,306,238,370)
Gross profit 4,403,929,201 3,302,634,357 2,953,645,819 2,270,849,865 2,082,962,551 2,209,515,366 1,887,207,931 1,587,065,516 1,442,221,156 1,206,112,183
Other operating income 198,816,074 70,375,782 94,495,240 65,199,571 64,194,796 44,047,999 30,210,657 38,603,398 19,811,729 10,337,940
Profit from operations 1,174,203,124 654,060,357 637,208,825 352,342,610 475,165,536 599,414,193 459,028,530 324,001,074 415,343,605 294,511,336
Net profit after taxation 179,958,539 240,874,683 206,034,228 87,470,836 208,953,909 452,260,028 270,686,563 1,070,722,130 97,411,122 (108,502,591)
Balance Sheet Data
Shareholders’ funds 4,258,504,793 4,434,605,437 3,994,897,962 3,887,681,839 3,902,955,947 3,756,665,160 3,170,442,180 2,970,230,897 1,903,329,941 1,963,001,143
Financial Ratios
Gross Profit Ratio(%) 55 52 50 49 52 52 51 49 50 48
Net Profit Ratio(%) 2 4 4 2 5 11 7 33 3 (4)
Increase in Revenue(%) 26 8 27 15 -5 14 15 12 15 12
Return on Equity (%) 4.23 5.43 5.16 2.25 5 12 9 36 5 (6)
Current Asset Ratio 0.67 0.83 0.89 1.03 1.11 0.71 0.58 0.43 0.74 0.62
Quick Asset Ratio 0.56 0.73 0.70 0.80 0.85 0.48 0.42 0.29 0.63 0.51
Return on assets (%) 1 2 2 1 3 8 5 24 2 (3)
Debt/Equity Ratio 1.86 1.37 1.27 0.84 0.58 0.25 0.28 0.23 0.63 0.60
Earnings/(Loss) per share (After Share split) 0.13 0.17 0.15 0.06 0.15 0.32 0.19 0.76 0.14 (0.15)
Net Assets Per Share (Rs) (After Share split) 3.02 3.15 2.83 2.76 2.77 2.67 2.25 2.11 2.70 2.79
Dividend per share (Rs) 0.10 0.08 0.07 0.06 0.05 0.05 0.05 - - -
Company
Income Statement Data
Revenue 3,568,770,483 2,568,162,863 2,833,195,719 2,497,830,914 2,112,827,471 2,082,532,459 1,806,857,492 1,608,036,836 1,459,181,099 1,607,719,271
Cost of services (1,532,151,922) (1,359,482,350) (1,490,055,615) (1,229,903,547) (957,537,962) (988,218,793) (876,040,195) (767,116,507) (747,982,289) (837,431,514)
Gross profit 2,036,618,561 1,208,680,513 1,343,140,104 1,267,927,367 1,155,289,509 1,094,313,666 930,817,297 840,920,329 711,198,810 770,287,757
Other operating income 534,238,431 169,209,127 86,694,974 152,643,920 132,467,166 116,017,261 124,673,860 72,280,970 19,388,776 9,247,622
Profit from operations 993,606,987 (12,864,992) 201,126,820 375,219,106 291,176,935 313,518,573 226,817,202 147,845,400 115,917,282 81,389,336
Net profit after taxation 453,607,982 (436,680,843) (127,565,499) 89,938,006 107,751,965 254,942,375 152,363,098 98,822,914 19,315,469 8,694,800
Balance Sheet Data
Shareholders’ funds 1,274,086,896 974,254,815 1,466,336,065 1,693,759,266 1,704,925,831 1,660,056,411 1,496,177,022 1,414,289,204 1,350,703,926 1,331,388,457
Financial Ratios
Gross Profit Ratio (%) 57 47 47 51 55 53 52 52 49 48
Net Profit Ratio (%) 13 (17) (5) 4 5 12 8 6 1 1
Increase in Revenue (%) 39 (9) 13 18 1 15 12 10 (13) (4)
Return on Equity (%) 36 (45) (9) 5.31 6 15 10 7 1 1
Current Asset Ratio 1.37 1.30 1.83 1.62 1.12 0.53 0.57 0.61 0.92 1.03
Quick Asset Ratio 1.31 1.24 1.75 1.53 1.01 0.48 0.53 0.57 0.89 1.00
Return on assets (Rs.) 4 (5) (2) 2 2 7 5 5 1 0
Debt/Equity Ratio 3.75 4.80 3.21 1.78 1.20 0.16 0.2 0.2 0.27 0.29
Earnings/(Loss) per share (After Share split) 0.32 (0.31) (0.09) 0.06 0.08 0.18 0.11 0.07 0.03 0.01
Net Assets Per Share (Rs.) (After Share split) 0.90 0.69 1.04 1.20 1.21 1.18 1.06 1 1.92 1.89
Dividend per share (Rs.) 0.10 0.08 0.07 0.06 0.05 0.05 0.05 – – –

214
Naw
alok
a H
osp
ital
s P
LC
|
A
nn
ual
Rep
ort 2
017/
18
NOTICE OF MEETING
Notice is hereby given that the 29th Annual General Meeting of NAWALOKA HOSPITALS PLC will be held at the Orchid Hall of the “BMICH” (Bandaranaike Memorial International Conference Hall) at Bauddhaloka Mawatha, Colombo on Friday the 29th day of June 2018 at 10am for the following purposes:
Agenda
1. To receive and consider the Report of the Board of Directors on the Affairs of the Company and the Financial Statements for the year ended 31 March 2018 together with the Report of Auditors thereon;
2. To resolve in terms of Section 211 of the Companies Act No. 07 of 2007 to appoint/reappoint Mr. Rienzie T Wijetilleke (who has attained the age of 70 years) and who retires at the end of the Annual General Meeting, as a Director, and that notwithstanding him having exceeded the age of 70 years to declare that the age limit referred to in Section 210 of the said Act, shall not apply to him and subject to his rotation;
3. To resolve in terms of Section 211 of the Companies Act No. 07 of 2007 to appoint/reappoint Deshabandu Tilak De Zoysa (who has attained the age of 70 years) and who retires at the end of the Annual General Meeting, as a Director, and that notwithstanding him having exceeded the age of 70 years to declare that the age limit referred to in Section 210 of the said Act, shall not apply to him and subject to his rotation;
4. To resolve in terms of Section 211 of the Companies Act No. 07 of 2007 to appoint/reappoint Mr. Tissa K Bandaranayake (who has attained the age of 70 years) and who retires at the end of the Annual General Meeting, as a Director, and that notwithstanding him having exceeded the age of 70 years to declare that the age limit referred to in Section 210 of the said Act, shall not apply to him and subject to his rotation;
5. To resolve in terms of Section 211 of the Companies Act No. 07 of 2007 to appoint/reappoint Mr. D Sunil AbeyRatna (who has attained the age of 70 years) and who retires at the end of the Annual General Meeting, as a Director, and that notwithstanding him having exceeded the age of 70 years to declare that the age limit referred to in Section 210 of the said Act, shall not apply to him and subject to his rotation;
6. To re-elect Directors as follows:
(a) Re-elect, as a Director, in terms of Article 74, Deshabandu Tilak De Zoysa who retires by rotation and offers himself for re-election;
(b) Re-elect, as a Director, in terms of Article 74, Mr. Tissa K Bandaranayake who retires by rotation and offers himself for re-election;
(c) Re-elect, as a Director, in terms of Article 74, Mr. Palitha Kumarasinghe, PC who retires by rotation and offers himself for re-election; and
(d) Re-elect, as a Director, in terms of Article 74, Mr. Victor Rajamanner Ramanan who retires by rotation and offers himself for re-election.
7. To authorise the Board of Directors to determine and make donations to charities;
8. To reappoint Messrs KPMG (Chartered Accountants) as Auditors of the Company and authorise the Board of Directors to determine their remuneration; and
9. To transact any other business of which due notice has been given.
By Order of the Board,
Sgd
M & A Company Secretaries (Private) Limited
Company Secretaries
Date: 23rd May 2018
Notes
1. A Member is entitled to appoint a Proxy to attend and vote instead of himself/herself. A Proxy need not be a Member of the Company. A Form of Proxy accompanies this Notice.
2. The completed Form of Proxy must be deposited at the Registered Office, No. 23, Deshamanya H K Dharmadasa Mawatha, Colombo 02, Sri Lanka, not later than 10am on 27 June 2018 (Forty-Eight hours prior to the Meeting).
3. A person representing a Corporation is required to carry a certified copy of the Resolution authorising him/her to act as the Representative of the Corporation. A Representative need not be a Member.
4. A person representing a Shareholder as the Attorney (Power of Attorney) is required to carry the original or a certified copy of the said Power of Attorney.
5. The Transfer Books of the Company will be kept open.

Form
of P
roxy
FORM OF PROXYI/We …………………………………………………….....................................….....… (NIC/Passport No.) ……........…......……………..................…………………
of ……………………………………………………………………………………….....………........…............…................…………… being a member/members of NAWALOKA HOSPITALS PLC hereby appoint:
Dr H K J Dharmadasa or failing himMr Rienzie T Wijetilleke or failing himVidyaJyothi Prof Lal Chandrasena or failing himDeshabandu Tilak de Zoysa or failing himMr Tissa K Bandaranayake or failing himMr U H Dharmadasa or failing him Mr A G Dharmadasa or failing him Ms A G Dharmadasa or failing herMr D Sunil AbeyRatna or failing himMr Palitha Kumarasinghe, PC or failing himMr Victor Rajamanner Ramanan or failing him
as *my/our Proxy to** ……………………………………..……… (NIC/Passport No.) ……………………………… vote as indicated hereunder for me*/us on my*/our behalf at the Annual General Meeting of the Company to be held on the 29th day of June 2018 at 10am at the Orchid Hall of the “BMICH” (Bandaranaike Memorial International Conference Hall) at Bauddhaloka Mawatha, Colombo and at any adjournment thereof and at every poll which may be taken in consequence thereof:
For Againsti. To receive and consider the Report of the Board of Directors on the Affairs of the Company and the Financial Statement for
the year ended 31 March 2018, together with the Report of Auditors thereon;
ii. To resolve in terms of Section 211 of the Companies Act No. 07 of 2007 to appoint/reappoint Mr Rienzie T Wijetilleke (who has attained the age of 70 years) and who retires at the end of the Annual General Meeting, as a Director, and that notwithstanding him having exceeded the age of 70 years to declare that the age limit referred to in Section 210 of the said Act, shall not apply to him and subject to his rotation;
iii. To resolve in terms of Section 211 of the Companies Act No. 07 of 2007 to appoint/reappoint Deshabandu Tilak De Zoysa (who has attained the age of 70 years) and who retires at the end of the Annual General Meeting, as a Director, and that notwithstanding him having exceeded the age of 70 years to declare that the age limit referred to in Section 210 of the said Act, shall not apply to him and subject to his rotation;
iv. To resolve in terms of Section 211 of the Companies Act No. 07 of 2007 to appoint/reappoint Mr. Tissa K. Bandaranayake (who has attained the age of 70 years) and who retires at the end of the Annual General Meeting, as a Director, and that notwithstanding him having exceeded the age of 70 years to declare that the age limit referred to in Section 210 of the said Act, shall not apply to him and subject to his rotation;
v. To resolve in terms of Section 211 of the Companies Act No. 07 of 2007 to appoint/reappoint Mr. D Sunil AbeyRatna (who has attained the age of 70 years) and who retires at the end of the Annual General Meeting, as a Director, and that notwithstanding him having exceeded the age of 70 years to declare that the age limit referred to in Section 210 of the said Act, shall not apply to him and subject to his rotation;
vi. To re-elect Directors as follows:
a. Re-elect, as a Director, in terms of Article 74, Deshabandu Tilak De Zoysa who retires by rotation and offers himself for re-election;
b. Re-elect, as a Director, in terms of Article 74, Mr. Tissa K Bandaranayake who retires by rotation and offers himself for re-election;
c. Re-elect, as a Director, in terms of Article 74, Mr. Palitha Kumarasinghe, PC who retires by rotation and offers himself for re-election; and
d. Re-elect, as a Director, in terms of Article 74, Mr. Victor Rajamanner Ramanan who retires by rotation and offers himself for re-election;
vii. To authorise the Board of Directors to determine and make donations to charities;
viii. To reappoint Messrs KPMG (Chartered Accountants) as Auditors of the Company and authorise the Board of Directors to determine their remuneration; and
ix. To transact any other business of which due Notice has been given.
In witness*my/our hands this ……........................................................……… day of ………….......…… Two Thousand and Eighteen.
…………...........................…………… Signature of Shareholder/sNote:a *Please delete the inappropriate words.b **If you wish your Proxy to speak at the meeting you should interpolate the words “Speak and” in the place indicated with and initial such interpolation.

Naw
alok
a H
osp
ital
s P
LC
|
A
nn
ual
Rep
ort 2
017/
18
Instructions as to completion
1. In terms of Article 40 (a) of the Articles of Association of the Company:
The instrument appointing a Proxy shall be in writing and –
(1) in the case of an individual, shall be signed by the appointer or his Attorney (if signed by the Attorney of the Company reserves the right to request to be furnished with a copy of the said Power of Attorney); and
(2) in the case of a corporation or company shall be either under its common seal or signed by its Attorney or by an Officer on behalf of the Company.
The Company may, but shall not be bound to, furnish evidence of the authority of any such Attorney or Officer. A proxy need not be a Member of the Company.
2. Kindly perfect the Form of Proxy by filling it legibly with your full name and address and it must be signed at the space provided. Please fill in the date of signature and indicate with an "X" in the space provided, as to how your Proxy is to vote on each Resolution. If no indication is given, the Proxy, in his/her discretion may vote as he/she thinks fit.
3. In terms of Article 52 of the Articles of Association of the Company in the case of joint-holding of a share, the Senior tenders a vote, whether in person or by Proxy or by Attorney or by Representative and that vote shall be accepted to the exclusion of the votes of the other joint-holders and for this purpose seniority shall be determined by the order in which the names stand in the Register of Members in respect of the joint-holding.
4. In case of a joint-holding only one member or his duly appointed Proxy may attend.
5. To be valid, the completed Form of Proxy should be deposited at the Registered Office of the Company situated at No. 23, Deshamanya H K Dharmadasa Mawatha, Colombo 02 not later than 48 hours of the date and time appointed for the meeting.


Produced by Smart Media (Pvt) Limited, a carbon neutral company that offsets its direct and indirect GHG emissions, including those resulting from the usage of paper and outsourced printing through verified sources.
Prepared using the Smart Integrated Reporting MethodologyTM of Smart Media The Annual Report Company, this report captures the essence of the IIRC <IR> Framework and the GRI Standards.
CORPORATE INFORMATION
Name of the CompanyNawaloka Hospitals PLC
Company Registration No.PQ 78
Registered OfficeNo. 23, Deshamanya H K Dharmadasa Mawatha, Colombo 00200, Sri Lanka.Telephone : +94 115 577 111, +94 112 304 444-56Telefax : +94 112 430 393E-mail : [email protected] : www.nawaloka.com
Legal FormQuotedPublicCompanywithlimitedliabilityincorporatedinSriLankaundertheCompaniesOrdinance1938and re-registeredundertheCompaniesActNo.07of2007.
Board of Directors1. Dr Jayantha Dharmadasa (Chairman & CEO)2. MrRTWijetilleke(Vice-Chairman)3. VidyaJyothi Prof L G Chandrasena (Director/GeneralManager)
4. Deshabandu Tilak de Zoysa5. Mr Tissa K Bandaranayake6. Mr U H Dharmadasa7. Mr A G Dharmadasa8. Ms A G Dharmadasa9. Mr D Sunil AbeyRatna;10. Mr Palitha Kumarasinghe, PC11. Mr V Rajamanner Ramanan
Secretaries to the CompanyM&ACompanySecretaries(Private)Limited, No.28(Level2), W A D Ramanayake Mawatha, Colombo 00200, Sri Lanka.
AuditorsKPMGCharteredAccountants,No.32A,SirMohamedMacanMarkarMawatha,Colombo 00300, Sri Lanka.
Lawyer(s)NithiMurugesu&Associates Attorneys-at-Law&NotariesPublic, No.28(Level2),WADRamanayakeMawatha, Colombo 00200, Sri Lanka.
BankersHatton National Bank PLCSampath Bank PLCCommercialBankofCeylonPLCBank of CeylonDFCC BankPeoples’ BankCargills Bank
SubsidiariesNewNawalokaHospitals(Private)LimitedNewNawalokaMedicalCentre(Private)LimitedNawalokaMedicare(Private)LimitedNawalokaGreenCrossLaboratories(Private)Limited

Nawaloka Hospitals PLCNo. 23, Deshamanya H K Dharmadasa Mawatha, Colombo 2, Sri Lanka.Phone: +94 11 254 4444-56, +94 11 557 7111 Fax: +94 11 243 [email protected]