fy14 sponsored programs expenditure report prepared by the office of the associate vice president...
TRANSCRIPT
FY14 Sponsored Programs Expenditure Report
Prepared by the Office of the Associate Vice President for Research and Federal Relations
(Internal Report)
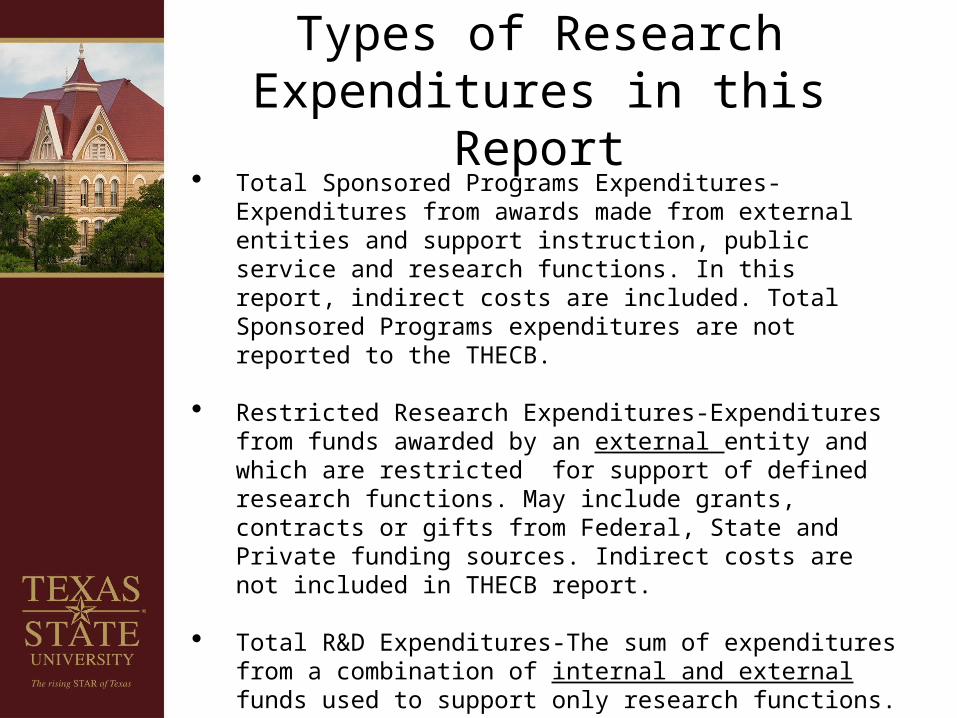
Types of Research Expenditures in this Report
Total Sponsored Programs Expenditures-Expenditures from awards made from external entities and support instruction, public service and research functions. In this report, indirect costs are included. Total Sponsored Programs expenditures are not reported to the THECB.
Restricted Research Expenditures-Expenditures from funds awarded by an external entity and which are restricted for support of defined research functions. May include grants, contracts or gifts from Federal, State and Private funding sources. Indirect costs are not included in THECB report.
Total R&D Expenditures-The sum of expenditures from a combination of internal and external funds used to support only research functions. These expenditures reflect the entire research enterprise of the institution and are reported annually to the THECB.

National Research University Funding Eligibility
Mandatory requirements
• ERU designation
• $45M in restricted research expenditures
Optional requirements
• endowments ($400M)
• number of Ph.D. degrees awarded (200 per year)
• freshman class of high academic achievement (at least 50 percent of first time entering freshmen in top 25 percent of high school class)
• recognition of research capabilities and scholarly attainment (Association of Research Library membership, Phi Beta Kappa Chapter, or Phi Kappa Phi Chapter)
• high quality faculty (5-7 faculty with various international and nationally recognized awards)
• high-quality graduate education (reflected in number of programs and graduation rates)
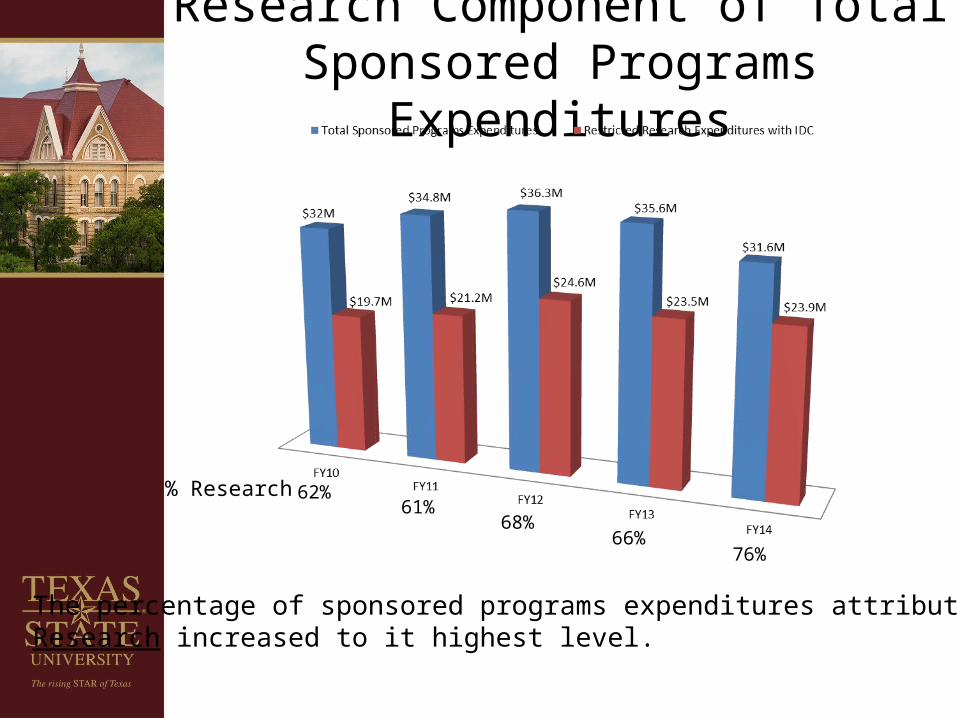
Research Component of Total Sponsored Programs Expenditures
62%61%
68%66%
76%
The percentage of sponsored programs expenditures attributed to Research increased to it highest level.
% Research

FY13-14 Variance Analysis• Total Sponsored Programs expenditures are comprised of awards classified
as Instructional/Public Service and Research.• Grants expire, commence or carry forward to next fiscal year (due to multi-
year awards and/or from no cost extensions).• Research expenditures were essentially unaffected so the net reduction in
expenditures occurred in Instructional/Public Service.• FY13 had 118 active Instructional/Public Service awards with $12M in
expenditures.• 61 FY13 awards carried forward into FY14 while 57 terminated. • FY14 had 27 few accounts with 91 active awards (61 from FY13 and 30 new
accounts) with $8M in expenditures. The expenditures from 30 new FY14 accounts ($3.1M) offset the loss in expenditures from 57 FY13 accounts that completely expired. With 27 fewer accounts there was less opportunity to offset reductions.
• The net change in total sponsored programs expenditures resulted from 61 FY13 awards ($8M) that carried forward to FY14 ($4M) or a difference of $4M. Based on the award periods the most likely reason for the decline was non-availability of funding to spend.
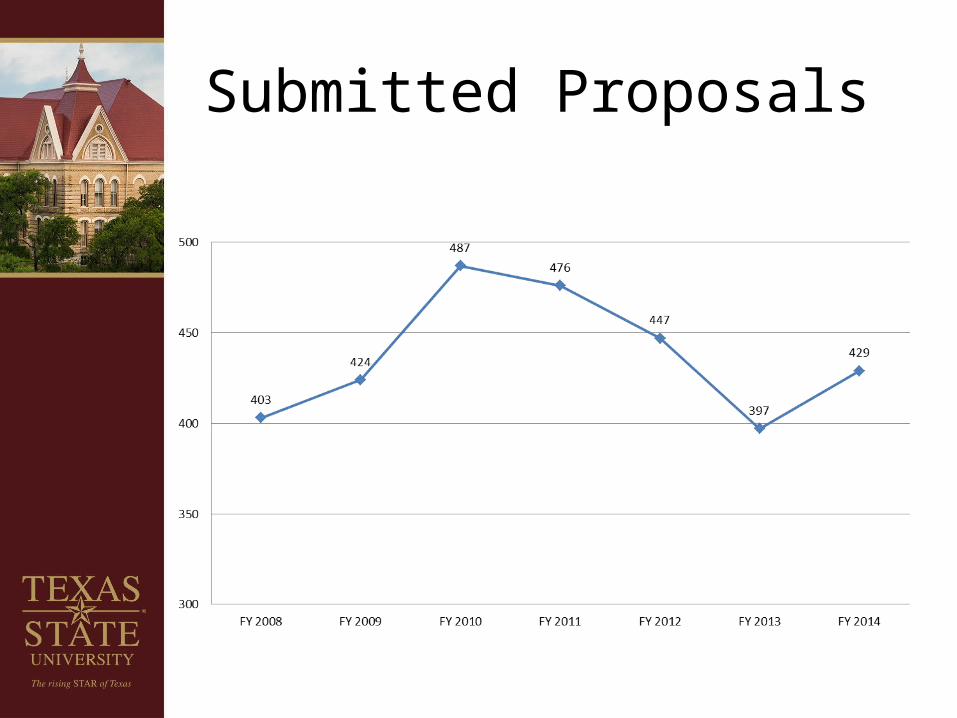
Submitted Proposals
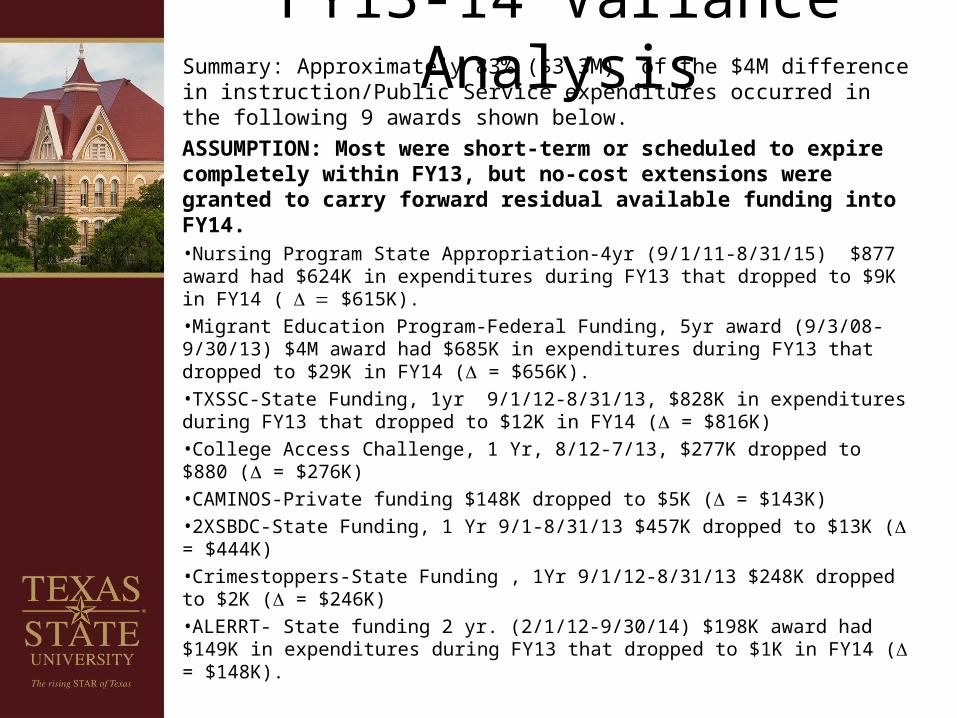
FY13-14 Variance AnalysisSummary: Approximately 83% ($3.3M) of the $4M difference in instruction/Public Service expenditures occurred in the following 9 awards shown below. ASSUMPTION: Most were short-term or scheduled to expire completely within FY13, but no-cost extensions were granted to carry forward residual available funding into FY14.•Nursing Program State Appropriation-4yr (9/1/11-8/31/15) $877 award had $624K in expenditures during FY13 that dropped to $9K in FY14 ( $615K).•Migrant Education Program-Federal Funding, 5yr award (9/3/08-9/30/13) $4M award had $685K in expenditures during FY13 that dropped to $29K in FY14 ( = $656K).•TXSSC-State Funding, 1yr 9/1/12-8/31/13, $828K in expenditures during FY13 that dropped to $12K in FY14 ( = $816K)•College Access Challenge, 1 Yr, 8/12-7/13, $277K dropped to $880 ( = $276K)•CAMINOS-Private funding $148K dropped to $5K ( = $143K)•2XSBDC-State Funding, 1 Yr 9/1-8/31/13 $457K dropped to $13K ( = $444K)•Crimestoppers-State Funding , 1Yr 9/1/12-8/31/13 $248K dropped to $2K ( = $246K)•ALERRT- State funding 2 yr. (2/1/12-9/30/14) $198K award had $149K in expenditures during FY13 that dropped to $1K in FY14 ( = $148K).
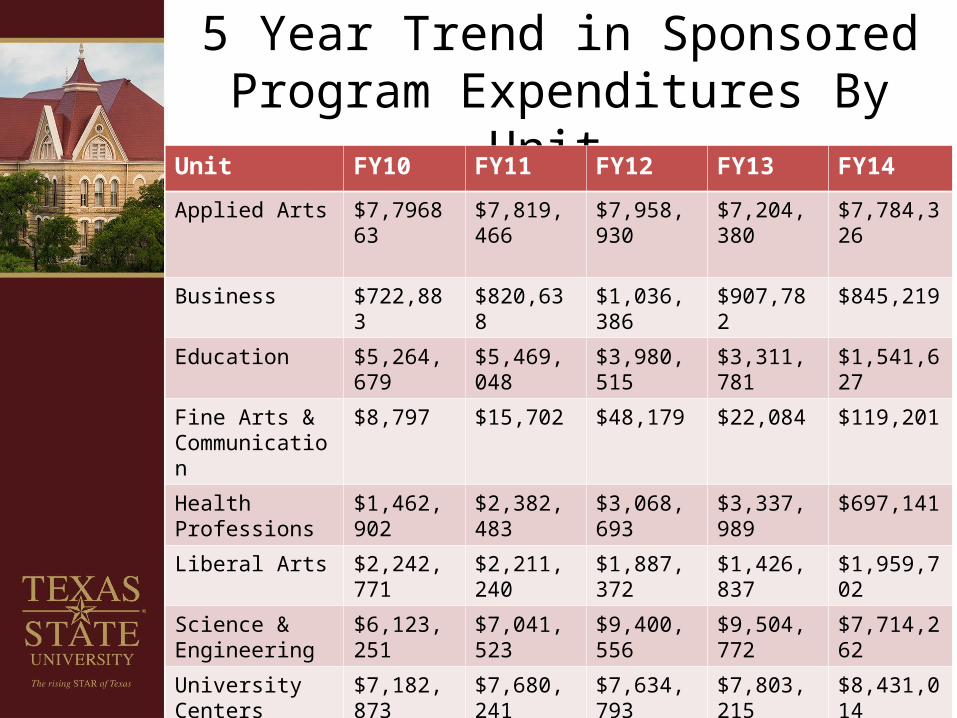
5 Year Trend in Sponsored Program Expenditures By Unit
Unit FY10 FY11 FY12 FY13 FY14
Applied Arts $7,796863 $7,819,466 $7,958,930 $7,204,380 $7,784,326
Business $722,883 $820,638 $1,036,386 $907,782 $845,219
Education $5,264,679 $5,469,048 $3,980,515 $3,311,781 $1,541,627
Fine Arts &Communication
$8,797 $15,702 $48,179 $22,084 $119,201
Health Professions
$1,462,902 $2,382,483 $3,068,693 $3,337,989 $697,141
Liberal Arts $2,242,771 $2,211,240 $1,887,372 $1,426,837 $1,959,702
Science &Engineering
$6,123,251 $7,041,523 $9,400,556 $9,504,772 $7,714,262
University Centers $7,182,873 $7,680,241 $7,634,793 $7,803,215 $8,431,014
University College $572,152 $999,931
VPSA $1,272,798 $1,340,721 $2,488,687 $1,494,225 $1,542,432
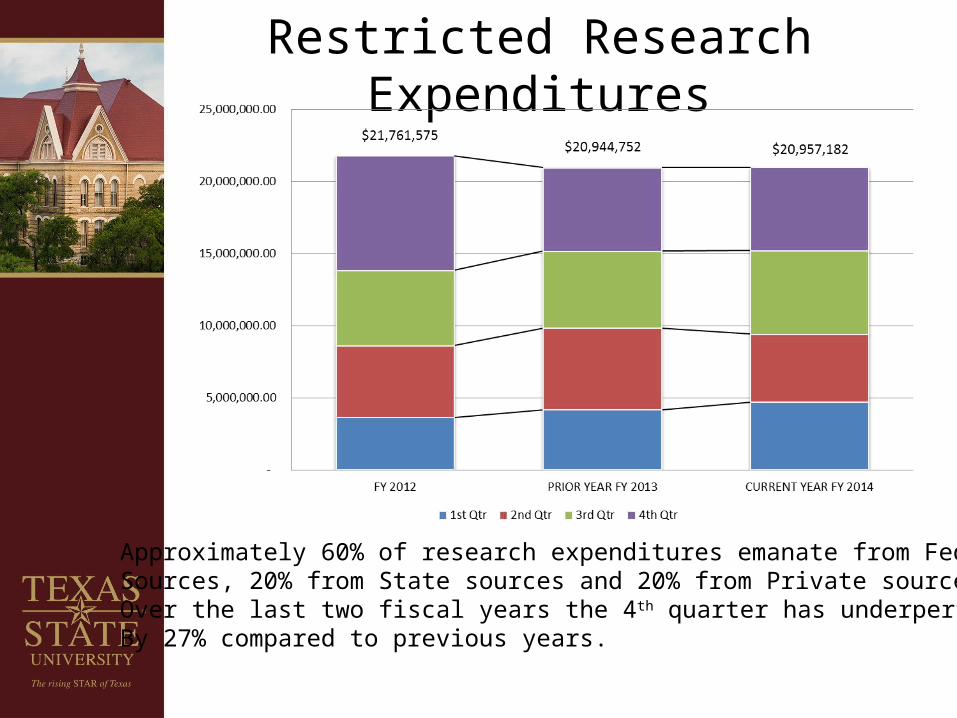
Restricted Research Expenditures
Approximately 60% of research expenditures emanate from Federal Sources, 20% from State sources and 20% from Private sources.Over the last two fiscal years the 4th quarter has underperformedBy 27% compared to previous years.
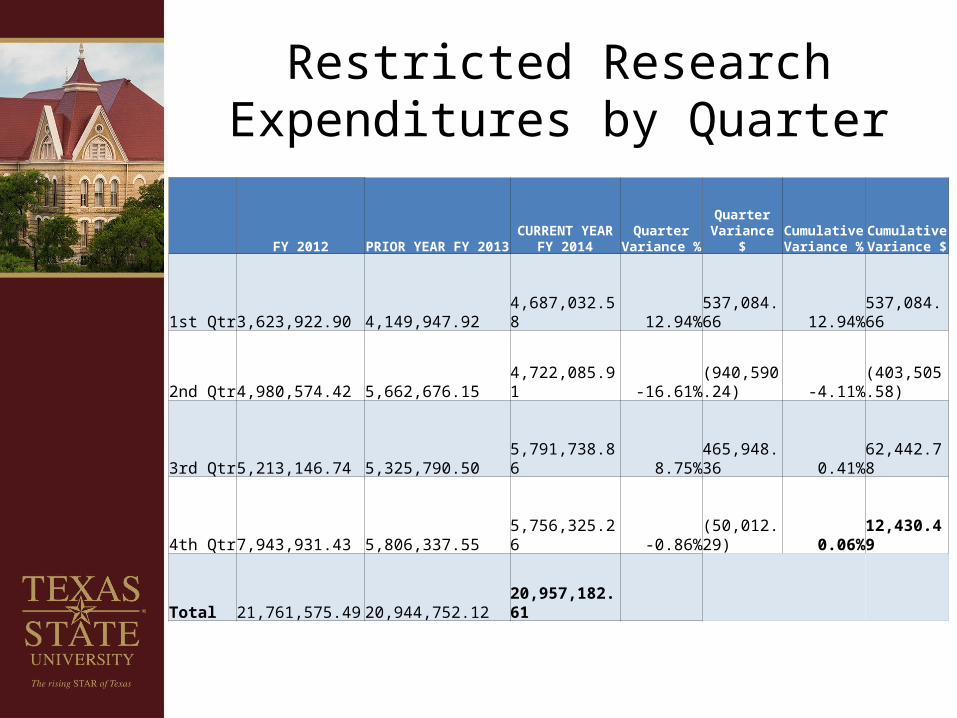
Restricted Research Expenditures by Quarter
FY 2012 PRIOR YEAR FY 2013CURRENT YEAR FY
2014Quarter
Variance %Quarter
Variance $Cumulative Variance %
Cumulative Variance $
1st Qtr 3,623,922.90 4,149,947.92 4,687,032.58 12.94%
537,084.66 12.94%
537,084.66
2nd Qtr 4,980,574.42 5,662,676.15 4,722,085.91 -16.61%
(940,590.24) -4.11%
(403,505.58)
3rd Qtr 5,213,146.74 5,325,790.50 5,791,738.86 8.75%
465,948.36 0.41%
62,442.78
4th Qtr 7,943,931.43 5,806,337.55 5,756,325.26 -0.86%
(50,012.29) 0.06%
12,430.49
Total 21,761,575.49 20,944,752.12 20,957,182.61
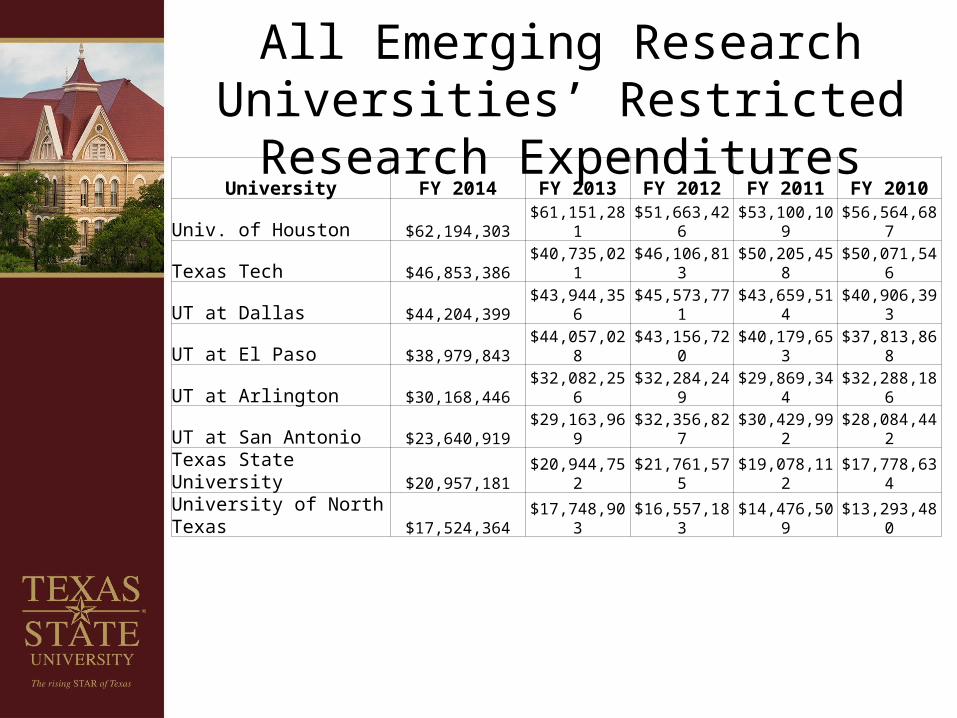
All Emerging Research Universities’ Restricted Research ExpendituresUniversity FY 2014 FY 2013 FY 2012 FY 2011 FY 2010
Univ. of Houston $62,194,303 $61,151,281 $51,663,426 $53,100,109 $56,564,687
Texas Tech $46,853,386 $40,735,021 $46,106,813 $50,205,458 $50,071,546
UT at Dallas $44,204,399 $43,944,356 $45,573,771 $43,659,514 $40,906,393
UT at El Paso $38,979,843 $44,057,028 $43,156,720 $40,179,653 $37,813,868
UT at Arlington $30,168,446 $32,082,256 $32,284,249 $29,869,344 $32,288,186
UT at San Antonio $23,640,919 $29,163,969 $32,356,827 $30,429,992 $28,084,442
Texas State University $20,957,181 $20,944,752 $21,761,575 $19,078,112 $17,778,634
University of North Texas $17,524,364 $17,748,903 $16,557,183 $14,476,509 $13,293,480
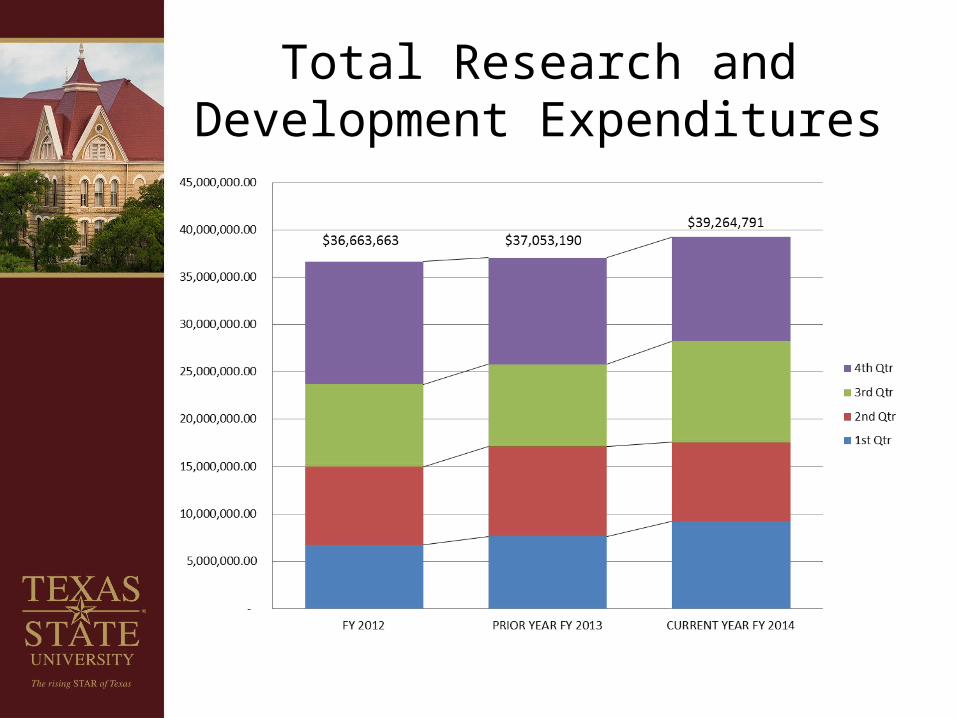
Total Research and Development Expenditures
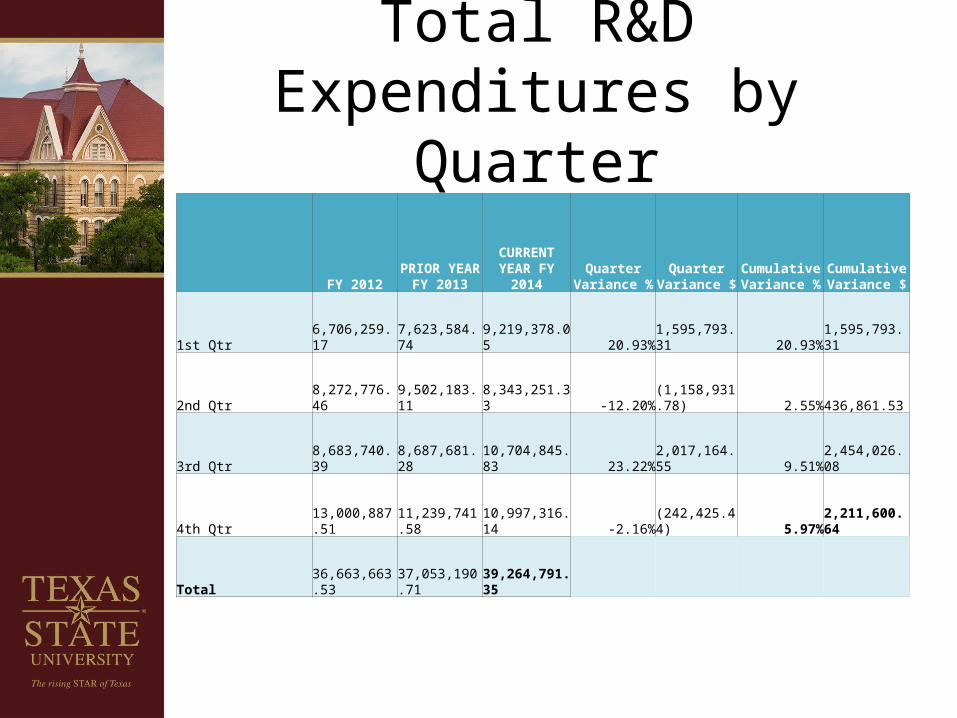
Total R&D Expenditures by Quarter
FY 2012PRIOR YEAR FY
2013CURRENT YEAR
FY 2014Quarter
Variance %Quarter
Variance $Cumulative Variance %
Cumulative Variance $
1st Qtr 6,706,259.17
7,623,584.74
9,219,378.05 20.93%
1,595,793.31 20.93%
1,595,793.31
2nd Qtr 8,272,776.46
9,502,183.11
8,343,251.33 -12.20%
(1,158,931.78) 2.55%
436,861.53
3rd Qtr 8,683,740.39
8,687,681.28
10,704,845.83 23.22%
2,017,164.55 9.51%
2,454,026.08
4th Qtr 13,000,887.51
11,239,741.58
10,997,316.14 -2.16%
(242,425.44) 5.97%
2,211,600.64
Total 36,663,663.53
37,053,190.71
39,264,791.35
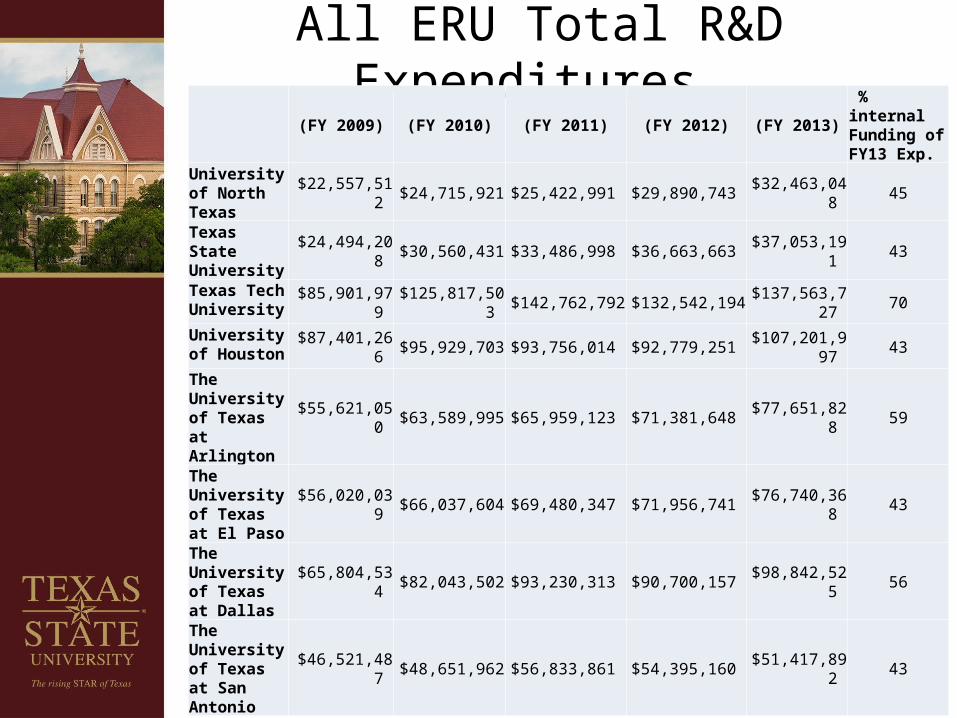
All ERU Total R&D Expenditures (FY 2009) (FY 2010) (FY 2011) (FY 2012) (FY 2013)
% internal Funding of FY13 Exp.
University of North Texas $22,557,512 $24,715,921 $25,422,991 $29,890,743 $32,463,048 45
Texas State University $24,494,208 $30,560,431 $33,486,998 $36,663,663 $37,053,191 43
Texas Tech University $85,901,979 $125,817,503 $142,762,792 $132,542,194 $137,563,727 70
University of Houston $87,401,266 $95,929,703 $93,756,014 $92,779,251 $107,201,997 43
The University of Texas at Arlington
$55,621,050 $63,589,995 $65,959,123 $71,381,648 $77,651,828 59
The University of Texas at El Paso
$56,020,039 $66,037,604 $69,480,347 $71,956,741 $76,740,368 43
The University of Texas at Dallas
$65,804,534 $82,043,502 $93,230,313 $90,700,157 $98,842,525 56
The University of Texas at San Antonio
$46,521,487 $48,651,962 $56,833,861 $54,395,160 $51,417,892 43
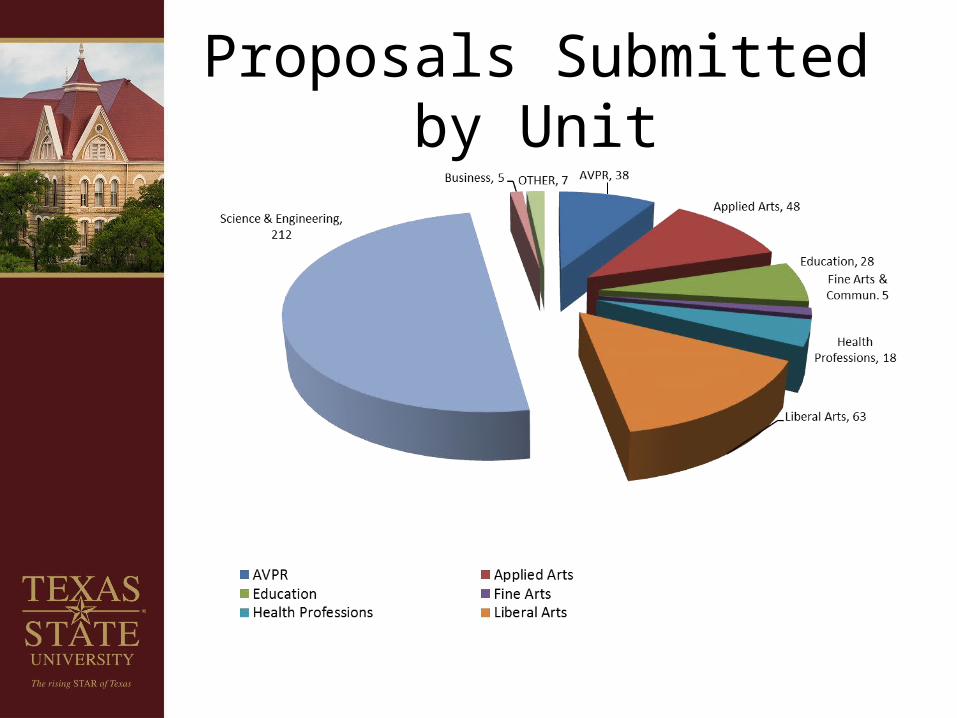
Proposals Submitted by Unit
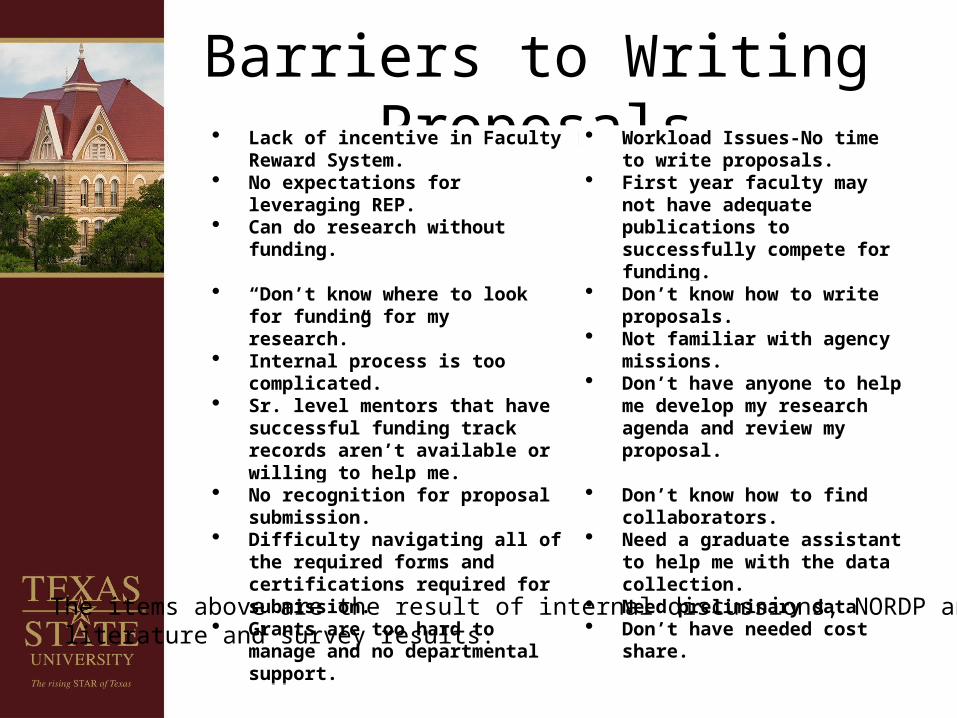
Barriers to Writing Proposals Lack of incentive in Faculty Reward
System. No expectations for leveraging REP. Can do research without funding.
Workload Issues-No time to write proposals.
First year faculty may not have adequate publications to successfully compete for funding.
“Don’t know where to look for funding for my research.”
Internal process is too complicated. Sr. level mentors that have successful
funding track records aren’t available or willing to help me.
Don’t know how to write proposals. Not familiar with agency missions. Don’t have anyone to help me
develop my research agenda and review my proposal.
No recognition for proposal submission. Difficulty navigating all of the required
forms and certifications required for submission.
Grants are too hard to manage and no departmental support.
Don’t know how to find collaborators.
Need a graduate assistant to help me with the data collection.
Need preliminary data Don’t have needed cost share.
The items above are the result of internal discussions, NORDP and other literature and survey results.
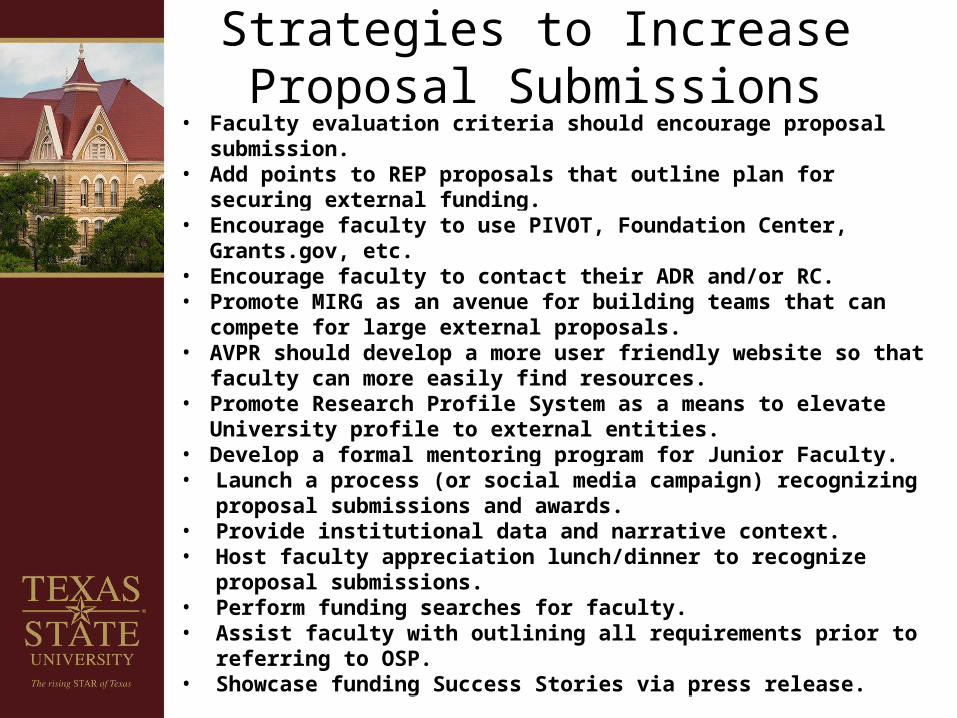
Strategies to Increase Proposal Submissions
• Faculty evaluation criteria should encourage proposal submission.• Add points to REP proposals that outline plan for securing external
funding.
• Encourage faculty to use PIVOT, Foundation Center, Grants.gov, etc.• Encourage faculty to contact their ADR and/or RC.• Promote MIRG as an avenue for building teams that can compete for large
external proposals.• AVPR should develop a more user friendly website so that faculty can
more easily find resources.• Promote Research Profile System as a means to elevate University profile
to external entities.• Develop a formal mentoring program for Junior Faculty.
• Launch a process (or social media campaign) recognizing proposal submissions and awards.
• Provide institutional data and narrative context.• Host faculty appreciation lunch/dinner to recognize proposal
submissions.• Perform funding searches for faculty.• Assist faculty with outlining all requirements prior to referring to OSP. • Showcase funding Success Stories via press release.