fy18-19 adopted budget 1 - district.maricopa.edu · section a: general overview may 22, 2018...
TRANSCRIPT
FY18-19 ADOPTED BUDGET 1

Table of Contents
SECTION A: GENERAL OVERVIEW ....................................................................................................................... 1
Administration and Addresses ....................................................................................................................... 2
Map of Maricopa Community Colleges .............................................................................................................. 3
Vision and Mission ......................................................................................................................................... 4
Introduction ................................................................................................................................................... 5
Overview of Adopted Budget ......................................................................................................................... 5
Future Budget Plan ..................................................................................................................................... 5
Budget Prep Assumptions ........................................................................................................................... 5
Fund Balances................................................................................................................................................. 6
Unrestricted Funds ..................................................................................................................................... 6
Restricted Funds ......................................................................................................................................... 7
Fund Balance for Allocation ........................................................................................................................ 8
Required and Recommended Budget Items. ................................................................................................. 9
Executive Budget Summary............................................................................................................................ 9
General Fund ................................................................................................................................................ 10
Revenues ................................................................................................................................................... 10
Fund Balance -Recommended Use ........................................................................................................... 11
Auxiliary Fund ............................................................................................................................................... 11
Restricted Fund (Fund 3) .............................................................................................................................. 12
Capital (Plant) Fund ...................................................................................................................................... 12
SECTION B: BUDGET SUMMARIES .................................................................................................................... 14
All Funds Summary ....................................................................................................................................... 15
All Funds FTE Summary ................................................................................................................................ 17
General Fund Summaries ............................................................................................................................. 18
Multi-year General Fund Financial Projection .......................................................................................... 19
General Fund Expenditure by College and Function ................................................................................ 21
General Fund Expenditure by College and Account Category .................................................................. 22
General Fund Comparison of FY18 Estimated Actual with FY19 Adopted by Function ........................... 23
General Fund Comparison of FY18 Estimated Actual with FY19 Adopted by Account ............................ 23
General Fund - Budgeted Position Summary ............................................................................................ 24
Auxiliary Funds ............................................................................................................................................. 26
Auxiliary Fund Revenue ............................................................................................................................ 26
Auxiliary Fund Expenditure Summary by College ..................................................................................... 26
Auxiliary Fund Budgeted Position Summary ............................................................................................. 27
Restricted (Fund 3) Summary ....................................................................................................................... 28
Restricted Fund Budgeted Position Summary .......................................................................................... 29
Proposition 301 Revenue & Expenditure.................................................................................................. 30
Plant Fund Revenue & Expenditure Summary ............................................................................................. 31
Debt Service- Revenue & Expenditure Summary ......................................................................................... 32
SECTION C: LEGAL BUDGET .............................................................................................................................. 33
SCHEDULE A – Summary of Budget Data .................................................................................................. 34
SCHEDULE B – Resources .......................................................................................................................... 35
SCHEDULE C –Expenditures and Other Outflows ..................................................................................... 36
SECTION D: APPENDIX ...................................................................................................................................... 37
Student Enrollment ...................................................................................................................................... 38
Historic Tuition & Fees ................................................................................................................................. 39
Property Tax ................................................................................................................................................. 40
Historic Property Assessment ................................................................................................................... 40
Historic Property Tax Rates ....................................................................................................................... 41
Estimated Tax Rates and Assessed Valuation ........................................................................................... 42
Expenditure Limitation Report Worksheet .................................................................................................. 43
SECTION E: GLOSSARY ...................................................................................................................................... 44

Adopted Budget
FY18-19
SECTION A: GENERAL OVERVIEW

Section A: General Overview May 22, 2018 FY18-19 Adopted Budget
Page 2
Administration and Addresses
MCCCD Governing Board & District Administration: 2411 W 14th Street – Tempe, AZ 85281|Ph. (480) 731-8000
Governing Board Members Positions District
Mr. Laurin Hendrix President 1
Mrs. Johanna Haver Secretary 3
Mr. Augustine Bartning Member 5
Mrs. Tracy Livingston Member At-Large
Mrs. Jean McGrath Member 4
Mr. Dana Saar Member 2
Dr. Linda Thor Member At-Large
District Leadership
Dr. Maria Harper-Marinick Chancellor
Dr. Karla Fisher Executive Vice Chancellor and Provost
Ms. Darcy Renfro Chief of Staff
Mr. Elliott Hibbs Chief Operating Officer
Ms. LaCoya Shelton Vice Chancellor, Human Resources
Mr. Edward Kelty Chief Information Officer, Information Technology Services
Ms. Leslie Cooper General Counsel
Ms. Christina Schultz President & CEO MCCCD Foundation
College Leadership & Administration
Dr. William Guerriero, Interim President
Chandler-Gilbert Community College 2626 E. Pecos Road Chandler, AZ 85225 Ph. (480) 732-7000
Dr. Steven Gonzales, President
GateWay Community College 108 N. 40th Street Phoenix, AZ 85034 Ph. (602) 286-8000
Dr. Teresa Leyba-Ruiz, President
Glendale Community College 6000 W. Olive Avenue
Glendale, AZ 85034 Ph. (623-845-3012
Dr. Ernie Lara, President
Estrella Mt. Community College 3000 N. Dysart Road Avondale, AZ 85392 Ph. (623) 935-8000
Mr. Sasan Poureetezadi, Interim President
Mesa Community College 1833 W. Southern Avenue
Mesa, AZ 85202 Ph. (480) 461-7000
Dr. Paul Dale, President
Paradise Valley Community College 18401 N. 32nd Street Phoenix, AZ 85032 Ph. (602) 787-6500
Ms. Christina Haines, Interim President Phoenix College
1202 W. Thomas Rd. Phoenix, AZ 85013 Ph. (602) 285-7500
Dr. Chris Bustamante, President
Rio Salado College 2323 W 14th Street Tempe, AZ 85281
Ph. (480) 517-8540
Dr. Jan Gehler, President
Scottsdale Community College 9000 E. Chaparral Road
Scottsdale, AZ 85256 Ph. (480) 423-6000
Dr. Shari Olson, President
South Mt. Community College 7050 S. 24th Street Phoenix, AZ 85040 Ph. (602) 343-8000

Section A: General Overview May 22, 2018 FY18-19 Adopted Budget
Page 3
Map of Maricopa Community Colleges
The map below shows the location of the ten colleges within the Maricopa County Community College District and
satellite locations where educational programs are provided to the community.

Section A: General Overview May 22, 2018 FY18-19 Adopted Budget
Page 4
Vision and Mission
VISION
A Community of Colleges…Colleges for the Community…working collectively and responsibly to meet the life-long
learning needs of our diverse students and communities.
MISSION
The Maricopa Community Colleges provide access to higher education for diverse students and communities. We
focus on learning through:
University Transfer Education
General Education
Developmental Education
Workforce Development
Student Development Services
Continuing Education
Community Education
Civic Responsibility
Global Engagement
The Maricopa Community Colleges are committed to:
COMMUNITY – We value all people – our students, our employees, their families and the communities in which they live and work. We value our global community of which we are in integral part.
EXCELLENCE - We value excellence and encourage our internal and external communities to strive for their academic professional and personal best.
HONESTY AND INTEGRITY - We value academic and personal honesty and integrity and believe these elements are essential in our learning environment. We strive to treat each other with respect, civility and fairness.
INCLUSIVENESS - We value inclusiveness and respect for one another. We believe that team work is critical, that each team member is important and we depend on each other to accomplish our mission.
INNOVATION - We value and embrace an innovative and risk-taking approach so that we remain at the forefront of global educational excellence
LEARNING - We value lifelong learning opportunities that respond to the needs of our communities and are accessible, affordable, and of the highest quality. We encourage dialogue and freedom to have an open exchange of ideas for the common good
RESPONSIBILITY - We value responsibility and that we are each accountable for our personal and professional actions. We are responsible for making our learning experiences significant and meaningful.
STEWARDSHIP - We value stewardship and honor the trust placed in us by the community. We are accountable to our communities for the efficient and effective use of resources as we prepare our students for their role as productive world citizens.
Section A: General Overview May 22, 2018 FY18-19 Adopted Budget
Page 5
Introduction The Maricopa District is one of the largest community college systems in the nation and is the largest public
higher education institution in Arizona; larger even than all three public universities combined. In FY2018-19,
the District will continue to build on its long history of services to the community.
As of December 15, 2017, the ten colleges and three skill centers that comprise the Maricopa Community
Colleges, offer the following: 2,032 Academic courses, 5,926 Occupational courses, 884 Occupational programs,
9 Associate degrees and 28 Academic Certificates (AC).
The Maricopa County Community College District (the District) is financially sound for the next three years. The
District strives to maximize the resources entrusted to us by the taxpayers and students. Maricopa
Transformation initiatives will require additional resources during its early years, as we develop new approaches
to better serve our students and increase student retention, which will lead to more graduates. However, future
decisions will need to be made to ensure long-term stability related to capital expenditure, since all of our G.O.
Bonds resources will be spent.
Overview of Adopted Budget
This Adopted budget compares the estimated revenue and expenditures from FY17-18 with the Adopted FY18-
19 Budget. This provides a base for future budgeted expenditure and revenue comparisons.
Throughout the budget process, the District evaluates the ability to sustain approved initiatives in the future.
Future Budget Plan
The Transformation initiated last year includes recommendation that a budget process be developed that
supports and promotes organizational performance around the following questions:
Are we allocating funds appropriately among our colleges to obtain the best outcomes?
Are revenues sufficient to fund critical education and support services now and in the future?
A study is underway to help answer these questions. The following will be used for future budget planning:
Fairness and Equity Study – plus analyze study results and develop adjustment methods as needed
Adequacy Study
Increased college involvement around budgeting for initiatives and outcomes
Budget Prep Assumptions
The following assumptions have been used in building the FY18-19 budget:
Conservative property tax valuation growth (1%);
Conservative new construction growth (2%);
FTSE count constant for FY18-19 – beginning with FY19-20, FTSE is estimated to grow by 1% due to
implementation of transformation initiatives;
General Fund expenditure growth includes required or previously agreed upon additions; and
No re-allocation of funds held by colleges for FY18-19 (except for enrollment changes).
Section A: General Overview May 22, 2018 FY18-19 Adopted Budget
Page 6
Fund Balances Balances are estimated revenue plus balances carried forward from prior year, minus estimated expenditures.
At Maricopa, we categorize funding as unrestricted or restricted.
Unrestricted Funds
Unrestricted funds are those that can be allocated for different purposes, they include:
General fund (Fund 1) – the largest and main operating fund for the Maricopa Community Colleges. The
General Fund accounts for unrestricted resources that will be expended in the current year for operating
purposes such as instruction, public service, academic support, student services, institutional support,
operation/maintenance of plant, plus scholarships.
Auxiliary Fund (Fund 2) – includes revenues and expenditures that support a variety of self-supporting
activities, including contract training, the three Skill Centers under Gateway, non-credit instruction, and
food services.
Plant/Bond Fund (Fund 7) – MCCCD’s capital fund. The major sources of revenue are from the voter
approved 2004 General Obligation Bonds Program and transfer from the General Fund. For Budgeting
purposes, G.O. Bond funds are considered unrestricted as they can be directed or redirected in
accordance with the needs of the District. For financial reporting, G.O. Bond funds are considered
externally restricted in accordance with accounting standards.
Quasi Endowment Fund – (Fund 6) –Medical insurance reserves
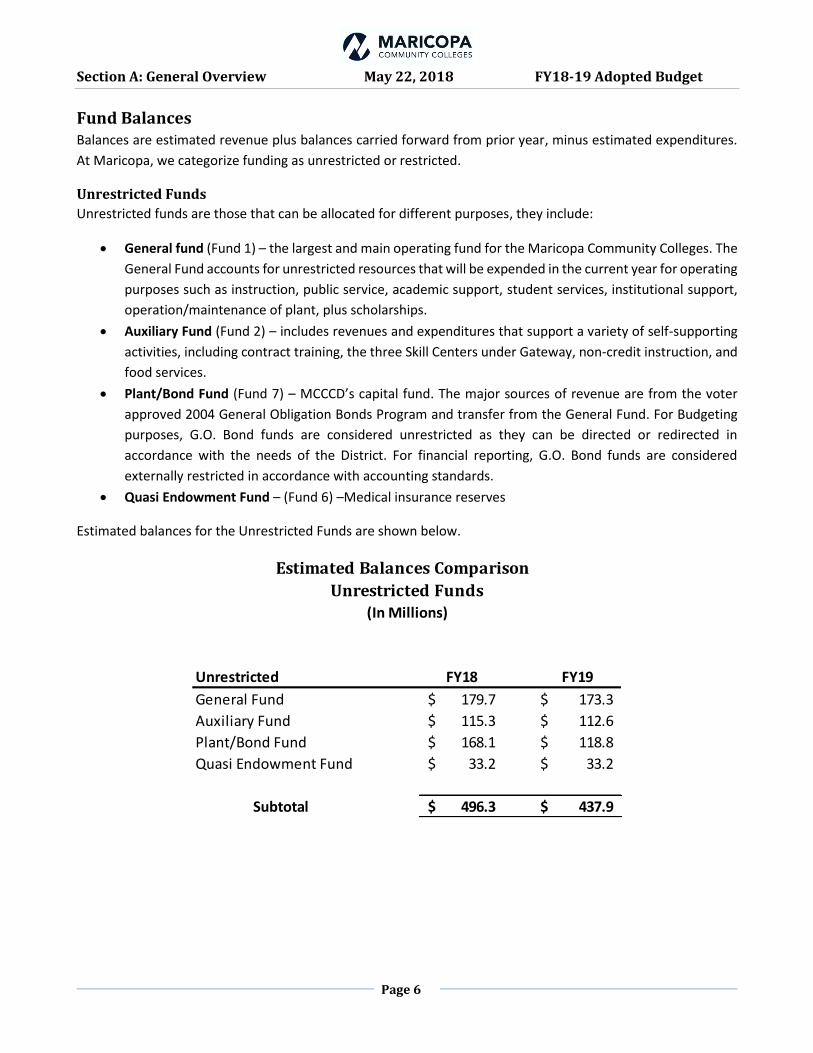
Estimated balances for the Unrestricted Funds are shown below.
Unrestricted FY18 FY19
General Fund 179.7$ 173.3$
Auxiliary Fund 115.3$ 112.6$
Plant/Bond Fund 168.1$ 118.8$
Quasi Endowment Fund 33.2$ 33.2$
Subtotal 496.3$ 437.9$
Estimated Balances Comparison
Unrestricted Funds(In Millions)

Section A: General Overview May 22, 2018 FY18-19 Adopted Budget
Page 7
Restricted Funds
Restricted funds account for all externally restricted activity such as grants, bond debt service and student
financial aid and include:
Restricted (Fund 3) – revenue sources include federal, state and local funds for grants or contracts and
federal financial aid;
Proposition 301 – a statewide November 2000 referendum that raised sales taxes for education
(community colleges are required to use the funds for workforce development and training);
Debt Service (Fund 8) – payments of interest and principal for General Obligation bonds purchased for
the 2004 Capital Bond Program; and
Quasi Endowment Fund (Fund 6) – portion of Worker’s Compensation reserves required by the
Industrial Commission.
Estimated balances for the restricted funds are shown below.
Restricted FY18 FY19
Restricted Fund--Other 2.9$ 2.3$
Restricted Fund--301 28.7$ 24.9$
Debt Service 74.2$ 76.3$
Quasi Endowment Fund 3.7$ 3.7$
Subtotal 109.6$ 107.2$
Grand Total 605.90$ 545.10$
(In Millions)
Estimated Balances Comparison
Restricted Fund
The grand total balances appear to be significant. It is misleading, however, to focus on just total balances
available and not consider what these balances represent and why they are needed, as explained below.

Section A: General Overview May 22, 2018 FY18-19 Adopted Budget
Page 8
Fund Balance for Allocation
Although the grand total fund balance for FY19 is estimated at $545.1 million, the restricted portion must be
removed since their use is limited. This leaves $437.9 million.
Some revenue will not be received, such as student bad debt and uncollected tax levy, so $6.8 million is removed
to recognize these losses. In addition, some of the fund balance should be held for claims ($5m), financial
stability ($54.7m), college operating and auxiliary reserves ($84m), college capital projects ($58.6m) and
districtwide (primarily college) projects ($60.3m) that have already been committed for future use.
In addition, to maintain a strong financial position, adjustments were approved prior to allocating balances,
including:
Increase the General Fund reserves for financial stability from 8% to 10% to simplify accounting for reserves and to adequately provide for emergency or other unplanned needs (extra $13.7 million)
Retain sufficient funds to meet 3rd year capital needs ($25.8m)
Implement capital fund reserves to insure ability to address unpredictable capital emergency needs ($25m)
This leaves an estimated balance of about $104 million available for possible allocation after all of these adjustments.
All Fund Balances 545.1$
Less Restricted Funds (107.2)$
Net Unrestricted Funds 437.9$
Less:
GF - Financial Stability (54.7)$
GF - Std Bad Debt, Uncollected Tax Levy (6.8)$
GF - Claim Reserve (5.0)$
College:
GF - College Reserve (23.9)$
Auxiliary Fund - Colleges (60.1)$
Capital Fund - College Projects (58.6)$
District Wide: Capital Fund (60.3)$
Proposed Adjustments
Raise GF Reserves from 8% to 10% (13.7)$
Provide for 3rd-Year Capital Needs (25.8)$
Capital Fund Reserve (New) (25.0)$ (333.9)$
Ending Balance - Available for Allocation 104.0$
Estimated Balances for June 30, 2019
As of April 10, 2018 (in Millions)
Some cautions to be noted regarding possible allocation of the ending balance:
The ending balance should be used for one time funding only or to ensure funds for ongoing costs are held for future expenditures;
Annual revenue growth from property tax, tuition and fees only average $9-$10 million/year in recent years. This is insufficient to cover large expenditure commitments;
Funding to meet 3-yr capital needs (total estimate $204m) is short by $26 m; no source for future needs. Portion of balances needs to be available to ensure capital needs can be met;
Transformation requires continuing investment; and
Operating costs will continue to increase (technology licenses, updated systems, health insurance, ASRS).

Section A: General Overview May 22, 2018 FY18-19 Adopted Budget
Page 9
Required and Recommended Budget Items. Discussion of allocation should recognize that there are required and recommended items for consideration.
The Required FY19 budget items include:
Fund Operating Cost needs- Arizona State Retirement, Lab Loading and Employee Manual costs;
Fund Transformation needs – how we improve and help students achieve greater success.
The following recommended budget items were approved by the Governing Board on May 1, 2018 and are
included in the FY18-19 Adopted Budget:
Technology Updates & Operations – technology is the backbone of the organization, so it is important that we stay up-to-date and are able to deliver quality support for our systems;
Increase General Fund Reserves - from 8% to 10%
Fund Course Equipment from the General Fund - this will help lower some course fees for students
Facilities Maintenance/Capital Needs – need to maintain facilities and ensure equipment is refreshed;
Establish Capital Reserve and approach to Fund Future Capital Needs –without future bonds, a new, cost-effective strategy to meet our future capital needs is required;
Transfer Majority of Quasi Endowment Fund Balance to General Fund;
Address Faculty and Staff compensation –we must ensure competitive wages, salaries and benefits are paid to retain and attract qualified Faculty and staff;
Reduce Tuition – send positive message to current and potential students while promote diversity at all our colleges
Executive Budget Summary
The Adopted FY18-19 Resources of $1.65 billion includes Quasi Endowment funds as well as ALL of the
estimated fund balances available for each fund group. All funds are shown in Section B Budget
Summaries.
The General Fund Resources total for FY18-19 is $861.9 million, an increase of $12.8 million (+1.5%) compared to the estimated resources of FY17-18.
The Auxiliary Fund totals $178.25 million, a decrease of about $3 million (-1.7%), compared to the estimated actual resources in FY17-18.
The Restricted Fund totals $231.37 million; an increase of about $0.7 million (+0.3%) compared to the FY17-18 estimated resources.
The Unexpended Plant Fund totals $184.2 million for FY18-19; a decrease of $12.9 million compared to the estimated resources for FY17-18. This includes $6 million Adopted primary tax rate increase of $0.015, which is pending approval by the Governing Board.
The FY18-19 Debt Service totals $158.4 million, an increase of $0.5 million over the FY17-18 estimated actuals.
Maintenance of the District’s financial stability policy, which requires balance of 8% General Fund revenues; the Adopted increase to 10% was approved by Governing Board on May 1, 2018.

Section A: General Overview May 22, 2018 FY18-19 Adopted Budget
Page 10
The District’s colleges have flexibility to reallocate budgets and to use new allocations to meet high priority needs and accomplish goals to continue to better serve the community.
General Fund
Revenues
Property Taxes:
The amount of additional property taxes from new construction is projected to remain fairly level for two-to-
three years with slow recovery thereafter. Based on the 2017 Maricopa County Assessor’s valuations, property
tax levy from new construction property will decrease from $10.1 million for FY17-18 to $9.87 million for FY18-
19. This is far below the $18.2 million from new construction received in FY2009.
Effective 2015, the voter-approved Proposition 117, alters the calculation of property tax. For 2015 both the
Primary and the Secondary tax rates are calculated based on the same assessed valuation -- the Limited Property
valuation (see the Appendix -Historic Property Assessment.) Proposition 117 also capped the growth of a
property’s limited property value at no more than 5% per year. This new law does not affect the total amount
of property tax collections, but rather the redistribution of the tax obligation among property owners.
On May 22nd, the Governing Board approved the primary tax increase of $0.0150 per $100 assessment (1.3%)
for capital needs, for a revised rate of $1.1708 per $100 Assessed Valuation An estimated $6 million will be
generated by increasing primary tax rate from $1.1558 to $1.1708. This Adopted rate is still lower than the FY17-
18 primary rate of $1.1956 per $100 assessment.
Tuition and Fees:
The Governing Board approved tuition and fee rates at its February 27, 2018 meeting. After further discussion
and review of the District’s resources, it was recommended to consider reducing the resident tuition rate. It is
contemplated that the lower tuition rate will provide a positive message to students and the community;
making college more affordable to students, thereby increasing student retention rate, and increasing student
racial and ethnic mix. A tuition reduction of $1 to $85 per credit hour is estimated to decrease tuition revenue
by $2.3 million, and the estimated revenue has been adjusted to reflect this decrease. The tuition reduction of
$1/credit was approved by the Governing Board on May 1, 2018. Consequently, an in-county full-time student
will pay $2,550 annually based on 30 credits/year, a decrease of $30 from the current annual tuition rate of
$2,580.
The Arizona Constitution mandates the provision of higher education "as nearly free as possible" and tuition for
Maricopa Community Colleges remains below the national average of public two-year institutions. Students
attending Maricopa Colleges prior to transferring to a baccalaureate granting institution should expect to pay
tuition at about 20-25 percent of Arizona’s public four-year institutions.
State Aid:
In FY2015-16, the Arizona Legislature changed state law to disallow State Aid funding for Maricopa and Pima
County Community College Districts. The last State Aid in FY14-15received was $8.8 million, which included $7.4
million of Operation and $1.4 million of STEM funding. Overall, Maricopa has lost over $68.7 Million in Operating
Section A: General Overview May 22, 2018 FY18-19 Adopted Budget
Page 11
State Aid since FY2007-08 and $11 million in Capital State Aid. In FY2017, the State Legislature reversed the
decision and restored Maricopa into the State Aid funding formula. For FY18-19, Maricopa submitted a request
of $11.1 million for STEM formula funding in accordance with the statutory formula.
Reallocation:
Over the past few years, the District has relied on the reallocation of existing resources to help compensate for
the cuts in State Aid and limited growth in other resources. To adapt to revenue losses and to reallocate for
emerging needs, the District reduced operational budgets four times prior to FY2013-14 for an annualized total
reduction of $35 million. Since the State of Arizona suspended the Capital State Aid formula funding, colleges
often transfer funding from the General Fund or Auxiliary Funds for capital expenditures.
Fund Balance -Recommended Use Starting with the FY2018-19 Budget, the entire estimated Fund Balance amount will be included in the report as
resources. These recommended uses of the FY19 estimated General Fund balance were approved by the
Governing Board on May 1, 2018:
Tuition Rate reduction - reduction of $1 per credit to $85 per credit (cost estimated to be $2.3m); the revenue was adjusted to a lower amount and reduced the fund balance available;
Employee Pay:
a. Load hour rate increase –increase from $872/credit hour to $925/credit hour;
b. Stipend for Faculty/Staff –one-time stipend of $750 for all staff classified as full time employees (excluding executives) who have been with the District during all of 2018;
c. Hourly Employees –increase rate of pay for hourly employees by $0.25/hour;
Reserves –increasing amount from 8% to 10% (extra $13.7m);
Update Technology Licenses/Operations–$5.97 m for license costs and required updates, plus funds to retain and hire qualified technology staff;
Course fee Equipment –$2m annually for course fee equipment from General fund starting in FY19-20;
Transformation –$14m for FY18-19 to provide academic case managers, a call center, a data warehouse and tools to improve student retention and experiences.
Auxiliary Fund
The Auxiliary Fund includes contract training and other substantially self-supporting activities, such as the skill
centers, non-credit instruction, course fees, and food services. The FY18-19 budget for Auxiliary totals $178.25
million in resources. Section B provides a summary of all Auxiliary funds.

Section A: General Overview May 22, 2018 FY18-19 Adopted Budget
Page 12
Restricted Fund (Fund 3)
The Restricted Fund (excluding Debt Service and Prop 301) FY18-19 budget is $191.5 million; the Proposition 301
Adopted budget for FY18-19 is almost $40 million, which include $28.8 million in previous allocations.
Proposition 301
The Governor recently signed into law a bill passed to extend Proposition 301 for another 20 years. The Work
Force Development Office will work with the colleges to develop a plan for FY19 and a 5-year plan to maximize
the benefits of these fund balances. Strategies to be examined include:
Workforce Faculty/Employees;
Workforce Equipment needs;
Workforce Information System Development
MCOR Fund Commitment (Rio)
Possible capital uses
Capital (Plant) Fund The Unexpended Plant Fund is $184 million for FY18-19. New evaluation of facilities will help District and the
colleges prioritize where capital funds are most needed. Since we cannot rely on State funding, and bond
resources are being consumed, there is a need to find a source for future capital needs.
Life without the Bond – Note:
As total tax rate declines from bonds being paid off, shift the planned reduction from secondary levy to primary tax levy to fund future capital need.
Capital needs to maintain facilities and refresh capital equipment remains.
Areas of student growth and modernization will require significant remodeling and even construction of new buildings.
Adopted strategy: as secondary rate declines shift rate to the primary levy to fund capital needs in the future and possibly forego bonds, but still allow total property tax levy to decline.
The chart below shows the effect of retaining a small portion of the tax levy decline in the future for maintenance and other capital needs.

Section A: General Overview May 22, 2018 FY18-19 Adopted Budget
Page 13
Fiscal Year Primary Secondary Scenario
Adjusted for
Capital
Adjusted
Tax Rate
Capital
Revenue
(in Millions)
2008-09 $0.7752 $0.1634 $0.9386
2009-10 $0.7246 $0.1598 $0.8844
2010-11 $0.7926 $0.1802 $0.9728
2011-12 $1.0123 $0.1959 $1.2082
2012-13 $1.1563 $0.2215 $1.3778
2013-14 $1.2896 $0.2459 $1.5355
2014-15 $1.2824 $0.2363 $1.5187
2015-16 $1.2628 $0.2312 $1.4940
2016-17 $1.2376 $0.2275 $1.4651
2017-18 $1.1956 $0.2140 $1.4096
2018-19 $1.1558 $0.2046 $1.3604 $0.0150 $1.3754 6.1$
2019-20 $1.1221 $0.1783 $1.3005 $0.0217 $1.3222 8.9$
2020-21 $1.0894 $0.1738 $1.2632 $0.0212 $1.2844 8.7$
2021-22 $1.0577 $0.1263 $1.1840 $0.0587 $1.2427 24.1$
2022-23 $1.0269 $0.1166 $1.1435 $0.0534 $1.1969 26.0$
2023-24 $0.9970 $0.0697 $1.0667 $0.1003 $1.1670 45.2$
2024-25 $0.9680 $0.0677 $1.0356 $0.1023 $1.1379 46.0$
2025-26 $0.9124 $0.0278 $0.9403 $0.1422 $1.0825 58.3$
2026-27 $0.9124 $0.0270 $0.9395 $0.1430 $1.0825 58.6$
2027-28 $0.8858 $0.0000 $0.8858 $0.1700 $1.0558 69.7$
Scenario for Capital Funding
Historic Tax Rates for FY 2014 through FY 2019 and Est. Tax Rates through FY2028MCCCD Property Tax Rates per $100 of Assessed Valuation
For FY19, the total tax rate would have been $1.3604 per $100 of assessed valuation, with $1.1558 of this as
primary. As highlighted in above, the approved increase of $0.0150 put the primary rate to $1.1708 and the total
tax rate to $1.3754 per $100 assessed valuation. This is still a reduction in the total tax rate from the current
year’s rate of $1.4096. This $0.0150 rate increase would raise an estimated $6.1 million for FY19 for capital
purposes, and more in the future if this approach is continued as reflected in the scenario above.

Page 14
Adopted Budget FY2018-19
SECTION B: BUDGET SUMMARIES
Section B: Budget Summaries May 22, 2018 FY18-19 Adopted Budget
Page 15
All Funds Summary
Fund Description
FY17-18
Est Actual
Resources
FY18-19
Adopted Budget
Resources
Increase/
(Decrease) % Change
% Total
FY17-18
% Total
FY18-19
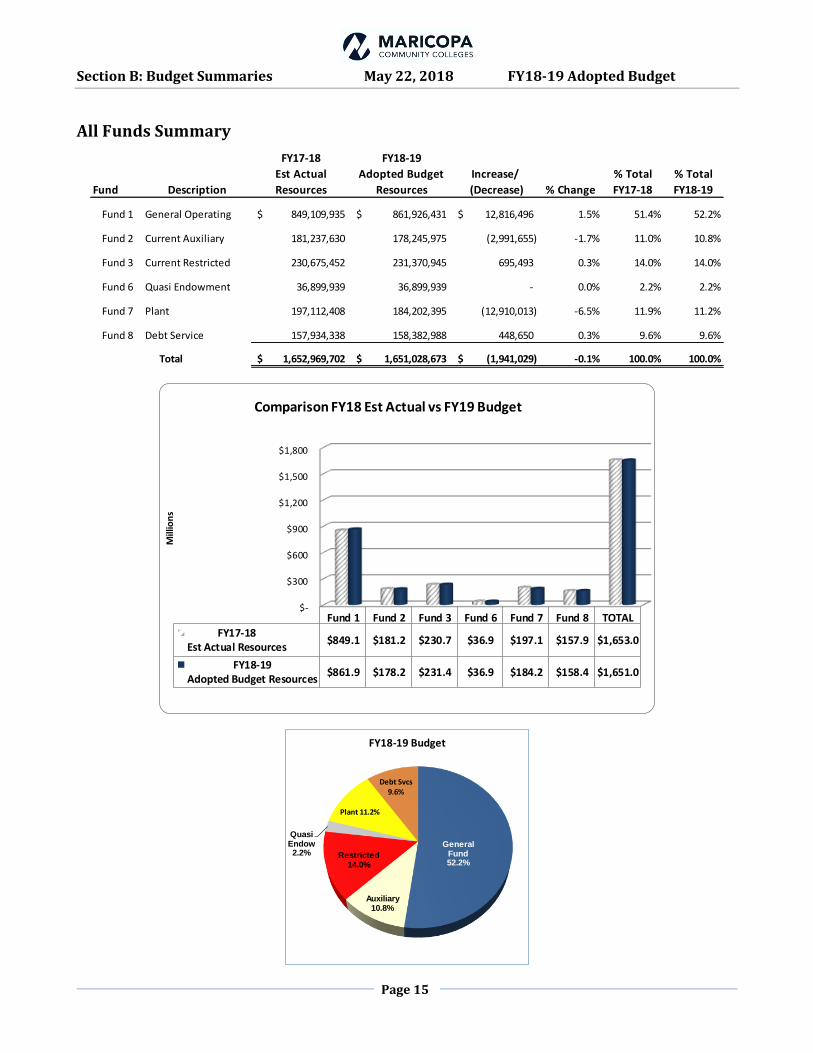
Fund 1 General Operating 849,109,935$ 861,926,431$ 12,816,496$ 1.5% 51.4% 52.2%
Fund 2 Current Auxiliary 181,237,630 178,245,975 (2,991,655) -1.7% 11.0% 10.8%
Fund 3 Current Restricted 230,675,452 231,370,945 695,493 0.3% 14.0% 14.0%
Fund 6 Quasi Endowment 36,899,939 36,899,939 - 0.0% 2.2% 2.2%
Fund 7 Plant 197,112,408 184,202,395 (12,910,013) -6.5% 11.9% 11.2%
Fund 8 Debt Service 157,934,338 158,382,988 448,650 0.3% 9.6% 9.6%
1,652,969,702$ 1,651,028,673$ (1,941,029)$ -0.1% 100.0% 100.0%Total
$-
$300
$600
$900
$1,200
$1,500
$1,800
Fund 1 Fund 2 Fund 3 Fund 6 Fund 7 Fund 8 TOTAL
FY17-18Est Actual Resources
$849.1 $181.2 $230.7 $36.9 $197.1 $157.9 $1,653.0
FY18-19Adopted Budget Resources
$861.9 $178.2 $231.4 $36.9 $184.2 $158.4 $1,651.0
Mill
ion
s
Comparison FY18 Est Actual vs FY19 Budget
General Fund52.2%
Auxiliary10.8%
Restricted14.0%
Quasi Endow2.2%
Plant 11.2%
Debt Svcs9.6%
FY18-19 Budget

Section B: Budget Summaries May 22, 2018 FY18-19 Adopted Budget
Page 16
Property Taxes 467,211,720$ -$ 6,063,485$ -$ 82,597,634$ 555,872,839$
In Lieu Tax, SRP 8,624,792 - - - 1,622,891 10,247,683
State Appropriations/Other State - - - 11,145,614 - 11,145,614
Subtotal Tax Support: 475,836,512$ -$ 6,063,485$ -$ 11,145,614$ 84,220,525$ 577,266,136$
General Tuition 182,700,000$ 4,215,156 - - - 186,915,156$
Out-of-State Tuition 15,160,346 9,609,291 - - - 24,769,637
Out-of-District Tuition 256,527 - - - 256,527
Fees (Course fees, Other fees) 4,593,128 16,644,442 - - - 21,237,570
Non-Credit/ Special Interest 6,028,537 - - - 6,028,537
Subtotal Tuition/Fees: 202,710,001$ 36,497,426$ -$ -$ -$ 239,207,427$
Grants & Contracts -$ 1,601,250$ -$ 38,814,085$ -$ 40,415,335$
Financial Aid - - - 149,391,975 - 149,391,975
Interest Income & Other 1,774,307 100,000 - 25,000 - 1,899,307
Food Service/Auxiliary Programs - 4,541,071 - - 4,541,071
Bookstore Operations 1,890,588 - - 1,890,588
Miscellaneous - 8,596,225 368,238 - 8,964,463
Subtotal Other Rev 3,664,895 14,838,546$ -$ 188,574,298$ 25,000$ -$ 207,102,739$
Total On-Going Revenues 682,211,408 51,335,972$ 6,063,485$ -$ 188,574,298$ 11,170,614$ 84,220,525$ 1,023,576,302$
Transfers - 11,609,743$ 10,075,290$ 21,685,033$
Total Revenues with Transfers 682,211,408 62,945,715$ 16,138,775.0$ -$ 188,574,298$ 11,170,614$ 84,220,525$ 1,045,261,335$
Fund Balance
College & DO Fund Balance 23,490,890$ 54,453,032$ 75,516,874$ 2,877,586$ 15,074,202$ 171,412,584
District-Wide Fund Balance 156,224,133 60,847,228 66,147,410 36,899,939 13,674,245$ 74,162,463$ 407,955,418
G.O. Bond Carryforward - - 26,399,336$ - 26,399,336
Total Fund Balance 179,715,023$ 115,300,260$ 168,063,620$ 36,899,939$ 2,877,586$ 28,748,447$ 74,162,463.0$ 605,767,338$
Total Resources 861,926,431$ 178,245,975$ 184,202,395$ 36,899,939$ 191,451,884$ 39,919,061$ 158,382,988$ 1,651,028,673$
Phoenix College 59,977,123$ 4,050,000$ 3,031,313$ 23,328,193$ 817,262$ -$ 91,203,891$
Glendale College 83,372,389 3,368,001 5,424,500 32,388,509 1,096,455 - 125,649,854
GateWay College 35,539,749 4,657,371 9,543,462 11,730,625 743,659 - 62,214,866 Gateway Extended
Campuses 12,827,431 670,249 222,745 - 13,720,425
Mesa College 99,267,375 7,147,152 4,651,000 31,406,475 1,899,586 - 144,371,588
Scottsdale College 53,214,414 4,711,870 4,420,049 10,968,158 285,856 - 73,600,347
Rio Salado College (Incl. MCOR) 63,701,556 15,497,467 3,179,500 25,232,799 2,858,014 - 110,469,336
South Mountain College 27,430,035 954,875 2,226,940 10,165,549 170,286 - 40,947,685
Chandler-Gilbert College 53,947,562 2,307,747 3,047,000 12,085,453 1,417,447 - 72,805,209
Paradise Valley College 40,643,363 1,688,758 4,351,420 8,114,518 288,798 - 55,086,857
Estrella Mountain College 38,258,599 2,418,573 1,748,000 19,240,264 651,662 - 62,317,098
District Office 68,325,729 150,000 - 68,475,729
Distrtict-Wide - 17,681,000 1,253,362 4,537,227 23,471,589
Prof. Growth & DW Programs 47,740,462 5,880,000 - - - 53,620,462
Trfs. to Skill Centers & LEAP 7,513,311 - 7,513,311
Maricopa Transformation 13,991,341 13,991,341
Rio Salado - Campus Work support -
Pending Allocations (Lab loading) 7,062,562 7,062,562
Debt Service Payment - - - 82,127,725 82,127,725
Carryforward & Contingency 23,940,574 57,769,502 - - 2,567,730 - - 84,277,806
Other Exp./transfer Recommendations 9,790,676 33,245,963 43,036,639
733,716,820$ 123,428,747$ 59,304,184$ 33,245,963$ 189,151,884$ 14,988,997$ 82,127,725$ 1,235,964,320$
Fund Balance 128,209,611$ 54,817,228$ 124,898,211$ 3,653,976$ 2,300,000$ 24,930,064$ 76,255,263$ 415,064,353$
Reserves & Designations 80,208,333$ 2,300,000$ -$ 3,653,976$ 2,300,000$ 13,930,064$ 76,255,263$ 178,647,636$
DW Capital Project -$ -$ 60,250,000$ -$ 60,250,000$
College & DO Fund Balance -$ 58,584,726$ 11,000,000$ 69,584,726$
Capital Reserve & 3rd-Yr Capital Need 25,000,000$ 19,736,515$ 6,063,485$ 50,800,000$
Total Reserves 105,208,333$ 22,036,515$ 124,898,211$ 3,653,976$ 2,300,000$ 24,930,064$ 76,255,263$ 359,282,362$
UNCOMMITTED FUND BALANCE 23,001,278$ 32,780,713$ -$ -$ -$ -$ -$ 55,781,991$
Expenditures by Unit
Total Expenditures
UNRESTRICTED FUND RESTRICTED FUND
Total
All Funds
General Fund
Fund 1
Auxiliary
Fund 2
Restricted
Fund 3 Prop 301
Unexpended
Plant Debt Service
* Quasi
Endowment
Total
All Funds
Revenues
General Fund
Fund 1
Auxiliary
Fund 2
FY18-19 ADOPTED REVENUE AND EXPENDITURES ALL FUNDS BUDGET SUMMARY -
Restricted
Fund 3 Prop 301
Unexpended
Plant Debt Service
* Quasi
Endowment
*Note: Reserves & Designation under Quasi Endowment fund is considered Restricted Fund as it is required by the Industrial
Commission for Worker’s Compensation reserve.
Section B: Budget Summaries May 22, 2018 FY18-19 Adopted Budget
Page 17
All Funds FTE Summary
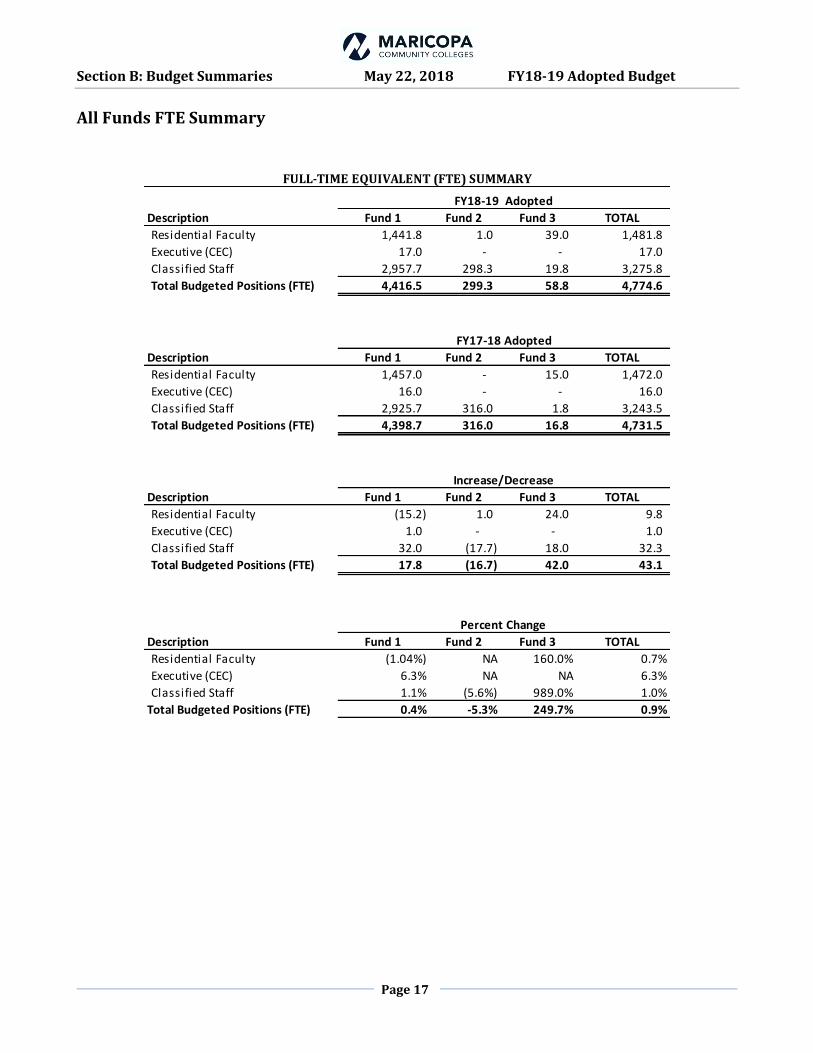
Description Fund 1 Fund 2 Fund 3 TOTAL
Residential Faculty 1,441.8 1.0 39.0 1,481.8
Executive (CEC) 17.0 - - 17.0
Classified Staff 2,957.7 298.3 19.8 3,275.8
Total Budgeted Positions (FTE) 4,416.5 299.3 58.8 4,774.6
Description Fund 1 Fund 2 Fund 3 TOTAL
Residential Faculty 1,457.0 - 15.0 1,472.0
Executive (CEC) 16.0 - - 16.0
Classified Staff 2,925.7 316.0 1.8 3,243.5
Total Budgeted Positions (FTE) 4,398.7 316.0 16.8 4,731.5
Description Fund 1 Fund 2 Fund 3 TOTAL
Residential Faculty (15.2) 1.0 24.0 9.8
Executive (CEC) 1.0 - - 1.0
Classified Staff 32.0 (17.7) 18.0 32.3
Total Budgeted Positions (FTE) 17.8 (16.7) 42.0 43.1
Description Fund 1 Fund 2 Fund 3 TOTAL
Residential Faculty (1.04%) NA 160.0% 0.7%
Executive (CEC) 6.3% NA NA 6.3%
Classified Staff 1.1% (5.6%) 989.0% 1.0%
Total Budgeted Positions (FTE) 0.4% -5.3% 249.7% 0.9%
FY18-19 Adopted
FY17-18 Adopted
Increase/Decrease
Percent Change
FULL-TIME EQUIVALENT (FTE) SUMMARY

Section B: Budget Summaries May 22, 2018 FY18-19 Adopted Budget
Page 18
General Fund Summaries
Sources of Revenue
FY17-18 Estimated
Actual
FY18-19
Adopted % of Total
Increase/
(Decrease) % Change
Tax Supported:
Primary Levy 453,423,109$ 457,339,611$ 53.1% 3,916,502$ 0.9%
Property Tax - New Construction 9,872,109 1.1% 9,872,109 n/a
In Lieu Tax (SRP) 9,065,516 8,624,792$ 1.0% (440,724) -4.9%
Subtotal Property Tax + SRP 462,488,625 475,836,512 55.2% 13,347,887$ 2.9%
Tuition and Fees:
General Tuition 185,000,000$ 182,700,000$ 21.2% (2,300,000) -1.2%
Out-of-State Tuition 15,160,346 15,160,346 1.8% - 0.0%
Out-of-District Tuition 302,202 256,527 0.0% (45,675) -15.1%
Other Fees & Charges 4,593,128 4,593,128 0.5% - 0.0%
Subtotal Tuition & Fees 205,055,676$ 202,710,001$ 23.5% (2,345,675)$ -1.1%
Interest and Other 1,733,386$ 1,774,307$ 0.2% 40,921$ 2.4%
Bookstore Operations 1,890,588 1,890,588 0.2% - 0.0%
Subtotal Interest/Other 3,623,974$ 3,664,895$ 0.4% (2,304,754)$ 1.1%
Total Anticipated Revenue w/o CF 671,168,275$ 682,211,408$ 79.1% 11,043,133$ 1.6%
Beginning Fund Balance 177,941,660$ 179,715,023$ 20.9% 1,773,363$ 1.0%
Total Anticipated Revenue 849,109,935$ 861,926,431$ 100.0% 12,816,496$ 1.5%
College/Description
FY17-18 Estimated
Actual
FY18-19
Adopted % of Total
Increase/
(Decrease) % Change
Phoenix College 60,350,170$ 59,977,123$ 8.17% (373,047)$ -0.6%
Glendale College 85,592,816 83,372,389 11.36% (2,220,427) -2.6%
GateWay College 36,309,089 35,539,749 4.84% (769,340) -2.1%
Mesa College 100,430,288 99,267,375 13.53% (1,162,913) -1.2%
Scottsdale College 53,317,627 53,214,414 7.25% (103,213) -0.2%
Rio Salado College 60,448,724 63,701,556 8.68% 3,252,832 5.4%
South Mountain College 27,570,421 27,430,035 3.74% (140,386) -0.5%
Chandler-Gilbert College 55,025,264 53,947,562 7.35% (1,077,702) -2.0%
Paradise Valley College 40,965,339 40,643,363 5.54% (321,976) -0.8%
Estrella Mountain College 39,451,852 38,258,599 5.21% (1,193,253) -3.0%
District Office 67,510,822 68,325,729 9.31% 814,907 1.2%
District-wide 42,422,500 76,307,676 10.40% 33,885,176 79.9%
College Carryforward 23,940,574 3.26% 23,940,574 N/A
Approved Budget Recommendations 9,790,676 1.33% 9,790,676 N/A
Total Expenditure by College $ 669,394,912 $ 733,716,820 100.00% $ 64,321,908 9.6%
Estimated Ending Fund Balance $ 179,715,023 $ 128,209,611 $ (51,505,412) -28.7%
Reserves & Designations $ (94,530,671) $ (80,208,333) $ 14,322,338 -15.2%
Capital Reserve $ - $ (25,000,000) $ (25,000,000) N/A
Fund Available for Allocations $ 179,715,023 $ 23,001,278 $ (156,713,745) -87.2%
Total Expenditure by College 669,394,912$ 733,716,820$ 100.00% 64,321,908$ 9.6%
Est Fund Balance after Expenditures 179,715,023$
GENERAL FUND REVENUE
EXPENDITURE SUMMARY BY COLLEGE
Section B: Budget Summaries May 22, 2018 FY18-19 Adopted Budget
Page 19
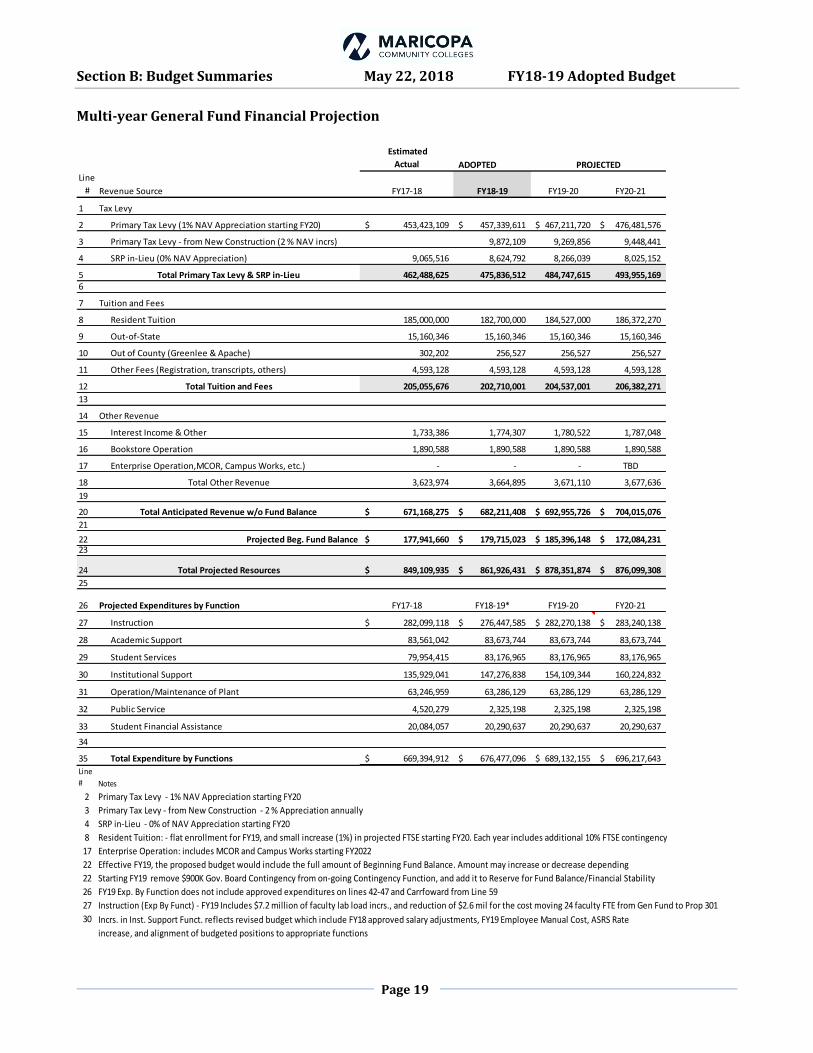
Multi-year General Fund Financial Projection
Estimated
Actual ADOPTED
Line
# Revenue Source FY17-18 FY18-19 FY19-20 FY20-21
1 Tax Levy
2 Primary Tax Levy (1% NAV Appreciation starting FY20) 453,423,109$ 457,339,611$ 467,211,720$ 476,481,576$
3 Primary Tax Levy - from New Construction (2 % NAV incrs) 9,872,109 9,269,856 9,448,441
4 SRP in-Lieu (0% NAV Appreciation) 9,065,516 8,624,792 8,266,039 8,025,152
5 Total Primary Tax Levy & SRP in-Lieu 462,488,625 475,836,512 484,747,615 493,955,169 6
7 Tuition and Fees
8 Resident Tuition 185,000,000 182,700,000 184,527,000 186,372,270
9 Out-of-State 15,160,346 15,160,346 15,160,346 15,160,346
10 Out of County (Greenlee & Apache) 302,202 256,527 256,527 256,527
11 Other Fees (Registration, transcripts, others) 4,593,128 4,593,128 4,593,128 4,593,128
12 Total Tuition and Fees 205,055,676 202,710,001 204,537,001 206,382,271
13
14 Other Revenue
15 Interest Income & Other 1,733,386 1,774,307 1,780,522 1,787,048
16 Bookstore Operation 1,890,588 1,890,588 1,890,588 1,890,588
17 Enterprise Operation,MCOR, Campus Works, etc.) - - - TBD
18 Total Other Revenue 3,623,974 3,664,895 3,671,110 3,677,636
19
20 Total Anticipated Revenue w/o Fund Balance 671,168,275$ 682,211,408$ 692,955,726$ 704,015,076$
21
22 Projected Beg. Fund Balance 177,941,660$ 179,715,023$ 185,396,148$ 172,084,231$ 23
24 Total Projected Resources 849,109,935$ 861,926,431$ 878,351,874$ 876,099,308$
25
26 Projected Expenditures by Function FY17-18 FY18-19* FY19-20 FY20-21
27 Instruction 282,099,118$ 276,447,585$ 282,270,138$ 283,240,138$
28 Academic Support 83,561,042 83,673,744 83,673,744 83,673,744
29 Student Services 79,954,415 83,176,965 83,176,965 83,176,965
30 Institutional Support 135,929,041 147,276,838 154,109,344 160,224,832
31 Operation/Maintenance of Plant 63,246,959 63,286,129 63,286,129 63,286,129
32 Public Service 4,520,279 2,325,198 2,325,198 2,325,198
33 Student Financial Assistance 20,084,057 20,290,637 20,290,637 20,290,637
34
35 Total Expenditure by Functions 669,394,912$ 676,477,096$ 689,132,155$ 696,217,643$
PROJECTED
Line
# Notes
2 Primary Tax Levy - 1% NAV Appreciation starting FY20
3 Primary Tax Levy - from New Construction - 2 % Appreciation annually
4 SRP in-Lieu - 0% of NAV Appreciation starting FY20
8 Resident Tuition: - flat enrollment for FY19, and small increase (1%) in projected FTSE starting FY20. Each year includes additional 10% FTSE contingency
17 Enterprise Operation: includes MCOR and Campus Works starting FY2022
22
22 Starting FY19 remove $900K Gov. Board Contingency from on-going Contingency Function, and add it to Reserve for Fund Balance/Financial Stability
26 FY19 Exp. By Function does not include approved expenditures on lines 42-47 and Carrfoward from Line 59
27 Instruction (Exp By Funct) - FY19 Includes $7.2 million of faculty lab load incrs., and reduction of $2.6 mil for the cost moving 24 faculty FTE from Gen Fund to Prop 301
30 Incrs. in Inst. Support Funct. reflects revised budget which include FY18 approved salary adjustments, FY19 Employee Manual Cost, ASRS Rate
increase, and alignment of budgeted positions to appropriate functions
Effective FY19, the proposed budget would include the full amount of Beginning Fund Balance. Amount may increase or decrease depending
Section B: Budget Summaries May 22, 2018 FY18-19 Adopted Budget
Page 20
36
Estimated
Actual ADOPTED
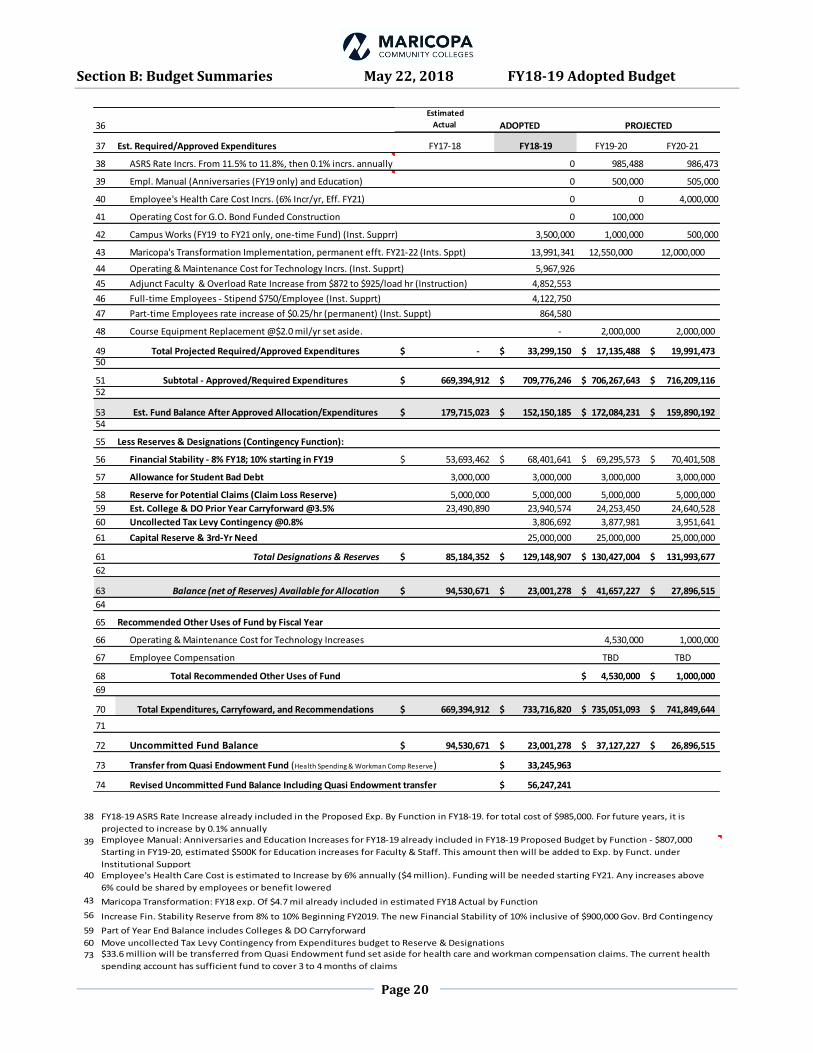
37 Est. Required/Approved Expenditures FY17-18 FY18-19 FY19-20 FY20-21
38 ASRS Rate Incrs. From 11.5% to 11.8%, then 0.1% incrs. annually 0 985,488 986,473
39 Empl. Manual (Anniversaries (FY19 only) and Education) 0 500,000 505,000
40 Employee's Health Care Cost Incrs. (6% Incr/yr, Eff. FY21) 0 0 4,000,000
41 Operating Cost for G.O. Bond Funded Construction 0 100,000
42 Campus Works (FY19 to FY21 only, one-time Fund) (Inst. Supprr) 3,500,000 1,000,000 500,000
43 Maricopa's Transformation Implementation, permanent efft. FY21-22 (Ints. Sppt) 13,991,341 12,550,000 12,000,000
44 Operating & Maintenance Cost for Technology Incrs. (Inst. Supprt) 5,967,926
45 Adjunct Faculty & Overload Rate Increase from $872 to $925/load hr (Instruction) 4,852,553
46 Full-time Employees - Stipend $750/Employee (Inst. Supprt) 4,122,750
47 Part-time Employees rate increase of $0.25/hr (permanent) (Inst. Suppt) 864,580
48 Course Equipment Replacement @$2.0 mil/yr set aside. - 2,000,000 2,000,000
49 Total Projected Required/Approved Expenditures -$ 33,299,150$ 17,135,488$ 19,991,473$ 50
51 Subtotal - Approved/Required Expenditures 669,394,912$ 709,776,246$ 706,267,643$ 716,209,116$ 52
53 Est. Fund Balance After Approved Allocation/Expenditures 179,715,023$ 152,150,185$ 172,084,231$ 159,890,192$ 54
55 Less Reserves & Designations (Contingency Function):
56 Financial Stability - 8% FY18; 10% starting in FY19 53,693,462$ 68,401,641$ 69,295,573$ 70,401,508$
57 Allowance for Student Bad Debt 3,000,000 3,000,000 3,000,000 3,000,000
58 Reserve for Potential Claims (Claim Loss Reserve) 5,000,000 5,000,000 5,000,000 5,000,000
59 Est. College & DO Prior Year Carryforward @3.5% 23,490,890 23,940,574 24,253,450 24,640,528
60 Uncollected Tax Levy Contingency @0.8% 3,806,692 3,877,981 3,951,641
61 Capital Reserve & 3rd-Yr Need 25,000,000 25,000,000 25,000,000
61 Total Designations & Reserves 85,184,352$ 129,148,907$ 130,427,004$ 131,993,677$
62
63 Balance (net of Reserves) Available for Allocation 94,530,671$ 23,001,278$ 41,657,227$ 27,896,515$
64
65 Recommended Other Uses of Fund by Fiscal Year
66 Operating & Maintenance Cost for Technology Increases 4,530,000 1,000,000
67 Employee Compensation TBD TBD
68 Total Recommended Other Uses of Fund 4,530,000$ 1,000,000$
69
70 Total Expenditures, Carryfoward, and Recommendations 669,394,912$ 733,716,820$ 735,051,093$ 741,849,644$
71
72 Uncommitted Fund Balance 94,530,671$ 23,001,278$ 37,127,227$ 26,896,515$
73 Transfer from Quasi Endowment Fund (Health Spending & Workman Comp Reserve) 33,245,963$
74 Revised Uncommitted Fund Balance Including Quasi Endowment transfer 56,247,241$
PROJECTED
38
39
40
43 Maricopa Transformation: FY18 exp. Of $4.7 mil already included in estimated FY18 Actual by Function
56 Increase Fin. Stability Reserve from 8% to 10% Beginning FY2019. The new Financial Stability of 10% inclusive of $900,000 Gov. Brd Contingency
59 Part of Year End Balance includes Colleges & DO Carryforward
60 Move uncollected Tax Levy Contingency from Expenditures budget to Reserve & Designations
73 $33.6 million will be transferred from Quasi Endowment fund set aside for health care and workman compensation claims. The current health
spending account has sufficient fund to cover 3 to 4 months of claims
Employee Manual: Anniversaries and Education Increases for FY18-19 already included in FY18-19 Proposed Budget by Function - $807,000
Starting in FY19-20, estimated $500K for Education increases for Faculty & Staff. This amount then will be added to Exp. by Funct. under
Institutional SupportEmployee's Health Care Cost is estimated to Increase by 6% annually ($4 million). Funding will be needed starting FY21. Any increases above
6% could be shared by employees or benefit lowered
FY18-19 ASRS Rate Increase already included in the Proposed Exp. By Function in FY18-19. for total cost of $985,000. For future years, it is
projected to increase by 0.1% annually
Section B: Budget Summaries May 22, 2018 FY18-19 Adopted Budget
Page 21
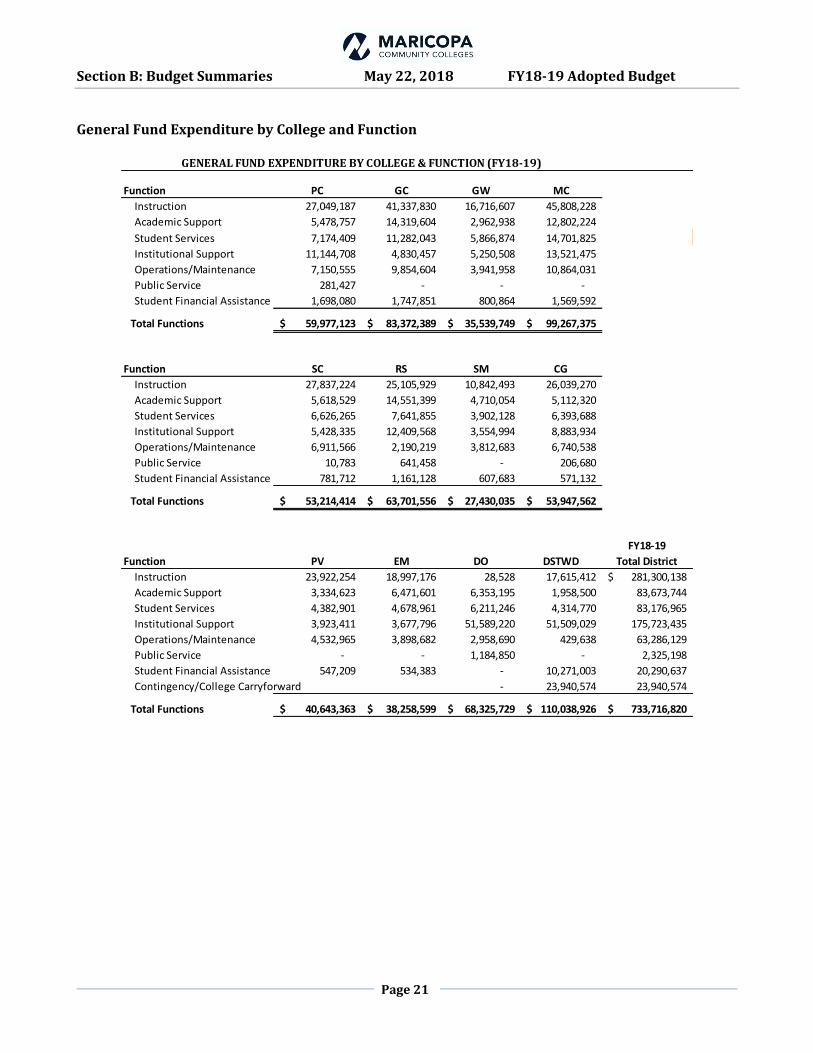
General Fund Expenditure by College and Function
Function PC GC GW MC
Instruction 27,049,187 41,337,830 16,716,607 45,808,228
Academic Support 5,478,757 14,319,604 2,962,938 12,802,224
Student Services 7,174,409 11,282,043 5,866,874 14,701,825
Institutional Support 11,144,708 4,830,457 5,250,508 13,521,475
Operations/Maintenance 7,150,555 9,854,604 3,941,958 10,864,031
Public Service 281,427 - - -
Student Financial Assistance 1,698,080 1,747,851 800,864 1,569,592
Total Functions 59,977,123$ 83,372,389$ 35,539,749$ 99,267,375$
Function SC RS SM CG
Instruction 27,837,224 25,105,929 10,842,493 26,039,270
Academic Support 5,618,529 14,551,399 4,710,054 5,112,320
Student Services 6,626,265 7,641,855 3,902,128 6,393,688
Institutional Support 5,428,335 12,409,568 3,554,994 8,883,934
Operations/Maintenance 6,911,566 2,190,219 3,812,683 6,740,538
Public Service 10,783 641,458 - 206,680
Student Financial Assistance 781,712 1,161,128 607,683 571,132
Total Functions 53,214,414$ 63,701,556$ 27,430,035$ 53,947,562$
Function PV EM DO DSTWD
FY18-19
Total District
Instruction 23,922,254 18,997,176 28,528 17,615,412 281,300,138$
Academic Support 3,334,623 6,471,601 6,353,195 1,958,500 83,673,744
Student Services 4,382,901 4,678,961 6,211,246 4,314,770 83,176,965
Institutional Support 3,923,411 3,677,796 51,589,220 51,509,029 175,723,435
Operations/Maintenance 4,532,965 3,898,682 2,958,690 429,638 63,286,129
Public Service - - 1,184,850 - 2,325,198
Student Financial Assistance 547,209 534,383 - 10,271,003 20,290,637
Contingency/College Carryforward - 23,940,574 23,940,574
Total Functions 40,643,363$ 38,258,599$ 68,325,729$ 110,038,926$ 733,716,820$
GENERAL FUND EXPENDITURE BY COLLEGE & FUNCTION (FY18-19)

Section B: Budget Summaries May 22, 2018 FY18-19 Adopted Budget
Page 22
General Fund Expenditure by College and Account Category
Description PC GC GW MC
Salaries & Wages 36,755,540 56,151,240 22,330,736 63,210,055
Employee Benefits 10,603,123 17,042,339 6,880,476 19,190,849
Contractual Services 3,263,115 2,176,555 2,294,030 7,172,865
Supplies & Materials 1,211,750 1,594,458 541,066 1,610,056
Fixed Charges 434,913 726,736 383,146 979,648
Communications & Utilities 2,413,500 2,575,989 1,334,784 2,515,022
Travel 174,260 219,497 110,459 545,458
Capital & Equipment 1,517,000 - - 1,702,427
Scholarships/Awards 1,569,090 1,675,870 806,264 1,600,592
Bad Debt/Carryforward 411,100 280,478 704,322 503,884
Transfers/Pending Allocation 1,623,732 929,227 154,466 236,519
Total Expenses 59,977,123$ 83,372,389$ 35,539,749$ 99,267,375$
Description SC RS SM CG
Salaries & Wages 33,814,796 34,416,654 17,125,044 34,984,053
Employee Benefits 10,377,199 9,820,877 5,398,412 10,246,570
Contractual Services 2,900,851 14,428,415 1,126,884 2,412,369
Supplies & Materials 1,342,776 460,503 423,302 969,574
Fixed Charges 453,684 366,800 257,450 447,502
Communications & Utilities 1,590,878 1,293,369 937,599 1,835,174
Travel 56,492 181,147 130,317 153,796
Capital & Equipment - - 80,000 38,500
Scholarships/Awards 803,012 1,211,128 609,783 572,632
Bad Debt/Carryforward 314,160 1,399,752 64,031 65,761
Transfers/Pending Allocation 1,560,566 122,911 1,277,213 2,221,631
Total Expenses 53,214,414$ 63,701,556$ 27,430,035$ 53,947,562$
Description PV EM DO DSTWD *
FY18-19
Total District
Salaries & Wages 26,625,509 25,407,222 41,108,585 4,932,773 396,862,207
Employee Benefits 7,795,606 7,531,727 13,817,551 1,071,362 119,776,091
Contractual Services 1,395,516 538,215 5,421,449 21,266,241 64,396,505
Supplies & Materials 995,157 242,426 713,834 153,975 10,258,877
Fixed Charges 285,610 131,561 1,074,929 4,084,903 9,626,882
Communications & Utilities 1,752,584 945,787 1,163,216 2,472,528 20,830,430
Travel 111,358 51,097 917,563 2,166,350 4,817,794
Capital & Equipment - - 76,500 - 3,414,427
Scholarships/Awards 1,032,509 550,954 - 10,271,003 20,702,837
Bad Debt/Carryforward 278,525 - 224,705 27,326,636 31,573,354
Transfers/Pending Allocation 370,989 2,859,610 3,807,397 36,293,155 51,457,416
Total Expenses 40,643,363$ 38,258,599$ 68,325,729$ 110,038,926$ 733,716,820$
GENERAL FUND EXPENDITURE BY UNIT & ACCOUNT (FY18-19)
Section B: Budget Summaries May 22, 2018 FY18-19 Adopted Budget
Page 23
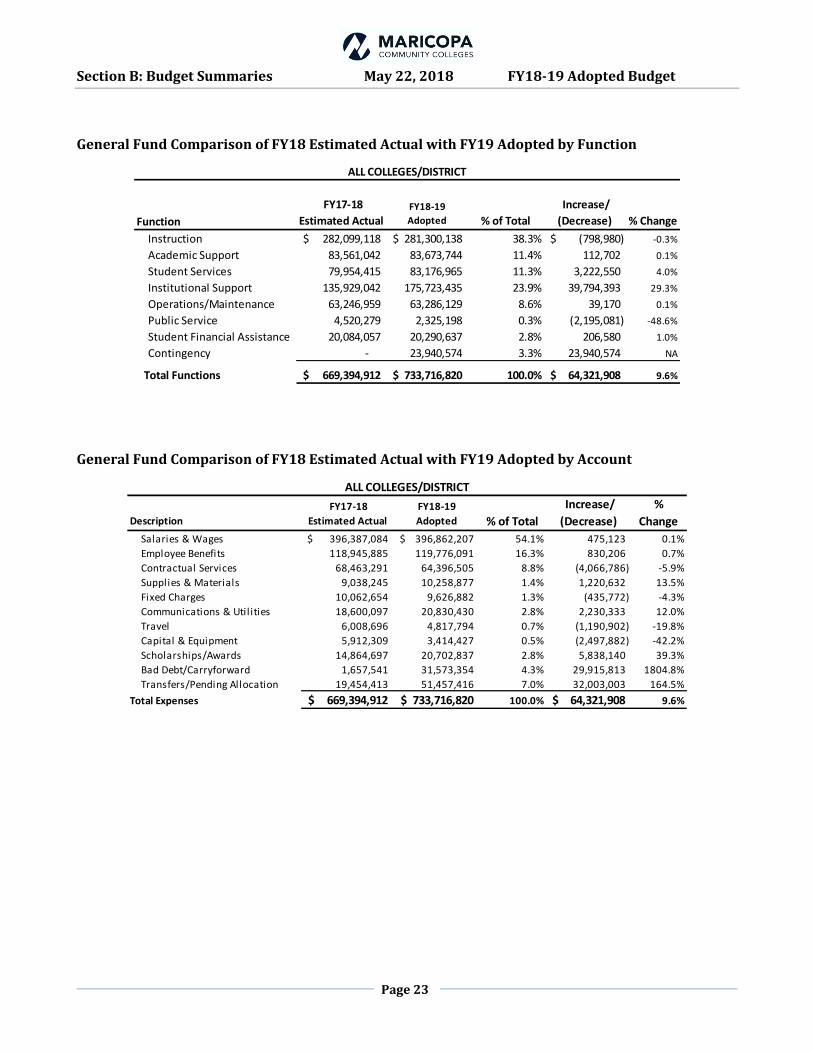
General Fund Comparison of FY18 Estimated Actual with FY19 Adopted by Function
Function
FY17-18
Estimated Actual FY18-19
Adopted % of Total
Increase/
(Decrease) % Change
Instruction 282,099,118$ 281,300,138$ 38.3% (798,980)$ -0.3%
Academic Support 83,561,042 83,673,744 11.4% 112,702 0.1%
Student Services 79,954,415 83,176,965 11.3% 3,222,550 4.0%
Institutional Support 135,929,042 175,723,435 23.9% 39,794,393 29.3%
Operations/Maintenance 63,246,959 63,286,129 8.6% 39,170 0.1%
Public Service 4,520,279 2,325,198 0.3% (2,195,081) -48.6%
Student Financial Assistance 20,084,057 20,290,637 2.8% 206,580 1.0%
Contingency - 23,940,574 3.3% 23,940,574 NA
Total Functions 669,394,912$ 733,716,820$ 100.0% 64,321,908$ 9.6%
ALL COLLEGES/DISTRICT
General Fund Comparison of FY18 Estimated Actual with FY19 Adopted by Account
Description
FY17-18
Estimated Actual
FY18-19
Adopted % of Total
Increase/
(Decrease)
%
Change
Salaries & Wages 396,387,084$ 396,862,207$ 54.1% 475,123 0.1%
Employee Benefits 118,945,885 119,776,091 16.3% 830,206 0.7%
Contractual Services 68,463,291 64,396,505 8.8% (4,066,786) -5.9%
Supplies & Materials 9,038,245 10,258,877 1.4% 1,220,632 13.5%
Fixed Charges 10,062,654 9,626,882 1.3% (435,772) -4.3%
Communications & Utilities 18,600,097 20,830,430 2.8% 2,230,333 12.0%
Travel 6,008,696 4,817,794 0.7% (1,190,902) -19.8%
Capital & Equipment 5,912,309 3,414,427 0.5% (2,497,882) -42.2%
Scholarships/Awards 14,864,697 20,702,837 2.8% 5,838,140 39.3%
Bad Debt/Carryforward 1,657,541 31,573,354 4.3% 29,915,813 1804.8%
Transfers/Pending Allocation 19,454,413 51,457,416 7.0% 32,003,003 164.5%
Total Expenses 669,394,912$ 733,716,820$ 100.0% 64,321,908$ 9.6%
ALL COLLEGES/DISTRICT

Section B: Budget Summaries May 22, 2018 FY18-19 Adopted Budget
Page 24
General Fund - Budgeted Position Summary
Description
FY17-18
Adopted
FY18-19
Adopted
Increase/
(Decrease)
%
Change
Residential Faculty 1,457.0 1,441.8 (15.2) -1.0%
Executive (CEC) 16.0 17.0 1.0 6.3%
Classified Staff 2,925.7 2,957.7 32.0 1.1%
Total Budgeted Positions (FTE) 4,398.7 4,416.5 17.8 0.4%
GENERAL FUND FULL-TIME EQUIVALENT (FTE) SUMMARY
Significant Staffing (FTE or Full-time equivalent) Changes for FY18-19 by College:
FACULTY: net reduction of 15.2 FTE are described below.
Consider adding 10 Faculty positions to create fairness among colleges.
2 Physical Sciences Faculty (1.8 FTE) were added by Mesa due to increased demand and higher
enrollment in Engineering, Healthcare and STEM.
1 new Counseling Faculty position Faculty position was added at Paradise Valley.
24 positions were moved from colleges in Fund 110 to Prop 301.
4 Faculty positions eliminated at Scottsdale due to declining enrollments
EXECUTIVE (CEC): net addition of 1 FTE
The Legal Counsel position at the District Office was changed from Classified Staff to CEC
CLASSIFIED STAFF: net increase of 32 positions are described below.
Phoenix: 1 vacant Lab Tech position was eliminated, but a financial literacy position for student success was added, resulting in no net change.
Gateway: 1 Learning Center position formerly funded by grants/other sources was permanently added to the General Fund.
Mesa: The following positions were added: 4 Instructional support positions (Coord Performing Arts Facilities, Admin Asst., Photo Ceramic Lab Tech, Student Svcs Specialist); 3 Student Svcs Specialist for Enrollment; and 3 Administrative staff (Mgr. College Employee Services; Coord HR Services, Network Admin). The net result is an increase of 10 Classified FTE’s at Mesa.
Scottsdale: 2 vacant positions were eliminated and 3 positions were added at Scottsdale: Instructional Design position, Recruitment, VP Student Affairs and partial funding of an Audiovisual Technician. The net change is an increase of 1 FTE.
Rio Salado: The following 9 positions were added at Rio Salado: Coordinator Dual Enrollment for more support at high schools; Student Services Specialist for Veterans students at new West Valley Military Center; Student Services Specialist in Developmental Education; Asst. Director Information Technology for business continuity and disaster recovery; Network Administrator and Systems Applications Analyst for out-of-state initiative needs; and a Police Officer to provide security at various Rio locations. In addition, several positions were upgraded from 0.75 to 1.0 FTE, bringing the net increase to 9 Classified FTE’s for Rio Salado.
Section B: Budget Summaries May 22, 2018 FY18-19 Adopted Budget
Page 25
South Mt: Several positions were eliminated due to declining enrollment and two new positions were added from the Student Success allocation (Student Orientation Mgr. and Customer Relations Mgr.). The net result was a decrease of 2 Classified staff FTE.
Chandler-Gilbert: The following positions were formerly among a pool of One-year only (OYO) to supplement staffing levels; since the need persisted, Chandler identified funding to make them permanent: Library Assistant; Student Services Specialist, Student Services Specialist in Veterans, Dual Enrollment Specialists. A Police Officer position was added to correct an error from the prior year’s budget. The net result is an increase of 5 classified staff for Chandler-Gilbert.
Paradise Valley: 3 Student Services Specialists were added at Paradise Valley.
Estrella Mt: 5 Classified Staff were added for instructional support due to higher enrollment at the college (Client Support Analyst; Business System Analyst, Coordinator. Student Services, Coordinator Grants, Lead Custodian).
District: 4 positions were eliminated and reallocated for other needs.
These changes result in a Grand Total net increase of 17.8 FTE in the General Fund for FY18-19.

Section B: Budget Summaries May 22, 2018 FY18-19 Adopted Budget
Page 26
Auxiliary Funds Auxiliary Fund Revenue
Revenues
FY17-18
Est. Actual
FY18-19
Adopted
% of
Total
Increase/
(Decrease)
%
Change
Grants/Donations 1,563,588$ 1,601,250$ 0.9% 37,662$ 2.4%
Tuition/Fees
Regular Tuition 4,200,000$ 4,215,156 2.3% 15,156 0.4%
5,633,452 9,609,291 3.1% 3,975,839 70.6%
Course Fees 14,663,181 12,245,707 8.1% (2,417,474) -16.5%
Non Credit 2,200,000 6,028,537 1.2% 3,828,537 174.0%
Other Fees & Charges 2,910,121 4,398,735 1.6% 1,488,614 51.2%
Subtotal - Tuition & Fees 29,606,754$ 36,497,426 16.3% 6,890,672 23.3%
Interest Income 100,000 100,000 0.1% - 0.0%
Auxiliary Operations 4,541,071 4,541,071 2.5% - 0.0%
Miscellaneous Other Revenues 6,339,497 8,596,225 3.5% 2,256,728 35.6%
Total Revenues 42,150,910$ 51,335,972 23.3% 9,185,062 61.3%
Trfs from Gen Fund 10,513,999 11,609,743 5.8% 1,095,744 10.4%
Beginning Fund Balance (FB)
College Fund Balance 55,321,327 54,453,032 (868,295) -1.6%
District/District-Wide Fund Balance 73,251,394 60,847,228 (12,404,166) -16.9%
Subtotal Transfers & Fund Balance 139,086,720 126,910,003 (12,176,717) -8.8%
Total Resourses including Transfr & FB 181,237,630$ 178,245,975$ 100.0% (2,991,655)$ -1.7%
Out of State & Non-resident Dist.Learning
Auxiliary Fund Expenditure Summary by College
FY17-18
Est. Actual
FY18-19
Adopted
% of
Total
Increase/
(Decrease)
%
ChangePhoenix College 4,384,969$ 4,050,000$ 6.2% (334,969)$ -7.6%
Glendale College 3,110,340 3,368,001 5.1% 257,661 8.3%
GateWay College 2,013,563 4,657,371 7.1% 2,643,808 131.3%
Gateway Extended Campus (formerly Skill Ctrs) 11,731,291 12,827,431 19.5% 1,096,140 9.3%
Mesa College 6,457,202 7,147,152 10.9% 689,950 10.7%
Scottsdale College 3,162,785 4,711,870 7.2% 1,549,085 49.0%
Rio Salado College 15,494,595 15,497,467 23.6% 2,872 0.0%
South Mountain College 808,302 954,875 1.5% 146,573 18.1%
Chandler-Gilbert College 2,409,402 2,307,747 3.5% (101,655) -4.2%
Paradise Valley College 1,327,630 1,688,758 2.6% 361,128 27.2%
Estrella Mountain College 1,096,658 2,418,573 3.7% 1,321,915 120.5%
Maricopa Corporate College 1,536,467 - 0.0% (1,536,467) -100.0%
Subtotal College Expenditures 53,533,204$ 59,629,245 6,096,041 11.4%
District Office/District Wide 12,404,166$ 6,030,000$ 9.2% (6,374,166) -51.4%
Total Auxiliary Expenditures 65,937,370$ 65,659,245$ 100.0% (278,125)$ -0.4%
College Carryfoward/Contingency 57,769,502$
Budgeted Expenditure, Including Carryfoward 65,937,370$ 123,428,747$ 57,491,377 87.2%
Estimated Ending Fund Balance
College Fund Balance 54,453,032$ (54,453,032)$ -100.0%
DW Fund Balance 60,847,228$ 54,817,228$ 100.0% (6,030,000) -9.9%
Total Fund Balance/Carryforward 115,300,260$ 54,817,228$ 100.0% (60,483,032) -52.5%
Other Reserves 2,300,000$ Capital Reserve & 3-Yr Need - New Eff. FY19) 19,736,515$
Estimated Uncommitted Fund Balance 32,780,713$
Expenditures by Unit
Section B: Budget Summaries May 22, 2018 FY18-19 Adopted Budget
Page 27
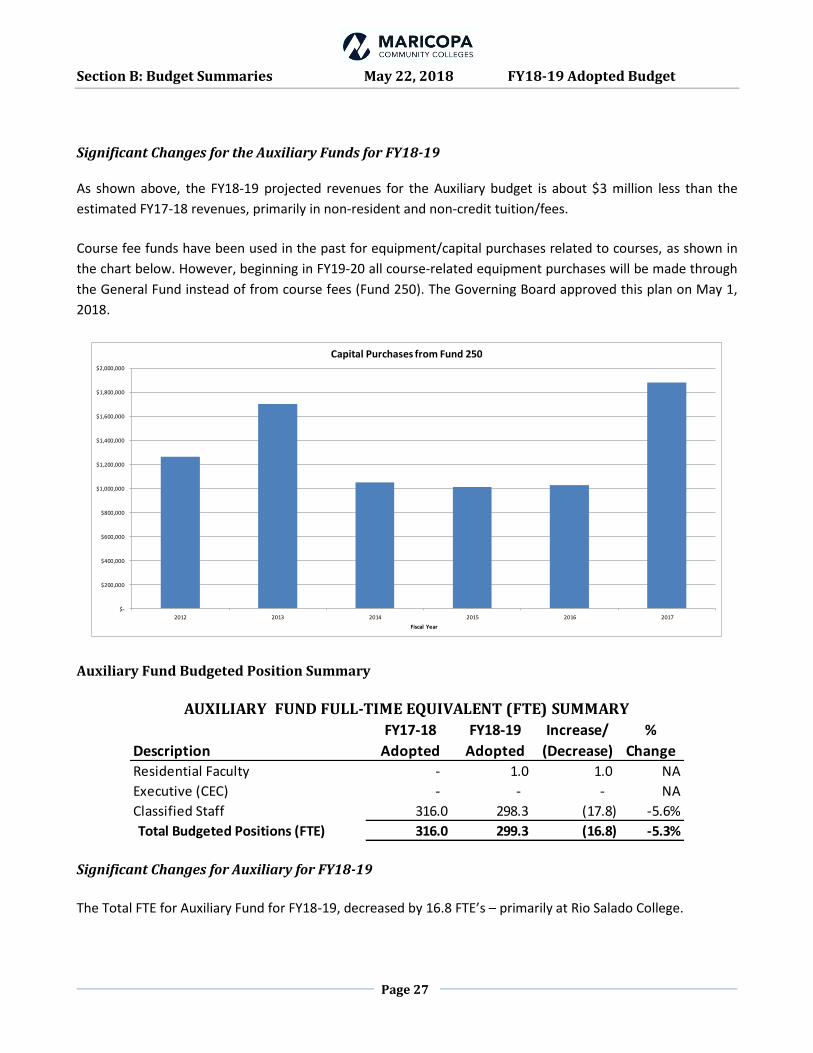
Significant Changes for the Auxiliary Funds for FY18-19
As shown above, the FY18-19 projected revenues for the Auxiliary budget is about $3 million less than the
estimated FY17-18 revenues, primarily in non-resident and non-credit tuition/fees.
Course fee funds have been used in the past for equipment/capital purchases related to courses, as shown in
the chart below. However, beginning in FY19-20 all course-related equipment purchases will be made through
the General Fund instead of from course fees (Fund 250). The Governing Board approved this plan on May 1,
2018.
$-
$200,000
$400,000
$600,000
$800,000
$1,000,000
$1,200,000
$1,400,000
$1,600,000
$1,800,000
$2,000,000
2012 2013 2014 2015 2016 2017
Fiscal Year
Capital Purchases from Fund 250
Auxiliary Fund Budgeted Position Summary
Description
FY17-18
Adopted
FY18-19
Adopted
Increase/
(Decrease)
%
Change
Residential Faculty - 1.0 1.0 NA
Executive (CEC) - - - NA
Classified Staff 316.0 298.3 (17.8) -5.6%
Total Budgeted Positions (FTE) 316.0 299.3 (16.8) -5.3%
AUXILIARY FUND FULL-TIME EQUIVALENT (FTE) SUMMARY
Significant Changes for Auxiliary for FY18-19
The Total FTE for Auxiliary Fund for FY18-19, decreased by 16.8 FTE’s – primarily at Rio Salado College.
Section B: Budget Summaries May 22, 2018 FY18-19 Adopted Budget
Page 28
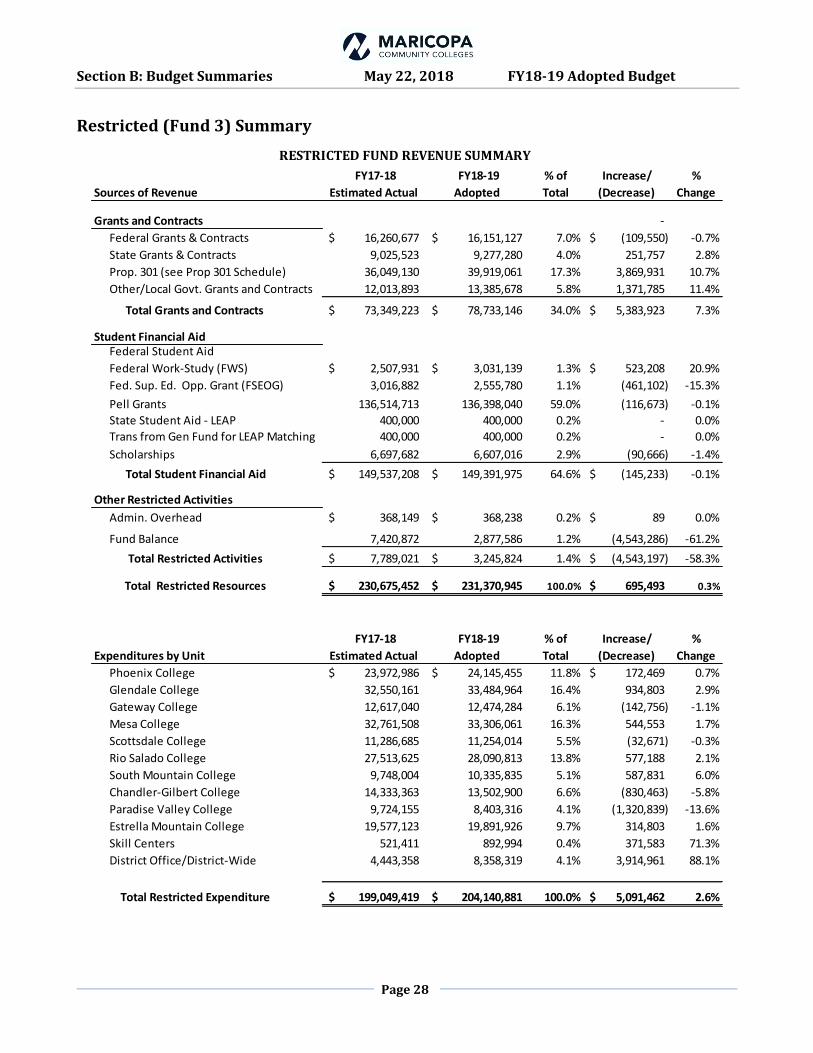
Restricted (Fund 3) Summary
Sources of Revenue
FY17-18
Estimated Actual
FY18-19
Adopted
% of
Total
Increase/
(Decrease)
%
Change
Grants and Contracts -
Federal Grants & Contracts 16,260,677$ 16,151,127$ 7.0% (109,550)$ -0.7%
State Grants & Contracts 9,025,523 9,277,280 4.0% 251,757 2.8%
Prop. 301 (see Prop 301 Schedule) 36,049,130 39,919,061 17.3% 3,869,931 10.7%
Other/Local Govt. Grants and Contracts 12,013,893 13,385,678 5.8% 1,371,785 11.4%
Total Grants and Contracts 73,349,223$ 78,733,146$ 34.0% 5,383,923$ 7.3%
Student Financial Aid Federal Student Aid
Federal Work-Study (FWS) 2,507,931$ 3,031,139$ 1.3% 523,208$ 20.9%
Fed. Sup. Ed. Opp. Grant (FSEOG) 3,016,882 2,555,780 1.1% (461,102) -15.3%
Pell Grants 136,514,713 136,398,040 59.0% (116,673) -0.1%
State Student Aid - LEAP 400,000 400,000 0.2% - 0.0%
Trans from Gen Fund for LEAP Matching 400,000 400,000 0.2% - 0.0%
Scholarships 6,697,682 6,607,016 2.9% (90,666) -1.4%
Total Student Financial Aid 149,537,208$ 149,391,975$ 64.6% (145,233)$ -0.1%
Other Restricted Activities
Admin. Overhead 368,149$ 368,238$ 0.2% 89$ 0.0%
Fund Balance 7,420,872 2,877,586 1.2% (4,543,286) -61.2%
Total Restricted Activities 7,789,021$ 3,245,824$ 1.4% (4,543,197)$ -58.3%
Total Restricted Resources 230,675,452$ 231,370,945$ 100.0% 695,493$ 0.3%
Expenditures by Unit
FY17-18
Estimated Actual
FY18-19
Adopted
% of
Total
Increase/
(Decrease)
%
Change
Phoenix College 23,972,986$ 24,145,455$ 11.8% 172,469$ 0.7%
Glendale College 32,550,161 33,484,964 16.4% 934,803 2.9%
Gateway College 12,617,040 12,474,284 6.1% (142,756) -1.1%
Mesa College 32,761,508 33,306,061 16.3% 544,553 1.7%
Scottsdale College 11,286,685 11,254,014 5.5% (32,671) -0.3%
Rio Salado College 27,513,625 28,090,813 13.8% 577,188 2.1%
South Mountain College 9,748,004 10,335,835 5.1% 587,831 6.0%
Chandler-Gilbert College 14,333,363 13,502,900 6.6% (830,463) -5.8%
Paradise Valley College 9,724,155 8,403,316 4.1% (1,320,839) -13.6%
Estrella Mountain College 19,577,123 19,891,926 9.7% 314,803 1.6%
Skill Centers 521,411 892,994 0.4% 371,583 71.3%
District Office/District-Wide 4,443,358 8,358,319 4.1% 3,914,961 88.1%
Total Restricted Expenditure 199,049,419$ 204,140,881$ 100.0% 5,091,462$ 2.6%
RESTRICTED FUND REVENUE SUMMARY

Section B: Budget Summaries May 22, 2018 FY18-19 Adopted Budget
Page 29
Significant Budget Changes for FY18-19
The FY18-19 Adopted Fund 3 Resources Budget without Prop 301 is about $3 million less than the estimated
amount for FY17-18. This is primarily due to a reduction in the fund balance.
Restricted Fund Budgeted Position Summary
Description
FY17-18
Adopted
FY18-19
Adopted
Increase/
(Decrease)
%
Change
Residential Faculty 15.0 39.0 24.0 160.0%
Classified Staff 1.8 19.8 18.0 1001.1%
Total Budgeted Positions (FTE) 16.8 58.8 42.0 250.1%
RESTRICTED FUND FULL-TIME EQUIVALENT (FTE) SUMMARY
Significant Changes for Restricted for FY18-19
The increase of 24 Faculty is related to Prop 301; the 18 classified staff is due to the inclusion of grant-funded
staff.

Section B: Budget Summaries May 22, 2018 FY18-19 Adopted Budget
Page 30
Proposition 301 Revenue & Expenditure
Proposition 301 is a statewide referendum approved by voters in November 2000 that raised sales taxes for
education. Community colleges are required to use the funds for workforce development and training. The
Department of Revenue started collecting an additional 0.6% sales tax beginning June 1, 2001, as a result of the
referendum. The money is first to be used to pay the annual debt service on outstanding School Facilities
Revenue Bonds. Three percent of the remaining money is allocated to the Community College Districts based on
the latest available Audited FTSE figures.
The Maricopa Community Colleges anticipates receiving $11.15 million in Proposition 301 sales tax revenues for
FY18-19 to support workforce development initiatives.
MCCD utilizes $1.9 million for the costs of 15 faculty currently in Fund 320. An additional 24 other workforce
development Faculty positions may be moved from the General Fund to Fund 320 in FY18-19 utilizing $2.6
million in Prop 301 support. Four million dollars has been allocated to College Workforce Initiatives at individual
colleges in areas such as aerospace and aviation, bioscience and biotechnology, business and financial services,
health care, teacher education, public safety and homeland security, career pipeline development,
apprenticeships/internships and retraining, response to local workforce needs and sustainability and green
technologies. Two million per year is reserved for MCOR support beginning in FY18 through FY21. Fund balance
is in reserve to address capital shortages or rapid response to workforce needs. Plans are underway to identify
workforce programs most in need of support and development. A long term plan will be created in coming
months to build strong work force development programs, facilities an class room equipment so students can
graduate or be certified to meet the business and industry needs of our communities, our county and our state.
Estimated
Actual
Adopted
Budget
Funding Source FY17-18 FY18-19
Increase
(Decrease) Percent Change
Sales Tax Revenue 10,774,859$ 11,145,614$ 370,755 3.4%
Interest Income 25,000 25,000 - 0.0%
Subtotal Revenue 10,799,859$ 11,170,614$ 370,755$ 3.4%
Beginning Fund Balance 25,249,271 28,748,447 3,499,176 13.9%
Total Resources 36,049,130$ 39,919,061$ 3,869,931$ 10.7%
Allocations/Expenditures
Workforce Initiatives (TBD)* 1,926,433$ 4,451,770$ 2,525,337$ 131.1%
SBDC 315,000 315,000 - 0.0%
GPEC Dues 50,000 50,000 - 0.0%
College Workforce Programs & Equipment 3,238,795 7,821,092 4,582,297 141.5%
Workforce Information Systems 282,100 351,135 69,035 24.5%
MCOR (4-yr support, FY18 to FY21) 1,488,355 2,000,000 511,645 34.4%
Total Expenditures 7,300,683$ 14,988,997$ 7,688,314$ 105%
Total Ending Fund Balance 28,748,447$ 24,930,064$ (3,818,383)$ -13%
Prop 301 Budget
FY17-18 Vs. FY2018-19
*total faculty originally funded in Prop 301 was 39 and 24 FTE moved to Gen. Fund. Will move back 24 Workforce faculty FTE from
Gen. Fund to Prop 301, effective FY19

Section B: Budget Summaries May 22, 2018 FY18-19 Adopted Budget
Page 31
Plant Fund Revenue & Expenditure Summary
Adopted
FY18-19
Sourse of Funds FY17-18 FY18-19 FY19-20 FY20-21
Tax Levy 6,063,485$ 6,366,659$ 6,557,659$
Fund Balance & Transfers
Transfers from General Fund 13,787,717$ 10,075,290$ 10,075,290 10,099,072
Fund Balance - Unrestricted
College Fund Balance 76,574,428$ 75,516,874$ 58,584,726 1,326,349
District/District-Wide Fund Balance 67,944,865 66,147,410 66,313,485 56,680,344
G. O Bond Fund Balance 38,805,398 26,399,336 - -
Total Fund Balance 183,324,691$ 168,063,620$ 124,898,211$ 58,006,693$
Total Resources with Transfers 197,112,408$ 184,202,395$ 141,340,160$ 74,663,424$
Estimated
Actual
Adopted
FY18-19
Projected Expenditures FY17-18 FY18-19 FY19-20 FY20-21
College Capital Expenditures
Construction & Remodels 20,867,917$ 13,088,000$ 35,519,000$ 10,400,500$
College Capital Expenditures (Non-Construction)
Instructional 1,688,877$ 6,101,760$ 7,550,800 6,726,830
Non-Instructional 3,731,435 9,779,277 11,858,475 16,026,690
Technology Improvements 963,104 12,654,147 12,405,392 13,523,528
Subtotal College Capital Needs 27,251,333$ 41,623,184$ 67,333,667$ 46,677,548$
DW Capital Expenditures
DW College Safety -$ 4,796,000$ 4,799,000$ 4,959,000$
Major Maintenance 461,724 12,742,000 11,060,800 9,545,000
DW Technology & Other 1,335,731 143,000 140,000 140,000
Subtotal College Capital Needs 1,797,455$ 17,681,000$ 15,999,800$ 14,644,000$
GRAND TOTAL CAPITAL EXPENDITURES/NEEDS 29,048,788$ 59,304,184$ 83,333,467$ 61,321,548$
Estimated Ending Fund Balance
College Fund Balance 101,916,210$ 58,584,726$ 1,326,349 (35,252,127)
District-Wide Fund Balance 66,147,410 60,250,000 50,313,685 42,036,344
Capital Reserve from Property Tax Levy - 6,063,485 6,366,659 6,557,659
PROJECTED ENDING FUND BALANCE 168,063,620$ 124,898,211$ 58,006,693$ 13,341,876$
Projected FY19-20 to
FY20-21
Unexpended Plant Fund
Projected FY19-20 to
FY20-21

Section B: Budget Summaries May 22, 2018 FY18-19 Adopted Budget
Page 32
Debt Service- Revenue & Expenditure Summary
Estimated
Actual
Adopted
FY18-19
Sourse of Funds FY17-18 FY18-19 FY19-20 FY20-21
Secondary Tax Levy/SRP in lieu Tax (Ends FY27) 83,494,925$ 84,220,525$ 75,567,725$ 75,809,125$
Beginning Fund Balance - Debt Service 74,439,413$ 74,162,463$ 76,255,263 68,976,363
Total Resources - Debt Service 157,934,338$ 158,382,988$ 151,822,988$ 144,785,488$
Expenditures
G. O. Bond Debt Service P&I (July Pmt) 74,439,413$ 74,162,463$ 76,255,263$ 68,976,363$
G.O. Bond Debt Service - Interest (January Pmt) 9,332,463$ 7,965,263$ 6,591,363 5,229,563
Total Debt Service Expenditures 83,771,876$ 82,127,725$ 82,846,625$ 74,205,925$
Total Reserves & Designations 76,255,263$ 68,976,363$ 70,579,563$
Estimated Ending Balance - Carryforward 74,162,463$ 76,255,263$ 68,976,363$ 70,579,563$
Debt Service & G.O. Bonds
Projected FY19-20 to
FY20-21

Page 33
Adopted Budget FY2018-19
SECTION C: LEGAL BUDGET
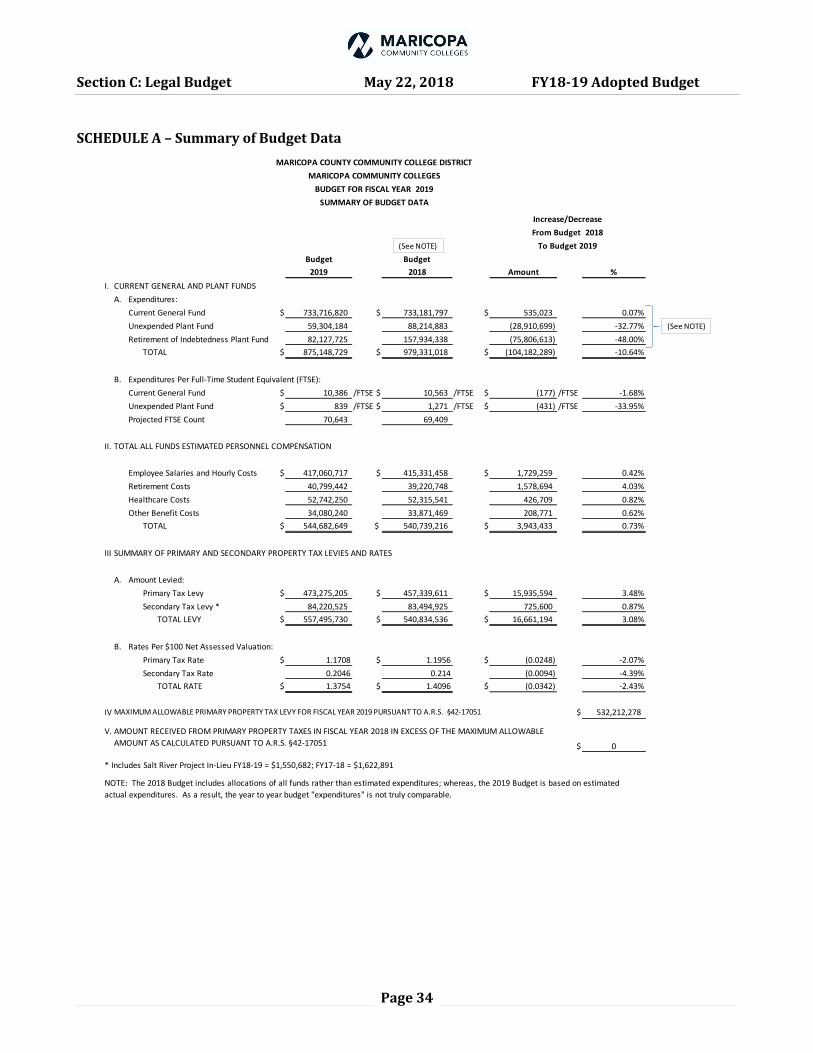
Section C: Legal Budget May 22, 2018 FY18-19 Adopted Budget
Page 34
SCHEDULE A – Summary of Budget Data
Budget Budget
2019 2018 Amount %
I. CURRENT GENERAL AND PLANT FUNDS
A. Expenditures:
Current General Fund $ 733,716,820 $ 733,181,797 $ 535,023 0.07%
Unexpended Plant Fund 59,304,184 88,214,883 (28,910,699) -32.77%
Retirement of Indebtedness Plant Fund 82,127,725 157,934,338 (75,806,613) -48.00%
TOTAL $ 875,148,729 $ 979,331,018 $ (104,182,289) -10.64%
B. Expenditures Per Full-Time Student Equivalent (FTSE):
Current General Fund $ 10,386 /FTSE $ 10,563 /FTSE $ (177) /FTSE -1.68%
Unexpended Plant Fund $ 839 /FTSE $ 1,271 /FTSE $ (431) /FTSE -33.95%
Projected FTSE Count 70,643 69,409
II. TOTAL ALL FUNDS ESTIMATED PERSONNEL COMPENSATION
Employee Salaries and Hourly Costs $ 417,060,717 $ 415,331,458 $ 1,729,259 0.42%
Retirement Costs 40,799,442 39,220,748 1,578,694 4.03%
Healthcare Costs 52,742,250 52,315,541 426,709 0.82%
Other Benefit Costs 34,080,240 33,871,469 208,771 0.62%
TOTAL $ 544,682,649 $ 540,739,216 $ 3,943,433 0.73%
III.SUMMARY OF PRIMARY AND SECONDARY PROPERTY TAX LEVIES AND RATES
A. Amount Levied:
Primary Tax Levy $ 473,275,205 $ 457,339,611 $ 15,935,594 3.48%
Secondary Tax Levy * 84,220,525 83,494,925 725,600 0.87%
TOTAL LEVY $ 557,495,730 $ 540,834,536 $ 16,661,194 3.08%
B. Rates Per $100 Net Assessed Valuation:
Primary Tax Rate $ 1.1708 $ 1.1956 $ (0.0248) -2.07%
Secondary Tax Rate 0.2046 0.214 (0.0094) -4.39%
TOTAL RATE $ 1.3754 $ 1.4096 $ (0.0342) -2.43%
IV. $ 532,212,278
V.
$ 0
* Includes Salt River Project In-Lieu FY18-19 = $1,550,682; FY17-18 = $1,622,891
NOTE: The 2018 Budget includes allocations of all funds rather than estimated expenditures; whereas, the 2019 Budget is based on estimated
actual expenditures. As a result, the year to year budget "expenditures" is not truly comparable.
MARICOPA COUNTY COMMUNITY COLLEGE DISTRICT
MARICOPA COMMUNITY COLLEGES
BUDGET FOR FISCAL YEAR 2019
SUMMARY OF BUDGET DATA
Increase/Decrease
From Budget 2018
To Budget 2019
MAXIMUM ALLOWABLE PRIMARY PROPERTY TAX LEVY FOR FISCAL YEAR 2019 PURSUANT TO A.R.S. §42-17051
AMOUNT RECEIVED FROM PRIMARY PROPERTY TAXES IN FISCAL YEAR 2018 IN EXCESS OF THE MAXIMUM ALLOWABLE
AMOUNT AS CALCULATED PURSUANT TO A.R.S. §42-17051
(See NOTE)
(See NOTE)

Section C: Legal Budget May 22, 2018 FY18-19 Adopted Budget
Page 35
SCHEDULE B – Resources
%Increase/Decrease
BEGINNING BALANCES-July 1
Restricted $ 28,748,447 26,399,336 74,162,463 129,310,246 $ 144,099,413 (10.3%)
Unrestricted 179,715,023 2,877,586 115,300,260 141,664,284 36,899,939 476,457,092 493,324,499 (3.4%)
Total Beginning Balances $ 179,715,023 31,626,033 115,300,260 168,063,620 74,162,463 36,899,939 $ 605,767,338 $ 637,423,912 (5.0%)
REVENUES AND OTHER INFLOWSStudent Tuition and Fees
General Tuition $ 182,700,000 4,215,156 $ 186,915,156 $ 201,349,821 (7.2%)
Out-of-District Tuition 256,527 256,527 302,202 (15.1%)
Out-of-State Tuition 15,160,346 9,609,291 24,769,637 25,241,083 (1.9%)
Student Fees 4,593,128 22,672,979 27,266,107 27,368,727 (0.4%)
State Appropriations
Maintenance Support
Property Taxes
Primary Tax Levy 467,211,720 6,063,485 473,275,205 457,339,611 3.5%
Secondary Tax Levy 82,597,634 82,597,634 81,872,034 0.9%
Gifts, Grants, and Contracts 188,206,060 1,601,250 189,807,310 188,438,551 0.7%
Sales and Services 2,640,392 2,640,392 3,547,931 (25.6%)
Investment Income 1,000,000 25,000 100,000 1,125,000 560,000 100.9%
State Shared Sales Tax 11,145,614 11,145,614 10,202,859 9.2%
Other Revenues 11,289,687 368,238 10,496,904 1,622,891 23,777,720 56,884,493 (58.2%)
Total Revenues/Other Inflows 682,211,408 199,744,912 51,335,972 6,063,485 84,220,525 1,023,576,302 1,053,107,312 (2.8%)
TRANSFERS
Transfers In 11,609,743 10,075,290 21,685,033 34,515,660 (37.2%)
(Transfers Out)
Total Transfers 11,609,743 10,075,290 21,685,033 34,515,660 (37.2%)
(68,401,641) (2,300,000) (70,701,641) (66,321,091) 6.6%
(3,806,692) (3,806,692) --
(3,653,976) (3,653,976) (35,600,000) (89.7%)
Enrollment Growth/Retention (17,062,300) (100.0%)
Gifts, Grants, & Student Aid (2,300,000) (2,300,000) (660,000) 248.5%
SSI/SSE/Safety/Other (41,475,204) (100.0%)
College Priority Initiatives (11,000,000) (58,584,726) (69,584,726) (21,650,000) 221.4%Capital Master Planning (5,000,000) (100.0%)
Future Initiatives (13,930,064) (32,780,713) (46,710,777) (47,000,000) (0.6%)
Student Bad Debt (3,000,000) (3,000,000) (3,000,000) --
Other Future Capital Projects (60,250,000) (60,250,000) (102,089,567) (41.0%)
Capital Reserve & 3rd-Yr Need (25,000,000) (19,736,515) (6,063,485) (50,800,000) --
(28,001,278) (76,255,263) (104,256,541) (18,848,518) 453.1%
$ 733,716,820 $ 204,140,881 $ 123,428,747 $ 59,304,184 $ 82,127,725 $ 33,245,963 $ 1,235,964,320 $ 1,366,340,204 (9.5%)
Total Resources Available for the
Budget Year
2019 2018
LESS Reserves:
Financial Stability
Health Spending / Worker's
Comp Reserve
Reserves for Potential Claims
/Contingency
2019 2019 2019 2019 2019 2019
Allowance for Uncollectable
Property Taxes
Total TotalFund Fund Fund Plant Fund Indebtedness Funds All Funds All Funds
General Restricted Auxiliary Unexpended Retirement of Other
MARICOPA COUNTY COMMUNITY COLLEGE DISTRICTMARICOPA COMMUNITY COLLEGES
FISCAL YEAR 2019RESOURCES --
CURRENT FUNDS PLANT FUNDS

Section C: Legal Budget May 22, 2018 FY18-19 Adopted Budget
Page 36
SCHEDULE C –Expenditures and Other Outflows
%
Increase/
Decrease
733,716,820$ 204,140,881$ 123,428,747$ 59,304,184$ $ 82,127,725$ $ 33,245,963$ $ 1,235,964,320$ 1,366,340,204$ (9.5%)
EXPENDITURES/OTHER OUTFLOWS
Instruction 281,300,138 12,694,593$ 293,994,731 329,086,260 (10.7%)
Public Service 2,325,198 19,215,475 21,540,673 39,277,537 (45.2%)
Academic Support 83,673,744 11,275,679 94,949,423 118,006,140 (19.5%)
Student Services 83,176,965 4,043,705 87,220,670 140,913,631 (38.1%)
175,723,435 2,827,748 178,551,183 175,781,526 1.6%
Operation/Maintenance of Plant 63,286,129 245,432 63,531,561 66,419,833 (4.3%)
Scholarships 20,290,637 153,838,249 174,128,886 173,151,892 0.6%
Auxiliary Enterprises 65,659,245 65,659,245 11,811,415 455.9%
Capital Assets 59,304,184 59,304,184 63,214,883 (6.2%)
82,127,725 82,127,725 83,494,925 (1.6%)
College Carryfwd. & Pending Alloc. 23,940,574 - 57,769,502 - - 33,245,963 114,956,039 165,182,162 (30.4%)
$ 733,716,820 $ 204,140,881 123,428,747 $ 59,304,184 $ 82,127,725 $ 33,245,963 $ 1,235,964,320 $ 1,366,340,204 (9.5%)
Total Expenditures and Other
Outflows
2019 2019 2019 2019 2019 2018
TOTAL RESOURCES AVAILABLE FOR
THE BUDGET YEAR (from Schedule B)
Institutional Support (Admin.)
Debt Service -
General Obligation Bonds
2019 2019
Total Total
Fund Fund Fund Plant Fund Indebtedness Funds All Funds All Funds
General Restricted Auxiliary Unexpended Retirement of Other
MARICOPA COUNTY COMMUNITY COLLEGE DISTRICT
MARICOPA COMMUNITY COLLEGES
BUDGET FOR FISCAL YEAR 2019
EXPENDITURES AND OTHER OUTFLOWS
CURRENT FUNDS PLANT FUNDS
Page 37
Adopted Budget FY2018-19
SECTION D: APPENDIX

Section D: Appendix MAY 22, 2018 FY18-19 Adopted Budget
Page 38
Student Enrollment
PROJECTED PROJECTED
FISCAL FISCAL FISCAL FISCAL FISCAL FISCAL FISCAL FISCAL FISCAL
Headcount 2010-11 2011-12 2012-13 2013-14 2014-15 2015-16 2016-17 2017-18 2018-19
Phoenix 21,392 19,525 19,476 19,008 17,804 17,382 17,100 17,101 17,101
Glendale 32,962 32,854 31,666 30,926 29,306 27,947 27,263 26,446 25,785
GateWay 13,266 11,674 10,962 10,444 9,592 8,495 7,876 7,877 7,877
Mesa 41,836 40,070 38,602 36,054 33,238 30,770 30,154 28,844 29,094
Scottsdale 17,702 17,474 16,527 15,384 14,770 14,760 14,023 13,391 12,922
Rio Salado 57,746 56,031 52,685 48,333 46,836 45,317 43,882 44,122 44,496
South Mountain 10,186 8,027 7,338 6,801 6,159 5,772 5,707 5,707 5,707
Chandler-Gilbert 17,938 19,611 19,791 19,297 19,225 19,040 19,402 19,114 19,114
Paradise Valley 16,046 15,246 14,380 14,198 13,314 12,516 12,586 12,334 12,334
Estrella Mountain 12,612 12,508 12,475 13,009 12,994 12,571 13,080 13,276 13,276
Subtotal 241,686 233,020 223,902 213,454 203,238 194,570 191,073 188,212 187,707
Maricopa Skill Center 1,477 1,336 1,176 1,038 1,073 965 774 720 720
Southwest Skill Center 819 680 572 643 679 496 416 424 424
ABE/GED/ESL 11,264 11,128 12,297 11,244 10,310 10,003 9,655 9,589 9,589
Subtotal 13,560 13,144 14,045 12,925 12,062 11,464 10,845 10,733 10,733
Total Headcount 255,246 246,164 237,947 226,379 215,300 206,034 201,918 198,945 198,440
PROJECTED PROJECTED
Full-Time Student FISCAL FISCAL FISCAL FISCAL FISCAL FISCAL FISCAL FISCAL FISCAL
Equivalent (FTSE) 2010-11 2011-12 2012-13 2013-14 2014-15 2015-16 2016-17 2017-18 2018-19
Phoenix 7,576 7,137 7,001 6,977 6,753 6,621 6,453 6,453 6,453
Glendale 12,777 12,728 12,473 12,326 11,799 11,229 10,966 10,637 10,371
GateWay 3,897 3,567 3,415 3,482 3,310 3,128 2,962 2,962 2,962
Mesa 16,097 15,363 14,709 13,845 13,148 12,137 12,023 11,500 11,600
Scottsdale 6,397 6,350 6,030 5,622 5,362 5,288 5,053 4,825 4,656
Rio Salado 14,378 14,263 13,815 12,584 12,494 11,518 11,736 11,800 11,900
South Mountain 2,954 2,778 2,737 2,586 2,423 2,318 2,278 2,278 2,278
Chandler-Gilbert 7,206 7,830 8,047 7,936 7,894 7,828 7,968 7,850 7,850
Paradise Valley 5,715 5,503 5,260 5,109 4,882 4,641 4,750 4,655 4,655
Estrella Mountain 4,739 4,709 4,932 5,330 5,522 5,362 5,694 5,779 5,779
Subtotal 81,736 80,228 78,419 75,797 73,587 70,070 69,880 68,739 68,504
Maricopa Skill Center 1,064 844 931 866 841 332 720 670 670
Southwest Skill Center 407 343 240 354 296 166 182 186 186
ABE/GED/ESL 1,337 1,609 1,628 1,437 1,426 1,321 1,293 1,284 1,284Subtotal 2,808 2,796 2,799 2,657 2,563 1,819 2,195 2,140 2,1400
Total FTSE 84,544 83,024 81,218 78,454 76,150 71,889 72,075 70,878 70,6430
* NOTE: Columns may not add due to rounding. Headcount reflects credit courses only.
Historic Student Enrollment
ACTUAL
ACTUAL
0
50,000
100,000
150,000
200,000
250,000
300,000
350,000
400,000
FY99-00 FY01-02 FY03-04 FY05-06 FY07-08 FY09-10 FY11-12 FY13-14 FY15-16 FY17-18 Proj.
Student Enrollment
FTSE Headcount

Section D: Appendix MAY 22, 2018 FY18-19 Adopted Budget
Page 39
Historic Tuition & Fees The FY18-19 tuition rate for Maricopa reflects a decrease from $86 to $85 per credit hour that was approved
by the Governing Board on May 1, 2018. The Annual cost is based on 30 credit hours per Academic year.
Tuition/ Annual Fiscal Year Credit Cost * Dollars Percent
FY 2009-10 71.00$ 2,130$ -$ 0%
FY 2010-11 71.00$ 2,130$ -$ 0%
FY 2011-12 76.00$ 2,280$ 150.00$ 7%
FY 2012-13 76.00$ 2,280$ -$ 0%
FY 2013-14 81.00$ 2,430$ 150.00$ 7%
FY 2014-15 84.00$ 2,520$ 90.00$ 4%
FY 2015-16 84.00$ 2,520$ -$ 0%
FY 2016-17 86.00$ 2,580$ 60.00$ 2%
FY 2017-18 86.00$ 2,580$ -$ 0%
FY 2018-19 85.00$ 2,550$ (30.00)$ -1%
MCCCD Historic Tuition & Fees
Increase/Decrease
The table below shows Maricopa’s tuition over a 10-year time period, as well as compared with the Public 2-yr
National Average, Western state institutions and Arizona State University. Locally Maricopa is a bargain
compared to Arizona State University (ASU), where their tuition exceeds $10,000 per year.
Annual Percent Annual Percent Annual Percent Annual Percent
FY 2009-10 2,130$ 0.0% 2,870$ 10.0% 2,648$ 6.4% 6,840$ 20.9%
FY 2010-11 2,130$ 0.0% 3,030$ 5.6% 2,847$ 7.5% 8,844$ 29.3%
FY 2011-12 2,280$ 7.0% 3,170$ 4.6% 3,119$ 9.6% 9,716$ 9.9%
FY 2012-13 2,280$ 0.0% 3,310$ 4.4% 3,319$ 6.4% 9,720$ 0.0%
FY 2013-14 2,430$ 6.6% 3,340$ 0.9% 3,424$ 3.2% 10,002$ 2.9%
FY2014-15 2,520$ 3.7% 3,370$ 0.9% 3,495$ 2.1% 10,157$ 1.5%
FY2015-16 2,520$ 0.0% 3,460$ 2.7% 3,559$ 1.8% 10,478$ 3.2%
FY 2016-17 2,580$ 2.4% 3,520$ 1.7% 3,694$ 3.8% 10,640$ 1.5%
FY 2017-18 2,580$ 0.0% 3,570$ 1.4% 3,838$ 3.9% 10,792$ 1.4%
FY 2018-19 2,550$ -1.2% 3,639$ 1.9% 3,960$ 3.2% 10,792$ 2.0%
Natonal Average 2-yr from "Trends in College Pricing 2017"; ASU and WICHE from WICHE 2017-18 Tuition & Fees report
FY18-19: ASU, National Avg, and WICHE 2yr resident tution are estimated
Tuition Comparison for Local, National, and WICHE
NATL. AVG. WICHE AVG. AZ STATE MARICOPA
$-
$2,000
$4,000
$6,000
$8,000
$10,000
$12,000
FY 2017-18 FY 2018-19
MCCCD NATL. AVG WICHE Avg ASU
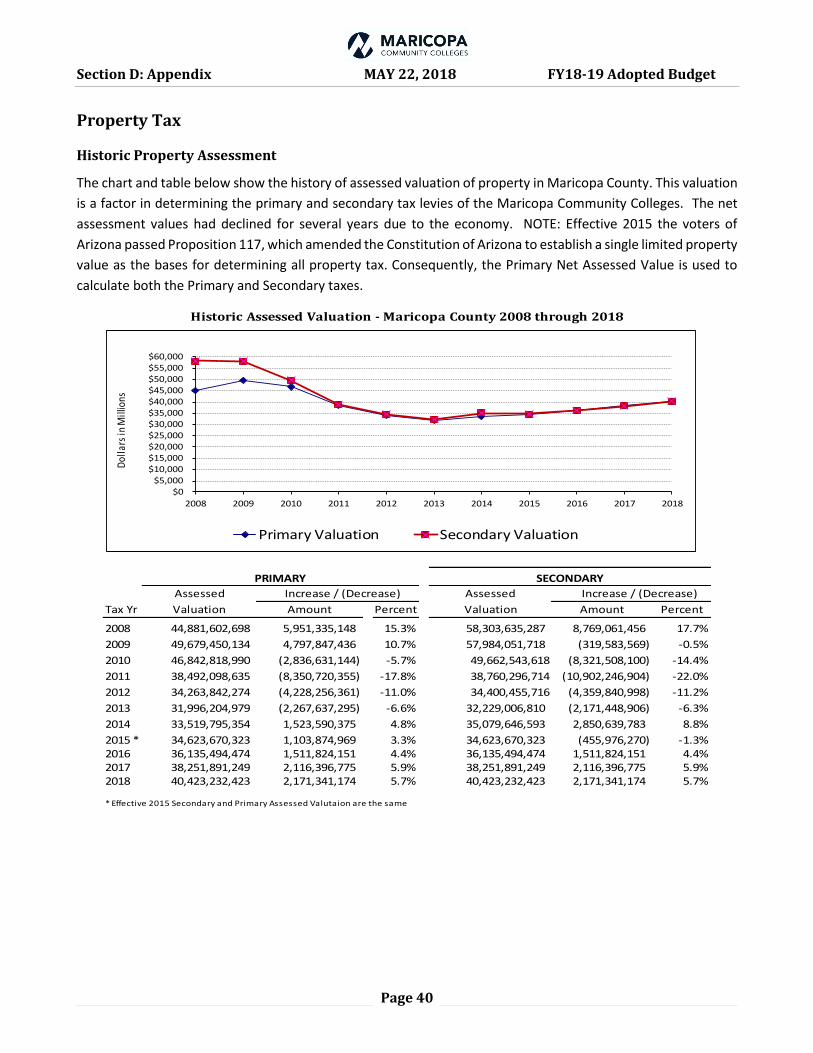
Section D: Appendix MAY 22, 2018 FY18-19 Adopted Budget
Page 40
Property Tax
Historic Property Assessment
The chart and table below show the history of assessed valuation of property in Maricopa County. This valuation
is a factor in determining the primary and secondary tax levies of the Maricopa Community Colleges. The net
assessment values had declined for several years due to the economy. NOTE: Effective 2015 the voters of
Arizona passed Proposition 117, which amended the Constitution of Arizona to establish a single limited property
value as the bases for determining all property tax. Consequently, the Primary Net Assessed Value is used to
calculate both the Primary and Secondary taxes.
Assessed Assessed
Tax Yr Valuation Amount Percent Valuation Amount Percent
2008 44,881,602,698 5,951,335,148 15.3% 58,303,635,287 8,769,061,456 17.7%
2009 49,679,450,134 4,797,847,436 10.7% 57,984,051,718 (319,583,569) -0.5%
2010 46,842,818,990 (2,836,631,144) -5.7% 49,662,543,618 (8,321,508,100) -14.4%
2011 38,492,098,635 (8,350,720,355) -17.8% 38,760,296,714 (10,902,246,904) -22.0%
2012 34,263,842,274 (4,228,256,361) -11.0% 34,400,455,716 (4,359,840,998) -11.2%
2013 31,996,204,979 (2,267,637,295) -6.6% 32,229,006,810 (2,171,448,906) -6.3%
2014 33,519,795,354 1,523,590,375 4.8% 35,079,646,593 2,850,639,783 8.8%
2015 * 34,623,670,323 1,103,874,969 3.3% 34,623,670,323 (455,976,270) -1.3%2016 36,135,494,474 1,511,824,151 4.4% 36,135,494,474 1,511,824,151 4.4%2017 38,251,891,249 2,116,396,775 5.9% 38,251,891,249 2,116,396,775 5.9%2018 40,423,232,423 2,171,341,174 5.7% 40,423,232,423 2,171,341,174 5.7%
* Effective 2015 Secondary and Primary Assessed Valutaion are the same
Historic Assessed Valuation - Maricopa County 2008 through 2018
Increase / (Decrease) Increase / (Decrease)
SECONDARYPRIMARY
$0$5,000
$10,000$15,000$20,000$25,000$30,000$35,000$40,000$45,000$50,000$55,000$60,000
2008 2009 2010 2011 2012 2013 2014 2015 2016 2017 2018
Dol
lars
in M
illio
ns
Primary Valuation Secondary Valuation
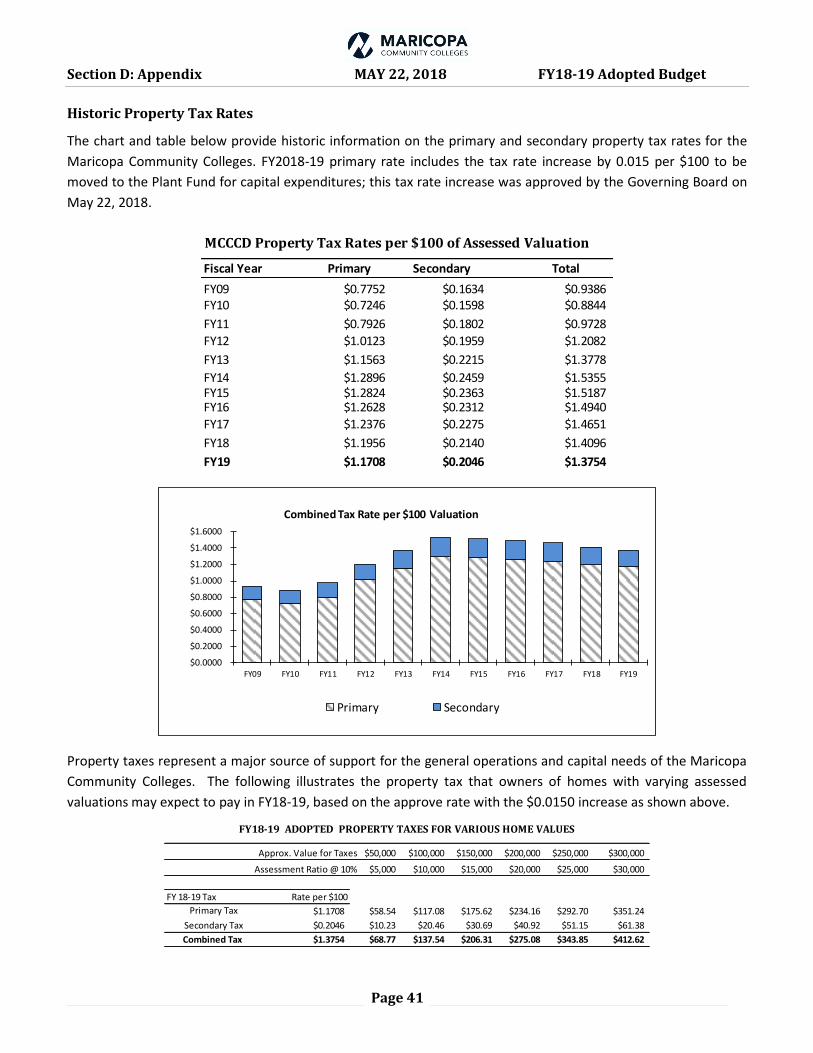
Section D: Appendix MAY 22, 2018 FY18-19 Adopted Budget
Page 41
Historic Property Tax Rates
The chart and table below provide historic information on the primary and secondary property tax rates for the
Maricopa Community Colleges. FY2018-19 primary rate includes the tax rate increase by 0.015 per $100 to be
moved to the Plant Fund for capital expenditures; this tax rate increase was approved by the Governing Board on
May 22, 2018.
Fiscal Year Primary Secondary Total
FY09 $0.7752 $0.1634 $0.9386FY10 $0.7246 $0.1598 $0.8844
FY11 $0.7926 $0.1802 $0.9728
FY12 $1.0123 $0.1959 $1.2082
FY13 $1.1563 $0.2215 $1.3778
FY14 $1.2896 $0.2459 $1.5355FY15 $1.2824 $0.2363 $1.5187FY16 $1.2628 $0.2312 $1.4940
FY17 $1.2376 $0.2275 $1.4651
FY18 $1.1956 $0.2140 $1.4096
FY19 $1.1708 $0.2046 $1.3754
MCCCD Property Tax Rates per $100 of Assessed Valuation
$0.0000
$0.2000
$0.4000
$0.6000
$0.8000
$1.0000
$1.2000
$1.4000
$1.6000
FY09 FY10 FY11 FY12 FY13 FY14 FY15 FY16 FY17 FY18 FY19
Primary Secondary
Combined Tax Rate per $100 Valuation
Property taxes represent a major source of support for the general operations and capital needs of the Maricopa
Community Colleges. The following illustrates the property tax that owners of homes with varying assessed
valuations may expect to pay in FY18-19, based on the approve rate with the $0.0150 increase as shown above.
Approx. Value for Taxes $50,000 $100,000 $150,000 $200,000 $250,000 $300,000
Assessment Ratio @ 10% $5,000 $10,000 $15,000 $20,000 $25,000 $30,000
FY 18-19 Tax Rate per $100
Primary Tax $1.1708 $58.54 $117.08 $175.62 $234.16 $292.70 $351.24
Secondary Tax $0.2046 $10.23 $20.46 $30.69 $40.92 $51.15 $61.38
Combined Tax $1.3754 $68.77 $137.54 $206.31 $275.08 $343.85 $412.62
FY18-19 ADOPTED PROPERTY TAXES FOR VARIOUS HOME VALUES
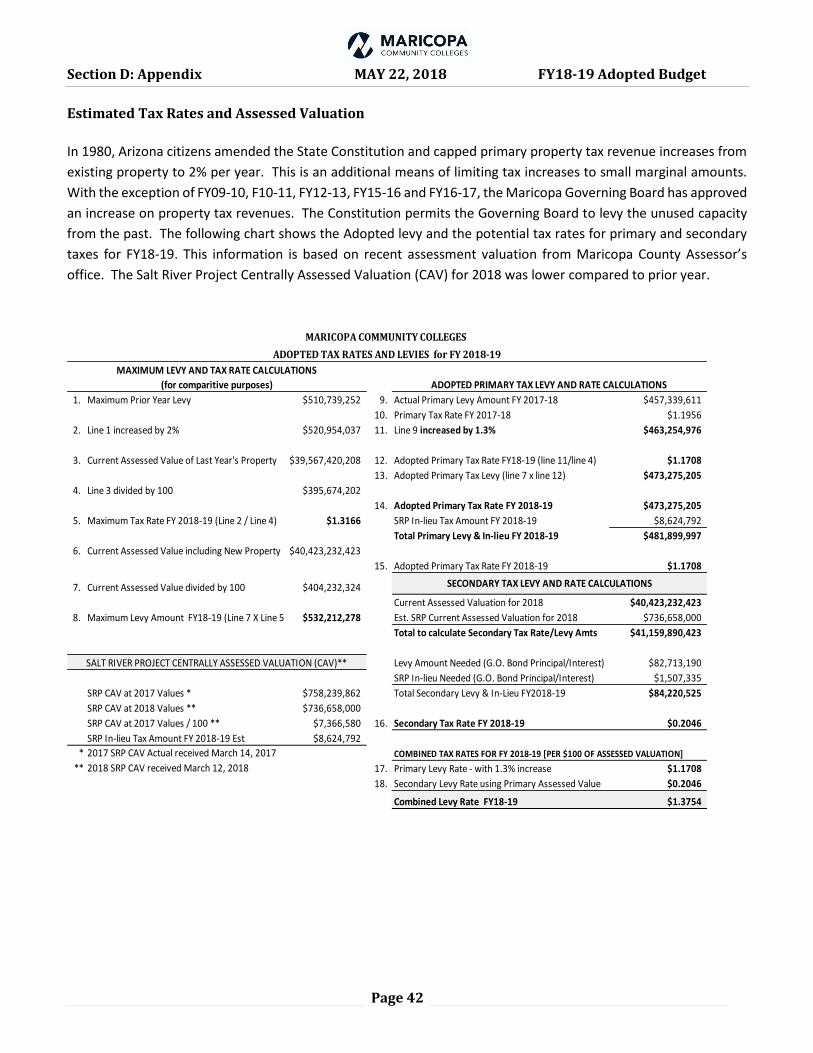
Section D: Appendix MAY 22, 2018 FY18-19 Adopted Budget
Page 42
Estimated Tax Rates and Assessed Valuation
In 1980, Arizona citizens amended the State Constitution and capped primary property tax revenue increases from
existing property to 2% per year. This is an additional means of limiting tax increases to small marginal amounts.
With the exception of FY09-10, F10-11, FY12-13, FY15-16 and FY16-17, the Maricopa Governing Board has approved
an increase on property tax revenues. The Constitution permits the Governing Board to levy the unused capacity
from the past. The following chart shows the Adopted levy and the potential tax rates for primary and secondary
taxes for FY18-19. This information is based on recent assessment valuation from Maricopa County Assessor’s
office. The Salt River Project Centrally Assessed Valuation (CAV) for 2018 was lower compared to prior year.
1. Maximum Prior Year Levy $510,739,252 9. Actual Primary Levy Amount FY 2017-18 $457,339,611
10. Primary Tax Rate FY 2017-18 $1.1956
2. Line 1 increased by 2% $520,954,037 11. Line 9 increased by 1.3% $463,254,976
3. Current Assessed Value of Last Year's Property $39,567,420,208 12. Adopted Primary Tax Rate FY18-19 (line 11/line 4) $1.1708
13. Adopted Primary Tax Levy (line 7 x line 12) $473,275,205
4. Line 3 divided by 100 $395,674,202
14. Adopted Primary Tax Rate FY 2018-19 $473,275,205
5. Maximum Tax Rate FY 2018-19 (Line 2 / Line 4) $1.3166 SRP In-lieu Tax Amount FY 2018-19 $8,624,792
Total Primary Levy & In-lieu FY 2018-19 $481,899,997
6. Current Assessed Value including New Property $40,423,232,423
15. Adopted Primary Tax Rate FY 2018-19 $1.1708
7. Current Assessed Value divided by 100 $404,232,324
Current Assessed Valuation for 2018 $40,423,232,423
8. Maximum Levy Amount FY18-19 (Line 7 X Line 5) $532,212,278 Est. SRP Current Assessed Valuation for 2018 $736,658,000
Total to calculate Secondary Tax Rate/Levy Amts $41,159,890,423
Levy Amount Needed (G.O. Bond Principal/Interest) $82,713,190
SRP In-lieu Needed (G.O. Bond Principal/Interest) $1,507,335
SRP CAV at 2017 Values * $758,239,862 Total Secondary Levy & In-Lieu FY2018-19 $84,220,525
SRP CAV at 2018 Values ** $736,658,000
SRP CAV at 2017 Values / 100 ** $7,366,580 16. Secondary Tax Rate FY 2018-19 $0.2046
SRP In-lieu Tax Amount FY 2018-19 Est $8,624,792
* COMBINED TAX RATES FOR FY 2018-19 [PER $100 OF ASSESSED VALUATION]
** 17. Primary Levy Rate - with 1.3% increase $1.1708
18. Secondary Levy Rate using Primary Assessed Value $0.2046
Combined Levy Rate FY18-19 $1.3754
2017 SRP CAV Actual received March 14, 2017
2018 SRP CAV received March 12, 2018
MARICOPA COMMUNITY COLLEGES
ADOPTED TAX RATES AND LEVIES for FY 2018-19
MAXIMUM LEVY AND TAX RATE CALCULATIONS
(for comparitive purposes) ADOPTED PRIMARY TAX LEVY AND RATE CALCULATIONS
SECONDARY TAX LEVY AND RATE CALCULATIONS
SALT RIVER PROJECT CENTRALLY ASSESSED VALUATION (CAV)**
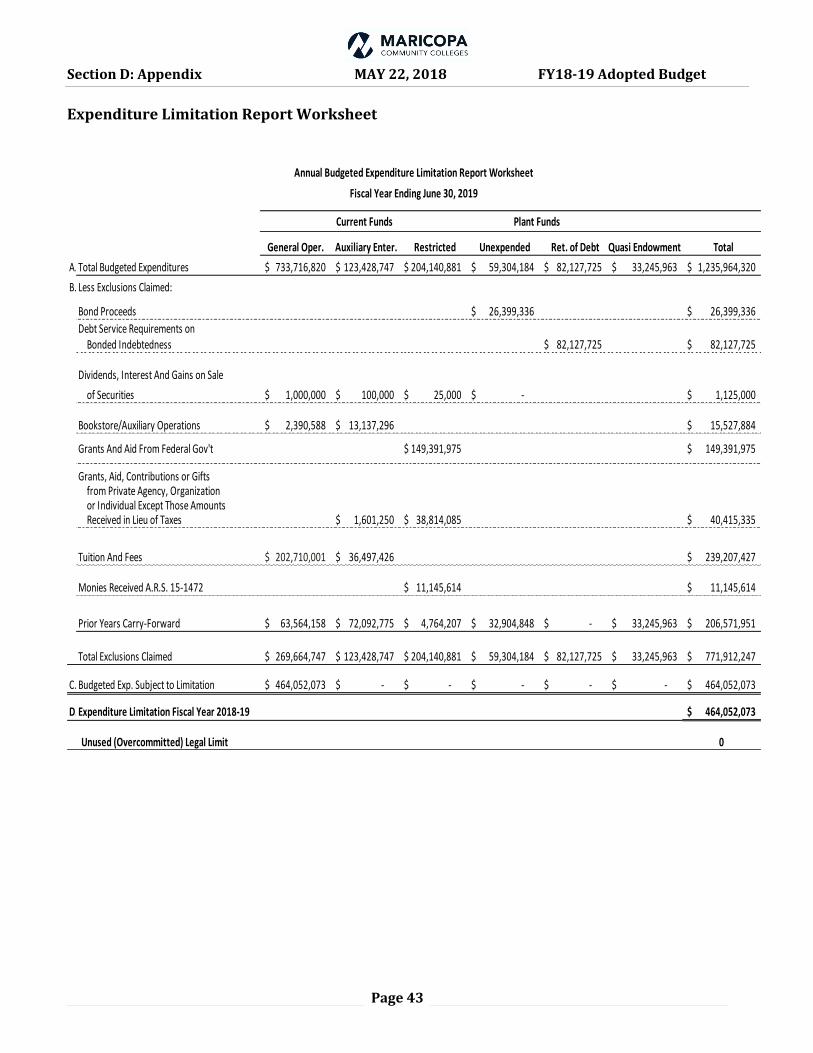
Section D: Appendix MAY 22, 2018 FY18-19 Adopted Budget
Page 43
Expenditure Limitation Report Worksheet
General Oper. Auxiliary Enter. Restricted Unexpended Ret. of Debt Quasi Endowment Total
A. Total Budgeted Expenditures 733,716,820$ 123,428,747$ 204,140,881$ 59,304,184$ 82,127,725$ 33,245,963$ 1,235,964,320$
B. Less Exclusions Claimed:
Bond Proceeds 26,399,336$ 26,399,336$
Debt Service Requirements onBonded Indebtedness 82,127,725$ 82,127,725$
Dividends, Interest And Gains on Sale
of Securities 1,000,000$ 100,000$ 25,000$ -$ 1,125,000$
Bookstore/Auxiliary Operations 2,390,588$ 13,137,296$ 15,527,884$
Grants And Aid From Federal Gov't 149,391,975$ 149,391,975$
Grants, Aid, Contributions or Giftsfrom Private Agency, Organizationor Individual Except Those AmountsReceived in Lieu of Taxes 1,601,250$ 38,814,085$ 40,415,335$
Tuition And Fees 202,710,001$ 36,497,426$ 239,207,427$
Monies Received A.R.S. 15-1472 11,145,614$ 11,145,614$
Prior Years Carry-Forward 63,564,158$ 72,092,775$ 4,764,207$ 32,904,848$ -$ 33,245,963$ 206,571,951$
Total Exclusions Claimed 269,664,747$ 123,428,747$ 204,140,881$ 59,304,184$ 82,127,725$ 33,245,963$ 771,912,247$
C. Budgeted Exp. Subject to Limitation 464,052,073$ -$ -$ -$ -$ -$ 464,052,073$
D.Expenditure Limitation Fiscal Year 2018-19 464,052,073$
Unused (Overcommitted) Legal Limit 0
Annual Budgeted Expenditure Limitation Report Worksheet
Fiscal Year Ending June 30, 2019
Current Funds Plant Funds

Page 44
Adopted Budget FY2018-19
SECTION E: GLOSSARY
Section E: Glossary May 22, 2018 FY18-19 Adopted Budget
Page 45
Academic Support
A functional category of expenditures reflective of support services for instructional programs and academic
functions such as funding for learning centers, libraries, and honor programs.
Account Codes (formerly Object Code)
Expenditures are budgeted and accounted for by account code categories to detail the use of funds. Revenues
also are budgeted in account codes to distinguish different types of resources
Communications and Utilities
All costs related to telephone, postage, electricity, water, sewer, etc. are charged to communications and utilities
account code.
Contingency, Scholarships, Misc, Transfers:
The contingency, miscellaneous and transfers account code includes reserve, holding and transfers accounts.
Examples are: a contingency for taxes that are budgeted but not collected; a basic contingency for unexpected
needs as prioritized by the Governing Board; allocations for the Enrollment Growth Funding program reserved
to help fund additional courses for increased student enrollment; funds for incremental costs from capital
development facilities; a reserve for insurance costs, college carryforward and student scholarships
Contractual Services
Expenditures such as funding for professional services, advertising, marketing, etc. are budgeted in the
contractual services account code series. Additionally, the cost of teaching services and course development for
concurrent enrollment as well as employer-sponsored programs may be charged to this account code.
Course Fees
Course fees are budgeted in the Auxiliary Fund. They cover the cost of materials for credit courses that rely on
special equipment or supplementary materials
Employee Benefits
These account codes account for the employee paid costs of employee health insurance, District retirement
contributions, social security and Medicare, life insurance, worker’s compensation, etc.
Enrollment Growth Funding
A formula based funding allocation based on full time student equivalent (FTSE) growth. Effective FY2010-11
Budget, funding were distributed to the colleges based on estimated growth at the rate of $2,130 per FTSE.
Expenditure Limitation
This is a provision of the State Constitution and Arizona Revised Statutes that limits the expenditure of local tax
revenues (e.g. primary property taxes and State Aid). The limitation is set by the Economic Estimates
Commission (EEC) by applying growth in enrollment (FTSE) and inflation over a base budget year.
Fixed Charges
Expenditures for facilities rentals, etc. are budgeted in fixed charges account code.
Food Service
This Auxiliary Fund division includes revenues and expenditures from directly operated food service operations. Full-time Student Equivalents (FTSE)

Section E: Glossary May 22, 2018 FY18-19 Adopted Budget
Page 46
A calculated estimate of enrollment, based on credit hours divided by 30 (the number of credits in a year that is
considered to be full-time). In the case of Skill Center or ABE/GED students, clock hours are used and divided by
640.
Functional Categories
To ensure comparability and standardization in the presentation of financial information, all colleges and units
are required to budget and account for the expenditure of funds by functional categories
General Institutional Support
A functional expense category that includes expenses for the day-to-day operational and general administrative
support of the institution such as safety, security, insurance, software licensing and computer repair, mail and
copy services, etc.
Headcount
The number of students enrolled in classes. Headcount may be duplicated or unduplicated.
In-Lieu Taxes (SRP)
In-lieu tax refers to a levy imposed as an alternate for another tax. Salt River Project is a political subdivision of the State of Arizona, so they are exempt from property tax. However, in accordance with Arizona law, the SRP District makes voluntary contributions each year to the State of Arizona, school districts, cities, counties, towns and other political subdivisions of the State of Arizona, for which property taxes are levied and within whose boundaries SRP has property included in its electric system. The amount paid is computed on the same basis as ad valorem taxes paid by a private utility corporation.
Institutional Support
This is a functional category of expenditures to identify cost related to management, business and human
resources operations, and planning of the organization. Examples include office of the president, fiscal
operations, human resources offices, information technology staff and legal services.
Instruction
This is a functional category of expenditures accounting for instructional activities. An example is salaries and
wages of faculty and supplies and other department chairs.
Non Credit/Special Interest Courses
These are fees that support the costs of these course offerings. This is an Auxiliary Fund division.
Object Codes (now Account Code)
Expenditures are budgeted and accounted for by account code categories to detail the use of funds. Revenues
also are budgeted in account codes to distinguish different types of resources
Operations/Maintenance
A functional category of expenditures allocated for the operation and maintenance of the physical plant, such
as utility costs and staff responsible for the maintenance of buildings and grounds for all units.
Section E: Glossary May 22, 2018 FY18-19 Adopted Budget
Page 47
Other Auxiliary Programs
The activities of this Auxiliary Fund division are supported by several sources including interest on cash balances
and facility rentals. Expenditures are for such purposes as scholarships, rental costs, faculty training (Lodestar),
campus security training, and revenue bond repayment costs.
Public Services
A functional category of expenditures that account for non-instructional services of benefit to the community;
examples include public lectures, and community service programs.
Salaries and Wages
Compensation provided to all regular Governing Board approved faculty and staff, while the temporary staff budget
is recorded in salaries and wages account codes.
State Aid
The State of Arizona provides financial support to community college districts based on formulas that are set in
statute. These formulas largely are based on enrollment levels. The formulas use the most recent audited full-time
student equivalents; hence, state aid is provided for enrollment growth that occurred two years before the fiscal
year under development. Currently Maricopa Community College District does not received State Aid.
Student Services
A functional category of expenditures reflective of support services provided to students, such as counseling,
testing, admissions, student financial aid, and career development.
Supplies & Materials
The cost of classroom and office supplies and materials, software, audiovisual aids, etc. is budgeted in supplies and
materials account code.
Tax Levy Limit
This is a provision of the Arizona State Constitution and statute that limits growth in taxes on existing property.
Travel
Travel related account codes include mileage, in and out of state travel, registration, hotels, airfare, etc.
Budget Office Info May 22, 2018 FY18-19 Adopted Budget
Page 48
https://www.maricopa.edu
https://district.maricopa.edu/data-reports/budget
The FY2018-19 Adopted Budget is prepared by the Financial Planning & Budget Office--Business Services
2411 W. 14th Street Tempe, AZ 85281-6942