adopted budget - cfpua
TRANSCRIPT

Adopted
Budget For the Fiscal
Year Beginning
July 1, 2019
Cape Fear
P u b lic U t il it y A u t h o r i t y
CAPE FEAR PUBLIC UTILITY AUTHORITY RECOMMENDED BUDGET FISCAL YEAR 2019 - 2020
Board Members
William A. Norris, Chair
Wesley P. Corder, Vice Chair
Jennifer Adams, Secretary
Michael C. Brown, III, Treasurer
Jessica Cannon, M.D.
Deans Hackney
Patricia O. Kusek, New Hanover County Commissioner
Kevin O’Grady, City of Wilmington Councilman
Charles Rivenbark, City of Wilmington Councilman
Larry Sneeden
Rob Zapple, New Hanover County Commissioner
James R. Flechtner, PE, Executive Director
John B. McLean, CPA, Chief Financial Officer
235 Government Center Drive
Wilmington, NC 28403
www.cfpua.org

Board Members
William A. Norris
Chairman
Appointed by the City of Wilmington
Seated in 2013
Term ends in 2018
Committees: Executive & Finance
Wesley P. Corder
Vice-Chair
Jointly appointed by City of Wilmington
and New Hanover County
Seated in 2017
Term ends 2020
Committee: Executive, Finance & Communications
Jennifer Adams
Secretary
Appointed by New Hanover County
Seated in 2016
Term ends 2019
Committee: Executive & Finance
Patricia O. Kusek
Commissioner
Appointed by New Hanover County
Seated in 2011
Term ends 2018
Committees: Communications &
Human Resources
Kevin O’Grady
Councilman
Appointed by City of Wilmington
Seated in 2014
Term ends 2019
Committee: Human Resources & Communications
Charles Rivenbark
Councilman
Appointed by City of Wilmington
Seated in 2010
Term ends in 2018
Committees: Long Range
Planning

Michael C. Brown, III
Treasurer
Appointed by New Hanover County
Seated in 2010
Term ends in 2019
Committees: Executive &
Finance
Jessica Cannon, M. D.
Member Appointed by City of Wilmington
Seated in 2019
Term ends 2020
Committees: Long Range Planning
Deans Hackney
Member
Appointed by City of Wilmington
Seated in 2018
Term ends in 2019
Committees: Long Range Planning & Human Resources
Larry Sneeden
Member
Appointed by New Hanover County
Seated in 2012
Term ends in 2020
Committees: Long Range Planning
Rob Zapple
Commissioner
Appointed by New Hanover County
Seated in 2015
Term ends in 2019
Committees: Finance & Long Range Planning
Donna S. Pope
Clerk to the Board

Fiscal Year 2019-2020 Budget Cape Fear Public Utility Authority
TABLE OF CONTENTS
INTRODUCTION & OVERVIEW
Budget Guide ______________________________________________________________ 8
Budget Message ___________________________________________________________ 9
Cape Fear Public Utility Authority Profile ________________________________________12
Strategic Plan______________________________________________________________16
Organizational Charts ______________________________________________________ 18
Financial Structure _________________________________________________________ 19
Budget Process ___________________________________________________________ 20
Budget Calendar __________________________________________________________ 22
Financial Policies __________________________________________________________ 24
OPERATING BUDGET
Expenditures Summary _____________________________________________________ 26
Departmental Summaries ___________________________________________________ 32
Authority Board ________________________________________________________ 32
Administration _________________________________________________________ 33
Finance _______________________________________________________________ 33
Human Resources ______________________________________________________ 33
Public & Environmental Policy ____________________________________________ 34
Information Technology _________________________________________________ 34
Engineering ___________________________________________________________ 35
Operations – Administration ______________________________________________ 35
Operations – Centralized Maintenance______________________________________ 35
Operations – Utility Services ______________________________________________ 36
Operations – Water Treatment ____________________________________________ 36
Operations – Wastewater Treatment _______________________________________ 37
Environmental Management/Safety ________________________________________ 37
Customer Service _______________________________________________________ 38
Revenue Summary _________________________________________________________ 39
Projected Changes in Net Position ____________________________________________ 44
Consolidated Financial Schedules
Operating Budget Summary _______________________________________________ 46
Statement of Revenues, Expenditures & Changes in Fund Balance ________________ 47
Budgeted and Actual Expenditures Summarized by Department and Category _______ 48
Budgeted and Actual Expenditures Detail by Department and Category ____________ 49
CAPITAL BUDGET
Capital Budget Summary ____________________________________________________ 51
FY 19-20 Capital Project Summaries ___________________________________________ 53
Ten-Year Capital Improvements Program ______________________________________ 80
Fiscal Year 2019-2020 Budget Cape Fear Public Utility Authority
TABLE OF CONTENTS
Projected Operating Budget Impacts From FY2020 CIP ____________________________ 83
LONG-TERM FINANCIAL MANAGEMENT ___________________________________________ 85
20 Year Projections of Operating and Capital Expenditures ________________________ 92
SUPPLEMENTAL & STATISTICAL INFORMATION
Acronyms ________________________________________________________________ 94
Rate and Fees Schedule _____________________________________________________ 96
Demographic Statistics ____________________________________________________ 100
Principal Water Customers _________________________________________________ 101
Principal Wastewater Customers ____________________________________________ 102
Principal Employers _______________________________________________________ 103
Operating Statistics _______________________________________________________ 104
Consumption by Customer Group ____________________________________________ 105
Budget Ordinances ______________________________________________________ 106
Glossary ________________________________________________________________ 108
Fiscal Year 2019-2020 Budget Cape Fear Public Utility Authority
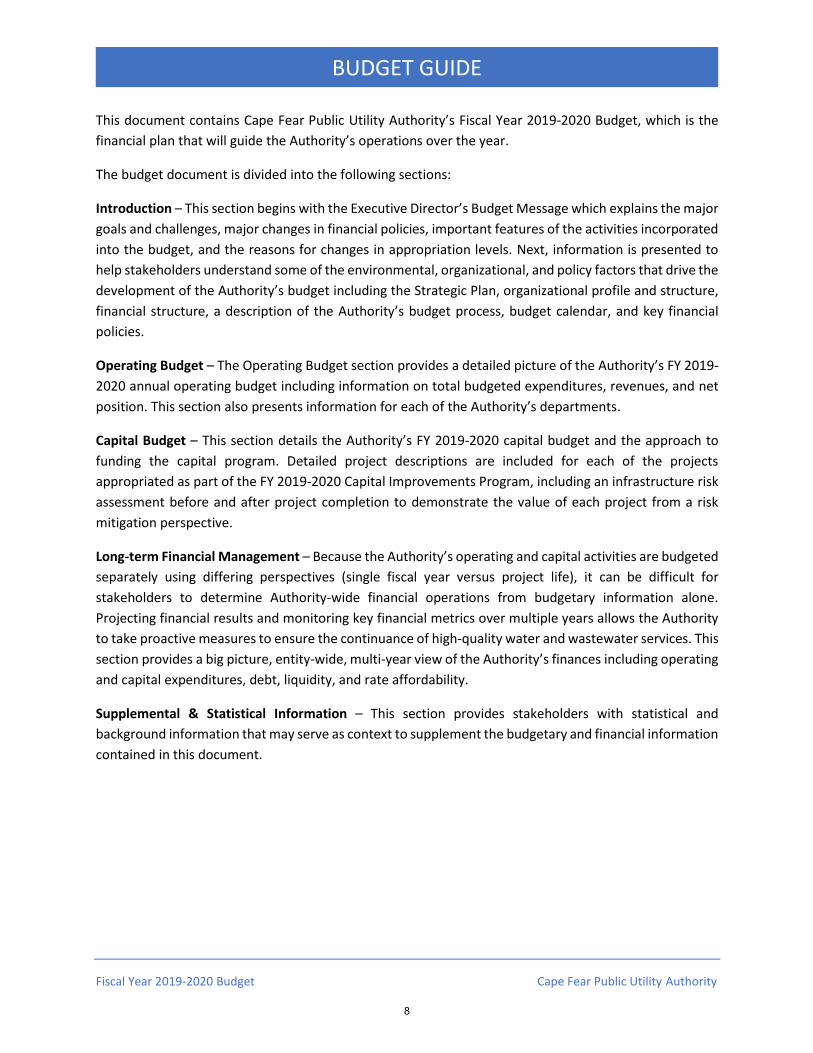
BUDGET GUIDE
This document contains Cape Fear Public Utility Authority’s Fiscal Year 2019-2020 Budget, which is the
financial plan that will guide the Authority’s operations over the year.
The budget document is divided into the following sections:
Introduction – This section begins with the Executive Director’s Budget Message which explains the major
goals and challenges, major changes in financial policies, important features of the activities incorporated
into the budget, and the reasons for changes in appropriation levels. Next, information is presented to
help stakeholders understand some of the environmental, organizational, and policy factors that drive the
development of the Authority’s budget including the Strategic Plan, organizational profile and structure,
financial structure, a description of the Authority’s budget process, budget calendar, and key financial
policies.
Operating Budget – The Operating Budget section provides a detailed picture of the Authority’s FY 2019-
2020 annual operating budget including information on total budgeted expenditures, revenues, and net
position. This section also presents information for each of the Authority’s departments.
Capital Budget – This section details the Authority’s FY 2019-2020 capital budget and the approach to
funding the capital program. Detailed project descriptions are included for each of the projects
appropriated as part of the FY 2019-2020 Capital Improvements Program, including an infrastructure risk
assessment before and after project completion to demonstrate the value of each project from a risk
mitigation perspective.
Long-term Financial Management – Because the Authority’s operating and capital activities are budgeted
separately using differing perspectives (single fiscal year versus project life), it can be difficult for
stakeholders to determine Authority-wide financial operations from budgetary information alone.
Projecting financial results and monitoring key financial metrics over multiple years allows the Authority
to take proactive measures to ensure the continuance of high-quality water and wastewater services. This
section provides a big picture, entity-wide, multi-year view of the Authority’s finances including operating
and capital expenditures, debt, liquidity, and rate affordability.
Supplemental & Statistical Information – This section provides stakeholders with statistical and
background information that may serve as context to supplement the budgetary and financial information
contained in this document.
8

Fiscal Year 2019-2020 Budget Cape Fear Public Utility Authority
BUDGET MESSAGE
Members of the Authority Board Cape Fear Public Utility Authority 235 Government Center Drive Wilmington, NC 28403
Dear Members of the Authority Board: I am pleased to present the Authority’s Fiscal Year 2019-2020 budget. This budget was prepared in accordance with the Local Government Budget and Fiscal Control Act, and is designed to provide services meeting or exceeding all applicable state regulations and rate covenants. This budget contains the necessary projects and operational funding to ensure that we continue providing the highest quality water and wastewater services to our customers at the lowest practical cost. As we enter our eleventh year of serving over 200,000 people in the City of Wilmington and New Hanover County, we continue to successfully operate under our guiding principles of Stewardship, Sustainability, and Service. These tenets provide a strong base upon which we have built award-winning services. At the same time, they drive us to continually increase the value of the services we offer. Given the complex issues facing water and sewer providers, I am confident this budget continues the Authority in the right direction. It addresses a broad spectrum of important topics such as customer service, public health, environmental stewardship, staff development, risk management and emergency preparedness to name a few. With the Authority’s human and financial resources focused in the right areas, we will remain ready to meet the needs of our community. The following factors influenced the decisions made in developing the budgets for FY 19-20:
• The rehabilitation and replacement of aging infrastructure - We are pleased to report that deliberate investment in infrastructure and operations is consistently paying dividends, improving our resiliency and enhancing our services while reducing risk. The primary components of this budget include projects identified in the ten-year Capital Improvements Program (CIP), forecasted water and wastewater demands, projected operating costs required to sustain service levels, and debt obligations. With continued input from you and key stakeholders, our budgets will accurately assess and meet community needs, both now and into the future.
• Commitment to sustainable capital funding – CFPUA’s financial policies imply that CFPUA’s $18 million minimum level of annual capital investment will be funded through current year water and wastewater rate revenue collections. Over the past two fiscal years the Board has adopted increases to water and wastewater rates to achieve this funding level. Due to higher-than-expected customer growth, CFPUA would have been able to fund the $18 million pay-as-you-go capital funding target in FY 19-20 without an increase to rates. However, due to the presence of PFAS in residual biosolids, CFPUA will transport this material to a land fill instead of applying it to farmland in the surrounding counties. Landfilling costs approximately $1.5 million more than land application. In FY 19-20 this additional cost is funded through a reduction in budgeted pay-go transfers from the $18 million target to $16.5 million. This temporary approach was preferable to increasing wastewater rates and will allow additional time to explore other lower cost options.
9

Fiscal Year 2019-2020 Budget Cape Fear Public Utility Authority
BUDGET MESSAGE
• In June 2017, the issue of water quality became the focus of our community when emerging contaminants were discovered in the drinking water and in the Cape Fear River—the largest source of drinking water for our region. Cape Fear Public Utility Authority has taken legal action, continued to monitor and track levels of these compounds, and begun testing new treatment technologies that have the potential to remove them from the drinking water. As of May 31, 2019, the Authority has spent $7.4 million related to emerging contaminants. These costs include $320,500 for water and wastewater treatment costs related to water removed from the Authority’s contaminated aquifer storage and recovery well. Except for $635,000 in state grants, all of these costs were funded with rate revenues.
OPERATING BUDGET The total Fiscal Year 2019-2020 operating budget is approximately $85.6 million. As a foundation for the FY 19-20 budget process, key goals and assumptions are identified and highlighted below:
• Fiscal Year 2019-2020 budgeted operating expenditures (excluding salaries and benefits, contingency, and debt service appropriations) are based on known costs or projections of likely costs derived from historical data adjusted for current expectations. Budgeted operating expenditures for FY 19-20 are approximately $3.2 million greater than operating expenditures in the adopted FY 18-19 budget. Approximately $2.2 million of this increase is attributable to forecasted legal, sampling, and other costs directly attributable to PFAS, including costs related to litigation, sampling, and biosolids disposal.
• Budgeted salaries include 4 additional full-time equivalent (FTE) positions including, one FTE in Administration, one FTE in Operations – Water Treatment, one FTE in Operations – Utility Services, and one FTE in Environmental Management. Budgeted salaries also include equity adjustments for various positions, a 1.5% cost-of-living adjustment, and 2.5% merit increases.
• Benefits were budgeted with a composite 4% in health premiums, respectively, effective January 1, 2020 and an increase in the Local Government Employee Retirement System employer contribution rate from 7.75% to 8.95% of covered payroll.
• Transfers to the capital projects funds remain relatively constant as compared to the FY18-19 adopted budget at $16.5 million. This amount is part of the Authority’s plan to transition to a point where normal, recurring annual capital expenditures are fully funded through rates pursuant to the Authority’s debt management policy.
• Debt service requirements (principal and interest on outstanding debt) in FY 19-20 are $22.4 million.
CAPITAL BUDGET
The total of the 10-Year Capital Improvements Program (CIP) is $257.5 million. New projects appropriated in FY 19-20 total $84.9 million with $43.3 million appropriated for enhancements to the Sweeney Water Treatment Plan for the removal of PFAS and other emerging, unregulated contaminants from finished drinking water; $25 million for CFPUA’s share of costs to replace the main that transmits raw surface water
10
Fiscal Year 2019-2020 Budget Cape Fear Public Utility Authority
BUDGET MESSAGE
to the Sweeney Water Treatment Plant; and the remaining $15.6 for various projects to rehabilitate or replace aging water and wastewater infrastructure.
The 10-Year CIP plan is reevaluated each year and provides opportunities to revisit the priorities and progress of these criteria. All projects were evaluated by preparing initial business cases. This process reviewed the best information available to identify project alternatives, pros and cons for each alternative, and planning level cost comparisons.
The initial business cases assess current risk and the risk reduction achieved by various project alternatives, in terms of consequence of failure and likelihood of failure. All projects were also prioritized on one or more of the following criteria:
• Compliance with regulatory requirements.
• Efficiency leading to future operating or capital savings.
• Capacity increases necessary for current of future flows.
• Growth in the number of customers served. Once projects are prioritized, the 10-Year CIP is incorporated into the Authority’s long-term financial plan prepared within the constraints established in policy to determine the financial impact on debt and debt service coverage, fund balance, and rates. This process is iterative in which the goal is to optimize system investment while being responsible to our rate payers and ensuring the financial sustainability of the organization. AWARDS
The Government Finance Officers Association of the United States and Canada (GFOA) presented a Distinguished Budget Presentation Award to the Authority for its annual budget for the fiscal year beginning July 1, 2018. The Authority has received this prestigious award for seven years. In order to receive this award, a governmental unit must publish a budget document that meets criteria as a policy document, as an operations guide, as a financial plan and as a communications device. We believe our FY 19-20 budget continues to conform to program requirements, and we are submitting it to GFOA to determine eligibility for another award.
This budget represents the combined efforts, experience, and expertise of the Authority Board, its Committees, and staff. This important work allows Cape Fear Public Utility Authority to meet the short and long-term needs of the customers we serve. A clear and transparent track record of responsibly employing our funding to the betterment of our customers and community has been established, and I am confident we will continue on this path in FY 19-20.
Respectfully submitted,
James R. Flechtner, P.E. Executive Director
11
Fiscal Year 2019-2020 Budget Cape Fear Public Utility Authority
CAPE FEAR PUBLIC UTILITY AUTHORITY PROFILE
Organizational Overview Cape Fear Public Utility Authority was formed by the City of Wilmington and New Hanover County to combine the water and wastewater operations, and began operations on July 1, 2008. The Authority was established pursuant to the Chapter 162A, Article 1 of the North Carolina General Statutes, known as the North Carolina Water and Sewer Authorities Act. The Authority’s service area consists of the City of Wilmington and areas of New Hanover County previously served by the New Hanover County Water and Sewer District (District). It does not include the municipalities of Carolina Beach, Kure Beach, and Wrightsville Beach; although by agreement, wastewater flows from Wrightsville Beach and a portion of Pender County are conveyed to and treated by the Authority. Recently, the Authority entered into a three-year bulk purchase agreement that provides the Town of Wrightsville Beach additional available drinking water during tourist season up to 45 million gallons per year. New Hanover County’s population is approximately 230,000 in an area encompassing approximately 220 square miles. Of this total, 21 square miles consist of water and wetlands. New Hanover County is the second smallest county in North Carolina by land area and is also the second most densely populated of the 100 counties. The County’s beaches provide miles of unspoiled natural beauty and are the area’s most popular tourist attractions. The County is the eastern terminus of Interstate Highway 40, a transcontinental route ending in Barstow, California. An eleven-member board governs the Authority. The City and County appoint five members each, with four of those appointments (two each) coming from their respective governing boards. The eleventh member is jointly appointed. The Authority board is responsible for the adoption of the annual budget, setting water and wastewater rates, making policy decisions, and managing the Executive Director and Legal Counsel.
The Water System
The water system is composed of a surface water system and two groundwater systems. There are 69,634 customer accounts, an increase of 1,022 compared to the previous year. Also, an additional 5,066 locations have services available (vacant lots). The Authority recently entered into a three-year bulk purchase agreement providing the Town of Wrightsville Beach additional drinking water during tourist season. The water system has 1,131 miles of distribution lines at June 30, 2018. The Authority also keeps eight wells on standby to supplement the water supply during emergencies or peak demand periods. Metered water consumption for the fiscal year June 30, 2018 increased .25% from the previous year.
The Authority has a needs-based contract to purchase up to 23.0 MGD of raw water from the Lower Cape Fear Water and Sewer Authority (LCFWSA) with a term ending in 2030. Raw surface water is either drawn from the Cape Fear River through the Authority’s 10 million gallon per day (MGD) raw water intake at King’s Bluff or purchased through a connection with the LCFWSA at U.S. Highway 421. The raw surface water is pumped to the Sweeney Water Treatment Plant (SWTP), which provides potable water to most of the Authority’s service area. The SWTP has a rated capacity of 35 MGD. Average production during the fiscal year ended June 30, 2018 was 14.49 MGD. The surface water distribution system has been providing water service for more than 100 years and includes 16.0 million gallons of covered finished water storage and 5.6 million gallons of storage in five elevated tanks. The LCFWSA and CFPUA equally share in the 106 MGD (combined) allocation of raw water from the Cape Fear River withdrawn at the Kings Bluff Raw Water Facilities.
12
Fiscal Year 2019-2020 Budget Cape Fear Public Utility Authority
CAPE FEAR PUBLIC UTILITY AUTHORITY PROFILE
In October 2009, the Authority placed a Nano-Filtration Groundwater Membrane Plant (the Richardson Plant) into operation to serve the northeast section of the distribution system. The source of raw water is from 25 wells drawing from two different aquifers. The plant softens the groundwater and removes organic and inorganic contaminants to produce a blended groundwater that is followed by disinfection, fluoridation, corrosion control, and pH adjustment. The Richardson Plant has a rated capacity of 6.0 MGD. The Richardson Plant had a daily average production during the fiscal year ended June 30, 2018 of 2.49 MGD. The distribution system provides water service to customers and includes 2.8 million gallons of covered ground storage and 2.35 million gallons of elevated storage in five elevated tanks. In addition, the Authority operates one smaller groundwater system, Monterey Heights, providing groundwater directly to customers from five wells and a single 0.5 million gallon elevated storage tank. The groundwater receives disinfection and pH adjustment before being pumped to the distribution system and the storage tank. Average production of the Monterey Heights system during the fiscal year ended June 30, 2018 was 0.693 MGD.
The Wastewater System
There are 69,135 wastewater accounts, an increase of 1,512 compared to the previous year. Also, an additional 3,908 locations have services available (vacant lots). The Authority also provides wholesale wastewater treatment services to the Town of Wrightsville Beach and provides wastewater services to a portion of Pender County. The Authority’s collection system consists of approximately 890 miles of gravity lines, 22,100 manholes, approximately 150 pump stations and 150 miles of pressurized sewage force main. Wastewater consumption, based on metered water (excluding irrigation) for the fiscal year June 30, 2018 increased 1.61% from the previous year.
The Authority currently owns and operates the James A. Loughlin, or Northside Wastewater Treatment Plant (NSWWTP) and the M’Kean Maffitt, or Southside Wastewater Treatment Plant (SSWWTP). The NSWWTP is permitted to treat up to 16.0 MGD. The SSWWTP is permitted to treat up to 12.0 MGD. For the fiscal year ended June 30, 2018, the combined average daily flows were 16.9 MGD of the combined 28.0 MGD permitted. The NSWWTP and SSWWTP both use physical, chemical and biological processes to clean the wastewater. After the wastewater flows are collected and treated, the treated effluent from the SSWWTP and the NSWWTP is discharged into the Cape Fear River. The Authority also has a hauled waste program receiving septage and other non-hazardous wastes to NSWWTP for processing.
The Authority has a sewer use ordinance that is administered under the pretreatment program. Ordinance revisions were approved by the Board on October 10, 2012, to ensure compliance with state and federal requirements and incorporate federal streamlining revisions. The pretreatment program monitors and regulates significant wastewater dischargers that are either connected to the Authority’s wastewater collection system or hauled to the wastewater treatment plants. Currently, six significant industrial users (SIU) are permitted under the program. SIU permits contain discharge limits for pollutants such as biochemical oxygen demand (BOD), total suspended solids (TSS), chemical oxygen demand (COD), oil and grease, chlorides, ammonia, total kjeldahl nitrogen (TKN), fluoride, certain metals, and organics. All SIUs pre-treat wastewater prior to discharging to the Authority. All SIUs submit monthly monitoring reports. Authority staff conducts semi-annual monitoring. Surcharges are applied to waste that contains pollutants in excess of domestic strength waste. A NC Division of Water Quality approved enforcement response plan ensures permit violations are addressed timely and equitably. Additionally, the pretreatment program permits and monitors food service establishments and other dischargers of
13

Fiscal Year 2019-2020 Budget Cape Fear Public Utility Authority
CAPE FEAR PUBLIC UTILITY AUTHORITY PROFILE
non-domestic wastewater that could be harmful to the treatment works, employees, bio-solids, public health, and receiving waters.
Additional information regarding the Authority’s service area and operating statistics are located in the supplemental and statistical section of this document.
14

15

Mission Statement
"We are a customer-centric organization that delivers high-quality water services."
Vision Supporting our community’s quality of life through the responsible use and care of water.
Values Excellence, transparency, education, and collaboration
Cape Fear Public Utility Authority Strategic Plan 2019
www.cfpua.org 235 Government Center Drive Wilmington, NC 28403
Goals Goal One: Understand and respond to the community’s current and future needs.
Strategies:
1.1. Understand, anticipate, and respond to our customers and our community’s needs in a professional, prompt, and efficient manner.
1.2. Maintain a stable financial position that balances rates, affordability, the environment, and the organization’s long-term capital and operating needs.
1.3. Identify partnerships, develop alliances, and encourage participation with both public and private community stakeholders.
1.4. Recruit and retain a well-qualified and motivated workforce that reflects the diversity of the community we serve.
1.5. Develop and communicate CFPUA service standards to ensure we operate a responsive and cost-effective collection, treatment, and distribution system.
Goal Two: Championing a positive customer service culture.
Strategies:
2.1. Remain committed to a vision of customer service delivery that understands our community’s needs, increases our partnership, and ensures that our customers get the right help and support – while enjoying a consistent, positive experience.
2.2. Promote customer self-reliance through a range of online services that can be easily accessed from any device; and support those who need individual service.
2.3. Develop process improvement initiatives that are cost-effective, compliant, and address the needs of our customers and the organization.
2.4. Provide and promote a framework to keep customers informed and up-to-date using their preferred communication method.
16
Goal Three: Providing exemplary leadership in protecting natural resources.
Strategies:
3.1. Consistently maintain and operate the utility, and all its human and physical assets, in a manner that optimizes the care and use of water and other natural resources.
3.2. Build a culture of sustainability by creating new energy-reducing goals and challenging existing ones.
3.3. Comply and many times surpass federal, state, county, city, and industry standards.
3.4. Continue and enhance community education around current programming, environmental stewardship, and CFPUA’s role in protecting the environment.
3.5. Advocate for water quality protection and related issues.
3.6. Explore the use of highly-treated waste water for potable or other non-potable applications.
Goal Four: Cultivating community ownership and advancing relationships.
Strategies:
4.1. Develop and share compelling content to deepen CFPUA’s relationship with customers and inspire positive engagement.
4.2. Partner with the community and media to carry a credible brand message to CFPUA’s customers and to a broader audience.
4.3. Shift organizational messaging from CFPUA as an organization to focus on the people who provide water service.
Goal Five: Fostering an engaged and forward-thinking workforce.
Strategies:
5.1. Adopt state-of-the-art tools, systems, and processes that prepare CFPUA for future technological advancements.
5.2. Establish best practices around a culture of talent management and employee development to ensure employees are trained and ready to advance.
5.3. Implement leadership and communication best practices to grow employee morale, engagement, and productivity.
5.4. Acquire and implement technologies and tools that allow for enhanced interdepartmental collaboration, enterprise-wide sharing of information, and operational efficiencies.
www.cfpua.org 235 Government Center Drive Wilmington, NC 28403
17

7/1/2019
Authority Board of
Directors
Deputy
Executive
Director
Director of
Human
Resources
Deputy
Executive
Director
Director
Customer
Service
Chief Financial
Officer
Director of
Environmental
Management
Engineering -
DesignEngineering -
Project
ManagementEngineering -
Development
Services
Billing/
Collections
Customer
Service
Meter
Reading &
Services
Information
Technology
Director
Collections
Wastewater
Treatment
Water
Treatment
Lab-Water
Lab-
Wastewater
Security/Safety
Community
Compliance
Executive Director/
Administration
Accounting/
Budgeting
Procurement
Customer
Assistance
Manager
Clk to Board/
Executive Assistant
Centralized
Maintenance
Enterprise
Resource
Planning
Engineering -
Asset
Management
Public Information
Officer
Director of
Public &
Environmental
Policy
Distribution
18

FINANCIAL STRUCTURE
Fiscal Year 2019-2020 Budget Cape Fear Public Utility Authority
Fund Description, Fund Structure and Basis of Accounting The Authority uses fund accounting to account for its financial resources and report the results of its operations. In fund accounting, accounts are organized based on funds, each of which is considered an independent fiscal entity with a separate set of self-balancing accounts consisting of assets, liabilities, fund balance, revenues and expenditures. The establishment of discrete funds helps to ensure that public monies are only spent for approved purposes as established by budget ordinances and other actions of the Board, laws and regulations, contracts and other agreements. For budgetary accounting and reporting, the Authority uses two funds: the Operating Fund and the Capital Projects Fund. Though not required, two funds are maintained mainly because of differences in how budgets are adopted and controlled. The annual budget is adopted as required by NC General Statute 159-8 for the Operating Fund. The annual budget ordinance establishes appropriations and estimated revenues for a single fiscal year. Expenditures in the Operating Fund include salaries and benefits for the Authority’s employees, system maintenance, and other administrative costs. Revenues to fund these costs include charges for water and wastewater service, system development charges, investment earnings, and other miscellaneous revenues. On the other hand, budgets related to the activity accounted for in the Capital Projects Fund are established by the adoption of capital project ordinances in accordance with NC General Statute 159-13.2. Capital project ordinances provide for budgeted expenditures and funding sources for those expenditures over the life of capital projects, rather than for a single fiscal year. The Capital Projects Fund accounts for system-wide, water, and wastewater capital projects that are appropriated in the capital budget. Funding sources include transfers from the Operating Fund, proceeds from the issuance of debt obligations, grant revenues, and contributions from third parties through cost-sharing agreements. For financial reporting in accordance with generally accepted accounting principles, the Authority is considered a special-purpose government engaged exclusively in business-type activities. This means that the Authority reports both its operating and capital activities together in the basic financial statements on the full-accrual basis of accounting similar to a private business. The Authority uses the modified accrual basis of accounting for budgetary purposes as required by NC General Statute 159-26(c). The modified accrual basis of accounting takes a short-term perspective and is intended to provide information to help the public determine whether a government was able to meet its financial obligations in the current year with available financial resources. For financial reporting in accordance with generally accepted accounting principles, the Authority uses the accrual basis of accounting. The accrual basis of accounting takes a longer-term perspective and doesn’t just account for a government’s current year obligations and financial resources, but accounts for all economic resources and liabilities. For example, capital costs for water and wastewater infrastructure under the accrual basis of accounting are capitalized as assets and expensed over the estimated useful life because these costs represent economic resources that have a future service capacity. However, under the modified accrual basis of accounting, these costs are not capitalized as assets since newly constructed infrastructure isn’t a financial resource that’s available to fund short-term liabilities. Rather, these costs are expensed when paid.
19
BUDGET PROCESS
Fiscal Year 2019-2020 Budget Cape Fear Public Utility Authority
This section outlines the process and procedures that guide the preparation and management of the Authority’s annual budget. The Authority follows guidelines established in board-adopted policies. Preparation of the annual budget begins approximately eight months prior to the start of each fiscal year with the development of the budget calendar. The budget calendar provides the projected dates and items that must be completed to meet the mandatory budget adoption as required by NC General Statute 159-8. The calendar is updated and revised as the budget process progresses and is a primary communication tool of the budget process. The Authority’s budget calendar must adhere to the following requirements detailed in NC General Statute 159-8. Before April 30 Each department head shall transmit to the budget officer the budget requests and
revenue estimates for their department for the budget year. No Later Than June 1 The budget together with the budget message shall be submitted to the governing
board. The public hearing on the budget should be scheduled at this time.
No Later Than July 1 The governing board shall adopt a budget ordinance. The development of the annual operating budget begins when the Finance Department distributes departmental budget request forms and communicates instructions for the annual budget process. Departmental budget requests detail the operating and discretionary salary line items necessary to execute departmental objectives and meet performance indicator targets. After submission, meetings are held with each department to review each departmental budget request and make adjustments as appropriate. Non-discretionary salary line items are separately forecasted by the Finance Department. The proposed operating budget is reviewed by the Finance Committee and the full Board in March through May. Changes are made based on these deliberations. The development of the capital budget involves a risk-based prioritization process based on asset management best practices that results in the 10-Year Capital Improvement Plan. This plan is reviewed by the Finance Department to identify funding sources and ensure that the plan is consistent with CFPUA’s financial policies and that key financial metrics will continue to be achieved. The proposed 10-Year Capital Improvement plan is reviewed by the Long-Range Planning Committee, Finance Committee, and the full Board in February through May. Changes are made based on these deliberations. The Board adopts the annual operating and capital budgets in June. Other highlights of the Authority’s Finance and Accounting Policies Budget Policy include:
• The Authority operates under an annual budget with a fiscal year period of July 1 through June 30.
• The Authority operates under an annual balanced budget ordinance in which the sum of estimated net revenues and appropriated fund balances are equal to the authorized expenditures.
20
BUDGET PROCESS
Fiscal Year 2019-2020 Budget Cape Fear Public Utility Authority
• The budget shall include only estimated revenues reasonably expected to be realized in the budget
year.
• Legally available fund balance (Appropriated Fund Balance) can be used in balancing the annual budget when sufficient funds are available.
• Except as restricted by law, the Authority Board may amend the budget ordinance, according to
board-adopted policies, at any time after the ordinance’s adoption, so long as the ordinance continues to satisfy the requirements of North Carolina General Statutes 159-8 and 159-13.
The following procedures are used to amend the budget as provided for by policy:
• Transfers of budget authority among appropriation lines in the Budget Ordinances require
approval of the Chief Financial Officer and must be reported to the Board at the meeting subsequent to such transfer. These transfers must be recorded in the meeting minutes.
• Changes to the appropriation levels provided for in the Budget Ordinances may only be made by
the Board through an adopted budget ordinance.
21

Fiscal Year 2019-2020 Budget Cape Fear Public Utility Authority
BUDGET CALENDAR
Day/Date/Time Event Group
September 2018 – December 2018
Multi Departmental CIP Team Develops Draft FY20 CIP and Ten-Year CIP Multi Departmental CIP Team
Wednesday, January 2, 2019 Regular Finance Committee Meeting Finance Committee 9:00 am IT Conference Room - Budget Calendar
Wednesday, January 9, 2019 Regular Board Meeting Authority Board 9:00 am NHC-Harrell Room - Budget Calendar
Thursday, January 24, 2019 FY20 CIP Draft Budget to LRPC Engineering/LRPC
Friday, February 1, 2019 Publish System Development Charge on CFPUA website for Public Comment
Wednesday, February 6, 2019 Regular Finance Committee Meeting Finance Committee 9:00 am IT Conference Room
Wednesday, February 13, 2019 Regular Board Meeting Engineering/Authority Board Following Regular Board Meeting - FY20 CIP Board Workshop
Friday, February 8, 2019 Employee Group and Business Insurance Estimates Due Human Resources/Finance
Friday, February 15, 2019 New Position Requests due to HR CFPUA Staff
Monday, February 18, 2019 Departmental Budgets Submitted to Finance by 5:00 pm CFPUA Staff
Fee Schedule Review Submitted to Finance by 5:00 pm CFPUA Staff
Thursday, February 28, 2019 Performance Evaluations Due to HR Human Resources
Monday, March 4, 2019 Departmental Budget Reviews ED/Finance
Wednesday, March 6, 2019 9:00 am IT Conference Room Regular Finance Committee Meeting Finance Committee
Wednesday, March 13, 2019 9:00 am NHC-Harrell Room Regular Board Meeting Authority Board
Monday, March 18, 2019 End of Public Comment Period for the System Development Charge
Thursday, March 25, 2019 FY20 CIP Approval by LRPC Engineering/LRPC
Wednesday, April 3, 2019 Regular Finance Committee Meeting Finance Committee 9:00 am IT Conference Room - Preliminary Rate Review
- Preliminary Budget Review - Review SDC Calculation
Wednesday, April 10, 2019 Regular Board Meeting/Public Hearing Authority Board
9:00 am NHC-Harrell Room
- Preliminary Rate Review - Public Hearing on SDC Calculation and Adoption of SDCs (if no revisions are needed)
- Preliminary Budget Review - FY20 CIP Recommended for Approval
Wednesday, April 17, 2019 Bi-monthly Finance Committee Meeting (OPTIONAL) Finance Committee
9:00 am IT Conference Room - Preliminary Rate Review Continued - Preliminary Budget Review Continued
Friday, April 19, 2019 Recommended Budget Completed CFPUA Staff
Wednesday, May 1, 2019 Regular Finance Committee Meeting Finance Committee
9:00 am IT Conference Room
- Recommended Budget Submitted - Review Revised System Development Charge (if necessary)
22

Fiscal Year 2019-2020 Budget Cape Fear Public Utility Authority
BUDGET CALENDAR
Day/Date/Time Event Group Wednesday, May 8, 2019 Regular Board Meeting Authority Board
9:00 am NHC-Harrell Room
- Recommended Budget Submitted - Review and Approve Revised System Development Charge (if necessary)
Wednesday, May 8, 2019 Budget Workshop (including rates) - OPTIONAL Authority Board
IT Conference Room (following Regular Board meeting)
Wednesday, June 5, 2019 Regular Finance Committee Meeting Finance Committee
9:00 am IT Conference Room - Recommendation of Budget Adoption Submitted (including rates)
Wednesday, June 12, 2019 Regular Board Meeting/Public Hearing Authority Board 9:00 am NHC-Harrell Room - Budget Adoption (including rates)
23

Fiscal Year 2019-2020 Budget Cape Fear Public Utility Authority
FINANCIAL POLICIES
Policies that affect the Authority’s long-term financial sustainability are adopted by the Board. These policies are periodically reviewed. These policies are summarized below. Adopted Budget
• The Adopted Budget and Budget Ordinance for the Authority is the basis for the financial plan for the fiscal year. The budget is prepared and presented in conformity with the North Carolina Local Government Budget and Fiscal Control Act under NC General Statute 159-8. The Authority operates under an annual balanced budget ordinance in which the sum of estimated net revenues and appropriated fund balances are equal to the authorized expenditures. Refer to the Budget Process for detailed information on the adopted budget.
• Operating appropriations lapse at the end of each fiscal year and are controlled at the department and expenditure category level. Capital appropriations do not lapse at the end of each fiscal year and are controlled at the project level.
Debt Management
• The Authority issues debt under the guidance of the Local Government Commission, a division of the State of North Carolina. Debt is issued in accordance with North Carolina General Statutes 162A.
• The Authority generally limits debt issuance to only those projects that are high-dollar, emergency-related, or growth-oriented.
• Debt may not be issued if such issuance would cause the ratio of outstanding debt to the value of capital assets to exceed 45%, consistent with target debt coverage and expected long-term borrowing costs.
Unrestricted Fund Balance and One-time Revenues
• The Authority periodically evaluates the targeted level of unrestricted fund balance that is needed to maintain sufficient liquidity for working capital needs and to provide for a reserve for unanticipated expenditures and/or revenue shortfalls that is tailored to the specific business risks relevant to the Authority’s operations. The Authority’s current unrestricted fund balance target is $50 million.
• The Authority is precluded from using “one-time” revenues, including operating surpluses generated in prior years, to fund recurring expenditures. After the end of each fiscal year, operating surpluses are identified and designated through Board action for the early retirement of debt, the accumulation of capital reserves, the payment of post-retirement healthcare benefits, or to remain as unrestricted fund balance available to fund future non-recurring expenditures.
24
Fiscal Year 2019-2020 Budget Cape Fear Public Utility Authority
FINANCIAL POLICIES
Revenues The Authority sets rates and charges in accordance with North Carolina General Statute 162A-9. Water and wastewater rates consist of fixed and volumetric charges. Fixed charges are based on the greater of annual debt service requirements or 35% of the operating budget. Volumetric charges are established to fund all operating costs less the estimated fixed charges, system development charges, and other revenues.
Investments
• The Authority is empowered to invest in types of securities in accordance with North Carolina General Statute 159-30 (c).
• The Authority prepares detailed cash flow forecasts to maximize the amount and maturity of investments to optimize investment returns.
• The State Treasurer of North Carolina enforces strict standards of financial stability for each depository that collateralizes public deposits under the pooling method. The State Treasurer enforces standards of minimum capitalization for all pooling method financial institutions. The Authority relies on the State Treasurer to monitor those financial institutions. The Authority analyzes the financial soundness of any other financial institution used by the Authority. The Authority complies with the provisions of G.S. 159-31 when designating official depositories and verifying that deposits are properly collateralized.
• The investment portfolio shall be properly diversified in order to minimize risks brought on by
economic and market changes. To achieve this diversification:
o No more than 25% of the Authority’s total investment portfolio shall be invested in a single security type.
o The Authority will not invest in securities maturing more than five years from date of purchase and the weighted average maturity of the portfolio shall never exceed one year.
Long-term Financial Planning In order to plan and demonstrate the Authority’s long-term operational and financial sustainability, the Authority is required to annually prepare a long-term financial plan which incorporates long-term capital expenditure plans and projected operating costs constrained by the Authority’s debt and revenue policies. The long-term financial plan is an iterative, multi-departmental process that seeks to balance efficient and effective service delivery, sufficient capital investment, the Authority’s financial health, and rate affordability.
25

Fiscal Year 2019-2020 Budget Cape Fear Public Utility Authority
EXPENDITURE SUMMARY
The Authority’s operating budget covers the cost to operate the system each year including water and
wastewater treatment, water distribution, wastewater collection, system maintenance, environmental
management, engineering, customer service, and administration. Appropriations in the operating budget
are made on an annual basis meaning that budget authority lapses at the end of each fiscal year. This
contrasts with the capital budget in which specific project appropriations continue through the life of the
project, which may span multiple fiscal years. The FY 19-20 operating budget is $85,554,722, an increase
of 4.6% compared to the adopted FY 18-19 operating budget. The information below summarizes the
major expenditure categories and some of the key factors and assumptions driving the FY 19-20 operating
budget.
Salaries and Benefits
Salaries and benefits costs related to the Authority’s employees and retirees budgeted for FY 19-20 are
approximately $24.4 million, which makes up 29% of the Authority’s operating budget. The following chart
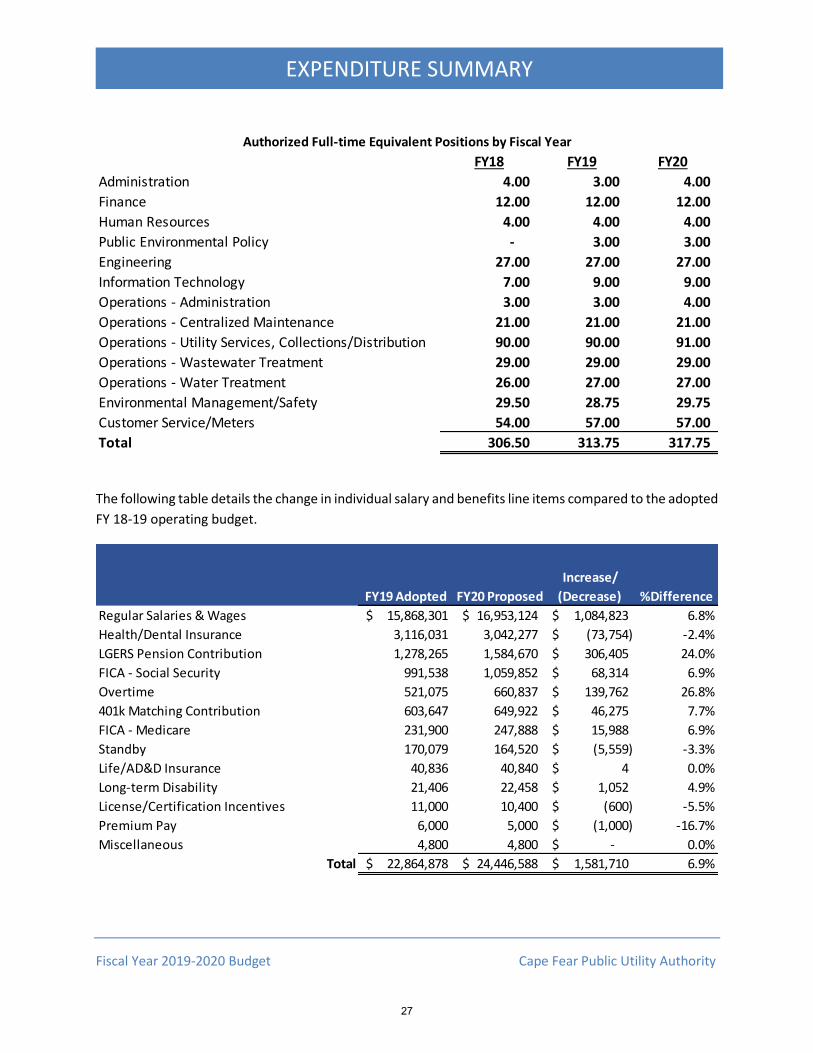
details the Authority’s staffing trends over the upcoming budget year and the previous two years. The FY
19-20 budget authorizes a total of 317.75 full-time equivalent (FTE) positions, an increase of 4 FTEs from
the FY 18-19 adopted budget.
Salaries & Benefits29%
Operations and Maintenance
26%
Debt Service26%
Transfers to Capital Projects
Fund19%
Fiscal Year 2019-2020 Expenditures by Type
26
Fiscal Year 2019-2020 Budget Cape Fear Public Utility Authority
EXPENDITURE SUMMARY
The following table details the change in individual salary and benefits line items compared to the adopted
FY 18-19 operating budget.
FY18 FY19 FY20
Administration 4.00 3.00 4.00
Finance 12.00 12.00 12.00
Human Resources 4.00 4.00 4.00
Public Environmental Policy - 3.00 3.00
Engineering 27.00 27.00 27.00
Information Technology 7.00 9.00 9.00
Operations - Administration 3.00 3.00 4.00
Operations - Centralized Maintenance 21.00 21.00 21.00
Operations - Utility Services, Collections/Distribution 90.00 90.00 91.00
Operations - Wastewater Treatment 29.00 29.00 29.00
Operations - Water Treatment 26.00 27.00 27.00
Environmental Management/Safety 29.50 28.75 29.75
Customer Service/Meters 54.00 57.00 57.00
Total 306.50 313.75 317.75
Authorized Full-time Equivalent Positions by Fiscal Year
FY19 Adopted FY20 Proposed
Increase/
(Decrease) %Difference
Regular Salaries & Wages 15,868,301$ 16,953,124$ 1,084,823$ 6.8%
Health/Dental Insurance 3,116,031 3,042,277 (73,754)$ -2.4%
LGERS Pension Contribution 1,278,265 1,584,670 306,405$ 24.0%
FICA - Social Security 991,538 1,059,852 68,314$ 6.9%
Overtime 521,075 660,837 139,762$ 26.8%
401k Matching Contribution 603,647 649,922 46,275$ 7.7%
FICA - Medicare 231,900 247,888 15,988$ 6.9%
Standby 170,079 164,520 (5,559)$ -3.3%
Life/AD&D Insurance 40,836 40,840 4$ 0.0%
Long-term Disability 21,406 22,458 1,052$ 4.9%
License/Certification Incentives 11,000 10,400 (600)$ -5.5%
Premium Pay 6,000 5,000 (1,000)$ -16.7%
Miscellaneous 4,800 4,800 -$ 0.0%
Total 22,864,878$ 24,446,588$ 1,581,710$ 6.9%
27

Fiscal Year 2019-2020 Budget Cape Fear Public Utility Authority
EXPENDITURE SUMMARY
Regular salaries and wages increased by 6.8% due to the 4 newly authorized full-time equivalent positions
along with a 1.5% market cost-of-living adjustments for all positions and 2.5% merit increases for certain
employees. The four newly authorized FTEs consist of the following:
• Water Control Operator (1 FTE) at the Richardson Water Treatment Plant to allow multiple
operators to be on-site during normal shift periods, allowing assignment of work that requires
multiple staff to complete safely.
• Utility Locator (1 FTE) within Utility services to ensure the timely completion of the increasing
volume of utility locate requests.
• Assistant Public Information Officer (1 FTE) to provide support for the Authority’s public
communications.
• Environmental Compliance Officer (1 FTE) in Environmental Management/Safety to assist with
the increased volume of backflow inspections and record management due to system growth and
to ensure compliance with increased regulation of contamination from cross connections.
Budgeted overtime increased 26.8% largely due to increases in Utility Services to conform to the actual
hours needed to ensure timely completion of the increasing volume of utility locates and in Customer
Service for staff training upon go-live of the new customer information system that is scheduled to occur
on weekends in order to not disrupt service delivery during regular work hours. The increases in regular
salaries and wages and overtime resulted in commensurate increases in amounts budgeted for FICA taxes
and 401(k) matching contributions. In addition to the increases in regular salaries and wages and
overtime, required employer contributions to the North Carolina Local Government Employees
Retirement System increased from 7.75% to 8.95% of covered payroll resulting in an overall increase of
24.0% compared to the FY 18-19 adopted budget. Despite an assumed composite 4% increase in North
Carolina state health plan premiums for active employees (effective January 1, 2020), budgeted
expenditures for health and dental benefits decreased from the prior year’s adopted budget. The decrease
is mainly attributable to a decrease in amounts budgeted for post-employment health insurance benefits
for retirees.
Operations and Maintenance
Operations and maintenance costs include all direct, non-capital costs to operate the water and
wastewater systems including water and wastewater treatment, water distribution, wastewater
collection, engineering, customer service, environmental management and testing, and administrative
costs. Operations and maintenance budgeted for FY 19-20 total approximately $22.2 million, an increase
of 16.7% from the FY 18-19 adopted budget. Budgeted operations and maintenance costs include
$2,166,358 related to PFAS including $454,000 for legal costs; $212,358 for sampling and testing of surface
and ground water, finished water, and biosolids; and a $1.5 million increase in cost related to the disposal
of biosolids. The FY 19-20 budget does not include the cost of replacing filter media at the Sweeney Water
28

Fiscal Year 2019-2020 Budget Cape Fear Public Utility Authority
EXPENDITURE SUMMARY
Treatment Plant to reduce levels of PFAS in finished drinking water. Instead, these costs are funded
through the capital budget.
The table below details changes in budgeted operating expenditures by department.
Significant increases in operations and maintenance expenditures from the FY 18-19 adopted budget by department are as follows:
• Wastewater Treatment – In the past, CFPUA has transported biosolid residuals from the water and wastewater treatment process to be applied to farm land in the surrounding counties. Due to the presence of PFAS in biosolids, CFPUA will transport this material to a land fill which will cost approximately $1.5 million more than land application.
• Utility Services o Amounts related to asphalt for street cuts. The City of Wilmington has set a
maximum area that they will cover. Asphalt for areas that exceed the maximum must be completed by a competitively selected contractor. The pricing contained in the contract is substantially more than the City’s rates.
o Amounts related to scheduled replacement of air release valves and other water line parts.
o An anticipated 7% increase in the odor control and corrosion protection service contract costs.
o Scheduled demolition and replacement costs of 3 small, wooden pump stations.
• Information Technology o Increases in software licenses due to the planned overlap of SunGard and D365
during the fiscal year
FY19 Adopted FY20 Proposed
Increase/
(Decrease) %Difference
Wastewater Treatment 2,391,940 4,050,942 1,659,002 69.4%
Utility Services 3,582,585$ 4,145,129$ 562,544$ 15.7%
Information Technology 1,586,836 2,065,407 478,571 30.2%
Customer Service 844,917 1,093,338 248,421 29.4%
Environmental Management 644,345 820,229 175,884 27.3%
Non-departmental 1,968,810 2,052,774 83,964 4.3%
Centralized Maintenance 1,412,692 1,496,040 83,348 5.9%
Human Resources 129,375 152,452 23,077 17.8%
Public & Environmental Policy 16,702 32,196 15,494 92.8%
Operations Administration 13,972 19,762 5,790 41.4%
Authority Board 25,951 24,299 (1,652) -6.4%
Finance 151,732 145,159 (6,573) -4.3%
Water Treatment 5,297,427 5,276,200 (21,227) -0.4%
Engineering 223,957 162,918 (61,039) -27.3%
Administration 724,427 645,807 (78,620) -10.9%
19,015,668$ 22,182,652$ 3,166,984$ 16.7%
29

Fiscal Year 2019-2020 Budget Cape Fear Public Utility Authority
EXPENDITURE SUMMARY
o Increases in a licensing agreement for virtual connections to enhance cybersecurity and reduce the risk of data breaches and intrusions.
• Customer Service o Amounts related to replacing broken and stuck meters that were funded from the
capital program in FY 18-19 o Amounts for reconfiguring the customer service space
• Environmental Management - Amounts related to increased sampling of source water, finished water, and biosolids related to PFAS.
• Non-departmental - Due to scheduled increases in lease rental expenditures and liability insurance premiums.
• Centralized Maintenance - Increases in contract prices for landscaping, membrane roof cleaning, annual boiler servicing, and tree & vegetation removal.
Debt Service
The Authority is empowered to issue revenue bonds to fund its capital program. Pursuant to the interlocal
agreement transferring the City of Wilmington’s and New Hanover County’s water and wastewater system
to the Authority, the Authority assumed responsibility for the related debt. All the debt transferred from
the City has been retired, while the 2012 Limited Obligation Bonds assumed from the County remain
outstanding.
The Authority is required to structure its rates to maintain coverage at 1.2 times the annual debt service
requirement; however, the Authority’s debt management policies are designed to maintain coverage of
at least 1.6 times the annual debt service requirement. In addition, this policy provides that the Authority
cannot issue debt if the issuance of such debt would cause the Authority’s debt balance to exceed 45% of
the Authority’s capital asset balance.
The Authority plans to issue approximately $70 million in revenue bonds in FY 19-20 largely to fund surface
water treatment enhancements to reduce the levels of PFAS in finished water and the Authority’s portion
of a new raw surface water transmission main. Through the use of capital reserve funds and the structure
of the debt, principal and interest related to this debt issuance will not become due, and will not be
reflected in water rates, until the water treatment enhancements become operational in FY 21-22.
Therefore, the FY 19-20 budget does not include debt service related to this planned issuance.
The following chart compares the budgeted debt service in FY 19-20 to the FY 18-19 adopted budget:
FY19 Adopted FY20 Proposed
Increase/
(Decrease) %Difference
Water and Sewer Rate Revenue Bonds 21,023,165$ 19,568,765$ (1,454,400)$ -6.9%
Debt Assumed from New Hanover County 1,439,350 1,383,450 (55,900) -3.9%
State Revolving Loans 716,403 1,473,267 756,864 105.6%
Total 23,178,918$ 22,425,482$ (753,436)$ -3.3%
30
Fiscal Year 2019-2020 Budget Cape Fear Public Utility Authority
EXPENDITURE SUMMARY
The debt service appropriation for the FY 19-20 budget is $22.4 million, a decrease of 3.3% compared to
the FY 18-19 adopted budget. The decrease reflects declining principal and interest payments related to
the Authority’s revenue bonds and limited obligation bonds assumed from New Hanover County of $1.5
million. This decrease is largely offset with an increase in principal and interest payments of Clean Water
State Revolving Loans related to four sewer rehabilitation projects. FY 19-20 principal payments total
$12.5 million and interest payments total $9.9 million.
Debt service coverage is project to be 1.78 times the FY 19-20 debt service requirement and maintain
outstanding debt balances at 41.9% of capital assets, or an additional $22.7 million in debt issuance
capacity. The Authority maintains credit ratings of AA+ and Aa2 from Standard & Poor’s and Moody’s,
respectively. Both ratings are one level below the highest possible ratings.
Transfers to Capital Projects Fund
In addition to proceeds from the issuance of debt, transfers of current year revenues to the capital
projects fund is the other major source of funding for the Authority’s capital program. With the adoption
of the Authority’s debt management policy in FY 16-17, transfers were planned to gradually increase until
an annual target of $18.0 million was projected to be achieved in FY 22-23. Due to growth in customers
that outpaced original projections, revenues were projected to be sufficient to fund the $18.0 million
target without an increase in rates. However, due to projected increases in the cost of biosolids disposal
of approximately $1.5 million, the Authority has chosen to fund this increase through reductions in its
capital program. Therefore, transfers to capital projects funds are $16.5 million.
31

Fiscal Year 2019-2020 Budget Cape Fear Public Utility Authority
DEPARTMENTAL SUMMARIES
As the chart below shows, 49% of the FY 19-20 budget is controlled by the Authority’s various departments including salaries and benefits and operational costs to execute the Strategic Plan. The remaining 51% are not controlled by individual departments and include transfers to the capital projects fund, debt service, and various overhead expenditures that aren’t attributable to a specific department such as expenditures for rent and insurance.
AUTHORITY BOARD The Cape Fear Public Utility Authority Board consists of eleven members. The City of Wilmington and New
Hanover County appoint five members each; two of those appointments come from their respective
governing boards. The eleventh member is jointly appointed. The Board is responsible for, among other
things, adopting the annual budget, setting water and sewer rates, making policy decisions, managing the
Executive Director, and contracting with the Authority’s Legal Counsel.
The Authority Board budget for FY 19-20 is $63,058, or .07% of the total FY 19-20 operating budget. Of
the total departmental budget, $38,759 (or 61.5%) is budgeted to pay monthly stipends for the Board’s
11 members. The remaining $24,299 (or 38.5%) is budgeted for various expenditures including costs to
broadcast Board meetings, advertise public hearings, and cell phone and tablet stipends.
Transfers to Capital Projects Fund
20%
Debt Service28%
Non-departmental3%
Departmental49%
Fiscal Year 2019-2020 Expenditures - Departmental versus Nondepartmental
32

Fiscal Year 2019-2020 Budget Cape Fear Public Utility Authority
DEPARTMENTAL SUMMARIES
ADMINISTRATION
The Administration Department consists of the Executive Director, Public Information Officer, Assistant
Public Information Officer, and Clerk to the Board. The Executive Director serves at the pleasure of the
Board and is responsible for executing the Board’s strategic vision, policies, and objectives. The Public
Information Officer and Assistant Public Information Officer are responsible for keeping customers and
other key stakeholders, including the news media, informed about CFPUA’s activities and issues affecting
customers and the region. They also support departments with outreach to customers affected by
scheduled construction projects or by providing emergency response assistance.
The Administration Department budget for FY 19-20 is $1,189,981, or 1.39% of the total FY 19-20
operating budget. Of the total departmental budget, $544,174 (or 45.7%) is budgeted to pay salaries and
benefits for the department’s 4 full-time equivalent positions. The remaining $645,807 (or 54.3%) is
budgeted for various expenditures including $605,000 for legal costs including those related to PFAS.
FINANCE The Finance Department is responsible for the following:
• developing and recommending financial policies that facilitate the fiscal sustainability of the
organization and developing and executing budgets and financial plans in accordance with these
policies including rate development, debt issuance, and the investment of public funds;
• supporting organization-wide operations through the timely, accurate payment of vendors,
employees, and other parties; managing the procurement of goods and services; budget
management; and enterprise resource planning system support;
• communicating financial information to stakeholders including customers, the Board, credit rating
agencies, the development community, and governmental partners.
The Finance Department budget for FY 19-20 is $1,268,232, or 1.48% of the total FY 19-20 operating
budget. Of the total departmental budget, $1,123,073 (or 88.6%) is budgeted to pay salaries and benefits
for the department’s 12 full-time equivalent positions. The remaining $145,159 (or 11.4%) is budgeted for
various expenditures including the cost of the annual financial audit, financial advisors/consultants, and
professional development.
HUMAN RESOURCES The Human Resources Department provides quality service and support in employment, employee
relations, benefits, compensation, health and safety, and training to the employees so that they can best
serve the needs of the customers of Cape Fear Public Utility Authority.
33

Fiscal Year 2019-2020 Budget Cape Fear Public Utility Authority
DEPARTMENTAL SUMMARIES
The Human Resources Department budget for FY 19-20 is $602,049 or .70% of the total FY 19-20 operating
budget. Of the total departmental budget, $449,597 (or 74.7%) is budgeted to pay salaries and benefits
for the department’s 4 full-time equivalent positions. The remaining $152,452 (or 25.3%) is budgeted for
various expenditures including costs related to insurance brokerage services for employee benefits,
worker’s compensation claims administration, organizational training, employee recognition and
education assistance, and advertisement of position vacancies.
PUBLIC & ENVIRONMENTAL POLICY
The Public and Environmental Policy Department consists of the Director, the Public and Environmental
Policy Specialist and the Environmental Data Analyst. The mission of the Public and Environmental Policy
Department is to ensure that CFPUA contributes to the long-term sustainability of Wilmington and New
Hanover County. The department helps create strategic environmental and public policy goals and assists
other departments in implementing and maintaining programs to meet them.
The department provides white papers, regulatory research, data analysis and educational materials to
help the organization monitor and improve its environmental and public policy initiatives. The department
also conducts external outreach to customers, environmental groups, research organizations and local
government, ensuring that CFPUA has stakeholder input and local expertise looped into our policies and
programs.
The Public & Environmental Policy Department budget for FY 19-20 is $304,045, or .36% of the total FY
19-20 operating budget. Of the total departmental budget, $271,849 (or 89.4%) is budgeted to pay salaries
and benefits for the department’s 3 full-time equivalent positions. The remaining $32,196 (or 10.6%) is
budgeted for various expenditures including software licenses and training, printing for special
educational materials, and various computer hardware.
INFORMATION TECHNOLOGY
The Information Technology Department is responsible for the connectivity of eight facilities, as well as
the SCADA network that consists of over 250 outlying sites. It also supports and maintains all Authority
servers, personal computers (PC’s), network equipment, and telephone systems. In addition, the
Information Technology Department is responsible for the Authority’s technology security, the website,
closed-circuit television (CCTV), and network security across the organization.
The Information Technology Department budget for FY 19-20 is $2,972,746, or 3.47% of the total FY 19-
20 operating budget. Of the total departmental budget, $907,339 (or 30.5%) is budgeted to pay salaries
and benefits for the department’s 9 full-time equivalent positions. The remaining $2,065,407 (or 69.5%)
is budgeted for various expenditures including the cost of software licenses, scheduled replacement of
34

Fiscal Year 2019-2020 Budget Cape Fear Public Utility Authority
DEPARTMENTAL SUMMARIES
computers, data connection services, regular maintenance on the Authority’s SCADA system, and costs
related to transition to new ERP software.
ENGINEERING
The Administration Division is responsible for the overall management of the Engineering Department
and for ensuring that department functions are aligned to meet the Authority’s strategic objectives. The
Department is comprised of five divisions: Administration, Asset Management, Planning and Design,
Project Management and Development Services.
The Engineering Department budget for FY 19-20 is $2,740,896, or 3.20% of the total FY 19-20 operating
budget. Of the total departmental budget, $2,577,978 (or 94.1%) is budgeted to pay salaries and benefits
for the department’s 27 full-time equivalent positions. The remaining $162,918 (or 5.9%) is budgeted for
various expenditures including the cost of updates to the Authority’s construction specifications and CIP
database maintenance.
OPERATIONS – ADMINISTRATION
The Operations Department is committed to delivering essential water and wastewater services to our
customers in an efficient and environmentally responsible manner. Divisions include water treatment,
wastewater treatment, utility services distribution and construction, utility services collections operations
and maintenance, and centralized maintenance. The department is responsible for regulatory compliance
of the various utility systems and providing outstanding water and sewer service to our customers. The
Department continues its efforts to minimize sanitary sewer overflows (SSOs), improve water quality, and
improve response to critical events that can damage infrastructure or the environment.
The Operations - Administration budget for FY 19-20 is $396,515, or .46% of the total FY 19-20 operating
budget. Of the total departmental budget, $376,753 (or 95%) is budgeted to pay salaries and benefits for
the department’s 3 full-time equivalent positions. The remaining $19,762 (or 5%) is budgeted for various
expenditures including cell phone stipends, dues and subscriptions, and office supplies.
OPERATIONS – CENTRALIZED MAINTENANCE
The Centralized Maintenance Division is responsible for maintenance activities associated with the water
and wastewater treatment plants, well sites, buildings and other facilities, as well as fleet management.
Efforts to consolidate maintenance resources have proven beneficial. Centralized Maintenance is
continuing to evaluate strategies to become more efficient by moving towards a more predictive approach
35

Fiscal Year 2019-2020 Budget Cape Fear Public Utility Authority
DEPARTMENTAL SUMMARIES
to maintenance. The Authority’s Computerized Maintenance and Management System (CMMS) has
proven to be a key component in this transition and will continue to prove effective.
The Operations – Centralized Maintenance budget for FY 19-20 is $2,945,577, or 3.44% of the total FY 19-
20 operating budget. Of the total division budget, $1,449,537 (or 49.2%) is budgeted to pay salaries and
benefits for the division’s 21 full-time equivalent positions. The remaining $1,496,040 (or 50.8%) is
budgeted for various expenditures including contracted services for fleet and equipment maintenance,
landscaping, and materials costs for various plant and facilities maintenance.
OPERATIONS – UTILITY SERVICES
Operations – Utility Services consists of the Collection System Operations and Maintenance Division and
the Construction and Water Distribution Division. The Collection System Operations and Maintenance
Division maintains the collection systems through regular inspection and cleaning of gravity lines,
maintains outfalls, and operates and maintains 142 pump stations. These duties help reduce the
frequency and volume of sanitary sewer overflows (SSOs). The Construction and Water Distribution
Division repairs breaks to lines, performs locate services, and ensures water quality through regular line
flushing.
The Operations – Utility Services budget for FY 19-20 is $10,375,303, or 12.13% of the total FY 19-20
operating budget. Of the total division budget, $6,230,174 (or 60%) is budgeted to pay salaries and
benefits for the division’s 91 full-time equivalent positions. The remaining $4,145,129 (or 40%) is
budgeted for various expenditures including contracted service for odor and corrosion control and root
control, pump replacement, electricity for pump stations, fuel for service vehicles and generators,
materials costs for line and pump station repairs, maintenance costs for CCTV inspection equipment, and
contracted surveying and clearing services for right-of-way maintenance.
OPERATIONS – WATER TREATMENT
The Water Treatment Division processes source water from the Cape Fear River and confined aquifers to
distribute clean, treated drinking water through three different systems within New Hanover County. A
staff of state-certified treatment operators and a team of skilled maintenance technicians keep all
facilities operational 24 hours per day, seven days per week to ensure that a supply of safe drinking water
is available for customers of the Authority.
The Operations – Water Treatment budget for FY 19-20 is $7,429,552, or 8.68% of the total FY 19-20
operating budget. Of the total division budget, $2,153,352 (or 29%) is budgeted to pay salaries and
benefits for the division’s 27 full-time equivalent positions. The remaining $5,276,200 (or 71%) is
budgeted for various expenditures including electricity and chemicals used in the treatment process, the
36

Fiscal Year 2019-2020 Budget Cape Fear Public Utility Authority
DEPARTMENTAL SUMMARIES
purchase of raw water, residuals disposal, maintenance and instrumentation contracts, plant
maintenance, and equipment replacement.
OPERATIONS – WASTEWATER TREATMENT
The Wastewater Treatment Division manages the operation and maintenance of the Authority’s two
wastewater treatment plants (WWTPs): Northside (NSWWTP) and Southside (SSWWTP). These facilities
have received diligent operation and maintenance attention, exhibited exemplary regulatory permit
compliance, and observed strict compliance with the approved budget.
The Staff has participated in many Cape Fear Public Utility Authority program initiatives including: asset
management, SCADA master planning, centralized maintenance, contingency emergency generator
connection provisions and treatment chemical bidding and award. The Staff has maintained high training
and certification standards, including operator, backflow prevention, and pesticide application
certifications.
A significant accomplishment was realized with the procurement of contracted residuals management
services. This contract covers various aspects of CFPUA’s residuals management program from January 1,
2017 through December 31, 2019 with two possible one-year renewal options extending the contract
period to December 31, 2021.
The Operations – Wastewater Treatment budget for FY 19-20 is $6,060,426, or 7.08% of the total FY 19-
20 operating budget. Of the total division budget, $2,009,484 (or 33.2%) is budgeted to pay salaries and
benefits for the division’s 29 full-time equivalent positions. The remaining $4,050,942 (or 66.8%) is
budgeted for various expenditures including electricity and chemicals used in the treatment process, the
disposal of wastewater residuals, plant maintenance, and equipment replacement.
ENVIRONMENTAL MANAGEMENT/SAFETY
The Environmental and Safety Management Department supports the core mission of the Authority
through operational and administrative activities of five divisions: Laboratory Services for Water,
Laboratory Services for Wastewater, Community Compliance, Emergency Response and Security and
Safety Management, and Environmental Management.
• Laboratory Services provides critical operational and compliance lab data daily to support
operation of both the water and wastewater systems.
• Community Compliance ensures proper implementation of the Sewer Use and Cross Connection
control ordinances to help prevent treatment disruptions at the wastewater treatment plants and
eliminate sanitary sewer overflows. The oversight of the cross-connection program helps ensure
37

Fiscal Year 2019-2020 Budget Cape Fear Public Utility Authority
DEPARTMENTAL SUMMARIES
protection of public health and drinking water quality by minimizing system vulnerabilities that
could allow system contamination.
• Emergency Response and Security Management works with staff in each department and other
agencies to identify system threats and vulnerabilities and to develop and implement plans and
training opportunities to mitigate and respond to risk.
• Environmental Management supports compliance efforts and activities to drive continual
improvement and environmental stewardship. This area works with staff and other
environmental agencies to formalize processes and programs, ensure training and perform
compliance audits and identify opportunities for improvement. Safety Management works with
staff and OSHA to ensure safe work practices meet or exceed safety requirements. These
programs ensure staff are performing their work safely.
The Environmental Management/Safety Department budget for FY 19-20 is $3,090,852 or 3.61% of the
total FY 10-20 operating budget. Of the total departmental budget, $2,270,623 (or 73.5%) is budgeted to
pay salaries and benefits for the department’s 29.75 full-time equivalent positions. The remaining
$820,229 (or 26.5%) is budgeted for various expenditures including the cost of chemicals and supplies for
in-house lab testing, third party lab testing services, maintenance agreements on lab equipment, and
employee safety training.
CUSTOMER SERVICE The Customer Service Department is responsible for customer service related functions including reading
and maintaining meter services, billing customer accounts, addressing customer concerns and collecting
on customer accounts. In addition, Customer Service bills for miscellaneous receivables and processes
payments for service through multiple payment channels. There are two customer service locations and
a call center staffed to address customer inquiries in an efficient and timely manner. The Department’s
objective is to provide an exceptional customer experience by meeting our customers’ needs through
timely response, effective service and managed financial costs.
The Customer Service Department budget for FY 19-20 is $4,637,234, or 5.42% of the total FY 19-20
operating budget. Of the total departmental budget, $3,543,896 (or 76.4%) is budgeted to pay salaries
and benefits for the department’s 57 full-time equivalent positions. The remaining $1,093,338 (or 23.6%)
is budgeted for various expenditures including contracted services for utility bill printing and mailing,
materials to repair/replace water meters, licenses for automatic meter reading software, fuel for meter
reading vehicles, fees to third-party collections agencies, and annual fees for the interactive voice
response system.
38

Fiscal Year 2019-2020 Budget Cape Fear Public Utility Authority
REVENUE SUMMARY
The Authority sets rates, fees and charges with oversight, supervision, and approval from the Board. The
Authority’s operations, capital improvement program and debt payments are funded almost entirely
through rates, fees and other charges for water and wastewater services, with occasional grants from the
state or federal government and contributions from the City of Wilmington, New Hanover County or other
governmental and nongovernmental entities.
Water and Wastewater Fixed and Volumetric Charges
Most of the Authority’s revenues (86%) are generated from rate revenues for water and wastewater
service. Rates are composed of fixed and volumetric portions. Fixed charges represent the minimum
amount a customer will pay regardless of usage. The volumetric component charges a cost per 1,000
gallons of usage. As shown above, in FY 19-20, 51% of total budgeted revenue are from volumetric charges
and 35% of total budgeted revenue are from fixed charges. Fixed charges are estimated to total $29.9
million ($14.8 million from water and $15.1 million from wastewater), a 1.8% increase from the FY 18-19
adopted budget. Volumetric revenues are anticipated to total $43.9 million ($21.6 million from water and
$22.3 million from wastewater), a 3.1% increase from the FY 18-19 adopted budget. The increases in
budgeted fixed and volumetric charges do not include increases to rates. Rather, the increases are
Fixed Water and Wastewater
Charges35%
Volumetric Water and Wastewater
Charges51%
System Development
Charges5%
Other6%
Investment Earnings2% Appropriated Fund
Balance1%
Fiscal Year 2019-2020 Revenues by Type
39

Fiscal Year 2019-2020 Budget Cape Fear Public Utility Authority
REVENUE SUMMARY
attributable to increases in the number of equivalent residential units and usage per equivalent residential
unit compared to the FY 18-19 adopted budget.
Water and wastewater fixed charges are developed to recover the greater of debt service due during the
year or 35% of the operating budget. This policy exists for two reasons: 1) to guarantee that sufficient
amounts are available to pay debt service irrespective of usage and 2) in periods in which annual debt
service requirements are declining, to ensure that the Authority’s revenues are insulated from significant
decreases in water and wastewater usage.
The fixed meter charges are incremented such that customers with larger water meter sizes pay a higher
fixed charge. Fixed meter charges are calculated based on the number of equivalent residential units
(ERUs), which expresses the number of active accounts as if each customer were a residential customer.
ERUs assumed for the FY 19-20 budget are based on current actual ERUs. The table below compares the
ERU assumptions and fixed charge revenues in the FY 18-19 and FY 19-20 budgets.
The volumetric charge utilizes a uniform rate structure such that the rate per 1,000 gallons remains
constant for all levels of usage. Volumetric charges are developed to recover operating costs allocated to
water and wastewater, respectively, that aren’t recovered from fixed charges and other revenues. The
remaining allocated cost pools for water and wastewater are divided by projected water and wastewater
usage. Usage projections for FY 19-20 are equal to actual FY 18-19 usage projected through the end of
fiscal year. The table below compares the usage assumptions and volumetric charge revenues in the FY
18-19 and FY 19-20 budgets.
FY19 Adopted FY20 Proposed
Increase/
(Decrease) % Difference
Assumed ERUs - Water 88,000 89,700 1,700 1.9%
Bimonthly Fixed Water Charge 27.56$ 27.56$ -$ 0.0%
Total Fixed Charges Water 14,551,680$ 14,832,792$ 281,112.00$ 1.9%
Assumed ERUs - Wastewater 85,000 86,500 1,500 1.8%
Bimonthly Fixed Wastewater Charge 29.10$ 29.10$ -$ 0.0%
Total Fixed Charges Wastewater 14,841,000$ 15,102,900$ 261,900$ 1.8%
Total Fixed Charges 29,392,680$ 29,935,692$ 543,012$ 1.8%
FY19 Adopted FY20 Proposed
Increase/
(Decrease) % Difference
Assumed Annual Usage - Water (TGal) 5,194,766 5,375,646 180,880 3.5%
Volumetric Charge - Water 4.02$ 4.02$ -$ 0.0%
Total Volumetric Charges - Water 20,882,958$ 21,610,097$ 727,139$ 3.5%
Assumed Annual Usage - Wastewater (Tgal) 4,682,223 4,812,134 129,911 2.8%
Volumetric Charge - Wastewater 4.63$ 4.63$ -$ 0.0%
Total Volumetric Charges - Wastewater 21,678,691$ 22,280,179$ 601,488$ 2.8%
Total Volumetric Charges 42,561,649$ 43,890,276$ 1,328,626$ 3.1%
40

Fiscal Year 2019-2020 Budget Cape Fear Public Utility Authority
REVENUE SUMMARY
The Authority’s water and wastewater rates remain at or below the median rates within North Carolina.
Assuming monthly usage of 5,000 gallons, a residential customer will pay $71.58 per month ($143.16
every two months) in FY 19-20. The graph below compares the Authority’s monthly residential water and
wastewater bills to those of other North Carolina public water and wastewater utilities in effect for FY 17-
18. Although the Authority bills customers every two months, monthly bill amounts were calculated for
purposes of comparability.
Source: Environmental Finance Center, Water and Wastewater Rates and Rate Structures in North Carolina, 2018
The peer groups for bill comparison include all North Carolina public water and wastewater utilities, large
North Carolina public water and wastewater utilities (defined as those utilities with more than 25,000
customer accounts), and all North Carolina public/metropolitan public utility authorities. The median
monthly bills for the peer groups are based on rates in effect for FY 17-18. The amounts presented for the
Authority are based on rates for FY 19-20. The Authority’s average monthly residential bill compares
favorably to the median bills for each of the peer groups. The total monthly residential bill is lower than
the median bills for all North Carolina public utilities and the North Carolina public/metropolitan utility
authorities and 1.2% higher than the median bill for large North Carolina Utilities. The Authority’s monthly
$30.89 $34.00 $33.88$40.82
$39.87$42.00
$37.70
$44.83
$0.00
$10.00
$20.00
$30.00
$40.00
$50.00
$60.00
$70.00
$80.00
$90.00
Large North CarolinaUtilities - FY18 Median
All North Carolina Utilities -FY18 Median
Cape Fear Public UtilityAuthority - FY20
All North CarolinaPublic/Metropolitan UtilityAuthorities - FY18 Median
Median Monthly Residential Water and Sewer Bill
Water Wastewater
41

Fiscal Year 2019-2020 Budget Cape Fear Public Utility Authority
REVENUE SUMMARY
residential wastewater bill is lower than the median monthly residential wastewater bills for each peer
group, while the Authority’s monthly residential water bill is lower than the median bill for all peer groups
except for the large North Carolina public water and wastewater utilities.
System Development Charges
The system development charge (SDC) is the upfront contribution that a new customer pays to buy into
infrastructure that will benefit the new customer that has been paid for with past rate collections. The
SDC calculation consists of two parts: 1) quantifying the value of infrastructure paid for by current and
past rate payers that will benefit new customers (i.e. rate payer equity) and 2) allocating rate payer equity
to existing and new customers. Rate payer equity is calculated by reducing the depreciated value of
infrastructure by amounts that were not paid by past rate payers including the outstanding balance of
debt issued to acquire or construct the infrastructure, conveyed infrastructure, grant funding, and cash
contributions from developers and governmental entities. Rate payer equity is then allocated between
water and wastewater in proportion to cumulative capital investment in the water and wastewater
systems. These allocations are then divided by the number of equivalent residential units projected for
water and sewer for the upcoming fiscal year.
Total SDC revenues are mainly a function of new development and the extent to which capital investments
have been funded by rate payers. The table below presents the adopted SDCs (for 5/8” meters) for FY 18-
19 and FY 19-20:
The increases in the adopted SDC charges are a direct result of the adoption of revisions to the Authority’s
debt management policy. These revisions have increased the proportion of cumulative capital
investments that are funded on a pay-as-you-go basis and consequently increased rate payer equity.
Despite these increases, total SDC revenues in FY 19-20 are forecasted to be $4.0 million (or 5% of total
estimated revenues for FY 19-20), a decrease of $200,000 from the FY 18-19 adopted budget. The overall
decrease is attributable to an expected drop in new development compared to FY 18-19 suggested by
leading indicators such as requests for information and plan inspections.
Other Charges for Service
Other charges for service account for 6% of total budgeted revenues. Other charges include penalties and
late fees, application and premise visit fees, meter fees and tap fees. Budgeted amounts are based on
historical averages adjusted for current trends. Other charges for FY 19-20 are $5.3 million, an increase of
FY19 Adopted FY20 Adopted
Increase/
(Decrease) % Difference
System Development Charge - Water 1,830$ 1,880$ 50$ 2.7%
System Development Charge - Wastewater 1,800$ 1,930$ 130$ 7.2%
42

Fiscal Year 2019-2020 Budget Cape Fear Public Utility Authority
REVENUE SUMMARY
approximately $1.0 million from the FY 18-19 budget. The increase is due to an increase in the amounts
budgeted for charges for wastewater-only customers and sales of capital assets.
Investment Earnings
Investment earnings are budgeted at $1.9 million in FY 19-20 which is approximately 2% of total budgeted
revenue. As available cash and investment balances are spent down to fund the capital program in
accordance with the Authority’s liquidity and reserve policies, maintaining investment earnings at levels
experienced in previous fiscal years was identified as a risk factor that could put upward pressure on water
and wastewater rates. The $700,000 budgeted in FY 18-19 reflected this expected decline. To limit this
risk, the Authority has implemented an investment management program designed to maximize the
invested resources while maintaining adequate liquidity and maximize investment yields by maximizing
investment maturities and expanding investment options to include all investments allowable under
North Carolina General Statutes. Estimated investment earnings for FY 19-20 are based on a projected
weighted average of available invested fund balance during the year and a 2.1% return on investments.
Appropriated Fund Balance
Upon inception of the Authority, the City of Wilmington and New Hanover County transferred funds that
were explicitly designated for funding post-employment health insurance benefits to legacy employees.
The FY 19-20 budget includes an estimated use of $500,000 of appropriated fund balance to fund
appropriations related to the provision of retiree health insurance benefits.
43

Fiscal Year 2019-2020 Budget Cape Fear Public Utility Authority
PROJECTED CHANGES IN NET POSITION
The Authority is a stand-alone enterprise in which the cost of service is recovered exclusively through
customer rates and charges. Consequently, the most meaningful measure of financial position for the
Authority’s operations is net position. Net position represents the extent to which the Authority’s assets
and deferred outflows of resources exceed its liabilities and deferred inflows of resources on the full
accrual basis of accounting similar to a private company.
Net position is composed of three components: 1) net investment in capital assets, 2) restricted net
position, and 3) unrestricted net position. Net position in capital assets is the depreciated historical cost
of system assets less the outstanding balance of debt used to acquire/construct those assets.
Consequently, these amounts are not available to meet the Authority’s ongoing obligations. Restricted
net position consists of those resources that are restricted through law or by outside parties for a
particular purpose. The Authority’s remaining net position is unrestricted and can be used to satisfy the
Authority’s ongoing obligations including debt service, normal operating expenses, and for the acquisition
of capital assets.
The following bar chart shows the components of the Authority’s net position since FY 14-15 and
projected through FY 19-20.
$359.1
$391.2$419.0
$460.0$476.3
$2.9 $11.0 $17.9 $24.2 $26.3
$122.8 $113.9$100.4
$83.1 $75.7
$0.0
$100.0
$200.0
$300.0
$400.0
$500.0
$600.0
2016 2017 2018 2019 Projected 2020 Projected
$ (
in m
illio
n)
Trends in Net Position
Net Investment in Capital Assets Restricted Unrestricted
44

Fiscal Year 2019-2020 Budget Cape Fear Public Utility Authority
PROJECTED CHANGES IN NET POSITION
The chart on the opposite illustrates two main trends in the Authority’s net position: a gradual increase in
net investment in capital assets and a gradual decrease in unrestricted net position. Both trends are driven
by the Authority’s debt policy. Beginning in FY 17-18, the Authority began gradually increasing water and
wastewater rates to increase pay-as-you-go funding for capital improvements. The increases to rates were
a direct consequence of implementing revisions to the Authority’s debt policy, which included the
implementation of an explicit debt limit. As rates are gradually increased, unrestricted net position is
available to be spent down to optimal levels to fully fund the Authority’s capital improvement plan.
Funding capital improvements more and more with current year revenues increases the net investment
in capital assets component of net position over time. Funding capital improvements from existing
reserves results in a decrease to unrestricted net position.
As a result, the Authority’s net investment in capital assets is projected to increase to $476.3 million and
the Authority’s unrestricted net position is projected to decrease to $75.7 million by the end of FY 19-20.
The Authority’s restricted net position includes amounts restricted for debt service and amounts
restricted by the Board for capital reserves. Amounts restricted for debt service are equal to 1/6th of the
Authority’s next interest payment and 1/12th of the Authority’s next principal payment on its outstanding
revenue bonds. Capital reserves are non-recurring revenues including operating surpluses that are
restricted by the Board for capital projects that otherwise would have been funded with debt. Restricted
net position is projected to increase to $26.3 million due to increased debt service requirements
attributable to the planned issuance of revenue bonds during FY 19-20.
45
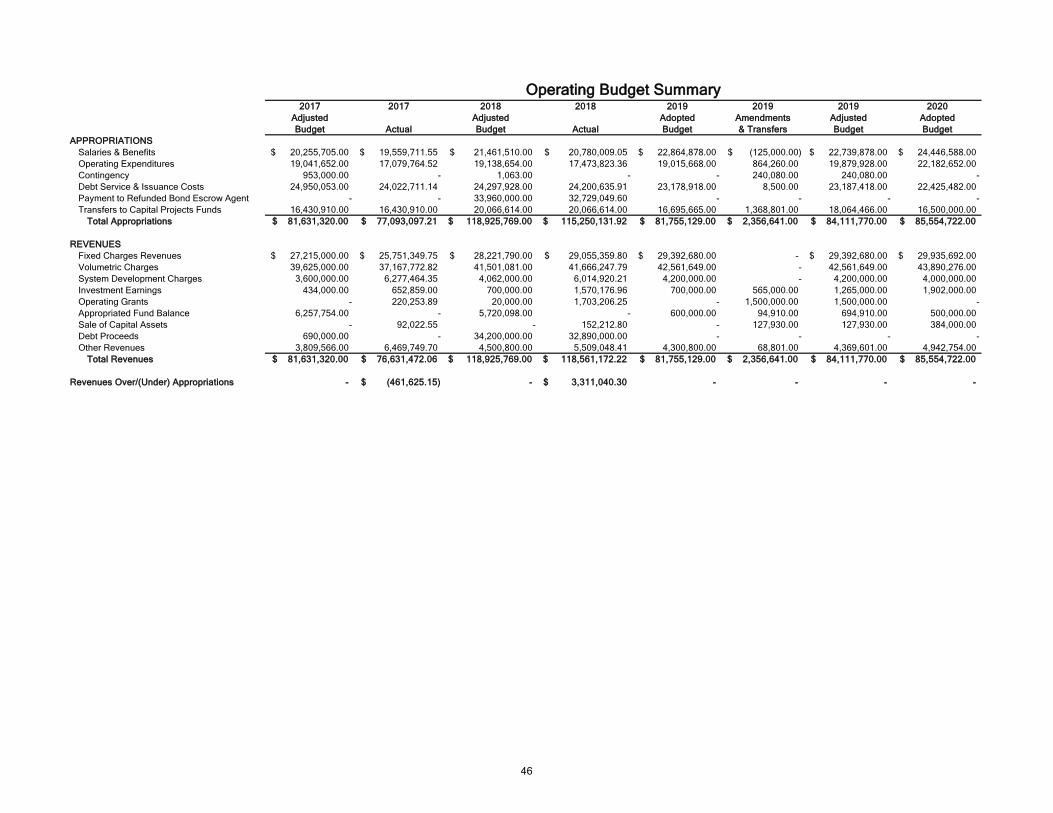
2017 2017 2018 2018 2019 2019 2019 2020
Adjusted Adjusted Adopted Amendments Adjusted Adopted
Budget Actual Budget Actual Budget & Transfers Budget Budget
APPROPRIATIONS
Salaries & Benefits 20,255,705.00$ 19,559,711.55$ 21,461,510.00$ 20,780,009.05$ 22,864,878.00$ (125,000.00)$ 22,739,878.00$ 24,446,588.00$
Operating Expenditures 19,041,652.00 17,079,764.52 19,138,654.00 17,473,823.36 19,015,668.00 864,260.00 19,879,928.00 22,182,652.00
Contingency 953,000.00 - 1,063.00 - - 240,080.00 240,080.00 -
Debt Service & Issuance Costs 24,950,053.00 24,022,711.14 24,297,928.00 24,200,635.91 23,178,918.00 8,500.00 23,187,418.00 22,425,482.00
Payment to Refunded Bond Escrow Agent - - 33,960,000.00 32,729,049.60 - - - -
Transfers to Capital Projects Funds 16,430,910.00 16,430,910.00 20,066,614.00 20,066,614.00 16,695,665.00 1,368,801.00 18,064,466.00 16,500,000.00
Total Appropriations 81,631,320.00$ 77,093,097.21$ 118,925,769.00$ 115,250,131.92$ 81,755,129.00$ 2,356,641.00$ 84,111,770.00$ 85,554,722.00$
REVENUES
Fixed Charges Revenues 27,215,000.00$ 25,751,349.75$ 28,221,790.00$ 29,055,359.80$ 29,392,680.00$ - 29,392,680.00$ 29,935,692.00$
Volumetric Charges 39,625,000.00 37,167,772.82 41,501,081.00 41,666,247.79 42,561,649.00 - 42,561,649.00 43,890,276.00
System Development Charges 3,600,000.00 6,277,464.35 4,062,000.00 6,014,920.21 4,200,000.00 - 4,200,000.00 4,000,000.00
Investment Earnings 434,000.00 652,859.00 700,000.00 1,570,176.96 700,000.00 565,000.00 1,265,000.00 1,902,000.00
Operating Grants - 220,253.89 20,000.00 1,703,206.25 - 1,500,000.00 1,500,000.00 -
Appropriated Fund Balance 6,257,754.00 - 5,720,098.00 - 600,000.00 94,910.00 694,910.00 500,000.00
Sale of Capital Assets - 92,022.55 - 152,212.80 - 127,930.00 127,930.00 384,000.00
Debt Proceeds 690,000.00 - 34,200,000.00 32,890,000.00 - - - -
Other Revenues 3,809,566.00 6,469,749.70 4,500,800.00 5,509,048.41 4,300,800.00 68,801.00 4,369,601.00 4,942,754.00
Total Revenues 81,631,320.00$ 76,631,472.06$ 118,925,769.00$ 118,561,172.22$ 81,755,129.00$ 2,356,641.00$ 84,111,770.00$ 85,554,722.00$
Revenues Over/(Under) Appropriations - (461,625.15)$ - 3,311,040.30$ - - - -
Operating Budget Summary
46
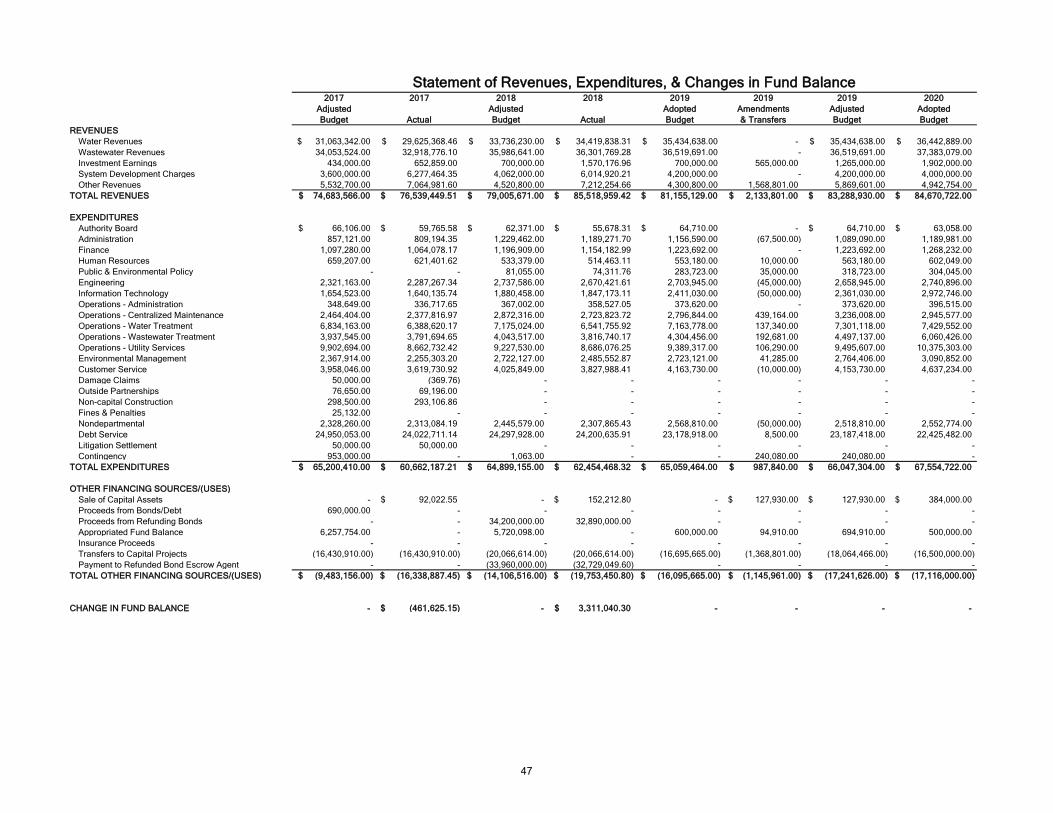
2017 2017 2018 2018 2019 2019 2019 2020
Adjusted Adjusted Adopted Amendments Adjusted Adopted
Budget Actual Budget Actual Budget & Transfers Budget Budget
REVENUES
Water Revenues 31,063,342.00$ 29,625,368.46$ 33,736,230.00$ 34,419,838.31$ 35,434,638.00$ - 35,434,638.00$ 36,442,889.00$
Wastewater Revenues 34,053,524.00 32,918,776.10 35,986,641.00 36,301,769.28 36,519,691.00 - 36,519,691.00 37,383,079.00
Investment Earnings 434,000.00 652,859.00 700,000.00 1,570,176.96 700,000.00 565,000.00 1,265,000.00 1,902,000.00
System Development Charges 3,600,000.00 6,277,464.35 4,062,000.00 6,014,920.21 4,200,000.00 - 4,200,000.00 4,000,000.00
Other Revenues 5,532,700.00 7,064,981.60 4,520,800.00 7,212,254.66 4,300,800.00 1,568,801.00 5,869,601.00 4,942,754.00
TOTAL REVENUES 74,683,566.00$ 76,539,449.51$ 79,005,671.00$ 85,518,959.42$ 81,155,129.00$ 2,133,801.00$ 83,288,930.00$ 84,670,722.00$
EXPENDITURES
Authority Board 66,106.00$ 59,765.58$ 62,371.00$ 55,678.31$ 64,710.00$ - 64,710.00$ 63,058.00$
Administration 857,121.00 809,194.35 1,229,462.00 1,189,271.70 1,156,590.00 (67,500.00) 1,089,090.00 1,189,981.00
Finance 1,097,280.00 1,064,078.17 1,196,909.00 1,154,182.99 1,223,692.00 - 1,223,692.00 1,268,232.00
Human Resources 659,207.00 621,401.62 533,379.00 514,463.11 553,180.00 10,000.00 563,180.00 602,049.00
Public & Environmental Policy - - 81,055.00 74,311.76 283,723.00 35,000.00 318,723.00 304,045.00
Engineering 2,321,163.00 2,287,267.34 2,737,586.00 2,670,421.61 2,703,945.00 (45,000.00) 2,658,945.00 2,740,896.00
Information Technology 1,654,523.00 1,640,135.74 1,880,458.00 1,847,173.11 2,411,030.00 (50,000.00) 2,361,030.00 2,972,746.00
Operations - Administration 348,649.00 336,717.65 367,002.00 358,527.05 373,620.00 - 373,620.00 396,515.00
Operations - Centralized Maintenance 2,464,404.00 2,377,816.97 2,872,316.00 2,723,823.72 2,796,844.00 439,164.00 3,236,008.00 2,945,577.00
Operations - Water Treatment 6,834,163.00 6,388,620.17 7,175,024.00 6,541,755.92 7,163,778.00 137,340.00 7,301,118.00 7,429,552.00
Operations - Wastewater Treatment 3,937,545.00 3,791,694.65 4,043,517.00 3,816,740.17 4,304,456.00 192,681.00 4,497,137.00 6,060,426.00
Operations - Utility Services 9,902,694.00 8,662,732.42 9,227,530.00 8,686,076.25 9,389,317.00 106,290.00 9,495,607.00 10,375,303.00
Environmental Management 2,367,914.00 2,255,303.20 2,722,127.00 2,485,552.87 2,723,121.00 41,285.00 2,764,406.00 3,090,852.00
Customer Service 3,958,046.00 3,619,730.92 4,025,849.00 3,827,988.41 4,163,730.00 (10,000.00) 4,153,730.00 4,637,234.00
Damage Claims 50,000.00 (369.76) - - - - - -
Outside Partnerships 76,650.00 69,196.00 - - - - - -
Non-capital Construction 298,500.00 293,106.86 - - - - - -
Fines & Penalties 25,132.00 - - - - - - -
Nondepartmental 2,328,260.00 2,313,084.19 2,445,579.00 2,307,865.43 2,568,810.00 (50,000.00) 2,518,810.00 2,552,774.00
Debt Service 24,950,053.00 24,022,711.14 24,297,928.00 24,200,635.91 23,178,918.00 8,500.00 23,187,418.00 22,425,482.00
Litigation Settlement 50,000.00 50,000.00 - - - - - -
Contingency 953,000.00 - 1,063.00 - - 240,080.00 240,080.00 -
TOTAL EXPENDITURES 65,200,410.00$ 60,662,187.21$ 64,899,155.00$ 62,454,468.32$ 65,059,464.00$ 987,840.00$ 66,047,304.00$ 67,554,722.00$
OTHER FINANCING SOURCES/(USES)
Sale of Capital Assets - 92,022.55$ - 152,212.80$ - 127,930.00$ 127,930.00$ 384,000.00$
Proceeds from Bonds/Debt 690,000.00 - - - - - - -
Proceeds from Refunding Bonds - - 34,200,000.00 32,890,000.00 - - - -
Appropriated Fund Balance 6,257,754.00 - 5,720,098.00 - 600,000.00 94,910.00 694,910.00 500,000.00
Insurance Proceeds - - - - - - - -
Transfers to Capital Projects (16,430,910.00) (16,430,910.00) (20,066,614.00) (20,066,614.00) (16,695,665.00) (1,368,801.00) (18,064,466.00) (16,500,000.00)
Payment to Refunded Bond Escrow Agent - - (33,960,000.00) (32,729,049.60) - - - -
TOTAL OTHER FINANCING SOURCES/(USES) (9,483,156.00)$ (16,338,887.45)$ (14,106,516.00)$ (19,753,450.80)$ (16,095,665.00)$ (1,145,961.00)$ (17,241,626.00)$ (17,116,000.00)$
CHANGE IN FUND BALANCE - (461,625.15)$ - 3,311,040.30$ - - - -
Statement of Revenues, Expenditures, & Changes in Fund Balance
47
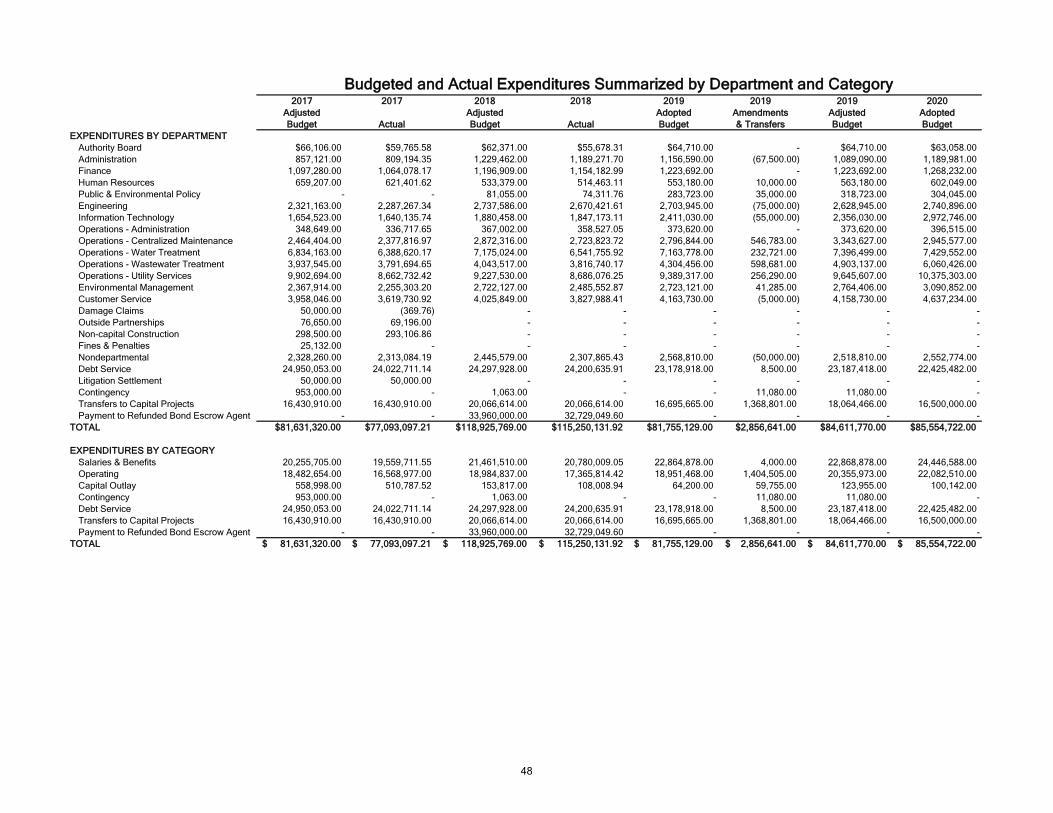
2017 2017 2018 2018 2019 2019 2019 2020
Adjusted Adjusted Adopted Amendments Adjusted Adopted
Budget Actual Budget Actual Budget & Transfers Budget Budget
EXPENDITURES BY DEPARTMENT
Authority Board $66,106.00 $59,765.58 $62,371.00 $55,678.31 $64,710.00 - $64,710.00 $63,058.00
Administration 857,121.00 809,194.35 1,229,462.00 1,189,271.70 1,156,590.00 (67,500.00) 1,089,090.00 1,189,981.00
Finance 1,097,280.00 1,064,078.17 1,196,909.00 1,154,182.99 1,223,692.00 - 1,223,692.00 1,268,232.00
Human Resources 659,207.00 621,401.62 533,379.00 514,463.11 553,180.00 10,000.00 563,180.00 602,049.00
Public & Environmental Policy - - 81,055.00 74,311.76 283,723.00 35,000.00 318,723.00 304,045.00
Engineering 2,321,163.00 2,287,267.34 2,737,586.00 2,670,421.61 2,703,945.00 (75,000.00) 2,628,945.00 2,740,896.00
Information Technology 1,654,523.00 1,640,135.74 1,880,458.00 1,847,173.11 2,411,030.00 (55,000.00) 2,356,030.00 2,972,746.00
Operations - Administration 348,649.00 336,717.65 367,002.00 358,527.05 373,620.00 - 373,620.00 396,515.00
Operations - Centralized Maintenance 2,464,404.00 2,377,816.97 2,872,316.00 2,723,823.72 2,796,844.00 546,783.00 3,343,627.00 2,945,577.00
Operations - Water Treatment 6,834,163.00 6,388,620.17 7,175,024.00 6,541,755.92 7,163,778.00 232,721.00 7,396,499.00 7,429,552.00
Operations - Wastewater Treatment 3,937,545.00 3,791,694.65 4,043,517.00 3,816,740.17 4,304,456.00 598,681.00 4,903,137.00 6,060,426.00
Operations - Utility Services 9,902,694.00 8,662,732.42 9,227,530.00 8,686,076.25 9,389,317.00 256,290.00 9,645,607.00 10,375,303.00
Environmental Management 2,367,914.00 2,255,303.20 2,722,127.00 2,485,552.87 2,723,121.00 41,285.00 2,764,406.00 3,090,852.00
Customer Service 3,958,046.00 3,619,730.92 4,025,849.00 3,827,988.41 4,163,730.00 (5,000.00) 4,158,730.00 4,637,234.00
Damage Claims 50,000.00 (369.76) - - - - - -
Outside Partnerships 76,650.00 69,196.00 - - - - - -
Non-capital Construction 298,500.00 293,106.86 - - - - - -
Fines & Penalties 25,132.00 - - - - - - -
Nondepartmental 2,328,260.00 2,313,084.19 2,445,579.00 2,307,865.43 2,568,810.00 (50,000.00) 2,518,810.00 2,552,774.00
Debt Service 24,950,053.00 24,022,711.14 24,297,928.00 24,200,635.91 23,178,918.00 8,500.00 23,187,418.00 22,425,482.00
Litigation Settlement 50,000.00 50,000.00 - - - - - -
Contingency 953,000.00 - 1,063.00 - - 11,080.00 11,080.00 -
Transfers to Capital Projects 16,430,910.00 16,430,910.00 20,066,614.00 20,066,614.00 16,695,665.00 1,368,801.00 18,064,466.00 16,500,000.00
Payment to Refunded Bond Escrow Agent - - 33,960,000.00 32,729,049.60 - - - -
TOTAL $81,631,320.00 $77,093,097.21 $118,925,769.00 $115,250,131.92 $81,755,129.00 $2,856,641.00 $84,611,770.00 $85,554,722.00
EXPENDITURES BY CATEGORY
Salaries & Benefits 20,255,705.00 19,559,711.55 21,461,510.00 20,780,009.05 22,864,878.00 4,000.00 22,868,878.00 24,446,588.00
Operating 18,482,654.00 16,568,977.00 18,984,837.00 17,365,814.42 18,951,468.00 1,404,505.00 20,355,973.00 22,082,510.00
Capital Outlay 558,998.00 510,787.52 153,817.00 108,008.94 64,200.00 59,755.00 123,955.00 100,142.00
Contingency 953,000.00 - 1,063.00 - - 11,080.00 11,080.00 -
Debt Service 24,950,053.00 24,022,711.14 24,297,928.00 24,200,635.91 23,178,918.00 8,500.00 23,187,418.00 22,425,482.00
Transfers to Capital Projects 16,430,910.00 16,430,910.00 20,066,614.00 20,066,614.00 16,695,665.00 1,368,801.00 18,064,466.00 16,500,000.00
Payment to Refunded Bond Escrow Agent - - 33,960,000.00 32,729,049.60 - - - -
TOTAL 81,631,320.00$ 77,093,097.21$ 118,925,769.00$ 115,250,131.92$ 81,755,129.00$ 2,856,641.00$ 84,611,770.00$ 85,554,722.00$
Budgeted and Actual Expenditures Summarized by Department and Category
48
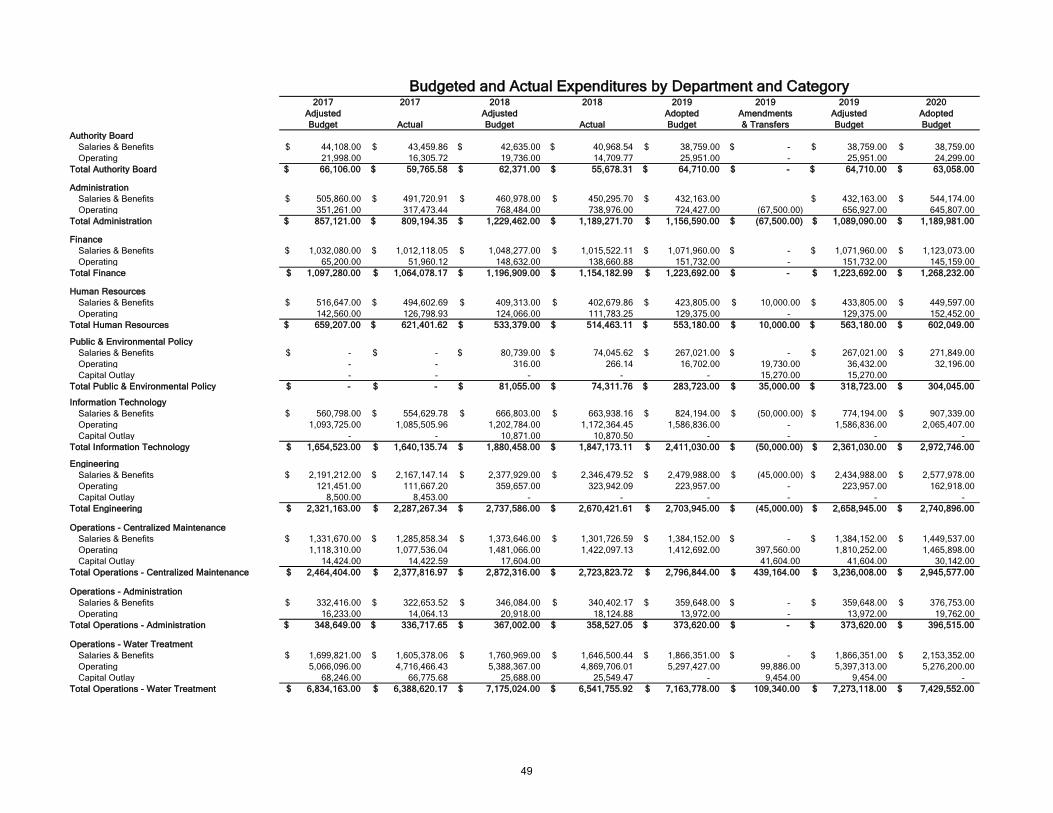
2017 2017 2018 2018 2019 2019 2019 2020
Adjusted Adjusted Adopted Amendments Adjusted Adopted
Budget Actual Budget Actual Budget & Transfers Budget Budget
Authority Board
Salaries & Benefits 44,108.00$ 43,459.86$ 42,635.00$ 40,968.54$ 38,759.00$ -$ 38,759.00$ 38,759.00$
Operating 21,998.00 16,305.72 19,736.00 14,709.77 25,951.00 - 25,951.00 24,299.00
Total Authority Board 66,106.00$ 59,765.58$ 62,371.00$ 55,678.31$ 64,710.00$ -$ 64,710.00$ 63,058.00$
Administration
Salaries & Benefits 505,860.00$ 491,720.91$ 460,978.00$ 450,295.70$ 432,163.00$ 432,163.00$ 544,174.00$
Operating 351,261.00 317,473.44 768,484.00 738,976.00 724,427.00 (67,500.00) 656,927.00 645,807.00
Total Administration 857,121.00$ 809,194.35$ 1,229,462.00$ 1,189,271.70$ 1,156,590.00$ (67,500.00)$ 1,089,090.00$ 1,189,981.00$
Finance
Salaries & Benefits 1,032,080.00$ 1,012,118.05$ 1,048,277.00$ 1,015,522.11$ 1,071,960.00$ -$ 1,071,960.00$ 1,123,073.00$
Operating 65,200.00 51,960.12 148,632.00 138,660.88 151,732.00 - 151,732.00 145,159.00
Total Finance 1,097,280.00$ 1,064,078.17$ 1,196,909.00$ 1,154,182.99$ 1,223,692.00$ -$ 1,223,692.00$ 1,268,232.00$
Human Resources
Salaries & Benefits 516,647.00$ 494,602.69$ 409,313.00$ 402,679.86$ 423,805.00$ 10,000.00$ 433,805.00$ 449,597.00$
Operating 142,560.00 126,798.93 124,066.00 111,783.25 129,375.00 - 129,375.00 152,452.00
Total Human Resources 659,207.00$ 621,401.62$ 533,379.00$ 514,463.11$ 553,180.00$ 10,000.00$ 563,180.00$ 602,049.00$
Public & Environmental Policy
Salaries & Benefits -$ -$ 80,739.00$ 74,045.62$ 267,021.00$ -$ 267,021.00$ 271,849.00$
Operating - - 316.00 266.14 16,702.00 19,730.00 36,432.00 32,196.00
Capital Outlay - - - - - 15,270.00 15,270.00
Total Public & Environmental Policy -$ -$ 81,055.00$ 74,311.76$ 283,723.00$ 35,000.00$ 318,723.00$ 304,045.00$
Information Technology
Salaries & Benefits 560,798.00$ 554,629.78$ 666,803.00$ 663,938.16$ 824,194.00$ (50,000.00)$ 774,194.00$ 907,339.00$
Operating 1,093,725.00 1,085,505.96 1,202,784.00 1,172,364.45 1,586,836.00 - 1,586,836.00 2,065,407.00
Capital Outlay - - 10,871.00 10,870.50 - - - -
Total Information Technology 1,654,523.00$ 1,640,135.74$ 1,880,458.00$ 1,847,173.11$ 2,411,030.00$ (50,000.00)$ 2,361,030.00$ 2,972,746.00$
Engineering
Salaries & Benefits 2,191,212.00$ 2,167,147.14$ 2,377,929.00$ 2,346,479.52$ 2,479,988.00$ (45,000.00)$ 2,434,988.00$ 2,577,978.00$
Operating 121,451.00 111,667.20 359,657.00 323,942.09 223,957.00 - 223,957.00 162,918.00
Capital Outlay 8,500.00 8,453.00 - - - - - -
Total Engineering 2,321,163.00$ 2,287,267.34$ 2,737,586.00$ 2,670,421.61$ 2,703,945.00$ (45,000.00)$ 2,658,945.00$ 2,740,896.00$
Operations - Centralized Maintenance
Salaries & Benefits 1,331,670.00$ 1,285,858.34$ 1,373,646.00$ 1,301,726.59$ 1,384,152.00$ -$ 1,384,152.00$ 1,449,537.00$
Operating 1,118,310.00 1,077,536.04 1,481,066.00 1,422,097.13 1,412,692.00 397,560.00 1,810,252.00 1,465,898.00
Capital Outlay 14,424.00 14,422.59 17,604.00 41,604.00 41,604.00 30,142.00
Total Operations - Centralized Maintenance 2,464,404.00$ 2,377,816.97$ 2,872,316.00$ 2,723,823.72$ 2,796,844.00$ 439,164.00$ 3,236,008.00$ 2,945,577.00$
Operations - Administration
Salaries & Benefits 332,416.00$ 322,653.52$ 346,084.00$ 340,402.17$ 359,648.00$ -$ 359,648.00$ 376,753.00$
Operating 16,233.00 14,064.13 20,918.00 18,124.88 13,972.00 - 13,972.00 19,762.00
Total Operations - Administration 348,649.00$ 336,717.65$ 367,002.00$ 358,527.05$ 373,620.00$ -$ 373,620.00$ 396,515.00$
Operations - Water Treatment
Salaries & Benefits 1,699,821.00$ 1,605,378.06$ 1,760,969.00$ 1,646,500.44$ 1,866,351.00$ -$ 1,866,351.00$ 2,153,352.00$
Operating 5,066,096.00 4,716,466.43 5,388,367.00 4,869,706.01 5,297,427.00 99,886.00 5,397,313.00 5,276,200.00
Capital Outlay 68,246.00 66,775.68 25,688.00 25,549.47 - 9,454.00 9,454.00 -
Total Operations - Water Treatment 6,834,163.00$ 6,388,620.17$ 7,175,024.00$ 6,541,755.92$ 7,163,778.00$ 109,340.00$ 7,273,118.00$ 7,429,552.00$
Budgeted and Actual Expenditures by Department and Category
49

2017 2017 2018 2018 2019 2019 2019 2020
Adjusted Adjusted Adopted Amendments Adjusted Adopted
Budget Actual Budget Actual Budget & Transfers Budget Budget
Budgeted and Actual Expenditures by Department and Category
Operations - Wastewater Treatment
Salaries & Benefits 1,740,978.00$ 1,711,643.65$ 1,853,980.00$ 1,793,597.19$ 1,912,516.00$ -$ 1,912,516.00$ 2,009,484.00$
Operating 2,196,567.00 2,080,051.00 2,161,473.00 2,023,142.98 2,327,740.00 224,683.00 2,552,423.00 3,980,942.00
Capital Outlay - - 28,064.00 - 64,200.00 (32,002.00) 32,198.00 70,000.00
Total Operations - Wastewater Treatment 3,937,545.00$ 3,791,694.65$ 4,043,517.00$ 3,816,740.17$ 4,304,456.00$ 192,681.00$ 4,497,137.00$ 6,060,426.00$
Operations - Utility Services
Salaries & Benefits 5,315,576.00$ 5,099,477.43$ 5,483,876.00$ 5,339,660.91$ 5,806,732.00$ (30,000.00)$ 5,776,732.00$ 6,230,174.00$
Operating 4,213,221.00 3,230,946.80 3,672,064.00 3,274,826.37 3,582,585.00 136,290.00 3,718,875.00 4,145,129.00
Capital Outlay 373,897.00 332,308.19 71,590.00 71,588.97
Total Operations - Utility Services 9,902,694.00$ 8,662,732.42$ 9,227,530.00$ 8,686,076.25$ 9,389,317.00$ 106,290.00$ 9,495,607.00$ 10,375,303.00$
Environmental Management
Salaries & Benefits 1,801,568.00$ 1,742,888.35$ 1,981,850.00$ 1,915,310.08$ 2,078,776.00$ -$ 2,078,776.00$ 2,270,623.00$
Operating 495,928.00 446,988.79 740,277.00 570,242.79 644,345.00 41,285.00 685,630.00 820,229.00
Capital Outlay 70,418.00 65,426.06 - - - - - -
Total Environmental Management 2,367,914.00$ 2,255,303.20$ 2,722,127.00$ 2,485,552.87$ 2,723,121.00$ 41,285.00$ 2,764,406.00$ 3,090,852.00$
Customer Service
Salaries & Benefits 2,787,971.00$ 2,640,011.82$ 3,034,431.00$ 2,966,364.52$ 3,318,813.00$ (10,000.00)$ 3,308,813.00$ 3,543,896.00$
Operating 1,146,562.00 956,317.10 991,418.00 861,623.89 844,917.00 - 844,917.00 1,093,338.00
Capital Outlay 23,513.00 23,402.00 - - - - - -
Total Customer Service 3,958,046.00$ 3,619,730.92$ 4,025,849.00$ 3,827,988.41$ 4,163,730.00$ (10,000.00)$ 4,153,730.00$ 4,637,234.00$
Damage Claims 50,000.00$ (369.76)$ -$ -$ -$ -$ -$ -$
Outside Partnerships 76,650.00 69,196.00 - - - - - -
Non-capital Construction 298,500.00 293,106.86 - - - - - -
Fines & Penalties 25,132.00 - - - - - - -
Nondepartmental 2,328,260.00 2,313,084.19 2,445,579.00 2,307,865.43 2,568,810.00 (50,000.00) 2,518,810.00 2,552,774.00
Debt Service 24,950,053.00 24,022,711.14 24,297,928.00 24,200,635.91 23,178,918.00 8,500.00 23,187,418.00 22,425,482.00
Litigation Settlement 50,000.00 50,000.00 - - - - - -
Contingency 953,000.00 - 1,063.00 - - 268,080.00 268,080.00 -
Transfers to Capital Projects 16,430,910.00 16,430,910.00 20,066,614.00 20,066,614.00 16,695,665.00 1,368,801.00 18,064,466.00 16,500,000.00
Payment to Refunded Bond Escrow Agent - - 33,960,000.00 32,729,049.60 - - - -
TOTAL 81,631,320.00$ 77,093,097.21$ 118,925,769.00$ 115,250,131.92$ 81,755,129.00$ 2,356,641.00$ 84,111,770.00$ 85,554,722.00$
50

Fiscal Year 2019-2020 Budget Cape Fear Public Utility Authority
CAPITAL BUDGET
Capital improvements are necessary for rehabilitation, replacement, and acquisition of infrastructure and to provide safe, reliable, high-quality water and wastewater services. Capital improvements are budgeted through project ordinances that appropriate funds to be used over the life of the project, which may span several budget years. This contrasts with the Authority’s operating budget appropriations which lapse at the end of each budget year. Capital budgets are developed by first preparing initial business cases to evaluate capital projects in terms of risk (defined as the product of the consequence of failure and the likelihood of failure) and whether the projects are necessary for compliance with regulatory requirements, improve efficiency, increase capacity, or are necessary to accommodate growth. Projects are prioritized based on risk and these other criteria. The capital budgeting process is also governed by certain financial limitations. Except for grants and capital contributions, the Authority’s capital projects are funded through either annual operating revenue (pay-as-you-go funded) or with proceeds from the issuance of debt (debt funded). In accordance with policy, debt is generally limited to high-dollar and growth-oriented projects. Debt cannot be issued if such issuance would cause the Authority’s debt-to-capitalization ratio to exceed 45%. These debt limitations mean that most other capital expenditures are funded on a pay-as-you-go basis. The Authority develops its capital budgets to provide that pay-as-you-go funded capital expenditures approximate a pre-determined target. Since pay-as-you-go funding comes from water and wastewater revenues, establishing an annual pay-as-you-go funded capital expenditure target reduces rate volatility and keeps rates affordable by reducing long-term debt and associated costs. The current amount of $18 million was determined based on the size of the system, current condition of the system, expectations of construction and materials costs, and rate affordability benchmarks. An important aspect of capital budgeting is the effect that budgeted projects have on the annual operating budget. As previously mentioned, most of the Authority’s capital expenditures are debt funded or pay-as-you-go funded. Both funding methods impact the annual operating budget. Under the pay-as-you-go method, customers are charged through rates to fund capital costs. Pay-as-you-go funding is appropriated as a transfer to the capital fund in the annual operating budget. Under the debt funding method, customers are charged through rates to cover debt service costs related to debt issued to fund capital costs. Debt service costs are appropriated in the annual operating budget. Appropriations for transfers to the capital projects fund and debt service for FY 19-20 are $16.5 million and $22.4 million, respectively. Combined, these appropriations comprise 46% of the FY 19-20 operating budget. The FY 19-20 capital budget totals $84.9 million. The majority (57.6%) of the FY 19-20 capital budget is focused on enhancement of existing infrastructure at the Sweeney Water Treatment Plant needed to reduce PFAS compounds in drinking water. Another 37.1% of the FY 19-20 capital budget is programmed for system rehabilitation and replacement. Notable projects include construction of a new raw water line with LCFWSA. The remaining 5.4% of the FY 19-20 capital budget is programmed for system expansion. Notable expansion projects include the Northern Water Mains Cost Recovery Project. The pie charts on the following page detail project appropriations by type and the funding sources
incorporated in the FY 19-20 capital budget.
51
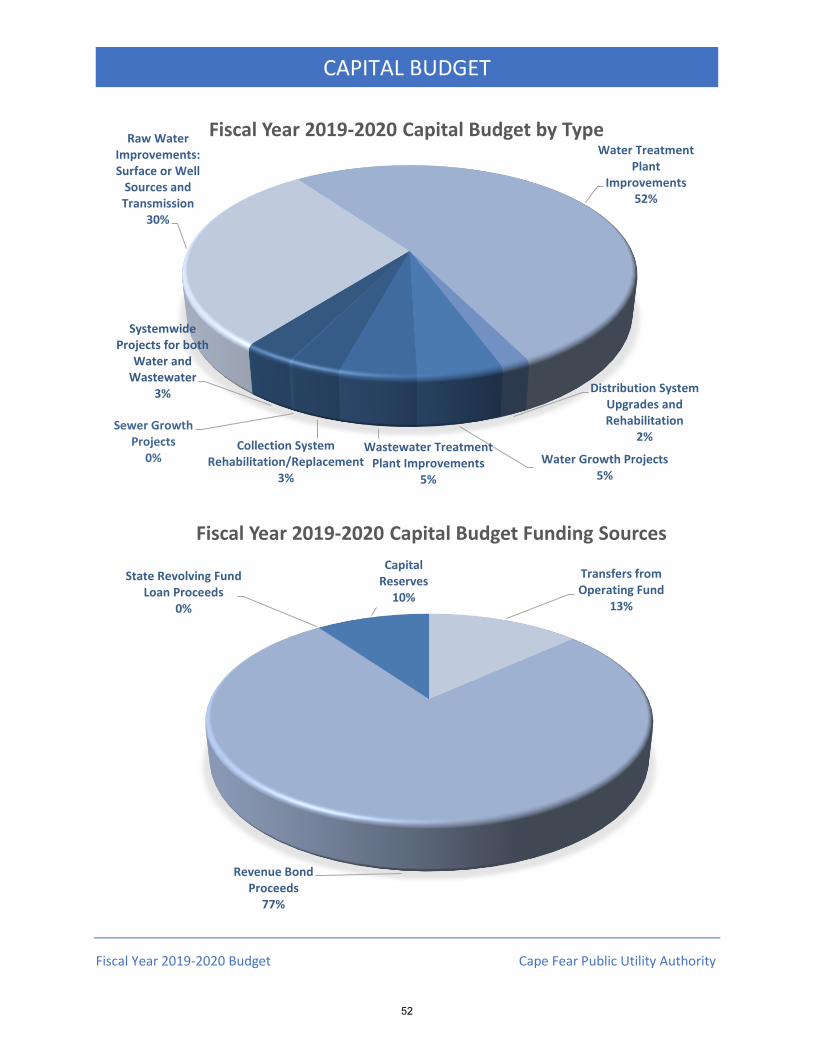
Fiscal Year 2019-2020 Budget Cape Fear Public Utility Authority
CAPITAL BUDGET
Raw Water Improvements: Surface or Well
Sources and Transmission
30%
Water Treatment Plant
Improvements52%
Distribution System Upgrades and Rehabilitation
2%
Water Growth Projects5%
Wastewater Treatment Plant Improvements
5%
Collection System Rehabilitation/Replacement
3%
Sewer Growth Projects
0%
Systemwide Projects for both
Water and Wastewater
3%
Fiscal Year 2019-2020 Capital Budget by Type
Transfers from Operating Fund
13%
Revenue Bond Proceeds
77%
State Revolving Fund Loan Proceeds
0%
Capital Reserves
10%
Fiscal Year 2019-2020 Capital Budget Funding Sources
52

REFERENCE NUMBER
1
Sewer Emergency Repair 17S393
Project Type: Rehab or Replace Assets
Project Area: Wastewater Collection
Summary:This project funds emergency repair of sewer infrastructure if there is a failure prior to programmed replacement or rehabilitation. Spending on sewer emergency repair in the last 5-years was as follows: FY-18 - $2,023,733; FY-17 - $355,211; FY-16 - $773,563; FY 15 - $817,430; FY 14 - $530,333.
• COMPLIANCE 100%: Required for compliance with no other benefits.
• EFFICIENCY 0%: No direct Impact on efficiency.
• CAPACITY 0%: No direct Impact on capacity.
Total Estimated Cost $20,500,000
Budgeted FY 2015-2019
$15,500,000
Requested FY 2020 Future Budget Needs
$500,000 $4,500,000
Project Drivers and Benefits:
• GROWTH 0%: No direct Impact on customer growth.
53
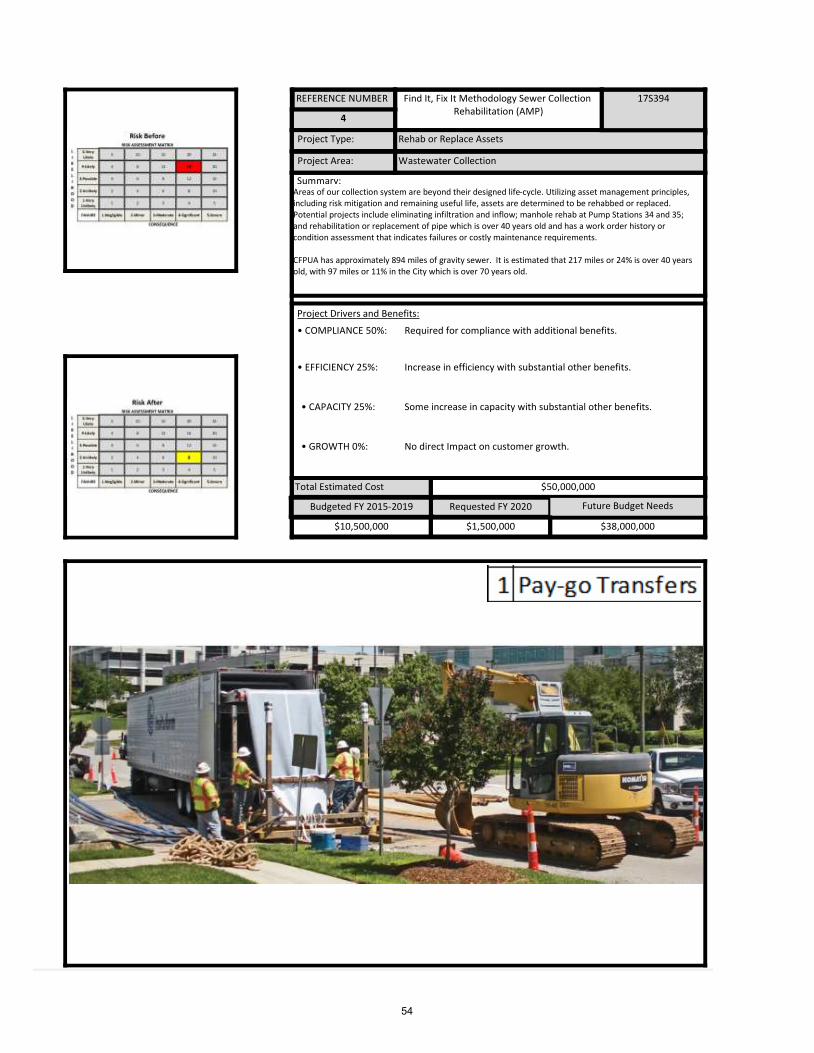
REFERENCE NUMBER
4
Find It, Fix It Methodology Sewer Collection Rehabilitation (AMP)
17S394
Project Type: Rehab or Replace Assets
Project Area: Wastewater Collection
Summary:Areas of our collection system are beyond their designed life‐cycle. Utilizing asset management principles, including risk mitigation and remaining useful life, assets are determined to be rehabbed or replaced. Potential projects include eliminating infiltration and inflow; manhole rehab at Pump Stations 34 and 35; and rehabilitation or replacement of pipe which is over 40 years old and has a work order history or condition assessment that indicates failures or costly maintenance requirements.
CFPUA has approximately 894 miles of gravity sewer. It is estimated that 217 miles or 24% is over 40 years old, with 97 miles or 11% in the City which is over 70 years old.
• COMPLIANCE 50%: Required for compliance with additional benefits.
• EFFICIENCY 25%: Increase in efficiency with substantial other benefits.
• CAPACITY 25%: Some increase in capacity with substantial other benefits.
Total Estimated Cost $50,000,000
Budgeted FY 2015-2019
$10,500,000
Requested FY 2020 Future Budget Needs
$1,500,000 $38,000,000
Project Drivers and Benefits:
• GROWTH 0%: No direct Impact on customer growth.
54

REFERENCE NUMBER
10
IT SCADA (PS Upgrades) 16S344
Project Type: Rehab or Replace Assets
Project Area: Other
Summary:This project is to fund systematic replacement of existing SCADA Remote Terminal Units (RTU's) at the Authority’s 142 pump stations. After ongoing replacements using current funding, approximately 52 existing RTU's will remain that are over 20‐years old. Parts for these units are no longer available in the marketplace for repairs. In addition, these replacements are needed to convert to wireless Ethernet communication.
• COMPLIANCE 75%: Required for compliance with some other beneficial considerations.
• EFFICIENCY 25%: Increase in efficiency with substantial other benefits.
• CAPACITY 0%: No direct Impact on capacity.
Total Estimated Cost $2,250,000
Budgeted FY 2015-2019
$1,000,000
Requested FY 2020 Future Budget Needs
$250,000 $1,000,000
Project Drivers and Benefits:
• GROWTH 0%: No direct Impact on customer growth.
55

REFERENCE NUMBER
18
Water Distribution Sample Stations 17W245
Project Type: Enhancement
Project Area: Water Distribution
Summary:CFPUA needs 250 sampling locations for its routine sampling of the distribution system water quality. Several sample sites are located on private property and owners want them removed. DEQ also wants redundancy for compliance. This project will remove the sampling sites from private property and construct new sampling stations in the public rights-of-way. The first phase of the Water Distribution Sample Stations project installed 105 sample stations. Future funding will address the remaining sampling stations.
• COMPLIANCE 75%: Required for compliance with some other beneficial considerations.
• EFFICIENCY 25%: Increase in efficiency with substantial other benefits.
• CAPACITY 0%: No direct Impact on capacity.
Total Estimated Cost $820,000
Budgeted FY 2015-2019
$420,000
Requested FY 2020 Future Budget Needs
$200,000 $200,000
Project Drivers and Benefits:
• GROWTH 0%: No direct Impact on customer growth.
56

REFERENCE NUMBER
22
Comprehensive Meter Replacement Program 16W215
Project Type: Rehab or Replace Assets
Project Area: Water Distribution
Summary:CFPUA has approximately 63,000 small meters (5/8” – typical residential), 3,900 midsizemeter (1", 1,1/2", and 2") and 307 large meters (3" or larger). The meter population is a mixture of radio read, touch/probe read, and manual read type. Billing is conducted bi-monthly, with a total of 221 routes and 9 meter readers. A majority of CFPUA’s meters are approaching the end of their useful life, meaning a reduction in reading accuracy. CFPUA recognized the need to initiate a Meter Replacement Program to replace these aged meters and institute a consistent and efficient meter reading method. Phase 1 and 2 install 30,141 small to midsize meters. Phase 3 project is currently ongoing with the expected to install 33,330 meters. Future funding will address the remaining large meters.
• COMPLIANCE 0%: No direct impact on compliance.
• EFFICIENCY 100%: Increases efficiency with no other benefits.
• CAPACITY 0%: No direct Impact on capacity.
Total Estimated Cost $19,480,000
Budgeted FY 2015-2019
$18,280,000
Requested FY 2020 Future Budget Needs
$200,000 $1,000,000
Project Drivers and Benefits:
• GROWTH 0%: No direct Impact on customer growth.
57

REFERENCE NUMBER
23
Rehabilitation of Sewer Infrastructure Matching with City Streets
17S395
Project Type: Rehab or Replace Assets
Project Area: Wastewater Collection
Summary:When the City of Wilmington initiates street repaving or stormwater projects there are opportunities for replacement of CFPUA sewer infrastructure as a part of the City's project. These funds are programmed to fund design and construction of Authority infrastructure rehab or replacement under contracts managed by the City as set forth by future Interlocal Agreements. Brick streets, repaving and streetscape projects are prime examples where the cost to the public and traffic disruptions can be reduced by concurrently addressing sewer infrastructure improvements. See also a matching project for water infrastructure.
• COMPLIANCE 50%: Required for compliance with additional benefits.
• EFFICIENCY 25%: Increase in efficiency with substantial other benefits.
• CAPACITY 25%: Some increase in capacity with substantial other benefits.
Total Estimated Cost $7,400,000
Budgeted FY 2015-2019
$1,400,000
Requested FY 2020 Future Budget Needs
$600,000 $5,400,000
Project Drivers and Benefits:
• GROWTH 0%: No direct Impact on customer growth.
58
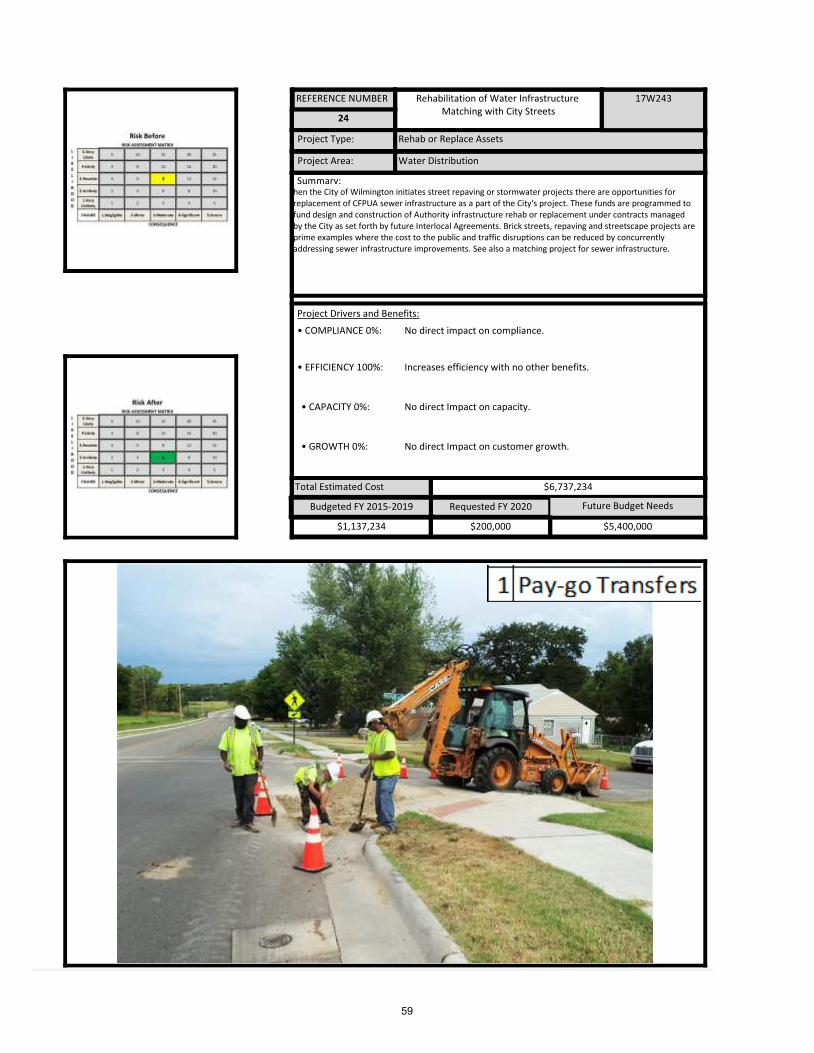
REFERENCE NUMBER
24
Rehabilitation of Water Infrastructure Matching with City Streets
17W243
Project Type: Rehab or Replace Assets
Project Area: Water Distribution
Summary:hen the City of Wilmington initiates street repaving or stormwater projects there are opportunities for replacement of CFPUA sewer infrastructure as a part of the City's project. These funds are programmed to fund design and construction of Authority infrastructure rehab or replacement under contracts managed by the City as set forth by future Interlocal Agreements. Brick streets, repaving and streetscape projects are prime examples where the cost to the public and traffic disruptions can be reduced by concurrently addressing sewer infrastructure improvements. See also a matching project for sewer infrastructure.
• COMPLIANCE 0%: No direct impact on compliance.
• EFFICIENCY 100%: Increases efficiency with no other benefits.
• CAPACITY 0%: No direct Impact on capacity.
Total Estimated Cost $6,737,234
Budgeted FY 2015-2019
$1,137,234
Requested FY 2020 Future Budget Needs
$200,000 $5,400,000
Project Drivers and Benefits:
• GROWTH 0%: No direct Impact on customer growth.
59

REFERENCE NUMBER
28
IT Virtual Desktop Migration 16A008
Project Type: Enhancement
Project Area: Other
Summary:Desktop PC's are being replaced with a thin client which is less costly than a desktop. Desktop PC’s will be allowed to run to failure to maximize the investment. Server resources are shared among virtual desktops to ensure that all resources are being utilized and not wasted. This solution allows for centralized management of the user’s desktop. This solution has multiple levels of redundancy and can be securely accessed remotely from any location with Internet access which meets the Information Technology Division’s Business Continuity plan.
• COMPLIANCE 50%: Required for compliance with additional benefits.
• EFFICIENCY 50%: Increase in efficiency with additional benefits.
• CAPACITY 0%: No direct Impact on capacity.
Total Estimated Cost $520,000
Budgeted FY 2015-2019
$380,000
Requested FY 2020 Future Budget Needs
$140,000 $0
Project Drivers and Benefits:
• GROWTH 0%: No direct Impact on customer growth.
60

REFERENCE NUMBER
30
Information Technology Networking Infrastructure Replacement
16A007
Project Type: Rehab or Replace Assets
Project Area: Other
Summary:In 2008 the Information Technology Division purchased various electronics (Firewalls, Switches, Routers) to connect the Administrative building and the other CFPUA facilities to one another. These devices provide intelligent routing and segmenting for various (Data, Voice, SCADA) applications, security from outside networks, Internet access, and virus protection for the Authority. This project replaces that equipment in a prioritized manner across multiple years. Some equipment will be replaced only after it fails or is obsolete to extract maximum value and service life.
• COMPLIANCE 25%: Some enhancement to compliance with substantial other benefits.
• EFFICIENCY 75%: Significant increase in efficiency with some other beneficial considerations.
• CAPACITY 0%: No direct Impact on capacity.
Total Estimated Cost $1,464,000
Budgeted FY 2015-2019
$464,000
Requested FY 2020 Future Budget Needs
$100,000 $900,000
Project Drivers and Benefits:
• GROWTH 0%: No direct Impact on customer growth.
61
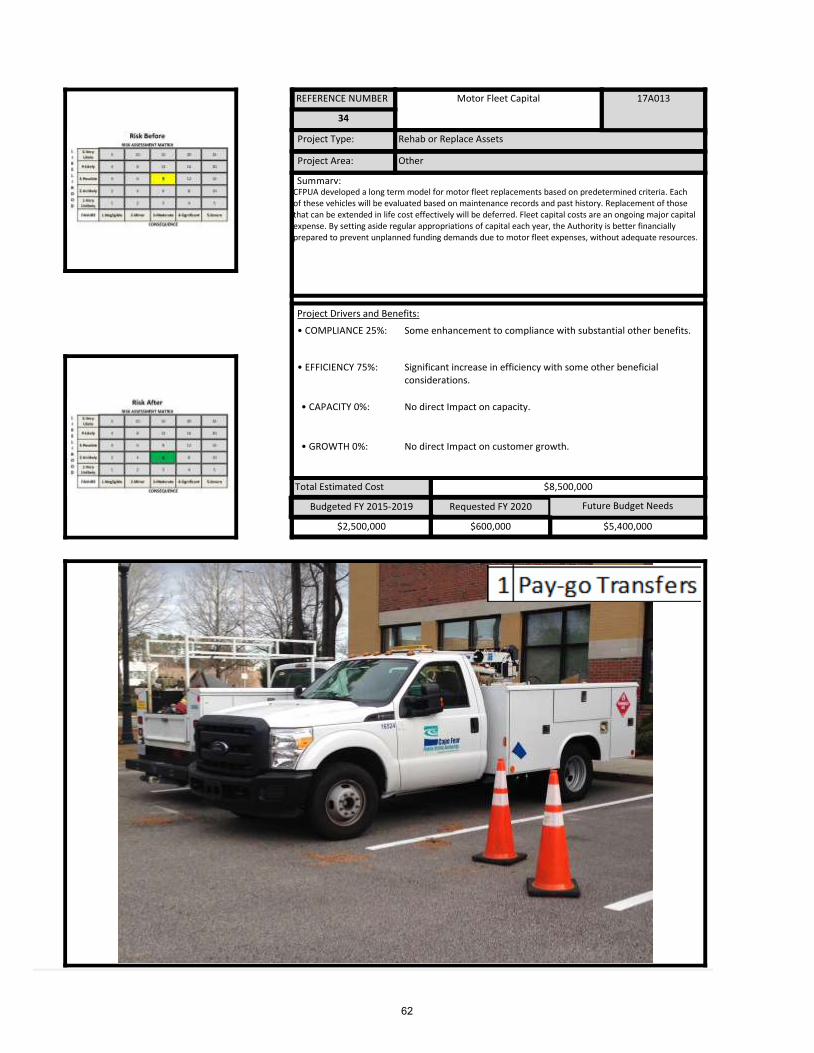
REFERENCE NUMBER
34
Motor Fleet Capital 17A013
Project Type: Rehab or Replace Assets
Project Area: Other
Summary:CFPUA developed a long term model for motor fleet replacements based on predetermined criteria. Each of these vehicles will be evaluated based on maintenance records and past history. Replacement of those that can be extended in life cost effectively will be deferred. Fleet capital costs are an ongoing major capital expense. By setting aside regular appropriations of capital each year, the Authority is better financially prepared to prevent unplanned funding demands due to motor fleet expenses, without adequate resources.
• COMPLIANCE 25%: Some enhancement to compliance with substantial other benefits.
• EFFICIENCY 75%: Significant increase in efficiency with some other beneficial considerations.
• CAPACITY 0%: No direct Impact on capacity.
Total Estimated Cost $8,500,000
Budgeted FY 2015-2019
$2,500,000
Requested FY 2020 Future Budget Needs
$600,000 $5,400,000
Project Drivers and Benefits:
• GROWTH 0%: No direct Impact on customer growth.
62

REFERENCE NUMBER
36
Water Meters for New Customers 17W247
Project Type: Expansion
Project Area: Water Distribution
Summary:Provides water meters for new customers added by development or other new connections. A sufficient number of water meters must be kept in inventory to meet the needs of new customers.
• COMPLIANCE 0%: No direct impact on compliance.
• EFFICIENCY 25%: Increase in efficiency with substantial other benefits.
• CAPACITY 25%: Some increase in capacity with substantial other benefits.
Total Estimated Cost $3,250,000
Budgeted FY 2015-2019
$750,000
Requested FY 2020 Future Budget Needs
$250,000 $2,250,000
Project Drivers and Benefits:
• GROWTH 50%: Increase customer growth with additional benefits.
63

REFERENCE NUMBER
38
Collection System - Standard Developer Agreements
17S399
Project Type: Expansion
Project Area: Wastewater Collection
Summary:Annual funds allocated to standard developer agreements. Provides cost sharing opportunities with private developers, decreasing overall cost of infrastructure and provides opportunities to increase customer base.
• COMPLIANCE 0%: No direct impact on compliance.
• EFFICIENCY 25%: Increase in efficiency with substantial other benefits.
• CAPACITY 25%: Some increase in capacity with substantial other benefits.
Total Estimated Cost $2,300,000
Budgeted FY 2015-2019
$800,000
Requested FY 2020 Future Budget Needs
$150,000 $1,350,000
Project Drivers and Benefits:
• GROWTH 50%: Increase customer growth with additional benefits.
64
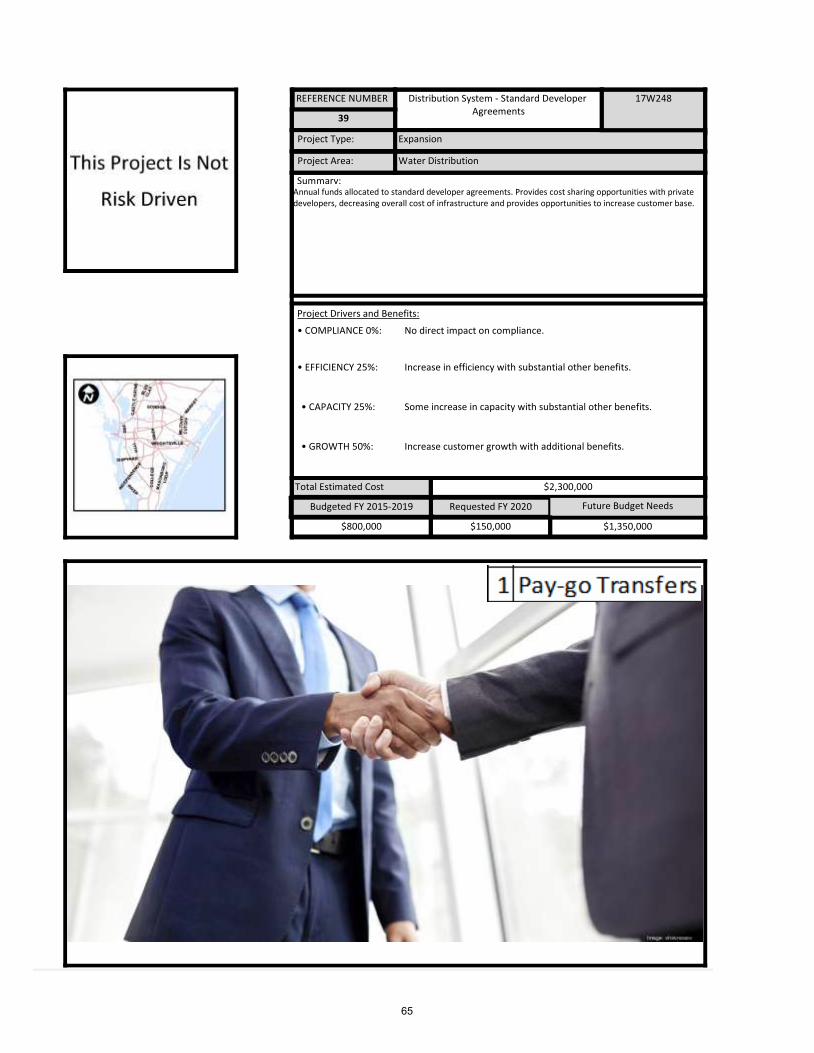
REFERENCE NUMBER
39
Distribution System - Standard Developer Agreements
17W248
Project Type: Expansion
Project Area: Water Distribution
Summary:Annual funds allocated to standard developer agreements. Provides cost sharing opportunities with private developers, decreasing overall cost of infrastructure and provides opportunities to increase customer base.
• COMPLIANCE 0%: No direct impact on compliance.
• EFFICIENCY 25%: Increase in efficiency with substantial other benefits.
• CAPACITY 25%: Some increase in capacity with substantial other benefits.
Total Estimated Cost $2,300,000
Budgeted FY 2015-2019
$800,000
Requested FY 2020 Future Budget Needs
$150,000 $1,350,000
Project Drivers and Benefits:
• GROWTH 50%: Increase customer growth with additional benefits.
65

REFERENCE NUMBER
40
OPS Large Equipment Purchases (Pumps, Plant Equipment, HVAC)
17A012
Project Type: Rehab or Replace Assets
Project Area: Other
Summary:This project funds replacement of large equipment such as HVAC, pumps and other equipment replacements large enough to be a capital project for any facility arising due to unplanned but non-emergency system failures that occur during the year.
• COMPLIANCE 50%: Required for compliance with additional benefits.
• EFFICIENCY 50%: Increase in efficiency with additional benefits.
• CAPACITY 0%: No direct Impact on capacity.
Total Estimated Cost $5,780,000
Budgeted FY 2015-2019
$780,000
Requested FY 2020 Future Budget Needs
$500,000 $4,500,000
Project Drivers and Benefits:
• GROWTH 0%: No direct Impact on customer growth.
66

REFERENCE NUMBER
45
Construction of New Raw Water Line with LCFWSA ILA
17W261
Project Type: Rehab or Replace Assets
Project Area: Water Treatment
Summary:CFPUA’s raw water source from surface water is partially conveyed through LCFWSA infrastructure. LCFWSA is planning to build a second raw water line for redundancy and ultimate capacity needs. CFPUA, as a significant partner, is participating in the cost for the second raw water line. Design funding was approved in FY-18. This funding is CFPUA’s share for the construction effort.
• COMPLIANCE 0%: No direct impact on compliance.
• EFFICIENCY 50%: Increase in efficiency with additional benefits.
• CAPACITY 50%: Increase in capacity with additional benefits.
Total Estimated Cost $26,700,000
Budgeted FY 2015-2019
$1,700,000
Requested FY 2020 Future Budget Needs
$25,000,000 $0
Project Drivers and Benefits:
• GROWTH 0%: No direct Impact on customer growth.
67

REFERENCE NUMBER
57
Water Emergency Repair 16W223
Project Type: Rehab or Replace Assets
Project Area: Water Distribution
Summary:Funding to address emergency water repair.Spending on water emergency repair in the last 2 years was as follows:FY-17 - $2,168,190; FY-18 - $229,083
• COMPLIANCE 100%: Required for compliance with no other benefits.
• EFFICIENCY 0%: No direct Impact on efficiency.
• CAPACITY 0%: No direct Impact on capacity.
Total Estimated Cost $2,433,845
Budgeted FY 2015-2019
$433,845
Requested FY 2020 Future Budget Needs
$250,000 $1,750,000
Project Drivers and Benefits:
• GROWTH 0%: No direct Impact on customer growth.
68

REFERENCE NUMBER
90
Northside WWTP - Enhancements, Upgrades and Generator Replacement
Project Type: Enhancement
Project Area: Wastewater Treatment
Summary:The Northside WWTP is a major and vital asset in the CFPUA system, providing advanced wastewater treatment for customers in the northern CFPUA service area. Internal review of the facility indicated a need for several modifications to improve operational reliability and flexibility of the plant. These modifications include, aeration basin channel flexibility, backup generator replacement, tertiary filter walkway improvements, protective coating of secondary clarifiers, drainage, erosion, security improvements.
• COMPLIANCE 25%: Some enhancement to compliance with substantial other benefits.
• EFFICIENCY 75%: Significant increase in efficiency with some other beneficial considerations.
• CAPACITY 0%: No direct Impact on capacity.
Total Estimated Cost $4,050,000
Budgeted FY 2015-2019
$100,000
Requested FY 2020 Future Budget Needs
$3,950,000 $0
Project Drivers and Benefits:
• GROWTH 0%: No direct Impact on customer growth.
69

REFERENCE NUMBER
94
Water Distribution Main Enhancements 18W005
Project Type: Enhancement
Project Area: Water Distribution
Summary:Existing dead end water mains create a necessity for excessive flushing and compliance issues. Local low fire flows have potential impacts to life and safety. Known locations have been identified and hydraulic benefit has been determined. Interconnects will be constructed to eliminate specific dead ends.
• COMPLIANCE 75%: Required for compliance with some other beneficial considerations.
• EFFICIENCY 25%: Increase in efficiency with substantial other benefits.
• CAPACITY 0%: No direct Impact on capacity.
Total Estimated Cost $1,300,000
Budgeted FY 2015-2019
$100,000
Requested FY 2020 Future Budget Needs
$300,000 $900,000
Project Drivers and Benefits:
• GROWTH 0%: No direct Impact on customer growth.
70

REFERENCE NUMBER
95
Cross Town Feeder Under Burnt Mill Creek Rehab/Replace
Project Type: Rehab or Replace Assets
Project Area: Water Distribution
Summary:Crosstown feeder is at a shallow depth under Burnt Mill Creek. Pipe is exposed, allowing potential damage and failure. Project will rehab existing line under the creek while constructing a duplicate redundant line at a deeper depth.
• COMPLIANCE 100%: Required for compliance with no other benefits.
• EFFICIENCY 0%: No direct Impact on efficiency.
• CAPACITY 0%: No direct Impact on capacity.
Total Estimated Cost $400,000
Budgeted FY 2015-2019
$0
Requested FY 2020 Future Budget Needs
$50,000 $350,000
Project Drivers and Benefits:
• GROWTH 0%: No direct Impact on customer growth.
71
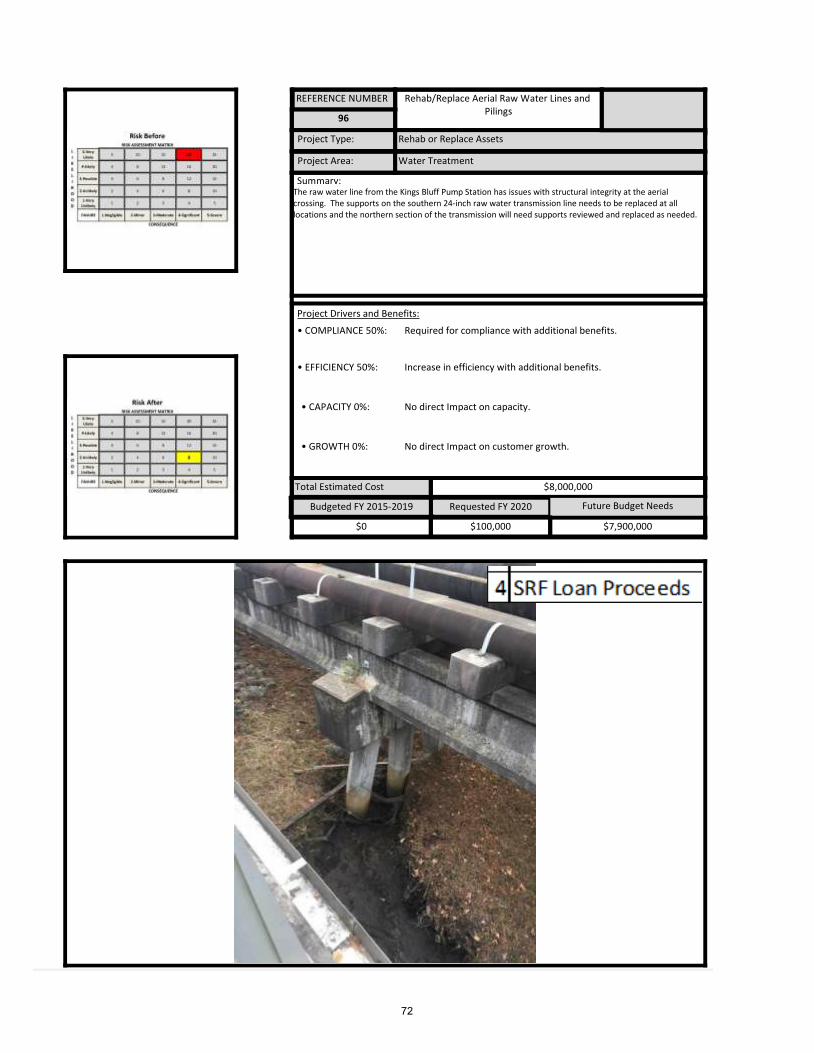
REFERENCE NUMBER
96
Rehab/Replace Aerial Raw Water Lines and Pilings
Project Type: Rehab or Replace Assets
Project Area: Water Treatment
Summary:The raw water line from the Kings Bluff Pump Station has issues with structural integrity at the aerial crossing. The supports on the southern 24-inch raw water transmission line needs to be replaced at all locations and the northern section of the transmission will need supports reviewed and replaced as needed.
• COMPLIANCE 50%: Required for compliance with additional benefits.
• EFFICIENCY 50%: Increase in efficiency with additional benefits.
• CAPACITY 0%: No direct Impact on capacity.
Total Estimated Cost $8,000,000
Budgeted FY 2015-2019
$0
Requested FY 2020 Future Budget Needs
$100,000 $7,900,000
Project Drivers and Benefits:
• GROWTH 0%: No direct Impact on customer growth.
72
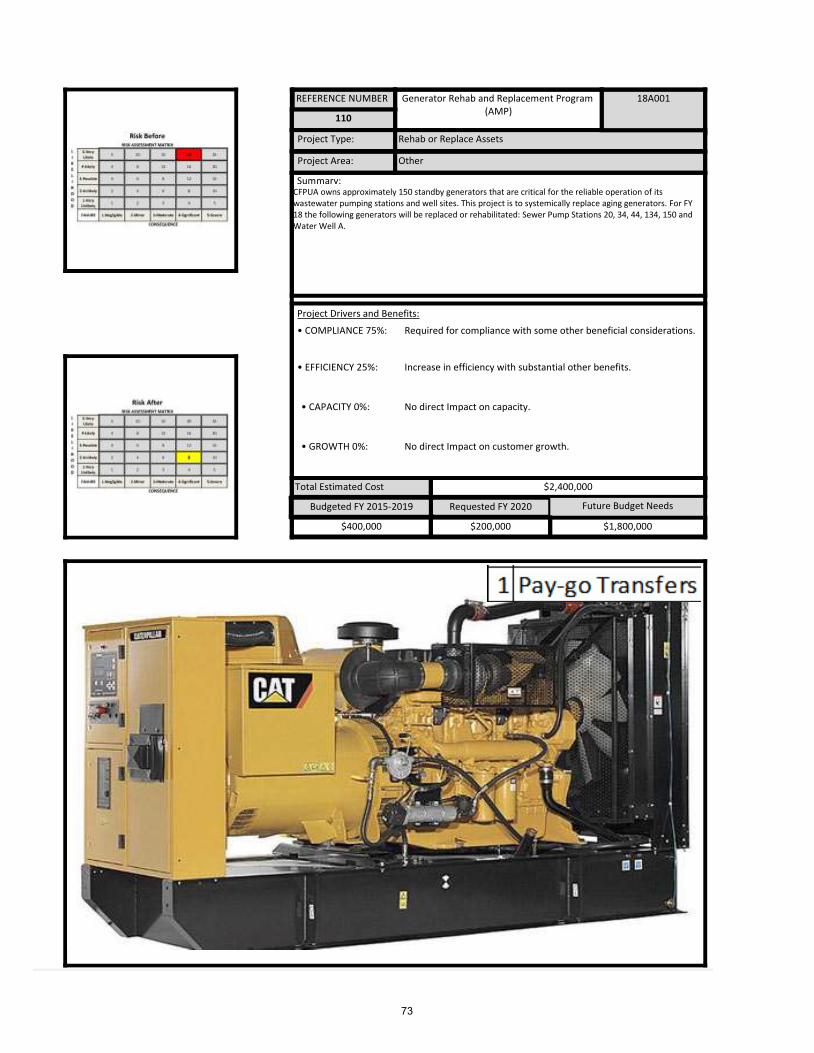
REFERENCE NUMBER
110
Generator Rehab and Replacement Program (AMP)
18A001
Project Type: Rehab or Replace Assets
Project Area: Other
Summary:CFPUA owns approximately 150 standby generators that are critical for the reliable operation of its wastewater pumping stations and well sites. This project is to systemically replace aging generators. For FY 18 the following generators will be replaced or rehabilitated: Sewer Pump Stations 20, 34, 44, 134, 150 and Water Well A.
• COMPLIANCE 75%: Required for compliance with some other beneficial considerations.
• EFFICIENCY 25%: Increase in efficiency with substantial other benefits.
• CAPACITY 0%: No direct Impact on capacity.
Total Estimated Cost $2,400,000
Budgeted FY 2015-2019
$400,000
Requested FY 2020 Future Budget Needs
$200,000 $1,800,000
Project Drivers and Benefits:
• GROWTH 0%: No direct Impact on customer growth.
73

REFERENCE NUMBER
114
IT SCADA
Project Type: Rehab or Replace Assets
Project Area: Other
Summary:The SCADA system at CFPUA’s facilities are becoming obsolete. Due to cyber security demands, standardization, centralized management, and to reduce future integration costs, SCADA is being migrated to an updated Wonderware platform. All hardware has been procured, configured and installed. Purchase and installation of new applications is planned at every plant over the next 3 years. SCADA controls are necessary for compliant and efficient operation of each facility.
• COMPLIANCE 50%: Required for compliance with additional benefits.
• EFFICIENCY 50%: Increase in efficiency with additional benefits.
• CAPACITY 0%: No direct Impact on capacity.
Total Estimated Cost $3,000,000
Budgeted FY 2015-2019
$750,000
Requested FY 2020 Future Budget Needs
$750,000 $1,500,000
Project Drivers and Benefits:
• GROWTH 0%: No direct Impact on customer growth.
74

REFERENCE NUMBER
122
Richardson Raw Water Supply, Chemistry and Membranes
16W210
Project Type: Rehab or Replace Assets
Project Area: Water Treatment
Summary:The Richardson WTP is ten years old and additional raw water supply from existing or new wells is needed to meet peak demands. This project includes increasing raw water supply, evaluation of more aquifer raw water blending prior to treatment, water chemistry enhancements required by new water changes, treatment enhancements and membrane selection and procurement. A new floor surface will be addedto the plant as part of the project to replace worn or damaged areas.
• COMPLIANCE 50%: Required for compliance with additional benefits.
• EFFICIENCY 50%: Increase in efficiency with additional benefits.
• CAPACITY 0%: No direct Impact on capacity.
Total Estimated Cost $3,500,000
Budgeted FY 2015-2019
$500,000
Requested FY 2020 Future Budget Needs
$300,000 $2,700,000
Project Drivers and Benefits:
• GROWTH 0%: No direct Impact on customer growth.
75

REFERENCE NUMBER
123
Sweeney WTP Treatment Enhancements 18W009
Project Type: Enhancement
Project Area: Water Treatment
Summary:This project was initiated to reduce contaminant levels of multiple per- and polyfluoroalkyl (PFAS) compounds, including GenX, that are present in the Cape Fear River, the raw water source for the Sweeney Water Treatment Plant (WTP). Although the Sweeney WTP already has advanced treatment processes, these were not designed to significantly reduce PFAS in the treated water. Extensive pilot testing identified Granular Activated Carbon (GAC) as the most effective treatment addition to the existing plant. The long-term solution for PFAS reduction is being designed. Funds requested in FY-2020 is to construct a post-filter, deep bed, GAC contractor process that is appropriately sized for the Sweeney WTP at a total capacity of 44 million gallons per day. The total project cost for design and construction of the deep bed contactors is estimated at $46 million. Funds also include an interim GAC change out for $1.3 million.
• COMPLIANCE 50%: Required for compliance with additional benefits.
• EFFICIENCY 50%: Increase in efficiency with additional benefits.
• CAPACITY 0%: No direct Impact on capacity.
Total Estimated Cost $49,880,200
Budgeted FY 2015-2019
$5,580,200
Requested FY 2020 Future Budget Needs
$44,300,000 $0
Project Drivers and Benefits:
• GROWTH 0%: No direct Impact on customer growth.
76

REFERENCE NUMBER
124
Northern Water Mains - Cost Recovery Project 17W264
Project Type: Expansion
Project Area: Water Distribution
Summary:This project provides water capacity for future develop throughout northern New Hanover County by completing a water transmission main loop. The planned water main is approximately 4.5 miles long and extends northward from the newly constructed Kerr Avenue water main to the General Electric campus, then eastward toward the New Hanover County Jail. Without the benefits of this looped main, all development north of I-140 will be constrained by limited water supply.
• COMPLIANCE 0%: No direct impact on compliance.
• EFFICIENCY 25%: Increase in efficiency with substantial other benefits.
• CAPACITY 75%: Significant increase in capacity with some other beneficial considerations.
Total Estimated Cost $6,000,000
Budgeted FY 2015-2019
$2,000,000
Requested FY 2020 Future Budget Needs
$4,000,000 $0
Project Drivers and Benefits:
• GROWTH 25%: Some increase in customer growth with substantial other.Benefits
77

REFERENCE NUMBER
134
Large Water Meter Vault Replacement
Project Type: Rehab or Replace Assets
Project Area: Water Distribution
Summary:Replace or repair large meter vaults or meter vault lids that may pose a hazard to the public and CFPUA personnel because of condition. Currently there are over 50 vaults identified that need work.
• COMPLIANCE 75%: Required for compliance with some other beneficial considerations.
• EFFICIENCY 25%: Increase in efficiency with substantial other benefits.
• CAPACITY 0%: No direct Impact on capacity.
Total Estimated Cost $1,800,000
Budgeted FY 2015-2019
$0
Requested FY 2020 Future Budget Needs
$300,000 $1,500,000
Project Drivers and Benefits:
• GROWTH 0%: No direct Impact on customer growth.
78

REFERENCE NUMBER
136
Facilities Structural and Roof Assessment and Rehab/Replace (AMP)
Project Type: Rehab or Replace Assets
Project Area: Other
Summary:CFPUA assets include buildings, tanks and other structures made of concrete, steel and other materials approaching end of lifecycle. This project assesses, prioritizes, rehabs or replaces damaged areas of these structures.
• COMPLIANCE 25%: Some enhancement to compliance with substantial other benefits.
• EFFICIENCY 75%: Significant increase in efficiency with some other beneficial considerations.
• CAPACITY 0%: No direct Impact on capacity.
Total Estimated Cost $1,000,000
Budgeted FY 2015-2019
$0
Requested FY 2020 Future Budget Needs
$100,000 $900,000
Project Drivers and Benefits:
• GROWTH 0%: No direct Impact on customer growth.
79
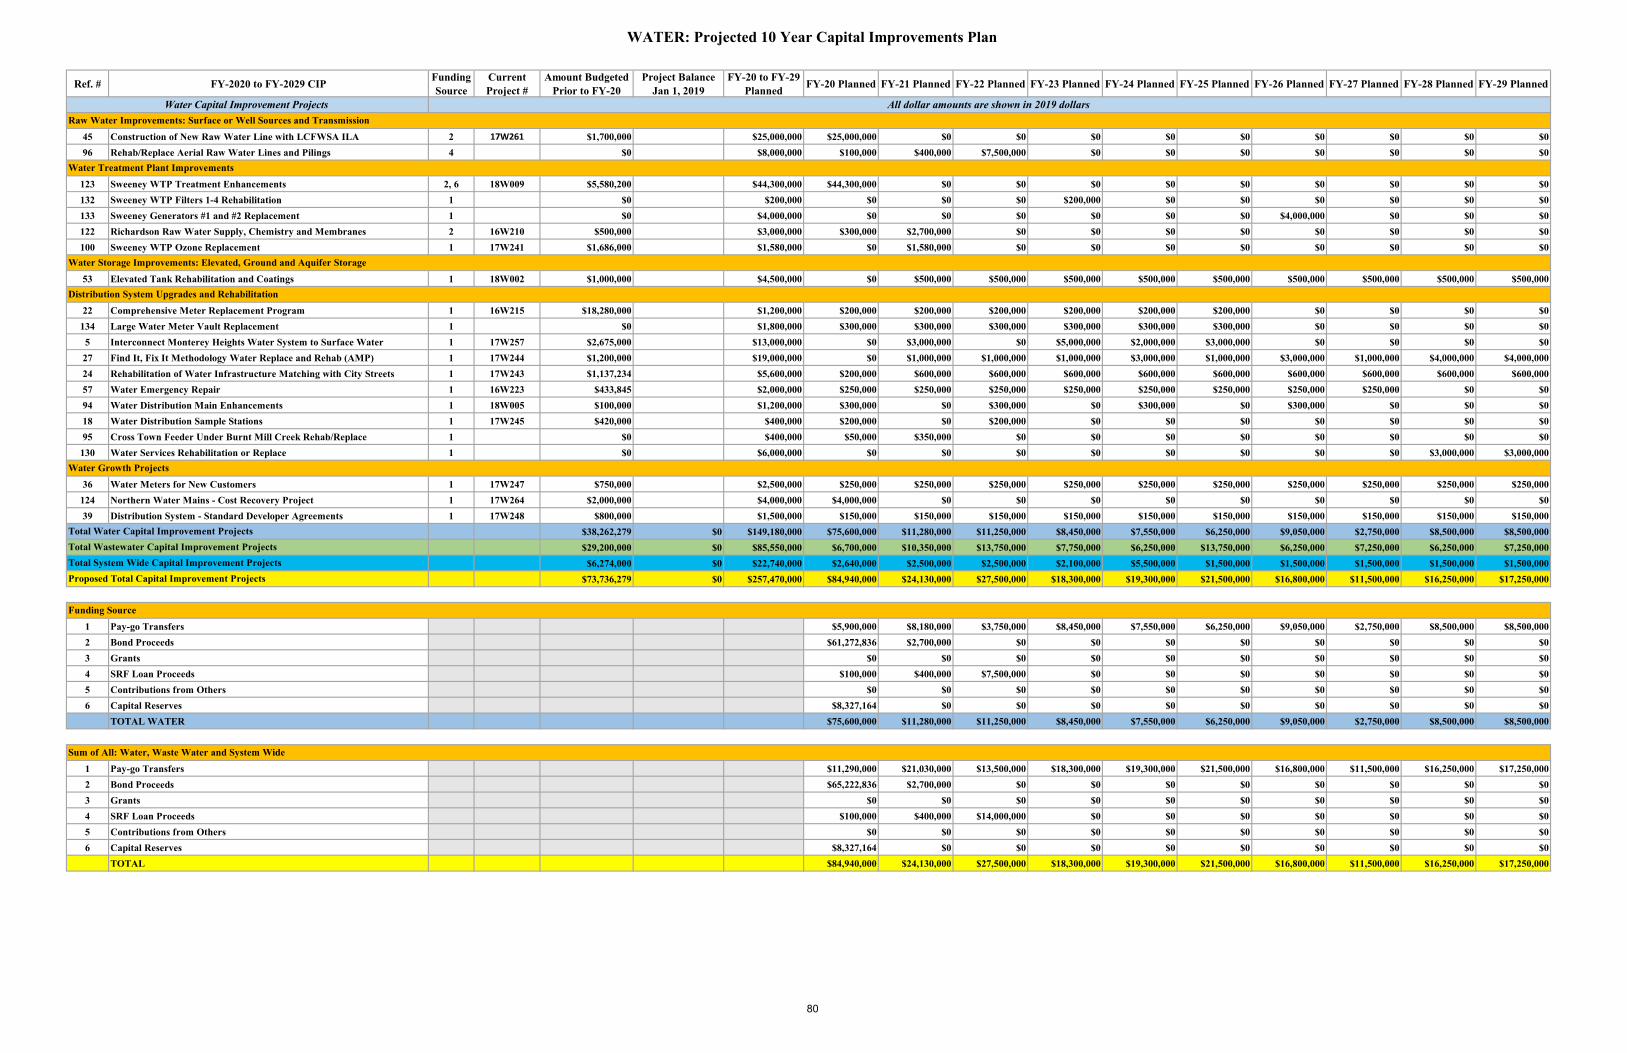
WATER: Projected 10 Year Capital Improvements Plan
Ref. # FY-2020 to FY-2029 CIP Funding Source
Current Project #
Amount Budgeted Prior to FY-20
Project Balance Jan 1, 2019
FY-20 to FY-29 Planned FY-20 Planned FY-21 Planned FY-22 Planned FY-23 Planned FY-24 Planned FY-25 Planned FY-26 Planned FY-27 Planned FY-28 Planned FY-29 Planned
45 Construction of New Raw Water Line with LCFWSA ILA 2 17W261 $1,700,000 $25,000,000 $25,000,000 $0 $0 $0 $0 $0 $0 $0 $0 $096 Rehab/Replace Aerial Raw Water Lines and Pilings 4 $0 $8,000,000 $100,000 $400,000 $7,500,000 $0 $0 $0 $0 $0 $0 $0
123 Sweeney WTP Treatment Enhancements 2, 6 18W009 $5,580,200 $44,300,000 $44,300,000 $0 $0 $0 $0 $0 $0 $0 $0 $0132 Sweeney WTP Filters 1-4 Rehabilitation 1 $0 $200,000 $0 $0 $0 $200,000 $0 $0 $0 $0 $0 $0133 Sweeney Generators #1 and #2 Replacement 1 $0 $4,000,000 $0 $0 $0 $0 $0 $0 $4,000,000 $0 $0 $0122 Richardson Raw Water Supply, Chemistry and Membranes 2 16W210 $500,000 $3,000,000 $300,000 $2,700,000 $0 $0 $0 $0 $0 $0 $0 $0100 Sweeney WTP Ozone Replacement 1 17W241 $1,686,000 $1,580,000 $0 $1,580,000 $0 $0 $0 $0 $0 $0 $0 $0
53 Elevated Tank Rehabilitation and Coatings 1 18W002 $1,000,000 $4,500,000 $0 $500,000 $500,000 $500,000 $500,000 $500,000 $500,000 $500,000 $500,000 $500,000
22 Comprehensive Meter Replacement Program 1 16W215 $18,280,000 $1,200,000 $200,000 $200,000 $200,000 $200,000 $200,000 $200,000 $0 $0 $0 $0134 Large Water Meter Vault Replacement 1 $0 $1,800,000 $300,000 $300,000 $300,000 $300,000 $300,000 $300,000 $0 $0 $0 $05 Interconnect Monterey Heights Water System to Surface Water 1 17W257 $2,675,000 $13,000,000 $0 $3,000,000 $0 $5,000,000 $2,000,000 $3,000,000 $0 $0 $0 $027 Find It, Fix It Methodology Water Replace and Rehab (AMP) 1 17W244 $1,200,000 $19,000,000 $0 $1,000,000 $1,000,000 $1,000,000 $3,000,000 $1,000,000 $3,000,000 $1,000,000 $4,000,000 $4,000,00024 Rehabilitation of Water Infrastructure Matching with City Streets 1 17W243 $1,137,234 $5,600,000 $200,000 $600,000 $600,000 $600,000 $600,000 $600,000 $600,000 $600,000 $600,000 $600,00057 Water Emergency Repair 1 16W223 $433,845 $2,000,000 $250,000 $250,000 $250,000 $250,000 $250,000 $250,000 $250,000 $250,000 $0 $094 Water Distribution Main Enhancements 1 18W005 $100,000 $1,200,000 $300,000 $0 $300,000 $0 $300,000 $0 $300,000 $0 $0 $018 Water Distribution Sample Stations 1 17W245 $420,000 $400,000 $200,000 $0 $200,000 $0 $0 $0 $0 $0 $0 $095 Cross Town Feeder Under Burnt Mill Creek Rehab/Replace 1 $0 $400,000 $50,000 $350,000 $0 $0 $0 $0 $0 $0 $0 $0
130 Water Services Rehabilitation or Replace 1 $0 $6,000,000 $0 $0 $0 $0 $0 $0 $0 $0 $3,000,000 $3,000,000
36 Water Meters for New Customers 1 17W247 $750,000 $2,500,000 $250,000 $250,000 $250,000 $250,000 $250,000 $250,000 $250,000 $250,000 $250,000 $250,000124 Northern Water Mains - Cost Recovery Project 1 17W264 $2,000,000 $4,000,000 $4,000,000 $0 $0 $0 $0 $0 $0 $0 $0 $039 Distribution System - Standard Developer Agreements 1 17W248 $800,000 $1,500,000 $150,000 $150,000 $150,000 $150,000 $150,000 $150,000 $150,000 $150,000 $150,000 $150,000
$38,262,279 $0 $149,180,000 $75,600,000 $11,280,000 $11,250,000 $8,450,000 $7,550,000 $6,250,000 $9,050,000 $2,750,000 $8,500,000 $8,500,000$29,200,000 $0 $85,550,000 $6,700,000 $10,350,000 $13,750,000 $7,750,000 $6,250,000 $13,750,000 $6,250,000 $7,250,000 $6,250,000 $7,250,000
$6,274,000 $0 $22,740,000 $2,640,000 $2,500,000 $2,500,000 $2,100,000 $5,500,000 $1,500,000 $1,500,000 $1,500,000 $1,500,000 $1,500,000$73,736,279 $0 $257,470,000 $84,940,000 $24,130,000 $27,500,000 $18,300,000 $19,300,000 $21,500,000 $16,800,000 $11,500,000 $16,250,000 $17,250,000
1 Pay-go Transfers $5,900,000 $8,180,000 $3,750,000 $8,450,000 $7,550,000 $6,250,000 $9,050,000 $2,750,000 $8,500,000 $8,500,0002 Bond Proceeds $61,272,836 $2,700,000 $0 $0 $0 $0 $0 $0 $0 $03 Grants $0 $0 $0 $0 $0 $0 $0 $0 $0 $04 SRF Loan Proceeds $100,000 $400,000 $7,500,000 $0 $0 $0 $0 $0 $0 $05 Contributions from Others $0 $0 $0 $0 $0 $0 $0 $0 $0 $06 Capital Reserves $8,327,164 $0 $0 $0 $0 $0 $0 $0 $0 $0
TOTAL WATER $75,600,000 $11,280,000 $11,250,000 $8,450,000 $7,550,000 $6,250,000 $9,050,000 $2,750,000 $8,500,000 $8,500,000
1 Pay-go Transfers $11,290,000 $21,030,000 $13,500,000 $18,300,000 $19,300,000 $21,500,000 $16,800,000 $11,500,000 $16,250,000 $17,250,0002 Bond Proceeds $65,222,836 $2,700,000 $0 $0 $0 $0 $0 $0 $0 $03 Grants $0 $0 $0 $0 $0 $0 $0 $0 $0 $04 SRF Loan Proceeds $100,000 $400,000 $14,000,000 $0 $0 $0 $0 $0 $0 $05 Contributions from Others $0 $0 $0 $0 $0 $0 $0 $0 $0 $06 Capital Reserves $8,327,164 $0 $0 $0 $0 $0 $0 $0 $0 $0
TOTAL $84,940,000 $24,130,000 $27,500,000 $18,300,000 $19,300,000 $21,500,000 $16,800,000 $11,500,000 $16,250,000 $17,250,000
Water Treatment Plant Improvements
Funding Source
Sum of All: Water, Waste Water and System Wide
Water Growth Projects
Water Capital Improvement Projects All dollar amounts are shown in 2019 dollars
Water Storage Improvements: Elevated, Ground and Aquifer Storage
Raw Water Improvements: Surface or Well Sources and Transmission
Total System Wide Capital Improvement ProjectsTotal Wastewater Capital Improvement ProjectsTotal Water Capital Improvement Projects
Proposed Total Capital Improvement Projects
Distribution System Upgrades and Rehabilitation
80

WASTE WATER: Projected 10 Year Capital Improvements Plan
Ref. # FY-2020 to FY-2029 CIP Funding Source
Current Project #
Amount Budgeted Prior to FY-20
Project Balance Jan 1, 2019
FY-20 to FY-29 Planned FY-20 Planned FY-21 Planned FY-22 Planned FY-23 Planned FY-24 Planned FY-25 Planned FY-26 Planned FY-27 Planned FY-28 Planned FY-29 Planned
131 Southside WWTP - Interim Rehabilitation Phase II 1 $0 $7,000,000 $0 $0 $0 $500,000 $0 $6,500,000 $0 $0 $0 $090 Northside WWTP - Enhancements, Upgrades and Generator Replacement 2 $100,000 $3,950,000 $3,950,000 $0 $0 $0 $0 $0 $0 $0 $0 $0
4 Find It, Fix It Methodology Sewer Collection Rehabilitation (AMP) 1 17S394 $10,500,000 $39,500,000 $1,500,000 $1,500,000 $1,500,000 $5,000,000 $5,000,000 $5,000,000 $5,000,000 $5,000,000 $5,000,000 $5,000,0001 Sewer Emergency Repair 1 17S393 $15,500,000 $5,000,000 $500,000 $500,000 $500,000 $500,000 $500,000 $500,000 $500,000 $500,000 $500,000 $500,000
23 Rehabilitation of Sewer Infrastructure Matching with City Streets 1 17S395 $1,400,000 $6,000,000 $600,000 $600,000 $600,000 $600,000 $600,000 $600,000 $600,000 $600,000 $600,000 $600,000
107 PS - 14 Greenfield Lake FM Replacement 4 18S004 $400,000 $6,500,000 $0 $0 $6,500,000 $0 $0 $0 $0 $0 $0 $055 PS - 69 Motts Creek Pump Station Upgrade 1 15S307 $400,000 $3,900,000 $0 $3,900,000 $0 $0 $0 $0 $0 $0 $0 $0126 Pump Stations Prioritization and Rehabilitation 1 $100,000 $5,000,000 $0 $1,000,000 $0 $1,000,000 $0 $1,000,000 $0 $1,000,000 $0 $1,000,000129 College Road Force Main Capacity in Chair Road Force Main 1 $0 $2,200,000 $0 $2,200,000 $0 $0 $0 $0 $0 $0 $0 $0135 Country Haven Force Main to Northside WWTP 1 $0 $5,000,000 $0 $500,000 $4,500,000 $0 $0 $0 $0 $0 $0 $0
38 Collection System - Standard Developer Agreements 1 17S399 $800,000 $1,500,000 $150,000 $150,000 $150,000 $150,000 $150,000 $150,000 $150,000 $150,000 $150,000 $150,000$29,200,000 $0 $85,550,000 $6,700,000 $10,350,000 $13,750,000 $7,750,000 $6,250,000 $13,750,000 $6,250,000 $7,250,000 $6,250,000 $7,250,000$38,262,279 $0 $149,180,000 $75,600,000 $11,280,000 $11,250,000 $8,450,000 $7,550,000 $6,250,000 $9,050,000 $2,750,000 $8,500,000 $8,500,000
$6,274,000 $0 $22,740,000 $2,640,000 $2,500,000 $2,500,000 $2,100,000 $5,500,000 $1,500,000 $1,500,000 $1,500,000 $1,500,000 $1,500,000$73,736,279 $0 $257,470,000 $84,940,000 $24,130,000 $27,500,000 $18,300,000 $19,300,000 $21,500,000 $16,800,000 $11,500,000 $16,250,000 $17,250,000
1 Pay-go Transfers $2,750,000 $10,350,000 $7,250,000 $7,750,000 $6,250,000 $13,750,000 $6,250,000 $7,250,000 $6,250,000 $7,250,0002 Bond Proceeds $3,950,000 $0 $0 $0 $0 $0 $0 $0 $0 $03 Grants $0 $0 $0 $0 $0 $0 $0 $0 $0 $04 SRF Loan Proceeds $0 $0 $6,500,000 $0 $0 $0 $0 $0 $0 $05 Contributions from Others $0 $0 $0 $0 $0 $0 $0 $0 $0 $06 Capital Reserves $0 $0 $0 $0 $0 $0 $0 $0 $0 $0
TOTAL WASTEWATER $6,700,000 $10,350,000 $13,750,000 $7,750,000 $6,250,000 $13,750,000 $6,250,000 $7,250,000 $6,250,000 $7,250,000
All dollar amounts are shown in 2019 dollars
Waste Water Treatment Plant Improvements
Collection System Rehabilitation/Replacement
Pump Station & Forcemain Improvements
Wastewater Capital Improvement Projects
Sewer Growth Projects
Funding Source
Total System Wide Capital Improvement Projects
Total Wastewater Capital Improvement ProjectsTotal Water Capital Improvement Projects
Proposed Total Capital Improvement Projects
81
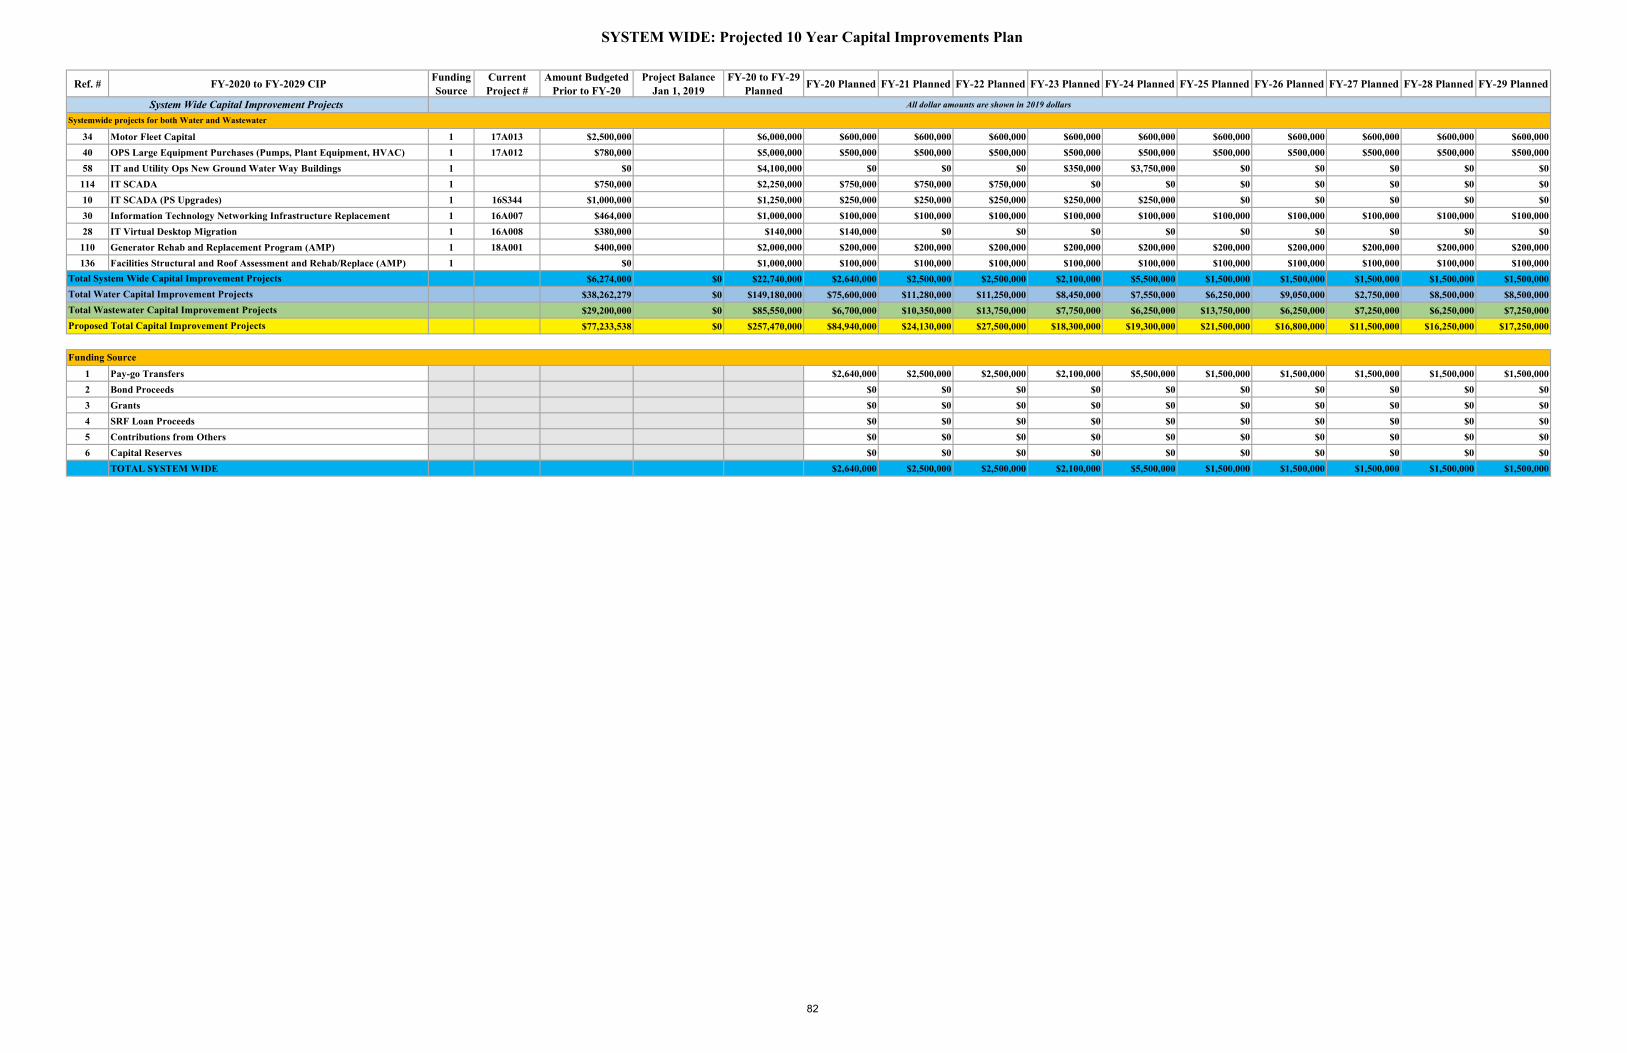
SYSTEM WIDE: Projected 10 Year Capital Improvements Plan
Ref. # FY-2020 to FY-2029 CIP Funding Source
Current Project #
Amount Budgeted Prior to FY-20
Project Balance Jan 1, 2019
FY-20 to FY-29 Planned FY-20 Planned FY-21 Planned FY-22 Planned FY-23 Planned FY-24 Planned FY-25 Planned FY-26 Planned FY-27 Planned FY-28 Planned FY-29 Planned
34 Motor Fleet Capital 1 17A013 $2,500,000 $6,000,000 $600,000 $600,000 $600,000 $600,000 $600,000 $600,000 $600,000 $600,000 $600,000 $600,00040 OPS Large Equipment Purchases (Pumps, Plant Equipment, HVAC) 1 17A012 $780,000 $5,000,000 $500,000 $500,000 $500,000 $500,000 $500,000 $500,000 $500,000 $500,000 $500,000 $500,00058 IT and Utility Ops New Ground Water Way Buildings 1 $0 $4,100,000 $0 $0 $0 $350,000 $3,750,000 $0 $0 $0 $0 $0
114 IT SCADA 1 $750,000 $2,250,000 $750,000 $750,000 $750,000 $0 $0 $0 $0 $0 $0 $010 IT SCADA (PS Upgrades) 1 16S344 $1,000,000 $1,250,000 $250,000 $250,000 $250,000 $250,000 $250,000 $0 $0 $0 $0 $030 Information Technology Networking Infrastructure Replacement 1 16A007 $464,000 $1,000,000 $100,000 $100,000 $100,000 $100,000 $100,000 $100,000 $100,000 $100,000 $100,000 $100,00028 IT Virtual Desktop Migration 1 16A008 $380,000 $140,000 $140,000 $0 $0 $0 $0 $0 $0 $0 $0 $0
110 Generator Rehab and Replacement Program (AMP) 1 18A001 $400,000 $2,000,000 $200,000 $200,000 $200,000 $200,000 $200,000 $200,000 $200,000 $200,000 $200,000 $200,000136 Facilities Structural and Roof Assessment and Rehab/Replace (AMP) 1 $0 $1,000,000 $100,000 $100,000 $100,000 $100,000 $100,000 $100,000 $100,000 $100,000 $100,000 $100,000
$6,274,000 $0 $22,740,000 $2,640,000 $2,500,000 $2,500,000 $2,100,000 $5,500,000 $1,500,000 $1,500,000 $1,500,000 $1,500,000 $1,500,000$38,262,279 $0 $149,180,000 $75,600,000 $11,280,000 $11,250,000 $8,450,000 $7,550,000 $6,250,000 $9,050,000 $2,750,000 $8,500,000 $8,500,000$29,200,000 $0 $85,550,000 $6,700,000 $10,350,000 $13,750,000 $7,750,000 $6,250,000 $13,750,000 $6,250,000 $7,250,000 $6,250,000 $7,250,000$77,233,538 $0 $257,470,000 $84,940,000 $24,130,000 $27,500,000 $18,300,000 $19,300,000 $21,500,000 $16,800,000 $11,500,000 $16,250,000 $17,250,000
1 Pay-go Transfers $2,640,000 $2,500,000 $2,500,000 $2,100,000 $5,500,000 $1,500,000 $1,500,000 $1,500,000 $1,500,000 $1,500,0002 Bond Proceeds $0 $0 $0 $0 $0 $0 $0 $0 $0 $03 Grants $0 $0 $0 $0 $0 $0 $0 $0 $0 $04 SRF Loan Proceeds $0 $0 $0 $0 $0 $0 $0 $0 $0 $05 Contributions from Others $0 $0 $0 $0 $0 $0 $0 $0 $0 $06 Capital Reserves $0 $0 $0 $0 $0 $0 $0 $0 $0 $0
TOTAL SYSTEM WIDE $2,640,000 $2,500,000 $2,500,000 $2,100,000 $5,500,000 $1,500,000 $1,500,000 $1,500,000 $1,500,000 $1,500,000
All dollar amounts are shown in 2019 dollars
Systemwide projects for both Water and Wastewater
Funding Source
Total Water Capital Improvement Projects
Proposed Total Capital Improvement Projects
System Wide Capital Improvement Projects
Total System Wide Capital Improvement Projects
Total Wastewater Capital Improvement Projects
82

Reference Number
Capital Project Current Project #
Amount Budgeted Prior to FY-20
Budgeted
FY-20 Budgeted
FY-21 to FY-29 Annual Planned
Total Cumulative Project Cost
Planned
Estimated Completion Fiscal Year
Quantifiable Annual Operating Budget Impact Expected
Unquantifiable Annual Operating Budget Impact
Expected
Annual Operating Budget Impact Comments
1 Sewer Emergency Repair 17S393 $15,500,000 $500,000 $4,500,000 $20,500,000 Annual Future Operating Budget Decrease Sewer Emergency Repairs reduce future operating costs by rapidly intervening and eliminating ongoing sanitary sewer spills and other emergency conditions.
4 Find It, Fix It Methodology Sewer Collection Rehabilitation (AMP) 17S394 $10,500,000 $1,500,000 $38,000,000 $50,000,000 Annual Future Operating Budget Decrease Rehabilitating sewer collection infrastructure reduces the operating costs of infiltration and inflow. This includes electricity costs, wear and tear on pumps and treatment chemical costs.
10 IT SCADA (PS Upgrades) 16S344 $1,000,000 $250,000 $1,000,000 $2,250,000 2019 Future Operating Budget Decrease Supervisory Control and Data Acquisition (SCADA) systems allow more efficient data collection at pump stations, potentially reducing the need for site visits by using automated means.
18 Water Distribution Sample Stations 17W245 $420,000 $200,000 $200,000 $820,000 2020 Future Operating Budget Decrease Installation of water distribution sample stations potentially reduces operating budget by providing CFPUA personnel locations to sample without the time and risk of entering customers homes.
22 Comprehensive Meter Replacement Program 16W215 $18,280,000 $200,000 $1,000,000 $19,480,000 Annual Future Operating Budget Decrease More accurate meter reads reduce the costs of mobilizing staff to re-read meters in question and reduces the chance that more water passes through the meter than is read by the device.
23 Rehabilitation of Sewer Infrastructure Matching with City Streets 17S395 $1,400,000 $600,000 $5,400,000 $7,400,000 Annual Future Operating Budget Decrease Rehabilitating sewer collection infrastructure reduces the operating costs of infiltration and inflow. This includes electricity costs, wear and tear on pumps and treatment chemical costs.
24 Rehabilitation of Water Infrastructure Matching with City Streets 17W243 $1,137,234 $200,000 $5,400,000 $6,737,234 Annual Future Operating Budget Decrease Rehabilitating water distribution infrastructure reduces the operating costs of water loss. This includes electricity costs, wear and tear on pumps and treatment chemical costs.
28 IT Virtual Desktop Migration 16A008 $380,000 $140,000 $0 $520,000 2019 Future Operating Budget Decrease Virtual Descktops are much easier for IT Staff to update and maintain than networked computers. Once the server is updated, all virtual desktops can be updated automatically.
30 Information Technology Networking Infrastructure Replacement 16A007 $464,000 $100,000 $900,000 $1,464,000 Annual Future Operating Budget Decrease IT Networking infrastructure is important to organizational efficiency. When networks fail, there are risks of cyber-crime, critical water and sewer failures and major operating inefficiencies.
34 Motor Fleet Capital 17A013 $2,500,000 $600,000 $5,400,000 $8,500,000 Annual Future Operating Budget Decrease When fleet vehicles break down while in operation, the cost to retrieve and repair the vehicles is far greater than the cost of ongoing maintenance and replacement.
36 Water Meters for New Customers 17W247 $750,000 $250,000 $2,250,000 $3,250,000 Annual Future Operating Budget Increase New customer accounts need meters to accurately bill for water received.
38 Collection System - Standard Developer Agreements 17S399 $800,000 $150,000 $1,350,000 $2,300,000 Annual Future Operating Budget Decrease Investments by CFPUA in developer installed infrastructure typically reduce future operating budgets by right-sizing infrastructure for additional future customers.
39 Distribution System - Standard Developer Agreements 17W248 $800,000 $150,000 $1,350,000 $2,300,000 Annual Future Operating Budget Decrease Investments by CFPUA in developer installed infrastructure typically reduce future operating budgets by right-sizing infrastructure for additional future customers.
40 OPS Large Equipment Purchases (Pumps, Plant Equipment, HVAC) 17A012 $780,000 $500,000 $4,500,000 $5,780,000 Annual Future Operating Budget Decrease Rebuilding or replacing large equipment reduces the operating costs of inefficient components. This includes electricity costs, maintenance costs of old equipment and downtime.
45 Construction of New Raw Water Line with LCFWSA ILA 17W261 $1,700,000 $25,000,000 $0 $26,700,000 2021 Future Operating Budget Decrease CFPUA's agreement with LCFWSA allows CFPUA to purchase raw water at a relatively low cost compared to constructing, owning and operating redundant infrastructure to LCFWSA.
57 Water Emergency Repair 16W223 $433,845 $250,000 $1,750,000 $2,433,845 Annual Future Operating Budget Decrease Water Emergency Repairs reduce future operating costs by rapidly intervening and eliminating ongoing sanitary sewer spills and other emergency conditions.
90 Northside WWTP - Enhancements, Upgrades and Generator Replacement $100,000 $3,950,000 $0 $4,050,000 2022 Future Operating Budget Decrease Replacement and improvements to major components at Northside WWTP increase efficiency and decrease operating costs.
94 Water Distribution Main Enhancements 18W005 $100,000 $300,000 $900,000 $1,300,000 2018 Future Operating Budget Decrease Water distribution main enhancements that eliminate dead ends, reduces the need for system flushing and reduces operating costs.
95 Cross Town Feeder Under Burnt Mill Creek Rehab/Replace $0 $50,000 $350,000 $400,000 2022 Future Operating Budget Decrease This project rehabilitates existing infrastructure that is at the end of its lifecycle. Reducing the risk of failure and the operating costs of responding to an emergency decreases future operating costs.
96 Rehab/Replace Aerial Raw Water Lines and Pilings $0 $100,000 $7,900,000 $8,000,000 Annual Future Operating Budget Decrease This project rehabilitates existing infrastructure that is at the end of its lifecycle. Reducing the risk of failure and the operating costs of responding to an emergency decreases future operating costs.
110 Generator Rehab and Replacement Program (AMP) 18A001 $400,000 $200,000 $1,800,000 $2,400,000 Annual Future Operating Budget Decrease This project rehabilitates existing infrastructure that is at the end of its lifecycle. Reducing the risk of failure and the operating costs of responding to an emergency decreases future operating costs.
114 IT SCADA (Wonderware) $750,000 $750,000 $1,500,000 $3,000,000 2023 Future Operating Budget Decrease The current software is no longer supported by its supplier. This project upgrades the software and reduces staff time and other operating costs to support the system.
All dollar amounts are shown in 2015 dollars. No adjustments are made for projected inflation or deflation.
PROJECTED OPERATING BUDGET IMPACTS FROM FY 2020 CIP
83

Reference Number
Capital Project Current Project #
Amount Budgeted Prior to FY-20
Budgeted
FY-20 Budgeted
FY-21 to FY-29 Annual Planned
Total Cumulative Project Cost
Planned
Estimated Completion Fiscal Year
Quantifiable Annual Operating Budget Impact Expected
Unquantifiable Annual Operating Budget Impact
Expected
Annual Operating Budget Impact Comments
All dollar amounts are shown in 2015 dollars. No adjustments are made for projected inflation or deflation.122 Richardson Raw Water Supply, Chemistry and Membranes 16W210 $500,000 $300,000 $2,700,000 $3,500,000 2022 Future Operating Budget Decrease Current membrane performance has degraded and requires frequent cleaning and
chemistry adjustments. New membranes with improved supply and stable water chemistry will result in savings.
123 Sweeney WTP Treatment Enhancements 18W009 $5,580,200 $44,300,000 $0 $49,880,200 2022 Operating Budget Increase Of $2.9 Million Per Year Starting In 2022
This project will increase operating budget due to increased operating and maintenance costs plus annual consumable costs for granular activated carbon media.
124 Northern Water Mains - Cost Recovery Project $2,000,000 $4,000,000 $0 $6,000,000 2021 Future Operating Budget Increase Since this project increases the amount of infrastructure that needs to be maintained, it will increase operating budget. However, revenues from new customers will help offset this.
134 Large Water Meter Vault Replacement $0 $300,000 $1,500,000 $1,800,000 2026 Future Operating Budget Decrease Current condition of large water meter vaults is poor. This project will replace this infrastructure, reducing the operating cost of frequent repair and risk of injury to the staff and public.
136 Facilities Structural and Roof Assessment and Rehab/Replace (AMP) $0 $100,000 $900,000 $1,000,000 2030 Future Operating Budget Decrease This project will rehab and replace this infrastructure, reducing the operating cost of frequent repairs and risk of failure potentially resulting in more damage and need for emergency response.
TOTAL CAPITAL IMPROVEMENT PROJECTS $66,280,000 $84,940,000 $90,550,000 $241,765,279
*These growth projects will have substantial capital cost recovery from new customers or other stakeholders. The entire project amount is programmed to allow construction prior to cost recovery.
84

Fiscal Year 2019-2020 Budget Cape Fear Public Utility Authority
LONG-TERM FINANCIAL MANAGEMENT
Consistent with its strategic plan, the Authority seeks to protect the environment, ensure public health and safety, and provide the highest quality services to both new and existing customers while maintaining a stable financial position that balances rates and the organization’s long-term capital and operating needs. Balancing these objectives presents both challenges and opportunities. Long-term financial planning is a critical tool in developing strategies to ensure that this balance is maintained. Long-term financial planning is the process of aligning financial capacity with long-term service objectives. Financial planning uses forecasts to provide insight into future financial capacity so that strategies can be developed to achieve long-term sustainability considering service objectives and financial challenges. The development of the Authority’s 20-year financial plan is an iterative, multi-departmental process and ultimately guided by the Authority’s adopted policies and key benchmarks. The goal of this process is to ensure that the Authority remains both operationally and financially sustainable while minimizing the impact to ratepayers. With this goal in mind, the Authority’s long-term financial plan seeks to optimize the balance among efficient and effective service delivery; strategic capital investment to address the riskiest infrastructure and facilitate growth and economic development; key financial metrics including debt service coverage and liquidity; and rate affordability. Operational Sustainability Operational sustainability means that high-quality service will continue to be delivered to customers over the long-term. This notion not only includes providing water and wastewater treatment, distribution, collection, customer service, engineering, and compliance services but also that the Authority makes sufficient, deliberate capital investments to minimize the risk of infrastructure failure and service disruption. The operating expenditure projections incorporated in the Authority’s long-term financial plan were developed with the goals of fully funding operating and maintenance costs at current levels plus inflation; retaining and attracting high-quality staff through competitive salaries and benefits; and executing a capital program focused on rehabilitating and replacing aging, high-risk infrastructure and other major projects. Capital expenditure projections are based on the Authority’s Ten-Year Capital Improvement Program, which is developed using risk-based analyses to plan the extent and timing of water and wastewater system improvements. Capital expenditures throughout the 20-year time horizon include scheduled replacement and rehabilitation of water and wastewater system assets of approximately $18 million per year. Projected capital expenditures through FY 22-23 include several large projects that will be debt funded through the issuance of revenue bonds or the state revolving loans totaling approximately $83 million. These projects include the construction of a new raw water transmission line from the King’s Bluff intake station to Brunswick County’s water treatment; upgrades to the Sweeney Water Treatment plant to remove PFAS and other emerging contaminants from finished drinking water; the replacement of aerial raw water transmission main pilings; and the replacement of Pump Station 14. Projected capital expenditures also include $145 million for a large capacity upgrade to the Southside Wastewater Treatment Plant in FY 36-37 through FY 38-39.
85

Fiscal Year 2019-2020 Budget Cape Fear Public Utility Authority
LONG-TERM FINANCIAL MANAGEMENT
$0
$10,000,000
$20,000,000
$30,000,000
$40,000,000
$50,000,000
$60,000,000
$70,000,000
20202025
20302035
2040
Projected Capital Expenditures by Funding Source
Water/Wastewater Rates Capital Reserves Revenue Bonds State Revolving Loans Grants
$0
$20,000,000
$40,000,000
$60,000,000
$80,000,000
$100,000,000
$120,000,000
$140,000,000
20202025
20302035
2040
Projected Operating Expenditures by Category
Salaries & Benefits Operating & Maintenance Debt Service Transfers to Capital Projects Funds
86

Fiscal Year 2019-2020 Budget Cape Fear Public Utility Authority
LONG-TERM FINANCIAL MANAGEMENT
Operating expenditures, excluding debt service expenditures, were assumed to grow in accordance with inflationary assumptions. Salaries and benefits (other than health and dental benefits) are assumed to grow at 4% per year to accommodate growth in the workforce tied to customer and system growth and cost-of-living and merit-based increases. Health and dental benefits are assumed to grow at 8%, while all other operating costs are assumed to grow at 2% per year. Projected operating expenditures include $1.3 million in FY 20-21 to replace filter media at the Sweeney Water Treatment Plant prior to the treatment enhancements becoming operational in FY 21-22 at which point operating expenditures include $2.9 million for filter media maintenance and replacement every year. Debt service expenditures are based on existing amortization schedules for outstanding debt. Debt service related to planned future debt issuance was based on the Authority’s historical borrowing rate, maturities on existing debt, and amortized with level payments for principal and interest. Financial Sustainability In addition to delivering and executing these services and projects, the Authority’s long-term financial plan is focused on achieving the budgetary flexibility resulting from high levels of debt service coverage and liquidity. Further, maintaining debt service coverage and liquidity at high levels is viewed positively by credit markets and helps to ensure that the Authority continues borrowing at low costs. The Authority’s long-term financial plan incorporates the Authority’s policy on debt limitations and cash reserve levels. These policies were adopted in February 2017 to produce a resilient financial structure by reducing the proportion of the annual operating budget reserved for mandatory debt service payments, “free up” future borrowing capacity, and achieve robust coverage levels expected of the highest rated water and wastewater utilities. In accordance with these policies, rates were deliberately increased over the past two fiscal years to achieve $18 million in annual pay-as-you-go capital funding. The Authority planned to achieve this level of funding in FY 19-20. However, the presence of PFAS in biosolid residuals has resulted in a change to how this material is disposed. Biosolids will be hauled to a land fill rather than be applied to farmland in surrounding counties. This change is projected to increase disposal costs by $1.5 million. In FY 19-20 this additional cost will be funded by reductions to annual pay-as-you-go funded capital investment from $18 million to $16.5 million. Debt is a critical capital financing mechanism that provides an immediate funding source and allows for the gradual pay-back of borrowed funds in the future. Debt, however, can be excessive when annual debt service requirements grow to levels that cause rates to increase to unaffordable levels or force cuts to services in the absence of rate increases. The Authority’s debt management policy is focused on maintaining the balance between debt funding, rate affordability, and operational sustainability by placing limits on debt issuance. The Authority’s debt management policy explicitly limits debt in two ways. First, the policy provides specific attributes that projects should generally have to be candidates for debt funding (e.g. for high-dollar projects where pay-go funding is impractical or for growth-oriented projects in which it makes sense for future rate payers to pay for those improvements). Second, the policy establishes a debt limit expressed in terms of the debt-to-capitalization ratio (debt outstanding as a percentage of the value of capital assets). The Authority may not issue debt if such issuance would cause the debt to capitalization ratio to exceed 45%. Measuring the Authority’s debt load using the debt-to-capitalization is an
87

Fiscal Year 2019-2020 Budget Cape Fear Public Utility Authority
LONG-TERM FINANCIAL MANAGEMENT
appropriate way to quantify the Authority’s debt load because the ratio reflects the Authority’s long-term mix of debt and pay-as-you-go funding. The policy debt metric limit of 45% was derived considering the Authority’s debt service coverage target and its expectation of long-term borrowing costs.
The debt-to-capitalization ratio is projected to be 41.7% due to the planned issuance of approximately $70 million in revenue bonds to fund enhancements to the Sweeney Water Treatment Plant for the removal of PFAS and other emerging contaminants and the replacement of the Authority’s raw water transmission line. The debt-to-capitalization ratio is projected to decrease through FY 33-34 as no new debt is projected to be issued and projected capital investment outpaces projected depreciation on system assets. The debt-to-capitalization ratio is projected to increase to 30.7% in FY 34-35 due to the planned issuance of debt to fund a capacity upgrade for the Southside Wastewater Treatment Plant. Debt service coverage measures an entity’s ability to pay principal and interest on its debt obligations with current year revenues. Debt service coverage more than 1.0 indicates that net operating revenues (revenues minus operating expenses) were greater than the principal and interest due during the period. Financial structures that provide for relatively high debt service coverage ratios are valued by credit markets – the higher the debt service coverage ratio, the more assurance that debt service requirements will be met. The Authority is required to structure its rates so that revenues in any given year are equal to at least 1.2 times of the principal and interest due on its outstanding debt obligations. However, credit markets and raters generally prefer higher debt service coverage ratios. The Authority’s debt service coverage target is 1.6.
0.0%
5.0%
10.0%
15.0%
20.0%
25.0%
30.0%
35.0%
40.0%
45.0%
50.0%
2020 2025 2030 2035 2040
Deb
t to
Cap
ital
izat
ion
Rat
io (
%)
Fiscal Year
Projected Debt to Capitalization Ratio
Projected Debt to Capitalization Ratio Debt Limit (45%)
88

Fiscal Year 2019-2020 Budget Cape Fear Public Utility Authority
LONG-TERM FINANCIAL MANAGEMENT
The graph above indicates that coverage is projected to be relatively stable through FY 33-34. Projected coverage increase rapidly through FY 39-40 to 2.11 as existing debt is fully retired which outpaces increases in debt service related to the issuance of debt to fund the capacity upgrade for the Southside Wastewater Treatment Plant.
1.00
1.20
1.40
1.60
1.80
2.00
2.20
2020 2025 2030 2035 2040
Deb
t to
Cap
ital
izat
ion
Rat
io
Fiscal Year
Projected Debt Service Coverage
Debt Service Coverage Policy Target (1.60)
$40,000,000
$45,000,000
$50,000,000
$55,000,000
$60,000,000
$65,000,000
$70,000,000
$75,000,000
$80,000,000
$85,000,000
$90,000,000
2020 2025 2030 2035 2040
Fiscal Year
Projected Fund Balance
Projected Fund Balance Fund Balance Target ($50 million)
89
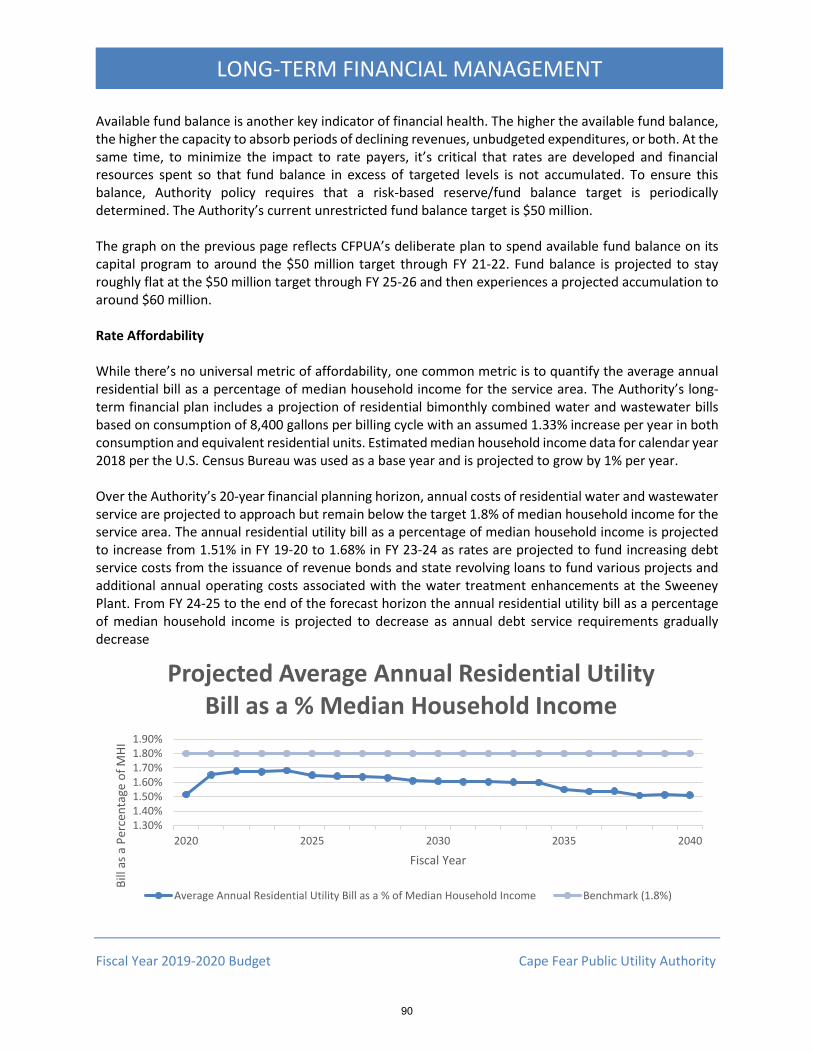
Fiscal Year 2019-2020 Budget Cape Fear Public Utility Authority
LONG-TERM FINANCIAL MANAGEMENT
Available fund balance is another key indicator of financial health. The higher the available fund balance, the higher the capacity to absorb periods of declining revenues, unbudgeted expenditures, or both. At the same time, to minimize the impact to rate payers, it’s critical that rates are developed and financial resources spent so that fund balance in excess of targeted levels is not accumulated. To ensure this balance, Authority policy requires that a risk-based reserve/fund balance target is periodically determined. The Authority’s current unrestricted fund balance target is $50 million. The graph on the previous page reflects CFPUA’s deliberate plan to spend available fund balance on its capital program to around the $50 million target through FY 21-22. Fund balance is projected to stay roughly flat at the $50 million target through FY 25-26 and then experiences a projected accumulation to around $60 million. Rate Affordability While there’s no universal metric of affordability, one common metric is to quantify the average annual residential bill as a percentage of median household income for the service area. The Authority’s long-term financial plan includes a projection of residential bimonthly combined water and wastewater bills based on consumption of 8,400 gallons per billing cycle with an assumed 1.33% increase per year in both consumption and equivalent residential units. Estimated median household income data for calendar year 2018 per the U.S. Census Bureau was used as a base year and is projected to grow by 1% per year. Over the Authority’s 20-year financial planning horizon, annual costs of residential water and wastewater service are projected to approach but remain below the target 1.8% of median household income for the service area. The annual residential utility bill as a percentage of median household income is projected to increase from 1.51% in FY 19-20 to 1.68% in FY 23-24 as rates are projected to fund increasing debt service costs from the issuance of revenue bonds and state revolving loans to fund various projects and additional annual operating costs associated with the water treatment enhancements at the Sweeney Plant. From FY 24-25 to the end of the forecast horizon the annual residential utility bill as a percentage of median household income is projected to decrease as annual debt service requirements gradually decrease
1.30%1.40%1.50%1.60%1.70%1.80%1.90%
2020 2025 2030 2035 2040
Bill
as
a P
erce
nta
ge o
f M
HI
Fiscal Year
Projected Average Annual Residential Utility Bill as a % Median Household Income
Average Annual Residential Utility Bill as a % of Median Household Income Benchmark (1.8%)
90

Fiscal Year 2019-2020 Budget Cape Fear Public Utility Authority
LONG-TERM FINANCIAL MANAGEMENT
Conclusion Ensuring that the Authority continues to provide high-quality water and wastewater service to its customers, remains in a strong financial position, and minimizes the impact to customers requires a careful balance. Long-term financial planning is an important tool that the Authority uses to maintain this balance in a proactive manner. Guided by financial policies, the Authority’s long-term financial plan fully funds operations at current levels plus inflation and funds an aggressive capital program focused on rehabilitating and replacing aging infrastructure. At the same time, target levels of debt, debt service coverage, and liquidity are projected to be attained while keeping the cost of service affordable for customers.
91

2020 2021 2022 2023 2024 2025 2026 2027 2028 2029
Adopted Projected Projected Projected Projected Projected Projected Projected Projected Projected
Budget Budget Budget Budget Budget Budget Budget Budget Budget BudgetOperating Activities
Revenues 85,554,722$ 94,084,611$ 97,197,721$ 98,805,908$ 101,367,232$ 101,730,591$ 103,493,016$ 105,318,054$ 107,218,259$ 108,277,928$
Expenditures, before Debt Service & Capital Outlay 46,629,240 49,432,447 52,621,045 54,304,402 56,054,182 57,873,590 59,702,625 61,600,665 63,570,799 65,616,281 Revenues over Expenditures before Debt Service &
Capital Outlay 38,925,482 44,652,164 44,576,676 44,501,506 45,313,050 43,857,001 43,790,391 43,717,389 43,647,460 42,661,647
Debt Service on Existing Debt 22,425,482 22,376,082 22,300,593 22,225,423 22,160,856 20,704,807 20,638,197 20,565,195 20,495,266 19,509,453
Debt Service on Planned Future Debt - 4,276,083 4,276,083 4,276,083 5,152,194 5,152,194 5,152,194 5,152,194 5,152,194 5,152,194
Total Estimated Debt Service 22,425,482 26,652,164 26,576,676 26,501,506 27,313,050 25,857,001 25,790,391 25,717,389 25,647,460 24,661,647
Revenue Available to Fund Capital Expenditures 16,500,000 18,000,000 18,000,000 18,000,000 18,000,000 18,000,000 18,000,000 18,000,000 18,000,000 18,000,000
Capital Investment
Capital Funding Sources:
Current Year Revenues 16,500,000 18,000,000 18,000,000 18,000,000 18,000,000 18,000,000 18,000,000 18,000,000 18,000,000 18,000,000
Available Fund Balance 8,261,525 13,771,525 18,271,525 (390,000) (966,667) 1,700,000 1,200,000 (1,400,000) (3,150,000) (3,000,000)
Capital Reserves 3,652,164 4,675,000 - - - - - - - -
Revenue Bonds 14,256,169 26,833,333 26,833,334 - - - - - - -
State Revolving Loans 2,750,809 400,000 7,000,000 7,000,000 - - - - - -
Grants 5,699,607 5,174,607 - - - - - - - -
Total Capital Funding 51,120,273 68,854,465 70,104,859 24,610,000 17,033,333 19,700,000 19,200,000 16,600,000 14,850,000 15,000,000
Total Capital Expenditures 51,120,273 68,854,465 70,104,859 24,610,000 17,033,333 19,700,000 19,200,000 16,600,000 14,850,000 15,000,000
Capital Asset Balance as of 6/30 743,624,966 786,385,519 828,643,844 824,792,060 812,937,776 803,257,660 792,597,543 778,922,426 763,126,059 747,104,692
Financial Benchmarks
Affordability:
Average Residential Bi-monthly Water & Sewer Bill $129.32 $142.40 $146.12 $147.15 $149.39 $148.12 $149.01 $149.93 $150.84 $150.44% Change in Average Residential Bi-monthly Water and
Sewer Bill 0.00% 10.11% 2.61% 0.71% 1.52% -0.85% 0.60% 0.62% 0.61% -0.26%
Annual Utility Bill as % of Effective Buying Income (<1.8%) 1.51% 1.65% 1.68% 1.67% 1.68% 1.65% 1.64% 1.64% 1.63% 1.61%
Median Household Income (1% per year growth) $51,232 $51,744 $52,262 $52,784 $53,312 $53,845 $54,384 $54,928 $55,477 $56,032
Liquidity:
Unrestricted Fund Balance as of 6/30 (appr. $50,000,000) $83,702,405 $69,930,881 $51,659,356 $52,049,356 $53,016,023 $51,316,023 $50,116,023 $51,516,023 $54,666,023 $57,666,023
Days Cash on Hand (>250) 655 516 358 350 345 324 306 305 314 321
Coverage:
Debt Coverage Ratio (>1.6) 1.71 1.66 1.66 1.66 1.64 1.68 1.68 1.68 1.68 1.71
Debt:
Debt Balance as of 6/30 $309,631,002 $294,951,089 $279,678,294 $278,297,223 $261,175,153 $244,832,412 $227,884,113 $210,312,264 $192,084,765 $174,070,404
Debt to Capitalization Ratio (Cannot exceed 45%) 41.6% 37.5% 33.8% 33.7% 32.1% 30.5% 28.8% 27.0% 25.2% 23.3%
Available Debt Capacity $25,000,233.19 $58,922,394.73 $93,211,435.33 $92,859,204.11 $104,646,846.73 $116,633,534.75 $128,784,780.89 $140,202,827.18 $151,321,961.26 $162,126,707.94
Fiscal Year 2019-2020 Budget Cape Fear Public Utility Authority
20-Year Projection of Operating and Capital Expenditures
LONG TERM FINANCIAL MANAGEMENT
92
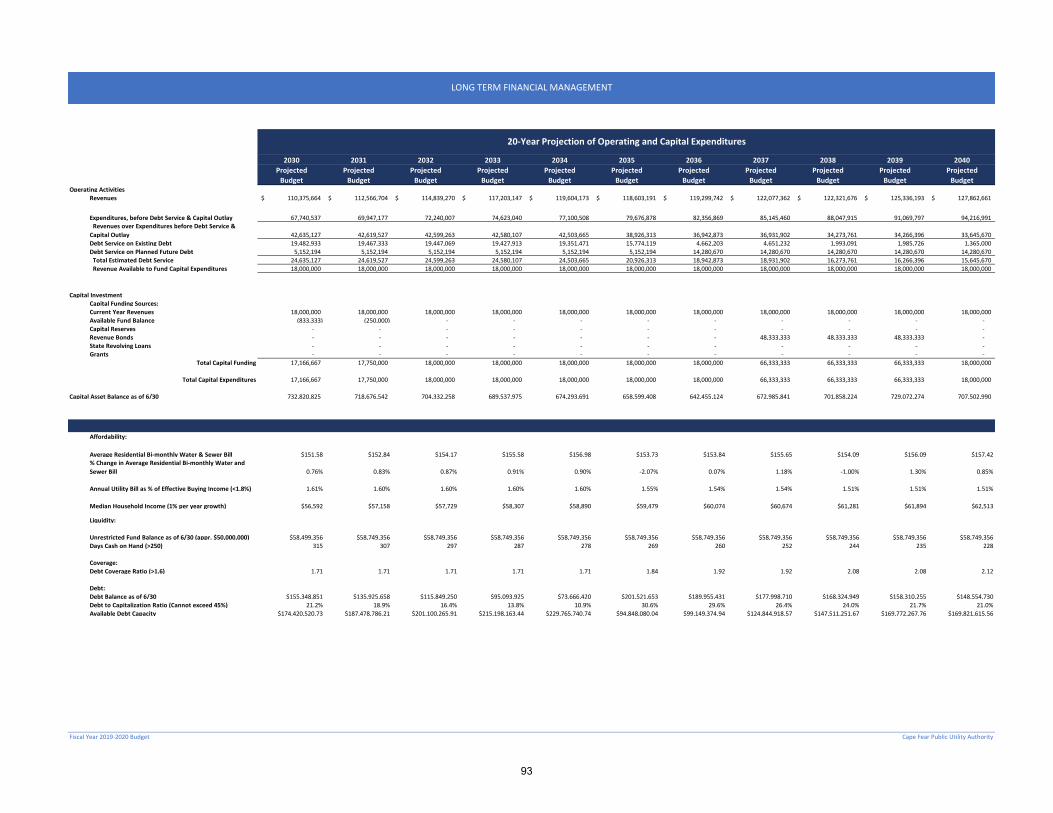
2030 2031 2032 2033 2034 2035 2036 2037 2038 2039 2040
Projected Projected Projected Projected Projected Projected Projected Projected Projected Projected Projected
Budget Budget Budget Budget Budget Budget Budget Budget Budget Budget BudgetOperating Activities
Revenues 110,375,664$ 112,566,704$ 114,839,270$ 117,203,147$ 119,604,173$ 118,603,191$ 119,299,742$ 122,077,362$ 122,321,676$ 125,336,193$ 127,862,661$
Expenditures, before Debt Service & Capital Outlay 67,740,537 69,947,177 72,240,007 74,623,040 77,100,508 79,676,878 82,356,869 85,145,460 88,047,915 91,069,797 94,216,991 Revenues over Expenditures before Debt Service &
Capital Outlay 42,635,127 42,619,527 42,599,263 42,580,107 42,503,665 38,926,313 36,942,873 36,931,902 34,273,761 34,266,396 33,645,670
Debt Service on Existing Debt 19,482,933 19,467,333 19,447,069 19,427,913 19,351,471 15,774,119 4,662,203 4,651,232 1,993,091 1,985,726 1,365,000
Debt Service on Planned Future Debt 5,152,194 5,152,194 5,152,194 5,152,194 5,152,194 5,152,194 14,280,670 14,280,670 14,280,670 14,280,670 14,280,670
Total Estimated Debt Service 24,635,127 24,619,527 24,599,263 24,580,107 24,503,665 20,926,313 18,942,873 18,931,902 16,273,761 16,266,396 15,645,670
Revenue Available to Fund Capital Expenditures 18,000,000 18,000,000 18,000,000 18,000,000 18,000,000 18,000,000 18,000,000 18,000,000 18,000,000 18,000,000 18,000,000
Capital Investment
Capital Funding Sources:
Current Year Revenues 18,000,000 18,000,000 18,000,000 18,000,000 18,000,000 18,000,000 18,000,000 18,000,000 18,000,000 18,000,000 18,000,000
Available Fund Balance (833,333) (250,000) - - - - - - - - -
Capital Reserves - - - - - - - - - - -
Revenue Bonds - - - - - - - 48,333,333 48,333,333 48,333,333 -
State Revolving Loans - - - - - - - - - - -
Grants - - - - - - - - - - -
Total Capital Funding 17,166,667 17,750,000 18,000,000 18,000,000 18,000,000 18,000,000 18,000,000 66,333,333 66,333,333 66,333,333 18,000,000
Total Capital Expenditures 17,166,667 17,750,000 18,000,000 18,000,000 18,000,000 18,000,000 18,000,000 66,333,333 66,333,333 66,333,333 18,000,000
Capital Asset Balance as of 6/30 732,820,825 718,676,542 704,332,258 689,537,975 674,293,691 658,599,408 642,455,124 672,985,841 701,858,224 729,072,274 707,502,990
Affordability:
Average Residential Bi-monthly Water & Sewer Bill $151.58 $152.84 $154.17 $155.58 $156.98 $153.73 $153.84 $155.65 $154.09 $156.09 $157.42% Change in Average Residential Bi-monthly Water and
Sewer Bill 0.76% 0.83% 0.87% 0.91% 0.90% -2.07% 0.07% 1.18% -1.00% 1.30% 0.85%
Annual Utility Bill as % of Effective Buying Income (<1.8%) 1.61% 1.60% 1.60% 1.60% 1.60% 1.55% 1.54% 1.54% 1.51% 1.51% 1.51%
Median Household Income (1% per year growth) $56,592 $57,158 $57,729 $58,307 $58,890 $59,479 $60,074 $60,674 $61,281 $61,894 $62,513
Liquidity:
Unrestricted Fund Balance as of 6/30 (appr. $50,000,000) $58,499,356 $58,749,356 $58,749,356 $58,749,356 $58,749,356 $58,749,356 $58,749,356 $58,749,356 $58,749,356 $58,749,356 $58,749,356
Days Cash on Hand (>250) 315 307 297 287 278 269 260 252 244 235 228
Coverage:
Debt Coverage Ratio (>1.6) 1.71 1.71 1.71 1.71 1.71 1.84 1.92 1.92 2.08 2.08 2.12
Debt:
Debt Balance as of 6/30 $155,348,851 $135,925,658 $115,849,250 $95,093,925 $73,666,420 $201,521,653 $189,955,431 $177,998,710 $168,324,949 $158,310,255 $148,554,730
Debt to Capitalization Ratio (Cannot exceed 45%) 21.2% 18.9% 16.4% 13.8% 10.9% 30.6% 29.6% 26.4% 24.0% 21.7% 21.0%
Available Debt Capacity $174,420,520.73 $187,478,786.21 $201,100,265.91 $215,198,163.44 $229,765,740.74 $94,848,080.04 $99,149,374.94 $124,844,918.57 $147,511,251.67 $169,772,267.76 $169,821,615.56
Fiscal Year 2019-2020 Budget Cape Fear Public Utility Authority
LONG TERM FINANCIAL MANAGEMENT
20-Year Projection of Operating and Capital Expenditures
93
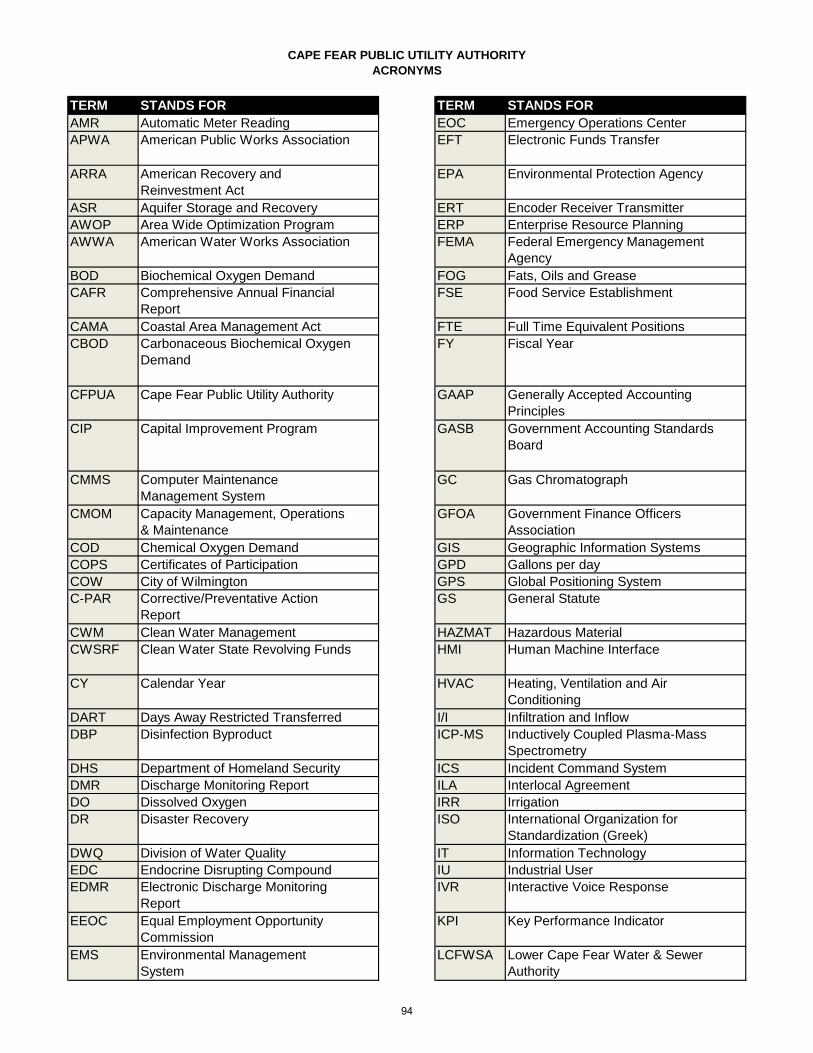
CAPE FEAR PUBLIC UTILITY AUTHORITY
ACRONYMS
TERM STANDS FOR TERM STANDS FOR
AMR Automatic Meter Reading EOC Emergency Operations Center
APWA American Public Works Association EFT Electronic Funds Transfer
ARRA American Recovery and
Reinvestment Act
EPA Environmental Protection Agency
ASR Aquifer Storage and Recovery ERT Encoder Receiver Transmitter
AWOP Area Wide Optimization Program ERP Enterprise Resource Planning
AWWA American Water Works Association FEMA Federal Emergency Management
Agency
BOD Biochemical Oxygen Demand FOG Fats, Oils and Grease
CAFR Comprehensive Annual Financial
Report
FSE Food Service Establishment
CAMA Coastal Area Management Act FTE Full Time Equivalent Positions
CBOD Carbonaceous Biochemical Oxygen
Demand
FY Fiscal Year
CFPUA Cape Fear Public Utility Authority GAAP Generally Accepted Accounting
Principles
CIP Capital Improvement Program GASB Government Accounting Standards
Board
CMMS Computer Maintenance
Management System
GC Gas Chromatograph
CMOM Capacity Management, Operations
& Maintenance
GFOA Government Finance Officers
Association
COD Chemical Oxygen Demand GIS Geographic Information Systems
COPS Certificates of Participation GPD Gallons per day
COW City of Wilmington GPS Global Positioning System
C‐PAR Corrective/Preventative Action
Report
GS General Statute
CWM Clean Water Management HAZMAT Hazardous Material
CWSRF Clean Water State Revolving Funds HMI Human Machine Interface
CY Calendar Year HVAC Heating, Ventilation and Air
Conditioning
DART Days Away Restricted Transferred I/I Infiltration and Inflow
DBP Disinfection Byproduct ICP‐MS Inductively Coupled Plasma‐Mass
Spectrometry
DHS Department of Homeland Security ICS Incident Command System
DMR Discharge Monitoring Report ILA Interlocal Agreement
DO Dissolved Oxygen IRR Irrigation
DR Disaster Recovery ISO International Organization for
Standardization (Greek)
DWQ Division of Water Quality IT Information Technology
EDC Endocrine Disrupting Compound IU Industrial User
EDMR Electronic Discharge Monitoring
Report
IVR Interactive Voice Response
EEOC Equal Employment Opportunity
Commission
KPI Key Performance Indicator
EMS Environmental Management
System
LCFWSA Lower Cape Fear Water & Sewer
Authority
94
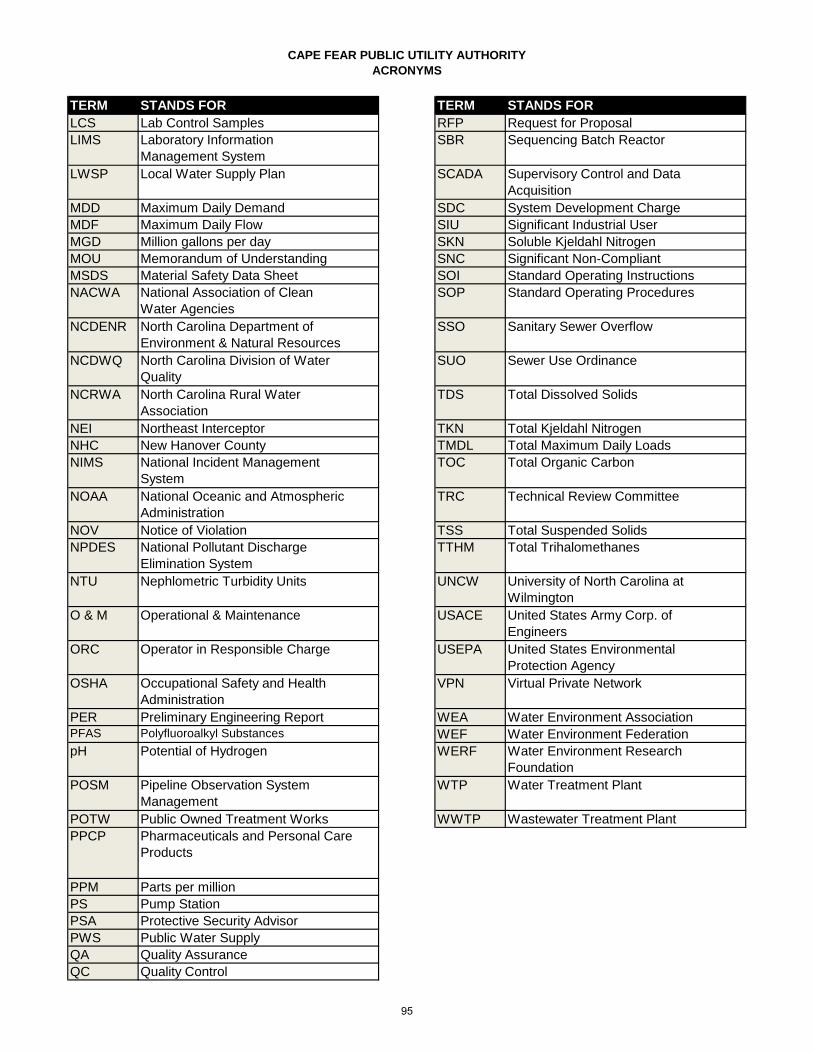
CAPE FEAR PUBLIC UTILITY AUTHORITY
ACRONYMS
TERM STANDS FOR TERM STANDS FOR
LCS Lab Control Samples RFP Request for Proposal
LIMS Laboratory Information
Management System
SBR Sequencing Batch Reactor
LWSP Local Water Supply Plan SCADA Supervisory Control and Data
Acquisition
MDD Maximum Daily Demand SDC System Development Charge
MDF Maximum Daily Flow SIU Significant Industrial User
MGD Million gallons per day SKN Soluble Kjeldahl Nitrogen
MOU Memorandum of Understanding SNC Significant Non‐Compliant
MSDS Material Safety Data Sheet SOI Standard Operating Instructions
NACWA National Association of Clean
Water Agencies
SOP Standard Operating Procedures
NCDENR North Carolina Department of
Environment & Natural Resources
SSO Sanitary Sewer Overflow
NCDWQ North Carolina Division of Water
Quality
SUO Sewer Use Ordinance
NCRWA North Carolina Rural Water
Association
TDS Total Dissolved Solids
NEI Northeast Interceptor TKN Total Kjeldahl Nitrogen
NHC New Hanover County TMDL Total Maximum Daily Loads
NIMS National Incident Management
System
TOC Total Organic Carbon
NOAA National Oceanic and Atmospheric
Administration
TRC Technical Review Committee
NOV Notice of Violation TSS Total Suspended Solids
NPDES National Pollutant Discharge
Elimination System
TTHM Total Trihalomethanes
NTU Nephlometric Turbidity Units UNCW University of North Carolina at
Wilmington
O & M Operational & Maintenance USACE United States Army Corp. of
Engineers
ORC Operator in Responsible Charge USEPA United States Environmental
Protection Agency
OSHA Occupational Safety and Health
Administration
VPN Virtual Private Network
PER Preliminary Engineering Report WEA Water Environment Association
PFAS Polyfluoroalkyl Substances WEF Water Environment Federation
pH Potential of Hydrogen WERF Water Environment Research
Foundation
POSM Pipeline Observation System
Management
WTP Water Treatment Plant
POTW Public Owned Treatment Works WWTP Wastewater Treatment Plant
PPCP Pharmaceuticals and Personal Care
Products
PPM Parts per million
PS Pump Station
PSA Protective Security Advisor
PWS Public Water Supply
QA Quality Assurance
QC Quality Control
95
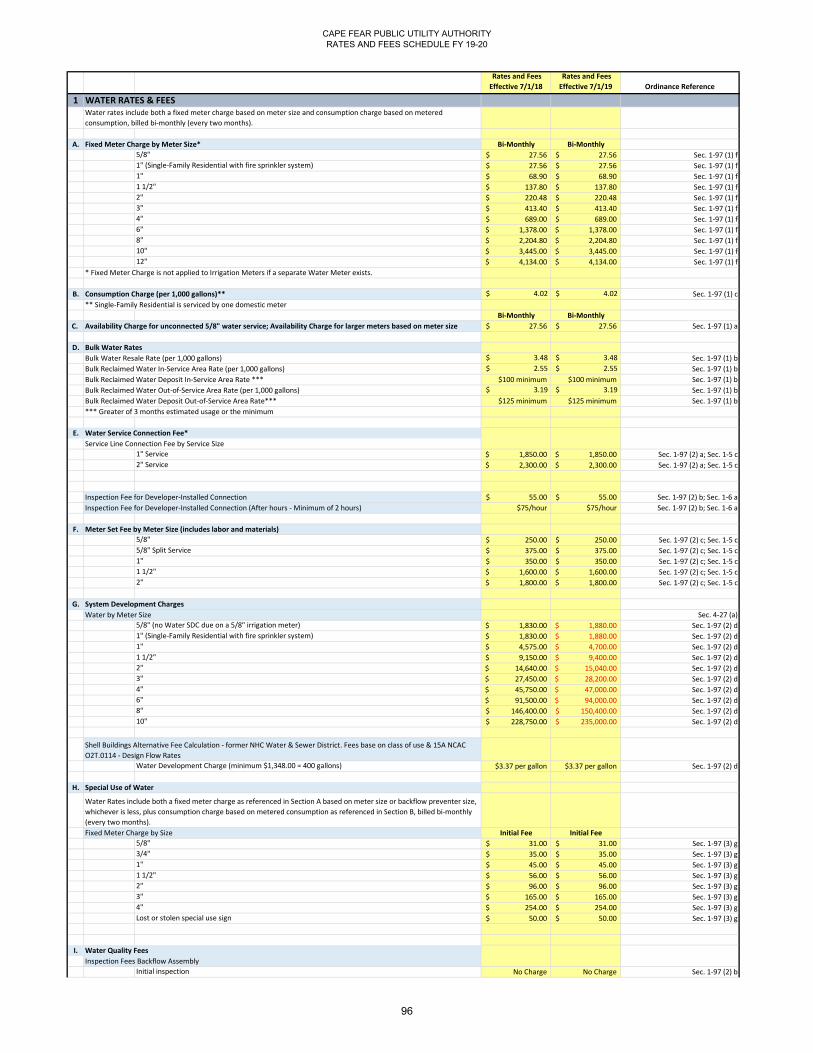
CAPE FEAR PUBLIC UTILITY AUTHORITYRATES AND FEES SCHEDULE FY 19-20
Rates and Fees
Effective 7/1/18
Rates and Fees
Effective 7/1/19 Ordinance Reference
1
A. Bi‐Monthly Bi‐Monthly
5/8" 27.56$ 27.56$ Sec. 1‐97 (1) f
1" (Single‐Family Residential with fire sprinkler system) 27.56$ 27.56$ Sec. 1‐97 (1) f
1" 68.90$ 68.90$ Sec. 1‐97 (1) f
1 1/2" 137.80$ 137.80$ Sec. 1‐97 (1) f
2" 220.48$ 220.48$ Sec. 1‐97 (1) f
3" 413.40$ 413.40$ Sec. 1‐97 (1) f
4" 689.00$ 689.00$ Sec. 1‐97 (1) f
6" 1,378.00$ 1,378.00$ Sec. 1‐97 (1) f
8" 2,204.80$ 2,204.80$ Sec. 1‐97 (1) f
10" 3,445.00$ 3,445.00$ Sec. 1‐97 (1) f
12" 4,134.00$ 4,134.00$ Sec. 1‐97 (1) f
B. $ 4.02 $ 4.02 Sec. 1‐97 (1) c
Bi‐Monthly Bi‐Monthly
C. 27.56$ 27.56$ Sec. 1‐97 (1) a
D.
$ 3.48 $ 3.48 Sec. 1‐97 (1) b
$ 2.55 $ 2.55 Sec. 1‐97 (1) b
$100 minimum $100 minimum Sec. 1‐97 (1) b
$ 3.19 $ 3.19 Sec. 1‐97 (1) b
$125 minimum $125 minimum Sec. 1‐97 (1) b
E.
1" Service 1,850.00$ 1,850.00$ Sec. 1‐97 (2) a; Sec. 1‐5 c
2" Service 2,300.00$ 2,300.00$ Sec. 1‐97 (2) a; Sec. 1‐5 c
55.00$ 55.00$ Sec. 1‐97 (2) b; Sec. 1‐6 a
$75/hour $75/hour Sec. 1‐97 (2) b; Sec. 1‐6 a
F.
5/8" 250.00$ 250.00$ Sec. 1‐97 (2) c; Sec. 1‐5 c
5/8" Split Service 375.00$ 375.00$ Sec. 1‐97 (2) c; Sec. 1‐5 c
1" 350.00$ 350.00$ Sec. 1‐97 (2) c; Sec. 1‐5 c
1 1/2" 1,600.00$ 1,600.00$ Sec. 1‐97 (2) c; Sec. 1‐5 c
2" 1,800.00$ 1,800.00$ Sec. 1‐97 (2) c; Sec. 1‐5 c
G.
Sec. 4‐27 (a)
5/8" (no Water SDC due on a 5/8" irrigation meter) 1,830.00$ 1,880.00$ Sec. 1‐97 (2) d
1" (Single‐Family Residential with fire sprinkler system) 1,830.00$ 1,880.00$ Sec. 1‐97 (2) d
1" 4,575.00$ 4,700.00$ Sec. 1‐97 (2) d
1 1/2" 9,150.00$ 9,400.00$ Sec. 1‐97 (2) d
2" 14,640.00$ 15,040.00$ Sec. 1‐97 (2) d
3" 27,450.00$ 28,200.00$ Sec. 1‐97 (2) d
4" 45,750.00$ 47,000.00$ Sec. 1‐97 (2) d
6" 91,500.00$ 94,000.00$ Sec. 1‐97 (2) d
8" 146,400.00$ 150,400.00$ Sec. 1‐97 (2) d
10" 228,750.00$ 235,000.00$ Sec. 1‐97 (2) d
Water Development Charge (minimum $1,348.00 = 400 gallons) $3.37 per gallon $3.37 per gallon Sec. 1‐97 (2) d
H.
Initial Fee Initial Fee
5/8" 31.00$ 31.00$ Sec. 1‐97 (3) g
3/4" 35.00$ 35.00$ Sec. 1‐97 (3) g
1" 45.00$ 45.00$ Sec. 1‐97 (3) g
1 1/2" 56.00$ 56.00$ Sec. 1‐97 (3) g
2" 96.00$ 96.00$ Sec. 1‐97 (3) g
3" 165.00$ 165.00$ Sec. 1‐97 (3) g
4" 254.00$ 254.00$ Sec. 1‐97 (3) g
Lost or stolen special use sign 50.00$ 50.00$ Sec. 1‐97 (3) g
I.
Initial inspection No Charge No Charge Sec. 1‐97 (2) b
Bulk Reclaimed Water In‐Service Area Rate (per 1,000 gallons)
WATER RATES & FEESWater rates include both a fixed meter charge based on meter size and consumption charge based on metered
consumption, billed bi‐monthly (every two months).
Fixed Meter Charge by Meter Size*
* Fixed Meter Charge is not applied to Irrigation Meters if a separate Water Meter exists.
Consumption Charge (per 1,000 gallons)**
** Single‐Family Residential is serviced by one domestic meter
Availability Charge for unconnected 5/8" water service; Availability Charge for larger meters based on meter size
Bulk Water Rates
Bulk Water Resale Rate (per 1,000 gallons)
Shell Buildings Alternative Fee Calculation ‐ former NHC Water & Sewer District. Fees base on class of use & 15A NCAC
O2T.0114 ‐ Design Flow Rates
Bulk Reclaimed Water Deposit In‐Service Area Rate ***
Bulk Reclaimed Water Out‐of‐Service Area Rate (per 1,000 gallons)
Bulk Reclaimed Water Deposit Out‐of‐Service Area Rate***
*** Greater of 3 months estimated usage or the minimum
Water Service Connection Fee*
Service Line Connection Fee by Service Size
Inspection Fee for Developer‐Installed Connection
Inspection Fee for Developer‐Installed Connection (After hours ‐ Minimum of 2 hours)
Meter Set Fee by Meter Size (includes labor and materials)
System Development Charges
Water by Meter Size
Special Use of Water
Water Rates include both a fixed meter charge as referenced in Section A based on meter size or backflow preventer size,
whichever is less, plus consumption charge based on metered consumption as referenced in Section B, billed bi‐monthly
(every two months).
Fixed Meter Charge by Size
Water Quality Fees
Inspection Fees Backflow Assembly
96

CAPE FEAR PUBLIC UTILITY AUTHORITYRATES AND FEES SCHEDULE FY 19-20
Rates and Fees
Effective 7/1/18
Rates and Fees
Effective 7/1/19 Ordinance Reference
Subsequent inspections 55.00$ 55.00$ Sec. 1‐97 (2) b
J.
Bi‐Monthly Bi‐Monthly
2" 20.00$ 20.00$ Sec. 1‐97 (1) e
4" 40.00$ 40.00$ Sec. 1‐97 (1) e
6" 80.00$ 80.00$ Sec. 1‐97 (1) e
8" 140.00$ 140.00$ Sec. 1‐97 (1) e
10" 220.00$ 220.00$ Sec. 1‐97 (1) e
12" 320.00$ 320.00$ Sec. 1‐97 (1) e
2
A. Bi‐Monthly Bi‐Monthly
5/8" 29.10$ 29.10$ Sec. 1‐97 (1) f; Sec. 1‐75
1" (Single‐Family Residential with fire sprinkler system) 29.10$ 29.10$ Sec. 1‐97 (1) f; Sec. 1‐75
1" 72.75$ 72.75$ Sec. 1‐97 (1) f; Sec. 1‐75
1 1/2" 145.50$ 145.50$ Sec. 1‐97 (1) f; Sec. 1‐75
2" 232.80$ 232.80$ Sec. 1‐97 (1) f; Sec. 1‐75
3" 436.50$ 436.50$ Sec. 1‐97 (1) f; Sec. 1‐75
4" 727.50$ 727.50$ Sec. 1‐97 (1) f; Sec. 1‐75
6" 1,455.00$ 1,455.00$ Sec. 1‐97 (1) f; Sec. 1‐75
8" 2,328.00$ 2,328.00$ Sec. 1‐97 (1) f; Sec. 1‐75
10" 3,637.50$ 3,637.50$ Sec. 1‐97 (1) f; Sec. 1‐75
12" 4,365.00$ 4,365.00$ Sec. 1‐97 (1) f; Sec. 1‐75
B. 4.63$ 4.63$ Sec. 1‐97 (1) c; Sec. 1‐75
Note 1 Single‐Family Residential metered consumption capped at 30,000 gallons per bi‐monthly billing Sec. 1‐97 (1) c; Sec. 1‐75
Note 2
Single Family Residential non‐metered consumption based on the average residential consumption plus
the fixed metered charge for a 5/8" meter Sec. 1‐97 (1) g; Sec. 1‐75
Note 3 Nonresidential non metered consumption capped at 24,000 gallons per bimonthly billing Sec. 1‐97 (1) g; Sec. 1‐75
Note 4 No cap for non‐residential metered consumption Sec. 1‐97 (1) c; Sec. 1‐75
Note 5 Single‐Family Residential is serviced by one domestic meter
Bi‐Monthly Bi‐Monthly
C. 29.10$ 29.10$ Sec. 1‐97 (1) a
D. $3.34 $3.34 Sec. 1‐97 (1) b
E.
4" Service 2,200.00$ 2,200.00$ Sec. 1‐97 (2) a; Sec. 1‐5 c
6" Service 2,800.00$ 2,800.00$ Sec. 1‐97 (2) a; Sec. 1‐5 c
55.00$ 55.00$ Sec. 1‐97 (2) b; Sec. 1‐6 a
$75/hour $75/hour Sec. 1‐97 (2) b; Sec. 1‐6 a
F.
Sec. 4‐47 (a)
5/8" 1,800.00$ 1,930.00$ Sec. 1‐97 (2) d
1" (Single‐Family Residential with fire sprinkler system) 1,800.00$ 1,930.00$ Sec. 1‐97 (2) d
1" 4,500.00$ 4,825.00$ Sec. 1‐97 (2) d
1 1/2" 9,000.00$ 9,650.00$ Sec. 1‐97 (2) d
2" 14,400.00$ 15,440.00$ Sec. 1‐97 (2) d
3" 27,000.00$ 28,950.00$ Sec. 1‐97 (2) d
4" 45,000.00$ 48,250.00$ Sec. 1‐97 (2) d
6" 90,000.00$ 96,500.00$ Sec. 1‐97 (2) d
8" 144,000.00$ 154,400.00$ Sec. 1‐97 (2) d
10" 225,000.00$ 241,250.00$ Sec. 1‐97 (2) d
Unmetered service (sewer only)
$10/gallon
projected flow
$10/gallon
projected flow Sec. 1‐97 (2) d
Sewer Impact Fee (minimum $2,103.90 = 300 gallons) $7.013 per gallon $7.013 per gallon Sec. 1‐97 (2) d
Sewer Development Charge $1.50 per gallon $1.50 per gallon Sec. 1‐97 (2) d
G.
$5.04 per gpd $5.60 per gpd Per Contract
$3.76 per gpd $4.17 per gpd Per Contract
$2.71 per gpd $2.71 per gpd Per Contract
3
A.
Initial and Annual Permit 750.00$ 750.00$ Sec. 5‐58: Sec. 5‐91 (b)
Modification of Permit (each occurrence) 200.00$ 200.00$ Sec. 5‐58: Sec. 5‐91 (b)
Availability Charge for unconnected 5/8" sewer service; Availability Charge for larger meters based on meter size
Fire Line Service
Fixed Fire Line Charge by Size
SEWER RATES & FEESSewer rates include both a fixed meter charge based on meter size and consumption charge based on metered
consumption, billed bi‐monthly (every two months).
Fixed Meter Charge by Meter Size
Consumption Charge (per 1,000 gallons) See Notes 1,2,3,4
Development Capacity Fees
Bulk Wastewater Collection and Treatement Rate (per 1,000 gallons)
Sewer Service Connection Fee
Installation Fee by Service Size
Inspection Fee for Developer‐Installed Connection
Inspection Fee for Developer‐Installed Connection (After hours ‐ Minimum of 2 hours)
System Development Charges
Sewer by Meter Size
Shell Buildings Alternative Fee Calculation ‐ former NHC Water & Sewer District. Fees base on class of use & 15A NCAC
O2T.0114 ‐ Design Flow Rates
Chair Road Associates ‐ Regional Lift Station (PS #157) and Northwest Forcemain Improvements
Chair Road Associates ‐ Northwest Forcemain Improvements Only
Kirkland Sewer Project Capacity Fee
Wastewater Pretreatment
Discharge Permit Applications and Annual Fees:
Significant Industrial Users, Industrial Users flow > 15,000 gallons/day
97
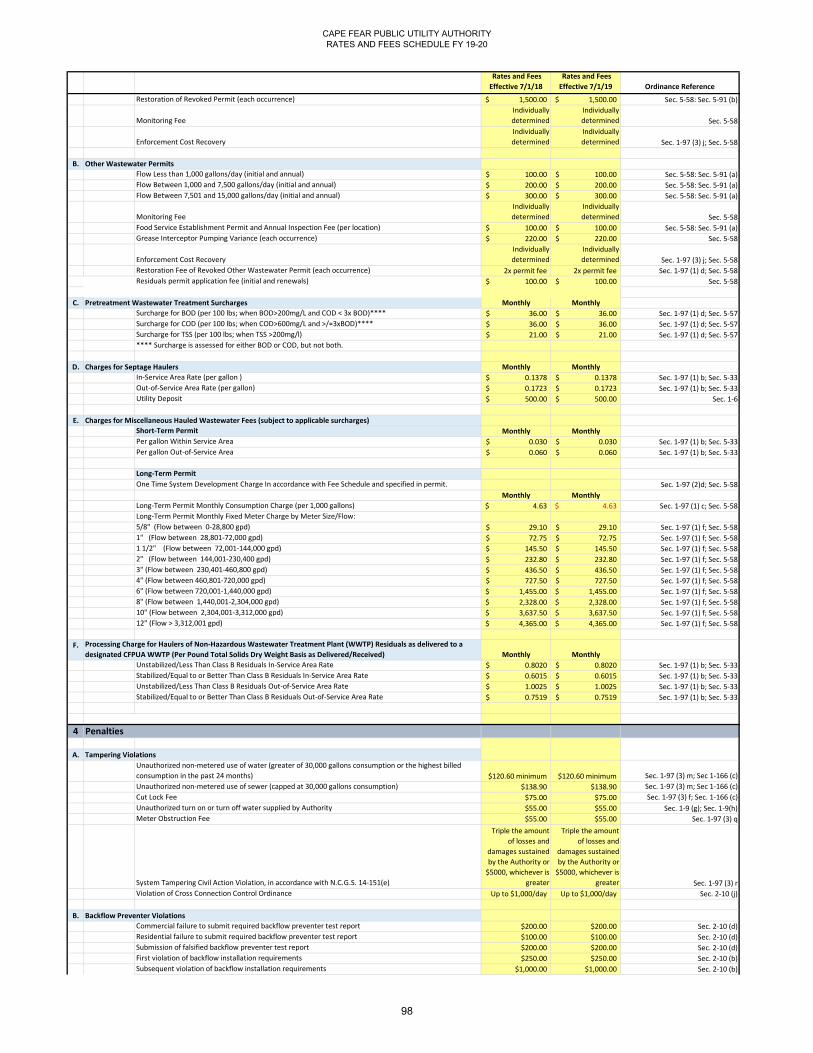
CAPE FEAR PUBLIC UTILITY AUTHORITYRATES AND FEES SCHEDULE FY 19-20
Rates and Fees
Effective 7/1/18
Rates and Fees
Effective 7/1/19 Ordinance Reference
Restoration of Revoked Permit (each occurrence) 1,500.00$ 1,500.00$ Sec. 5‐58: Sec. 5‐91 (b)
Monitoring Fee
Individually
determined
Individually
determined Sec. 5‐58
Enforcement Cost Recovery
Individually
determined
Individually
determined Sec. 1‐97 (3) j; Sec. 5‐58
B.
Flow Less than 1,000 gallons/day (initial and annual) 100.00$ 100.00$ Sec. 5‐58: Sec. 5‐91 (a)
Flow Between 1,000 and 7,500 gallons/day (initial and annual) 200.00$ 200.00$ Sec. 5‐58: Sec. 5‐91 (a)
Flow Between 7,501 and 15,000 gallons/day (initial and annual) 300.00$ 300.00$ Sec. 5‐58: Sec. 5‐91 (a)
Monitoring Fee
Individually
determined
Individually
determined Sec. 5‐58
Food Service Establishment Permit and Annual Inspection Fee (per location) 100.00$ 100.00$ Sec. 5‐58: Sec. 5‐91 (a)
Grease Interceptor Pumping Variance (each occurrence) 220.00$ 220.00$ Sec. 5‐58
Enforcement Cost Recovery
Individually
determined
Individually
determined Sec. 1‐97 (3) j; Sec. 5‐58
Restoration Fee of Revoked Other Wastewater Permit (each occurrence) 2x permit fee 2x permit fee Sec. 1‐97 (1) d; Sec. 5‐58
Residuals permit application fee (initial and renewals) 100.00$ 100.00$ Sec. 5‐58
C. Monthly Monthly
Surcharge for BOD (per 100 lbs; when BOD>200mg/L and COD < 3x BOD)**** 36.00$ 36.00$ Sec. 1‐97 (1) d; Sec. 5‐57
Surcharge for COD (per 100 lbs; when COD>600mg/L and >/=3xBOD)**** 36.00$ 36.00$ Sec. 1‐97 (1) d; Sec. 5‐57
Surcharge for TSS (per 100 lbs; when TSS >200mg/l) 21.00$ 21.00$ Sec. 1‐97 (1) d; Sec. 5‐57
**** Surcharge is assessed for either BOD or COD, but not both.
D. Monthly Monthly
In‐Service Area Rate (per gallon ) 0.1378$ 0.1378$ Sec. 1‐97 (1) b; Sec. 5‐33
Out‐of‐Service Area Rate (per gallon) 0.1723$ 0.1723$ Sec. 1‐97 (1) b; Sec. 5‐33
Utility Deposit 500.00$ 500.00$ Sec. 1‐6
E.
Short‐Term Permit Monthly Monthly
Per gallon Within Service Area 0.030$ 0.030$ Sec. 1‐97 (1) b; Sec. 5‐33
Per gallon Out‐of‐Service Area 0.060$ 0.060$ Sec. 1‐97 (1) b; Sec. 5‐33
Long‐Term Permit
One Time System Development Charge In accordance with Fee Schedule and specified in permit. Sec. 1‐97 (2)d; Sec. 5‐58
Monthly Monthly
Long‐Term Permit Monthly Consumption Charge (per 1,000 gallons) 4.63$ 4.63$ Sec. 1‐97 (1) c; Sec. 5‐58
Long‐Term Permit Monthly Fixed Meter Charge by Meter Size/Flow:
5/8" (Flow between 0‐28,800 gpd) 29.10$ 29.10$ Sec. 1‐97 (1) f; Sec. 5‐58
1" (Flow between 28,801‐72,000 gpd) 72.75$ 72.75$ Sec. 1‐97 (1) f; Sec. 5‐58
1 1/2" (Flow between 72,001‐144,000 gpd) 145.50$ 145.50$ Sec. 1‐97 (1) f; Sec. 5‐58
2" (Flow between 144,001‐230,400 gpd) 232.80$ 232.80$ Sec. 1‐97 (1) f; Sec. 5‐58
3" (Flow between 230,401‐460,800 gpd) 436.50$ 436.50$ Sec. 1‐97 (1) f; Sec. 5‐58
4" (Flow between 460,801‐720,000 gpd) 727.50$ 727.50$ Sec. 1‐97 (1) f; Sec. 5‐58
6" (Flow between 720,001‐1,440,000 gpd) 1,455.00$ 1,455.00$ Sec. 1‐97 (1) f; Sec. 5‐58
8" (Flow between 1,440,001‐2,304,000 gpd) 2,328.00$ 2,328.00$ Sec. 1‐97 (1) f; Sec. 5‐58
10" (Flow between 2,304,001‐3,312,000 gpd) 3,637.50$ 3,637.50$ Sec. 1‐97 (1) f; Sec. 5‐58
12" (Flow > 3,312,001 gpd) 4,365.00$ 4,365.00$ Sec. 1‐97 (1) f; Sec. 5‐58
F.Monthly Monthly
Unstabilized/Less Than Class B Residuals In‐Service Area Rate 0.8020$ 0.8020$ Sec. 1‐97 (1) b; Sec. 5‐33
Stabilized/Equal to or Better Than Class B Residuals In‐Service Area Rate 0.6015$ 0.6015$ Sec. 1‐97 (1) b; Sec. 5‐33
Unstabilized/Less Than Class B Residuals Out‐of‐Service Area Rate 1.0025$ 1.0025$ Sec. 1‐97 (1) b; Sec. 5‐33
Stabilized/Equal to or Better Than Class B Residuals Out‐of‐Service Area Rate 0.7519$ 0.7519$ Sec. 1‐97 (1) b; Sec. 5‐33
4
A.
Unauthorized non‐metered use of water (greater of 30,000 gallons consumption or the highest billed
consumption in the past 24 months) $120.60 minimum $120.60 minimum Sec. 1‐97 (3) m; Sec 1‐166 (c)
Unauthorized non‐metered use of sewer (capped at 30,000 gallons consumption) $138.90 $138.90 Sec. 1‐97 (3) m; Sec 1‐166 (c)
Cut Lock Fee $75.00 $75.00 Sec. 1‐97 (3) f; Sec. 1‐166 (c)
Unauthorized turn on or turn off water supplied by Authority $55.00 $55.00 Sec. 1‐9 (g); Sec. 1‐9(h)
Meter Obstruction Fee $55.00 $55.00 Sec. 1‐97 (3) q
System Tampering Civil Action Violation, in accordance with N.C.G.S. 14‐151(e)
Triple the amount
of losses and
damages sustained
by the Authority or
$5000, whichever is
greater
Triple the amount
of losses and
damages sustained
by the Authority or
$5000, whichever is
greater Sec. 1‐97 (3) r
Violation of Cross Connection Control Ordinance Up to $1,000/day Up to $1,000/day Sec. 2‐10 (j)
B.
Commercial failure to submit required backflow preventer test report $200.00 $200.00 Sec. 2‐10 (d)
Residential failure to submit required backflow preventer test report $100.00 $100.00 Sec. 2‐10 (d)
Submission of falsified backflow preventer test report $200.00 $200.00 Sec. 2‐10 (d)
First violation of backflow installation requirements $250.00 $250.00 Sec. 2‐10 (b)
Subsequent violation of backflow installation requirements $1,000.00 $1,000.00 Sec. 2‐10 (b)
Other Wastewater Permits
Pretreatment Wastewater Treatment Surcharges
Charges for Septage Haulers
Charges for Miscellaneous Hauled Wastewater Fees (subject to applicable surcharges)
Processing Charge for Haulers of Non‐Hazardous Wastewater Treatment Plant (WWTP) Residuals as delivered to a
designated CFPUA WWTP (Per Pound Total Solids Dry Weight Basis as Delivered/Received)
Penalties
Tampering Violations
Backflow Preventer Violations
98
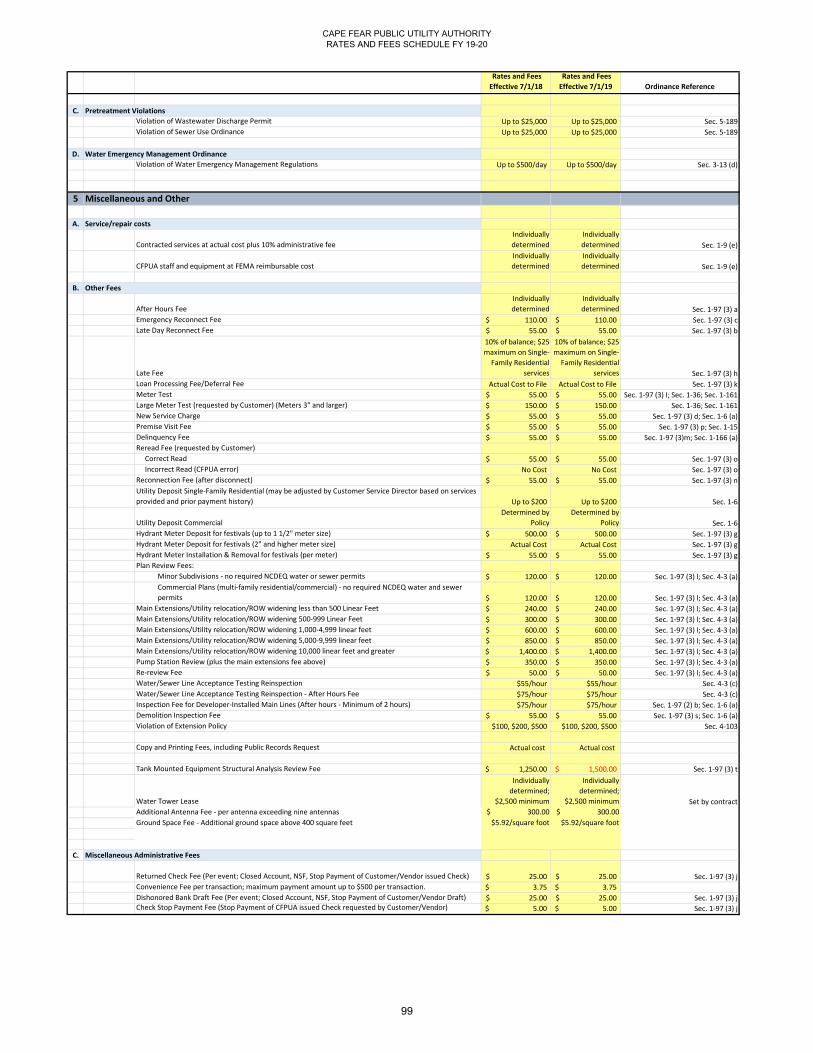
CAPE FEAR PUBLIC UTILITY AUTHORITYRATES AND FEES SCHEDULE FY 19-20
Rates and Fees
Effective 7/1/18
Rates and Fees
Effective 7/1/19 Ordinance Reference
C.
Violation of Wastewater Discharge Permit Up to $25,000 Up to $25,000 Sec. 5‐189
Violation of Sewer Use Ordinance Up to $25,000 Up to $25,000 Sec. 5‐189
D.
Violation of Water Emergency Management Regulations Up to $500/day Up to $500/day Sec. 3‐13 (d)
5
A.
Contracted services at actual cost plus 10% administrative fee
Individually
determined
Individually
determined Sec. 1‐9 (e)
CFPUA staff and equipment at FEMA reimbursable cost
Individually
determined
Individually
determined Sec. 1‐9 (e)
B.
After Hours Fee
Individually
determined
Individually
determined Sec. 1‐97 (3) a
Emergency Reconnect Fee 110.00$ 110.00$ Sec. 1‐97 (3) c
Late Day Reconnect Fee 55.00$ 55.00$ Sec. 1‐97 (3) b
Late Fee
10% of balance; $25
maximum on Single‐
Family Residential
services
10% of balance; $25
maximum on Single‐
Family Residential
services Sec. 1‐97 (3) h
Loan Processing Fee/Deferral Fee Actual Cost to File Actual Cost to File Sec. 1‐97 (3) k
Meter Test 55.00$ 55.00$ Sec. 1‐97 (3) I; Sec. 1‐36; Sec. 1‐161
Large Meter Test (requested by Customer) (Meters 3" and larger) 150.00$ 150.00$ Sec. 1‐36; Sec. 1‐161
New Service Charge 55.00$ 55.00$ Sec. 1‐97 (3) d; Sec. 1‐6 (a)
Premise Visit Fee 55.00$ 55.00$ Sec. 1‐97 (3) p; Sec. 1‐15
Delinquency Fee 55.00$ 55.00$ Sec. 1‐97 (3)m; Sec. 1‐166 (a)
Reread Fee (requested by Customer)
Correct Read 55.00$ 55.00$ Sec. 1‐97 (3) o
Incorrect Read (CFPUA error) No Cost No Cost Sec. 1‐97 (3) o
Reconnection Fee (after disconnect) 55.00$ 55.00$ Sec. 1‐97 (3) n
Utility Deposit Single‐Family Residential (may be adjusted by Customer Service Director based on services
provided and prior payment history) Up to $200 Up to $200 Sec. 1‐6
Utility Deposit Commercial
Determined by
Policy
Determined by
Policy Sec. 1‐6
Hydrant Meter Deposit for festivals (up to 1 1/2" meter size) 500.00$ 500.00$ Sec. 1‐97 (3) g
Hydrant Meter Deposit for festivals (2" and higher meter size) Actual Cost Actual Cost Sec. 1‐97 (3) g
Hydrant Meter Installation & Removal for festivals (per meter) 55.00$ 55.00$ Sec. 1‐97 (3) g
Plan Review Fees:
Minor Subdivisions ‐ no required NCDEQ water or sewer permits 120.00$ 120.00$ Sec. 1‐97 (3) l; Sec. 4‐3 (a)
Commercial Plans (multi‐family residential/commercial) ‐ no required NCDEQ water and sewer
permits 120.00$ 120.00$ Sec. 1‐97 (3) l; Sec. 4‐3 (a)
Main Extensions/Utility relocation/ROW widening less than 500 Linear Feet 240.00$ 240.00$ Sec. 1‐97 (3) l; Sec. 4‐3 (a)
Main Extensions/Utility relocation/ROW widening 500‐999 Linear Feet 300.00$ 300.00$ Sec. 1‐97 (3) l; Sec. 4‐3 (a)
Main Extensions/Utility relocation/ROW widening 1,000‐4,999 linear feet 600.00$ 600.00$ Sec. 1‐97 (3) l; Sec. 4‐3 (a)
Main Extensions/Utility relocation/ROW widening 5,000‐9,999 linear feet 850.00$ 850.00$ Sec. 1‐97 (3) l; Sec. 4‐3 (a)
Main Extensions/Utility relocation/ROW widening 10,000 linear feet and greater 1,400.00$ 1,400.00$ Sec. 1‐97 (3) l; Sec. 4‐3 (a)
Pump Station Review (plus the main extensions fee above) 350.00$ 350.00$ Sec. 1‐97 (3) l; Sec. 4‐3 (a)
Re‐review Fee 50.00$ 50.00$ Sec. 1‐97 (3) l; Sec. 4‐3 (a)
Water/Sewer Line Acceptance Testing Reinspection $55/hour $55/hour Sec. 4‐3 (c)
Water/Sewer Line Acceptance Testing Reinspection ‐ After Hours Fee $75/hour $75/hour Sec. 4‐3 (c)
Inspection Fee for Developer‐Installed Main Lines (After hours ‐ Minimum of 2 hours) $75/hour $75/hour Sec. 1‐97 (2) b; Sec. 1‐6 (a)
Demolition Inspection Fee 55.00$ 55.00$ Sec. 1‐97 (3) s; Sec. 1‐6 (a)
Violation of Extension Policy $100, $200, $500 $100, $200, $500 Sec. 4‐103
Copy and Printing Fees, including Public Records Request Actual cost Actual cost
Tank Mounted Equipment Structural Analysis Review Fee 1,250.00$ 1,500.00$ Sec. 1‐97 (3) t
Water Tower Lease
Individually
determined;
$2,500 minimum
Individually
determined;
$2,500 minimum Set by contract
Additional Antenna Fee ‐ per antenna exceeding nine antennas $ 300.00 $ 300.00
Ground Space Fee ‐ Additional ground space above 400 square feet $5.92/square foot $5.92/square foot
C.
Returned Check Fee (Per event; Closed Account, NSF, Stop Payment of Customer/Vendor issued Check) 25.00$ 25.00$ Sec. 1‐97 (3) j
Convenience Fee per transaction; maximum payment amount up to $500 per transaction. 3.75$ 3.75$
Dishonored Bank Draft Fee (Per event; Closed Account, NSF, Stop Payment of Customer/Vendor Draft) 25.00$ 25.00$ Sec. 1‐97 (3) jCheck Stop Payment Fee (Stop Payment of CFPUA issued Check requested by Customer/Vendor) 5.00$ 5.00$ Sec. 1‐97 (3) j
Service/repair costs
Other Fees
Miscellaneous Administrative Fees
Pretreatment Violations
Water Emergency Management Ordinance
Miscellaneous and Other
99

Cape Fear Public Utility Authority
Demographic Statistics
Current Fiscal Year and Last Nine Fiscal Years
Fiscal Year City of New Hanover Public Local Personal
Ended Wilmington County Median School Unemployment Income Per Capita
June 30 Population (1) Population (1) Age (3) Enrollment (2) Rate % (3) (000's) (4) Income (4)
2018 119,045 227,198 38 26,263 3.9% N/A N/A
2017 117,525 223,483 38 26,096 3.9% N/A N/A
2016 115,933 220,358 38 25,901 4.8% $9,444,753 $42,262
2015 113,657 216,298 38 26,241 5.6% $8,921,731 $40,487
2014 112,067 213,267 38 25,470 6.1% $8,454,467 $39,035
2013 109,922 209,234 38 25,364 9.1% $7,819,052 $36,653
2012 108,297 206,189 37.5 25,253 9.3% $7,543,199 $36,054
2011 106,476 202,667 36.7 23,934 10.1% $7,419,000 $36,020
2010 102,207 194,054 38.5 23,643 9.4% $7,031,719 $34,588
2009 101,526 192,235 38 23,614 9.0% $7,059,313 $35,265
Note: Fiscal year 2009 was the first year of operations for the Authority.
(1) US Census Bureau.
(2) Provided by the NHC Schools Finance Department
(3) North Carolina Department of Commerce
(4) Federal Agency Data: Bureau of Economic Analysis. Data provided for as many years as available.
100

Ten Largest Users of the Water System Annual Consumption
Thousands of
Gallons % of System Revenues ($)
% of
Revenues Ten Largest Users of the Water System Annual Consumption
Thousands of
Gallons
% of
System Revenues ($)
% of
Revenues
1 UNC Wilmington 102,951 1.95% 458,735$ 1.32% 1 UNC Wilmington 136,483 2.34% 430,613$ 1.89%
2 New Hanover Regional Medical Center 64,628 1.23% 297,075 0.86% 2 New Hanover County 63,232 1.08% 232,431 1.02%
3 Wilmington Housing Authority 44,688 0.85% 208,074 0.60% 3 New Hanover Regional Medical Center 61,473 1.05% 211,318 0.93%
4 Elementis 41,080 0.78% 162,159 0.47% 4 New Hanover County Schools 47,862 0.82% 208,756 0.92%
5 New Hanover County Schools 39,659 0.75% 250,703 0.72% 5 Wilmington Housing Authority 40,956 0.70% 137,433 0.60%
6 New Hanover County 37,626 0.71% 217,435 0.63% 6 Lake Forest Apartments 30,088 0.52% 97,305 0.43%
7 Tribute Properties 26,660 0.51% 207,172 0.60% 7 College Manor Apartments 23,411 0.40% 80,985 0.36%
8 Lake Forest Apartments 25,042 0.48% 111,292 0.32% 8 Mayfaire Complex 22,955 0.39% 119,091 0.52%
9 State of North Carolina 18,786 0.36% 80,488 0.23% 9 Tribute Properties 21,463 0.37% 114,526 0.50%
10 City of Wilmington 17,758 0.34% 185,271 0.53% 10 Elementis Chromium 18,971 0.33% 58,243 0.26%
Total Net Consumption / Net Revenue 418,878 7.95% $ 2,178,404 6.28% Total Net Consumption / Net Revenue 466,893 8.00% $ 1,690,699 7.42%
Total Annual System Net Consumption / Net Revenue 5,271,263 $ 34,667,433 Total Annual System Net Consumption / Net Revenue 5,834,129 $ 22,781,177
Note: Fiscal year 2009 was the first year of operations for the Authority.
(1) Restated 2009 Top 10 Users to reflect "Net Consumption" and "Net Revenue"
Source: Cape Fear Public Utility Authority Customer Service Department.
2018 2009 (1)
Cape Fear Public Utility Authority
Principal Water Customers
Current Fiscal Year and Nine Years Ago
101
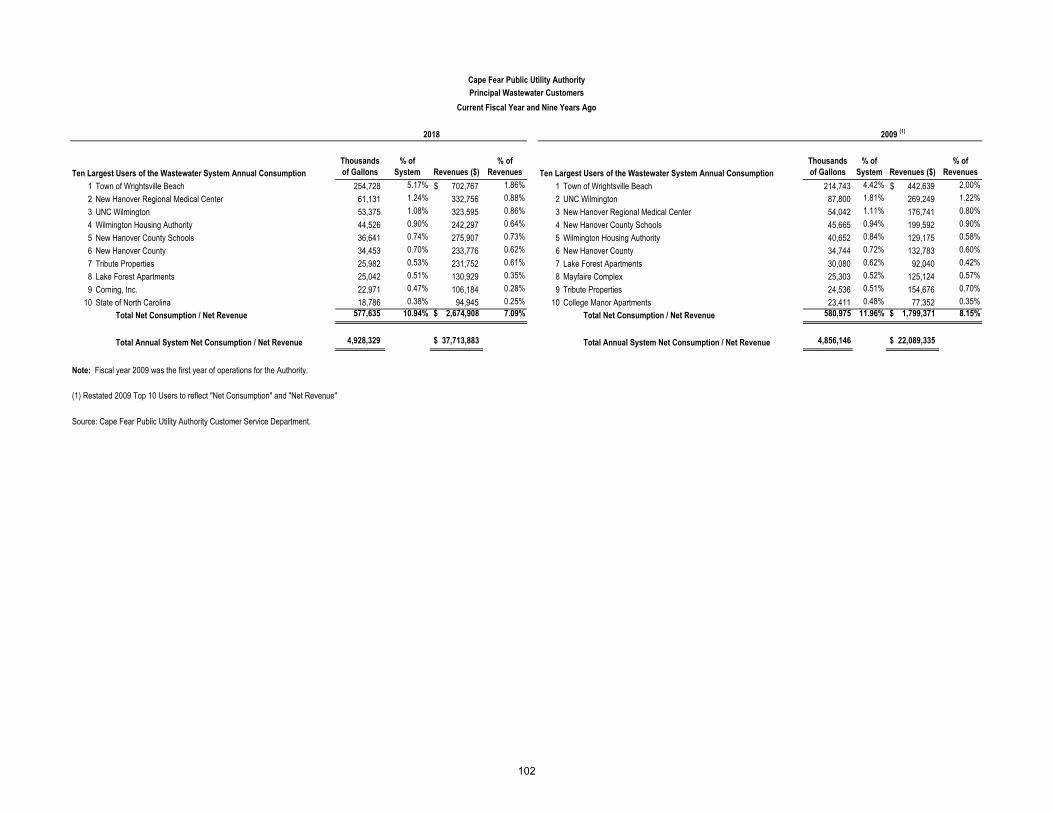
Cape Fear Public Utility Authority
Principal Wastewater Customers
Current Fiscal Year and Nine Years Ago
Thousands
of Gallons
% of
System Revenues ($)
% of
Revenues
Thousands
of Gallons
% of
System Revenues ($)
% of
Revenues
1 Town of Wrightsville Beach 254,728 5.17% 702,767$ 1.86% 1 Town of Wrightsville Beach 214,743 4.42% 442,639$ 2.00%
2 New Hanover Regional Medical Center 61,131 1.24% 332,756 0.88% 2 UNC Wilmington 87,800 1.81% 269,249 1.22%
3 UNC Wilmington 53,375 1.08% 323,595 0.86% 3 New Hanover Regional Medical Center 54,042 1.11% 176,741 0.80%
4 Wilmington Housing Authority 44,526 0.90% 242,297 0.64% 4 New Hanover County Schools 45,665 0.94% 199,592 0.90%
5 New Hanover County Schools 36,641 0.74% 275,907 0.73% 5 Wilmington Housing Authority 40,652 0.84% 129,175 0.58%
6 New Hanover County 34,453 0.70% 233,776 0.62% 6 New Hanover County 34,744 0.72% 132,783 0.60%
7 Tribute Properties 25,982 0.53% 231,752 0.61% 7 Lake Forest Apartments 30,080 0.62% 92,040 0.42%
8 Lake Forest Apartments 25,042 0.51% 130,929 0.35% 8 Mayfaire Complex 25,303 0.52% 125,124 0.57%
9 Corning, Inc. 22,971 0.47% 106,184 0.28% 9 Tribute Properties 24,536 0.51% 154,676 0.70%
10 State of North Carolina 18,786 0.38% 94,945 0.25% 10 College Manor Apartments 23,411 0.48% 77,352 0.35%
Total Net Consumption / Net Revenue 577,635 10.94% $ 2,674,908 7.09% Total Net Consumption / Net Revenue 580,975 11.96% $ 1,799,371 8.15%
Total Annual System Net Consumption / Net Revenue 4,928,329 $ 37,713,883 Total Annual System Net Consumption / Net Revenue 4,856,146 $ 22,089,335
Note: Fiscal year 2009 was the first year of operations for the Authority.
(1) Restated 2009 Top 10 Users to reflect "Net Consumption" and "Net Revenue"
Source: Cape Fear Public Utility Authority Customer Service Department.
Ten Largest Users of the Wastewater System Annual Consumption
2018
Ten Largest Users of the Wastewater System Annual Consumption
2009 (1)
102

Cape Fear Public Utility Authority
Principal Employers
Current Fiscal Year and Nine Years Ago
2018 2009
Employers
Employees
(1) Rank
Percentage of Total
County
Employment Employers
Employees
(3) Rank
Percentage of Total
County
Employment
New Hanover Regional Medical Center 6,880 1 5.68% New Hanover Regional Medical Center 4,890 1 5.10%
New Hanover County Schools 4,476 2 3.70% New Hanover County Schools 4,130 2 4.30%
GE Hitachi Nuclear Energy and GE Aviation 3,000 3 2.48% GE Hitachi Nuclear Energy and GE Aviation 3,000 3 3.13%
Wal-Mart Stores 2,227 4 1.84% University of North Carolina at Wilmington 1,810 4 1.89%
University of North Carolina Wilmington 2,154 5 1.78% New Hanover County 1,670 5 1.74%
Duke Energy 1,770 6 1.46% PPD 1,420 6 1.48%
New Hanover County 1,726 7 1.43% Cape Fear Community College 1,260 7 1.31%
PPD 1,500 8 1.24% City of Wilmington 1,200 8 1.25%
Verizon Wireless 1,278 9 1.06% Verizon Wireless 1,200 9 1.25%
City of Wilmington 1,067 10 0.88% Corning, Inc. 1,000 10 1.04%
21.54% 22.49%
Total # Employed at June 30 of the respective FY (2) 121,074 Total # Employed at June 30 of the respective FY (2) 95,964
Note: Fiscal year 2009 was the first year of operations for the Authority.
(1) Source: 2018 Book on Business; www.wilmingtonbiz.com
(2) Source: North Carolina Employment Security Commission (2009) and www.ncworks.gov (2018)
(3) Source: New Hanover County CAFR for Fiscal Year Ended June 30, 2009 using the Wilmington Industrial Development, Inc. and NC State Demographics Website.
103

2018 2017 2016 2015 2014 2013 2012 2011 2010 2009
Water System
Number of available service connections(1) 74,700 73,118 71,439 70,356 68,794 68,033 67,067 64,602 63,683 62,551
Number of treatment plants - surface water system 1 1 1 1 1 1 1 1 1 1
Treatment capacity (mgd) - surface water 35.00 35.00 35.00 35.00 35.00 35.00 35.00 27.50 27.50 27.50
Average production (mgd) - surface water 14.49 14.63 14.35 13.56 13.44 13.20 13.50 13.70 13.30 14.30
Number of groundwater systems 2 2 3 3 3 3 3 3 3 3
Number of treatment plants - groundwater system 1 1 1 1 1 1 1 1 1 -
Number of active wells - groundwater system 38 37 34 36 36 36 36 36 36 36
Treatment capacity (mgd) - groundwater plant 6 6 6 6 6 6 6 6 6 -
Treatment capacity (mgd) - other groundwater systems 1.02 0.90 0.70 0.70 0.70 0.70 0.70 0.70 0.70 0.70
Average production (mgd) - groundwater 3.07 3.08 3.04 2.94 2.48 2.95 2.95 3.20 3.30 3.10
Miles of water mains 1,131 1,113 1,114 1,089 1,041 (2) 1,078 1,072 1,070
(2) 1,129 1,103
Wastewater System
Number of available service connections(1) 73,043 71,539 69,222 68,246 66,829 66,059 64,529 64,330 63,793 62,296
Number of treatment plants 2 2 3 3 3 3 3 3 3 3
WPC plant permit (mgd) 28.10 28.10 28.10 28.10 22.10 22.10 22.10 22.10 22.10 22.10
Average annual daily flow (mgd) 17.49 17.16 18.76 17.48 16.45 16.17 15.10 15.80 16.80 15.60
Number of lift stations 148 146 142 143 141 141 141 141 142 142
Miles of wastewater gravity mains(2) 892 877 848 844 827
(2) 850 840 840(2) 881 877
Miles of wastewater force mains 143 142 131 131 112 110 104 104 100 100
Number of manholes 22,097 22,017 21,221 21,049 20,918 20,300 20,300 20,300 N/A N/A
Note: Fiscal year 2009 was the first year of operations for the Authority.
Source: Cape Fear Public Utility Authority Records
(1) Data restated to remove irrigation meters associated with domestic meters for the same location.
(2) Based on more accurate information as a result of implementating and improving the accuracy of an asset management system.
Cape Fear Public Utility Authority
Operating Statistics
Current Year and Last Nine Fiscal Years
Fiscal Year
104

Thousand
Gallons
% of
Consumption Thousand Gallons
% of
Consumption
Thousand
Gallons
% of
Consumption
Thousand
Gallons
% of
Consumption
Thousand
Gallons
% of
Consumption
Thousand
Gallons
% of
Consumption
Thousand
Gallons
% of
Consumption
Thousand
Gallons
% of
Consumption
Thousand
Gallons
% of
Consumption
Thousand
Gallons
% of
Consumption
Residential 3,614,451 68.57% 3,651,875 69.45% 3,630,541 69.20% 3,461,812 68.80% 3,415,831 69.87% 3,522,531 69.85% 3,806,074 70.45% 3,887,894 70.88% 3,652,988 70.13% 4,152,536 71.18%
Commercial 1,175,036 22.29% 1,151,382 21.90% 1,128,569 21.51% 1,053,502 20.94% 1,006,253 20.58% 1,026,039 20.35% 1,059,983 19.62% 1,075,703 19.61% 1,032,322 19.82% 1,094,936 18.77%
Industrial 90,719 1.72% 68,109 1.30% 74,645 1.42% 65,334 1.30% 63,349 1.30% 59,116 1.17% 62,267 1.15% 62,278 1.14% 57,719 1.11% 102,707 1.76%
Institutional and Government 391,058 7.42% 386,583 7.35% 413,036 7.87% 451,090 8.96% 403,523 8.25% 435,048 8.63% 474,130 8.78% 459,656 8.38% 465,940 8.94% 483,950 8.30%
Total 5,271,263 100.00% 5,257,949 100.00% 5,246,790 100.00% 5,031,738 100.00% 4,888,957 100.00% 5,042,734 100.00% 5,402,454 100.00% 5,485,531 100.00% 5,208,969 100.00% 5,834,129 100.00%
Residential 3,259,728 66.14% 3,277,428 67.57% 3,287,280 67.36% 3,171,068 67.33% 3,184,447 68.27% 3,246,521 68.52% 3,424,127 68.94% 3,497,483 68.98% 3,329,608 69.30% 3,543,624 72.97%
Commercial 1,078,506 21.88% 1,048,627 21.62% 1,019,892 20.90% 956,150 20.30% 922,045 19.77% 923,952 19.50% 941,927 18.96% 957,062 18.88% 842,782 17.54% 869,266 17.90%
Town of Wrightsville Beach 254,728 5.17% 184,695 3.81% 227,370 4.66% 207,905 4.41% 210,681 4.52% 203,370 4.29% 207,561 4.18% 214,479 4.23% 234,303 4.88% 214,743 4.42%
Pender County 14,374 0.29% 11,291 0.23% 10,562 0.22% 10,033 0.21% 9,008 0.19% 10,473 0.22% 11,550 0.23% 16,224 0.32% 13,550 0.28% 14,139 0.29%
Industrial 17,144 0.35% 15,470 0.32% 18,257 0.37% 21,027 0.45% 19,468 0.42% 16,296 0.34% 16,197 0.33% 18,219 0.36% 23,060 0.48% 24,964 0.51%
Institutional and Government 303,850 6.17% 312,907 6.45% 316,946 6.49% 343,878 7.30% 318,809 6.83% 337,107 7.12% 365,297 7.35% 366,618 7.23% 361,467 7.52% 189,410 3.90%
Total (2)
4,928,329 100.00% 4,850,418 100.00% 4,880,306 100.00% 4,710,062 100.00% 4,664,457 100.00% 4,737,719 100.00% 4,966,659 100.00% 5,070,085 100.00% 4,804,770 100.00% 4,856,146 100.00%
Note: Fiscal year 2009 was the first year of operations for the Authority.
Source: Cape Fear Public Utility Authority Customer Service Department.
(1) Prior year data has been updated to reflect adjustments made in the current year.
Water includes domestic and irrigation connections
(2) The Total value for Thousand Gallons listed for Wastewater Customers does not include an estimation for the volumetric value of the Flat Wastewater customer class.
For billing purposes, the calculation of Flat Wastewater charges is based on 24,000 gallons discharged bimonthly. There were an average of approximately 1,530 Flat Wastewater customers in 2015.
Cape Fear Public Utility Authority
Consumption by Customer Group
Current Fiscal Year and Last Nine Fiscal Years
Wastewater Customers
Water Customers
2013 2012 2011 2010 (1) 2009 (1)20142015201620172018
105
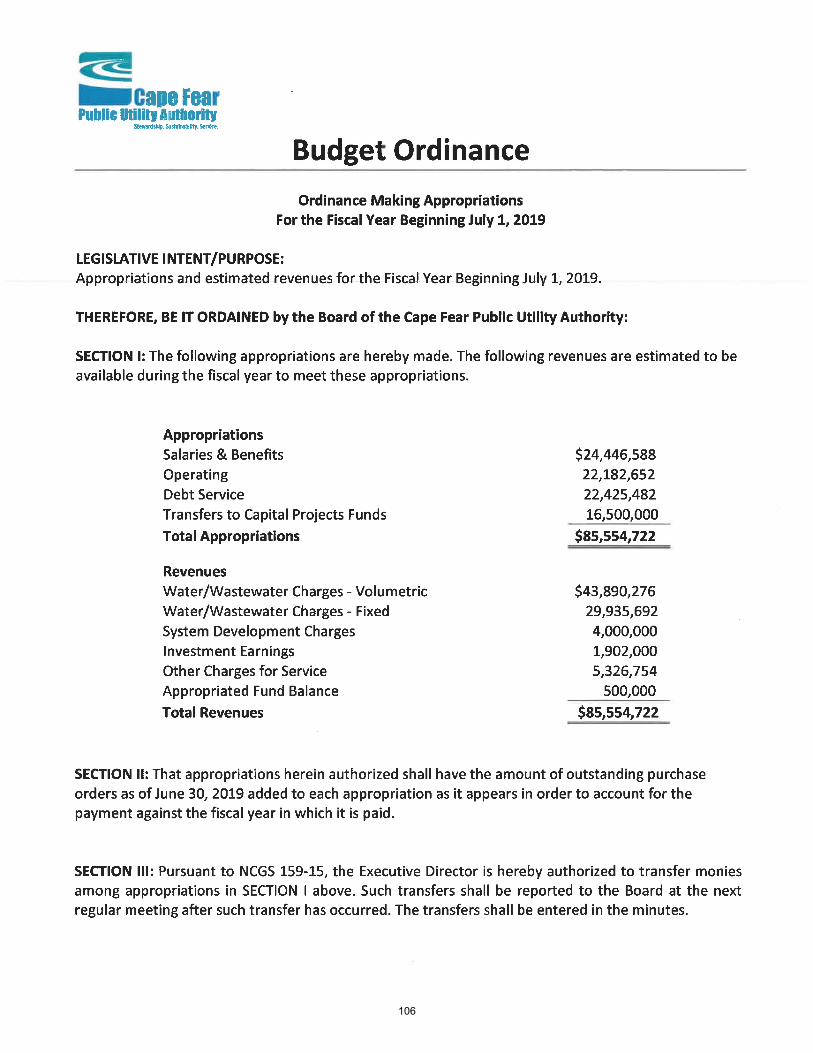
106

107
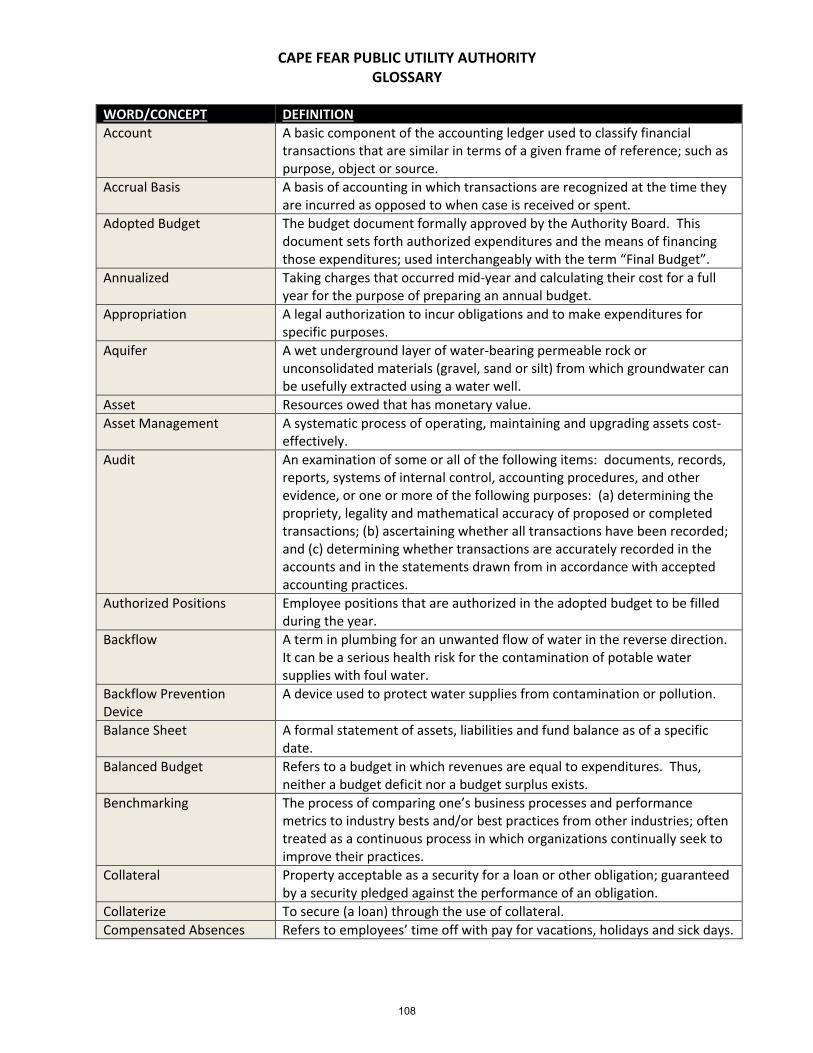
CAPE FEAR PUBLIC UTILITY AUTHORITY GLOSSARY
WORD/CONCEPT DEFINITION
Account A basic component of the accounting ledger used to classify financial transactions that are similar in terms of a given frame of reference; such as purpose, object or source.
Accrual Basis A basis of accounting in which transactions are recognized at the time they are incurred as opposed to when case is received or spent.
Adopted Budget The budget document formally approved by the Authority Board. This document sets forth authorized expenditures and the means of financing those expenditures; used interchangeably with the term “Final Budget”.
Annualized Taking charges that occurred mid‐year and calculating their cost for a full year for the purpose of preparing an annual budget.
Appropriation A legal authorization to incur obligations and to make expenditures for specific purposes.
Aquifer A wet underground layer of water‐bearing permeable rock or unconsolidated materials (gravel, sand or silt) from which groundwater can be usefully extracted using a water well.
Asset Resources owed that has monetary value.
Asset Management A systematic process of operating, maintaining and upgrading assets cost‐effectively.
Audit An examination of some or all of the following items: documents, records, reports, systems of internal control, accounting procedures, and other evidence, or one or more of the following purposes: (a) determining the propriety, legality and mathematical accuracy of proposed or completed transactions; (b) ascertaining whether all transactions have been recorded; and (c) determining whether transactions are accurately recorded in the accounts and in the statements drawn from in accordance with accepted accounting practices.
Authorized Positions Employee positions that are authorized in the adopted budget to be filled during the year.
Backflow A term in plumbing for an unwanted flow of water in the reverse direction. It can be a serious health risk for the contamination of potable water supplies with foul water.
Backflow Prevention Device
A device used to protect water supplies from contamination or pollution.
Balance Sheet A formal statement of assets, liabilities and fund balance as of a specific date.
Balanced Budget Refers to a budget in which revenues are equal to expenditures. Thus, neither a budget deficit nor a budget surplus exists.
Benchmarking The process of comparing one’s business processes and performance metrics to industry bests and/or best practices from other industries; often treated as a continuous process in which organizations continually seek to improve their practices.
Collateral Property acceptable as a security for a loan or other obligation; guaranteed by a security pledged against the performance of an obligation.
Collaterize To secure (a loan) through the use of collateral.
Compensated Absences Refers to employees’ time off with pay for vacations, holidays and sick days.
108
CAPE FEAR PUBLIC UTILITY AUTHORITY GLOSSARY
WORD/CONCEPT DEFINITION
Comprehensive Annual Financial Report (CAFR)
The official annual financial report of the Authority; summarizes and discloses the financial activity of the Authority.
Computer Maintenance A CMMS software package maintains a computer database of information.
Contingency A budgetary reserve set aside for emergencies or unforeseen expenditures not otherwise budgeted.
Corporate Governance Processes, customers, policies, laws and institutions affecting the way a corporation is directed, administered or controlled.
Debt Coverage Ratio The ratio of cash available for debt servicing to interest, principal and lease payments. It is a popular benchmark used in the measurement of an entity’s ability to produce enough cash to cover its debt payments. The higher this ratio is, the easier it is to obtain a loan.
Debt Management A formal agreement between the Authority and its’ creditors.
Debt Service The cost of paying principal and interest on borrowed money according to a pre‐determined payment schedule.
Department A basic organizational unit that is functionally unique in its delivery of services; each department can be subdivided into divisions.
Depreciation Drop in value; a method of allocating the cost of a tangible asset over its useful life.
Disbursement The expenditure of monies from an account.
Distinguished Budget A voluntary awards program administered by the Government of Finance.
Effluent An outflowing of water or gas from a natural body of water, or from a human‐made structure.
Encoder Receiver Transmitter (ERT)
Communications modules that fit on electric, gas or water meters. ERT’s encode consumption and tamper information from the meters and communicates the data to Itron data collection systems including handheld devices, mobile automatic reading devices and networks.
Encumbrance A commitment of appropriated funds to purchase an item or service. To encumber funds means to set aside or commit funds for a specified future expenditure.
Enterprise Fund A government owned fund that sells goods and services to the general public; are common in local government.
Environmental Management System (EMS)
Refers to the management of an organization’s environmental programs in a comprehensive, systematic, planned and documented manner. It includes the organizational structure, planning and resources for developing, implementing and maintaining policy for environmental protection.
Environmental Protection Agency (EPA)
The agency of the federal government of the United States charged with protecting human health and the environment by writing and enforcing regulations based on laws passed by Congress.
Expenditure The payment of funds against appropriations that reduce cash balance; are made for the purpose of acquiring an asset, service or settling a loss.
Feasibility Report An evaluation and analysis of the potential of a proposed project which is based on extensive investigation and research to support the process of decision making.
109

CAPE FEAR PUBLIC UTILITY AUTHORITY GLOSSARY
WORD/CONCEPT DEFINITION
Fiscal Year A 12‐month period designated as the operating year for accounting and budgeting purposes in an organization.
Fixed Assets Assets of long‐term character that are intended to continue to be held or used; includes land, buildings, machinery, furniture and other equipment.
Full time Equivalent A position converted to the decimal equivalent of a full‐time position .
Fund Accounting System used by non‐profit organizations, particularly governments.
Fund Balance Difference between assets and liabilities reported in a governmental fund on the modified accrual basis of accounting.
Generally Accepted Accounting Principles (GAAP)
Uniform minimum standards for financial accounting and recording, encompassing the conventions, rules and procedures that define accepted accounting principles.
Goal A statement of broad direction, purpose or intent; general and timeless.
Government Accounting Standards Board
The accepted standard setting body for establishing accounting and financial reporting principles.
Ground Water Water located beneath the ground surface in soil pore spaces and in the fractures of rock formations.
Infrastructure The basis physical and organizational structures needed for the operation of a society of enterprise (1), or the services the facilities necessary for an economy to function (2). It can be generally defined as the set of interconnected structural elements that provide the framework supporting an entire structure of development.
Interest Cost of using money.
Interest Earnings Interest earned on cash held in interest bearing deposits and accounts.
National Incident Management System (NIMS)
An emergency management doctrine used nationwide to coordinate emergency preparedness and incident management and response among the public and private sectors.
National Pollutant Discharge Elimination System (NPDES)
Controls water pollution by regulating point sources that discharge pollutants into waters of the United States.
Non‐Departmental Accounts
Items of expenditure essential to the operation of the Authority that do not fall within the function of any department.
Operating Budget The annual budget of an activity stated in terms of Budget Classification Code, functional/sub functional categories and cost accounts. It contains estimates of the total value of resources required for the performance of the operation; used to keep track of maintenance operations, salaries and interest payments.
Operating Expenses The cost for personnel, materials and equipment required for a department to function.
Operating Revenue Funds received to pay for on‐going operations. It includes rates and fees; used to pay for day‐to‐day services.
Ordinance A law made by a municipality or other local authority.
Outfall The discharge point of a waste stream into a body of water; alternatively it may be the outlet of a river, drain or a sewer where it discharges into the sea, a lake, etc. A wastewater treatment system discharges treated effluent to a water body from an outfall.
110

CAPE FEAR PUBLIC UTILITY AUTHORITY GLOSSARY
WORD/CONCEPT DEFINITION
Pay‐As‐You‐Go Basis AKA “Pay‐Go”; a term used to describe a financial policy by which capital outlays or capital projects are financed from current revenues rather than from borrowing.
Performance Measure Defines data that documents how effectively or efficiently a program is achieving its objectives.
Potable Water Drinking water.
Procurement The acquisition of goods or services. It is favorable that the goods or services are appropriate and that they are procured at the best possible cost to meet the needs of the purchaser in terms of quality and quantity, time and location.
Proprietary Fund An account in which certain (government) transactions are handled. Services that fit into a proprietary fund are grouped by similarities to evaluate their performance.
Revenues Sources of income financing the operations of the Authority.
Risk Management The process of identifying, assessing and controlling risks arising from operational factors and making decisions that balance risk costs with mission benefits.
SCADA (Supervisory Control & Data Acquisition)
A computer system that monitors and controls industrial, infrastructure or facility‐based processes.
Septage The material pumped out of a septage tank or onsite sewage facility.
Service Helping others with a specific need or want.
Stewardship An ethic that embodies responsible planning and management of resources.
Strategic Plan A process for determining where an organization is going over the next year or, more typically, 3 to 5 years (long term); some extend their vision to 20 years.
Strategic Vision Outlines what the organization wants to be, or how it wants the world in which it operates to be. This is a long‐term view and concentrates on the future.
Surface Water Water collecting on the ground or in a stream, river, lake, wetland or ocean; it is related to water collecting as groundwater or atmospheric water.
Sustainability The long‐term maintenance of responsibility, which has environmental, economic and social dimensions, and encompasses the concept of stewardship, the responsible management of resource use.
System Development Charges
Calculated charges to cover the cost of capacity in the Authority’s existing water and wastewater plants and transmission facilities, and the estimated cost of capacity in future treatment plants and facilities that are covered in the 10‐year Capital Improvement Plan.
111