fy’2020 financial update presentation
TRANSCRIPT

FY’2020 – Financial Update Presentation
PT BANK RAKYAT INDONESIA (PERSERO) Tbk.

OUTLINE
2
CEO Messages …………………………………………………………………………………………………………………………………………\
Investment Proposition ……………………………………………………………………………………………………………………………………
Macro Economy & Banking Industry …………………………………………………….…………………………..…….……..……….……....
3
5
9
BRI vs Industry ……………………………………………………………………………………………………………………………………….… 12
Economic Recovery Program (ERP) …………………………….…………………………………………………….…………………………...
BRI Strategies & Focus During Covid-19 Pandemic ……………………………………………………………………………………………..
13
18
BRI (Consolidated) …………………………………………………………………………………………………………………………………… 22
BRI (Bank Only) 26
1. Financial Highlights …………………………………….………………………………………………………………………………….. 27
2. Balance Sheet …………………………………………………………………………………………………………….………………… 28
3. Loan – Mix and Growth ………………………………………………………………………………………………………………...… 29
4. Deposits – Mix and Growth ………………………………………………………………………………………………………………. 34
5. Income Statement ………………………………………………………………………………………….……...…………………….. 35
6. Financial Ratios ………………………………………………………………………………………………………………………...…….. 40
Business Updates:
1. Micro Loans ………………..………………………………………………………………………………………….……………………. 42
2. Small and Medium Loans ……………………………………………..…………..……………………………………. 45
3. Consumer Loans……………………………………………….…………………..……..……..……..……..……….…………………… 47
4. Corporate and SoE Loans …………………………….………………………..……………………………..……..……….…….…… 49
5. BRI Digital Initiatives ……………………………………………………………………………………………………………………….. 51
6. BRI ESG Initiatives ……….………………………………………………………………………………………………………………………. 60
8. Subsidiaries …………………….……………………….……………………………...………………..….……..……..……..…….…….. 68
Key Takeaways ….…….……...……………………………………….………………………..………….……………………….……..………… 71
Guidance 2020 ……………………………………………………………………….……..……............................................................................ 73
Others ……………………………………………………………………….…………………………………………………………………………... 75

CEO MESSAGE – Moving Forward to the Light at the End of the Tunnel
3
2020 could be a year that will be remembered for all the worries brought about by Covid-19 pandemic. Even if there
will still be challenges in 2021, we see clearer signs of recovery and we are moving forward to the light at the end of
this covid-19 tunnel. The accelerated government spending has been able to withstand the economic slowdown. In
general, liquidity in the system is very adequate. The financial system regulators, BI and OJK, keep providing
accommodative policies to help accelerate economic recovery. The economic recovery trend also shown by increasing
BRI Micro and SME Index (BMSI). The Government’s Economic Recovery Programs was very well carried out with 80%
budget realization and BRI has contributed more than 60% in each program that has given BRI’s customers and BRI
itself a lot of positive impacts. Covid-19 Vaccination Program have also been rolled out in countries, including in
Indonesia, sooner than expected, which could be one of positive catalysts to improve economy in 2021.
As we look beyond 2020, we see that BRI’s business recovery is getting stronger as our loan restructuring keeps
declining from its peak at Rp193.7 Trillion in September 2020 to Rp186.6 Trillion in December 2020, below our
previous expectation of Rp200 Trillion. Even so, BRI will continue to remain watchful on our loan restructuring by close
monitoring and adequate provisioning to anticipate loan quality deterioration. Loan disbursement has recovered
especially in micro segment which has led to an increase in micro loan composition, reaching 40% of our total loans.
All in all, the recovering loan restructuring and loan disbursement has gradually improved our profitability. Moreover,
this pandemic has also encouraged the acceleration of our digital initiatives with promising results.
We are now more confident to enter 2021 as we move forward to the light at the end of the tunnel. We have
sharpened our corporate plan and evolved it into BRIvolution 2.0. Through our previous BRIvolution, we have
successfully unlocked new growth engines; ultra micro loans and digital initiatives. In BRIvolution 2.0, we will
strengthen BRI Group core for growth and scale up new growth engines which will ultimately bring us to our strategic
vision to be “The Most Valuable Banking Group in Southeast Asia & Champion of Financial Inclusion”.
Sunarso, CEO BRI

LIGHT AT THE END OF THE TUNNEL
LOAN DISBURSEMENT
Micro &SMEs
Micro
(Rp Trillion)
RECOVERING TREND OF
103.7
60.1
86.5 90.8
69.2
35.0
56.264.1
20,0 00
30,0 00
40,0 00
50,0 00
60,0 00
70,0 00
80,0 00
90,0 00
100 ,000
110 ,000
1Q'20 2Q'20 3Q'20 4Q'20
GDPGOV’T SPENDING
SUPPORT
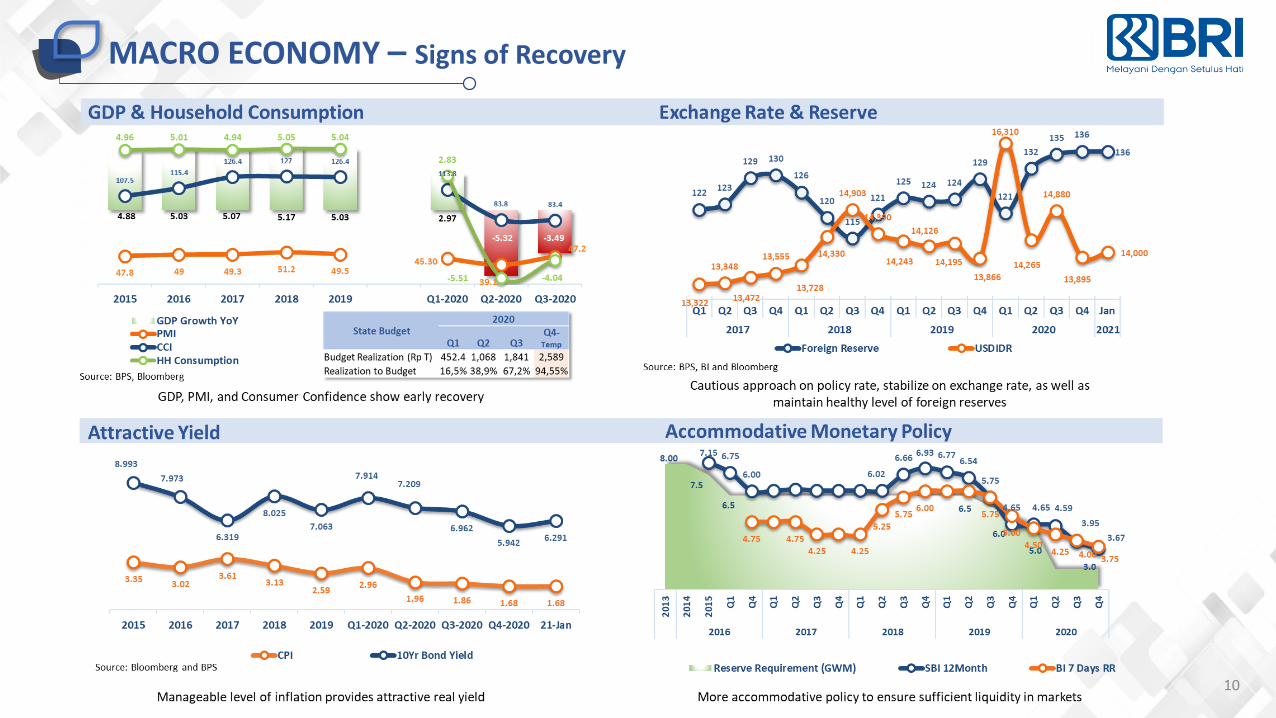
5.02% 4.97%
2.97%
-5.32%
-3.49%
-6.00%
-4.00%
-2.00%
0.0 0%
2.0 0%
4.0 0%
6.0 0%
Q3 '19 Q4 '19 Q1 '20 Q2 '20 Q3 '20 Q4 '20
ACCELERATED
95%of Total Government Budget
+ Rp773 T
Govt Spending
GDP Growth YoY
452
1,068
1,841
2,589
-
500
1,00 0
1,50 0
2,00 0
2,50 0
3,00 0
+ Rp616 T
LOAN RESTRUCTURING(Rp Trillion)
FLATTENED TREND OF
PROFITABILITY (Rp Trillion)
BOTTOMED OUT
CAPITALSTRONG
+ Rp748 T
INVESTMENT PROPOSITION

6
WHY INVEST IN BRI?

7
KEEP INNOVATING FOR BUSINESS SUSTAINABILITY

8Ticket Size Tenor
Av
era
ge
tic
ke
t si
ze
2015
2020 --- 2025
Rp50 Mio
Rp40 Mio
Rp20 MioFintech & E-Commerce Partnership
KUR MicroRp15 Mio
KUR MicroRp18 Mio
COMMITTED TO GROW MICRO & SMEs – To Be The Champion of Financial Inclusion
1 year
6 months
0 month
2 years
3 years
5 years
ten
or
Rp4 – 7.5 Mio
Rp55 Mio
KUR MicroRp22 Mio
Rp8.7 Mio
Rp2.9 Mio
Commercial Micro Loan Subsidized Micro Loan
Potential Ultra Micro(>50 Mio businesses)
20192010
KUPEDES
KUPEDES
KUPEDES
KUPEDES
KUR Super Micro
45%Micro Composition
in 2025
BPUM Customers
…Go Smaller, Go Shorter, Go Faster…
Rp2.5 Mio

MACRO ECONOMY & BANKING INDUSTRY
10
MACRO ECONOMY – Signs of Recovery

11
BRI MICRO & SME INDEX (BMSI) : The First MSME Index in Indonesia
As a prominent player of MSME financing in Indonesia, BRI conduct MSME business activity tracking throught survey.
Increasing Debt Payment Capacity
BMSI shows a recovery signs…

12
BRI vs INDUSTRY – Increasing Market Share
Market ShareLOAN DEPOSIT
LoanGrowth
BRI Industry
3.4% - 1.4%
DepositGrowth
11.6%12.1%
N I M N P L
L D R
5.89% 3.12%
84.17%
C A R
20.77%
BRI Industry BRI Industry
BRI Industry BRI Industry
4.41% 3.18%
82.33% 24.25%
Source: Indonesian Banking Statistic - OJK & BRI Performance Report
November 2020
13.8%
14.5%
14.9%15.1%
15.3%15.5%
16.1%
12. 5%
13. 0%
13. 5%
14. 0%
14. 5%
15. 0%
15. 5%
16. 0%
16. 5%
2015 2016 2017 2018 2019 Nov-19 Nov-20
14.6%
15.0%15.2%
16.0%16.2%
15.6%15.7%
13. 5%
14. 0%
14. 5%
15. 0%
15. 5%
16. 0%
16. 5%
2015 2016 2017 2018 2019 Nov-19 Nov-20
ECONOMIC RECOVERY PROGRAM (ERP)

14
CONTINUATION OF ERP PROGRAM IN 2021
Government still allocates budget for Economic Recovery Program in 2021
Budget Deficit2021
5.70% of GDP(6.09% in 2020)
Covid-19 BudgetRp356.5 T
Financing
3
2
Based on The Law No.2/2020 Article 16 No.1, BI is allowed to buy Gov’t Bond in the primary market.
1
1
Source, Indonesia Ministry of Finance, June 2020
Health
Rp25.4 T
Social Safety Net
Rp110.2 T
Economic Recovery Program
Rp84.1 T
Local Government
Rp136.7 T
Business Incentive SME Corporate
Rp20.4 T (-83%) Rp48.8 T (-58%) Rp14.9 T (-75%)

VACCINATION PROGRAM – Positive Catalyst for Economic Recoveries
15
Vaccination Period

16
ECONOMIC RECOVERY PROGRAM – Maximizing Benefits for Borrowers & BRI
Economic Recovery Program
Economic Recovery Program implementation has given positive impacts, not only for borrowers but also for BRI – more manageable credit risk, secured interest income, source of CASA, and Ultra Micro penetration

17
ECONOMIC RECOVERY PROGRAM – Strengthen the Micro Journey
.....productive assistance increases CASA and future micro credit pipeline.....
7.7 Mio
Micro Businesses
985 Thousand
Borrowers
6.5 Mio
Borrowers
3.2 Mio
Borrowers
45%Micro
CompositionIn 2025

BRI STRATEGIES & FOCUS DURING COVID-19 PANDEMIC

19
BRI FOCUS AND STRATEGIES
PEOPLE’S FIRST
SUSTAINABLEBUSINESS GROWTH
GOOD CORPORATE GOVERNANCE
Health and Safety Protocol
Work From Home
Digital Initiatives Optimization
• Banking premises disinfection and sterilization• Vaccines for employees• Health care products for employees (masks,
hand sanitizers, and vitamins)
• Shorten banking operational hours• Work From Home• Flexible office space
• BRIStars: Digital office application• BRISpot: Digital loan processing• BRISIM: Daily monitoring Dashboard
Loan portfolio
• Selective Growth• Loan restructuring program• Loan relaxation program
Liquidity and Market Activities
• Maintain reserve requirement, SR, LDR, RIM • Maintain long position on Net Foreign Position• Maintain Cash Ratio
GCG Implementation
The principles of Good Corporate Governance remain in place

20
COVID-19 RESTRUCTURING TREND – Gradually Declining
Restructured Loans IDR Trillion
# Restructured Borrowers in Million
Restru. Loans By Segment Restru. Loans By Region
“Covid-19 restructured loan has been gradually decreasing as the economy starts to recover and borrowers especially in Micro
Segment start to pay”
“Further restructuring comes from Corporate Segment with better than our previous estimation of Rp200 Tr in Total Loan
Restructured”
44%
6%
3%
43%
5%
Micro ConsumerMedium Small CommercialCorporate and SOE
20%
41%
15%
24%
Jakarta Java Ex. Jakarta Sumatra Mid&East
14.9
101.2
160.5 171.9 183.7 189.1 193.7 192.3 189.3 186.6
14.9
86.3
59.3 11.4 11.8 5.4 4.6 -1.4 -3.0 -2,6
1.7%
11.8%
18.7%20.1%
21.5% 22.1% 22.4% 22.0% 21.6% 21.2%
-5.0%
0.0 %
5.0 %
10. 0%
15. 0%
20. 0%
25. 0%
-50.0
-
50.0
100 .0
150 .0
200 .0
250 .0
Mar Apr May Jun Jul Aug Sep Okt Nov 28-Des
Total Monthly % to Total Loan
0.13
1.41
2.64 2.82
2.95 2.98 2.95 2.95 2.88 2,83
0.1
1.3 1.2 0.2 0.1 0.0 -0.0 0.0 -0.1 -0.1
1.1%
11.1%
20.7%22.2% 23.2% 23.4% 23.2% 23.2% 22.7% 22.2%
-5.0%
5.0 %
15. 0%
25. 0%
-0.50
-
0.50
1.00
1.50
2.00
2.50
3.00
3.50
Mar Apr May Jun Jul Aug Sep Okt Nov 28-Des
Total Monthly % to Total Loan
Des
Des

21
BRI SUPPORT FOR Micro & SME’s BUSINESS RECOVERIES

22
BRI (CONSOLIDATED)

23
FINANCIAL HIGHLIGHT - Consolidated
IDR Billion
Description 1Q'20 1H'20 9M'20 2019 2020 g QoQ g YoY
Asset/Liabilities
Total Assets (IDR Billion) 1,358,979 1,387,759 1,447,848 1,416,759 1,511,805 4.4% 6.7%
Total Loans (Gross) (IDR Billion) 930,726 922,967 935,347 903,197 938,374 0.3% 3.9%
Total Deposits (IDR Billion) 1,028,996 1,072,501 1,131,928 1,021,197 1,121,102 -1.0% 9.8%
Asset Quality
NPL (gross) 3.00% 3.13% 3.12% 2.80% 2.99%
NPL (nett) 0.77% 0.89% 0.87% 1.19% 0.87%
Liquidity
CASA 55.90% 55.81% 59.02% 57.70% 59.67%
LDR 90.45% 86.06% 82.63% 88.45% 83.70%
Profitability
Net Profit (IDR Billion) 8,170 10,201 14,154 34,414 18,660 14.0% -45.8%
NIM 6.59% 5.63% 5.64% 6.73% 5.86%
Cost Efficiency Ratio (CER) 43.79% 51.29% 51.08% 41.22% 47.51%
Operating Expense to Operating Income 75.22% 78.78% 81.74% 72.08% 82.46%
ROA before tax 2.99% 2.26% 1.95% 3.28% 1.87%
ROE Tier 1 19.95% 12.02% 10.81% 18.40% 10.48%
Capital
Tier1 CAR 17.45% 19.05% 19.82% 21.65% 20.09%
Total CAR 18.56% 20.15% 20.92% 22.77% 21.17%

24
BALANCE SHEET - Consolidated
√ √ Total customer deposits include syirkah fund√ √ Loan and NPL are total of BRI, BRISyariah and BRIAgro
IDR Billion
Description 1Q'20 1H'20 9M'20 2019 2020 g QoQ g YoY
Total Assets 1,358,979 1,387,759 1,447,848 1,416,759 1,511,805 4.4% 6.7%
- Gross Loans 930,726 922,967 935,347 903,197 938,374 0.3% 3.9%
- Government Bonds (Recap) 1,130 1,130 - 1,130 - - -
- Other Earnings Assets 341,133 397,685 443,215 393,886 491,204 10.8% 24.7%
Total Earning Assets 1,272,989 1,321,782 1,378,562 1,298,214 1,429,578 3.7% 10.1%
Earning Assets Provision (60,988) (57,277) (62,980) (39,329) (69,161) 9.8% 75.9%
Total Earning Assets (net) 1,212,001 1,264,505 1,315,582 1,258,884 1,360,417 3.4% 8.1%
Total Non Earning Assets 146,978 123,254 132,266 157,875 151,387 14.5% -4.1%
Total Liabilities & S.E 1,358,979 1,387,759 1,447,848 1,416,759 1,511,805 4.4% 6.7%
Total Customer Deposits 1,028,996 1,072,501 1,131,928 1,021,197 1,121,102 -1.0% 9.8%
- Demand Deposits 177,085 184,277 229,184 174,928 193,078 -15.8% 10.4%
- Savings 398,098 414,283 438,914 414,333 475,848 8.4% 14.8%
- Time Deposits 453,814 473,941 463,830 431,936 452,176 -2.5% 4.7%
Other Interest Bearing Liabilities 97,742 85,640 72,711 138,881 136,188 87.3% -1.9%
Non Interest Bearing Liabilities 52,601 41,783 48,542 47,897 54,604 12.5% 14.0%
Tier I Capital 163,810 175,577 184,501 197,219 188,647 2.2% -4.3%
Total Shareholder's Equity 179,639 187,835 194,668 208,784 199,910 2.7% -4.3%

25
INCOME STATEMENT - Consolidated
IDR Billion
Description 1Q'20 2Q'20 3Q'20 4Q'20 g QoQ 2019 2020 g YoY
Interest Income 31,343 25,235 29,280 31,074 6.1% 121,756 116,933 -4.0%
Interest Expense (10,376) (9,700) (9,733) (7,913) -18.7% (40,049) (37,723) -5.8%
Net Interest Income 20,967 15,535 19,547 23,161 18.5% 81,707 79,210 -3.1%
Net Premium Income 559 25 456 (157) -134.5% 1,011 882 -12.8%
Fee & Other Opr. Income 8,002 5,735 7,737 7,990 3.3% 28,439 29,464 3.6%
Gross Operating Income 40,861 32,229 38,791 40,725 5.0% 155,569 152,605 -1.9%
Other Operating Expenses (12,808) (12,610) (13,314) (11,200) -15.9% (44,966) (49,931) 11.0%
Pre Provision Operating Profit 16,720 8,685 14,425 19,794 37.2% 66,192 59,624 -9.9%
Provision Expenses (6,593) (3,299) (9,504) (13,454) 41.6% (22,760) (32,850) 44.3%
Non Operating Income (Net) 29 (2) (50) (26) -48.5% (68) (49) -27.3%
Profit Before Tax n Minor. Int. 10,156 5,384 4,871 6,314 29.6% 43,364 26,725 -38.4%
Net Profit 8,170 2,031 3,953 4,507 14.0% 34,414 18,660 -45.8%

BRI (BANK ONLY)

27
FINANCIAL HIGHLIGHTS
√ NPL (net) is after provision for impaired loan
IDR Billion
Description 1Q'20 1H'20 9M'20 2019 2020 g QoQ g YoY
Asset/Liabilities
Total Assets (IDR Billion) 1,287,094 1,309,321 1,359,556 1,343,078 1,421,785 4.6% 5.9%
Total Loans (Gross) (IDR Billion) 884,246 869,042 877,547 859,558 880,675 0.4% 2.5%
Total Deposits (IDR Billion) 978,326 1,013,156 1,062,702 969,750 1,052,664 -0.9% 8.6%
Asset Quality
NPL (gross) 2.81% 2.98% 3.02% 2.62% 2.94%
NPL (nett) 0.63% 0.77% 0.78% 1.04% 0.80%
Liquidity
CASA 56.86% 56.64% 60.15% 59.01% 61.00%
LDR 90.39% 85.78% 82.58% 88.64% 83.66%
RIM/MIR (Macroprudential Intermediary Ratio) 86.09% 82.26% 80.05% 85.31% 80.03%
LCR 236.15% 243.57% 255.93% 229.98% 236.06%
NSFR 132.06% 138.10% 141.95% 136.17% 149.06%
Profitability
Net Profit (IDR Billion) 8,305 10,201 14,047 34,029 18,353 12.0% -46.1%
Cost of Fund (CoF) 3.65% 3.54% 3.45% 3.58% 3.22%
NIM 6.66% 5.72% 5.76% 6.98% 6.00%
Cost Efficiency Ratio (CER) 41.19% 50.23% 50.04% 40.26% 46.60%
Operating Expense to Operating Income 72.97% 77.49% 80.64% 70.10% 81.22%
ROA before tax 3.19% 2.41% 2.07% 3.50% 1.98%
ROE Tier 1 20.39% 12.62% 11.43% 19.41% 11.05%
ROE B/S 18.33% 11.33% 10.26% 17.77% 9.91%
Capital
Tier1 CAR 17.20% 18.81% 19.37% 21.52% 19.59%
Total CAR 18.23% 19.83% 20.38% 22.55% 20.61%

28
BALANCE SHEETIDR Billion
Description 1Q'20 1H'20 9M'20 2019 2020 g QoQ g YoY
Total Assets 1,287,094 1,309,321 1,359,556 1,343,078 1,421,785 4.6% 5.9%
- Gross Loans 884,246 869,042 877,547 859,558 880,675 0.4% 2.5%
- Government Bonds (Recap) 1,130 1,130 - 1,130 - - -
- Other Earnings Assets 324,067 380,682 420,502 372,442 467,502 11.2% 25.5%
Total Earning Assets 1,209,443 1,250,855 1,298,050 1,233,131 1,348,177 3.9% 9.3%
Earning Assets Provision (58,701) (54,798) (60,399) (37,670) (66,444) 10.0% 76.4%
Total Earning Assets (net) 1,150,742 1,196,057 1,237,651 1,195,460 1,281,733 3.6% 7.2%
Total Non Earning Assets 136,351 113,264 121,905 147,617 140,052 14.9% -5.1%
Total Liabilities & S.E 1,287,094 1,309,321 1,359,556 1,343,078 1,421,785 4.6% 5.9%
Total Customer Deposits 978,326 1,013,156 1,062,702 969,750 1,052,664 -0.9% 8.6%
- Demand Deposits 168,593 172,763 215,173 167,843 183,002 -15.0% 9.0%
- Savings 387,642 401,092 424,002 404,360 459,148 8.3% 13.6%
- Time Deposits 422,091 439,301 423,527 397,547 410,513 -3.1% 3.3%
Other Interest Bearing Liabilities 95,574 84,351 71,974 135,752 134,912 87.4% -0.6%
Non Interest Bearing Liabilities 37,757 28,719 35,260 33,910 39,850 13.0% 17.5%
Tier I Capital 153,694 165,118 170,426 187,012 174,757 2.5% -6.6%
Total Shareholder's Equity 175,437 183,095 189,619 203,665 194,359 2.5% -4.6%

33.3 34.1 34.3 35.8
39.9
15.8 16.3 16.4 16.3 16.3
21.3 21.9 22.9 23.1 22.4
2.9 2.8 2.3 2.5 2.3 12.1 11.0 11.4 10.9
10.6
14.6 13.8 12.7 11.3 8.5
0%
10%
20%
30%
40%
50%
60%
70%
80%
90%
100 %
2016 2017 2018 2019 2020
29
LOAN MIX – Reaching Micro Composition of 40%
√ Started in 2018, Loan has been adjusted due to reclassification of Trade Finance/LC Related Receivables from Loan to Other Earning Assets-Other Receivables
Loan Outstanding – by business segment
(IDR Trillion)
Composition – by business segment (%)
14.2YoY Growth ( % ) 2.3 -0.7 -7.2 -0.1 -23.3 2.5(Rp Tn) 43.6 3.2 -1.4 -1.6 -0.1 -22.6 21.1
Micro Consumer Small Medium Corporate Non SOE SOE Total
…Accelerating micro loan composition increase……Growth driven by Micro, Small, and Consumer segment…
211.5 239.5 274.3 307.7 351.3
100.2 114.6
130.8 140.5
143.7 135.5
153.9
183.0
198.7
197.2
18.1
19.9
18.3
21.5 20.0
77.2
77.4
91.0
93.8 93.7
92.8
97.1
101.4
97.4 74.7
635.3
702.4
798.9
859.6 880.7
-
100 .0
200 .0
300 .0
400 .0
500 .0
600 .0
700 .0
800 .0
900 .0
1,00 0.0
-
100 .0
200 .0
300 .0
400 .0
500 .0
600 .0
700 .0
800 .0
900 .0
1,00 0.0
2016 2017 2018 2019 2020

30
LOAN DISBURSEMENT TREND - Ongoing RecoveryIDR Trillion
Total Micro & SMEs Micro
103.7 60.1 86.5 90.8
31.8
37.134.8
19.7
15.7
24.828.1
25.8
32.7
28.9
34.1
27.8
-
5.0
10.0
15.0
20.0
25.0
30.0
35.0
40.0
0
20
40
60
80
100
120
Jan Feb Mar Apr May Jun Jul Aug Sep Okt Nov Des
Quarterly Monthly
69.2 35.0 56.2 64.1
21.5 24.2 23.5
10.8 8.4
15.8 18.3
16.8
21.1 20.6
25.2
18.3
-
5.0
10.0
15.0
20.0
25.0
30.0
0
10
20
30
40
50
60
70
80
Jan Feb Mar Apr May Jun Jul Aug Sep Okt Nov Des
Quarterly Monthly
14.3 7.5 10.7 10.1
4.7
5.5
4.1
2.5
1.8
3.2 3.3 2.9
4.6
2.7
3.4
4.0
-
1.0
2.0
3.0
4.0
5.0
6.0
0
2
4
6
8
10
12
14
16
Jan Feb Mar Apr May Jun Jul Aug Sep Okt Nov Des
Quarterly Monthly
Small & Medium
20.3 17.6 19.5 16.6
5.6
7.4 7.3
6.3
5.5 5.8
6.4 6.1
7.0
5.5 5.5 5.5
-
1.0
2.0
3.0
4.0
5.0
6.0
7.0
8.0
0
5
10
15
20
25
Jan Feb Mar Apr May Jun Jul Aug Sep Okt Nov Des
Quarterly Monthly
Consumer

31
LOAN QUALITY – Manageable During Pandemic
Non Performing Loan – by segment (%) Special Mention – by segment (%)
√ Started in 2018, Loan has been adjusted due to reclassification of Trade Finance/LC Related Receivables from Loan to Other Earning Assets-Other Receivables
NPL % 2016 2017 2018 2019 2020
Micro 1.00 1.08 1.01 1.18 0.83
Consumer 1.18 1.05 1.03 1.10 1.49
Small 2.95 3.01 3.14 3.17 3.61
Medium 7.90 5.45 6.80 5.38 4.61
Corporate 5.40 6.91 5.49 8.75 12.58
SoE - - 1.10 1.73 1.30
Total NPL 2.03 2.12 2.16 2.62 2.94
SML % 2016 2017 2018 2019 2020
Micro 4.43 4.04 3.51 3.51 2.47
Consumer 3.04 2.85 2.49 2.52 2.69
Small 6.06 5.79 4.28 4.63 3.19
Medium 3.04 3.24 2.87 2.97 3.07
Corporate 3.79 5.86 7.73 5.82 2.31
SoE 3.30 1.98 0.86 4.29 3.53
Total SML 4.28 4.12 3.65 3.93 2.75

Consumer7.4%
Corporate19.7%
Medium3.6%
Micro25.2%
Small Comm34.5%
SOE9.5%
RESTRUCTURED LOANS & LOAN AT RISK
Restructured Loans% to Total Loan
Loan At Risk % to Total Loan
6.0%
7.1%
Excl. Covid-19 Incl. Covid-19
5.0%
26.2%
28.3%
9.8%
2019 2020 2020
2019 2020 2020
Restructured Loan by Segment
2019 2020
LAR by Segment
2019 2020
Consumer5.2%
Corporate8.9%
Medium2.8%
Micro39.1%
Small Comm39.4%
SOE4.6%
Consumer3.1%
Corporate18.8%
Medium3.8%
Micro19.4%
Small Comm40.9%
SOE13.9%
Consumer6.5% Corporate
8.7%
Medium2.8%
Micro38.3%
Small Comm38.4%
SOE5.3%
32
2.8%
1.6%
2.7%
7.1%
19.7%
1.2%
0.3%
21.2%
Current SML NPL Total
22.6%2.8%
2.9% 28.3%
Restructured Loan by Quality (% to Total Loan)
Non CovidCovid
2.8%
0.4%1.7%
5.0%
19.7%
1.2%0.3%
21.2%
Current SML NPL LAR
Covid Non Covid
22.6%1.6%
2.0% 26.2%
LAR by Quality (% to Total Loan)
Excl. Covid-19 Incl. Covid-19

33
COVERAGE, WRITE OFF & RECOVERY – Enough Cushion During Pandemic
NPL Coverage Ratio
Write Off & Recovery
IDR Trillion
8.4 9.512.2
17.013.7
4.5 5.0 6.2 7.0 7.1
52.8% 53.1% 51.0%
41.1%
52.4%
0.0 %
10. 0%
20. 0%
30. 0%
40. 0%
50. 0%
60. 0%
-
2.0
4.0
6.0
8.0
10.0
12.0
14.0
16.0
18.0
2016 2017 2018 2019 2020
Write Off Recovery Recovery to Write Off
…Providing more cushion to mitigate loan deterioration…
21.929.1
34.6 37.5
64.1
12.9 14.9 17.222.5 25.9
170.3%195.5% 200.6%
166.6%
248.0%
00%
50%
100 %
150 %
200 %
250 %
300 %
-
10.0 0
20.0 0
30.0 0
40.0 0
50.0 0
60.0 0
70.0 0
2016 2017 2018 2019 2020
Provision NPL NPL Coverage
LAR Coverage Ratio (Inc. Covid-19)
12.93%
28.92% 29.77% 28.26%
48.66%
20.63% 21.84%25.77%
0.0 0%
10. 00%
20. 00%
30. 00%
40. 00%
50. 00%
60. 00%
Mar Jun Sep Des
LAR LAR Coverage
34
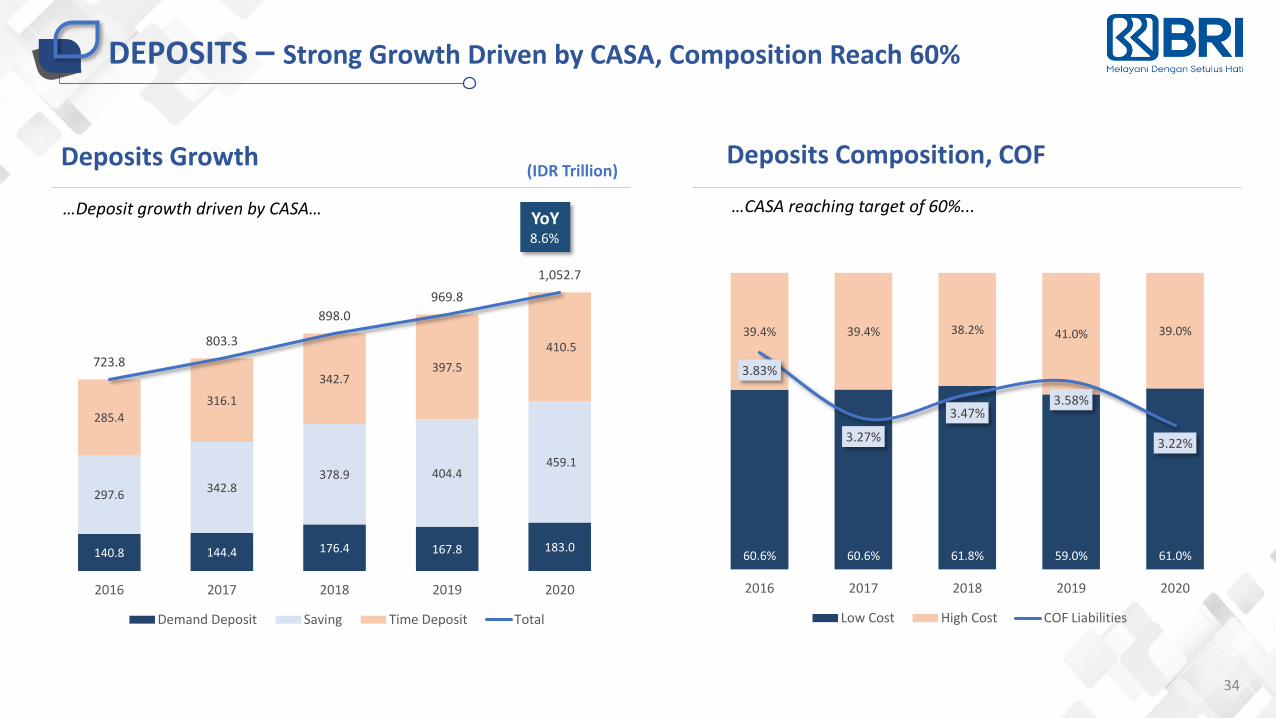
DEPOSITS – Strong Growth Driven by CASA, Composition Reach 60%
Deposits Composition, COFDeposits Growth (IDR Trillion)
…CASA reaching target of 60%... …Deposit growth driven by CASA…YoY8.6%
140.8 144.4 176.4 167.8 183.0
297.6 342.8
378.9 404.4 459.1
285.4
316.1
342.7 397.5
410.5 723.8
803.3
898.0
969.8
1,052.7
0.0
200 .0
400 .0
600 .0
800 .0
1,0 00.0
1,2 00.0
0.0
200 .0
400 .0
600 .0
800 .0
1,0 00.0
1,2 00.0
2016 2017 2018 2019 2020
Demand Deposit Saving Time Deposit Total
60.6% 60.6% 61.8% 59.0% 61.0%
39.4% 39.4% 38.2% 41.0% 39.0%
3.83%
3.27%
3.47%3.58%
3.22%
2.0 0%
2.5 0%
3.0 0%
3.5 0%
4.0 0%
4.5 0%
5.0 0%
0.0 %
20. 0%
40. 0%
60. 0%
80. 0%
100 .0%
120 .0%
2016 2017 2018 2019 2020
Low Cost High Cost COF Liabilities

35
INCOME STATEMENT – Increasing PPOP Supported by Recovering NII
*) Detail on the Fee & Other Operating Income on page 35**) Annualized – Excluding Treasury Stock
IDR Billion
Description 1Q'20 2Q'20 3Q'20 4Q'20 g QoQ 2019 2020 g YoY
Interest Income 29,648 23,514 27,663 29,134 5.3% 115,639 109,959 -4.9%
Interest from Loans 26,031 20,531 23,778 25,286 6.3% 103,028 95,626 -7.2%
Int. from Other Earning Assets 3,617 2,984 3,885 3,848 -1.0% 12,611 14,333 13.7%
Interest Expense (9,619) (8,991) (9,006) (7,196) -20.1% (37,078) (34,812) -6.1%
Net Interest Income 20,029 14,523 18,657 21,938 17.6% 78,560 75,147 -4.3%
Fee & Other Opr. Income * 7,855 5,859 7,338 7,379 0.6% 27,552 28,430 3.2%
Gross Operating Income 27,884 20,382 25,994 29,317 12.8% 106,112 103,577 -2.4%
Operating Expenses (11,398) (12,212) (12,294) (10,493) -14.7% (41,782) (46,396) 11.0%
Pre Provision Operating Profit 16,486 8,170 13,700 18,824 37.4% 64,329 57,181 -11.1%
Provision Expenses (6,224) (2,977) (9,009) (12,780) 41.9% (21,307) (30,989) 45.4%
Non Operating Income (Net) (4) (2) 9 (34) -463.0% (72) (31) -57.6%
Profit Before Tax n Minor. Int. 10,259 5,191 4,701 6,011 27.9% 42,950 26,161 -39.1%
Tax Expense (1,954) (3,295) (855) (1,704) 99.4% (8,921) (7,808) -12.5%
Net Profit 8,305 1,896 3,846 4,306 12.0% 34,029 18,353 -46.1%
EPS** 68 15 31 35 12.0% 278 150 -46.1%

36
RECOVERING PROFITABILITY TREND
(IDR Trillion)PPOP
Cost of Fund Net Interest Margin
(IDR Trillion)
3.65% 3.44% 3.26% 2.56%
3.60% 3.63%
3.71%
3.45% 3.47% 3.40% 3.42% 3.34%3.01%
2.72%2.52% 2.45%
3.60% 3.62%
3.65%
3.60% 3.57% 3.54% 3.53% 3.50% 3.45% 3.37% 3.29% 3.22%
0
0.0 05
0.0 1
0.0 15
0.0 2
0.0 25
0.0 3
0.0 35
0.0 4
Jan Feb Mar Apr Mei Jun Jul Aug Sep Okt Nov Des
COF Quarterly COF Monthly COF YtD
7.00% 4.46% 5.80% 6.68%
7.21%
6.76%
7.08%
3.20%
4.62%
5.59%5.30%
5.89%6.41% 6.18%
6.70%7.29%
7.21%
6.97%
7.00%6.08%
5.77% 5.72% 5.66%
5.68% 5.76% 5.80% 5.89% 6.00%
0
0.0 1
0.0 2
0.0 3
0.0 4
0.0 5
0.0 6
0.0 7
0.0 8
Jan Feb Mar Apr Mei Jun Jul Aug Sep Okt Nov Des
NIM Quarterly NIM Monthly NIM YtD
20.0
14.5
18.7
22.0
16.5
8.2
13.7
18.8
6.2
3.0
9.0
13.2
8.3
1.93.8 4.5
0.0
5.0
10. 0
15. 0
20. 0
25. 0
1Q'20 2Q'20 3Q'20 4Q'20
NII PPOP Provision Exp. Net Profit
Profitability Trend
16.49 8.17 13.70 18.82
6.45
5.12 4.91
0.92
2.52
4.73 4.43 4.06
5.20 5.62 5.61
7.60
0.0 0
1.0 0
2.0 0
3.0 0
4.0 0
5.0 0
6.0 0
7.0 0
8.0 0
0
2
4
6
8
10
12
14
16
18
20
Jan Feb Mar Apr Mei Jun Jul Aug Sep Okt Nov Des
Quarterly Monthly
37
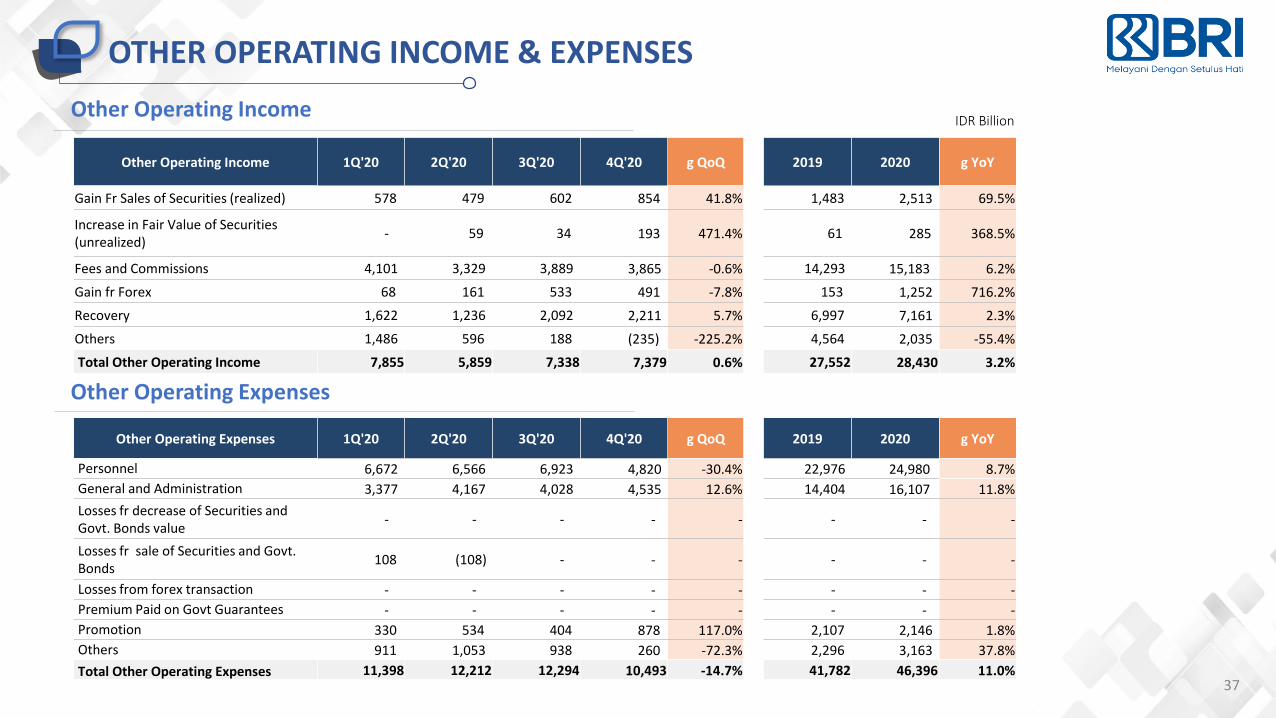
OTHER OPERATING INCOME & EXPENSES
IDR BillionOther Operating Income
Other Operating Expenses
Other Operating Income 1Q'20 2Q'20 3Q'20 4Q'20 g QoQ 2019 2020 g YoY
Gain Fr Sales of Securities (realized) 578 479 602 854 41.8% 1,483 2,513 69.5%
Increase in Fair Value of Securities (unrealized)
- 59 34 193 471.4% 61 285 368.5%
Fees and Commissions 4,101 3,329 3,889 3,865 -0.6% 14,293 15,183 6.2%
Gain fr Forex 68 161 533 491 -7.8% 153 1,252 716.2%
Recovery 1,622 1,236 2,092 2,211 5.7% 6,997 7,161 2.3%
Others 1,486 596 188 (235) -225.2% 4,564 2,035 -55.4%
Total Other Operating Income 7,855 5,859 7,338 7,379 0.6% 27,552 28,430 3.2%
Other Operating Expenses 1Q'20 2Q'20 3Q'20 4Q'20 g QoQ 2019 2020 g YoY
Personnel 6,672 6,566 6,923 4,820 -30.4% 22,976 24,980 8.7%
General and Administration 3,377 4,167 4,028 4,535 12.6% 14,404 16,107 11.8%
Losses fr decrease of Securities andGovt. Bonds value
- - - - - - - -
Losses fr sale of Securities and Govt.Bonds
108 (108) - - - - - -
Losses from forex transaction - - - - - - - -
Premium Paid on Govt Guarantees - - - - - - - -
Promotion 330 534 404 878 117.0% 2,107 2,146 1.8%
Others 911 1,053 938 260 -72.3% 2,296 3,163 37.8%
Total Other Operating Expenses 11,398 12,212 12,294 10,493 -14.7% 41,782 46,396 11.0%

4,024 28%
4,913 34%
1,674 12%
1,835 13%
815 6%
362 2%
671 5%
Deposit Adm Fee E-Channel Related Fee
Loan Adm Fee Trade Finance & Int'l Business Related Fee
Non E-Channel Related Fee Insurance Related Fee
Others
Fee & Other Operating Income Fees and Commission – Composition (IDR Billion)
Growth YoY
Fees and Commissions income grew strong, reaching 11.0% of Total Income.
YoY g = 3.2%
38
FEE & OTHER OPERATING INCOME – Shifting to Transaction Based Fee Income
2019 2020
(IDR Billion)
9,210 10,303 11,900 14,293 15,183
4,461 5,044
6,200
6,997 7,161
3,008 3,346
4,676
6,261 6,086
16,679 18,693
22,777
27,552 28,430
-
5,00 0
10,0 00
15,0 00
20,0 00
25,0 00
30,0 00
35,0 00
2016 2017 2018 2019 2020
Fees and Commissions Recovery Others Total
4,177 27%
5,772 38%
1,529 10%
1,628 11%
997 7%
456 3%
625 4%
-6.9%
25.8%
22.3%
-11.3%
-8.7%
17.5%
3.8%
Others
Insurance Related Fee
Non E-Channel Related Fee
Trade Finance & Int'l Business Related Fee
Loan Adm Fee
E-Channel Related Fee
Deposit Adm Fee
YoY g = 6.2%

39
CAPITAL & CET1 RATIO – Adequate Capital During Pandemic
… Increasing CAR supported by more efficient capital-used expansion, OCI-securities gain, and ESA program, provides room for higher dividend payout…
*Include Capital Conservation Buffer (2.5%)
21.95%
20.15%21.52%
17.20%
18.81% 19.37% 19.59%
1.01%
1.06%
1.03%
1.02%
1.02%1.02% 1.02%
22.96%
21.21%
22.55%
18.23%
19.83%20.38% 20.61%
10. 00%
12. 00%
14. 00%
16. 00%
18. 00%
20. 00%
22. 00%
24. 00%
10. 00%
12. 00%
14. 00%
16. 00%
18. 00%
20. 00%
22. 00%
24. 00%
2017 2018 2019 1Q'20 1H'20 9M'20 FY'20
Tier 1 CAR Tier 2 CAR Total CAR
12%
Risk AppetiteStatement
17,0%
RegulatoryRequirement*
14,5%DPO
60%DPO
50%DPO
45%
40
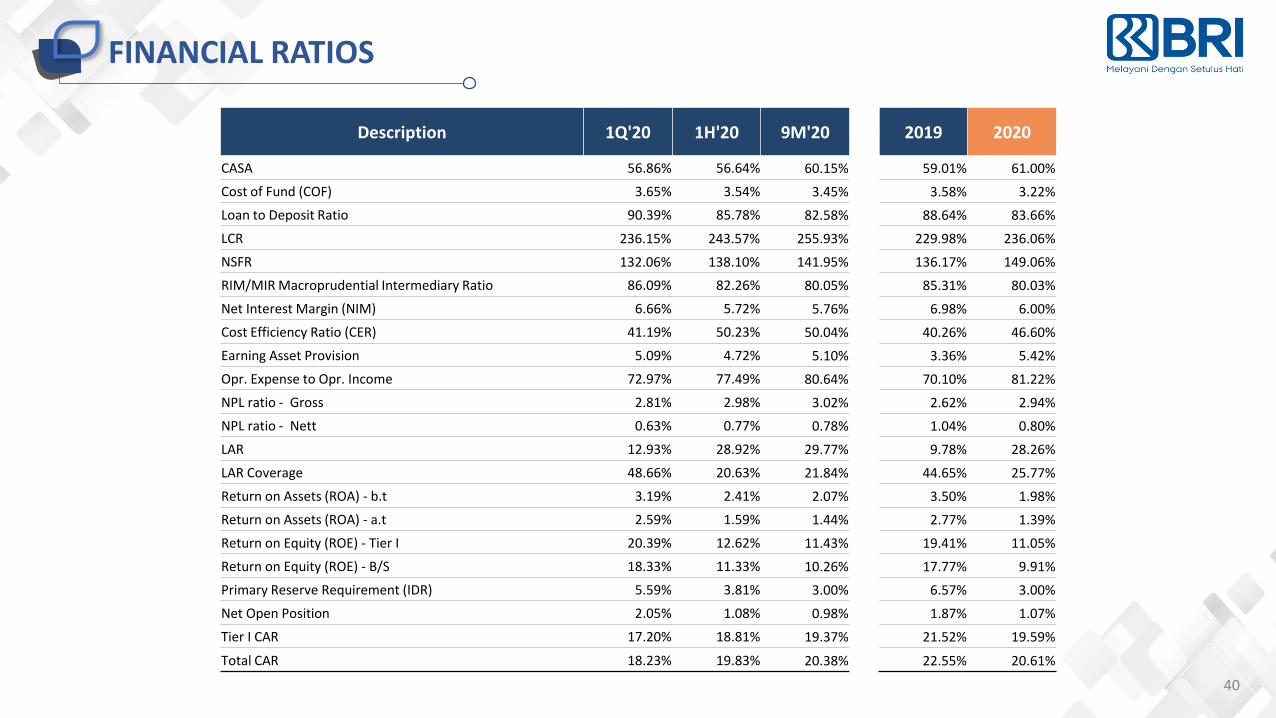
FINANCIAL RATIOS
Description 1Q'20 1H'20 9M'20 2019 2020
CASA 56.86% 56.64% 60.15% 59.01% 61.00%
Cost of Fund (COF) 3.65% 3.54% 3.45% 3.58% 3.22%
Loan to Deposit Ratio 90.39% 85.78% 82.58% 88.64% 83.66%
LCR 236.15% 243.57% 255.93% 229.98% 236.06%
NSFR 132.06% 138.10% 141.95% 136.17% 149.06%
RIM/MIR Macroprudential Intermediary Ratio 86.09% 82.26% 80.05% 85.31% 80.03%
Net Interest Margin (NIM) 6.66% 5.72% 5.76% 6.98% 6.00%
Cost Efficiency Ratio (CER) 41.19% 50.23% 50.04% 40.26% 46.60%
Earning Asset Provision 5.09% 4.72% 5.10% 3.36% 5.42%
Opr. Expense to Opr. Income 72.97% 77.49% 80.64% 70.10% 81.22%
NPL ratio - Gross 2.81% 2.98% 3.02% 2.62% 2.94%
NPL ratio - Nett 0.63% 0.77% 0.78% 1.04% 0.80%
LAR 12.93% 28.92% 29.77% 9.78% 28.26%
LAR Coverage 48.66% 20.63% 21.84% 44.65% 25.77%
Return on Assets (ROA) - b.t 3.19% 2.41% 2.07% 3.50% 1.98%
Return on Assets (ROA) - a.t 2.59% 1.59% 1.44% 2.77% 1.39%
Return on Equity (ROE) - Tier I 20.39% 12.62% 11.43% 19.41% 11.05%
Return on Equity (ROE) - B/S 18.33% 11.33% 10.26% 17.77% 9.91%
Primary Reserve Requirement (IDR) 5.59% 3.81% 3.00% 6.57% 3.00%
Net Open Position 2.05% 1.08% 0.98% 1.87% 1.07%
Tier I CAR 17.20% 18.81% 19.37% 21.52% 19.59%
Total CAR 18.23% 19.83% 20.38% 22.55% 20.61%

BUSINESS UPDATES

MICRO
42

43
MICRO BANKING – Loan and Deposit Increase Double Digit
(IDR Trillion)
Micro Deposit
Micro Borrowers
(Million)
YoY g = 14.2% YoY g = 13.0%
YoY g = 11,5%20202019
Micro Loan
(IDR Trillion)
155.7 177.9 205.2 232.2 221.2
4.2 2.3
4.8 6.2 3.4
51.6 59.3
64.3 69.3 126.7
211.5 239.5
274.3 307.7
351.3
-
50.0
100 .0
150 .0
200 .0
250 .0
300 .0
350 .0
400 .0
-
50.0
100 .0
150 .0
200 .0
250 .0
300 .0
350 .0
400 .0
2016 2017 2018 2019 2020
Kupedes Kupedes Rakyat Micro KUR Total
4.0 4.1 4.2 4.4 4.0
0.7 0.2 0.3 0.5 0.3
4.2 5.1 5.5 5.7 7.5
8.9 9.4 10.0 10.6 11.8
-
2.0
4.0
6.0
8.0
10.0
12.0
14.0
-
2.0
4.0
6.0
8.0
10.0
12.0
14.0
2016 2017 2018 2019 2020
Kupedes Kupedes Rakyat Micro KUR Total
182.0 207.5 230.2 249.6 289.1
1.4 1.1
1.3 1.4
1.4
31.6 36.9
41.3 46.3
45.5
215.0 245.5
272.8 297.3
336.0
-
50.0
100 .0
150 .0
200 .0
250 .0
300 .0
350 .0
400 .0
-
50.0
100 .0
150 .0
200 .0
250 .0
300 .0
350 .0
400 .0
2016 2017 2018 2019 2020
Savings Demand Deposit Time Deposit Total
84.4%
15.6%
Low Cost High Cost
86.6%
13.4%
…KUR & KUR Super Micro have contributed to double digit loan growth & increasing number of borrowers …
…Double digit Micro deposit growth has been contributed by BPUM, BRILink, and Micro Payment…
Micro Deposit Composition

2021 Quota
Rp 110TBANK BRI
6%
Schemes
Plafond
50 MillionIDR
Interest Rate
10,5%
Insurance Coverage
Govt Subsidy
Paid by borrower 44
FOCUSING ON KUR DURING PANDEMIC - Increasing Micro Composition With Lower RWA
KUR Super Micro Loan Disbursement
IDR Trillion
KUR SUPER MICROKUR scheme expansion for new micro business entrepreneur as part of Government Program to support Economic Recovery.
IDR 8.66 Trillion
As of Dec 31st 2020,
985 thousand borrowers
Minimum 6 months experience on running Micro business
Target Market
Loan Composition
6%
Schemes
Maximum Plafond
10 MillionIDR
Interest Rate
13%BANK BRI
2021 Quota
Rp 40T
Govt Subsidy
Paid by borrower
Insurance Coverage
45%IN 2025 KUR Disbursement
Partnership*
*Partnership with E-Commerce & Ride Hailing Application
New Micro Business EntrepreneurNo limitation on business experience
Target Market
211.5 239.5 274.3 307.7 351.3
635.3 702.4 798.9 859.6 880.7
33.3%34.1% 34.3%
35.8%39.9%
28. 0%
30. 0%
32. 0%
34. 0%
36. 0%
38. 0%
40. 0%
42. 0%
0%
10%
20%
30%
40%
50%
60%
70%
80%
90%
100 %
2016 2017 2018 2019 2020
Micro Total Loan % to Total
1.95
4.86
7.29
8.66
0
1
2
3
4
5
6
7
8
9
10
Sept Oct Nov Dec
KUR MICRO

SMALL & MEDIUM
45

46
SMALL AND MEDIUM LOANS
√ Started in 2018, Loan has been adjusted due to reclassification of Trade Finance/LC Related Receivables from Loan to Other Earning Assets-Other Receivables
Medium (IDR Trillion)
(IDR Trillion) By Region (%)
By Economic Sectors (%)
Small
YoY g = - 7.2%
Insurance Coverage
KMK Tangguh(Government Guaranteed Loan Scheme –Manageable Credit Risk and Lower RWA)
Maximum Plafond
10 BillionIDR
Max Loan Tenure
36 Months
Insurance Premium paid by Government
For Covid-19 impacted borrowers
128.7 144.0169.5 181.6 175.9
6.89.9
13.517.1 21.3
135.5153.9
183.0198.7 197.2
0.0
50. 0
100 .0
150 .0
200 .0
250 .0
0.0
50. 0
100 .0
150 .0
200 .0
250 .0
2016 2017 2018 2019 2020
Small Commercial Retail KUR Total Loan
YoY g = - 0.7%
Jakarta23.4%
Java Ex. Jakarta34.9%
Mid & East25.2%
Sumatera16.5%
18.1
19.9
18.3
21.5
20.0
16
17
18
19
20
21
22
2016 2017 2018 2019 2020
Agribusiness14.8%
Mining2.2%
Industry Manufacturing
16.7%
Electricity, Gas & Water
1.0%
Construction16.3%
Trading, Hotel & Rest.34.2%
Transportation7.0%
Business Services
5.6%
Social Services2.3%
As of Dec 31st 2020
IDR8.76 Tr
14.4 thousand borrowers
Rp436 Bio Disbursement Volume
130 Borrowers
2 Months AvgLoan Tenor
14.5% Avg Int. Rate
P2P Partnership
Powered by

CONSUMER
47

48
CONSUMER LOANS
• Consumer loan grew 2.3% YoY and salary based loan is still the biggest portion of theconsumer loans of 70.5% in 2020.
Sales Volume
Rp61 Bio
Users 11,676
Rp680 Bio
44,819
Consumer Digital Loan
Outstanding Rp21.2 Mio
Sales Volume
Users
Outstanding Rp342.2 Mio
Outstanding
NPL (%)
(IDR Trillion)
Description 2016 2017 2018 2019 2020 g YoY Composition
Salary Based 78.2 88 97.8 101.3 101.3 0.0% 70.5%
Mortgage 18.2 22.1 27.1 32.3 35.7 10.6% 24.9%
Vehicle Loan 2.2 2.6 3.7 4.1 3.0 -26.8% 2.1%
Card and Others 1.6 1.8 2.3 2.7 3.6 33.6% 2.5%
Total 100.2 114.6 130.8 140.5 143.7 2.3% 100.0%
Description 2016 2017 2018 2019 2020
Salary Based 0.81% 0.74% 0.73% 0.69% 0.94%
Mortgage 2.60% 2.18% 1.92% 2.30% 2.80%
Vehicle Loan 0.60% 0.56% 0.47% 0.71% 2.77%
Card and Others 4.07% 2.95% 4.07% 2.85% 2.83%
Total 1.18% 1.05% 1.03% 1.10% 1.49%
Powered by

CORPORATE & SOE
49

77.2 77.4 91.00 93.8 93.7
92.8 97.1101.4 97.4 74.7
170 174.5192.5 191.1
168.4
0
50
100
150
200
250
2016 2017 2018 2019 2020
Corporate SOE Total
50
SOE AND CORPORATE LOANS
Loan Outstanding – Trend (IDR Trillion)
YoY g = - 11.9%
By Business Segment
SOE Loans
√ Started in 2018, Loan has been adjusted due to reclassification of Trade Finance/LC Related Receivables from Loan to Other Earning Assets-Other Receivables
Corporate Business Strategies
• Selective loan growth
• Improve asset quality
• Boost fees & other operating income through transaction banking
SOE Loans Corporate Loans
…Corporate & SOE loan growth trend alignwith BRI focus to grow more on MSME andoptimize transactions in Corporate Segment…

DIGITAL INITIATIVES

Digitizing Core Digital EcosystemNew Digital Propositions
Exploration:
Build ecosystem to offer products and services beyond core business.
Exploration:
Create and launch an independent greenfield digital bank in Indonesia
Exploitation:
Digitize existing services and transactions (Business Process)
● Optimize existing Channels● Integrated Digitized Operation● Simplified and standardized system
Branchless Banking Initiatives for Micro
● Digital Platform for Business● Build new business model● Partnership with Fintech
Digital Lending Platform
● Mobile First channel● Fully Digital for untapped market● Build New Digital Capability
Boost Productivity &Unleash The Potential
Tap the UntappedEmbedded in Customer Life
Leveraging New Liquidity, NewOpportunities, New Source of Growth
Digital Credit Card
52
BRI DIGITAL INITIATIVES – Strengthening Digital Capability
K E C EDigital
Ultra Micro Loan
The First Bank with ISO Certificate
in Big Data
ISO
27
00
1:2
01
3
AI & Big Data Analytics
DigitalLoan
Products
BRI x TravelokaPaylater Card
Digital Loan Underwriting System
Advanced Mobile Banking
Digital partnership & Collaboration
The First Bank with
ISO Certificate
in Open API
ISO
27
00
1:2
01
3
DigitalEcosystem
Platform
LPG Gas 3kg Ordering Systerm
B2B2C Integrated Billing System
School Management System Micro Transaction
Ecosystem Solutions
Online Wet Market
P2P PartnershipE-Commerce Partnership
Ride HailingPartnership

53
BRILink – Increasing Volume & Strong Fee Income Growth
Money Transfer
LinkAja Cash Withdrawal
Bill PaymentLoan Installment
Cash Deposit & Withdrawal
Mobile Phone Voucher
SERVICES PROVIDED
422,160
504,233
# of Agents
521
728
# of Transaction(In Million)
Transaction Volume(IDR Trillion)
673
843
(IDR Billion)
Fee Based Income
A branchless banking initiatives performed by BRI’s customer through fee income sharing scheme..
Cash Pickup
87.3 Thousand saving referrals ( )
80.3 Thousand loan referrals ( )
IDR 13.3 T savings ( )
72% YoY
112% YoY
57% YoY
54.6 Thousand (74% of total) villages acquisitions
2019 2020 2019 2020
2019 2020 2019 2020
1,159.7
788.7
Ultra Micro Payment (synergy with Pegadaian & PNM)

54
1
• Double Work• Variative Financial Assessment• No Cross Sell Module
• All in one go• Standardized Template• Built-in Cross-Sell Module
Digitalization
BRISPOT JOURNEY – Continuous Enhancement
• Manual Pre-screening• Manual Disbursement• Manually notify by loan officer
• Automated Pre-screening• Automatic Disbursement• SMS Notification
Automation
FROM TO
FROM TO
• Paper Based• Manual Mapping• Approval process in 20 days
SimplificationFROM TO
• Less Paper• Geo-tagging Technology• Less in 2 days
2018
2019
2020
Goingforward
BRISPOT MICROBusiness Process Re-Engineering supported by the development of BRISPOT for micro loan (Kupedes), an application platform that expedite the micro loan underwriting process.
Business Process Re-Engineering supported by the development of BRISPOT Consumer as an application platform for consumer business banking services and facilities.
BRISPOT CONSUMER
Development of BRISPOT for small and commercial business replicated the successful implementation of BRISPOT for micro and consumer.
BRISPOT SMALL COMMERCIAL
Development of BRISPOT as apps for external use (customer) to ease the access to BRI’s loan application.
BRISPOT EXTERNAL
NEXT (ENHANCEMENT)
• Ride Hailing Apps Integration• Fintech Partnership Integration• BRISPOT for BRILink Agents• GoogleAPI collaboration for geo-tagging loan
disbursement pipeline

TRANSACTION – Shifting to Digital
ATM(Trx in million )
“During the pandemic, customers' transaction behaviors have shifted from using conventional e-channels (ATM and EDM) to digital (e-banking)”
INTERNET BANKING*
(Trx in million )
* Internet banking numbers shown above incl. BRIMO transactions
55
Launched in 2019, BRIMo is Internet-based digital financial application using newest UI/UX, providing attractive
features e.g online opening account, card-less cash withdrawal, and fingerprint/ face ID login
(Trx in million) BRIMo
2,157.0 2,084.6 2,322.0
3,723.5 3,745.6
-
500 .0
1,00 0.0
1,50 0.0
2,00 0.0
2,50 0.0
3,00 0.0
3,50 0.0
4,00 0.0
2016 2017 2018 2019 2020
219.1 311.5
574.9
1,169.4
2,715.4
-
500 .0
1,00 0.0
1,50 0.0
2,00 0.0
2,50 0.0
3,00 0.0
2016 2017 2018 2019 2020
100.7
765.8
0
100
200
300
400
500
600
700
800
900
2019 2020

56
APPLICATION PROGRAMMING INTERFACE (API) – Gateway for Digital Partnership
Execute Digital Partnership with Precision & Speed (OpenAPI)API which stands for 'Application Programming Interface’ connects business processes, services, content, and data to channel partners, internal teams, and independent developers in an easy and secure way.
Top BRIAPI’s Features
1. BRIVA
2. Inquiry Balance
3. Transfer
4. BRIZZI
5. Direct Debit
Healthcare Ecosystem
Transportation Ecosystem
Agri Ecosystem
Fintech & E-CommerceForeign currencyInformation and Transaction
• Balance Inquiry• Account Statement
• Money Transfer
Information of BRI Branches Location
T-Bank BRI E-Pay BRI
BRI Virtual Account
Information of BRIE-channel Location
BRI Credit Card
BRI Consumer LoanBRI Micro and Retail KUR
Oil & Gas Ecosystem, Education Ecosystem, etc
ISO 27001:2013
…Digital Partnership Model to connect withFintech and create digital ecosystem. As of Dec2020, more than 120 partners have been usingBRIAPI with 88 million transactions and Rp43 Tsales volume…
Sales Volume Rp43 T ( 309.5%)
Transaction Volume 88 Mio ( 111.5%)
209 Total Partners ( 145.8%)

DIGITAL SAVING – New Playing Field
BRI Digital Saving Advantages
Easily accessed(Accessible through web browser)
Easy to use & user friendly
Quick approval process
No outlet visit
Bundled with internet bankingand BRIMo
Onboarding Platforms
57
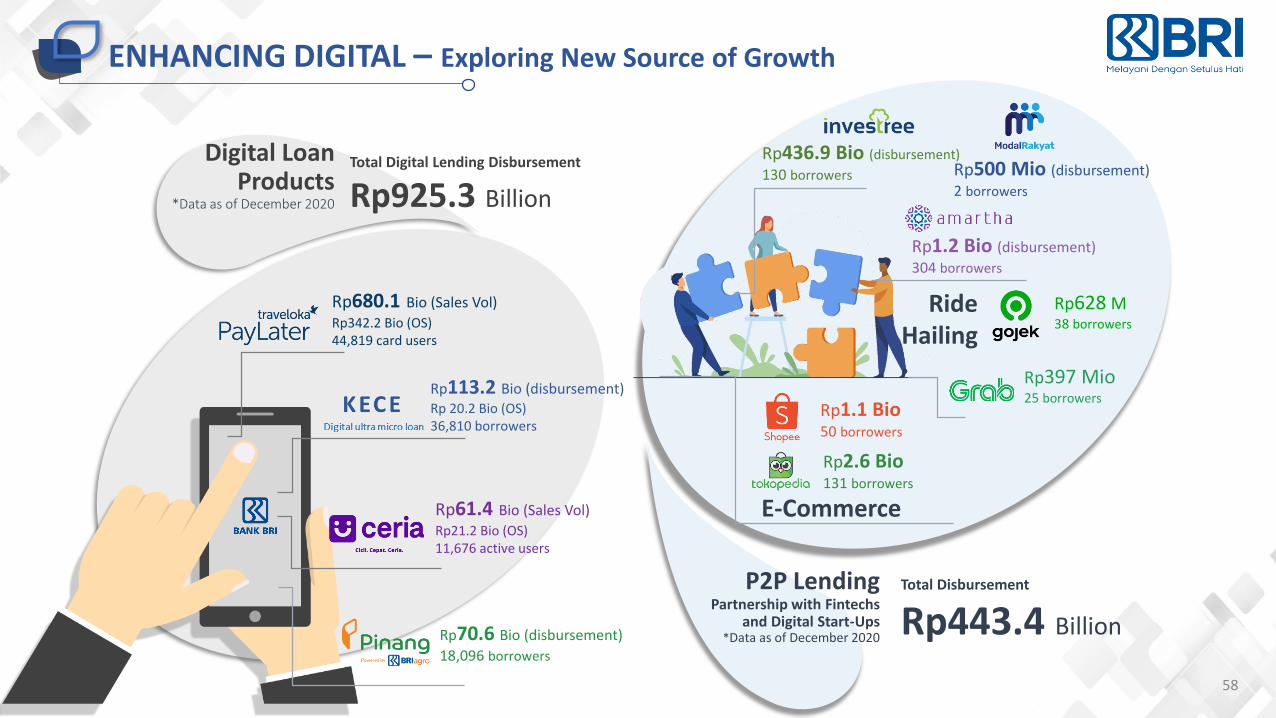
58
ENHANCING DIGITAL – Exploring New Source of Growth
Digital Loan Products
*Data as of December 2020
Rp70.6 Bio (disbursement)
18,096 borrowers
Rp113.2 Bio (disbursement)Rp 20.2 Bio (OS)36,810 borrowers
Rp61.4 Bio (Sales Vol)
Rp21.2 Bio (OS)11,676 active users
Rp628 M38 borrowers
Rp680.1 Bio (Sales Vol)
Rp342.2 Bio (OS)44,819 card users
Total Digital Lending Disbursement
Rp925.3 Billion
P2P Lending Partnership with Fintechs
and Digital Start-Ups*Data as of December 2020
Rp436.9 Bio (disbursement)
130 borrowers
Rp1.2 Bio (disbursement)
304 borrowers
Ride Hailing
Rp397 Mio25 borrowers
E-Commerce
Rp1.1 Bio 50 borrowers
Rp2.6 Bio 131 borrowers
Total Disbursement
Rp443.4 Billion
Rp500 Mio (disbursement)
2 borrowers
Rp628 M38 borrowers
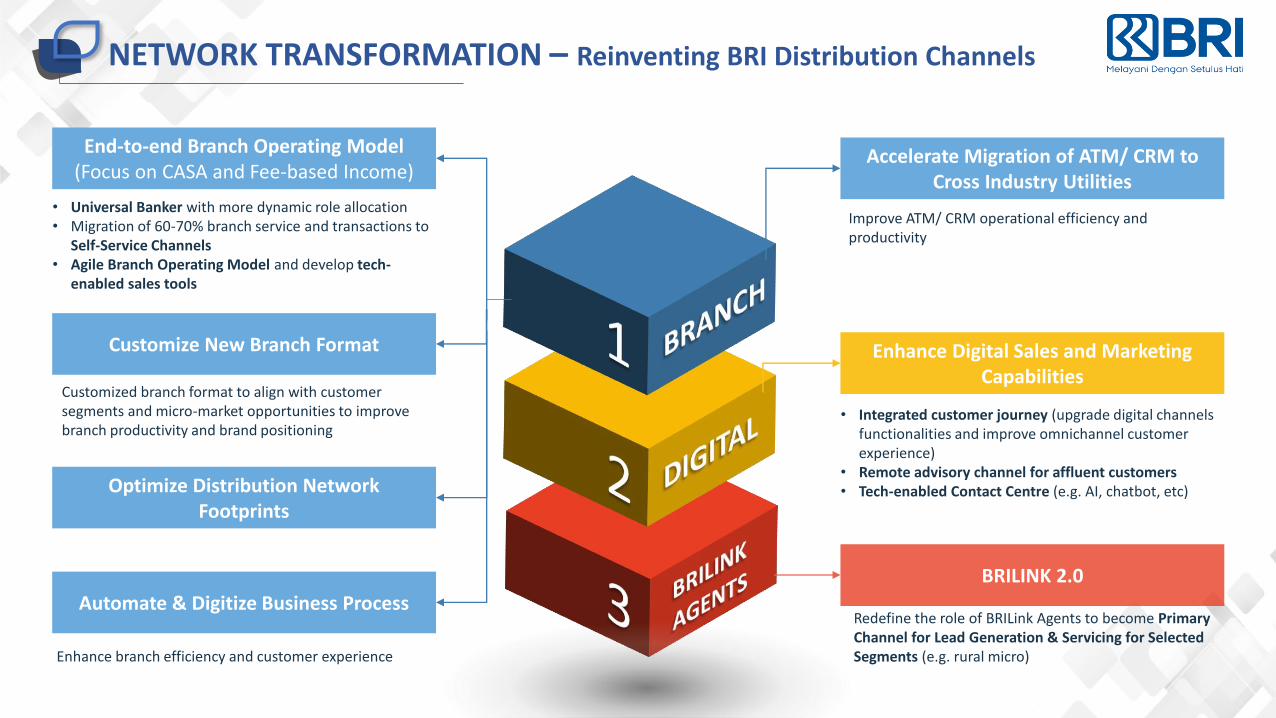
NETWORK TRANSFORMATION – Reinventing BRI Distribution Channels
X
End-to-end Branch Operating Model (Focus on CASA and Fee-based Income)
Customize New Branch Format
Optimize Distribution Network Footprints
Automate & Digitize Business Process
Accelerate Migration of ATM/ CRM to Cross Industry Utilities
Enhance Digital Sales and Marketing Capabilities
BRILINK 2.0
• Universal Banker with more dynamic role allocation• Migration of 60-70% branch service and transactions to
Self-Service Channels• Agile Branch Operating Model and develop tech-
enabled sales tools
Customized branch format to align with customer segments and micro-market opportunities to improve branch productivity and brand positioning
Enhance branch efficiency and customer experience
Improve ATM/ CRM operational efficiency and productivity
• Integrated customer journey (upgrade digital channels functionalities and improve omnichannel customer experience)
• Remote advisory channel for affluent customers• Tech-enabled Contact Centre (e.g. AI, chatbot, etc)
Redefine the role of BRILink Agents to become Primary Channel for Lead Generation & Servicing for Selected Segments (e.g. rural micro)

BRI ESG INITIATIVES (Environment, Social, and Governance)

BRI SUSTAINABLE FINANCE FRAMEWORK
Human Capital
Assets Liabilities
Operations
• Financing sustainable projects, such as
Renewable Energy, Energy Efficiency,
Pollution Control & Prevention, Biodiversity
Conservation, Eco-Friendly Transportation,
Green Building, etc.
• Credit risk management policy on CPO
• ESG-linked Liability Products:
BRI Sustainability Bond 2019
• Socially Responsible Liability Products with
Anti-Money Laundering and Counter-
Terrorism Financing Policies
• Paperless Operations
▪ BRI Digital Office
▪ BRISPOT or Digital Loan Mobile
Application
• Green IT Infrastructure
• Reuse, Reduce, Recycle
• Socially Responsible Human Capital
Strategy with Diversity and Equality Policies
• BRISMART (Eco-friendly E-Learning
System)
We are committed to give optimal values to stakeholders by implementing a Sustainable Finance Framework in our banking activities
61

SUPPORTING THE GOVERNMENT TO ACHIEVE SDGs
40% of BRI’s total loans is contributed by Micro and Ultra Micro Loans, distributed to 11.7 million borrowers
BRI has disbursed loans to key sectors in the economy including Agriculture and Food Processing & Manufacturing
The BRI Peduli – Indonesia Sehat Program aims to improve the community’s quality of life and its health (i.e. ambulance donation, free medical examinations, etc.)
The BRI Peduli – Indonesia Cerdas Program aims to improve the quality of human resources (i.e. scholarships, renovation of education infrastructures, etc.)
BRI has disbursed Subsidized Ultra Micro Loans (KUR Super Mikro), that is prioritized productive housewives.
BRI has disbursed loans to sustainable water and wastewater management projects.
BRI has disbursed loans to renewable energy projects.
The BRI micro loans has created jobs for micro business entrepreneurs
The Subsidized Micro Loan (KUR Mikro) has created jobs for micro start-ups entrepreneurs.
The BRILink system has created new sustainable business opportunities for BRI Micro Borrowers.
The BRI Sustainability Bond has provided access to affordable houses, financed the LRT Jakarta and the Green Building Projects
The BRI Digital Initiatives, such as BRISMART Digital Learning System, and BRISPOT Digital Loan System have helped reduce GHG emissions (less business travel)
The BRI Peduli – Indonesia Lestari Program aims to support the preservation of nature for a better life (i.e. planting mangrove seedlings, etc)
BRI has internal financial crime prevention policies and human rights policy. Every year all employees complete e-training to prevent bribery, corruption, etc.
BRI is the chairman of Indonesian Sustainable Finance Initiative (IKBI) that aims to support the government’s effort in achieving the SDGs
BRI requires all CPO producer borrowers to have ISPO and/or RSPO certification.

FINANCING FOR SUSTAINABLE DEVELOPMENT
Micro & SMEs
Rp484.4 T
Renewable Energy
Rp14.6 T
PollutionPrevention & Control
Rp2.3 T
Environmentally Sustainable Management of Living Natural
Resources & Land UseRp33.1 T
Terrestrial & Aquatic Biodiversity Conservation
Rp702 B
Clean Transportation
Rp15.5 T
Sustainable Water and Wastewater
ManagementRp685 B
Green Building
Rp2.9 T
Eco-efficient Product, Production Technologies
and ProcessesRp7.7 T
Other Sustainability-
related projectsRp541 B
Sustainable Business Activities*
Loan PortfolioAs of December 31, 2020
Rp562 Trillion63.9% of Total Loans
Rp493 T57.3% of Total Loans
Y-to-Y Increase
2019
2020
“The BRI Sustainable Business Activities
Loan Portfolio has increased 14.1% YoYand the highest among peers”
*Based on Financial Services Authority Regulation (POJK) No.51/POJK.03/2017 on the
Application of Sustainable Finance for Financial Services Institutions,
Issuers and Public Companies.
63

BRI SUSTAINABILITY BOND 2019
PROCEEDS ALLOCATION
BY PROJECT TYPE
BY ELIGIBLE CATEGORY
• 84% for Social Projects • 16% for Green Projects
• 43%: Socioeconomic advancement and empowerment
• 41%: Employee Generation
• 8%: Green Buildings• 7%: Clean Transportation• 1%: Affordable Housing
THE BOND SUPPORTS SDGs
Decent Work and Economic Growth• Job creation supported by Micro Loans
Reduced Inequality• Job creation by targeting micro start-ups
entrepreneurs
Sustainable Cities and Communities• Access to affordable houses• LRT Jakarta Project• Green Building Project
TRANSACTION HIGHLIGHT
• Issue date: 21 March 2019• Size: $500 Million• Maturity: 5 years• Coupon: 3.95%• Rating: Baa2 by Moody’s
BBB- by Fitch
SECOND PARTY OPINION
“BRI’s Sustainability Bond Framework is credible and impactful”
FIRST SUSTAINABILITY
BOND
in South East Asiain RegS Format
64

INCREASING ESG AWARENESS AND COMMITMENT AMONG EMPLOYEES
SUSTAINABLE FINANCE
AWARD
GOVERNANCE, RISK AND
COMPLIANCE
CULTURE CARNIVAL
E-LEARNING ON ESG
THROUGH BRISMART
As part of the BRI Sustainable
Finance Action Plan, all
employees across the Bank
should implement sustainable-
finance-related activities in their
own business/banking units.
BRI Sustainable Finance
Award is given to the most
innovative employees who are
able to create and implement
effective sustainable-finance-
related activities.
The BRI Governance, Risk
and Compliance Culture
Carnival is part of the ongoing BRI
Culture Transformation.
This virtual event is aimed to
increase employees’ awareness of
banking risk and compliance
management that includes Anti-
bribery, Anti-corruption and Anti-
Fraud Policy, BRI Whistle Blower
System management, and Digital
& Cyber Risk Management.
To increase awareness of ESG
Issues and Risks among
employees, BRI provides e-
learning through BRISMART
learning system that include the
following learning materials:
▪ Sustainable Finance
▪ Anti-Fraud Awareness
▪ Anti-Bribery
▪ Anti-Money Laundering and
Fight against Terrorism Funding
▪ Information Technology
Govenance, Data Privacy and
Security
65
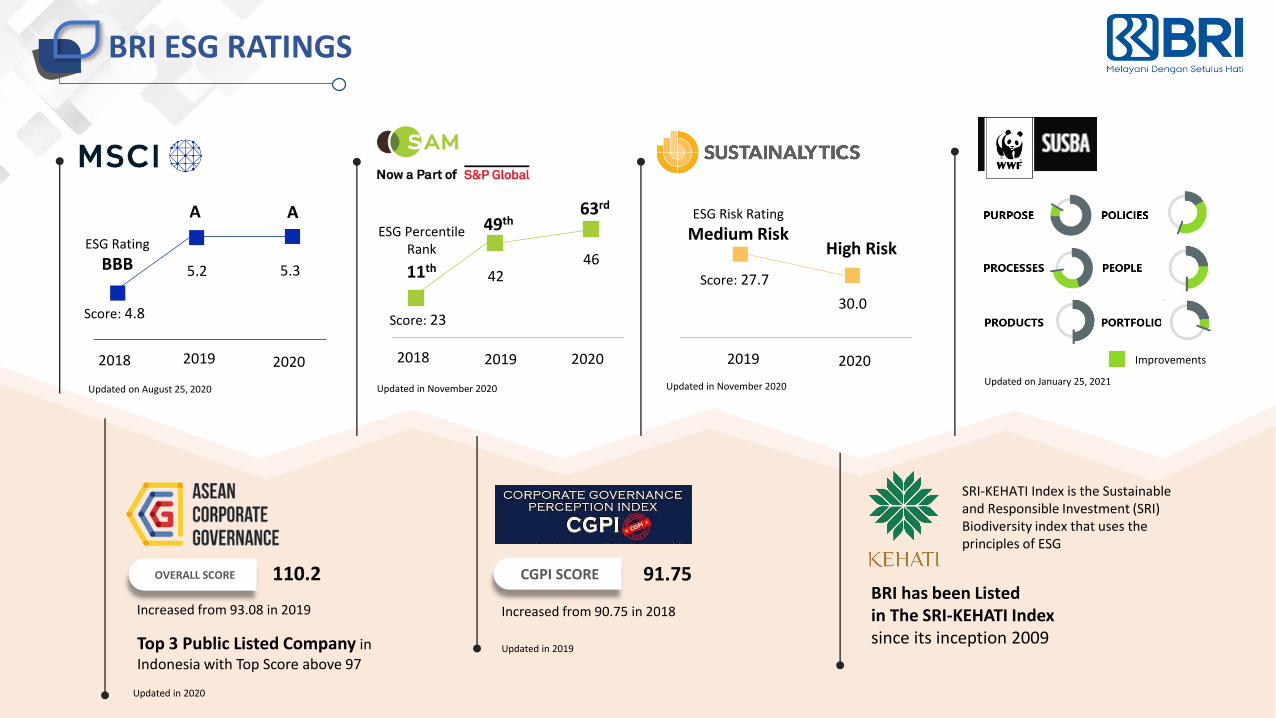
BRI ESG RATINGS
Updated on August 25, 2020 Updated in November 2020 Updated in November 2020 Updated on January 25, 2021
OVERALL SCORE 110.2
Increased from 93.08 in 2019
Top 3 Public Listed Company in Indonesia with Top Score above 97
CGPI SCORE 91.75
Increased from 90.75 in 2018
Updated in 2020
Updated in 2019
BRI has been Listed in The SRI-KEHATI Indexsince its inception 2009
SRI-KEHATI Index is the Sustainable and Responsible Investment (SRI) Biodiversity index that uses the principles of ESG
2018 2019 2020
ESG Rating
BBB
A A
Score: 4.8
5.2 5.3
2018 2019 2020
49th63rd
4246
ESG Percentile Rank
11th
Score: 23
2019 2020
High Risk
30.0
ESG Risk Rating
Medium Risk
Score: 27.7
Improvements

67
ESG AWARDS
67
ESG AWARDS 2020
BRI was the winner of 14 categories in ESG Awards 2020, organized by Beritasatu Media Holdings
in cooperation with Bumi Global Karbon Foundation
ASIA SUSTAINABILITY REPORTING RATING (ASRRAT) AWARDS 2020
This award reflects the quality ofBRI’s Sustainability Report
based on Global Reporting Initiatives (GRI) Standards
THE ASSET ASIAN AWARDS
“BEST ISSUER FOR SUSTAINABLE FINANCE”
INDONESIA
“BESTSUSTAINABILITY BOND”
INDONESIA

SUBSIDIARIES

69
BRI GROUP
SUBSIDIARIES – Shares >50% and as a controller stake
To be the leading sharia bank in Indonesia by focusing on
consumer and SME segment
To provide financial solution in agribusiness in Indonesia by building a
digital platform for agriculture ecosystem
To be the top 5 Player Based on Market Share GWP in 2023
Enter the multifinance with asset above Rp 10 Trillion with focus on
consumer financing
To be a strong financial services company by connecting business
between Indonesia and Hong Kong
Become one of the most valuable securities house in Indonesia
To be the leading Venture Capital in financial technology and beyond
To be the top 5 general insurance in Indonesia in 2024 by focusing on micro, applying advanced digital
tech, and customer centric
Go Public 2018
71.64%Shares Ownership
Go Public 2003
87.10%Shares Ownership
91.00%Shares Ownership
99.88%Shares Ownership
100%Shares Ownership
67.00%Shares Ownership
99.97%Shares Ownership
90.00%Shares Ownership
ASSOCIATED ENTITIES – Shares <50%
To be a leading venture capital company in Indonesia by focusing
on SME and Ultra Micro
To be the top 5 AUM in mutual funds by providing the best
mutual funds as financial solutions
35.00%Shares Ownership
35.00%Shares Ownership
Majority: PBUI Majority: Danareksa
% shares ownership as in December 2020

70
SUBSIDIARIES
Subsidiaries’s Total Asset Rp 109.1 T
57.9 T
28.0 T
13.1 T
4.1 T3.0 T
1.8 T 1.1 T8.5 B

KEY TAKEAWAYS

72
KEY TAKEAWAYS
1
2
3
4
5
6 Adequate provision provides cushion to anticipate Covid-19 impact
7 Strong capital to support future expansion and dividend payment
Increasing NIM supported by recovering loan disbursement and lowering COF
Well-managed Covid-19 loan restructured risk with declining outstanding
Increasing Micro & SME Loan Composition
Re-sharpening & Re-focusing BRIVolution 1.0 into BRIVolution 2.0
Manageable Covid-19 impact

GUIDANCE 2021

74
GUIDANCE 2021
Loan Growth : 6% - 7%
LDR : ±85%
NIM : ±6.3%
Fee Income Growth : ±8%
OPEX Growth : ±8%
NPL : ±3%
Credit Cost : ±3.1%

OTHERS
76
BOARD OF COMMISSIONERS

77
BOARD OF MANAGEMENT
*Effective after OJK’s approval on the Fit & Proper Test in accordance with the prevailing regulations
SEVP Head of Internal Audit
Hari Siaga Amijarso
SEVP Treasury & Global Service
Listiarini Dewajanti
SEVP Change Management& Transformation
Retno WahyuniWijayanti
President Director
Sunarso
Vice President Director
Catur Budi Harto
Director of Finance
Viviana Dyah A. R.*
Director of Small and Medium
Business
Amam Sukriyanto*
Director of Consumer
Handayani
Director of Micro Business
Supari
Director of Digital and Information
Technology
Indra Utoyo
Director of Networks and
Services
Arga M. Nugraha*
Director of Human Capital
Agus Winardono*
Director of Risk Management
Agus Sudiarto
Director of Institution and SOE
Agus Noorsanto
Director of Compliance
Ahmad SolichinLutfiyanto*

AWARDS
Best Overall SOEBest SOE for Organizational Transformation –
ANUGERAH BUMN (SOE AWARD) 2020
Best in Country Indonesia 2019 –IR MAGAZINE SOUTH EAST ASIA
The Best CEO in Banking Transformation–
CNBC INDONESIA AWARD 2020
TOP CSR AWARDS 2020
Innovative Company For Embracing Startup Collaboration For Digital
Ecosystem–INDONESIA DIGITAL INNOVATION
AWARD 2020
Best of The Best Company 2020 –FORBES INDONESIA
The Most Resilient BUMN (SOE) 2020 –TOP BUMN AWARD 2020
SURVIVE IN CRISIS
The Best Bank in supporting MSME for Bank In Category BUKU 3 & 4 2020
– BANK INDONESIA
78

79
THE MOST EXTENSIVE AND LARGEST NETWORKS
Regional Office Distribution
• Jakarta 1, 2, 3• Bandung• Surabaya•Malang• Yogyakarta• Semarang
• Denpasar•Makasar•Manado• Jayapura• Banjarmasin• Banda Aceh
• Medan• Pekanbaru• Padang• Palembang• Bandar Lampung
*Total branches and sub branches are including 4 overseas offices and 3 overseas sub branches
REGIONAL OFFICES DISTRIBUTION
Branch Network 2016 2017 2018 2019 2020 YoY
Head Office 1 1 1 1 1 -
Regional Offices 19 19 19 19 19 -
Branches 467 468 468 467 462 (5)
Sub Branches 609 610 609 611 608 (3)
BRI Units 5,380 5,382 5,381 5,382 5,382 -
Cash Offices 984 992 964 952 890 (62)
Teras BRI 2,545 2,536 2,069 2,049 1,986 (63)
Teras Mobile 638 638 136 137 136 (1)
Payment Point 35 38 50 54 54 -
Total 10,678 10,684 9,697 9,672 9,538 (134)
E-channel 2016 2017 2018 2019 2020 YoY
ATM 24,292 24,684 22,684 19,184 16,880 (2,304)
EDC 257,712 302,921 284,425 204,386 184,580 (19,806)
CRM 1,392 1,992 2,609 3,809 5,809 2,000
e-Buzz 57 57 57 57 57 -
Total 283,453 329,654 309,775 227,436 207,326 (20,110)
Branchless Network 2016 2017 2018 2019 2020 YoY
Brilink Agents 84,550 279,750 401,550 422,160 504,233 82,073

80
CREDIT RATINGS
International & Domestic Ratings
- Long Term Foreign Currency IDR : BBB-, Stable Outlook- Short Term Foreign Currency IDR : F3- Support Rating Floor :BBB-- Support Rating : 2
- Viability Rating : bbb-- National Long-Term Rating : AA+ (idn), Stable Outlook- Rupiah Subordinated Debt : A+ (idn)- Senior Unsecured Notes : BBB-
- Outlook : Stable- Issuer Credit Rating : BBB-- Stand-Alone Credit Profile (SACP) : bbb-
- Outlook : Stable- Bank Deposit : Baa2/P-2- Baseline Credit Assessment : baa2- Adjusted Baseline Credit Assessment : baa2
- Counterparty Risk Assessment : Baa1(cr)/P-2(cr)
National Rating : id AAA,Stable Outlook
- Long Term Foreign Currency : BBB- Outlook : Stable- Long Term Local Currency : BBB+- Outlook : Stable
Negative
BB-

81
STOCK PERFORMANCE
Shareholders Composition BBRI Market Cap Rank in South East Asia Bank

82
BBRI OVER THE YEARS – Stock-Related Corporate Action
…Since IPO, BBRI has done stock split twice, buyback and long term benefit
program for employees…
IPO on November 10th
2003 using ticker BBRI
Management Stock Option Program (MSOP)
2004 - 2010
First time stock split 1:2 on Januari 11th 2011
2011
2015-2016Stock buyback
2015 - 2016
Stock split 1: 5 on November 10th 2017
2017
Employee Stock Option Program (ESOP)
2019
Employee Stock Allocation (ESA) Program
2020
2003
Stock buyback
2020

PT BANK RAKYAT INDONESIA (Persero) Tbk.Investor Relations7th floor BRI II BuildingJl. Jenderal Sudirman No. 44-46 Jakarta 10210Indonesia
Phone : 62 21 5752006/09, 5751952/79Fax : 62 21 5752010Website : www.ir-bri.com Email : [email protected]
Disclaimer ; this report has been prepared by PT bank Rakyat Indonesia (Persero) Tbk (Bank BRI) independently and is circulated for the purpose of general information only. It is not intended to the specific person who may receive this report.The information in this report has been obtained from sources which we deem reliable. No warranty (expressed or implied) is made to the accuracy or completeness of the information. All opinions and estimations included in this reportconstitute our judgment as of this date and are subject to change without prior notice. We disclaim any responsibility or liability without prior notice of Bank BRI and/or their respective employees and/or agents whatsoever arising which maybe brought against or suffered by any person as a result of acting in reliance upon the whole or any part of the contents of this report and neither Bank BRI and/or its affiliated companies and/or their respective employees and/or agentsaccepts liability for any errors, omissions, negligent or otherwise. In this report and any inaccuracy herein or omission here from which might otherwise arise