g1 bottle of soda - amazon s3s3.amazonaws.com/zanran_storage/ · bottle of soda cristina cunha ......
TRANSCRIPT
The Value Chain of a The Value Chain of a Bottle of SodaBottle of Soda
Cristina CunhaAnita Zivkovic
Focal Firms and SMEs in Global Value Chains
University of Fribourg
Agenda• Introduction into the soft drink industry• Spatial organization of production• Global value chain▫ Focal Firms▫ Bottlers▫ Suppliers▫ Distributors
• Value added• Conclusion
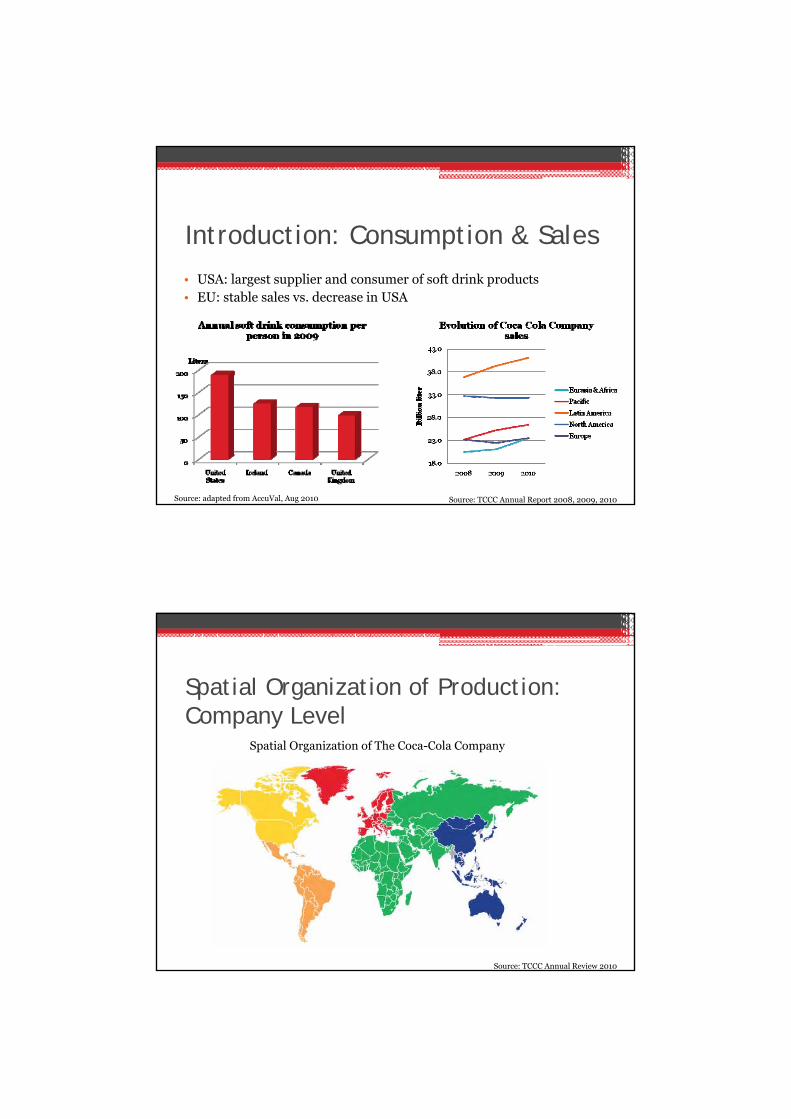
Introduction: Consumption & Sales
• USA: largest supplier and consumer of soft drink products• EU: stable sales vs. decrease in USA
Source: TCCC Annual Report 2008, 2009, 2010Source: adapted from AccuVal, Aug 2010
Spatial Organization of Production: Company Level
Spatial Organization of The Coca-Cola Company
Source: TCCC Annual Review 2010

Spatial Organization of Production: Bottlers Level
Regions covered differently by bottlers
Bottling Company Territory % of ownership% of TCCC’s
volumes
CCE North America USA, Canada 100% 18%
Coca-Cola FEMSACentral and South America
32% 10%
Coca-Cola HellenicEast Europe & Nigeria
23% 8%
Coca-Cola Amatil Pacific 30% 2%
New CCEWest and North Europe
0% 5%
Source: TCCC Annual Review 2010, TCCC Annual Report 2010
Spatial Organization of Production: European Level
Coca-Cola HellenicCoca-Cola Enterprises
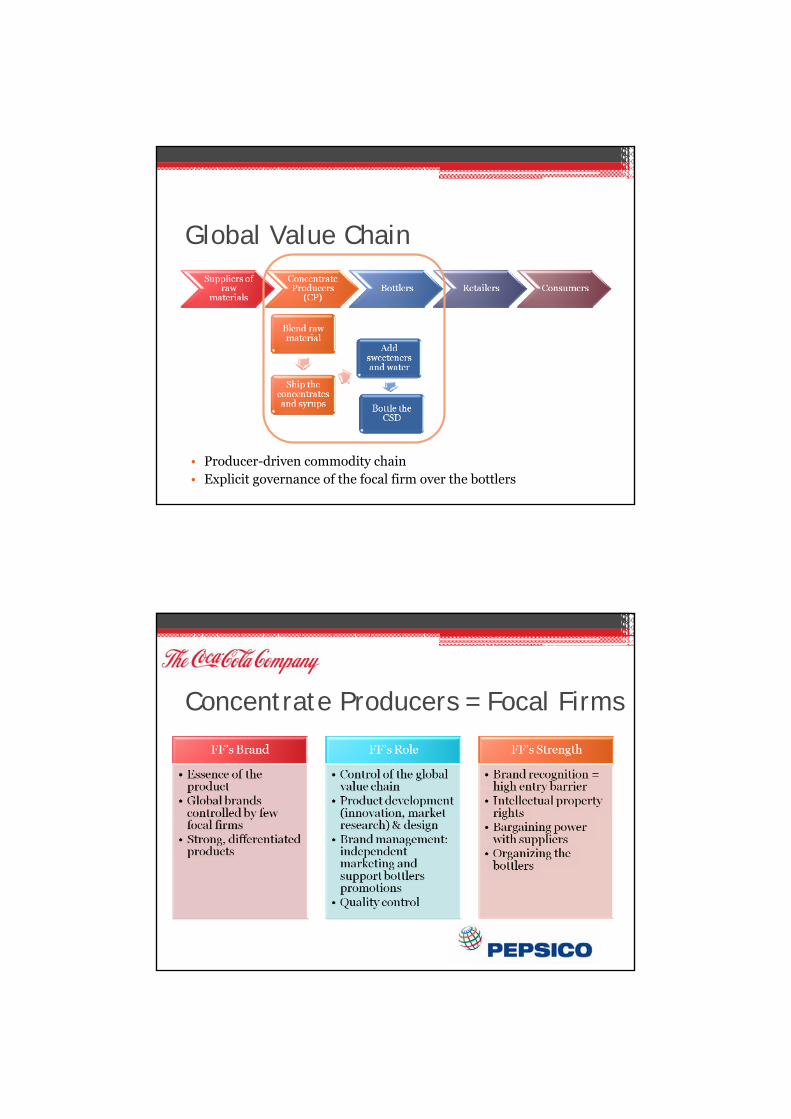
Global Value Chain
• Producer-driven commodity chain• Explicit governance of the focal firm over the bottlers
Concentrate Producers = Focal Firms
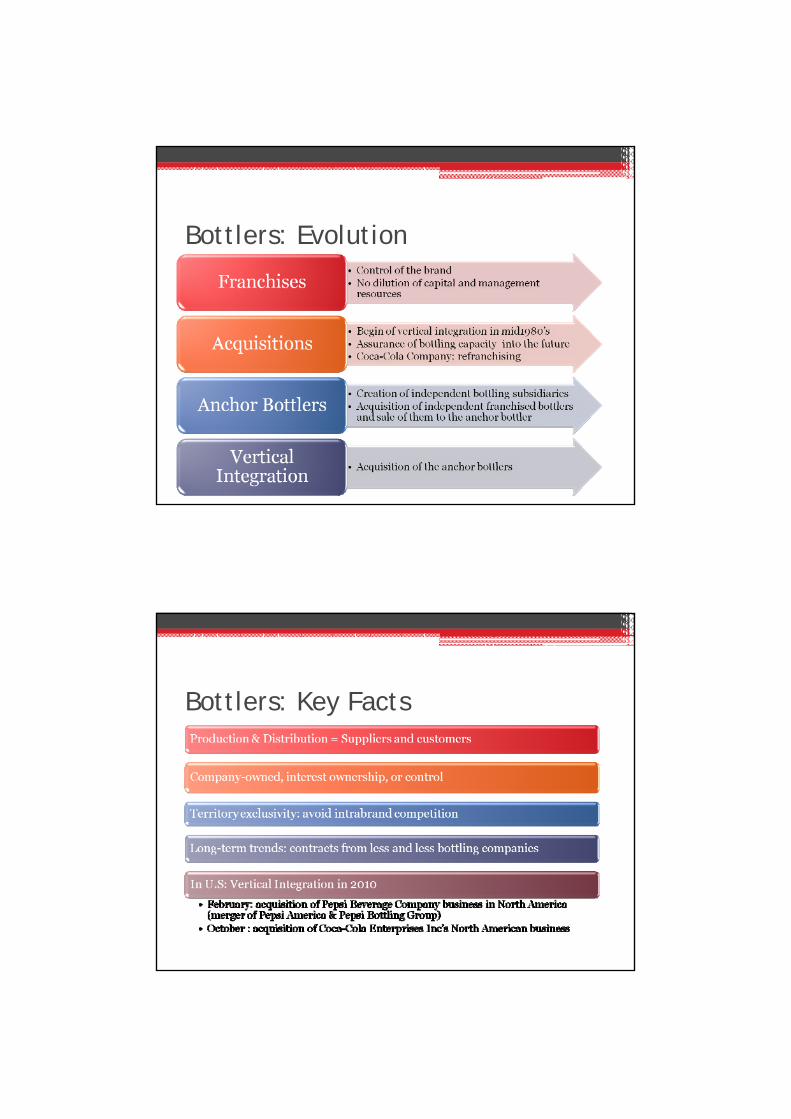
Bottlers: Evolution
Bottlers: Key Facts
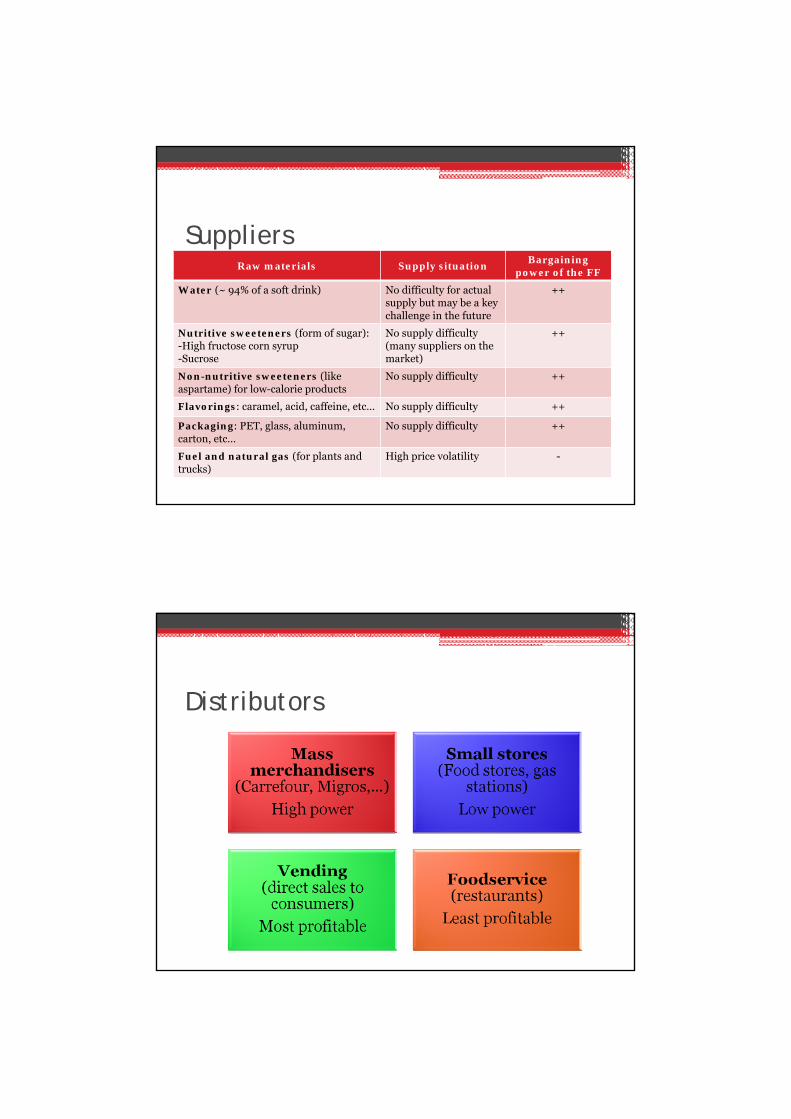
SuppliersRaw materials Supply situation
Bargaining power of the FF
Water (~ 94% of a soft drink) No difficulty for actual supply but may be a key challenge in the future
++
Nutritive sweeteners (form of sugar): -High fructose corn syrup-Sucrose
No supply difficulty (many suppliers on the market)
++
Non-nutritive sweeteners (like aspartame) for low-calorie products
No supply difficulty ++
Flavorings: caramel, acid, caffeine, etc… No supply difficulty ++
Packaging: PET, glass, aluminum, carton, etc…
No supply difficulty ++
Fuel and natural gas (for plants and trucks)
High price volatility -
Distributors
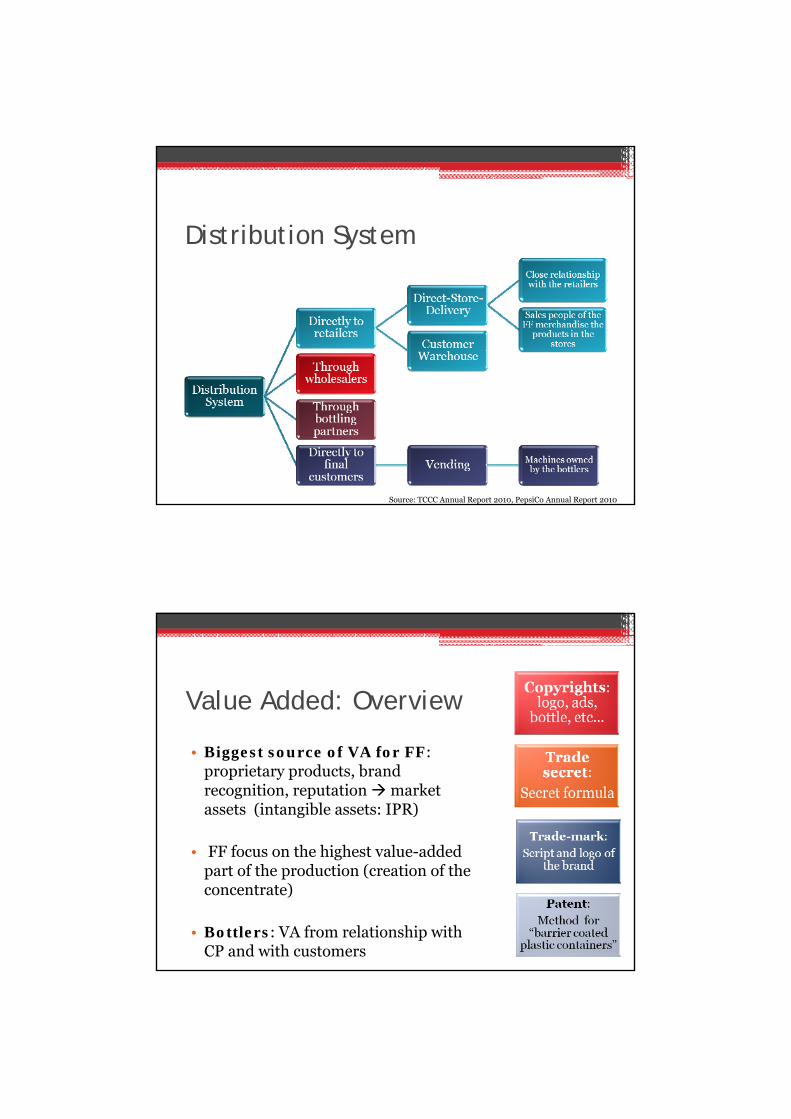
Distribution System
Source: TCCC Annual Report 2010, PepsiCo Annual Report 2010
Value Added: Overview
• Biggest source of VA for FF: proprietary products, brand recognition, reputation market assets (intangible assets: IPR)
• FF focus on the highest value-added part of the production (creation of the concentrate)
• Bottlers: VA from relationship with CP and with customers

VA: Comprehensive Income (TCCC) In millions USD 2010 %
Net operating revenues
35,119
- Cost of goods sold - 12,693 36.14% of net operating revenues
= Gross profit = 22,426
- Selling, general and administrative expenses
- 13,158 2.88%22.17%29.65%45.29%
Stock-based compensationAdvertisingBottling and distributionOther operating expenses
- Other operating charges - 819
= Operating income 8,449
Income before income taxes
14,243
Net income 11’859 33.77% of net operating revenues
Source: TCCC Annual Report 2010
VA: Calculation
Finished products% of total
salesEffective amount Value creation
Net operating revenues 49% 17,247 mio USD 0.49 USD/ liter
Cost of goods sold 36.14% 6.233 mio USD 0.18 USD / liter
Volumes 24% 34.79 billion liter
These figures include all TCCC’s products, not only Coke (impossible to indentify Coke’s sales)!

Conclusion
* Evolution of consumption of Coca-Cola products 2010 vs 2009
Thank you for your attention!
Questions?