g284.4—digital flood insurance r maps (dfirms
TRANSCRIPT
G284.4—DIGITAL FLOOD INSURANCE RATE MAPS (DFIRMS)
MODULE 4

This page intentionally left blank.
G284.4—Digital Flood Insurance Rate Maps (DFIRMs)
September 2011 Participant Manual Page 4-1
INTRODUCTION
Visual 4.1
Key Points This module will review the history of Flood Insurance Rate Mapping and discuss the development and uses of Digital Flood Insurance Rate Maps (DFIRMs).
G284.4—Digital Flood Insurance Rate Maps (DFIRMs)
Page 4-2 Participant Manual September 2011
INTRODUCTION
Visual 4.2
Key Points After completing this module, you will be able to: • Describe floodplain mapping purpose and process. • Describe how to coordinate the mapping process. • Identify how to gain public and political support for floodplain mapping. • Demonstrate how DFIRMs and backup data can be used. • Describe map change processes, impact, and consequences.
G284.4—Digital Flood Insurance Rate Maps (DFIRMs)
September 2011 Participant Manual Page 4-3
MAPPING BACKGROUND
Visual 4.3
Key Points The first section of this module will discuss the history of Flood Insurance Rate Mapping.

G284.4—Digital Flood Insurance Rate Maps (DFIRMs)
Page 4-4 Participant Manual September 2011
MAPPING BACKGROUND
Visual 4.4
Key Points The following topics will be addressed in this section: • The reason that Flood Insurance Rate Maps (FIRMs) were developed. • The history of Flood Insurance Rate Mapping. • The components of Flood Insurance Rate Mapping.
G284.4—Digital Flood Insurance Rate Maps (DFIRMs)
September 2011 Participant Manual Page 4-5
MAPPING BACKGROUND
Visual 4.5
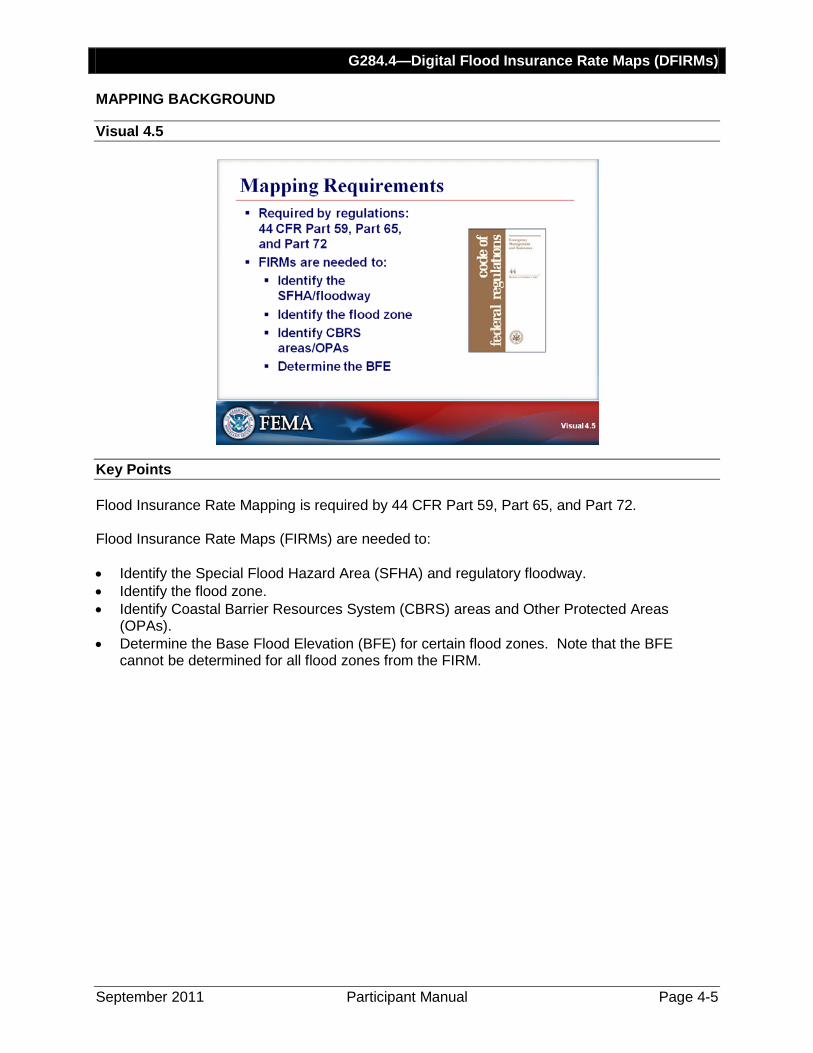
Key Points Flood Insurance Rate Mapping is required by 44 CFR Part 59, Part 65, and Part 72. Flood Insurance Rate Maps (FIRMs) are needed to: • Identify the Special Flood Hazard Area (SFHA) and regulatory floodway. • Identify the flood zone. • Identify Coastal Barrier Resources System (CBRS) areas and Other Protected Areas
(OPAs). • Determine the Base Flood Elevation (BFE) for certain flood zones. Note that the BFE
cannot be determined for all flood zones from the FIRM.
G284.4—Digital Flood Insurance Rate Maps (DFIRMs)
Page 4-6 Participant Manual September 2011
MAPPING BACKGROUND
Visual 4.6
Key Points Discussion Question
: Why might a community need a new FIRM?
G284.4—Digital Flood Insurance Rate Maps (DFIRMs)
September 2011 Participant Manual Page 4-7
MAPPING BACKGROUND
Visual 4.7
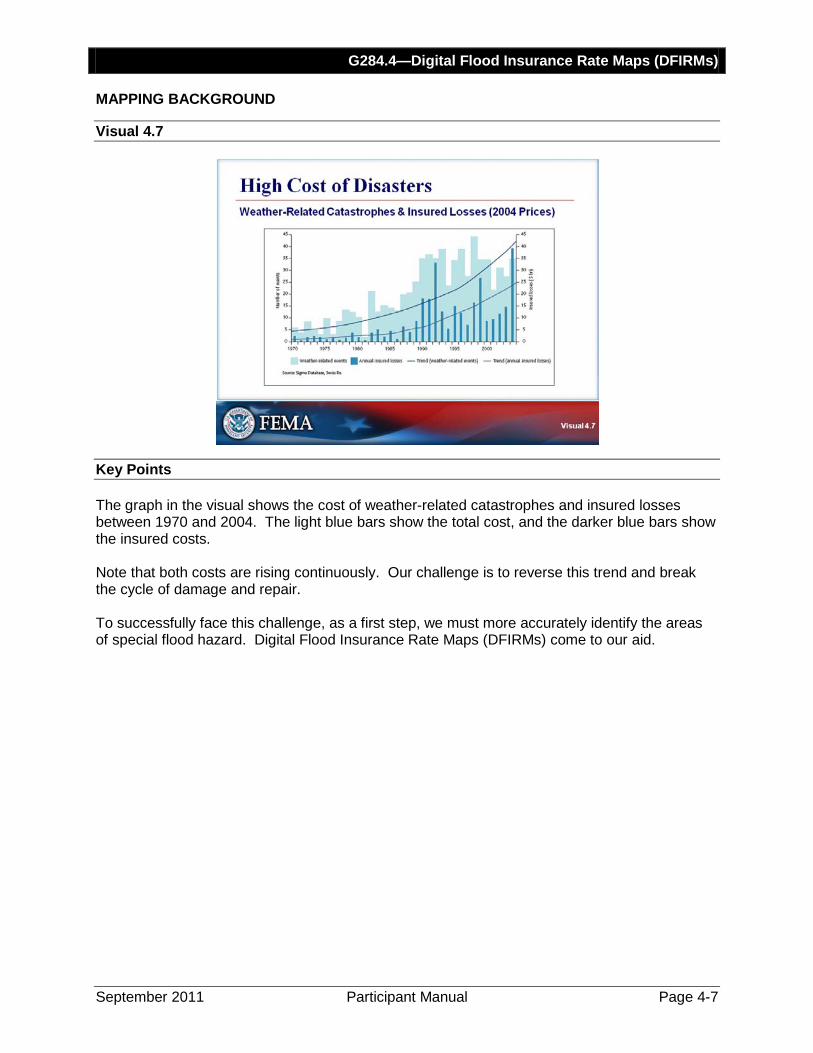
Key Points The graph in the visual shows the cost of weather-related catastrophes and insured losses between 1970 and 2004. The light blue bars show the total cost, and the darker blue bars show the insured costs. Note that both costs are rising continuously. Our challenge is to reverse this trend and break the cycle of damage and repair. To successfully face this challenge, as a first step, we must more accurately identify the areas of special flood hazard. Digital Flood Insurance Rate Maps (DFIRMs) come to our aid.
G284.4—Digital Flood Insurance Rate Maps (DFIRMs)
Page 4-8 Participant Manual September 2011
MAPPING BACKGROUND
Visual 4.8
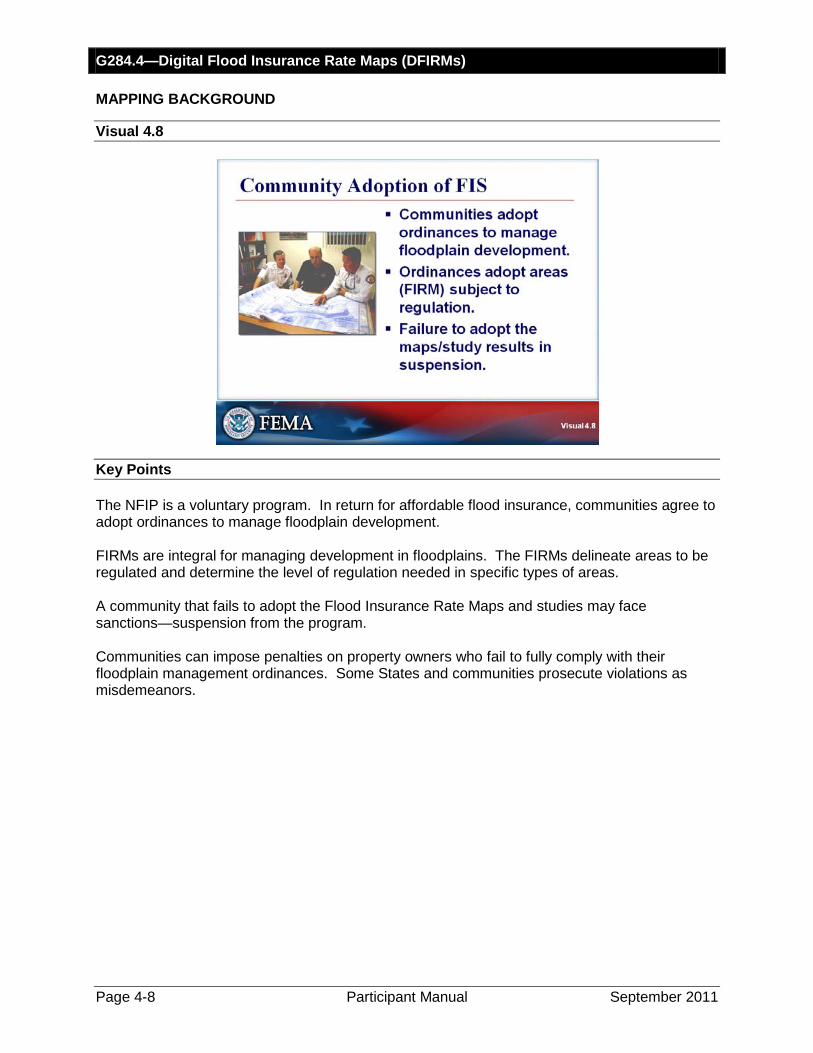
Key Points The NFIP is a voluntary program. In return for affordable flood insurance, communities agree to adopt ordinances to manage floodplain development. FIRMs are integral for managing development in floodplains. The FIRMs delineate areas to be regulated and determine the level of regulation needed in specific types of areas. A community that fails to adopt the Flood Insurance Rate Maps and studies may face sanctions—suspension from the program. Communities can impose penalties on property owners who fail to fully comply with their floodplain management ordinances. Some States and communities prosecute violations as misdemeanors.

G284.4—Digital Flood Insurance Rate Maps (DFIRMs)
September 2011 Participant Manual Page 4-9
MAPPING BACKGROUND
Visual 4.9
Key Points When maps were first created in the late 1960’s and early 1970’s, they were in the form of the Flood Hazard Boundary Map (FHBM). Flood Hazard Boundary Maps identified all flood hazard areas by the approximate methods rather than through detailed engineering studies. Many of these maps were converted to FIRMs without conducting detailed studies so that they are brought into the Regular Phase of the program, which facilitated higher insurance coverage. Then the number of detailed engineering studies began to grow. In this phase, the maps were prepared as a combination of separate Flood Boundary and Floodway Map (FBFM) and the Flood Insurance Rate Map (FIRM) that were part of a Flood Insurance Study (FIS). These two distinct sets of maps created many problems, especially in communities that were not using both map sets in their program implementation. In the mid-1980s, both of these maps were combined into a single FIRM that was community-based. For example, the County maps did not show SFHAs for municipalities within the County. • The FIS and FIRM are now countywide, which resulted in significant cost savings due to a
reduced number of map panels. • The class will be working with a countywide FIS and FIRM during this module. Scanned historical Flood Insurance Rate Maps and studies are available online from the Map Information eXchange (MIX). The maps are accessible to the public and allow creation and printing of maps showing user-designated portions of the FIRM, which are called FIRMettes. Scanned map panels are in a Tagged Image File (TIF) format. None of the information is digitized and the maps cannot be revised.

G284.4—Digital Flood Insurance Rate Maps (DFIRMs)
Page 4-10 Participant Manual September 2011
MAPPING BACKGROUND
Visual 4.10
Key Points The goal of the Map Modernization Initiative is that all communities with Flood Insurance Rate Maps will use a digitized map that meets specific standards. There are different approaches to meeting this goal. • The existing effective paper FIRM may be digitized, resulting in a DFIRM that appears
identical to the effective FIRM. • The existing FIRM may be plotted on a digital base map. The DFIRM will look different from
the existing FIRM, even through the same study and BFEs were used. The SFHA may be enlarged or narrowed.
• The DFIRM may be created through a new study. Advantages of DFIRMs include the following: • Reduces costs and increases accuracy. • Eliminates problems with use of different scales and with matching adjacent map panels. • Allows combined mapping of flood and other hazards. • Encourages use of quality local data for better program administration and implementation. States and regions have different approaches to creating DFIRMs. However, all methods begin with a digital base map. The base map can be planimetric or aerial.
G284.4—Digital Flood Insurance Rate Maps (DFIRMs)
September 2011 Participant Manual Page 4-11
MAPPING BACKGROUND The digital base map may use a different datum than the existing effective FIRM. • A datum is a system of reference points on the Earth’s surface from which position
measurements are made and define the geographic coordinate system. • The National Geodetic Vertical Datum (NGVD) of 1929 was used as reference for FIRMs
prior to Map Modernization. • Later FIRMs were produced based on North American Vertical Datum (NAVD) of 1988• The two datums can easily be converted from one to other, in most cases.
.
G284.4—Digital Flood Insurance Rate Maps (DFIRMs)
Page 4-12 Participant Manual September 2011
MAPPING BACKGROUND
Visual 4.11
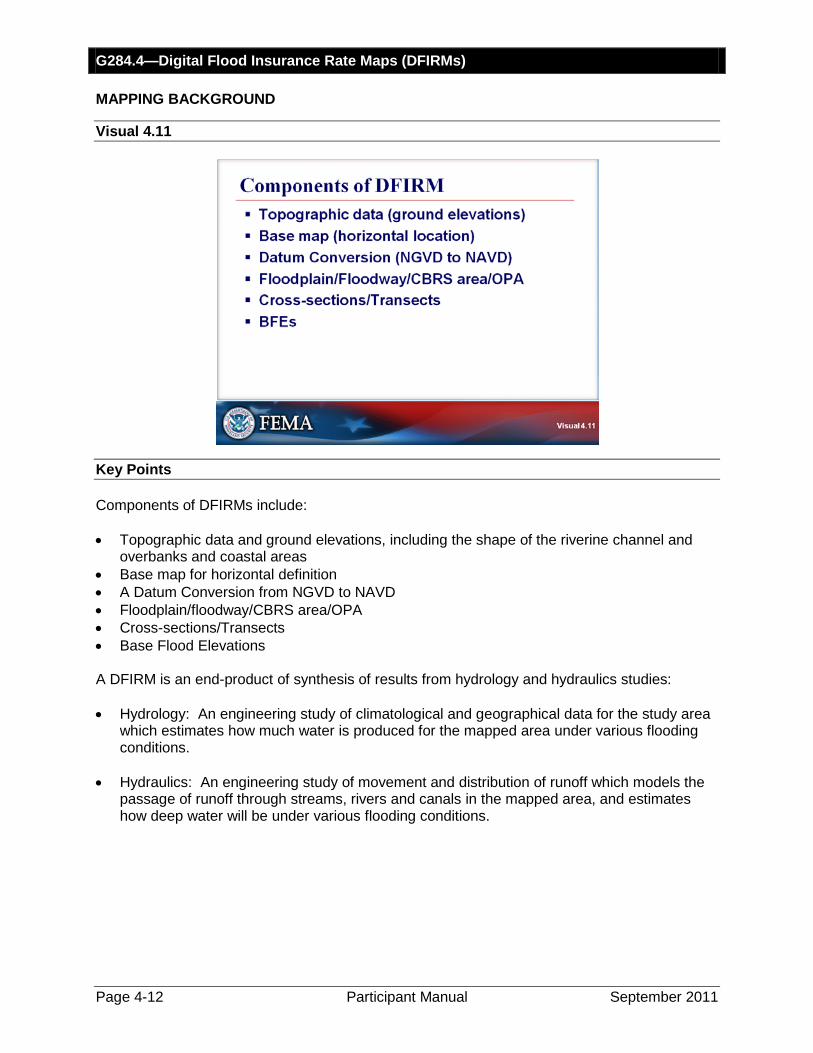
Key Points Components of DFIRMs include: • Topographic data and ground elevations, including the shape of the riverine channel and
overbanks and coastal areas • Base map for horizontal definition • A Datum Conversion from NGVD to NAVD • Floodplain/floodway/CBRS area/OPA • Cross-sections/Transects • Base Flood Elevations A DFIRM is an end-product of synthesis of results from hydrology and hydraulics studies: • Hydrology: An engineering study of climatological and geographical data for the study area
which estimates how much water is produced for the mapped area under various flooding conditions.
• Hydraulics: An engineering study of movement and distribution of runoff which models the
passage of runoff through streams, rivers and canals in the mapped area, and estimates how deep water will be under various flooding conditions.

G284.4—Digital Flood Insurance Rate Maps (DFIRMs)
September 2011 Participant Manual Page 4-13
FIS PROCESS
Visual 4.12
Key Points The next portion of this module will describe the Flood Insurance Study (FIS) process.
G284.4—Digital Flood Insurance Rate Maps (DFIRMs)
Page 4-14 Participant Manual September 2011
FIS PROCESS
Visual 4.13
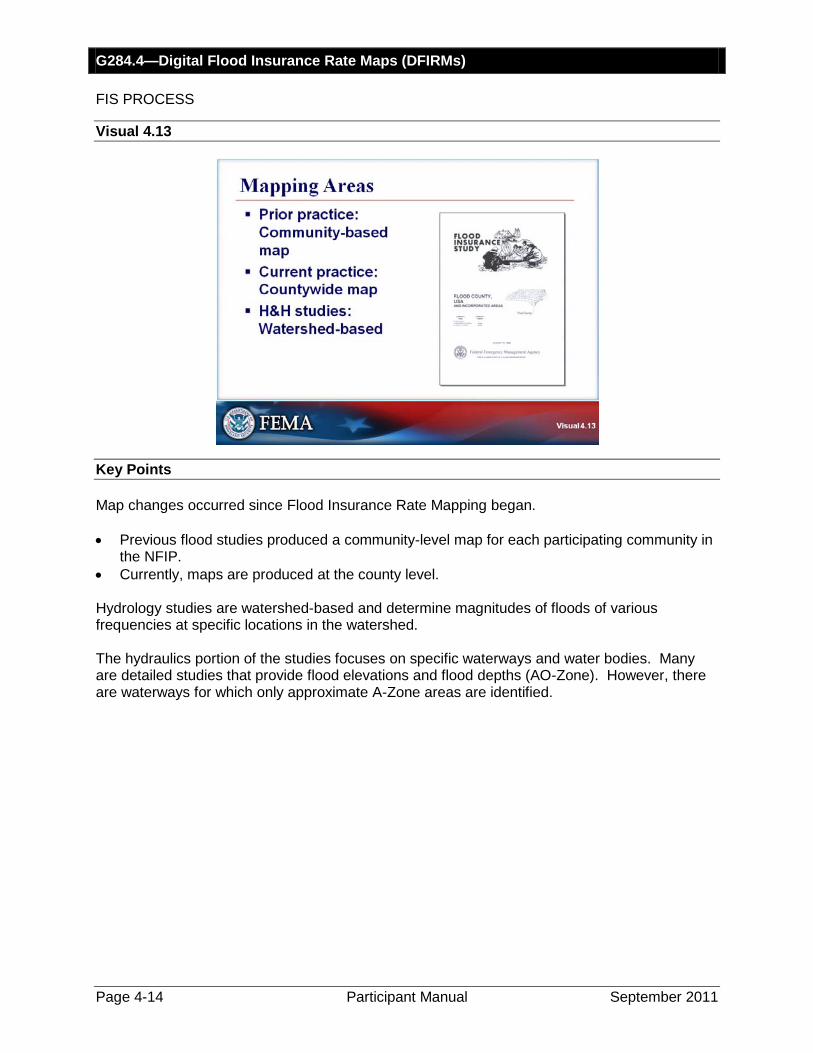
Key Points Map changes occurred since Flood Insurance Rate Mapping began. • Previous flood studies produced a community-level map for each participating community in
the NFIP. • Currently, maps are produced at the county level. Hydrology studies are watershed-based and determine magnitudes of floods of various frequencies at specific locations in the watershed. The hydraulics portion of the studies focuses on specific waterways and water bodies. Many are detailed studies that provide flood elevations and flood depths (AO-Zone). However, there are waterways for which only approximate A-Zone areas are identified.

G284.4—Digital Flood Insurance Rate Maps (DFIRMs)
September 2011 Participant Manual Page 4-15
FIS PROCESS
Visual 4.14
Key Points A watershed or drainage basin refers to a system controlled by topography, which defines how water will flow. A watershed includes an area with creeks, rivers, or streams that drains to a waterway or into a body of water. • For example, all creeks that flow in the San Francisco Bay are part of the San Francisco Bay
Watershed. • However, there are many smaller watersheds within this area depending on flow patterns. • Alameda Creek Watershed would be an area that drains into Alameda Creek. When it rains, water will flow through the appropriate watershed. A ridge, which consists of topographical high areas between two watersheds, is called a divide. In the United States there is an area in the Rocky Mountains called the “Continental Divide.” • Water on the east of the divide eventually flows into the Atlantic. • The water on the west side eventually flows into the Pacific.
G284.4—Digital Flood Insurance Rate Maps (DFIRMs)
Page 4-16 Participant Manual September 2011
FIS PROCESS
Visual 4.15
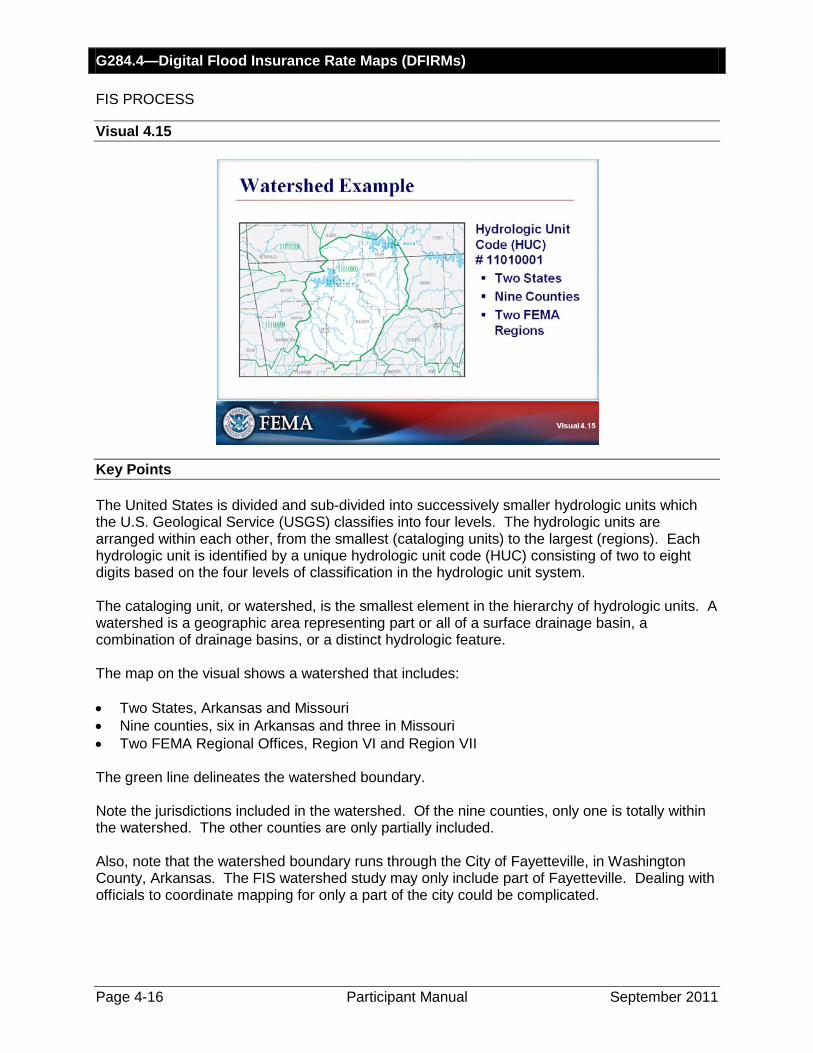
Key Points The United States is divided and sub-divided into successively smaller hydrologic units which the U.S. Geological Service (USGS) classifies into four levels. The hydrologic units are arranged within each other, from the smallest (cataloging units) to the largest (regions). Each hydrologic unit is identified by a unique hydrologic unit code (HUC) consisting of two to eight digits based on the four levels of classification in the hydrologic unit system. The cataloging unit, or watershed, is the smallest element in the hierarchy of hydrologic units. A watershed is a geographic area representing part or all of a surface drainage basin, a combination of drainage basins, or a distinct hydrologic feature. The map on the visual shows a watershed that includes: • Two States, Arkansas and Missouri • Nine counties, six in Arkansas and three in Missouri • Two FEMA Regional Offices, Region VI and Region VII The green line delineates the watershed boundary. Note the jurisdictions included in the watershed. Of the nine counties, only one is totally within the watershed. The other counties are only partially included. Also, note that the watershed boundary runs through the City of Fayetteville, in Washington County, Arkansas. The FIS watershed study may only include part of Fayetteville. Dealing with officials to coordinate mapping for only a part of the city could be complicated.

G284.4—Digital Flood Insurance Rate Maps (DFIRMs)
September 2011 Participant Manual Page 4-17
FIS PROCESS
Visual 4.16
Key Points The hydrology part of Flood Insurance Studies is watershed-based, while maps will remain county-based. The advantages of watershed based studies are: • Improved science. • Fewer disconnects between related areas. • Greater accuracy. The disadvantages may include the need to deal with multiple jurisdictions, especially if they adopt varying floodplain management standards in their ordinances: Watershed-based studies may require multiple scoping meetings and Preliminary DFIRM Coordination Committee (PDCC) meetings. Another disadvantage is that only a part of the community may be the subject of the meetings, because the community includes two or more watersheds. There are water rights issues in the American Southwest and Southeast. There may be political ramifications involved in watershed-based studies. Hydrology studies estimate the amount of flow at various locations in the watershed for specific frequency flood events.

G284.4—Digital Flood Insurance Rate Maps (DFIRMs)
Page 4-18 Participant Manual September 2011
FIS PROCESS
Visual 4.17
Key Points The mapping process consists of the following steps. • The initial scoping meeting is held. • Data development and study production are completed. • The preliminary FIS and DFIRM are issued. • The PDCC meeting is held approximately 30 days after release of the preliminary FIS and
DFIRM. • The 90-day appeal period begins with the publication of the second public notice following
the PDCC meeting. • After 90 days, the appeal period ends. • The Letter of Final Determination (LFD) is issued after all appeals are resolved. • The 6-month adoption and compliance period begins. • At the end of the 6-month compliance period, the FIS and DFIRM become effective.

G284.4—Digital Flood Insurance Rate Maps (DFIRMs)
September 2011 Participant Manual Page 4-19
FIS PROCESS The following example is the timetable from the State of Montana. State of Montana Flood Study and Adoption Timeline
FEMA Flood Study and Adoption Timeline
Project scoping and kickoff meetings held
Project begins Initial scoping meeting held
Flood hazard data development/Flood Insurance
Rate Map* and flood study production
*Flood Insurance Rate Map refers to the DFIRM
Timeframe varies Flood hazard data development/Flood Insurance
Rate Map* and flood study production
Preliminary Flood Insurance Rate Map and report issued
Draft map release date Preliminary Flood Insurance Rate Map and report issued
Public meeting(s) held for affected communities on
proposed Flood Insurance Rate Map and report
Approximately 30 days after release
Final community meeting held
BFEs published twice
Order to adopt proposed Flood Insurance Rate Map and report
drafted and noticed
Community meeting(s) held and BFEs
published
90-day appeal period on flood elevations and 90-day protest
period on flood hazard delineations begins
Official start date: 2nd BFE publication date
30-day appeal period on order begins
60 days into FEMA appeal period
Appeal period ends
Resolve appeals to finalize maps
Approximately 120 days after release
Appeal period ends
Finalize maps and resolve appeals
State adoption of proposed Flood Insurance Rate Map and
report
Once appeals resolved and map finalized
Letter of Final Determination issued
6-month Adoption/Compliance period—Communities adopt
Flood Insurance Rate Map and report
End of 6-month adoption period
Flood Insurance Rate Map and report effective

G284.4—Digital Flood Insurance Rate Maps (DFIRMs)
Page 4-20 Participant Manual September 2011
FIS PROCESS
Visual 4.18
Key Points The mapping process offers opportunities to: • Fix problem areas with maps, such as wrong road names. • Add new development and subdivisions to maps. • Share local information that will become part of official map. • Engage elected officials in floodplain management. In general, the best investment that a local community can make is to obtain better topographic maps. Key considerations during the mapping process include assuring that: • Local information meets mapping guidelines and standards. • Needs assessment is ongoing and needs are continually updated. The Floodplain Manager should communicate local needs at initial scoping meeting.
G284.4—Digital Flood Insurance Rate Maps (DFIRMs)
September 2011 Participant Manual Page 4-21
FIS PROCESS
Visual 4.19
Key Points Discussion Question
: How has the mapping process proceeded in your community?
Discussion Question
: What advice would you give to communities beginning the process?
G284.4—Digital Flood Insurance Rate Maps (DFIRMs)
Page 4-22 Participant Manual September 2011
FIS PROCESS
Visual 4.20
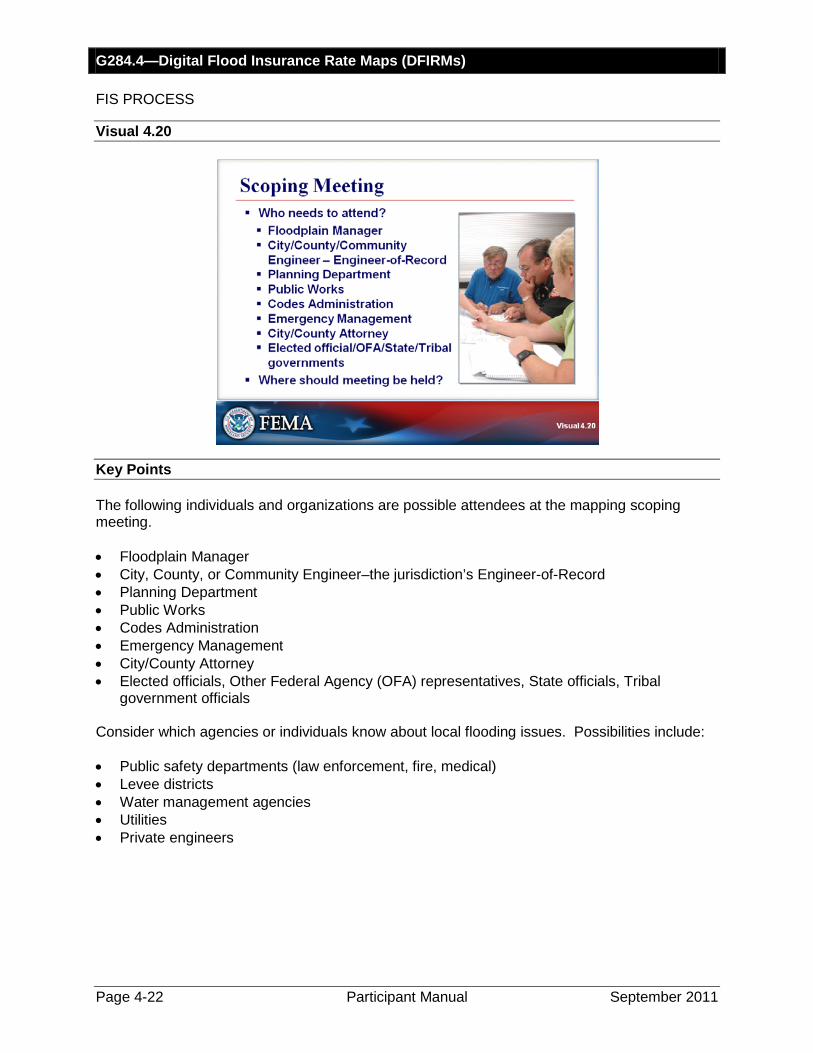
Key Points The following individuals and organizations are possible attendees at the mapping scoping meeting. • Floodplain Manager • City, County, or Community Engineer–the jurisdiction’s Engineer-of-Record • Planning Department • Public Works • Codes Administration • Emergency Management • City/County Attorney • Elected officials, Other Federal Agency (OFA) representatives, State officials, Tribal
government officials Consider which agencies or individuals know about local flooding issues. Possibilities include: • Public safety departments (law enforcement, fire, medical) • Levee districts • Water management agencies • Utilities • Private engineers
G284.4—Digital Flood Insurance Rate Maps (DFIRMs)
September 2011 Participant Manual Page 4-23
FIS PROCESS Decide whether given individuals need to attend the meeting, or if their departmental or organizational mapping needs could be provided in advance of the meeting. After deciding who should attend, a meeting location needs to be identified. When the meeting is conducted, it is important to record names and contact information of attendees, and apprise them of subsequent developments throughout the mapping process.

G284.4—Digital Flood Insurance Rate Maps (DFIRMs)
Page 4-24 Participant Manual September 2011
FIS PROCESS
Visual 4.21
Key Points Discussion Question
: What is the objective of scoping?
Discussion Question
: What do I need to bring?

G284.4—Digital Flood Insurance Rate Maps (DFIRMs)
September 2011 Participant Manual Page 4-25
FIS PROCESS
Visual 4.22
Key Points After the scoping meeting, the data development process begins. The study contractor will work with the community, the State, and FEMA. Data from the community, especially topographic data, are often needed. All data: • Must meet mapping specifications and guidelines. • Should be submitted to the study contractor. • Should flow to the contractor through a single source.

G284.4—Digital Flood Insurance Rate Maps (DFIRMs)
Page 4-26 Participant Manual September 2011
FIS PROCESS
Visual 4.23
Key Points At the conclusion of data development, preliminary map products are issued. Products include: • A Preliminary FIRM. • A Study Report. The Preliminary FIRM should be reviewed by: • Officials within the jurisdiction affected by mapping results. • Citizens. Public input and review can build support for new maps. It is important to ensure that previously issued Letters of Map Change (LOMCs) are incorporated in the Preliminary FIRM.

G284.4—Digital Flood Insurance Rate Maps (DFIRMs)
September 2011 Participant Manual Page 4-27
FIS PROCESS
Visual 4.24
Key Points Discussion Question
: Who should be invited to review preliminary map products?
G284.4—Digital Flood Insurance Rate Maps (DFIRMs)
Page 4-28 Participant Manual September 2011
FIS PROCESS
Visual 4.25
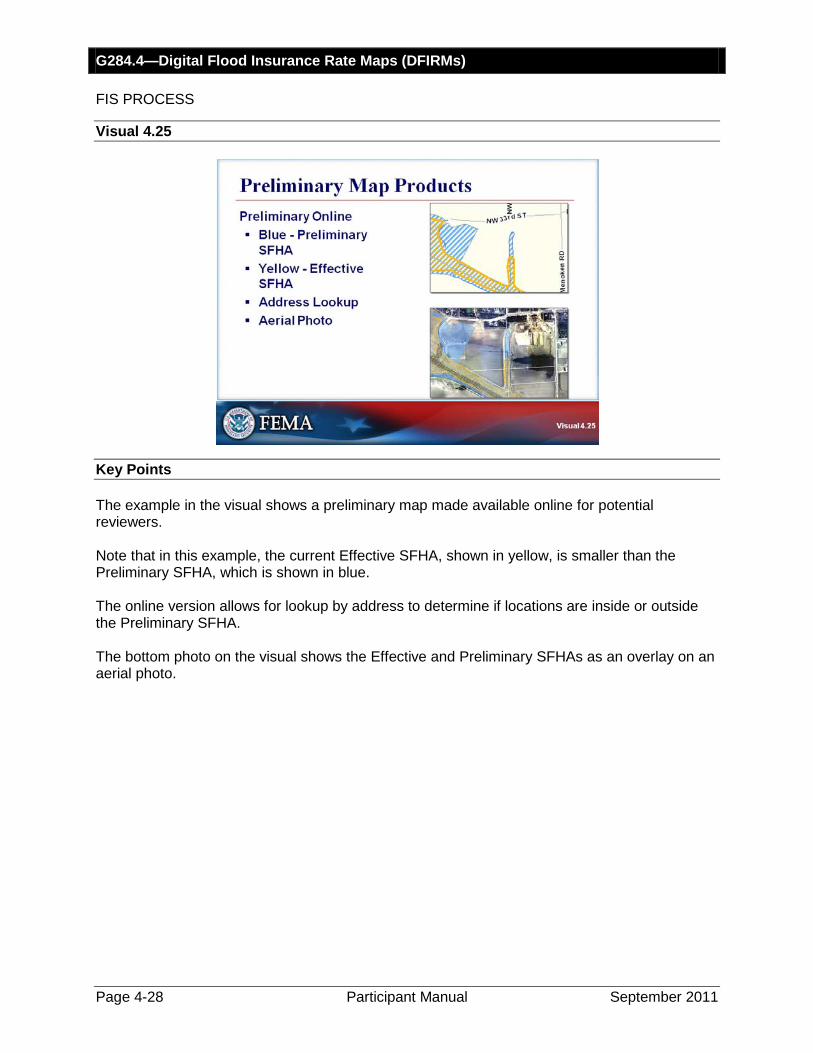
Key Points The example in the visual shows a preliminary map made available online for potential reviewers. Note that in this example, the current Effective SFHA, shown in yellow, is smaller than the Preliminary SFHA, which is shown in blue. The online version allows for lookup by address to determine if locations are inside or outside the Preliminary SFHA. The bottom photo on the visual shows the Effective and Preliminary SFHAs as an overlay on an aerial photo.
G284.4—Digital Flood Insurance Rate Maps (DFIRMs)
September 2011 Participant Manual Page 4-29
FIS PROCESS
Visual 4.26
Key Points Discussion Question
: What problems do preliminary map products typically encounter?
G284.4—Digital Flood Insurance Rate Maps (DFIRMs)
Page 4-30 Participant Manual September 2011
FIS PROCESS
Visual 4.27
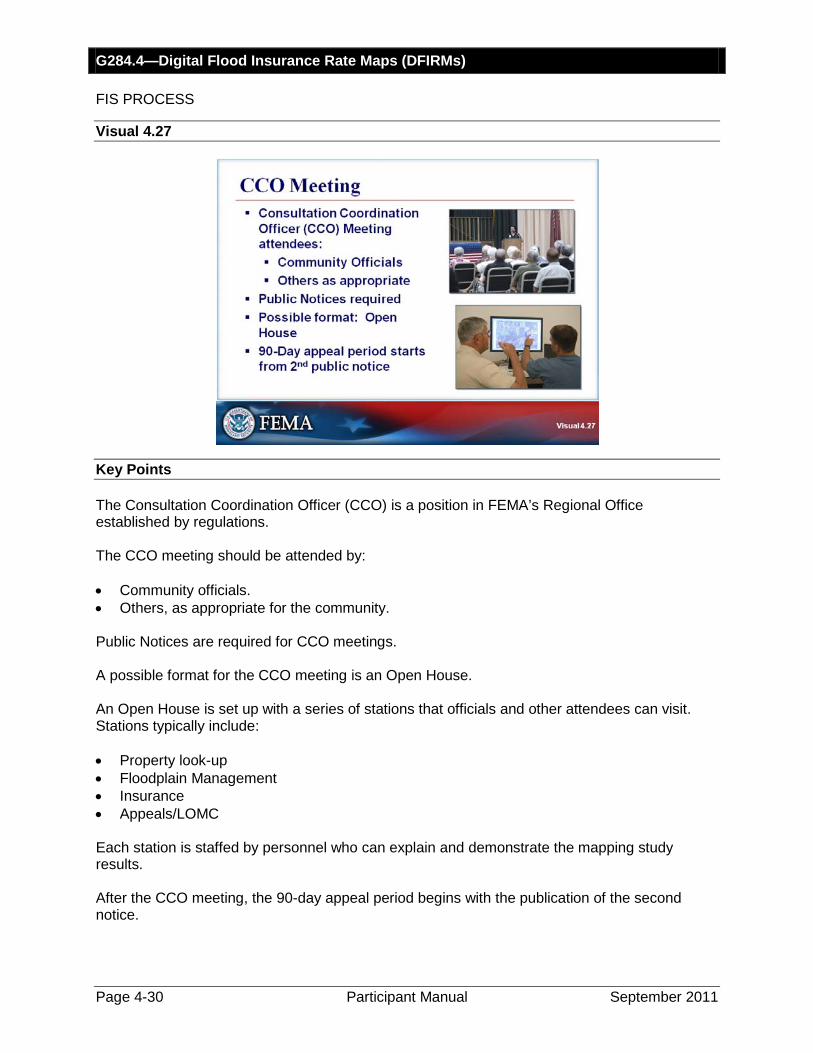
Key Points The Consultation Coordination Officer (CCO) is a position in FEMA’s Regional Office established by regulations. The CCO meeting should be attended by: • Community officials. • Others, as appropriate for the community. Public Notices are required for CCO meetings. A possible format for the CCO meeting is an Open House. An Open House is set up with a series of stations that officials and other attendees can visit. Stations typically include: • Property look-up • Floodplain Management • Insurance • Appeals/LOMC Each station is staffed by personnel who can explain and demonstrate the mapping study results. After the CCO meeting, the 90-day appeal period begins with the publication of the second notice.
G284.4—Digital Flood Insurance Rate Maps (DFIRMs)
September 2011 Participant Manual Page 4-31
FIS PROCESS
Visual 4.28
Key Points Discussion Question
: What experiences have you had with Open Houses?

G284.4—Digital Flood Insurance Rate Maps (DFIRMs)
Page 4-32 Participant Manual September 2011
FIS PROCESS
Visual 4.29
Key Points During the LOMC revalidation process, LOMCs issued under the previous effective map are evaluated to determine current validity. The role of the FPM in this process is to guide the public. Assistance may include providing FEMA contact information. Cases where determination is the same (e.g. that the lot is removed from the SFHA) are revalidated. If cases are not revalidated, property owners need to know: • Who to contact. • The process to request a reissuance or revalidation.
G284.4—Digital Flood Insurance Rate Maps (DFIRMs)
September 2011 Participant Manual Page 4-33
FIS PROCESS There are four categories of LOMC cases: 1. Category 1 includes those Letters of Map Amendment (LOMAs), Letters of Map Revision—
Based-on-Fill (LOMR-Fs), and Letters of Map Revision (LOMRs) for which the results have been shown on the new or revised FIRM panel(s).
2. Category 2 includes those LOMAs and LOMR-Fs for which the results could not be mapped and shown on the new or revised FIRM panel(s) because of scale limitations or because the affected areas were determined to be outside the SFHA as shown on the effective FIRM. These LOMAs and LOMR-Fs are automatically revalidated after the new or revised FIRM panel(s) become(s) effective.
3. Category 3 includes those LOMAs, LOMR-Fs, and LOMRs for which the results have not
been, and will not be, reflected on the new or revised FIRM panel(s) because the flood hazard information on which the original determinations were based is being superseded by new flood hazard information.
4. Category 4 includes those LOMAs, LOMR-Fs, and LOMRs for which new determinations must be made. LOMAs and LOMR-Fs that were previously issued for multiple lots or structures where the determination for one or more of the lots or structures has changed as a result of the re-mapping cannot be revalidated through the revalidation process. The processing Mapping Partner will use the data submitted in support of the original LOMA or LOMR-F request to make a new determination after the new or revised FIRM becomes effective. FEMA will issue a single new determination letter for the subject properties.
The study contractor is responsible for identifying LOMAs and LOMR-Fs for revalidation. The contract may miss some LOMCs. The local official should check the study LOMCs against local LOMC files to assure that all are included.
G284.4—Digital Flood Insurance Rate Maps (DFIRMs)
Page 4-34 Participant Manual September 2011
FIS PROCESS
Visual 4.30
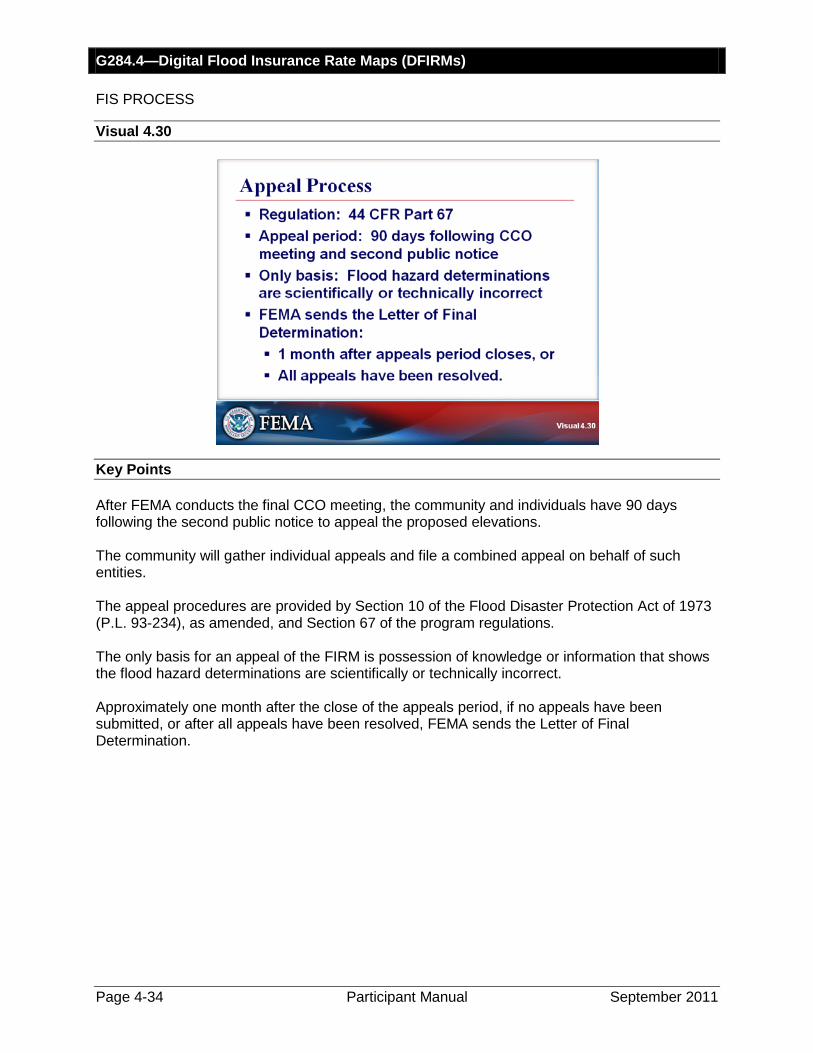
Key Points After FEMA conducts the final CCO meeting, the community and individuals have 90 days following the second public notice to appeal the proposed elevations. The community will gather individual appeals and file a combined appeal on behalf of such entities. The appeal procedures are provided by Section 10 of the Flood Disaster Protection Act of 1973 (P.L. 93-234), as amended, and Section 67 of the program regulations. The only basis for an appeal of the FIRM is possession of knowledge or information that shows the flood hazard determinations are scientifically or technically incorrect. Approximately one month after the close of the appeals period, if no appeals have been submitted, or after all appeals have been resolved, FEMA sends the Letter of Final Determination.
G284.4—Digital Flood Insurance Rate Maps (DFIRMs)
September 2011 Participant Manual Page 4-35
FIS PROCESS
Visual 4.31
Key Points Activity Purpose
: The purpose of this activity is to allow you to identify valid and invalid grounds for appeals to FIS and DFIRM.
Instructions
1. Review circumstances of each appeal.
: Working as a group:
2. Determine whether there are valid grounds for an appeal. 3. Explain what should happen next in this situation. Time
: 10 minutes
Situations
:
1. The owner has submitted a complete package of data, including Hydrology and Hydraulics data and a map showing the SFHA. The owner contends that the FIRM incorrectly places the property in the SFHA.
G284.4—Digital Flood Insurance Rate Maps (DFIRMs)
Page 4-36 Participant Manual September 2011
FIS PROCESS Situations
: (Continued)
2. An owner has submitted a copy of a preliminary FIRM and a tax map showing the same road with different names.
3. A homeowner has sent a letter stating that she has lived in her house for 50 years, and it
has never flooded. The homeowner charges that the FIRMs are wrong.
G284.4—Digital Flood Insurance Rate Maps (DFIRMs)
September 2011 Participant Manual Page 4-37
FIS PROCESS
Visual 4.32
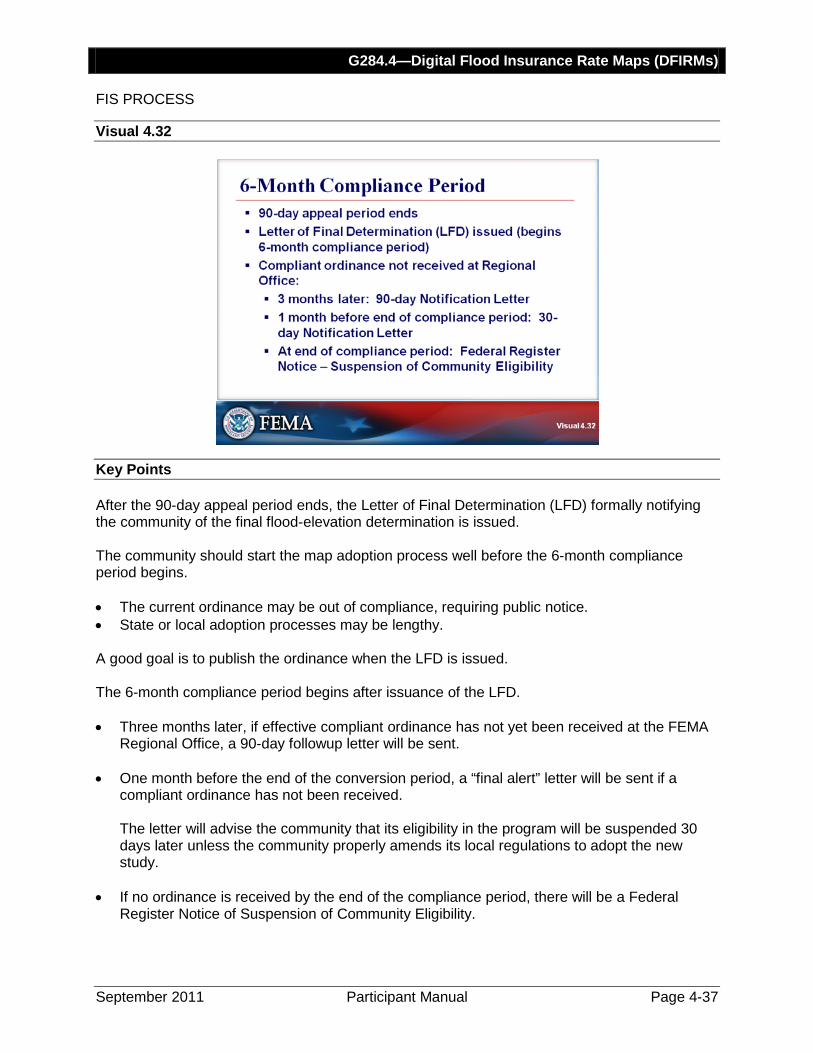
Key Points After the 90-day appeal period ends, the Letter of Final Determination (LFD) formally notifying the community of the final flood-elevation determination is issued. The community should start the map adoption process well before the 6-month compliance period begins. • The current ordinance may be out of compliance, requiring public notice. • State or local adoption processes may be lengthy. A good goal is to publish the ordinance when the LFD is issued. The 6-month compliance period begins after issuance of the LFD. • Three months later, if effective compliant ordinance has not yet been received at the FEMA
Regional Office, a 90-day followup letter will be sent. • One month before the end of the conversion period, a “final alert” letter will be sent if a
compliant ordinance has not been received.
The letter will advise the community that its eligibility in the program will be suspended 30 days later unless the community properly amends its local regulations to adopt the new study.
• If no ordinance is received by the end of the compliance period, there will be a Federal
Register Notice of Suspension of Community Eligibility.
G284.4—Digital Flood Insurance Rate Maps (DFIRMs)
Page 4-38 Participant Manual September 2011
FIS PROCESS The scheduled regular program entry date will mark the end of the 6-month compliance period. The Flood Insurance Rate Maps and actuarial insurance rates will become effective on the same day. If a floodplain management ordinance is not enacted in a timely fashion, a community can be reinstated quickly in the program once a compliant, effective ordinance is received and approved by FEMA. A community becomes eligible again within a few working days of receipt of the ordinance at the FEMA Regional Office. Each community adopts the FIS and the entire map, but that community has no jurisdiction over other local governments also included in the map. Communities are encouraged to keep one copy of the paper maps.

G284.4—Digital Flood Insurance Rate Maps (DFIRMs)
September 2011 Participant Manual Page 4-39
DIGITAL MAP USES
Visual 4.33
Key Points The next section of this module will discuss various uses of digital maps.

G284.4—Digital Flood Insurance Rate Maps (DFIRMs)
Page 4-40 Participant Manual September 2011
DIGITAL MAP USES
Visual 4.34
Key Points Refer to the FEMA Fact Sheet: Increasing Options with Digital Flood Data. The Factsheet reviews the following types of mapping products: • FIRM scan • FIRMette • MapViewer, available on the Web • Digital Flood Insurance Rate Map (DFIRM) data • Web Map Service

G284.4—Digital Flood Insurance Rate Maps (DFIRMs)
September 2011 Participant Manual Page 4-41
DIGITAL MAP USES
Visual 4.35
Key Points Having digital maps provides the ability to: • Provide FIRMettes to the public. • Add new base data, for example, by adding a new aerial photo. • Print at different scales. • Integrate with GIS data. • Integrate developers’ digital plans with the DFIRM.
G284.4—Digital Flood Insurance Rate Maps (DFIRMs)
Page 4-42 Participant Manual September 2011
DIGITAL MAP USES
Visual 4.36
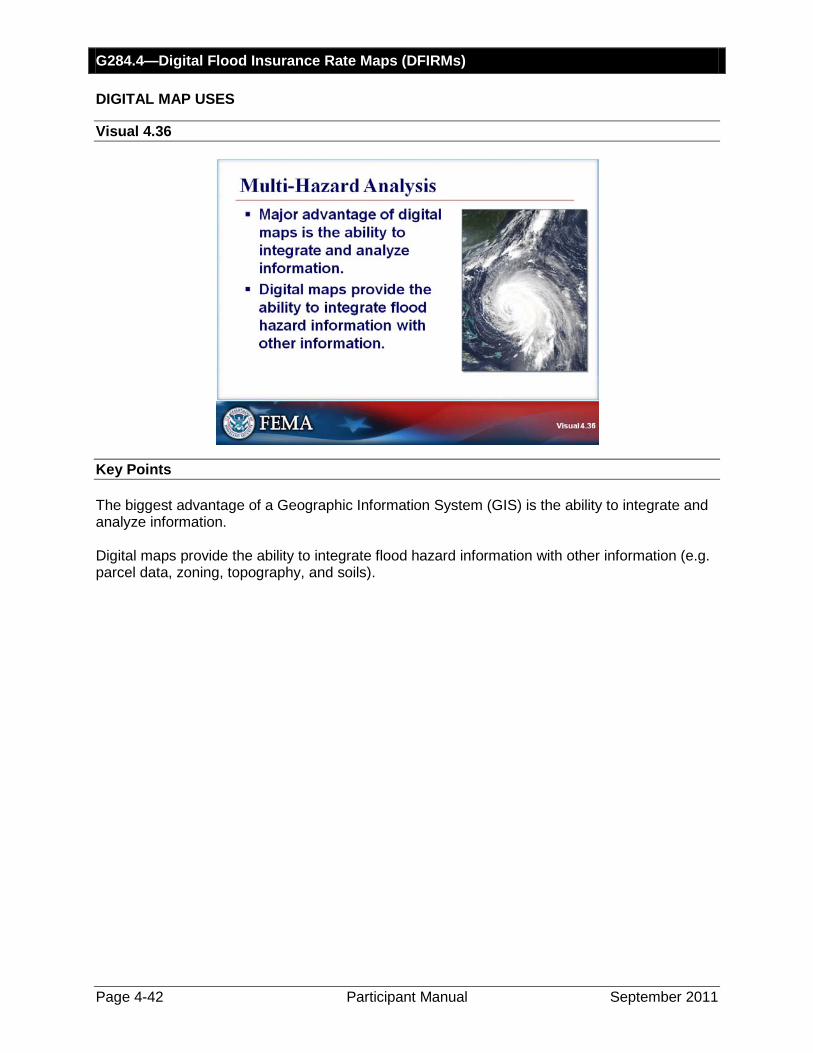
Key Points The biggest advantage of a Geographic Information System (GIS) is the ability to integrate and analyze information. Digital maps provide the ability to integrate flood hazard information with other information (e.g. parcel data, zoning, topography, and soils).

G284.4—Digital Flood Insurance Rate Maps (DFIRMs)
September 2011 Participant Manual Page 4-43
DIGITAL MAP USES
Visual 4.37
Key Points The big advantage of the MapViewer—Web is that the data are current and are the most complete compared to other sources. LOMAs and LOMRs are added daily to the base DFIRM data, and all are displayed in the same view.
G284.4—Digital Flood Insurance Rate Maps (DFIRMs)
Page 4-44 Participant Manual September 2011
DIGITAL MAP USES
Visual 4.38
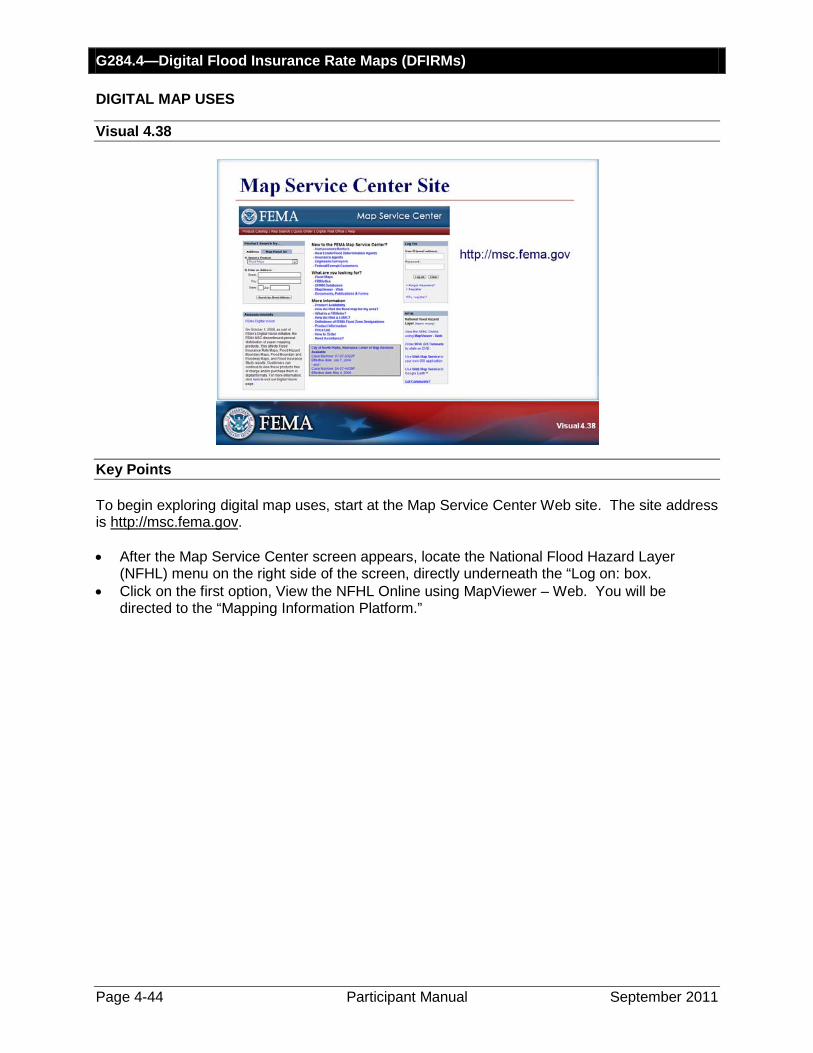
Key Points To begin exploring digital map uses, start at the Map Service Center Web site. The site address is http://msc.fema.gov
.
• After the Map Service Center screen appears, locate the National Flood Hazard Layer (NFHL) menu on the right side of the screen, directly underneath the “Log on: box.
• Click on the first option, View the NFHL Online using MapViewer – Web. You will be directed to the “Mapping Information Platform.”
G284.4—Digital Flood Insurance Rate Maps (DFIRMs)
September 2011 Participant Manual Page 4-45
DIGITAL MAP USES
Visual 4.39
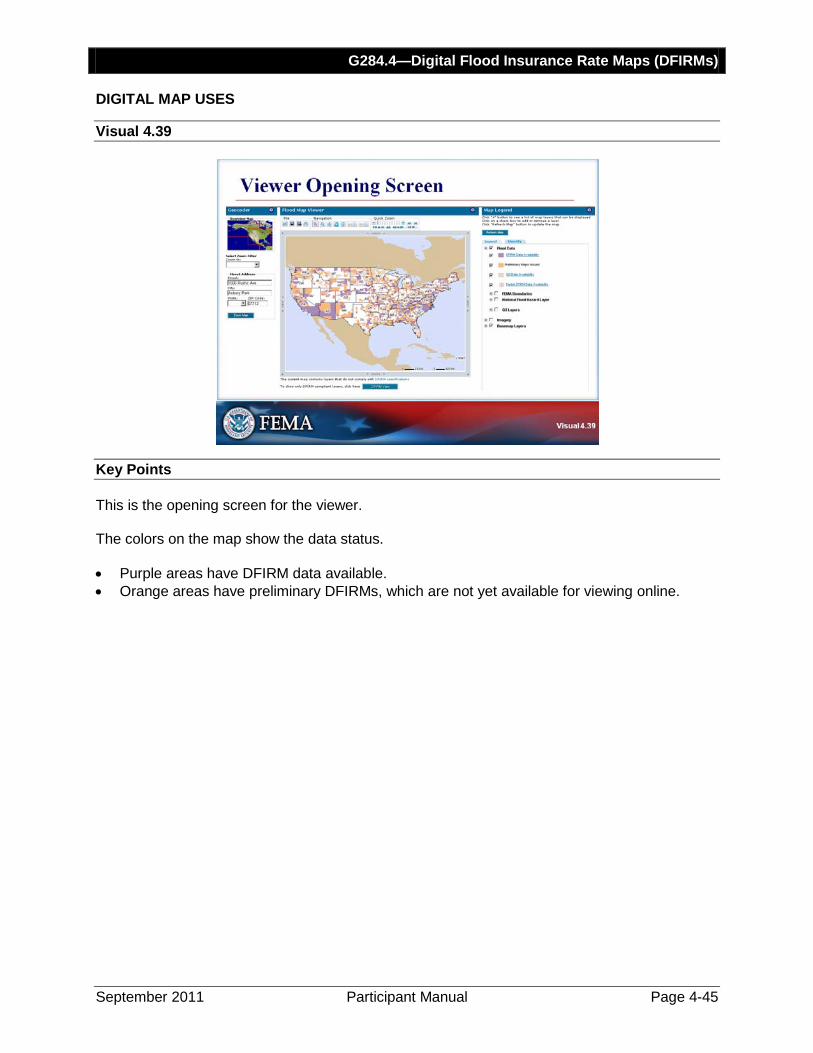
Key Points This is the opening screen for the viewer. The colors on the map show the data status. • Purple areas have DFIRM data available. • Orange areas have preliminary DFIRMs, which are not yet available for viewing online.

G284.4—Digital Flood Insurance Rate Maps (DFIRMs)
Page 4-46 Participant Manual September 2011
DIGITAL MAP USES
Visual 4.40
Key Points You can enter a street address to find the area you are interested in. The address entered for this demonstration is: 1500 Rustic Dr. Asbury Park, NJ 07712 Click on “Zoom Map.”
G284.4—Digital Flood Insurance Rate Maps (DFIRMs)
September 2011 Participant Manual Page 4-47
DIGITAL MAP USES
Visual 4.41
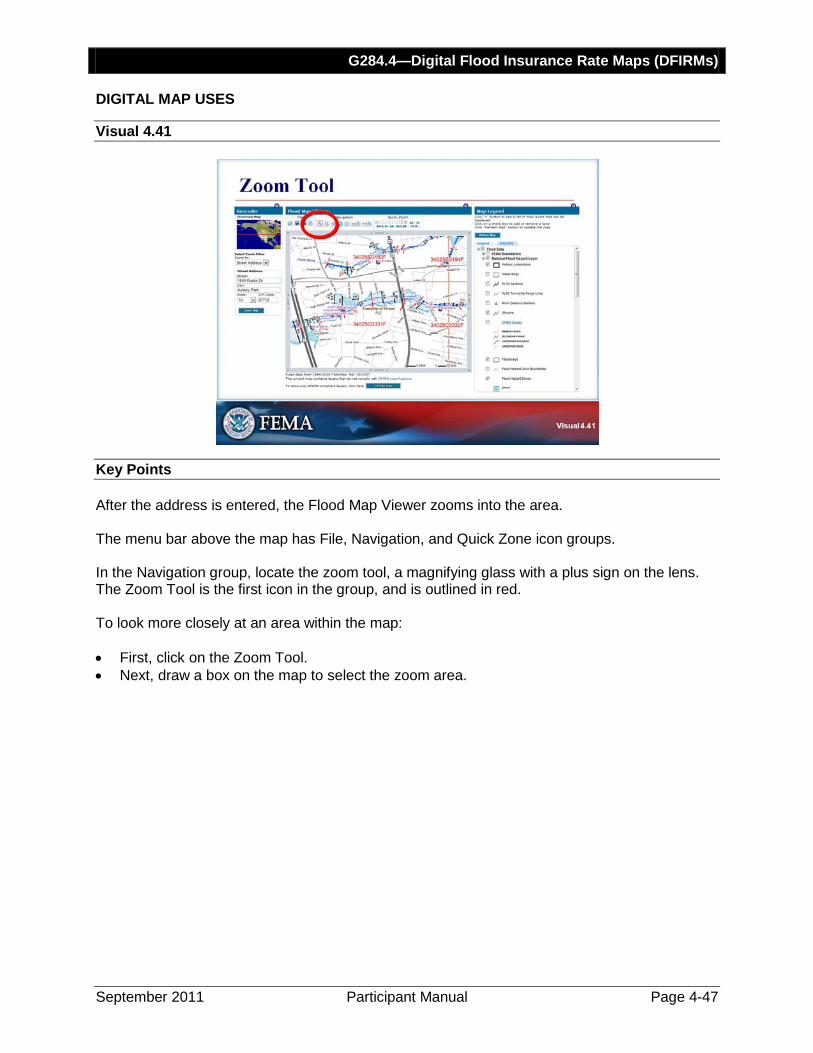
Key Points After the address is entered, the Flood Map Viewer zooms into the area. The menu bar above the map has File, Navigation, and Quick Zone icon groups. In the Navigation group, locate the zoom tool, a magnifying glass with a plus sign on the lens. The Zoom Tool is the first icon in the group, and is outlined in red. To look more closely at an area within the map: • First, click on the Zoom Tool. • Next, draw a box on the map to select the zoom area.

G284.4—Digital Flood Insurance Rate Maps (DFIRMs)
Page 4-48 Participant Manual September 2011
DIGITAL MAP USES
Visual 4.42
Key Points After clicking the zoom tool, draw a box around the approximate area shown in the visual.

G284.4—Digital Flood Insurance Rate Maps (DFIRMs)
September 2011 Participant Manual Page 4-49
DIGITAL MAP USES
Visual 4.43
Key Points The zoomed area should look like the visual on this slide. Note that Rustic Drive is located east of cross-section K.
G284.4—Digital Flood Insurance Rate Maps (DFIRMs)
Page 4-50 Participant Manual September 2011
DIGITAL MAP USES
Visual 4.44
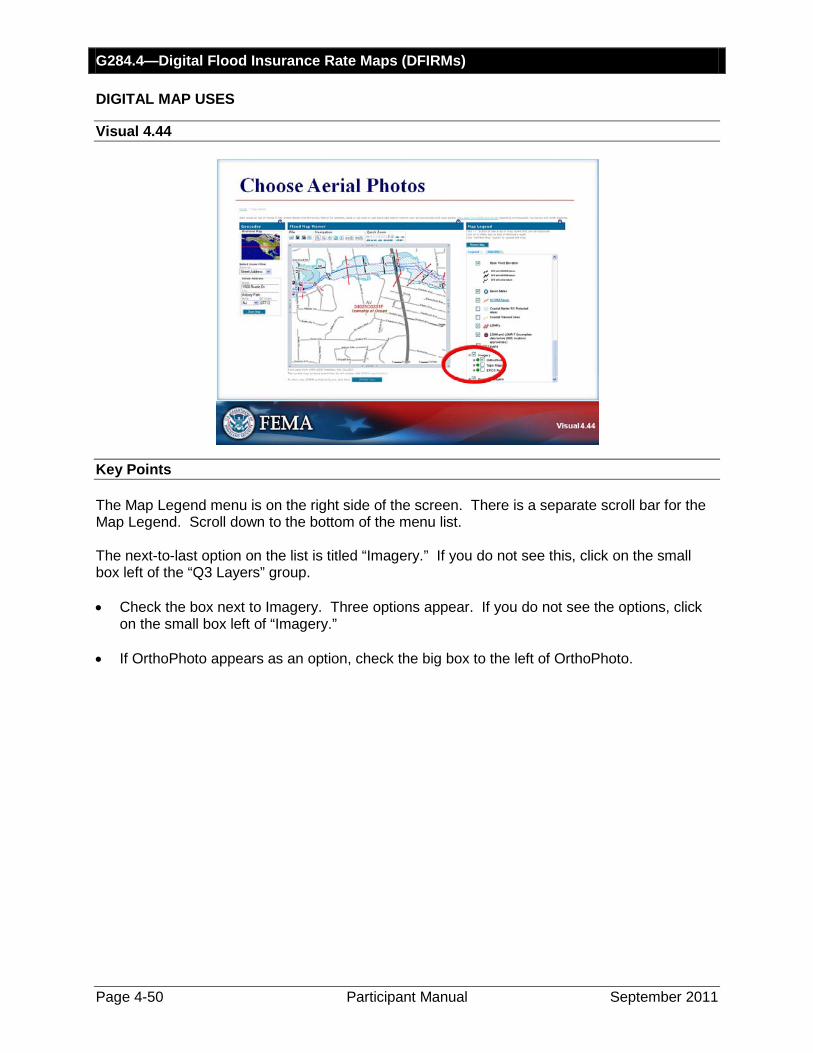
Key Points The Map Legend menu is on the right side of the screen. There is a separate scroll bar for the Map Legend. Scroll down to the bottom of the menu list. The next-to-last option on the list is titled “Imagery.” If you do not see this, click on the small box left of the “Q3 Layers” group. • Check the box next to Imagery. Three options appear. If you do not see the options, click
on the small box left of “Imagery.” • If OrthoPhoto appears as an option, check the big box to the left of OrthoPhoto.

G284.4—Digital Flood Insurance Rate Maps (DFIRMs)
September 2011 Participant Manual Page 4-51
DIGITAL MAP USES
Visual 4.45
Key Points To view the map with an aerial photo, click on the “Refresh Map” button (large blue box) near the top of the Map Legend menu.
G284.4—Digital Flood Insurance Rate Maps (DFIRMs)
Page 4-52 Participant Manual September 2011
DIGITAL MAP USES
Visual 4.46
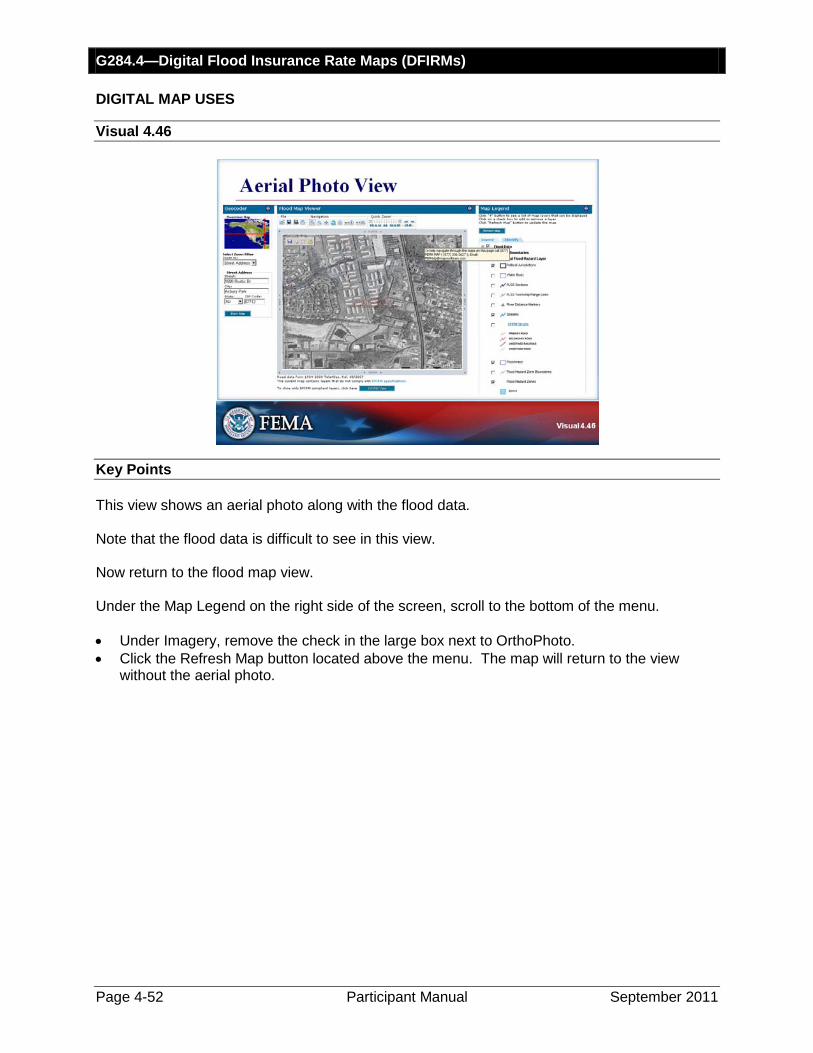
Key Points This view shows an aerial photo along with the flood data. Note that the flood data is difficult to see in this view. Now return to the flood map view. Under the Map Legend on the right side of the screen, scroll to the bottom of the menu. • Under Imagery, remove the check in the large box next to OrthoPhoto. • Click the Refresh Map button located above the menu. The map will return to the view
without the aerial photo.

G284.4—Digital Flood Insurance Rate Maps (DFIRMs)
September 2011 Participant Manual Page 4-53
DIGITAL MAP USES
Visual 4.47
Key Points On the menu bar above the map, locate the e-z print icon, the last button in the Navigation group. The icon shows the letters e-z with a printer symbol on the right. You can generate a report for a specific location by: • First, clicking on the e-z print icon. • Next, clicking on the chosen location.
G284.4—Digital Flood Insurance Rate Maps (DFIRMs)
Page 4-54 Participant Manual September 2011
DIGITAL MAP USES
Visual 4.48
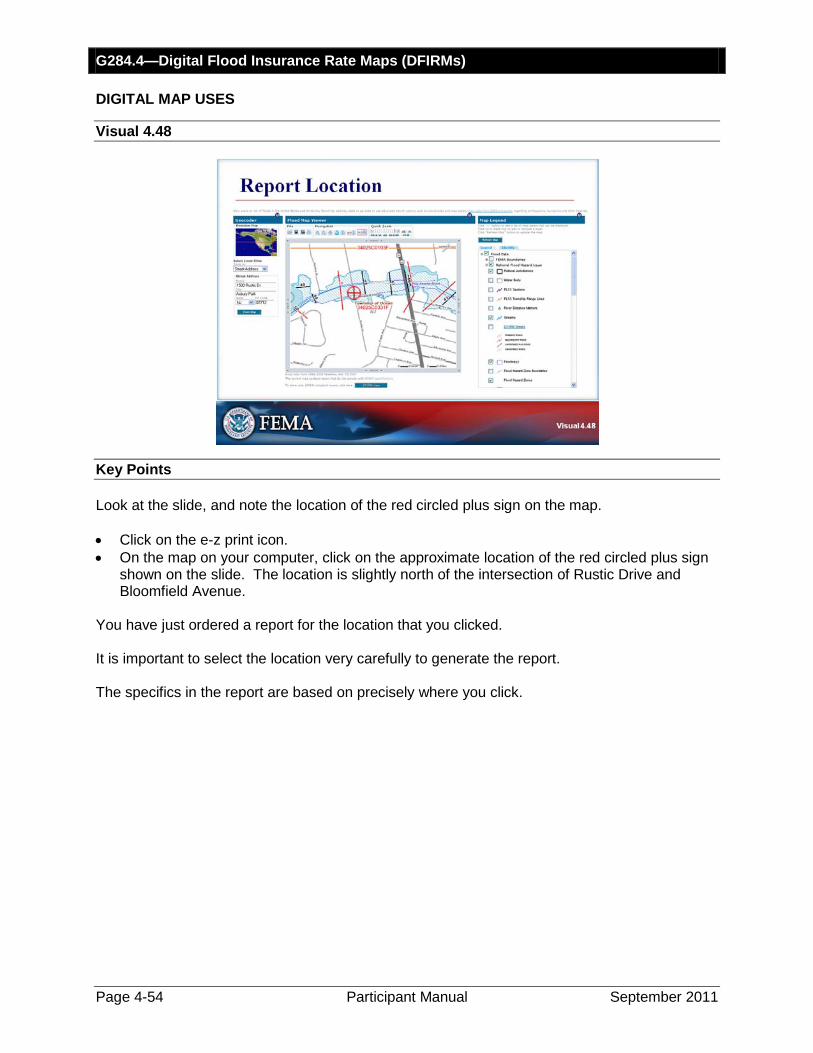
Key Points Look at the slide, and note the location of the red circled plus sign on the map. • Click on the e-z print icon. • On the map on your computer, click on the approximate location of the red circled plus sign
shown on the slide. The location is slightly north of the intersection of Rustic Drive and Bloomfield Avenue.
You have just ordered a report for the location that you clicked. It is important to select the location very carefully to generate the report. The specifics in the report are based on precisely where you click.

G284.4—Digital Flood Insurance Rate Maps (DFIRMs)
September 2011 Participant Manual Page 4-55
DIGITAL MAP USES
Visual 4.49
Key Points Depending on the computer you are using, a message may appear explaining that popups are blocked. The report you requested is a popup. If the message appears, look for an option on the screen to enable popups. The option may be at the top of the screen. Click on the option to enable popups for this session. The report may take up to a minute to generate.

G284.4—Digital Flood Insurance Rate Maps (DFIRMs)
Page 4-56 Participant Manual September 2011
DIGITAL MAP USES
Visual 4.50
Key Points You are now in the Crystal Reports Viewer. The report consists of four pages. The first page of the report should appear. The first page shows a detailed map of the flood zones, similar to a FIRMette. • The green plus sign on the map shows where you clicked to generate the report. • In the legend to the right of the map, the green plus sign highlights the latitude and longitude
of the location. To navigate to page 2 of the report, locate the arrows to the right of the “Main Report” pull-down menu at the top of the screen. Click on the yellow arrow pointing to the right to move to the next page.
G284.4—Digital Flood Insurance Rate Maps (DFIRMs)
September 2011 Participant Manual Page 4-57
DIGITAL MAP USES
Visual 4.51
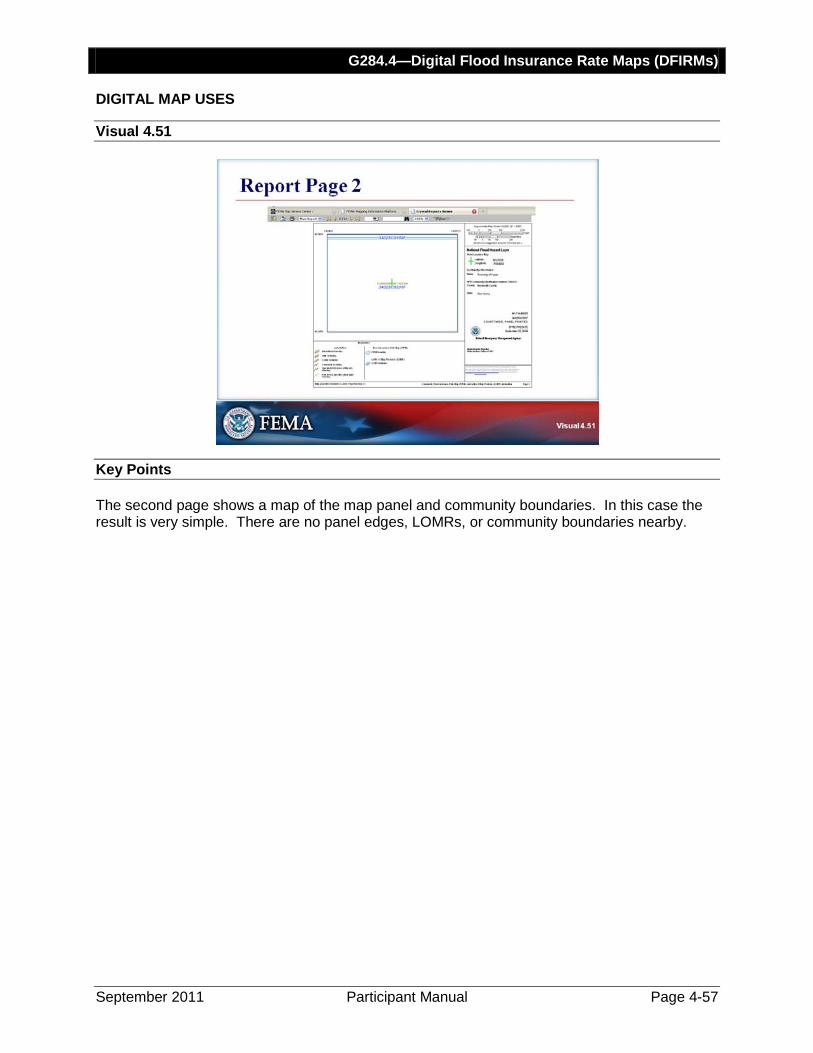
Key Points The second page shows a map of the map panel and community boundaries. In this case the result is very simple. There are no panel edges, LOMRs, or community boundaries nearby.

G284.4—Digital Flood Insurance Rate Maps (DFIRMs)
Page 4-58 Participant Manual September 2011
DIGITAL MAP USES
Visual 4.52
Key Points To navigate to page 3 of the report, click again on the right-facing arrow. The next page provides the map information in text format for the point you clicked. It includes community information, flood hazard zone, and floodway, depending on the location you selected.
G284.4—Digital Flood Insurance Rate Maps (DFIRMs)
September 2011 Participant Manual Page 4-59
DIGITAL MAP USES
Visual 4.53
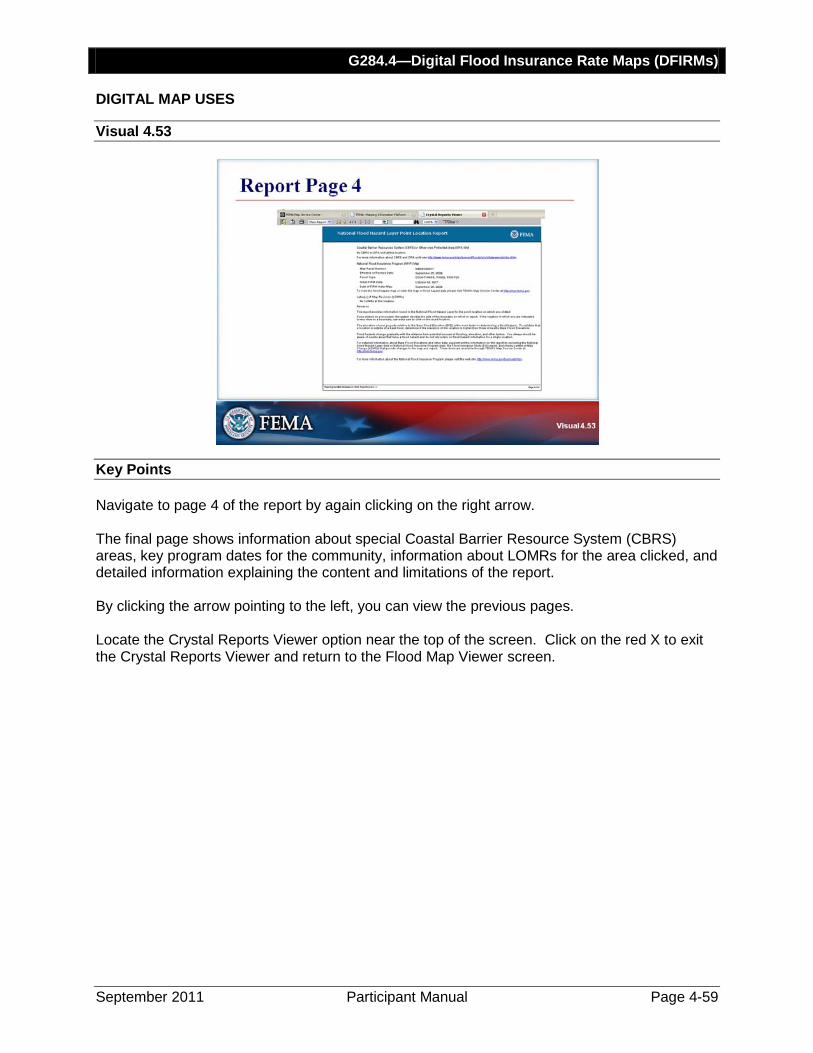
Key Points Navigate to page 4 of the report by again clicking on the right arrow. The final page shows information about special Coastal Barrier Resource System (CBRS) areas, key program dates for the community, information about LOMRs for the area clicked, and detailed information explaining the content and limitations of the report. By clicking the arrow pointing to the left, you can view the previous pages. Locate the Crystal Reports Viewer option near the top of the screen. Click on the red X to exit the Crystal Reports Viewer and return to the Flood Map Viewer screen.

G284.4—Digital Flood Insurance Rate Maps (DFIRMs)
Page 4-60 Participant Manual September 2011
DIGITAL MAP USES
Visual 4.54
Key Points On the left side of the screen, under Geocoder, type the following address:
287 Main St, Cromwell, CT, 06416 Click on the Zoom Map button directly under the address.
G284.4—Digital Flood Insurance Rate Maps (DFIRMs)
September 2011 Participant Manual Page 4-61
DIGITAL MAP USES
Visual 4.55
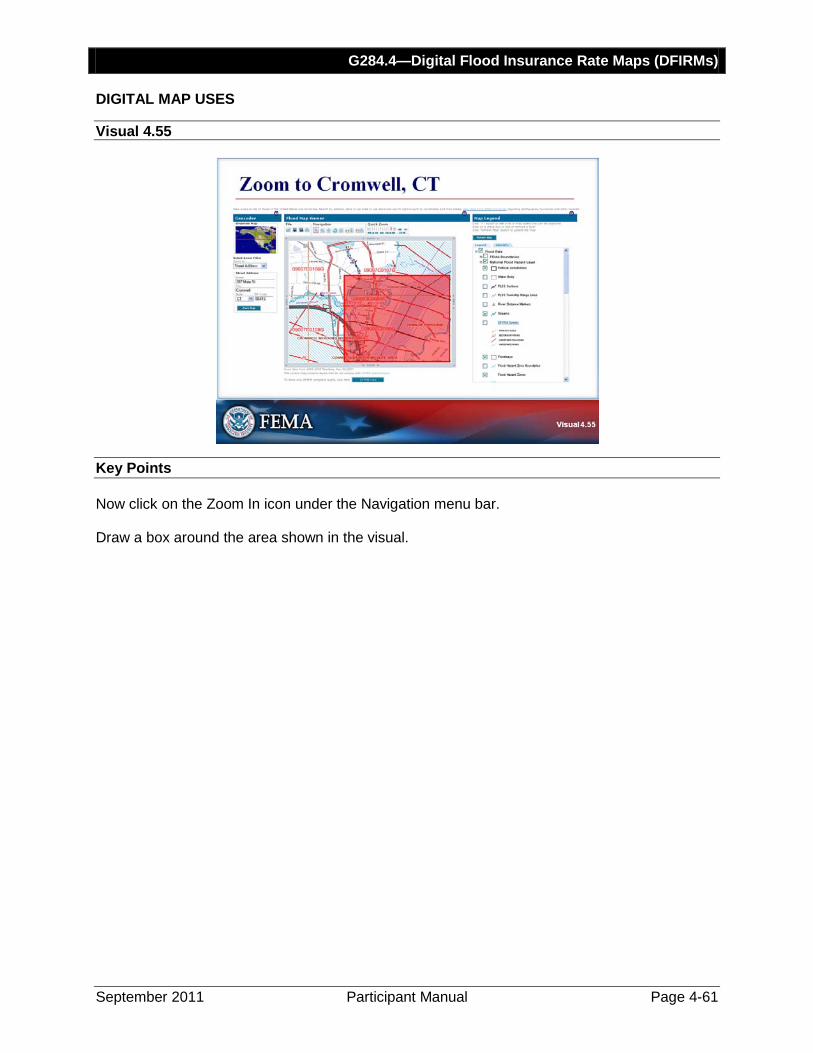
Key Points Now click on the Zoom In icon under the Navigation menu bar. Draw a box around the area shown in the visual.

G284.4—Digital Flood Insurance Rate Maps (DFIRMs)
Page 4-62 Participant Manual September 2011
DIGITAL MAP USES
Visual 4.56
Key Points Your screen should show approximately the same area as the visual above. This view shows how Letters of Map Amendment (LOMAs) and Letters of Map Revision (LOMRs) are integrated into the MapViewer – Web display. The jagged red boundary running from the top to the bottom of the view is the boundary of an area that was modified by a LOMR. The floodplain boundaries within this area reflect the changes implemented by the LOMR. The purple dot represents the approximate location of a LOMR.

G284.4—Digital Flood Insurance Rate Maps (DFIRMs)
September 2011 Participant Manual Page 4-63
DIGITAL MAP USES
Visual 4.57
Key Points The purple dot does not represent the exact location of the LOMR. To understand where the exact location of the LOMA is and how it impacts the mapped floodplain, you need to view the actual LOMA document. In the Navigation group on the menu bar above the map, locate the identify tool, a lower-case letter “I” within a circle. To view the LOMR: • Click on the identify tool. A red border will appear around the icon. • Click on the purple dot.

G284.4—Digital Flood Insurance Rate Maps (DFIRMs)
Page 4-64 Participant Manual September 2011
DIGITAL MAP USES
Visual 4.58
Key Points The right-hand pane on the screen switches from the Legend tab to the Identify tab. In the Identify list, click on the plus sign next to the “LOMA and LOMR-F” layer.

G284.4—Digital Flood Insurance Rate Maps (DFIRMs)
September 2011 Participant Manual Page 4-65
DIGITAL MAP USES
Visual 4.59
Key Points The right hand pane now displays more information about the LOMA location. Attributes include the FEMA Case Number, Community ID Number, the Town, and other data. Click the link opposite PDFHYPERLINKID to view the actual LOMA document.

G284.4—Digital Flood Insurance Rate Maps (DFIRMs)
Page 4-66 Participant Manual September 2011
DIGITAL MAP USES
Visual 4.60
Key Points The LOMA determination document is a PDF file. You need to download the file to view it. You can choose “Open” to view a temporary copy or “Save” to store it on your computer for viewing later.

G284.4—Digital Flood Insurance Rate Maps (DFIRMs)
September 2011 Participant Manual Page 4-67
DIGITAL MAP USES
Visual 4.61
Key Points This is the actual LOMA document. It includes the property address and the flood zone determination for the property and the structure. In this case, the structure is out of the SFHA, but portions of the property are in the SFHA. The description in this document is the official determination of the SFHA. The location of the purple dot on the map is approximate and cannot be used to determine the flood zone. Close the PDF document by clicking the red X in the upper right corner.

G284.4—Digital Flood Insurance Rate Maps (DFIRMs)
Page 4-68 Participant Manual September 2011
DIGITAL MAP USES
Visual 4.62
Key Points You can use EZ Print again to generate a report on a location in Cromwell, Connecticut.
G284.4—Digital Flood Insurance Rate Maps (DFIRMs)
September 2011 Participant Manual Page 4-69
DIGITAL MAP USES
Visual 4.63
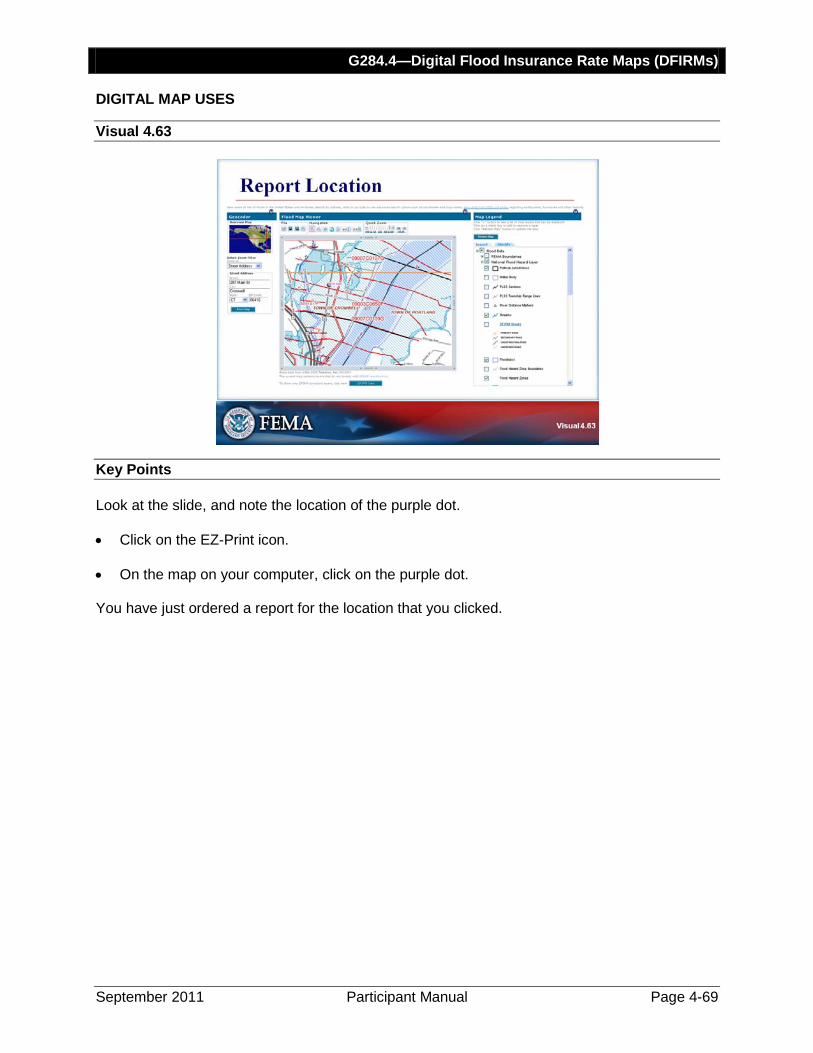
Key Points Look at the slide, and note the location of the purple dot. • Click on the EZ-Print icon. • On the map on your computer, click on the purple dot. You have just ordered a report for the location that you clicked.
G284.4—Digital Flood Insurance Rate Maps (DFIRMs)
Page 4-70 Participant Manual September 2011
DIGITAL MAP USES
Visual 4.64
Key Points The report may take up to a minute to generate.

G284.4—Digital Flood Insurance Rate Maps (DFIRMs)
September 2011 Participant Manual Page 4-71
DIGITAL MAP USES
Visual 4.65
Key Points The map displays the following information. • The green cross represents the location that you clicked on. • The dark red area is the floodway, the dark red hatching is also in the SFHA. • The very light hatching is the shaded X-Zone. Navigate to page 2 of the report by clicking on the right arrow in the menu bar at the top of the screen.
G284.4—Digital Flood Insurance Rate Maps (DFIRMs)
Page 4-72 Participant Manual September 2011
DIGITAL MAP USES
Visual 4.66
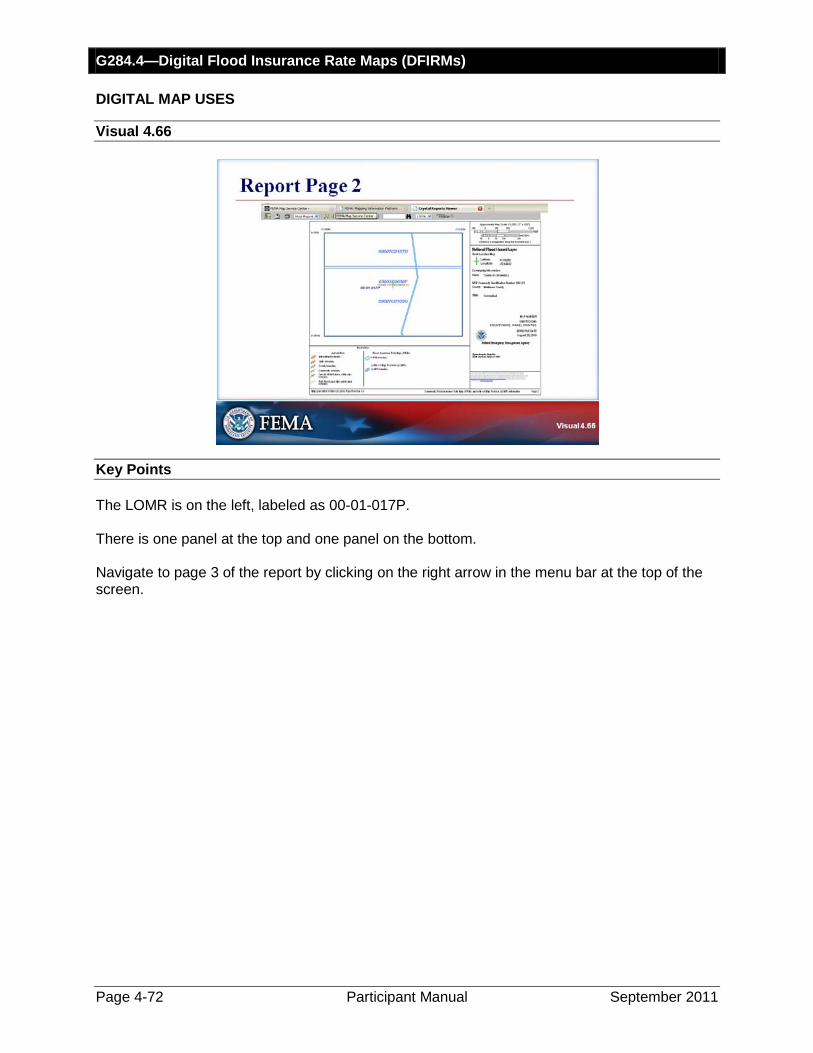
Key Points The LOMR is on the left, labeled as 00-01-017P. There is one panel at the top and one panel on the bottom. Navigate to page 3 of the report by clicking on the right arrow in the menu bar at the top of the screen.
G284.4—Digital Flood Insurance Rate Maps (DFIRMs)
September 2011 Participant Manual Page 4-73
DIGITAL MAP USES
Visual 4.67
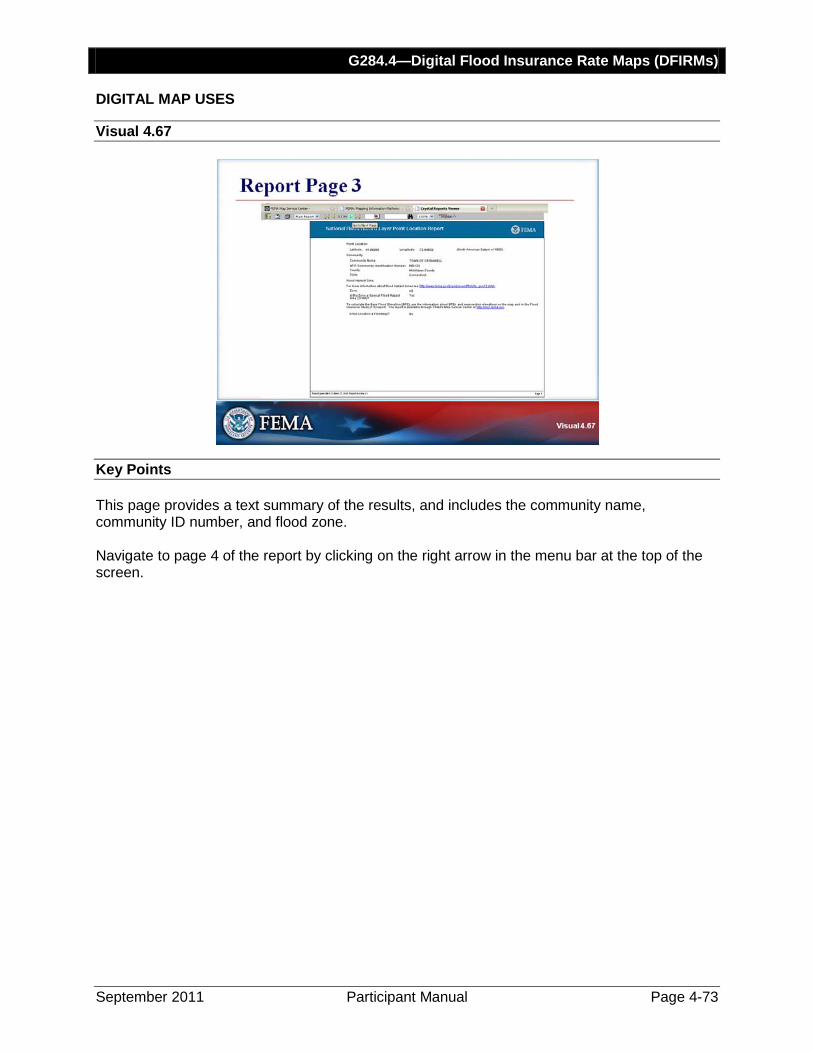
Key Points This page provides a text summary of the results, and includes the community name, community ID number, and flood zone. Navigate to page 4 of the report by clicking on the right arrow in the menu bar at the top of the screen.
G284.4—Digital Flood Insurance Rate Maps (DFIRMs)
Page 4-74 Participant Manual September 2011
DIGITAL MAP USES
Visual 4.68
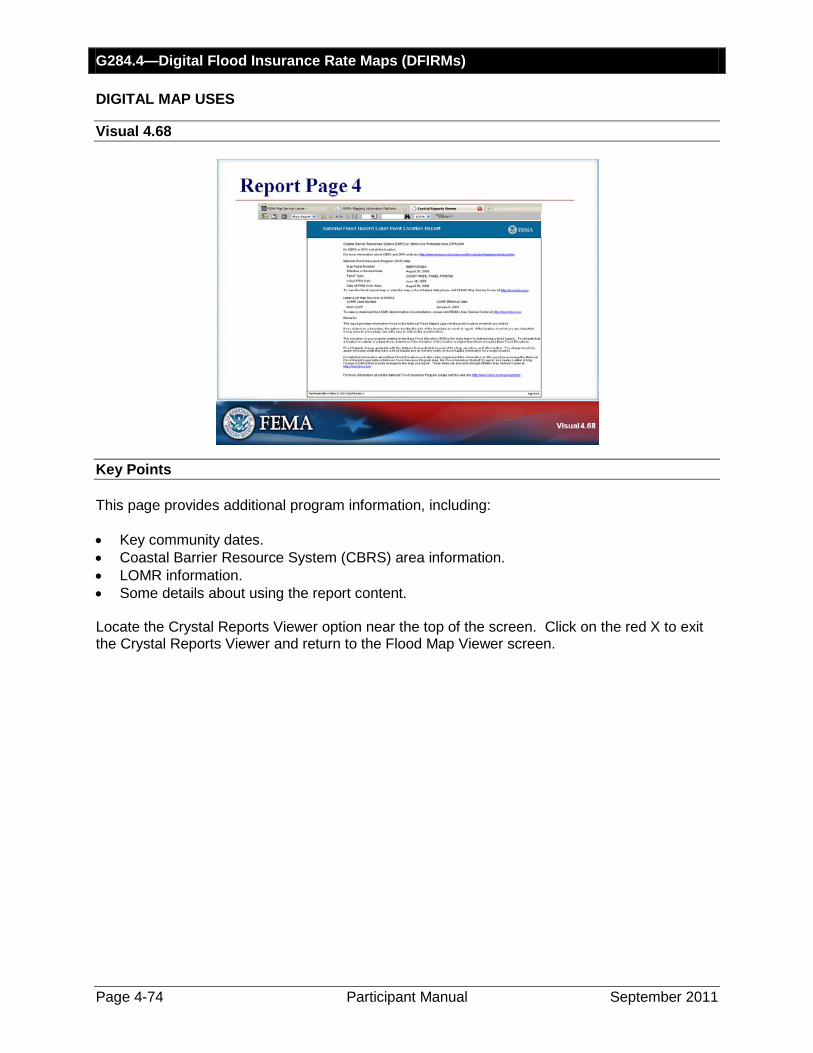
Key Points This page provides additional program information, including: • Key community dates. • Coastal Barrier Resource System (CBRS) area information. • LOMR information. • Some details about using the report content. Locate the Crystal Reports Viewer option near the top of the screen. Click on the red X to exit the Crystal Reports Viewer and return to the Flood Map Viewer screen.

G284.4—Digital Flood Insurance Rate Maps (DFIRMs)
September 2011 Participant Manual Page 4-75
DIGITAL MAP USES
Visual 4.69
Key Points Activity Purpose
: The purpose of this activity is to allow you to become aware of the information available through digital maps.
Instructions
1. As needed, review the MapViewer—Web instructions.
: Working individually:
2. Navigate to the Map Service Center Web site at http://msc.fema.gov. 3. Choose a location that you want to explore. It may be your own address, an address in your
community, or another location. 4. View the digital map information at your chosen location. Time
: 45 minutes

G284.4—Digital Flood Insurance Rate Maps (DFIRMs)
Page 4-76 Participant Manual September 2011
DIGITAL MAP USES
Visual 4.70
Key Points The Stay Dry
(version 2.0), instruction sheet, A Basic Application to View FEMA Flood Hazard Information Using Google Earth™, provides step-by-step instructions.

G284.4—Digital Flood Insurance Rate Maps (DFIRMs)
September 2011 Participant Manual Page 4-77
DIGITAL MAP USES
Visual 4.71
Key Points Activity Purpose
: The purpose of this activity is to allow you to become aware of the information available through Google Earth™.
Instructions
1. As needed, review the Stay Dry instructions.
: Working individually:
2. Navigate to the Map Service Center Web site at http://msc.fema.gov
.
3.
Click on the link “Using Web Map.”
4. Follow instructions to access Google Earth™
.
5. Click on the circle (
) in front of “View flood hazards for an address” in the Places panel. The map legend and a sample map will be displayed.
6. In the “Fly to” entry field, enter the address: 1927 Ocean Street, Santa Cruz, CA.
7.
8. View the flood hazard information at the location.
Click the Enter key to “fly to” the location. (Be sure that the eye altitude is 10,000 feet or lower.)
9. Choose another location that you want to explore. It may be your own address, an address
in your community, or another location. Repeat the instructions to fly to the location and view flood hazard information.
Time: 25 minutes
G284.4—Digital Flood Insurance Rate Maps (DFIRMs)
Page 4-78 Participant Manual September 2011
RESOURCES
Visual 4.72
Key Points The final section of this module will identify resources that are available to guide you in using Digital Flood Insurance Rate Maps.
G284.4—Digital Flood Insurance Rate Maps (DFIRMs)
September 2011 Participant Manual Page 4-79
RESOURCES
Visual 4.73
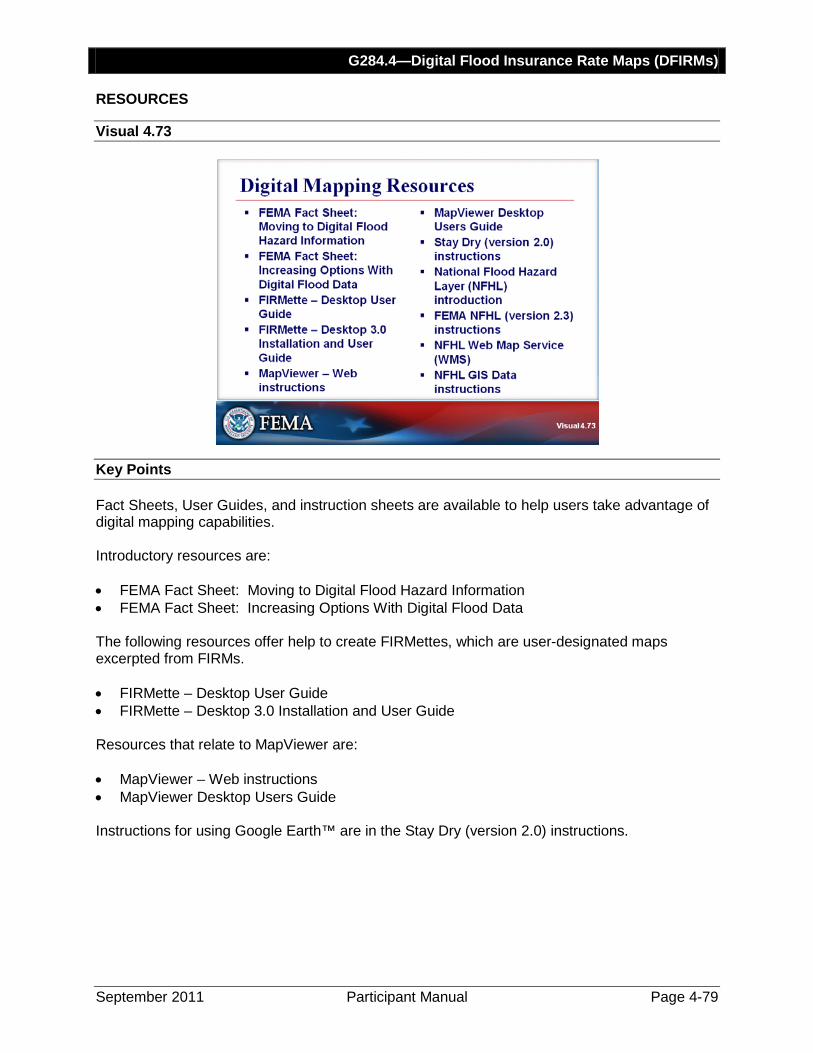
Key Points Fact Sheets, User Guides, and instruction sheets are available to help users take advantage of digital mapping capabilities. Introductory resources are: • FEMA Fact Sheet: Moving to Digital Flood Hazard Information • FEMA Fact Sheet: Increasing Options With Digital Flood Data The following resources offer help to create FIRMettes, which are user-designated maps excerpted from FIRMs. • FIRMette – Desktop User Guide • FIRMette – Desktop 3.0 Installation and User Guide Resources that relate to MapViewer are: • MapViewer – Web instructions • MapViewer Desktop Users Guide Instructions for using Google Earth™ are in the Stay Dry (version 2.0) instructions.
G284.4—Digital Flood Insurance Rate Maps (DFIRMs)
Page 4-80 Participant Manual September 2011
RESOURCES The following resources provide instructions for using the National Flood Hazard Layer (NFHL). • National Flood Hazard Layer (NFHL) introduction • FEMA NFHL (version 2.3) instructions • NFHL Web Map Service (WMS) • NFHL GIS Data instructions All of the references are available through the Map Service Center Web site.
G284.4—Digital Flood Insurance Rate Maps (DFIRMs)
September 2011 Participant Manual Page 4-81
MODULE SUMMARY
Visual 4.74
Key Points After completing this module, are you able to: • Describe the floodplain mapping purpose and process? • Describe how to coordinate the mapping process? • Identify how to gain public and political support for floodplain mapping? • Explain how DFIRMs and backup data can be used? • Describe map change processes, impact, and cost consequences?

G284.4—Digital Flood Insurance Rate Maps (DFIRMs)
Page 4-82 Participant Manual September 2011
This page intentionally left blank.