gadget loving: a test of an integrative model
TRANSCRIPT

Gadget Loving: A Test of an IntegrativeModelAviv ShohamUniversity of Haifa
Ossi PesamaaHanken School of Economics & Blekinge Institute of Technology
ABSTRACT
Following the seminal work of Bruner and Kumar (2007) on gadget loving, this paper views gadgetloving as the attachment individuals have toward advanced electronic items and how such anattachment relates to actual use (i.e., actual gadgets ownership). It extends existing research in twoimportant ways. First, it provides a retest of the reliability and validity of the gadget-loving scale intwo new countries (Israel and Sweden), thus adding to the generalizability of the scale acrosscultures. Second, it develops and tests an integrative model that includes gadget loving as a centralconstruct as well as several antecedents and consequences proposed as important topics for futureresearch in the extant literature. The results show that inherent novelty seeking, technologicalinnovativeness, and technical curiosity predict the gadget-loving trait, which in turn affectstechnological opinion leadership and gadget ownership. These findings have theoretical andpractical implications. C© 2013 Wiley Periodicals, Inc.
A key issue of consumer marketing is pleasing cus-tomers (Bagozzi & Nataraajan, 2000). Once a com-pany has a good understanding of consumers’ desires,paths to their hearts can be planned. This simpleadage might be even more relevant for new high-tech gadgets (Lehtonen, 2003). Most consumers learnabout high-tech gadgets indirectly through word-of-mouth communications. This indirect nature is cen-tral to the notion of gadget loving (GL) in which it isassumed that consumers are reached via technologi-cally and socially influential people (Bruner & Kumar,2007).
High-tech gadgets have become a huge and grow-ing market. Notably, while Nintendo has developed a“value net” between software providers and the hard-ware industry in the videogame industry, the personalcomputer, software, and phone industries are less stan-dardized and are dominated by multiple key players us-ing different standards and offering different applica-tions. For example, in the early years of mobile phones,the first modern NMT (Nordic Mobile Telephone sys-tem) mobile had a million subscribers in 1981 and about10 million 10 years later. The NMT was replaced byGSM (Global System for Mobile Communication), usedby only 16 million users in 1991 but by as many twobillion subscribers in 2006. Yet, GSM was replaced in2003 by 3G. The mobile phone market continues to growfrom three billion in 2007, 4.6 billion in 2009, and morethan five billion in 2011.
Consider the following additional example. Based onApple’s 2009 annual report, it sold approximately 7.9billion dollars of iPods and 6.5 billion dollars of iPhones(out of total sales of 36 billion dollars) (Cusumano,2010). Likewise, use of smartphones has increasedacross all demographics and annual sales of smart-phones exceeded 40 million units worldwide in 2009(Gartner, 2009). This trend is also evident in the UnitedStates; 93% of Americans now use cellphones or wire-less devices and about one-third of these are smart-phones (Jayson, 2011). As is evident, many gadgetshave become an important part of consumers’ self-definition as they help consumers communicate (PCand Phone), navigate (GPS), experience (cameras), andexpress themselves (web-based applications) (Lehto-nen, 2003).
While high-tech consumer markets are large and im-portant, Bruner and Kumar (2007) noted that someconsumers are skeptical of the additional benefits ofhigh-tech gadgets whereas others resist the pressureto switch from old to new gadgets entering the market.For these reasons, market diffusion and penetrationmight be faster when firms target technological inno-vators, especially when opinion leaders are also earlyadopters (Valente & Davis, 1999).
Bruner and Kumar (2007) also proposed that a spe-cific type of adopter—a gadget lover—influenced othersto also be early adopters of innovations. Given the the-oretical and practical importance of this segment and
Psychology and Marketing, Vol. 30(3): 247–262 (March 2013)View this article online at wileyonlinelibrary.com/journal/marC© 2013 Wiley Periodicals, Inc. DOI: 10.1002/mar.20602
247

the GL scale used to identify its members, this paperhas three goals. First, it provides a retest of the scale’sreliability and validity. Second, it examines the scalebased on surveys conducted in two new countries (Is-rael and Sweden), potentially providing support for thegeneralizability of the GL scale. Selection of these twocountries is supported by the relatively similar techno-logical readiness rates of both Sweden and Israel acrossper-capita use of mobile phones, broadband, and com-puters (Schwab, 2009). Third, an integrative model forGL is proposed and tested. While this model includesGL as a central construct, it adds antecedents and con-sequences proposed by Bruner and Kumar (2007) asimportant topics for further research.
The remainder of this paper is organized as follows.First, the theoretical background is summarized. Sec-ond, the antecedents and consequences of GL are re-viewed and hypotheses about their relationships aredeveloped. An overview of the research design and find-ings follows, and the paper concludes with a discussionof the findings and implications.
THEORY AND RESEARCH HYPOTHESES
Technological Gadgets and ConsumerBehavior
Gadgets are novel products (e.g., mobile phones, com-puters, and GPS navigators) that have software appli-cations loaded into hardware and software platforms.For example, iGoogle can be used to add applicationsto computer desktops (e.g., calculators or translationtools; Wu, Papka, & Stevens, 2008).
Technology in general is a vital part of modernlife. It affects identity (Westjohn, Arnold, Magnus-son, Zdravkovic, & Zhou, 2009), and in turn person-ality traits affect many product designs (Zhu, Nakata,Sivakumar, & Grewal, 2007). The ability to express one-self and influence others through technology enhancesthe process of adapting new technologies (Nysveen,Pedersen, & Thorbjørnsen, 2005; Thorbjørnsen, Ped-ersen, & Nysveen, 2007). Some consumers seek newgadgets, enjoy finding new uses for them, and discussthem with others. In contrast, some individuals avoidgadgets as well as talking about them. The former enterthe market early; the latter delay their entry. Products,including gadgets, can activate emotions such as anger,frustration, pleasure, and delight (Bagozzi, Gopinath,& Nyer, 1999). Moreover, positive and negative emo-tions affect satisfaction and loyalty (McColl-Kennedy& Sparks, 2003). Indeed, emotions have an importantrole in the context of gadgets as they evolve from users’experiences. These emotions therefore also add to “amore or less stable attachment between new technol-ogy and its users” (Lehtonen, 2003, p. 383) and to thecreation of bonds between users and gadgets (Verganti,2006).
Recognizing these tendencies, Apple hired a bath-room designer to change the appearance of iMacs as away to challenge the market dominance of traditionalPCs (Verganti, 2006). Similarly, Nokia emphasized the“look and feel” aspect of their mobile phones in an ef-fort to enhance their intimate and emotional appeal toconsumers (Verganti, 2006). Such gadget-induced emo-tions help to build and maintain a match between peo-ple’s gadgets and their image.
In sum, markets for gadgets, including high-techones, have become large and deserve scholarly atten-tion. The GL trait-like characteristic was first recog-nized by Bruner and Kumar (2007), and is discussedbelow.
The GL Trait
Personality traits help explain purchasing in early life-cycle stages of consumer products (Clark & Goldsmith,2006). Bruner and Kumar (2007, p. 329) argued thatgadget lovers are “a specific type of adopter [that] mightmeet the requirements of both influencing others’ opin-ions and being relatively early adopters of innovations.”Following the seminal work of McLuhan (1964), theydefined (p. 330) a gadget lover as “a consumer withhigh intrinsic motivation to adopt and use a varietyof leading-edge, technology-based goods, as well as theservices that complement them.” Importantly, focusgroup findings reported in the original paper led theauthors to view GL as a trait-like characteristic, whichis similar (but not identical) to Ridgway and Price’s(1994) use of an innovativeness trait. Further evidencefor the trait-like nature of GL was provided throughtest–retest consistency reported by Bruner and Kumar(2007). In sum, following Bruner and Kumar (2007)and the empirical support they reported, GL is viewedhere as a personality trait-like characteristic. Two ofthe original antecedents of GL were included in thisstudy, as well as two additional antecedents discussedbelow.
GL Antecedents
Bruner and Kumar used inherent novelty seeking (NS)and technological innovativeness (TI) as antecedentsof GL. This paper extends their list of antecedents toinclude life NS and technical curiosity. Recent stud-ies have empirically documented that NS exhibitedthrough new products helps people satisfy the need forexcitement (Hur, Yoo, & Chung, 1991). Moreover, re-cent studies have identified commonalities between cu-riosity and switching between different technologicalproducts (Han-Jen, Yung-Sung, & Hsien-Tang, 2012).The relationships between these four antecedents andGL are summarized below.
Actualized NS. Actualized NS (ANS) is the first oftwo new antecedents of GL. ANS is defined as an in-dividual’s tendency to search for new information, new
248 SHOHAM AND PESAMAAPsychology and Marketing DOI: 10.1002/mar

things, and different things. In other words, it parallelsinherent NS, but is more applied in the sense that itrequires actions to be taken. Such an approach is in-formed by Hirschman’s (1980) paper on innovativenessand NS in which she distinguished between inherentNS and ANS. A key point, however, is that ANS and ac-tualized innovativeness differ. The former refers to “theinitiation of behaviors intended to acquire new informa-tion” while the latter refers to “the actual acquisitionof new information” (p. 285). Inherent and ANS shareconceptual roots and represent two manifestations ofthe search for novelty. Thus, both should be relatedsimilarly to a tendency to like gadgets, conceptualizedhere as the GL trait. Thus:
H1: ANS and GL are positively related.
Inherent NS. Bruner and Kumar (2007, p. 331) de-fined inherent NS as the “degree to which a persondesires variation or stimulation in his or her life.” Theyproposed that inherent NS should be positively relatedto GL, but that operationalization of GL should exhibitdiscriminant validity vis-a-vis the operationalization ofNS.
Dabholkar and Bagozzi (2002) examined the rela-tionship of NS to adoption behavior. According to themNS, a general personality trait, should lead high-NSpeople to adopt sooner than low-NS people do. Thisdifference arises from the former’s greater desire forarousal. While Dabholkar and Bagozzi’s definition ofNS (“the desire to seek out new stimuli” (p. 187; seealso Hirschman, 1980) is not identical to the one pre-sented in this paper, it recognizes that some innova-tiveness aspects could influence attitudes about tech-nological products (Hirschman, 1980; Parasuraman,2000).
High-NS individuals should favor technology and itsuse in new high-tech products (Dabholkar & Bagozzi,2002). Moreover, their motivation to use such productsshould be stronger than low-NS people’s (Hirschman,1980; Mehrabian & Russell, 1974). Finally, high-NSconsumers tend to seek stimulating experiences, whichthe use of new technologies could provide (Dabholkar& Bagozzi, 2002). In other words, the general trait ofinherent NS should be positively related to the trait-like GL tendency. In sum:
H2: Inherent NS and GL are positively related.
Technological Innovativeness. Bruner and Kumar(2007, p. 331) defined TI as the “extent to which aconsumer is motivated to be the first to adopt newtechnology-based goods and services”. They expected itto be positively related to GL, an expectation confirmedby their research.
Notably, TI is a facet of innovativeness, whichRogers (1983) viewed as the extent to which individ-uals are early in adopting innovations compared to
other people. Likewise, Midgley and Dowling (1993)viewed “inherent innovativeness” as the extent towhich individuals are accepting of new ideas. Suchhigh-innovativeness people tend to make innovation-related decisions independently of the experience ofothers.
Wang, Dou, and Zhou (2008) summarized previousempirical research and argued that a need for stim-ulation is positively associated with consumer inno-vativeness (e.g., Joachimsthaler & Lastovicka, 1984;Roehrich, 2004; Venkatesan, 1973). Accordingly, giventheir new benefits, features, functions, and looks, newproducts in general can stimulate or excite consumers.Moreover, many of these new and attractive attributesare made possible by technological advances, which aretypically used to produce high-tech new products. Thus,individuals’ need for stimulation can affect their atti-tudes vis-a-vis high-tech products (Hirschman, 1981).In other words, individuals in search of stimulat-ing/exciting experiences through consumption choicesshould be attracted by novelty, which frequently typi-fies high-tech products. In turn, such attitudes shouldlead to affective high-tech/GL (Mittelstaedt, Grossbart,Curtis, & Devere, 1976; Shih & Venkatesh 2004). Insum:
H3: TI and GL are positively related.
Technological Curiosity. Technological curiosity(TC), referred to as the curiosity facet of use innova-tiveness by Childers (1986) and Price and Ridgway(1983), is the second new antecedent of GL includedin this study. Similar to Price and Ridgway (1983), thisstudy refers to TC as a facet of use innovativeness,which is a manifestation of consumer exploratory be-havior. Notably, use innovativeness is a product con-sumption behavior. Importantly, the conceptualizationsuggested by Price and Ridgway (1983) involved twobehavioral levels. The first is the use of a productin a novel way. The second level of use innovative-ness involves using a currently owned product for avariety of purposes. However, the operationalizationused by both Childers (1986) and Price and Ridgway(1983) included a third facet of use innovativeness,not explicitly discussed in their papers—a technolog-ical/technical curiosity dimension. This facet, whichpertains to the topic of the current paper, involvesbehavioral tendencies such as more interest in whatmakes products work than what they look like, anda preference to “play” with a product to understandhow it works rather than seeking external advice andhelp.
To establish the validity of the dimensions of theirscale, Price and Ridgway correlated its subdimensionswith preference for and actual novel use of a high-techgadget (calculator, a new, high-tech gadget at the timeof their study). Significant differences were observedacross levels of use innovativeness and calculator use,thus supporting validity of the subscales. In sum:
GADGET LOVING 249Psychology and Marketing DOI: 10.1002/mar

H4: TC and GL are positively related.
GL Consequences
Significant people in one’s life influence an individual’slearning and buying behavior (Kulviwat, Bruner II, &Al-Shuridah, 2009). Such social influence on potentialconsumers is critical, especially in a new gadget con-text (Arruda-Filho & Lennon, 2011). Early adopters ofnew products feel a need to justify their behavior toother consumers (Arruda-Filho & Lennon, 2011). Addi-tionally, observing early adopters’ enthusiasm in socialcontexts increases others’ willingness to explore newtechnological gadgets (Peck & Childers, 2003). More-over, social interactions with gadget adopters increasenonadopters confidence that they can cope with theuncertainty inherent in trying an innovation (Harris& Blair, 2006). Similar to Bruner and Kumar (2007),this paper includes technological leadership and actualgadget ownership as consequences of GL and the in-terrelationships between the GL, technological opinionleadership (TOL), and gadget ownership are discussedbelow.
GL and TOL. Bruner and Kumar (2007) suggestedthat GL and TOL should be related positively. Their jus-tification was based on the notion that TOL is domain-specific and therefore should have a positive relation-ship with GL. The proposed positive relationship wassupported.
This argument resonates with the findings reportedby Shoham and Ruvio (2008). They proposed thatthe extent to which individuals use computers atwork/home might have an impact on their opinion lead-ership for computers and software. This propositionwas based on the logic that heavy work/home PC usersshould exhibit a higher probability of becoming expertson computers/software. Indeed, their data supportedthis notion and PC use was a significant positive pre-dictor of PC opinion leadership.
These findings parallel the context of the currentstudy. Specifically, people who exhibit higher levels ofGL should have a higher probability of learning aboutgadgets. Such learning would enhance the probabilitythat they will be technological opinion leaders. Thus:
H5: GL and TOL are positively related.
TOL and Gadget Ownership. Bruner and Kumar(2007) argued that TOL should be operationalized atspecific domain levels since it is not a general ten-dency. Hence, they expected TOL to have a positiverelationship with GL, an expectation confirmed by theirstudy.
Flynn, Goldsmith, and Eastman (1996, p. 138) ar-gued that opinion leadership requires a consensus-based definition. They followed Rogers and Cartano’s(1962, p. 435) definition in which opinion leaders are
“individuals who exert an unequal amount of influenceon the decision of others.” Accordingly, high-TOL in-dividuals are viewed here as people who have a highlevel of influence over others’ decisions in the context oftechnological issues, such as product choices.
In line with these theoretical arguments, Flynn,Goldsmith, and Eastman (1996) reported that fashionopinion leadership was positively related with fash-ion shopping and fashion spending. Likewise, Ruvioand Shoham (2007) studied the market maven phe-nomenon and found that opinion leadership affectedinformation seeking and trial of new products. Fi-nally, Shoham and Ruvio (2008) studied opinion lead-ership in the context of computers and software. Theirdata established a link between computer-based opin-ion leadership and reading relevant literature, as wellas visits to computer stores. In addition, Clark andGoldsmith (2006) argue that consumers who buy inearly product life-cycle stages tend to be opinion lead-ers rather than seekers. In combination, these studiesestablish relationships between domain-specific opin-ion leadership and consumption behaviors. Appliedto the context of the current study, we propose thefollowing:
H6: TOL and gadget ownership are related posi-tively.
GL and Actual Gadget Ownership. Bruner and Ku-mar (2007) documented empirically that GL was re-lated positively with actual gadget ownership (termedadoption behaviors in their paper). This relationshipwas confirmed even controlling for the impact of re-spondent demographics.
Bruner and Kumar (2007) hypothesized a GL → be-havior tendency link, but provided limited theory-basedjustification for this relationship. This paper draws onthe principle of cognitive consistency to support this re-lationship. Briefly, consumers value consistency amongtheir thoughts, feelings, and actions. They strive to re-duce dissonance when such consistency is not achieved(Festinger, 1957). Additionally, individuals’ attitudesshould lead to actual behavior responses (e.g., Fishbein1963; Fishbein & Ajzen, 1975).
A slightly different approach was suggested byHeider’s (1958) balance theory. He proposed thatbalance/harmony is achieved when all relationshipsamong the facets of attitude are positive, or if two rela-tionships are negative and one is positive. Otherwise,there are imbalances leading people to actions designedto restore balance by changing a facet.
GL consumers are likely to be motivated to behaveaccording to balance theory. Such behavior should leadto balance and harmony across attitudinal facets andenable individuals to avoid dissonance. Conversely, lowGL individuals will be motivated to refrain from buyinggadgets. In sum, cognitive consistency theories suggesta positive link between GL tendencies and gadget own-ership. Hence:
250 SHOHAM AND PESAMAAPsychology and Marketing DOI: 10.1002/mar

Figure 1. Research model.
H7: GL and gadget ownership are positively re-lated.
This paper examines how different cognitions on life(inherent and ANS) and orientations (TI and techni-cal curiosity) relate to a personality, trait-like charac-teristic (GL). These cognitions and orientations thenimpact, through the GL concept, informational (TOL)and buying behavior (gadget ownership). The proposedtheoretical model is summarized in Figure 1. The sevenresearch hypotheses were tested empirically using datafrom Israeli consumers. Below, Figure 1 describes thefoci of this study.
EMPIRICAL STUDY
Sampling
Data were collected in two countries. One country wasIsrael and the other was Sweden.
Israel. Data was collected in Israel from individuals 21and over since most Israelis serve a mandatory periodof three years (18–21) in military services. Data werecollected by two student research teams trained in re-search methodology. They boarded trains serving themajor rail route, approached passengers, and promis-ing anonymity, solicited their participation. The teamswere instructed to target a demographically represen-tative sample to increase the generalizability of the
findings. In total, 360 respondents participated, 319 ofproviding completed questionnaires (88.6%). The agedistribution closely resembled national averages—thenational median age is 29.3 (Central Bureau of Statis-tics, 2010) and the age of sample respondents was 31.0.While an effort was made to recruit a reasonably rep-resentative sample, approximately 60% had above av-erage income. Additionally, males comprised approxi-mately 57%. It is difficult to directly compare the sam-ple to national averages because they are reported forages 15+ while the sample only included people over21. Finally, the sample was relatively more educatedthan the national average (12 years and under, sample= 24.7% vs. 52.5%; 13–15 years of education, sample =32.4% vs. 24.8%; and 42.9% vs. 22.7% for the sampleand the reported national average, respectively). Thedifferences should be smaller given the age basis forthe sample (21+) compared to national statistics basedon ages 15+.
Sweden. The Swedish sample included consumersolder than 18, which corresponds to the minimal agein Israel (without military service). Data were collectedin Sweden by setting up a Web site and encourag-ing individuals to complete the survey. The objectiveagain was a demographically representative sample toincrease the generalizability of the findings. A totalof 138 Swedish respondents participated, 129 provid-ing completed questionnaires (93.5%). In Sweden, asin Israel, income was higher than the national aver-age (approximately 62% above the Swedish average).
GADGET LOVING 251Psychology and Marketing DOI: 10.1002/mar

Similar to Israel, males comprised 51% of the Swedishsample.
These intra- and intercountry issues are discussedfurther in the “Limitations” section of the paper. Thescales used in the two studies are presented below.
Questionnaire and Measurement Scales
A structured questionnaire with six established scaleswas used. Since these scales were developed in En-glish, back translation was used to ensure equivalenceof items. The same approach was used in both countries.Specifically, the scales were first translated into the twolocal languages. Then, bilinguals without knowledge ofthe original items back-translated the Hebrew/Swedishitems to English independently. Final wording was de-termined in a meeting of the translators and one of theauthors (see Appendix for all items).
Measurement Model, Reliability, andValidity
Tables 1, 2 provide descriptive statistics for each coun-try. The measurement model was assessed through anexploratory factor analysis (EFA; Table 3) using SPSSversion 20 and a confirmatory factor analysis (CFA, Ta-ble 4) using SPSS Amos version 20. Recently, Bagozziand Yi (2012) recommended several fundamental cri-teria for assessing the quality of measures (reliability,dimensionality, and construct validity). This paper fol-lows these guidelines in evaluating the quality of thescales in Israel and Sweden and used EFA, reliabilitytests, and SEM-based CFA. These guidelines provideda framework for assessing theory-driven measurementmodels and are considered rigorous tests of constructvalidity (Anderson & Gerbing, 1988).
Reliability. Cronbach alphas (for dimensions withthree or more items) and correlation coefficients (fortwo-item scales) are provided to assess dimension re-liability in each country (Tables 1, 2). For Israel andSweden, α , respectively, was 0.84 and 0.90 (ANS); 0.90and 0.90 (inherent NS); 0.92 and 0.97 (TI); r = 0.72and 0.666 (TC); 0.94 and 0.97 (GL); and 0.95 and 0.96(TOL; Table 3). Notably, all alphas exceed 0.70 (Nun-nally, 1978) and all within-construct correlations arestronger than across constructs (Bentler, 1990; Eriks-son & Pesamaa, 2013). Additionally, the scales exhibitlow cross-nation variation in internal consistency.
Dimensionality. Scale validation requires structuralsimilarity to the original scale. SPSS-based exploratoryfactor analyses (six-factor constrained to eigenvalues >
1; Hair, Black, Babin, & Anderson, 2010) with prin-cipal component analysis and varimax rotation sub-stantiated the same six-dimensional structure of thismodel in Sweden and Israel (Table 3). Loadings weresubstantial (> 0.6) and balanced within each countryand dimension (Table 3). Overall dimensions are very
similar across samples (Hair et al., 2010). No substan-tial cross-loadings were observed in either country inline with Harman’s test for common method bias (Pod-sakoff, MacKenzie, Podsakoff, & Lee, 2003).
Structural Equation Modeling (SEM)
Several SEM tests can be used to establish if a theo-retical model fits the observed data. CFA followed bya structural model is a popular approach and its es-timated χ2 and normed-χ2 test suggest how well themodel fits the data (Anderson & Gerbing, 1988). Othergoodness-of-fit indices include standardized root meanresidual (RMR) and root mean square error of ap-proximation (RMSEA), expected to be lower than 0.08(Bentler, 1990) and comparative fit index (CFI), recom-mended to exceed 0.90 (Hair et al., 2010). A country-stacked model with no cross-country constraints asan initial baseline model was used here (Tables 4–7;Bagozzi & Yi, 2012). These initial goodness-of-fit statis-tics were acceptable (CFI = 0.936, RMSEA = 0.048,SRMR = 0.052, and χ2 = 1458.348 [df = 724; p ≤ 0.001,χ2/df = 2.01]).
Validity and Reliability Tests from CFA
Construct Validity. CFA processes are designed toprovide additional support for reliability and valid-ity. SEM analyses help ensure that each measure cor-responds to what it is purported to measure as ameans to establish convergent and discriminant va-lidity (Bagozzi & Yi, 1988). Following the procedurerecommended by Bagozzi and Yi (2012) to assess reli-ability and validity CFA-based individual loadings, av-erage variance extracted (AVE; Table 4), and constructintercorrelations (Tables 5, 6) are reported.
Reliability was examined by assessing composite re-liability, recommended to exceed 0.70, and variance ex-tracted scores, recommended to exceed 0.50 (Bagozzi& Yi, 1988; Hair et al., 2010). Using a formula sug-gested by Fornell and Larcker (1981) and Bagozzi andYi (1988, 2012), these criteria were met in both samples(minimal AVE > 0.59 and minimal composite reliability> 0.78; Table 4). Notably, initial evidence of discrim-inant validity depends on shared variances and canbe claimed if AVE/squared intercorrelation ≥ 1 (For-nell & Larcker, 1981), a criterion met in both samples(Table 4). Interconstruct correlations below 0.90 pro-vide additional discriminant validity support (Fornell& Larcker, 1981).
Within-Group Construct Validity
A comparison of an unconstrained baseline model(Model 1 in Table 7) against a constrained model (Model2 in Table 7; Bagozzi & Yi, 2012) is presented next toprovide stronger evidence of cross-national invariance.
252 SHOHAM AND PESAMAAPsychology and Marketing DOI: 10.1002/mar

Tab
le1.
Sp
earm
anC
orre
lati
on,M
ean
s,an
dS
tan
dar
dD
evia
tion
Isra
el(n
=31
9).
12
34
56
78
910
1112
1314
1516
1718
1920
2122
2324
2526
2728
2930
X1
1.00
X2
0.66
∗∗1.
00X
30.
53∗∗
0.66
∗∗1.
00X
40.
100.
22∗∗
0.27
∗∗1.
00X
50.
12∗
0.20
∗∗0.
16∗∗
0.59
∗∗1.
00X
60.
13∗
0.21
∗∗0.
24∗∗
0.66
∗∗0.
64∗∗
1.00
X7
0.17
∗∗0.
27∗∗
0.24
∗∗0.
62∗∗
0.62
∗∗0.
75∗∗
1.00
X8
0.20
∗∗0.
26∗∗
0.27
∗∗0.
59∗∗
0.55
∗∗0.
60∗∗
0.68
∗∗1.
00X
90.
27∗∗
0.39
∗∗0.
40∗∗
0.50
∗∗0.
50∗∗
0.56
∗∗0.
61∗∗
0.64
∗∗1.
00X
100.
18∗∗
0.27
∗∗0.
20∗∗
0.07
0.10
0.14
∗0.
12∗
0.08
0.18
∗∗1.
00X
110.
12∗
0.22
∗∗0.
14∗
0.09
0.23
∗∗0.
19∗∗
0.18
∗∗0.
13∗
0.21
∗∗0.
78∗∗
1.00
X12
0.12
∗0.
23∗∗
0.17
∗∗0.
070.
14∗∗
0.13
∗0.
12∗
0.07
0.17
∗∗0.
79∗∗
0.83
∗∗1.
00X
130.
060.
22∗∗
0.18
∗∗0.
080.
14∗
0.13
∗0.
13∗
0.07
0.23
∗∗0.
66∗∗
0.64
∗∗0.
79∗∗
1.00
X14
0.12
∗0.
23∗∗
0.13
∗0.
040.
100.
090.
100.
090.
16∗∗
0.62
∗∗0.
67∗∗
0.67
∗∗0.
64∗∗
1.00
X15
0.29
∗∗0.
24∗∗
0.16
∗∗0.
040.
12∗
0.12
∗0.
100.
14∗∗
0.23
∗∗0.
25∗∗
0.23
∗∗0.
24∗∗
0.24
∗∗0.
23∗∗
1.00
X16
0.34
∗∗0.
29∗∗
0.24
∗∗0.
050.
12∗
0.15
∗∗0.
12∗
0.16
∗∗0.
24∗∗
0.25
∗∗0.
23∗∗
0.26
∗∗0.
26∗∗
0.22
∗∗0.
72∗∗
1.00
X17
0.24
∗∗0.
23∗∗
0.24
∗∗0.
060.
14∗
0.12
∗0.
14∗
0.08
0.20
∗∗0.
52∗∗
0.46
∗∗0.
48∗∗
0.40
∗∗0.
40∗∗
0.27
∗∗0.
34∗∗
1.00
X18
0.29
∗∗0.
29∗∗
0.20
∗∗0.
030.
16∗∗
0.12
∗0.
15∗∗
0.14
∗0.
21∗∗
0.40
∗∗0.
37∗∗
0.40
∗∗0.
32∗∗
0.37
∗∗0.
32∗∗
0.38
∗∗0.
68∗∗
1.00
X19
0.35
∗∗0.
36∗∗
0.31
∗∗0.
020.
15∗∗
0.08
0.13
∗0.
12∗
0.22
∗∗0.
52∗∗
0.47
∗∗0.
49∗∗
0.44
∗∗0.
46∗∗
0.35
∗∗0.
37∗∗
0.70
∗∗0.
75∗∗
1.00
X20
0.32
∗∗0.
37∗∗
0.32
∗∗0.
090.
14∗
0.13
∗0.
13∗
0.13
∗0.
22∗∗
0.56
∗∗0.
52∗∗
0.57
∗∗0.
49∗∗
0.46
∗∗0.
32∗∗
0.37
∗∗0.
67∗∗
0.68
∗∗0.
79∗∗
1.00
X21
0.24
∗∗0.
25∗∗
0.22
∗∗0.
060.
11∗
0.12
∗0.
090.
080.
17∗∗
0.57
∗∗0.
54∗∗
0.56
∗∗0.
41∗∗
0.44
∗∗0.
27∗∗
0.30
∗∗0.
64∗∗
0.55
∗∗0.
64∗∗
0.71
∗∗1.
00X
220.
31∗∗
0.30
∗∗0.
24∗∗
0.06
0.14
∗0.
080.
090.
060.
20∗∗
0.63
∗∗0.
52∗∗
0.58
∗∗0.
51∗∗
0.48
∗∗0.
30∗∗
0.34
∗∗0.
60∗∗
0.54
∗∗0.
64∗∗
0.69
∗∗0.
64∗∗
1.00
X23
0.33
∗∗0.
30∗∗
0.19
∗∗0.
060.
16∗∗
0.10
0.15
∗∗0.
090.
22∗∗
0.58
∗∗0.
53∗∗
0.53
∗∗0.
47∗∗
0.49
∗∗0.
38∗∗
0.40
∗∗0.
65∗∗
0.63
∗∗0.
72∗∗
0.67
∗∗0.
64∗∗
0.67
∗∗1.
00X
240.
35∗∗
0.30
∗∗0.
23∗∗
0.08
0.14
∗∗0.
100.
16∗∗
0.15
∗∗0.
25∗∗
0.47
∗∗0.
41∗∗
0.45
∗∗0.
40∗∗
0.40
∗∗0.
41∗∗
0.50
∗∗0.
59∗∗
0.64
∗∗0.
64∗∗
0.62
∗∗0.
54∗∗
0.55
∗∗0.
72∗∗
1.00
X25
0.30
∗∗0.
33∗∗
0.26
∗∗0.
110.
080.
070.
100.
12∗
0.20
∗∗0.
51∗∗
0.43
∗∗0.
50∗∗
0.43
∗∗0.
46∗∗
0.32
∗∗0.
31∗∗
0.55
∗∗0.
50∗∗
0.56
∗∗0.
56∗∗
0.55
∗∗0.
56∗∗
0.61
∗∗0.
54∗∗
1.00
X26
0.30
∗∗0.
34∗∗
0.25
∗∗0.
080.
070.
070.
12∗
0.13
∗0.
22∗∗
0.52
∗∗0.
43∗∗
0.50
∗∗0.
45∗∗
0.44
∗∗0.
36∗∗
0.38
∗∗0.
57∗∗
0.50
∗∗0.
58∗∗
0.56
∗∗0.
53∗∗
0.57
∗∗0.
65∗∗
0.58
∗∗0.
88∗∗
1.00
X27
0.26
∗∗0.
32∗∗
0.23
∗∗0.
050.
070.
070.
080.
100.
17∗∗
0.56
∗∗0.
47∗∗
0.52
∗∗0.
48∗∗
0.45
∗∗0.
30∗∗
0.32
∗∗0.
55∗∗
0.51
∗∗0.
59∗∗
0.58
∗∗0.
53∗∗
0.57
∗∗0.
62∗∗
0.55
∗∗0.
84∗∗
0.85
∗∗1.
00X
280.
26∗∗
0.34
∗∗0.
28∗∗
0.15
∗∗0.
18∗∗
0.15
∗∗0.
19∗∗
0.17
∗∗0.
25∗∗
0.45
∗∗0.
44∗∗
0.46
∗∗0.
43∗∗
0.42
∗∗0.
29∗∗
0.32
∗∗0.
47∗∗
0.46
∗∗0.
49∗∗
0.48
∗∗0.
40∗∗
0.47
∗∗0.
56∗∗
0.49
∗∗0.
67∗∗
0.70
∗∗0.
76∗∗
1.00
X29
0.32
∗∗0.
36∗∗
0.30
∗∗0.
12∗
0.14
∗0.
11∗
0.17
∗∗0.
14∗
0.25
∗∗0.
47∗∗
0.41
∗∗0.
46∗∗
0.42
∗∗0.
44∗∗
0.34
∗∗0.
34∗∗
0.51
∗∗0.
47∗∗
0.55
∗∗0.
50∗∗
0.43
∗∗0.
51∗∗
0.57
∗∗0.
51∗∗
0.73
∗∗0.
78∗∗
0.80
∗∗0.
85∗∗
1.00
X30
−0.
09−
0.00
−0.
090.
020.
080.
07−
0.01
−0.
010.
070.
30∗∗
0.29
∗∗0.
30∗∗
0.29
∗∗0.
19∗∗
0.04
0.07
0.21
∗∗0.
11∗
0.18
∗∗0.
17∗∗
0.26
∗∗0.
27∗∗
0.21
∗∗0.
100.
24∗∗
0.24
∗∗0.
26∗∗
0.24
∗∗0.
21∗∗
1.00
M3.
803.
403.
363.
253.
623.
423.
673.
833.
431.
972.
191.
931.
662.
182.
702.
702.
722.
962.
792.
442.
652.
002.
582.
562.
22.
222.
122.
232.
293.
70S
D1.
021.
041.
091.
241.
121.
151.
101.
021.
131.
211.
391.
241.
071.
351.
261.
311.
391.
411.
411.
381.
401.
221.
301.
351.
271.
301.
241.
261.
302.
56
∗∗p
<0.
01;∗
p<
0.05
.X
1–X
3=
AN
S;I
NS
=X
4–X
9;T
I=
X10
–X14
;TC
=X
15–X
16;G
L=
X17
–X24
;TO
L=
X25
–X29
;In
dex
=X
30.
GADGET LOVING 253Psychology and Marketing DOI: 10.1002/mar

Tab
le2.
Cor
rela
tion
,Mea
ns,
and
Sta
nd
ard
Dev
iati
onS
wed
en(n
=12
9).
12
34
56
78
910
1112
1314
1516
1718
1920
2122
2324
2526
2728
2930
X1
1.00
X2
0.82
∗∗1.
00X
30.
67∗∗
0.72
∗∗1.
00X
40.
23∗
0.28
∗∗0.
32∗∗
1.00
X5
0.32
∗∗0.
30∗∗
0.31
∗∗0.
66∗∗
1.00
X6
0.27
∗∗0.
30∗∗
0.24
∗∗0.
59∗∗
0.61
∗∗1.
00X
70.
38∗∗
0.37
∗∗0.
27∗∗
0.61
∗∗0.
62∗∗
0.67
∗∗1.
00X
80.
34∗∗
0.38
∗∗0.
32∗∗
0.53
∗∗0.
49∗∗
0.47
∗∗0.
55∗∗
1.00
X9
0.43
∗∗0.
46∗∗
0.46
∗∗0.
53∗∗
0.47
∗∗0.
56∗∗
0.56
∗∗0.
62∗∗
1.00
X10
0.10
0.20
∗0.
18∗
0.13
0.05
0.14
0.13
0.22
∗0.
28∗∗
1.00
X11
0.16
0.25
∗∗0.
160.
170.
090.
17∗
0.22
∗0.
24∗∗
0.25
∗∗0.
90∗∗
1.00
X12
0.15
0.24
∗∗0.
18∗
0.13
0.09
0.18
∗0.
160.
22∗
0.28
∗∗0.
88∗∗
0.90
∗∗1.
00X
130.
120.
23∗∗
0.13
0.10
0.02
0.18
∗0.
140.
18∗
0.20
∗0.
89∗∗
0.88
∗∗0.
92∗∗
1.00
X14
0.18
∗0.
25∗∗
0.20
∗0.
120.
120.
22∗
0.18
∗0.
19∗
0.28
∗∗0.
85∗∗
0.86
∗∗0.
88∗∗
0.87
∗∗1.
00X
150.
160.
23∗∗
0.20
∗0.
170.
17∗
0.23
∗∗0.
160.
060.
26∗∗
0.46
∗∗0.
49∗∗
0.44
∗∗0.
45∗∗
0.47
∗∗1.
00X
160.
050.
150.
160.
010.
030.
120.
030.
080.
27∗∗
0.48
∗∗0.
48∗∗
0.47
∗∗0.
44∗∗
0.46
∗∗0.
65∗∗
1.00
X17
0.23
∗∗0.
28∗∗
0.20
∗0.
120.
020.
160.
110.
17∗
0.24
∗∗0.
60∗∗
0.60
∗∗0.
60∗∗
0.56
∗∗0.
52∗∗
0.49
∗∗0.
58∗∗
1.00
X18
0.29
∗∗0.
30∗∗
0.28
∗∗0.
120.
110.
20∗
0.16
0.21
∗0.
26∗∗
0.57
∗∗0.
60∗∗
0.57
∗∗0.
55∗∗
0.52
∗∗0.
45∗∗
0.48
∗∗0.
87∗∗
1.00
X19
0.24
∗∗0.
32∗∗
0.23
∗∗0.
100.
020.
150.
130.
160.
23∗∗
0.61
∗∗0.
61∗∗
0.56
∗∗0.
58∗∗
0.54
∗∗0.
52∗∗
0.56
∗∗0.
83∗∗
0.81
∗∗1.
00X
200.
20∗
0.28
∗∗0.
19∗
0.08
−0.
000.
160.
120.
18∗
0.20
∗0.
62∗∗
0.67
∗∗0.
63∗∗
0.62
∗∗0.
58∗∗
0.49
∗∗0.
55∗∗
0.79
∗∗0.
77∗∗
0.87
∗∗1.
00X
210.
26∗∗
0.33
∗∗0.
18∗
0.04
−0.
050.
110.
110.
150.
160.
51∗∗
0.55
∗∗0.
50∗∗
0.52
∗∗0.
46∗∗
0.42
∗∗0.
47∗∗
0.71
∗∗0.
72∗∗
0.77
∗∗0.
82∗∗
1.00
X22
0.20
∗0.
26∗∗
0.24
∗∗0.
19∗
0.06
0.14
0.12
0.21
∗0.
24∗∗
0.63
∗∗0.
61∗∗
0.61
∗∗0.
62∗∗
0.56
∗∗0.
42∗∗
0.49
∗∗0.
80∗∗
0.80
∗∗0.
82∗∗
0.82
∗∗0.
76∗∗
1.00
X23
0.20
∗0.
30∗∗
0.22
∗0.
140.
010.
170.
170.
18∗
0.28
∗∗0.
69∗∗
0.68
∗∗0.
65∗∗
0.66
∗∗0.
62∗∗
0.48
∗∗0.
51∗∗
0.81
∗∗0.
78∗∗
0.83
∗∗0.
81∗∗
0.79
∗∗0.
88∗∗
1.00
X24
0.21
∗0.
28∗∗
0.26
∗∗0.
120.
030.
120.
140.
21∗
0.27
∗∗0.
68∗∗
0.67
∗∗0.
67∗∗
0.67
∗∗0.
61∗∗
0.48
∗∗0.
53∗∗
0.82
∗∗0.
81∗∗
0.80
∗∗0.
80∗∗
0.71
∗∗0.
86∗∗
0.86
∗∗1.
00X
250.
100.
20∗
0.19
∗0.
19∗
0.02
0.08
0.17
0.10
0.22
∗0.
65∗∗
0.66
∗∗0.
60∗∗
0.64
∗∗0.
57∗∗
0.49
∗∗0.
48∗∗
0.53
∗∗0.
54∗∗
0.58
∗∗0.
58∗∗
0.49
∗∗0.
57∗∗
0.56
∗∗0.
65∗∗
1.00
X26
0.09
0.19
∗0.
17∗
0.12
−0.
020.
030.
120.
070.
170.
65∗∗
0.64
∗∗0.
60∗∗
0.64
∗∗0.
60∗∗
0.45
∗∗0.
49∗∗
0.49
∗∗0.
50∗∗
0.52
∗∗0.
57∗∗
0.45
∗∗0.
55∗∗
0.52
∗∗0.
62∗∗
0.93
∗∗1.
00X
270.
140.
24∗∗
0.23
∗∗0.
140.
020.
090.
150.
130.
22∗
0.66
∗∗0.
65∗∗
0.61
∗∗0.
65∗∗
0.60
∗∗0.
42∗∗
0.48
∗∗0.
50∗∗
0.52
∗∗0.
54∗∗
0.57
∗∗0.
45∗∗
0.58
∗∗0.
57∗∗
0.64
∗∗0.
89∗∗
0.92
∗∗1.
00X
280.
020.
170.
18∗
0.05
−0.
07−
0.08
0.01
0.00
0.11
0.59
∗∗0.
56∗∗
0.55
∗∗0.
57∗∗
0.52
∗∗0.
30∗∗
0.32
∗∗0.
42∗∗
0.40
∗∗0.
43∗∗
0.46
∗∗0.
34∗∗
0.45
∗∗0.
49∗∗
0.56
∗∗0.
71∗∗
0.76
∗∗0.
79∗∗
1.00
X29
0.06
0.19
∗0.
170.
120.
010.
020.
100.
080.
18∗
0.66
∗∗0.
65∗∗
0.64
∗∗0.
64∗∗
0.61
∗∗0.
36∗∗
0.39
∗∗0.
46∗∗
0.48
∗∗0.
50∗∗
0.54
∗∗0.
41∗∗
0.56
∗∗0.
58∗∗
0.61
∗∗0.
80∗∗
0.82
∗∗0.
87∗∗
0.86
∗∗1.
00X
300.
040.
07−
0.01
0.08
0.04
0.05
0.10
0.14
0.18
∗0.
42∗∗
0.45
∗∗0.
40∗∗
0.41
∗∗0.
46∗∗
0.25
∗∗0.
29∗∗
0.31
∗∗0.
34∗∗
0.31
∗∗0.
33∗∗
0.27
∗∗0.
32∗∗
0.35
∗∗0.
30∗∗
0.37
∗∗0.
42∗∗
0.41
∗∗0.
38∗∗
0.40
∗∗1.
00
M4.
093.
903.
503.
163.
503.
303.
493.
543.
432.
432.
512.
161.
942.
383.
223.
342.
713.
022.
722.
702.
952.
292.
522.
542.
392.
292.
192.
122.
175.
97S
D0.
840.
931.
000.
970.
910.
830.
840.
880.
931.
271.
311.
191.
071.
261.
081.
131.
211.
101.
181.
271.
261.
141.
261.
251.
231.
201.
111.
121.
112.
60
∗ p<
0.01
;∗p
<0.
05.
X1–X
3=
AN
S;I
NS
=X
4–X
9;T
I=
X10
–X14
;TC
=X
15–X
16;G
L=
X17
–X24
;TO
L=
X25
–X29
;In
dex
=X
30.
254 SHOHAM AND PESAMAAPsychology and Marketing DOI: 10.1002/mar
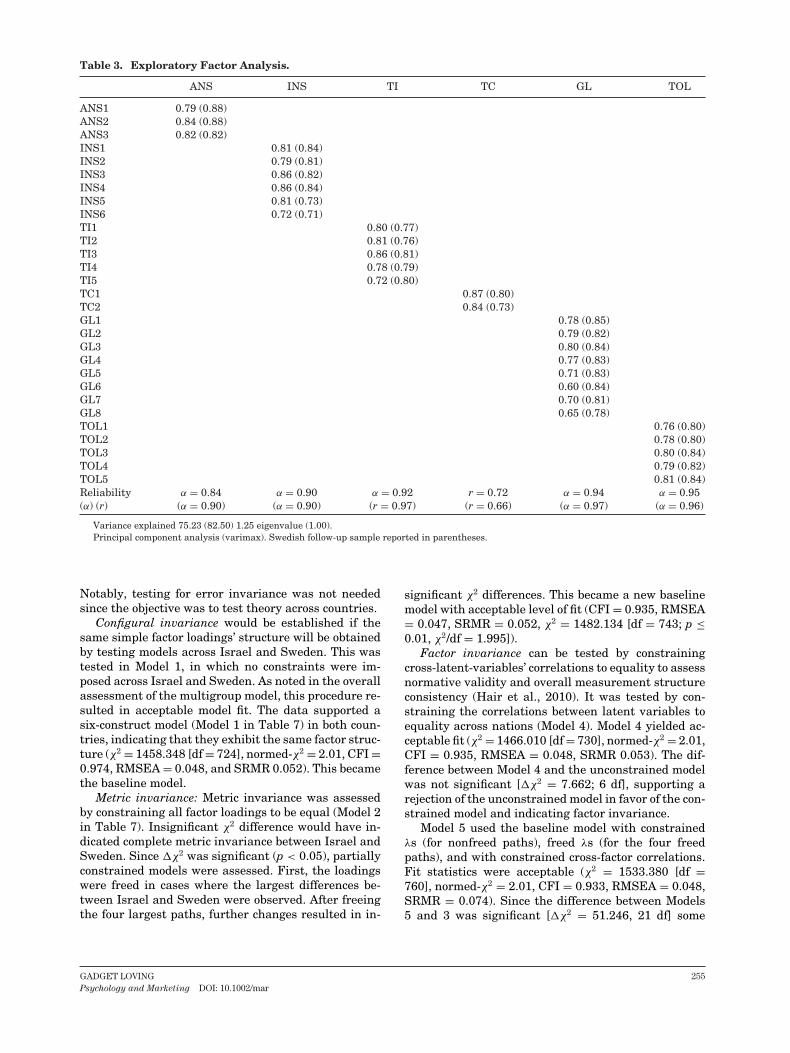
Table 3. Exploratory Factor Analysis.
ANS INS TI TC GL TOL
ANS1 0.79 (0.88)ANS2 0.84 (0.88)ANS3 0.82 (0.82)INS1 0.81 (0.84)INS2 0.79 (0.81)INS3 0.86 (0.82)INS4 0.86 (0.84)INS5 0.81 (0.73)INS6 0.72 (0.71)TI1 0.80 (0.77)TI2 0.81 (0.76)TI3 0.86 (0.81)TI4 0.78 (0.79)TI5 0.72 (0.80)TC1 0.87 (0.80)TC2 0.84 (0.73)GL1 0.78 (0.85)GL2 0.79 (0.82)GL3 0.80 (0.84)GL4 0.77 (0.83)GL5 0.71 (0.83)GL6 0.60 (0.84)GL7 0.70 (0.81)GL8 0.65 (0.78)TOL1 0.76 (0.80)TOL2 0.78 (0.80)TOL3 0.80 (0.84)TOL4 0.79 (0.82)TOL5 0.81 (0.84)Reliability α = 0.84 α = 0.90 α = 0.92 r = 0.72 α = 0.94 α = 0.95(α) (r) (α = 0.90) (α = 0.90) (r = 0.97) (r = 0.66) (α = 0.97) (α = 0.96)
Variance explained 75.23 (82.50) 1.25 eigenvalue (1.00).Principal component analysis (varimax). Swedish follow-up sample reported in parentheses.
Notably, testing for error invariance was not neededsince the objective was to test theory across countries.
Configural invariance would be established if thesame simple factor loadings’ structure will be obtainedby testing models across Israel and Sweden. This wastested in Model 1, in which no constraints were im-posed across Israel and Sweden. As noted in the overallassessment of the multigroup model, this procedure re-sulted in acceptable model fit. The data supported asix-construct model (Model 1 in Table 7) in both coun-tries, indicating that they exhibit the same factor struc-ture (χ2 = 1458.348 [df = 724], normed-χ2 = 2.01, CFI =0.974, RMSEA = 0.048, and SRMR 0.052). This becamethe baseline model.
Metric invariance: Metric invariance was assessedby constraining all factor loadings to be equal (Model 2in Table 7). Insignificant χ2 difference would have in-dicated complete metric invariance between Israel andSweden. Since �χ2 was significant (p < 0.05), partiallyconstrained models were assessed. First, the loadingswere freed in cases where the largest differences be-tween Israel and Sweden were observed. After freeingthe four largest paths, further changes resulted in in-
significant χ2 differences. This became a new baselinemodel with acceptable level of fit (CFI = 0.935, RMSEA= 0.047, SRMR = 0.052, χ2 = 1482.134 [df = 743; p ≤0.01, χ2/df = 1.995]).
Factor invariance can be tested by constrainingcross-latent-variables’ correlations to equality to assessnormative validity and overall measurement structureconsistency (Hair et al., 2010). It was tested by con-straining the correlations between latent variables toequality across nations (Model 4). Model 4 yielded ac-ceptable fit (χ2 = 1466.010 [df = 730], normed-χ2 = 2.01,CFI = 0.935, RMSEA = 0.048, SRMR 0.053). The dif-ference between Model 4 and the unconstrained modelwas not significant [�χ2 = 7.662; 6 df], supporting arejection of the unconstrained model in favor of the con-strained model and indicating factor invariance.
Model 5 used the baseline model with constrainedλs (for nonfreed paths), freed λs (for the four freedpaths), and with constrained cross-factor correlations.Fit statistics were acceptable (χ2 = 1533.380 [df =760], normed-χ2 = 2.01, CFI = 0.933, RMSEA = 0.048,SRMR = 0.074). Since the difference between Models5 and 3 was significant [�χ2 = 51.246, 21 df] some
GADGET LOVING 255Psychology and Marketing DOI: 10.1002/mar

Table 4. CFA All Free Across Countries Israel and Sweden.
Squared Sum of squaredLoadings loadings loadings AVE C.R AVE/(Corr)2
ANS1 0.75 (0.89) 0.56 (0.78) 1.94 (2.28) 65% (76%) 0.78 (0.88) 3.42 (3.08)ANS2 0.91 (0.95) 0.82 (0.90)ANS3 0.74 (0.77) 0.55 (0.60)INS1 0.75 (0.78) 0.56 (0.60) 3.68 (3.55) 61% (59%) 0.85 (0.84) 5.54 (2.95)INS2 0.74 (0.78) 0.54 (0.61)INS3 0.84 (0.80) 0.71 (0.63)INS4 0.87 (0.83) 0.75 (0.69)INS5 0.77 (0.70) 0.60 (0.50)INS6 0.72 (0.72) 0.52 (0.52)TI1 0.88 (0.94) 0.77 (0.88) 4.17 (4.69) 74% (89%) 0.92 (0.97) 1.68 (1.71)TI2 0.86 (0.94) 0.74 (0.89)TI3 0.94 (0.95) 0.88 (0.91)TI4 0.79 (0.94) 0.63 (0.88)TI5 0.70 (0.92) 0.49 (0.84)TC1 0.78 (0.77) 0.61 (0.59) 1.70 (1.63) 75% (71%) 0.84 (0.80) 3.00 (1.51)TC2 0.91 (0.87) 0.84 (0.75)GL1 0.80 (0.90) 0.64 (0.80) 6.42 (7.16) 69% (82%) 0.94 (0.97) 1.56 (1.58)GL2 0.78 (0.87) 0.61 (0.76)GL3 0.87 (0.91) 0.76 (0.83)GL4 0.86 (0.90) 0.73 (0.82)GL5 0.76 (0.83) 0.58 (0.70)GL6 0.76 (0.92) 0.58 (0.84)GL7 0.83 (0.92) 0.69 (0.84)GL8 0.76 (0.91) 0.58 (0.83)TOL1 0.91 (0.94) 0.82 (0.88) 3.89 (4.14) 78% (83%) 0.93 (0.95) 1.39 (1.69)TOL2 0.93 (0.96) 0.87 (0.92)TOL3 0.92 (0.96) 0.85 (0.92)TOL4 0.79 (0.80) 0.63 (0.64)TOL5 0.85 (0.89) 0.72 (0.79)
Maximum likelihoodSwedish follow-up sample reported in parentheses.
CR = composite reliability = (� of standardized loadings)2/(� of standardized loadings)2 +� of εj.AVE = average variance extracted = � of (standardized loadings)2/(� of (standardized loadings)2 + � of εj.CV = convergent validity (AVE > 0.50).DV = discriminant validity = AVE/(Corr)2 > 0.1. (Intercorrelations see Tables 5, 6).(Corr)2 = highest (Corr)2 between factors of interest and remaining factors.
Table 5. Intercorrelations Between Constructs.
1 2 3 4 5 6
1. ANS 1.002. INS 0.33 (0.45) 1.003. TI 0.29 (0.27) 0.22 (0.27) 1.004. TC 0.37 (0.18) 0.21 (0.18) 0.33 (0.60) 1.005. GL 0.44 (0.34) 0.20 (0.21) 0.66 (0.72) 0.50 (0.69) 1.006. TOL 0.43 (0.23) 0.18 (0.16) 0.59 (0.70) 0.42 (0.59) 0.75 (0.66) 1.00
All coefficients p < 0.05.Swedish follow-up sample reported in parentheses.
substantive paths were expected to differ in the struc-tural model.
Structural Model
The next model tested the hypotheses in both coun-tries simultaneously. Model fit statistics were accept-able (χ2 = 1588.121 [df = 786], normed-χ2 = 2.02, CFI= 0.93, RMSEA = 0.048, SRMR = 0.071). The model ex-plained 57.4% and 66.2% of the variance in GL, 57.7%and 44.6% in TOL, and 7.8% and 21.0% in gadget own-
ership in Israel and Sweden, respectively. Substantiveresults are reported in Table 8.
In support of H1, ANS and GL were positively relatedin both countries (Israel: β = 0.20, p < 0.01; Sweden β
= 0.18, p < 0.05). A positive relationship between in-herent NS and GL was expected (H2). However, the re-lationship was not significant in either country (Israel:β = −0.03, p > 0.05; Sweden β = −0.07, p > 0.05).
TI was related positively with GL (H3; Israel: β =0.53, p < 0.01; Sweden β = 0.47, p < 0.01). Similarly,H4 suggesting a positive relationship between TC and
256 SHOHAM AND PESAMAAPsychology and Marketing DOI: 10.1002/mar

Table 6. Squared Intercorrelations Between Constructs.
1 2 3 4 5 6
1. ANS 1.002. INS 0.11 (0.20) 1.003. TI 0.08 (0.07) 0.05 (0.07) 1.004. TC 0.14 (0.03) 0.04 (0.03) 0.11 (0.36) 1.005. GL 0.19 (0.11) 0.04 (0.04) 0.44 (0.52) 0.25 (0.47) 1.006. TOL 0.18 (0.05) 0.03 (0.02) 0.35 (0.49) 0.18 (0.35) 0.56 (0.43) 1.00
Table 7. Test Invariance Across Israel and Sweden.
Model
Model χ2 (df) p-value χ2/df CFI RMSEA SRMR Comparison �χ2 (df) p-value Conclusion
Model 1:Unconstrained
1458.348 (724) 0.000 2.014 0.936 0.048 0.052 Baseline model
Model 2: Fullyconstrained
1500.501 (747) 0.000 2.009 0.934 0.048 0.053 (2–1) 42.153 (23) 0.009 Differencesexist
Model 3: Partiallyconstrained(TI4–5; GL6,GL8)
1482.134 (743) 0.000 1.995 0.935 0.047 0.052 (3–1) 23.785 (19) 0.205 Invariant, newbaselinemodel
Model 4:Covariance equal
1466.01 (730) 0.000 2.008 0.935 0.048 0.053 (4–1) 7.662 (6) 0.264 No differences
Model 5:Covariance andpartial loadingsequal
1533.38 (760) 0.000 2.007 0.933 0.048 0.074 (5–3) 51.246 (21) 0.000 Differencesexist
GL was supported in both countries (Israel: β = 0.23,p < 0.01; Sweden β = 0.39, p < 0.01). Similarly, H5
(GL → TOL) was supported (Israel: β = 0.76, p < 0.01;Sweden β = 0.67, p < 0.01), as was H6 (TOL → gadgetownership; Israel: β = 0.20, p < 0.05; Sweden β = 0.34,p < 0.01). Finally, H7 (GL → gadget ownership) wasnot supported (Israel: β = 0.09, p > 0.05; Sweden β =0.16, p > 0.05).
To further explore possible cross-country differ-ences, the baseline unconstrained model was testedagainst models in which paths were constrained (oneby one in isolation). Chi-square differences between thebaseline model and the seven models containing oneconstrained path each were not significant (Table 9).Thus, the structural paths were the same in Israel andSweden.
Table 8. Unconstrained Regression for Israel and Sweden.
StandardizedPath Regression Coefficient Standard Error t-value p-value
H1: Actualized novelty seeking→Gadgetloving
0.20 (0.18) 0.08 (0.10) 3.91 (2.61) 0.000 (0.009)
H2: Inherent novelty seeking→Gadget loving − 0.03 (−0.07) 0.06 (0.10) − 0.72 (−1.04) 0.469 (0.301)H3: Technological innovativeness→Gadget
loving0.53 (0.47) 0.06 (0.08) 9.99 (5.57) 0.000 (0.000)
H4: Technological curiosity→Gadget loving 0.26 (0.39) 0.06 (0.12) 5.02 (3.33) 0.000 (0.000)H5: Gadget lovingaTechnological opinion
leadership0.76 (0.67) 0.06 (0.08) 13.80 (8.63) 0.000 (0.000)
H6: Technological opinionleadership→Gadget ownership
0.20 (0.34) 0.20 (0.25) 2.23 (3.05) 0.026 (0.002)
H7: Gadget loving→Gadget ownership 0.09 (0.16) 0.21 (0.26) 1.01 (1.47) 0.310 (0.142)R-square
Gadget loving; technological opinionleadership; gadget ownership
0.574 (0.662); 0.577(0.446); 0.078
(0.210);
Goodness-of-fit (Unconstrained): Model’s χ2 = 1588.121 with 786 degrees of freedom (χ2/degrees of freedom = 2.02); CFI = 0.93; RMSEA =0.048; SRMR = 0.071.
GADGET LOVING 257Psychology and Marketing DOI: 10.1002/mar

Table 9. Test Invariance (Unconstrained). All Paths and Path by Past for Israel and Sweden.
ModelModel χ2 (df) p-value χ2/df CFI RMSEA SRMR comparison �χ2 (df) p-value Conclusion
Unconstrained 1588.121 (786) 0.000 2.021 0.93 0.048 0.071All constrained 1592.999 (791) 0.000 2.014 0.93 0.048 0.068 (2–1) 4.879 (5) 0.431 InvariantH1 constrained 1588.192 (787) 0.000 2.018 0.93 0.048 0.071 (3–1) 0.071 (1) 0.79 InvariantH2 constrained 1588.423 (787) 0.000 2.018 0.93 0.048 0.071 (4–1) 0.303 (1) 0.582 InvariantH3 constrained 1590.142 (787) 0.000 2.021 0.93 0.048 0.069 (5–1) 2.022 (1) 0.155 InvariantH4 constrained 1590.870 (787) 0.000 2.021 0.93 0.048 0.072 (6–1) 2.75 (1) 0.097 InvariantH5 constrained 1588.663 (787) 0.000 2.019 0.93 0.048 0.069 (7–1) 0.542 (1) 0.462 InvariantH6 constrained 1589.027 (787) 0.000 2.019 0.93 0.048 0.071 (8–1) 0.906 (1) 0.341 InvariantH7 constrained 1588.387 (787) 0.000 2.018 0.93 0.048 0.072 (10–1) 0.266 (1) 0.606 Invariant
DISCUSSION
The preceding section established the quality andequivalence of the measurement and substantive mod-els across Israel and Sweden. Hence, substantive find-ings are discussed below.
Substantive Model
This paper developed a hierarchy of the ways con-sumers advance their NS and innovativeness traitsinto GL, which has cognitive (leadership) and buy-ing behavior consequences. For example, demographicsmight affect one or more of the hypothesized relation-ships. To examine this possibility, the model was testedfirst for equivalence of the covariance matrices acrossmales/females and high versus low-moderate incomesubsamples. Since the χ2 test showed no significantdifferences across the four subsamples, the approachof Abe, Bagozzi, and Sadarangani (1996) was followedand the subsamples were combined.
ANALYSIS OF FINDINGS
Limitations
Before discussing the findings, several limitationsof this study are recognized. First, the teams at-tempted to recruit representative samples. However,the different collection techniques might have hadsome influence on the composition of the respondents.Additionally, while the samples were close to nationalaverages, they did deviate on some demographic char-acteristics. Thus, replicating the studies with randomand representative samples is an important task forfuture research.
While the first limitation concerns the generaliz-ability of the findings to the populations in Israel andSweden, the second concerns generalizability to othercultures. This limitation typifies every research en-deavor conducted in specific countries/cultures and isdiscussed further in the discussion section.
Theoretical Discussion
These limitations notwithstanding, the findings of thisresearch have theoretical and practical implications.The theory of adopting gadgets at an early stage is builtaround given personal traits (Bruner & Kumar, 2007;Clark & Goldsmith, 2006; McLuhan, 1964; Ridgway &Price, 1994). Given the relatively high opportunitiesin sales that successful new gadgets offer (Cusumano,2010) and the costs of mistaken decisions (Lehtonen,2003), this theory requires additional tests. Thus, amajor contribution of the study is to offer new empiri-cal evidence by replicating and extending the work ofBruner and Kumar (2007). Specifically, the theoreticalmodel was supported for five out of seven hypothesizedrelationships.
Confirming H1 (ANS → GL) provides support forthe role of ANS. ANS was conceptualized in this studyalong the approach suggested by Hirschman (1980). Itwas tested as a driver of GL, a role hypothesized butnot tested by Bruner and Kumar (2007). Accordingly,future research on GL should recognize this facet of NS.
H2 hypothesized that inherent NS will lead to GL.It was based on the notion that GL, and later owner-ship, could help in replacing one’s perceptions of anomieand alienation with feelings of doing something newand meaningful. However, support for this hypothesiswas not found. One explanation might be that gad-gets are not powerful enough to help people througha sense of boredom with their present situation. Al-ternatively, gadgets might offer only a short and dis-appearing reprieve from everyday activities. These ex-planations should be further tested in future research,which could include an assessment of the role gadgetsplay in consumers’ lives.
The next set of hypotheses dealt with the role oftechnology in people’s lives. H3 was associated withTI, which is a tendency to be motivated by new tech-nology (Bruner & Kumar, 2007). Such innovativenesswas expected to enhance GL. Similarly, TC was ex-pected to be associated with GL (H4). TC reflects anintrinsic characteristic toward new technology (Price& Ridgway, 1983). However, rather than focusing onthe physical product and its functional attributes, it
258 SHOHAM AND PESAMAAPsychology and Marketing DOI: 10.1002/mar

captures the process of playing and figuring out howit works and how to best operate it. H3 and H4 weresupported, indicating that individuals’ TI and curiosityare manifested in the functional and hedonic aspects ofnew technologies.
The first four hypotheses provide an interesting pro-file of gadget lovers. ANS, TI, and TC, but not inher-ent NS, are related to GL. Importantly, the relation-ships found are unequal in strength. Specifically, TIwas the strongest antecedent of GL (β = 0.53). ANS(β = 0.20) and TC (β = 0.26) had approximately equaland medium-strength explanatory power. For futurestudies, the implications are that inherent NS could beexcluded, and if questionnaire length is a consideration,TI should be included.
The subsequent part of the model linked GL (reflect-ing intrinsic motivation to adopt new technology) as amore general life orientation to the behavior of buyingand owning gadgets. Opinion leaders search for andtry new products (Clark & Goldsmith, 2006; Shoham& Ruvio, 2008). The relationship between GL and TOL(H5) was supported, as was the relationship betweenTOL and gadget ownership (H6). Such relationshipsare consistent with previous findings in the contextof opinion leadership and fashion consumption (Flynn,Goldsmith, & Eastman, 1996). These findings providesupport for the generalizability of the relationshipsacross contexts and countries and suggest that futureresearch could well include an affective (like/love) com-ponent, a cognitive one (opinion leadership), and a be-havioral one (behavioral tendency or actual behavior),all adapted to specific study contexts.
Bruner and Kumar (2007) found support for a GL—gadget ownership link (H7), which was not confirmedin this study. In other words, for both samples, TOLfully mediated the relationship between GL and gadgetownership. The difference might arise from the fact thatBruner and Kumar (2007) did not test the possible roleof TOL as a mediator.
Some relationships hypothesized and confirmed inthis study might not hold in other cultures. For exam-ple, the culture in both Israel and Sweden is typifiedby a medium level of individualism (Hofstede, 1991).Assuming the purchase of new gadgets is partially mo-tivated by hedonic consideration, it would be interest-ing to assess gadget ownership in cultures that arehigher than Israel on individualism (e.g., the UnitedStates) and should therefore exhibit high levels of he-donism (Hofstede, 1991) and consequently gadget own-ership. Similarly, consumers in low-individualism cul-tures (e.g., many South American countries) that valuegroup norms and group influence should be included asa determinant in studies about gadgets.
Arguably, buying and using innovative gadgets in-volves a certain degree of risk-taking by consumers.Thus, it could be argued that buying such gadgets coulddiffer across cultures on the basis of the level of uncer-tainty avoidance they exhibit. Given that Israel scoredhigh on this value and Sweden scored low, the find-ings support the generalizability of relationships across
differing levels of uncertainty avoidance. Likewise, as-suming that indeed males are more inclined to buygadgets (a point revisited post-hoc below), one couldargue that the importance of masculinity versus femi-ninity could affect the findings reported here. However,since Israel and Sweden differ markedly on this valuedimension, the findings document generalizabilityacross cultures that emphasize masculine or femininevalues.
Practical Implications
From a practical standpoint, it is believed that GL as apersonality trait could be a useful segmentation tool formarketing managers. While it is unlikely that market-ing managers will administer the GL scale to a largenumber of potential customers, they can rely on readilyavailable information about media users’ profiles. Forexample, Sail and Blue Water Sailing are popular foryacht owners and skippers. Thus, they could be usedto advertise/promote yacht gadgets, such as new yachtGPS systems. Similarly, Popular Photography and Out-door Photographer would be media choices for new gad-gets in the photography industry.
POST-HOC ANALYSES
Earlier, possible moderation effects of gender and in-come were suggested. This section of the paper dis-cusses this issue. Specifically, post-hoc testing for po-tential moderation of gender and income followed thesame model applied across males/females and acrosshigh/low-moderate income subsamples (Aiken & West,1993). A similar approach was used in other marketingstudies (Licata, Mowen, Harris, & Brown, 2003).
Regarding gender, Bruner and Kumar (2007, p. 332)noted: “research has found that men tend to be morefascinated with technology than women . . . ” Brunerand Kumar handled this possible gender difference byfirst carrying out “ . . . all the analyses in [their] studyseparately for the male and female samples. Becausethe patterns of results were very similar it seems plau-sible to draw identical conclusions from both samples,as herein combined the samples in terms of both genderand data from the mail and online samples.” The ap-proach in the current study differed in that moderationwas tested post hoc. Sample size considerations alloweda test of moderation only in Israel. Notably, Israel isconsidered a masculine country in terms of cultural val-ues. Accordingly, it is believed that the GL-ownershiprelationship might be stronger for males than for fe-males, and consequently, that links in the hypothesizedmodel might differ across gender.
With respect to income, Bruner and Kumar (2007,p. 333) noted: “We performed an even more stringenttest of the GL scale by examining its ability to explainadoption behaviors beyond the contributions made bya set of demographic variables, such as age, gender,
GADGET LOVING 259Psychology and Marketing DOI: 10.1002/mar

education, and income. Therefore, we employed a hi-erarchical regression to predict adoption behaviors inwhich we entered the demographic variables, alongwith respondents’ TI scores, as predictors in step 1 andtheir GL scores in step 2.” The approach used here dif-fers in that it is believed that actualizing GL in theform of ownership might require high income, and con-sequently, that links in the hypothesized model mighthold for some, but not all income levels. Since testingthese expectations required the use of split subsamplesin each country, a large sample size is required andwas available only in Israel (not Sweden). The resultsfor Israel are reported below (detailed tables are avail-able from the second author).
In line with H1, there was a significant relation-ship between ANS and GL across all four subsamples.Specifically, the relationship was positive and signifi-cant for males (β = 0.20; p < 0.01), females (β = 0.18; p< 0.05), low- (β = 0.29; p < 0.01), and high-income (β =0.15; p < 0.05). Similar to the full sample, H2 (inherentNS → GL) was not supported (males: β = −0.07; p >
0.05; females: β = 0.07; p > 0.05; low income: β = −0.03;p > 0.05; high income: β = −0.02; p > 0.05). The datasupported H3 (TI → GL) for all subsamples (males: β =0.51; p < 0.01; females: β = 0.59; p < 0.01; low income:β = 0.46; p < 0.01; high income: β = 0.58; p < 0.01). H4
(TC → GL) was supported across gender and income(males: β = 0.26; p < 0.01; females: β = 0.19; p < 0.01;low income: β = 0.25; p < 0.01; high income: β = 0.25;p < 0.01). Likewise, H5 (GL → TOL) exhibits a similarsignificant relationship across subgroups (males: β =0.74; p < 0.01; females: β = 0.72; p < 0.01; low income:β = 0.75; p < 0.01; high income: β = 0.76; p < 0.01).
As for H6 (TOL → gadget ownership), which wassubstantiated for the pooled sample, there are genderand income differences. H6 was supported for femalesbut not males (males: β = 0.18; p > 0.05; females: β =0.26; p < 0.05) and for low- but not high-income individ-uals (low income: β = 0.40; p < 0.01; high income: β =0.02; p > 0.05). Finally, H7 (GL → gadget ownership),disconfirmed in the pooled sample, was disconfirmedfor three subsamples and substantiated for one (males:β = 0.17; p > 0.05; females: β = 0.06; p > 0.05; lowincome: β = −0.10; p > 0.05; high income: β = 0.24; p< 0.05).
In sum, the findings for H6–7 (but not for H1–5)across gender and income subsamples revealed that thegadget links hypothesized under H1–5 are stable andsubstantial. Future research should search for alterna-tive boundary conditions for the GL—TOL relationship.For example, assuming that being a technological opin-ion leader requires resources such as time and money,the relationship might hold only for wealthier people orfor people with more free leisure time. Regarding H6–7,the TOL—gadget ownership relationship (H6) was sup-ported for females or low-income individuals but not formales or high-income ones. Additionally, GL and gadgetownership (H7) were only related in the high-incomegroup. In combination, these relationships imply thatlow-income individuals and females depend on opinion
leadership to transform orientations into ownership,while for high-income people GL guides ownership.
CONCLUSIONS
This study had three objectives. In line with these goals,it provided a first retest of the reliability and validity ofthe gadget lover scale. Second, the finding that its rolewas mostly supported in two different countries (Israeland Sweden) strengthened the argument for the gener-alizability of the GL model. Third, this paper tested anintegrative model for GL, which provided some supportfor the roles of several antecedents and consequencesproposed by Bruner and Kumar (2007) as importanttopics for further research. Finally, the post-hoc anal-yses helped identify some gender- and income-baseddifferences of the model’s relationships.
REFERENCES
Abe, S., Bagozzi, R. P, & Sadarangani, P. (1996). An investi-gation of construct validity and generalizability of the self-concept: Self-consciousness in Japan and the United States.Journal of International Consumer Marketing, 8, 97–123.
Aiken, L. S., & West, S. G. (1993). Multiple regression: Test-ing and interpreting interactions (3rd ed.). Newbury Park:Sage.
Anderson, J. C., & Gerbing, D. W. (1988). Structural equationmodeling in practice: A review and recommended two-stepapproach. Psychological Bulletin, 103, 411–423.
Arruda-Filho, E. J. M., & Lennon, M. M. (2011). How iPhoneinnovators changed their consumption in iDay2: Hedonicpost or brand devotion. International Journal of Informa-tion Management, 31, 524–532.
Bagozzi, R. P., Gopinath, M., & Nyer, P. U. (1999). The role ofemotions in marketing. Journal of the Academy of Market-ing Science, 27, 184–206.
Bagozzi, R. P., & Nataraajan, R. (2000). The year 2000: Look-ing forward. Psychology & Marketing, 17, 1–11.
Bagozzi, R. P., & Yi, Y. (1988). On the evaluation of structuralequation models. Academy of Marketing Science, 16, 74–94.
Bagozzi, R. P., & Yi, Y. (2012). Specification, evaluation, andinterpretation of structural equation models. Journal ofAcademy Marketing Science, 40, 8–34.
Bentler P. M. (1990). Comparative fit indexes in structuralmodels. Psychological Bulletin, 107, 238–246.
Bollen, K., & Lennox, R. (1991). Conventional wisdom on mea-surement: A structural equation perspective. PsychologicalBulletin, 110, 305–314.
Bruner, G. C., & Kumar, A. (2007). Gadget lovers. Journal ofthe Academy of Marketing Science, 35, 329–339.
Childers, T. L. (1986). Assessment of the psychometric prop-erties of an opinion leadership scale. Journal of MarketingResearch, 23, 184–188.
Clark, R. A., & Goldsmith, R. E. (2006). Interpersonal influ-ence and consumer innovativeness. International Journalof Consumer Studies, 30, 34–43.
Cusumano, M. L. (2010). Platforms and services: Understand-ing the resurgence of Apple. Communications of the ACM,53, 22–24.
260 SHOHAM AND PESAMAAPsychology and Marketing DOI: 10.1002/mar

Dabholkar, P. A., & Bagozzi, R. P. (2002). An attitudinalmodel of technology-based self-service: Moderating effectsof consumer traits and situational factors. Journal of theAcademy of Marketing Science, 30, 184–201.
Eriksson, P. E., & Pesamaa, O. (2013). Buyer-supplier inte-gration in project-based industries. Journal of Business &Industrial Marketing, 28, 29–40.
Festinger, L. (1957). A theory of cognitive dissonance. Stan-ford, CA: Stanford University Press.
Fishbein, M. (1963). An investigation of relationships betweenbeliefs about an object and the attitude toward the object.Human Relations, 16, 233–240.
Fishbein, M., & Ajzen, I. (1975). Belief, attitude, intention, andbehavior. Reading, MA: Addison-Wesley.
Flynn, L. R., Goldsmith, R. E., & Eastman, J. K. (1996). Opin-ion leaders and opinion seekers: Two new measurementscales. Journal of the Academy of Marketing Science, 24,137–147.
Gartner, Inc. (2009). Competitive landscape: Mobile devices,worldwide, 2009. UK: Egham.
Hair, J. F., Black, B., Babin, B., & Anderson, R. E. (2010).Multivariate data analysis (7th ed.). London: Prentice-Hall.
Han-Jen, N., Yung-Sung, C., & Hsien-Tang, T. (2012). An ex-ploratory study of the Otaku Adolescent Consumer. Psy-chology & Marketing, 29, 712–725.
Harris, J., & Blair, E. (2006). Functional compatibility riskand consumer preference for product bundles. Journal ofthe Academy of Marketing Science, 34, 19–26.
Heider, F. (1958). The psychology of interpersonal relations.NY: John Wiley & Sons.
Hirschman, E. C. (1980). Innovativeness, novelty seeking,and consumer creativity. Journal of Consumer Research,7, 283–295.
Hirschman, E. C. (1981). Technology and symbolism as sourcesfor the generation of innovations. In M. Andrew (Ed.), Ad-vances in consumer research, Vol. 9 (pp. 537–541). St Louis,MO: Association for Consumer Research.
Hofstede, G. (1991). Cultures and organizations: Software ofthe mind. NY: McGraw-Hill.
Hur, W.-M., Yoo, J.-J., & Chung, T.-L. (2012). The consump-tion values and consumer innovativeness on convergenceproducts. Industrial Management & Data Systems, 112,688–706.
Jayson, S. (2011). 2010: The year technology replaced talk-ing. USA Today online. Retrieved January 3, 2011 fromhttp://www.usatoday.com/yourlife/parenting-family/2010-12-30-1AYEAR30_CV_N.htm.
Joachimsthaler, E. A., & Lastovicka, J. L. (1984). Optimalstimulation level-exploratory behavior models. Journal ofConsumer Research, 11, 830–835.
Kulviwat, S., Bruner II, G. C., & Al-Shuridah, O. (2009). Therole of social influence on adoption of high tech innovations:The moderating effect of public/private consumption. Jour-nal of Business Research, 62, 706–712.
Lehtonen, T. K. (2003). The domestication of new technologiesas a set of trials. Journal of Consumer Culture, 3, 363–385.
Licata, J. W., Mowen, J. C., Harris, E. G., & Brown, T. J. (2003).On the trait antecedents and outcomes of service workerjob resourcefulness. Journal of the Academy of MarketingScience, 31, 256–271.
McColl-Kennedy, J. R., & Sparks, B. A. (2003). Applicationof fairness theory to service failures and service recovery.Journal of Service Research, 5, 251–266.
McLuhan, M. (1964). Understanding media. New York:McGraw-Hill.
Mehrabian, A., & Russell, J. A. (1974). An approach to envi-ronmental psychology. Cambridge, MA: The MIT Press.
Midgley, D. F., & Dowling, G. R. (1993). A longitudinal studyof product form innovation: The interaction between pre-dispositions and social messages. Journal of Consumer Re-search, 19, 611–625.
Mittelstaedt, R. A., Grossbart, S. L., Curtis, W. W., & Devere,S. P. (1976). Optimal stimulation adoption of new leveland the adoption decision process. Journal of ConsumerResearch, 3, 84–94.
Nunnally, J. C. (1978). Psychometric Theory. New York: Mc-Graw-Hill
Nysveen, H., Pedersen, P. E., & Thorbjørnsen, H. (2005). In-tentions to use mobile services: Antecedents and cross-service comparisons. Journal of the Academy of MarketingScience, 33, 330–346.
Parasuraman, A. (2000). Technology readiness index (TRI).Journal of Services Marketing, 2, 307–320.
Peck, J., & Childers, T. (2003). Individual differences in hapticinformation processing: The “need for touch” scale. Journalof Consumer Research, 30, 430–442.
Podsakoff, P. M., MacKenzie, S. B., Podsakoff, N. P., & Lee, J.Y. (2003). Common method biases in behavioral research:A critical review of literature and recommended remedies.Journal of Applied Psychology, 88, 879–903.
Price, L. L., & Ridgway, N. M. (1983). Development of a scaleto measure use innovativeness. In Richard P. Bagozzi &Alice M. Tybout (Eds.), Advances in consumer research,Vol. 10 (pp. 679–684). Ann Arbor: Association for ConsumerResearch.
Ridgway, N. M., & Price, L. L. (1994). Exploration in productusage: A model of use innovativeness. Psychology & Mar-keting, 11, 69–84.
Roehrich, G. (2004). Consumer innovativeness: Concepts andmeasurements. Journal of Business Research, 57, 671–677.
Rogers, E. M. (1983). Diffusion of innovations. New York: TheFree Press.
Rogers, E. M., & Cartano, D. G. (1962). Methods of measuringopinion leadership. Public Opinion Quarterly, 26, 435–441.
Ruvio, A., & Shoham, A. (2007). Innovativeness, exploratorybehavior, market mavenship, and opinion leadership: Anempirical examination in the Asian context. Psychology &Marketing, 24, 703–722.
Schwab, K. (2009). The Global Competitiveness Report 2009–2010. Geneva: World Economic Forum.
Shih, C. F., & Venkatesh, A. (2004). Beyond adoption: Devel-opment and application of a use-diffusion model. Journalof Marketing, 68, 59–72.
Shoham, A., & Ruvio, A. (2008). Opinion leaders and followers:A replication and extension. Psychology & Marketing, 25,280–297.
Statistical Abstract of Israel (2010). Jerusalem, Israel: CentralBureau of Statistics.
Thorbjørnsen, H., Pedersen, P. E., & Nysveen, H. (2007). ‘Thisis who I am’: Identity expressiveness and the theory ofplanned behavior. Psychology & Marketing, 24, 763–785.
Valente, T. W., & Davis, R. L. (1999). Accelerating the dif-fusion of innovations using opinion leaders. Annals of theAmerican Academy of Political and Social Science, 566, 55–67.
Venkatesan, M. (1973). Cognitive consistency and noveltyseeking. Englewood Cliffs, NJ: Prentice-Hall.
Verganti, R. (2006). Innovation through design. Harvard Busi-ness Review, 84, 114–122.
Wang, G., Dou, W., & Zhou, N. (2008). Consumption attitudesand adoption of new consumer products: A contingency ap-proach. European Journal of Marketing, 42, 238–254.
Westjohn, S., Arnold, M., Magnusson, P., Zdravkovic, S.,& Zhou, J. (2009). Technology readiness and usage: A
GADGET LOVING 261Psychology and Marketing DOI: 10.1002/mar

global-identity perspective. Journal of the Academy of Mar-keting Science, 37, 250–265.
Wu, W. J., Papka, M. E., & Stevens, R. (2008). Toward an opensocial life science gateway. Presented at Conference Infor-mation: Grid Computing Environment Workshop, Nov 16,2008 Austin, TX (pp. 107–112). Source: GCE: 2008 GRIDCOMPUTING ENVIRONMENTS WORKSHOP.
Zhu, Z., Nakata, C., Sivakumar, K., & Grewal, D. (2007). Self-service technology effectiveness: The role of design featuresand individual traits. Journal of the Academy of MarketingScience, 35, 492–506.
Special thanks to Professors Joseph Hair Jr. and RichardP. Bagozzi for methodological and linguistic guidance. Also,thanks to Professor Rajan Nataraajan and the selected blindreviewers for their constructive comments. Finally, our sin-cere appreciation goes to attending faculty members at BTHand Hanken for inspiring recommendations in two separateresearch seminars.
Correspondence regarding this article should be sentto: Aviv Shoham, Professor, Graduate School of Man-agement, University of Haifa, Haifa 31905, Israel([email protected]).
APPENDIX: SCALES AND ITEMS
Actualized NS (GNS; Patterned after Hirschman1980, 1981)
1. How ready are you to search for new information?2. Do you search for new things?3. Do you search for things that are different?
Inherent NS (LNS; NS in the original. Alpha = 0.86and AVE = 0.53 in the original).
4. I prefer an unpredictable life that is full of changeto a more routine one.
5. I like surprises.6. I like continually changing activities.7. I like to experience novelty and change in my
daily routine.8. When things get boring. I like to find some new
and unfamiliar experience.9. I am continually seeking new ideas and experi-
ences.
TI (alpha = 0.91. AVE = 0.67)
10. I get a kick out of buying new high-tech itemsbefore most other people know they exist.
11. It is cool to be the first to own new high-techproducts.
12. I get a thrill out of being the first to purchase ahigh technology item.
13. Being the first to buy new technological devicesis very important to me.
14. I want to own the newest technological products.
TC
14. I am more interested in what makes a productwork than in what it looks like.
15. If I fail to understand how something works, Iprefer to “play” with it, rather than ask for help.
GL (alpha = 0.93. AVE = 0.65 in the original study)
16. Despite their age, I love to play around with tech-nological gadgets.
17. Even if they aren’t the newest things on the mar-ket, learning how to operate technological prod-ucts is interesting to me.
18. Old or new, playing with technological productsbrings me a lot of enjoyment.
19. Others may not understand it but it’s kind of athrill to play with products that have a high-techcomponent.
20. If I was alone for several hours, I could entertainmyself easily if I had lots of gadgets to play with.
21. Leafing through catalogs from high-tech vendorssuch as Sharper Image and Dell is something Ilike to do.
22. It is easy for me to spend a lot of time playingaround with almost any kind of technological de-vice.
23. Some people find it irritating but I enjoy figuringout how to get technological goods and services towork.
TOL
24. When they choose technological goods and ser-vices, other people do not come to me for advice(reversed).
25. Other people rarely come to me for advice aboutchoosing technological products. (r)
26. People that I know pick technological gadgets andservices based on what I have told them.
27. I often persuade other people to buy the technol-ogy products that I like.
28. I often influence people’s opinions about techno-logical goods and services.
Gadget Ownership Index
30. Cellular phone 3.5 (in Israel) Smartphone (inSweden)
31. Ipod32. Iphone33. MP4 player34. Home DVD player35. Portable DVD player36. Quad PC/Laptop37. Wireless keyboard38. Digital picture frame39. Digital camera (over 6MP; 3´ optical zoom)40. DSLR41. LCD/Plasma TV42. Home cinema system43. Car GPS
Household income1.00 = “much below Israel’s average”2.00 = “below Israel’s average”3.00 = “about Israel’s average”4.00 = “above Israel’s average”5.00 = “much above Israel’s average”
262 SHOHAM AND PESAMAAPsychology and Marketing DOI: 10.1002/mar