gamma ray logs
TRANSCRIPT

8/9/2019 Gamma Ray Logs
http://slidepdf.com/reader/full/gamma-ray-logs 1/31

8/9/2019 Gamma Ray Logs
http://slidepdf.com/reader/full/gamma-ray-logs 2/31

8/9/2019 Gamma Ray Logs
http://slidepdf.com/reader/full/gamma-ray-logs 3/31
pdfcrowd comopen in browser PRO version Are you a developer? Try out the HTML to PDF API
radioactivity with increased shale content is apparent. At the high radioactivity
extreme are organic-rich shales and potash (KCl). These plotted values can
include beta as well as gamma radioactivity (collected with a Geiger counter).
Modern techniques concentrate on gamma ray detection.
Fig. 1 – Distribution of relative radioactivity level for
various rock types (from Bigelow after Russell ).
Radioactive isotopes in rocks
The primary radioactive isotopes in rocks are potassium-40 and the isotope
series associated with the disintegration of uranium and thorium. Fig. 2
shows the equilibrium distribution of energy levels associated with each of
these groups. Potassium-40 (K ) produces a single gamma ray of energy of
1.46 MeV as it transforms into stable calcium. On the other hand, both
thorium (Th) and uranium (U) break down to form a sequence of radioactive
daughter products. Subsequent breakdown of these unstable isotopes
[2] [1]
40

8/9/2019 Gamma Ray Logs
http://slidepdf.com/reader/full/gamma-ray-logs 4/31
pdfcrowd comopen in browser PRO version Are you a developer? Try out the HTML to PDF API
produces a variety of energy levels. Standard gamma ray tools measure a
very broad band of energy including all the primary peaks as well as lower-
energy daughter peaks. As might be expected from Fig. 2, the total count
can be dominated by the low-energy decay radiation.
Fig. 2 – Gamma-ray energy levels resulting from
disintegration of unstable isotopes (adapted from Tittman
et al . ).
The radionuclides, including radium, may become more mobile in formation
waters found in oil fields. Typically, the greater the ionic strength (salinity),
the higher the radium content. Produced waters can have slightly higher
radioactivity than background. In addition, the radionuclides are often
concentrated in the solid deposits (scale) formed in oilfield equipment. When
enclosed in flow equipment (pipes, tanks, etc.) this elevated concentration is
not important. However, health risks may occur when equipment is cleaned
for reuse or old equipment is put to different application.
[3]

8/9/2019 Gamma Ray Logs
http://slidepdf.com/reader/full/gamma-ray-logs 5/31
pdfcrowd comopen in browser PRO version Are you a developer? Try out the HTML to PDF API
Table 1 lists some of the common rock types and their typical content of
potassium, uranium, and thorium.
Potassium is an abundant element, so the radioactive K is widely
distributed (Table 2). Potassium, feldspars and micas are common
components in igneous and metamorphic rocks. Immature sandstones can
retain an abundance of these components. In addition, potassium is common
in clays. Under extreme evaporitic conditions, KCl (sylvite) will be deposited
and result in very high radioactivity levels. Uranium and thorium, on the other
hand, are much less common. Both U and Th are found in clays (by
absorption), volcanic ashes, and heavy minerals.
Table 1
40

8/9/2019 Gamma Ray Logs
http://slidepdf.com/reader/full/gamma-ray-logs 6/31
pdfcrowd comopen in browser PRO version Are you a developer? Try out the HTML to PDF API
Table 2
History of gamma ray tools
The gamma ray tool was the first nuclear log to come into service, around
1930 (see Fig. 3). Gamma ray logs are used primarily to distinguish clean,
potentially productive intervals from probable unproductive shale intervals. The
measurement is used to locate shale beds and quantify shale volume. Clay
minerals are formed from the decomposition of igneous rock. Because clay
minerals have large cation exchange capacities, they permanently retain aportion of the radioactive minerals present in trace amounts in their parent
igneous micas and feldspars. Thus, shales are usually more radioactive than
sedimentary rocks. The movement of water through formations can
complicate this simple model. Radioactive salts (particularly uranium salts)
dissolved in the water can precipitate out in a porous formation, making
otherwise clean sands appear radioactive.

8/9/2019 Gamma Ray Logs
http://slidepdf.com/reader/full/gamma-ray-logs 7/31
pdfcrowd comopen in browser PRO version Are you a developer? Try out the HTML to PDF API
Fig. 3 – A timeline of nuclear logging highlights the
introduction and evolution of commercial nuclear-logging
measurements.
Gamma ray logging tool
Before getting into how to use the log readings, let us consider the workings
of the tool. Unlike all other nuclear tools (and, in fact, all other logging
measurements), it is completely passive. It emits no radiation. Instead, it
simply detects incoming gamma rays from the formation and (unfortunately)the borehole. Gamma rays are electromagnetic radiation, generally in the
energy range 0.1 to 100 MeV. As light, this would correspond to very short
wavelengths indeed. The difference between gamma rays and X-rays is largely
semantic because they overlap in energy.
Originally, the detector was a Geiger-Müeller tube, just as in the Geiger
counter. More recently, the detectors have been switched to solid-state

8/9/2019 Gamma Ray Logs
http://slidepdf.com/reader/full/gamma-ray-logs 8/31
pdfcrowd comopen in browser PRO version Are you a developer? Try out the HTML to PDF API
scintillation crystals such as NaI. When a gamma ray strikes such a crystal,
it may be absorbed. If it is, the crystal produces a flash of light. This light is
"seen" by a photomultiplier staring into the end of the crystal. The
photomultiplier shapes the light into an electrical pulse that is counted by the
tool. Hence, like all nuclear tools, the raw measured quantity in a gamma ray
log is counts. This means that the precision of gamma ray log measurements
is determined by Poisson statistics. The precision is the square root of the
total number of counts recorded at a given depth. Counts recorded are
basically proportional to the volume of the detector crystal times its density
(which determine the probability that a gamma ray will be captured within the
crystal) times the length of time counted. As with all nuclear-logging
measurements, the only part of this that the logger controls is the counting
time. Because log measurements are depth driven, the length of time the
logger counts is inversely proportional to the logging speed.
Historically, gamma ray sondes have recorded the total flux of gamma
radiation integrated over all energies emanating from a formation as a single
count rate, the gamma ray curve. Logging tools are not uniform in their energy
sensitivity. No detector responds to all the gamma rays that impinge on it.
Many pass through with no effect. The sizes of a detector, the solid angle it
subtends, and its thickness, as well as its composition (particularly its
density), all affect its efficiency for detecting gamma rays. The tool housing
around the detector, the casing, and even the density of the borehole fluid can
all filter the gamma rays coming from the formation. All these factors not only
lower the overall tool efficiency, they also lead to variations in efficiency for
gamma rays of different energies. In short, the count rate recorded in a
particular radioactive shale bed is not a unique property of the shale. It is a
complex function of tool design and borehole conditions as well as the actual
formation’s radioactivity.

8/9/2019 Gamma Ray Logs
http://slidepdf.com/reader/full/gamma-ray-logs 9/31
df d mi b PRO i Are you a developer? Try out the HTML to PDF API
Common scale
Even though gamma ray readings are generally used only in a relative sense,
with reservoir (clean) and shale values determined in situ, there are
advantages to a common scale. In the US and most places outside the
former Soviet Union, gamma ray logs are scaled in American Petroleum
Institute (API) units. This harkens back to a desire to compare logs from tools
of different designs. Tools with different detector sizes and compositions willnot have the same efficiency and thus will not give the same count rate even
in the same hole over the same interval. To provide a common scale, API built
a calibration facility at the U. of Houston. It consists of a concrete-filled pit, 4
ft in diameter, with three 8-ft beds penetrated by a 5 1/2-in. hole cased with
17-lbm casing. The top and bottom beds are composed of extremely-low-
radioactivity concrete. The middle bed was made approximately twice as
radioactive as a typical midcontinent US shale, resulting in the zone
containing 13 ppm uranium, 24 ppm thorium, and 4% potassium. The gamma
ray API unit is defined as 1/200 of the difference between the count rate
recorded by a logging tool in the middle of the radioactive bed and that
recorded in the middle of the nonradioactive bed.
While it has served fairly well for more than 40 years, this is a poor way to
define a fundamental unit. Different combinations of isotopes, tool designs,
and hole conditions may give the same count rate, so the calibration does not
transfer very far from the calibration-pit conditions. In contrast, Russiangamma ray logs are typically scaled in microroentgens (μR)/hr, which does
correspond to a specific amount of radiation. Converting this to API units is a
bit vaguely defined, but it is often suggested that the conversion factor is 1
μR/hr = 10 API units for Geiger tube detectors, but 15 μR/hr = 10 API for
scintillation detectors. This falls in with the previous discussion of the many
factors that can affect gamma ray readings. The problem is further aggravated

8/9/2019 Gamma Ray Logs
http://slidepdf.com/reader/full/gamma-ray-logs 10/31
df di b PRO i Are you a developer? Try out the HTML to PDF API
in logging-while-drilling (LWD) measurements. The API unit provides a degree
of standardization, but despite the best efforts of tool designers, one cannot
expect tools of different designs to read exactly the same under all
conditions. Fortunately, none of this is very important because gamma ray
measurements are generally used only in a relative way.
Factors affecting readings
Because we use gamma ray logs as relative measures, precise calibration is
not very important except as a visual log display feature. Environmental
effects are much more important. Consider a radioactive volume of rock
traversed by a borehole. Nuclear physics tells us that gamma rays are
absorbed as they pass through the formation. For typical formations, this
limits the depth of investigation to approximately 18 in. Considering only the
geometry, the count rate opposite a given rock type will be much lower in a
larger borehole in which the detector is effectively farther from the source ofgamma rays. In an open hole, borehole size almost always has the greatest
effect on the count-rate calibration. This problem can go well beyond changes
in bit size. Especially if shales or sands are selectively washed out, borehole
size can imprint itself of the expected gamma ray contrast between shales
and sands. If the borehole is large enough, the density of the fluid filling the
borehole can also impact the calibration by absorbing some of the gamma
rays before they get to the tool.
Barite in the mud is another complication, filtering the incoming gamma rays.
Thus, the gamma ray borehole size and fluid corrections are often very
important and should be made if at all possible. Obviously, casing absorbs a
large fraction of the gamma rays traversing it on their way to the borehole, so
if the tool is run in a cased hole, casing corrections are very important. Tool
design has a large impact on environmental corrections. The housing and

8/9/2019 Gamma Ray Logs
http://slidepdf.com/reader/full/gamma-ray-logs 11/31
df di b PRO i A d l ? T t th HTML t PDF API
location of the detectors all filter the incoming gamma rays. It is important to
use the right environmental corrections for the tool being run. This is
especially true for LWD tools that may consist of multiple detectors
embedded in large, heavy drill collars that filter the incoming gamma rays in
unique ways.
Interpreting gamma ray logs
Log analysis
Now that we know how the tools work, we are ready to discuss how gamma
ray logs are used in log analysis. While the gamma ray log traditionally has
been used primarily for well-to-well correlation, it also plays a role in
quantitative log analysis. As mentioned at the outset, gamma ray logs are
used primarily to define and quantify productive intervals. As discussed, above
there are only three naturally occurring radioactive elements-potassium,
uranium, and thorium (or K, U, and Th by their elemental symbols)—and all of
these tend to be associated with shales, not clean matrix minerals (e.g.,
quartz sand, SiO , limestone CaCO ).
The most common interpretation method is the simple bulk linear mixing law
presented previously.
....................(1)
Even though we know that the distribution of clays in shales and reservoir
rocks is quite complex, to first order, log analysts frequently simplify the
linear bulk mixing law to the determination of shale volume:
....................(2)
2 3

8/9/2019 Gamma Ray Logs
http://slidepdf.com/reader/full/gamma-ray-logs 12/31
df di b PRO i A d l ? T t th HTML t PDF API
Standard log analysis separates the log-analysis problem into a series of
sequential, independent steps. Because shale-volume determination is
usually the first step in the sequential process of formation evaluation from
logs, porosity and fluid volumes are not yet known. As a result, the equation
is further simplified to
....................(3)
Adding closure,
....................(4)
leads to the familiar formula for calculating shale volume from a borehole-
corrected gamma ray log:
....................(5)
where the "c lean" terms represent the lumped response to the matrix grains
and the fluids in the porosity. Further complications arise because the shale
values are taken from overlying shale beds. The clays distributed in the
reservoir rock are almost certainly not simply dispersed versions of the
shales, unless they occur as thin laminations. At the very least, there will bedifferences between shale, made up of clay minerals, c lay bound water, and
silt-size particles, and the clay minerals alone distributed in the matrix.
Worse, because of differences in the processes at work when the shales
were laid down vs. the shaly sands, the clay minerals in the sands may not
be the same as those in the matrix. To compensate for this, numerous
nonlinear relationships have been proposed. These have geologically
8/9/2019 Gamma Ray Logs
http://slidepdf.com/reader/full/gamma-ray-logs 13/31df di b PRO i
Are you a developer? Try out the HTML to PDF API
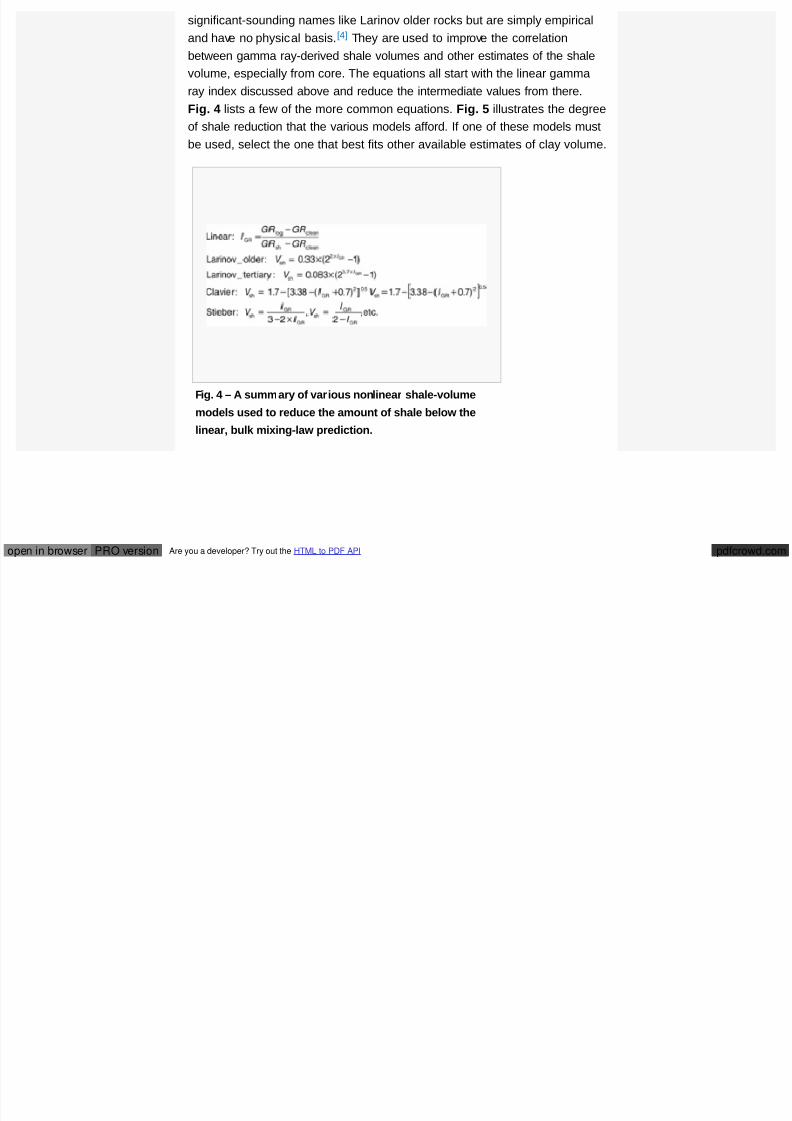
significant-sounding names like Larinov older rocks but are simply empirical
and have no physical basis. They are used to improve the correlation
between gamma ray-derived shale volumes and other estimates of the shale
volume, especially from core. The equations all start with the linear gamma
ray index discussed above and reduce the intermediate values from there.
Fig. 4 lists a few of the more common equations. Fig. 5 illustrates the degree
of shale reduction that the various models afford. If one of these models must
be used, select the one that best fits other available estimates of clay volume.
Fig. 4 – A summary of various nonlinear shale-volume
models used to reduce the amount of shale below thelinear, bulk mixing-law prediction.
[4]

8/9/2019 Gamma Ray Logs
http://slidepdf.com/reader/full/gamma-ray-logs 14/31df di b PRO iAre you a developer? Try out the HTML to PDF API
Fig. 5 – Illustration of the amount of shale reduction
predicted by various nonlinear shale-volume models
listed in Fig 4.
One disadvantage of the various empirical, nonlinear models is that they
generally require core data for calibration or at least justification. This is a
generic problem with more complex models; they require more parameters to
characterize them. To set or calibrate those parameters in turn requires more
independent log or core measurements.
It is also assumed that the clean reservoir material (the sum of the pore fluids
and matrix minerals) has a fixed amount of radiation associated with it. As
long as the gamma ray reading associated with the clean reservoir material is
small compared to the shales, this assumption is safe. As the sands become
hotter (more radioactive), lumping the fluids and matrix together becomes
problematic, particularly if the porosity is large.
P i i

8/9/2019 Gamma Ray Logs
http://slidepdf.com/reader/full/gamma-ray-logs 15/31df di b PRO iAre you a developer? Try out the HTML to PDF API
Precision
Consider briefly some details of how a standard, gross-count-rate gamma ray
tool works. Most modern tools (in nuclear logging, "modern" means within the
past 25 years) use a solid-state scintillator crystal (most often sodium iodide,
NaI) to detect gamma rays. When a gamma ray strikes the crystal, there is
some probability that it will be captured. That probability is mostly
proportional to the size and density of the crystal. If it is captured, it gives offa flash of light. A photomultiplier mounted on one end of the crystal converts
that light to an electrical pulse, which is then fed to an electronic pulse
counter. To measure a count rate with a given precision in the laboratory, one
counts until enough counts are registered to give the desired level of precision
(see the discussion of counting statistics above). Then, one divides that
number of counts by the time it took to get that many to obtain a count rate.
Unfortunately, in a logging tool, all measurements are depth-based. To
measure a count rate, the tool counts for the length of time it takes the tool tomove 1/2 ft (or whatever the depth increment is), then divides by the length of
time it took the tool to move that distance. This means that the precision of a
nuclear-logging measurement in a given lithology is proportional to one over
the square root of the logging speed. Remember that the number of counts
received crossing a clean 1/2 ft will be much less than the number when
crossing a shaly 1/2 ft.
Environmental distortion
The simple consideration of the discussion of radiation transport helps clarify
which environmental effects most seriously distort the gamma ray log.
Imagine what happens as borehole size increases. There is less of the
radiating radioactive material near the detector, and the measured count rate
goes down, even though the actual level of radioactivity in the formation
remains the same Further imagine the rather typical case in which the

8/9/2019 Gamma Ray Logs
http://slidepdf.com/reader/full/gamma-ray-logs 16/31
Are you a developer? Try out the HTML to PDF API
remains the same. Further imagine the rather typical case in which the
shales are eroded and broken out while the sands remain in gauge. This
would suppress the apparent gamma ray count rate in the eroded shales
much more than in the sands, suppressing the gamma ray contrast between
eroded shales and sands. This is typically one of the largest environmental
effects on the gamma ray count rate. Again from the discussion of radiation
transport, heavier materials in the path that the gamma rays must follow from
the formation through the detector will absorb more gamma rays than lighter
materials (as will be seen in a later section, this is the basis for the bulk
density log, but that is another story and a different log). Worse yet, barite is
a big absorber of gamma rays. The lesson to carry away is that borehole size
and fluid corrections are almost always important when running the gamma
ray log.
Gamma ray interactions with formations
Gamma rays interact with formations in three different ways:
Compton scattering
Photoelectric absorption
Pair production (to a limited extent)
One of these will dominate depending on the energy of the gamma ray, as
Fig. 6 shows.

8/9/2019 Gamma Ray Logs
http://slidepdf.com/reader/full/gamma-ray-logs 17/31

8/9/2019 Gamma Ray Logs
http://slidepdf.com/reader/full/gamma-ray-logs 18/31
pdfcrowd.comopen in browser PRO version Are you a developer? Try out the HTML to PDF API
....................(6)
where Z is the average atomic number of the formation. The attenuation law
for gamma ray intensity falloff is then
....................(7)
For Compton scattering to be a true measure of bulk density, ρ , Z / A must be
a constant. For almost all formation elements, Z / A = 1/2, and a measurement
of gamma ray attenuation in the 1- to 10-MeV range can indeed be calibrated
to bulk density. The notable exception is hydrogen, for which Z / A =1. Table 1
lists some density values for comparison.
Table 1
b

8/9/2019 Gamma Ray Logs
http://slidepdf.com/reader/full/gamma-ray-logs 19/31
pdfcrowd.comopen in browser PRO version Are you a developer? Try out the HTML to PDF API
Photoelectric (PE) absorption
Not surprisingly, the PE log is based on the photoelectric absorption of
gamma rays, the scattering process that dominates at low energy. In this
process, the incoming gamma ray is absorbed by an atomic electron, giving
up all its energy to the electron in the process. If the gamma ray is energetic
enough, the added energy causes the electron to break free from its atom. As
another electron falls into the vacancy, a characteristic X-ray, generally less
than 100 keV, is emitted. These X-rays are too low in energy to contribute to
logging measurements.
The PE cross section falls off very strongly as the energy of the incoming
gamma ray increases. The cross section is proportional to
....................(8)
It is a significant factor in gamma ray scattering only for energies less than
100 keV. This means that it is easy to separate the effects of PE absorption
from those of Compton scattering by simply windowing the energies of the
gamma rays detected. The same tool can make both measurements
simultaneously. By examining the falloff of low-energy gamma ray flux, a
logging tool can be calibrated to measure the PE factor (PEF). The PEF, in
turn, is primarily sensitive to the average atomic number, Z , of the formation.
Because hydrocarbons and water have very low Z values, they contribute very
little to the average PE of a formation. Conversely, because the major rock
matrices have very different Z s, the PE factor is a nearly porosity-independent
lithology indicator.

8/9/2019 Gamma Ray Logs
http://slidepdf.com/reader/full/gamma-ray-logs 20/31
primarily by formation material electron density and Compton scattering. This

8/9/2019 Gamma Ray Logs
http://slidepdf.com/reader/full/gamma-ray-logs 21/31
pdfcrowd.comopen in browser PRO version Are you a developer? Try out the HTML to PDF API
p y y y p g
limits the depth of investigation to around 30 cm, although it will depend on
the energy levels. Because the radioactive decay is a statistical process,
slower logging rates produce better results. The low number of counts
resulting from logging too fast cannot be increased by logging rate correction
factors. Most tools are usually out of calibration if they are not centered in the
borehole. Heavy barite mud can also lower the overall count rate, particularly
for low-energy gamma rays.
Rather than merely measuring total gamma radiation, the energy levels can
be detected separately. This allows the concentrations of K, U, and Th to be
derived as independent parameters. Fig. 7 shows the energy windows used in
a Baker-Atlas tool. This would allow, for example, the feldspars in immature
sands to be separated from clays with adsorbed U or Th.
Fig. 7 – Gamma-ray energy windows used for spectral
gamma-ray logging (from Bigelow ).[2]
Id if i h l l

8/9/2019 Gamma Ray Logs
http://slidepdf.com/reader/full/gamma-ray-logs 22/31
pdfcrowd.comopen in browser PRO version Are you a developer? Try out the HTML to PDF API
Identifying shale volumes
The most common use of gamma ray logs is to estimate the shale "volume"
in rocks. It is important to remember that the tool measures radioactivity, and
the correlation to shale content is empirical. Shales are presumed to be
composed of clay minerals. Thus, the gamma ray level is assumed to be
correlated with grain size. In reality, shales may be composed of 30% or
more of quartz and other minerals. The clays within the shales may not be
radioactive, and the adjacent sands may contain radioactive isotopes.
However, radioactivity levels typically are related to grain size, as seen in Fig.
8. Here, core plugs were analyzed for median grain size and radioactivity level
measured directly; crosses are fine-grained sands, while dots are silts and
clay-rich rocks.

8/9/2019 Gamma Ray Logs
http://slidepdf.com/reader/full/gamma-ray-logs 23/31
pdfcrowd.comopen in browser PRO version Are you a developer? Try out the HTML to PDF API
Fig. 8– Measured mean grain size vs. gamma-ray levels
(calibrated to API value) for clastic samples. The rough
correspondence of gamma ray value can be seen, butrelationship is not simple (data from Georgi et al . ).
To extract the shale content in rocks, a linear or near-linear relation is used to
convert a gamma ray index, I , to shale volume V . Because local sands
can contain radioactive components, and the shales may vary with depth,
local baseline levels are chosen near the zone of interest.
....................(9)
where R is the measured radiation level, R is the baseline level
through a reference sand, and R is the baseline through a representative
shale. Several relations have been developed to derive shale volume (Fig. 9).
A linear relation simply sets the shale content equal to the gamma ray index.
[5]
gr sh
cleansand
shale
....................(10)

8/9/2019 Gamma Ray Logs
http://slidepdf.com/reader/full/gamma-ray-logs 24/31
pdfcrowd.comopen in browser PRO version Are you a developer? Try out the HTML to PDF API
....................(10)
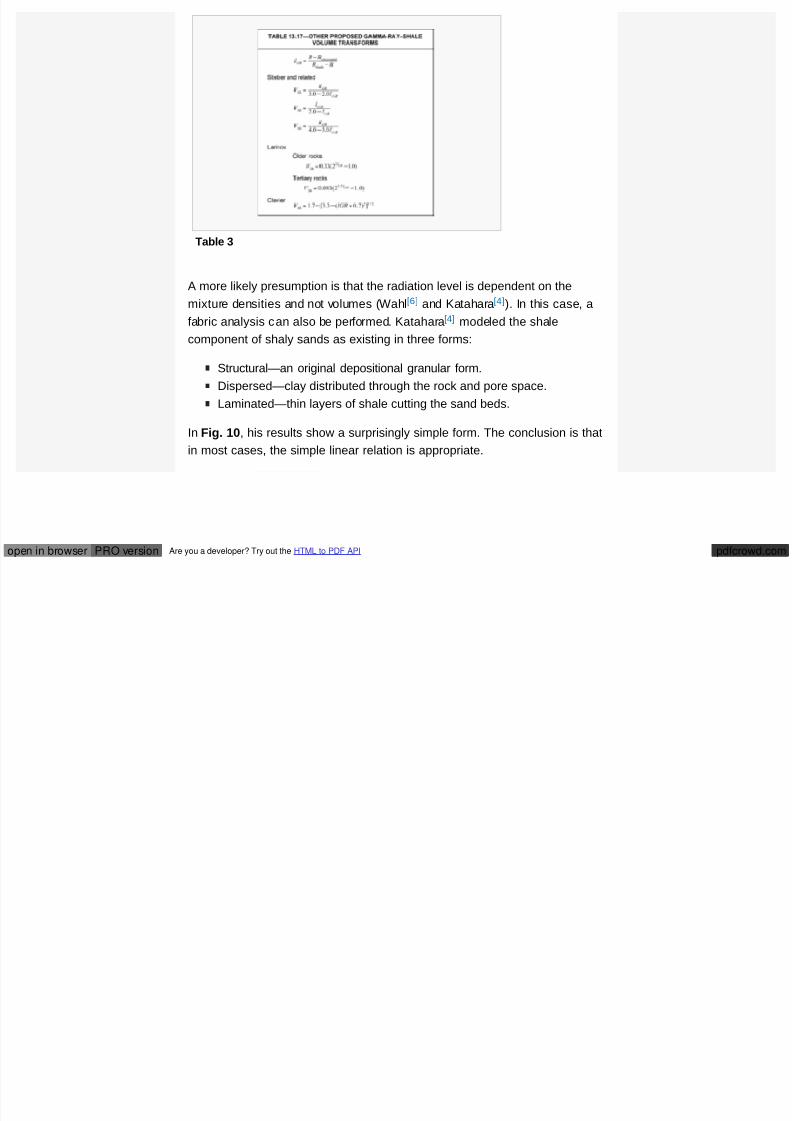
Other proposed relations shown in Fig. 9 are defined in Table 3. Several
assumptions are made in these evaluations:
Compositions of sand and shale components are constant.
Baselines are chosen on representative "shales" and "clean" sands
(although these terms are very subjective).Simple mixture laws apply.
Fabric is not important.
Many of these assumptions may be poor approximations.
Fig. 9 – Reported gamma-ray index to shale volume
conversions (from Bigelow ).[2]
8/9/2019 Gamma Ray Logs
http://slidepdf.com/reader/full/gamma-ray-logs 25/31
pdfcrowd.comopen in browser PRO version Are you a developer? Try out the HTML to PDF API
Table 3
A more likely presumption is that the radiation level is dependent on the
mixture densities and not volumes (Wahl and Katahara ). In this case, a
fabric analysis can also be performed. Katahara modeled the shale
component of shaly sands as existing in three forms:
Structural—an original depositional granular form.
Dispersed—clay distributed through the rock and pore space.
Laminated—thin layers of shale cutting the sand beds.
In Fig. 10, his results show a surprisingly simple form. The conclusion is that
in most cases, the simple linear relation is appropriate.
[6] [4]
[4]

8/9/2019 Gamma Ray Logs
http://slidepdf.com/reader/full/gamma-ray-logs 26/31
pdfcrowd.comopen in browser PRO version Are you a developer? Try out the HTML to PDF API
Fig. 10 – Modeled gamma-ray response to different clay
distributions within a shaley sand series (modified from
Katahara ).
As an example of this process, the shale content of a zone in a Gulf of
Mexico well is estimated. In Fig.11, a sand-shale sequence gives a gamma
ray range of approximately 20 to 90 API units. A baseline of approximately 25
is chosen through the sand, and a baseline of approximately 98 is chosen for
the shale. Using the relations in Eqs. 9 and 10 result in the shale volume
estimates scaled at the bottom of the logged zone.
[4]

8/9/2019 Gamma Ray Logs
http://slidepdf.com/reader/full/gamma-ray-logs 27/31
pdfcrowd.comopen in browser PRO version Are you a developer? Try out the HTML to PDF API
Fig. 11 – Typical shale volume extraction from a Gulf of
Mexico log. 100% “sand” and 100% “shale” lines are
locally established; then, shale content is a linear
interpolation between the two.
Correlating cores with logged depth
Gamma radiation levels can also be measured on core. This technique
provides a profile of levels along the length of the core. The primary use is to
correlate core depths to logged depths. An example is shown in Fig. 12. This
procedure can be used to identify log features or positioning of the cored
interval. Especially when core recovery is poor, this method is very useful in
tying the core fragments to true depths. Core plugs can also be measured,
although special equipment must be used to record the low levels of radiation
associated with the small samples. In general, property correlations to the
measured gamma ray levels are much better for cores than for the log
because of the depth averaging in the log. [5]

8/9/2019 Gamma Ray Logs
http://slidepdf.com/reader/full/gamma-ray-logs 28/31
pdfcrowd.comopen in browser PRO version Are you a developer? Try out the HTML to PDF API
Fig. 12 – A measured core gamma-ray profile vs. logged
data in a carbonate section. Comparison of peaks shows
the offset in measured depth (adapted from Core Labs
data).
Nomenclature
A = atomic weight
E = gamma ray energy
N = Avogadro’s number = 6.02 × 10 23 molecules/gram molecular
weight
V = volume of clean formation
V = volume of fluid
GR
A
cn
f
V = volume of a particular constituent (mineral or fluid) of a
formation
i

8/9/2019 Gamma Ray Logs
http://slidepdf.com/reader/full/gamma-ray-logs 29/31
pdfcrowd.comopen in browser PRO version Are you a developer? Try out the HTML to PDF API
formation
V = volume fraction of matrix mineral
V = volume of shale
Z = average atomic number
γ = gamma ray tool reading in API units
γ = gamma ray flux from 100% fluid
γ = gamma ray flux from 100% clean formation component
γ = gamma ray flux from 100% matrix
γ = gamma ray tool reading in nonshale
γ = gamma ray tool reading in 100% shale
ρ = bulk density
σ = Compton scattering cross section
Σ = capture cross section of i th formation component
Subscripts
GR = gamma ray
i = item count or index
References
1. ↑ Russell, W.L. 1944. The total gamma ray activity of
ma
sh
f
cn
ma
ns
sh
b
co
i
1.0 1.1
sedimentary rocks as indicated by Geiger counter determinations.
Geophysics 9 (2): 180 216 http://dx doi org/10 1190/1 1445076

8/9/2019 Gamma Ray Logs
http://slidepdf.com/reader/full/gamma-ray-logs 30/31
pdfcrowd.comopen in browser PRO version Are you a developer? Try out the HTML to PDF API
Geophysics 9 (2): 180-216. http://dx.doi.org/10.1190/1.1445076.
2. ↑ Bigelow, E.L. 1992. Introduction to Wireline Log Analysis.
Houston, Texas: Western Atlas International.
3. ↑ Tittmann, B.R., Clark, V.A., Richardson, J.M. et al. 1980. Possible
mechanism for seismic attenuation in rocks containing small amounts
of volatiles. Journal of Geophysical Research: Solid Earth 85 (B10):
5199-5208. http://dx.doi.org/10.1029/JB085iB10p05199.4. ↑ Katahara, K. 1995. Gamma Ray Log Response in
Shaly Sands. The Log Analyst 36 (4): 50.
5. ↑ Georgi, D.T., Bergren, P.A., and Devier, C.A. 1997. Plug
gamma ray: Key to formation evaluation. Poster presentation at the
1997 SCA International Symposium, Calgary, 8-10 September. SCA-
9732.
6. ↑ Wahl, J.S. 1983. Gamma-ray logging. Geophysics 48 (11): 1536-
1550. http://dx.doi.org/10.1190/1.1441436.
Noteworthy papers in OnePetro
Use this section to list papers in OnePetro that a reader who wants to learn
more should definitely read
External links
See also
Spectral gamma ray logs
Rock failure relationships
Nuclear log interpretation
2 .0 2 .1 2 .2
4.0 4 .1 4.2 4.3
5.0 5.1
Nuclear logging

8/9/2019 Gamma Ray Logs
http://slidepdf.com/reader/full/gamma-ray-logs 31/31
pdfcrowd.comopen in browser PRO version Are you a developer? Try out the HTML to PDF API
gg g
Nuclear logging while drilling
Density logging
PEH:Nuclear Logging
This page was last modified on 14 September 2013, at 21:04.
Privacy policy About Disclaimer Help
Copyright 2012-2014, Society of Petroleum Engineers