gamma-ray measurements of naturally occurring
TRANSCRIPT
*Corresponding author e-mail:[email protected], [email protected] © 2018 NSP
Natural Sciences Publishing Cor.
J. Rad. Nucl. Appl.3, No. 1, 23-31 (2018) 23
Journal of Radiation and Nuclear Applications An International Journal
http://dx.doi.org/10.18576/jrna/030103
Gamma-Ray Measurements of Naturally Occurring
Radionuclides and Resulting Dose Estimation in Soil Samples
Collected from District Chakwal, Pakistan
S. U. Rahman1, S. A. Mehdi2, Qazi Jahanzeb2, M. Rafique3,*, A. D. K. Tareen3, J. Iqbal3, Talat Iqbal4 and A.
Jabbar5
1Department of Medical Physics, Nuclear Medicine, Oncology and Radiotherapy Institute (NORI), Islamabad, Pakistan 2Federal Urdu University of Science, Arts & Technology (FUUSAT), Islamabad, Pakistan 3Department of Physics, University of Azad Jammu and Kashmir, Muzaffarabad, Azad Kashmir, Pakistan 4Centre for Earthquake Studies, National Centre for Physics, Islamabad, Pakistan 5Health Physics Division, PINSTECH, Nilore, Islamabad, Pakistan
Received: 16 Sep. 2017,Revised: 20 Dec. 2017, Accepted: 25 Dec. 2017.
Publishedonline: 1 Jan. 2018.
Abstract
Soil samples were collected from four tehsils of district Chakwal, Pakistan with an aim to measure naturally occurring
radio-nuclides in this region. Radioactivities of 226Ra, 232Th and 40K are measured using high purity germanium (HPGe)
based gamma ray spectrometry system. The measured mean specific activity concentrations of 226Ra, 232Th and 40K in the
soil samples was 34.27 ± 1.28, 51.59 ± 2.73 Bqkg-1 and 606.42 ± 21.23 Bqkg-1. From the measured activity concentrations
of soil samples, radium equivalent activity, external and internal hazard indices, terrestrial absorbed dose, gamma
representative Index, annual effective dose, annual gonadal dose equivalent, and estimated life time cancer risk were
calculated. Mean radium equivalent activity (Raeq), outdoor radiation hazard index (Hex), indoor radiation hazard index
(Hin), absorbed dose rate (D) and gamma representative Index (Iγ) for soil were found to be 155.02 ± 6.66 Bqkg-1 0.42 ±
0.2, 0.51 ± 0.2, 73.35 ± 2.69 nGyh-1and 1.15 ± 0.01 respectively. The calculated annual effective dose, annual gonadal
dose, and estimated life time cancer risk for soil samples were 0.13 ± 0.01 mSvy-1,512.78 ± 18.50 mSvy-1, and 0.47 x 10⁻³
respectively. Frequency distribution and activity concentration of measured radionuclides for all sampling sites are
presented. The geo statistical mapping was created to indicate the activity distribution in the studied area. On the basis of
measured activity and calculated values of hazards indices, it is concluded that the surveyed area is not a major source of
radiation hazards and do not pose any health problem.
Keywords:
HPGe gamma ray spectrometry, soil samples, health hazards, natural radionuclides, radium equivalent activity
1. Introduction Naturally occurring radioactive materials are present
everywhere on earth’s crust and their radioactivity may be
concentrated in certain area as a result of human activities.
Natural radiation at earth’s crust consists of two types
namely cosmic and terrestrial radiation. The latter
component originates from the primordial radioactive
compounds associated in the early stage of the formation of
the solar system is a major contributor. Uranium, thorium
and potassium are the main components contributing the
terrestrial radioactivity [1-5]. It is an established fact that
radioactivity in the soil adds to the background level of
radiation which directly effects human beings depending
upon the amount of generated activity. The level of
contribution to the background radiation depends on the
concentration of the radioactive materials in the
environmental media and may vary from area to area [5-9].
The naturally occurring radionuclides are present in soil act
as the major sources of external gamma-ray exposure. The
radio-nuclides get released into the environment through
several decay processes and reach the human body. The
concentration of these naturally occurring radio-nuclides in
any region and associated external exposure depends
primarily on the geological origin, environmental
parameters and geographical conditions of the region [10–14]. Exposure to human being due to naturally occurring
24 S. Rahman et al.Gamma-Ray measurments of naturally………..
© 2018NSP
Natural Sciences Publishing Cor.
radionuclides is an inevitable process because of their
presence in the earth’s crust, soil, air, food and water. It is
largely recognized that natural radiation are the major
source of public radiation exposure [15-17]. Therefore, it
is, necessary to measure the radiation levels in the
environment surrounding humans to make sure the
radiological safety of general public. The awareness about
naturally occurring radionuclides is valuable in order to set
the standards and national guidelines in the light of
international recommendations [18-23].
The aim of the present study is to determine the
radioactivity levels in soil samples of district Chakwal. In
order to assess the risks associated with exposure due to the
natural radioactivity, radium equivalent activity, indoor and
outdoor radiation hazard indices, gamma representative
index, absorbed dose rate, annual effective dose equivalent,
annual gonadal dose equivalent, and estimated lifetime
cancer risk were calculated for the studied area. This data
would help to decide whether the studied region has normal
or higher background radiation levels.
Table 1. Longitude, latitude and elevation of sampling sites
S.
No
Sampling
Site
Longitude Latitude Elevation
(m)
1 Naka
Kahoot
32o57′ N 72o29′ E 429
2 Adlakka 32o52′ N 72o23′ E 506
3 Dhaular 33o02′ N 72o18′ E 404
4 Akwal 33o02′ N 72o21′ E 475
5 Pachnand 32o53′ N 71o59′ E 413
6 DhokMach
ukhel
32o43′ N 71o57′ E 375
7 KotQazi 32O49′ N 72O00′ E 391
8 KotGulla 32o57′ N 71o54′ E 331
9 Mial 32o51′ N 72006′ E 411
10 Nara 32o37′ N 71o57′ E 474
11 Mankewali 32O41′ N 72O03′ E 519
12 Hawapura 32o47′ N 72o11′ E 562
13 Bhilomar 32o43′ N 72o26′ E 663
14 Chakhandi 32o50′ N 72o17′ E 535
15 Nikka
Rihan
33o00′ N 72o26′ E 434
16 DhokPatha
n
33o08′ N 72o20′ E 377
17 Patwali 33o02′ N 72o10′ E 378
18 Latti 32o 55′ N 72o04′ E 372
19 Khuhian
Village
33˚ 01′ N 72˚04′ E 359
20 DhokJand 33˚03′ N 71˚56′ E 256
21 Dhudail 33˚04′ N 72˚55′ E 501
22 Narang 33˚10′ N 72˚45′ E 357
23 Roopwal 33˚03′ N 72˚32′ E 445
24 Kurpal 32˚55′ N 73˚05′ E 418
25 ChakChak
ora
33˚07′ N 73˚19′ E 375
26 Thoha
Bahadur
32˚56′ N 72˚42′ E 536
27 Nurwal 32˚56′ N 72˚53′ E 519
28 Jamalwal 33˚04′ N 72˚47′ E 461
29 Ghanwal 32˚51′ N 73˚01′ E 478
30 Kotla 32˚59′ N 73˚03′ E 438
31 WahaliBal
a
32˚43′ N 73˚02′ E 797
32 Warwal 33˚08′ N 72˚31′ E 341
33 Bhaun 32˚52′ N 72˚46′ E 557
34 Noorpur 32˚39′ N 72˚34′ E 752
35 DhokMoch
ian
32˚48′ N 72˚34′ E 552
36 ChakKhus
hi
32˚46′ N 72˚46′ E 669
37 Sardhi 32˚41′ N 72˚42′ E 810
38 Bharpur 32o51′ N 72˚34′ E 557
39 Jhamrah 32o42′ N 72˚37′ E 808
40 Buchal
Kalan
32o41′ N 72˚38′ E 834
41 Katas 32˚43′ N 72˚57′ E 690
42 Dhok
Gujar
32˚45′ N 73˚11′ E 661
43 Kariala 32˚50′ N 72˚54′ E 534
44 Dandot 32˚39′ N 72˚57′ E 687
45 Saloi 32˚44′ N 73˚05′ E 693
2. Materials and Methods
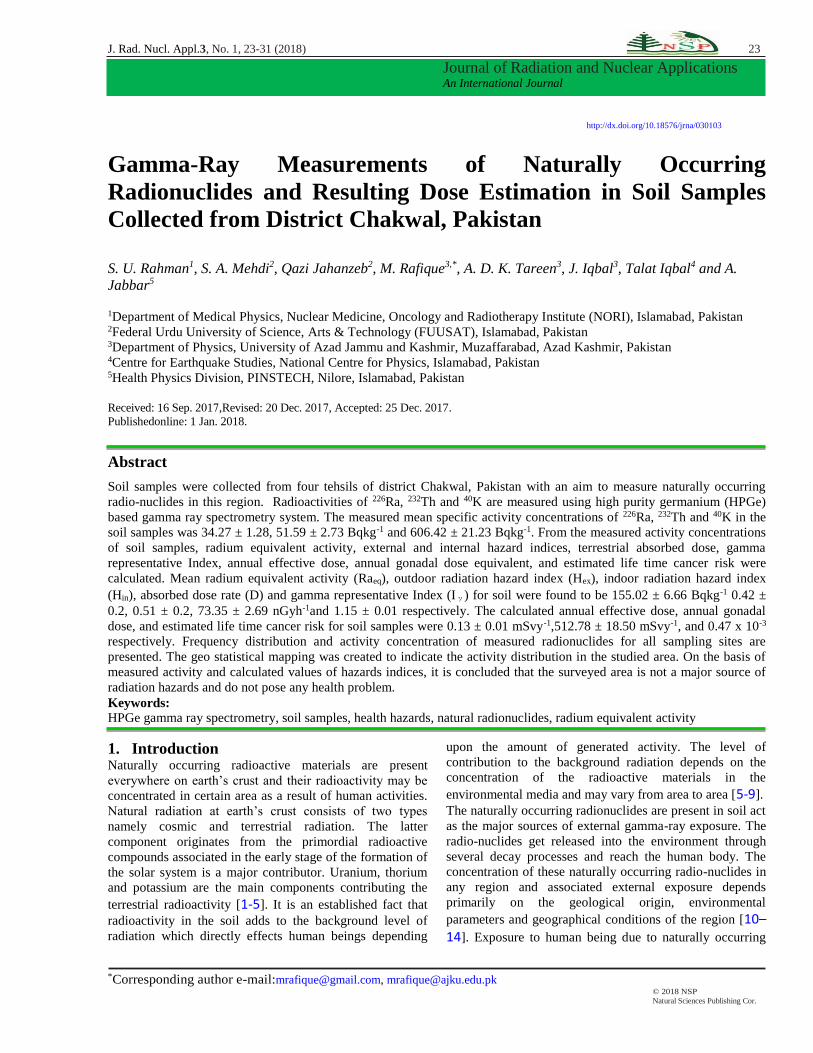
2.1. Study area Chakwal district comprised of four tehsils, namely,
Talagang, Chakwal, ChoaSaiden Shah and KallarKahar.
The studied area borders the districts of Rawalpindi and
Attock in the north, Jhelum in the east, Khushab in the
south and Mianwali in the west. The southern portion of the
district runs up into the Salt Range. Chakwal is a barani
district and the terrain is mainly hilly, covered with scrub
forest in the southwest, and levelled plains interspaced with
dry rocky patches in the north and northeast. The total area
of Ckakwal district is 6,524 km2.The sampling area is
shown in figure 1. A global positioning system was used to
record the coordinates of the sampling sites [4,5].The
longitude and latitude of the sampling locations ranged
from 32o37′ N to 33o51′ N and71˚56′ E to 73˚19′ E,
respectively. The sampling sites with longitude, latitude
and elevation of the studied region are shown in table 1.
Systematic soil sampling was carried out following the grid
of 15 × 15 km².
J. Rad. Nucl. Appl.3, No. 1, 23-31 (2018) / http://www.naturalspublishing.com/Journals.asp25
© 2018NSP
Natural Sciences Publishing Cor.
Figure 1. Sampling Sites
2.2. Sample Collection A total of 45 samples were collected from different
locations of four tehsils of District Chakwal. The sampling
sites were selected to be relatively flat, undisturbed and
situated sufficiently away from the public road and
buildings. The samples were collected from the upper 4-6
cm layer with a coring tool. These soil samples were
gathered from different adjacent sites and combined to
make a single representative sample. The samples were
packed in specially designed polyethylene bags and sealed
properly. The collected samples were marked with date,
sampling site for later identification and brought to the
laboratory for processing before analysis [4,5].
2.3. Sample preparation For activity measurements, the samples were dried at room
temperature for few days under a controlled environment.
The samples were then oven dried at 150 0C until the
moisture of the samples removed and the sample weight
became constant. The dried samples were crushed,
powdered and passed through sieve having 2mm mesh size.
The homogenized samples having weight of 200 g were
then sealed in plastic containers. The geometrical
dimensions of these samples were kept identical as that of
reference material, described by the calibration requirement
[4,5,9]. The samples were sealed hermetically and stored for
more than 40 days for establishment of secular equilibrium
between 226Ra and its short lived decay products.
2.4.Gamma Spectrometry To determine the concentration of 238U, 232Th and 40K, a
high resolution gamma-ray spectrometer consisting of
HPGe detector (Model GC 3020 Canberra) coupled to PC
based MCA card was used. The relative efficiency of the
detector was 30% and the resolution 2.23 keV at 1332
gamma-rays of 60Co. The used detector was equipped with
8192-channels and it was shielded in 8 cm lead chamber
with an inner lining of 0.5 cm thick copper plate to reduce
the background. The results were analyzed by using Geni-
2000 software. Efficiency calibration of the detection
system was evaluated with Soil-327 which was obtained
from IAEA. The samples were counted for 65000 seconds. 40K was analyzed by its single peak of 1460 keV. However,
the analysis of 238U and 232Th was based upon the peaks of
progeny in equilibrium with their parent radionuclides
[10,13].
3. Results and Discussion
The activity of 226Ra, 232Th and 40K in the soil samples have
been measured by High Purity Germanium (HPGe) detector
and the correspondence results are shown in table 2.
Table 2. Measured radioactive concentrations of 226Ra, 232Th and 40K in soil samples
No
of S
Tehsil Range 226Ra
(Bq/kg)
232Th
(Bq/kg)
40K
(Bq/kg)
20
Talagang
Min 20.02
± 1.13
33.67
± 2.28
371.77
± 18.18
Max 42.09
± 1.29
65.30
± 2.49
635.80
± 19.60
Mean 31.10
± 1.17
47.47
± 2.35
548.97
± 18.50
12
Chakwal
Min 27.90
± 1.23
41.68
± 2.16
583.78
± 22.22
Max 45.79
± 1.41
65.32
± 3.22
797.07
± 27.04
Mean 36.73
± 1.25
53.88
± 2.65
674.63
± 25.67
08
KalarKa
har
Min 16.50
± 1.13
15.45
± 2.81
93.32 ±
21.71
Max 50.74
± 1.41
79.89
± 3.41
764.40
± 25.33
Mean 33.63
± 1.71
53.90
± 3.05
613.87
± 22.51
05
ChoaSai
dian
Shah
Min 33.19
± 1.36
47.25
± 3.15
643.25
± 22.34
Max 53.51
± 1.35
67.43
± 3.42
686.26
± 21.65
Mean 42.50
± 1.54
60.63
± 3.29
660.56
± 22.15
Overall
mean
34.27
± 1.28
51.79
± 2.73
606.42
± 21.23
The maximum and minimum activity of 226Ra has been
found 53.51 ± 1.35 Bqkg-1 in Katas and 16.50 ± 1.13 Bqkg-
1 in Noorpur, respectively. The mean radioactivity of 226Ra
in the study area is 34.27 ± 1.28 Bqkg-1, which is less than
the world average value of 50 Bqkg-1 [22]. Minimum 232Th
activity (15.45 ± 2.81 Bqkg-1) measured in Noorpur and
maximum activity (79.89 ± 3.41 Bqkg-1) with mean value
of 51.79 ± 2.73 Bqkg-1, while the world average activity for
the same is 50 Bqkg-1 [22].
The maximum and minimum activity of 40K found to be
797.07 ± 27.04 Bqkg-1 in Dhudail and 93.32 ± 21.71 Bqkg-1
in Noorpur, respectively. The mean radioactivity of 40K in
the study area is 606.42 ± 21.23 Bqkg-1 and it is higher than
the mean value of the world 500 Bqkg-1 [22]. In present
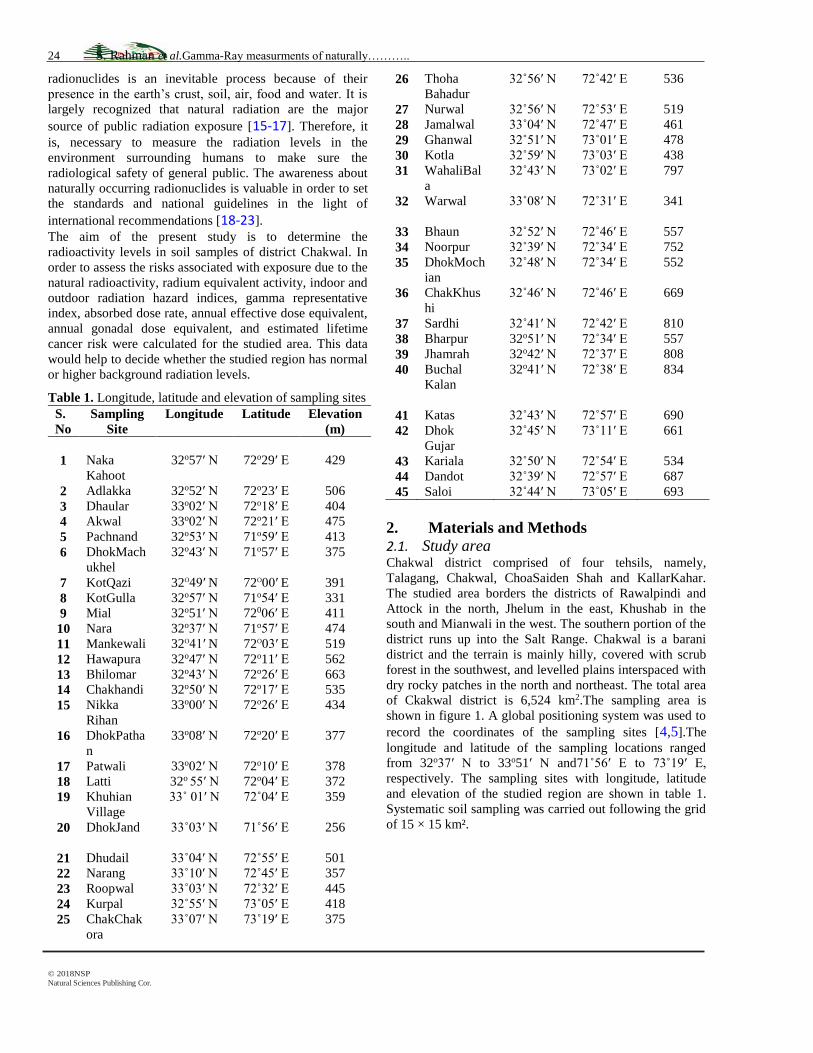
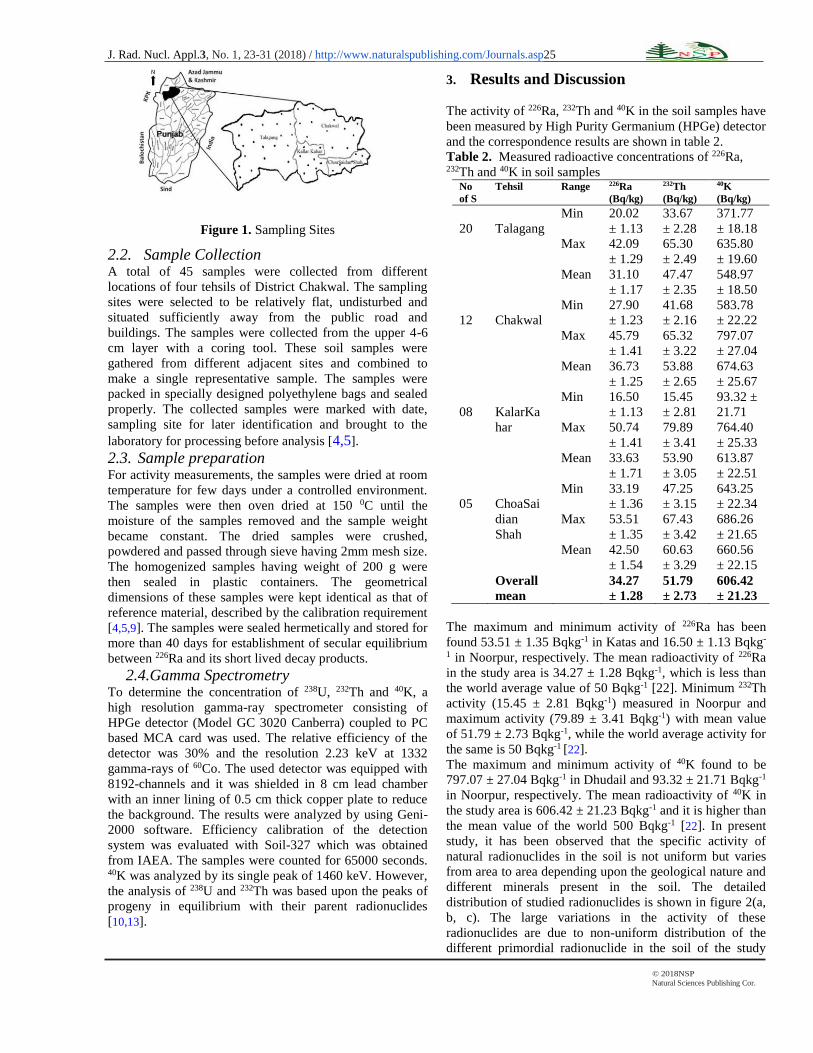
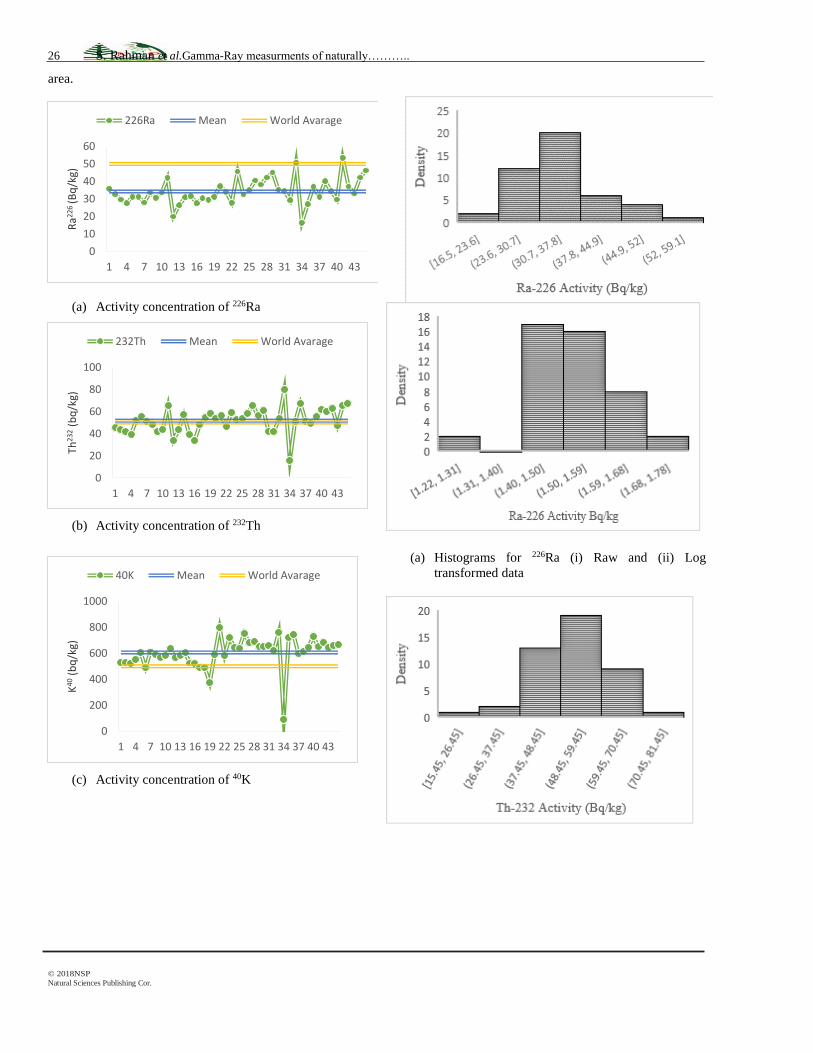
study, it has been observed that the specific activity of
natural radionuclides in the soil is not uniform but varies
from area to area depending upon the geological nature and
different minerals present in the soil. The detailed
distribution of studied radionuclides is shown in figure 2(a,
b, c). The large variations in the activity of these
radionuclides are due to non-uniform distribution of the
different primordial radionuclide in the soil of the study
26 S. Rahman et al.Gamma-Ray measurments of naturally………..
© 2018NSP
Natural Sciences Publishing Cor.
area.
(a) Activity concentration of 226Ra
(b) Activity concentration of 232Th
(c) Activity concentration of 40K
(a) Histograms for 226Ra (i) Raw and (ii) Log
transformed data
0
10
20
30
40
50
60
1 4 7 10 13 16 19 22 25 28 31 34 37 40 43
Ra22
6 (B
q/k
g)
226Ra Mean World Avarage
0
20
40
60
80
100
1 4 7 10 13 16 19 22 25 28 31 34 37 40 43
Th23
2(b
q/k
g)
232Th Mean World Avarage
0
200
400
600
800
1000
1 4 7 10 13 16 19 22 25 28 31 34 37 40 43
K40
(bq
/kg)
40K Mean World Avarage
J. Rad. Nucl. Appl.3, No. 1, 23-31 (2018) / http://www.naturalspublishing.com/Journals.asp27
© 2018NSP
Natural Sciences Publishing Cor.
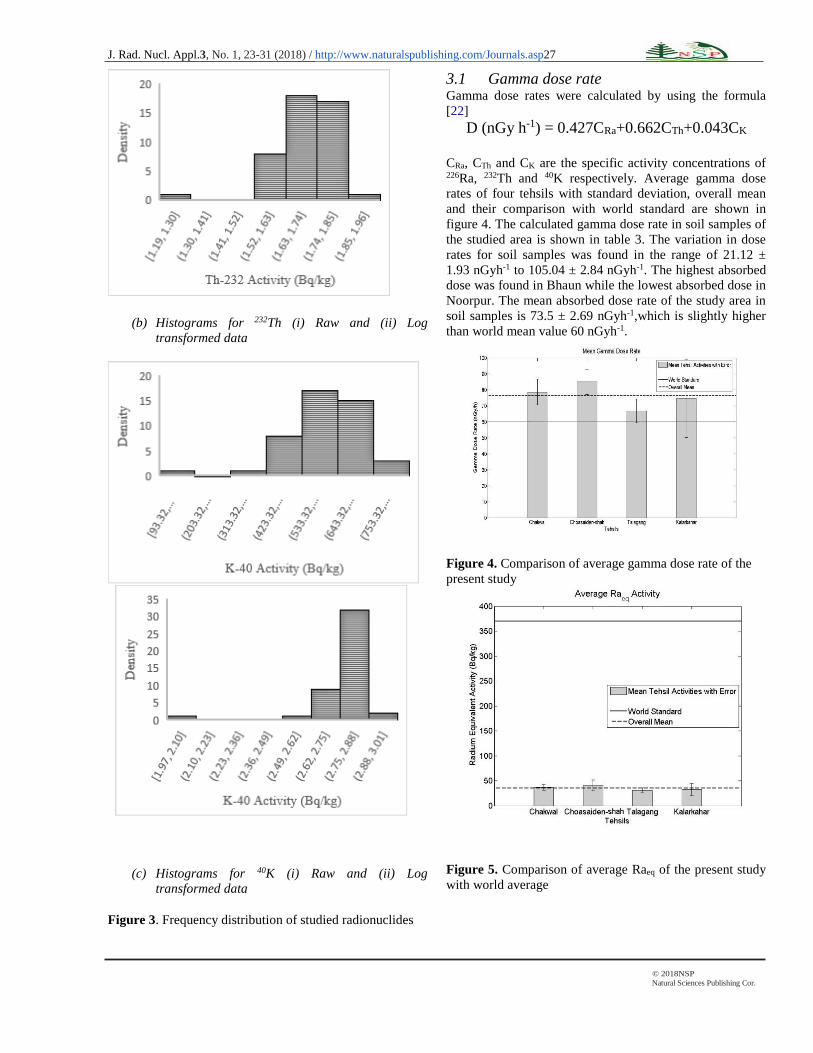
(b) Histograms for 232Th (i) Raw and (ii) Log
transformed data
(c) Histograms for 40K (i) Raw and (ii) Log
transformed data
Figure 3. Frequency distribution of studied radionuclides
3.1 Gamma dose rate Gamma dose rates were calculated by using the formula
[22]
D (nGy h-1) = 0.427CRa+0.662CTh+0.043CK
CRa, CTh and CK are the specific activity concentrations of 226Ra, 232Th and 40K respectively. Average gamma dose
rates of four tehsils with standard deviation, overall mean
and their comparison with world standard are shown in
figure 4. The calculated gamma dose rate in soil samples of
the studied area is shown in table 3. The variation in dose
rates for soil samples was found in the range of 21.12 ±
1.93 nGyh-1 to 105.04 ± 2.84 nGyh-1. The highest absorbed
dose was found in Bhaun while the lowest absorbed dose in
Noorpur. The mean absorbed dose rate of the study area in
soil samples is 73.5 ± 2.69 nGyh-1,which is slightly higher
than world mean value 60 nGyh-1.
Figure 4. Comparison of average gamma dose rate of the
present study
Figure 5. Comparison of average Raeq of the present study
with world average

28 S. Rahman et al.Gamma-Ray measurments of naturally………..
© 2018NSP
Natural Sciences Publishing Cor.
3.2 Radium equivalent activity Radium equivalent activity (Raeq) is defined to compare the
specific activity of materials containing different amounts
of 226Ra, 232Th and 40K using the equation.
Raeq= ARa+ 1.43ATh+0.077AK
In the above equation ARa, ATh and AK are the mean
activities of 226Ra, 232Th and 40Kin Bqkg−1,
respectively.Average radium equivalent activity of the
present study and its comparison with world standard is
shown in figure 5. It is clear from the figure 5 that Raeq is
significantly below the world average. Radium equivalent
activity calculated for different soil samples investigated in
the present study are given in table 3. Radium equivalent
activity varied from 45.78 ± 6.67 Bqkg-1 to 223.84 ± 8.08
Bqkg-1 in the studied area. The mean radium equivalent
activity of the soil samples found to be 155.02 ± 6.60 Bqkg-
1.
3.3 External and internal hazard indices The internal and external hazard indices are calculated by
using the following expressions
Hex = ARa/370 + ATh/259 + AK/4810
Hin = ARa/185 + ATh/259 + AK/4810
In the above equations ARa, ATh and AK are the activities of 226Ra, 232Th and 40K in Bqkg-1,respectively. Average
internal and external hazard indices of the present study and
their comparison with world standard are shown in figure 6.
The calculated Hex for soil samples varies from 0.12 ± 0.02
to 0.60 ± 0.02 with mean value 0.42 ± 0.2 and is less than
world mean value 0.5.
Figure 6. Comparison of hazard indices and gamma
Table 3. Calculated radiological parameters on the basis of measured data
No of
samples
Tehsils Range Raeq D Hin Hex Iγ AEDE AGDE ELCR
20
Talagang
Min 111.82
± 5.73
53.84 ±
2.64
0.36 ±
0.2
0.30
± 0.2
0.85 ±
0.01
0.10 ±
0.01
380.5 ±
19.82
0.35
Max 184.43
± 6.36
86.60 ±
2.92
0.61 ±
0.2
0.50±
0.2
1.36 ±
0.01
0.16 ±
0.01
602.6 ±
22.36
0.56
Mean 141.26
± 7.01
66.81 ±
1.97
0.47 ±
0.2
0.38±
0.2
1.05 ±
0.01
0.12 ±
0.01
466.92 ±
17.35
0.43
12
Chakwal
Min 139.46
± 5.99
66.22 ±
2.84
0.45 ±
0.2
0.38±
0.2
1.04 ±
0.01
0.12 ±
0.01
464.22 ±
16.92
0.43
Max 185.68
± 7.39
87.93 ±
2.53
0.63 ±
0.2
0.50±
0.2
1.38 ±
0.01
0.16 ±
0.01
614.46 ±
20.55
0.57
Mean 165.73
± 6.21
78.64 ±
3.14
0.55 ±
0.2
0.45±
0.2
1.23 ±
0.01
0.14 ±
0.01
550.58 ±
21.41
0.51
08
KalarKahar
Min 45.78 ±
6.67
21.12 ±
1.93
0.17 ±
0.2
0.12±
0.2
0.33 ±
0.01
0.04 ±
0.01
144.87 ±
15.97
0.14
Max 223.84
± 8.08
105.04
± 2.84
0.74 ±
0.2
0.60±
0.2
1.65 ±
0.01
0.19 ±
0.01
730.75 ±
28.01
0.68
Mean 157.70
± 6.98
74.56 ±
2.56
0.52 ±
0.2
0.43±
0.2
1.17 ±
0.01
0.14 ±
0.01
521.14 ±
21.22
0.48
05
ChoaSaidan
Shah
Min 150.29
± 6.66
71.56 ±
2.41
0.50 ±
0.2
0.41±
0.2
1.12 ±
0.01
0.13 ±
0.01
502.04 ±
21.13
0.46
Max 193.94
± 8.01
91.09 ±
2.69
0.66 ±
0.2
0.52±
0.2
1.43 ±
0.01
0.17 ±
0.01
633.80 ±
24.15
0.59
Mean 180.06
± 8.51
84.91 ±
3.03
0.60 ±
0.2
0.49±
0.2
1.33 ±
0.01
0.16 ±
0.01
592.17 ±
19.33
0.55
45
Overall
mean
Min 45.78 ±
6.67
21.12 ±
1.93
0.17 ±
0.2
0.12±
0.2
0.33 ±
0.01
0.04 ±
0.01
144.87 ±
15.97
0.14
Max 223.84
± 8.08
105.04±
2.84
0.74 ±
0.2
0.60±
0.2
1.65 ±
0.01
0.19 ±
0.01
730.75 ±
28.01
0.68
Mean 155.02
± 6.66
73.35 ±
2.69
0.51 ±
0.2
0.42±
0.2
1.15 ±
0.01
0.13 ±
0.01
512.7 ±
18.50
0.47
J. Rad. Nucl. Appl.3, No. 1, 23-31 (2018) / http://www.naturalspublishing.com/Journals.asp29
© 2018NSP
Natural Sciences Publishing Cor.
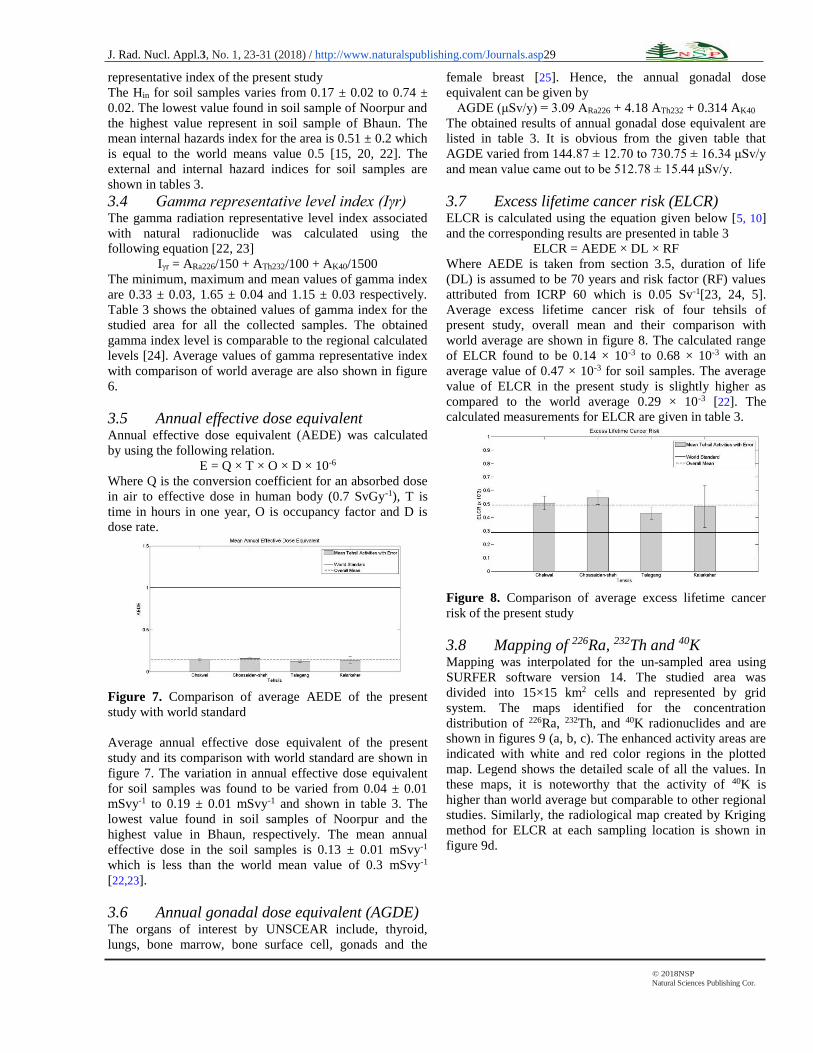
representative index of the present study
The Hin for soil samples varies from 0.17 ± 0.02 to 0.74 ±
0.02. The lowest value found in soil sample of Noorpur and
the highest value represent in soil sample of Bhaun. The
mean internal hazards index for the area is 0.51 ± 0.2 which
is equal to the world means value 0.5 [15, 20, 22]. The
external and internal hazard indices for soil samples are
shown in tables 3.
3.4 Gamma representative level index (Iγr) The gamma radiation representative level index associated
with natural radionuclide was calculated using the
following equation [22, 23]
Iγr = ARa226/150 + ATh232/100 + AK40/1500
The minimum, maximum and mean values of gamma index
are 0.33 ± 0.03, 1.65 ± 0.04 and 1.15 ± 0.03 respectively.
Table 3 shows the obtained values of gamma index for the
studied area for all the collected samples. The obtained
gamma index level is comparable to the regional calculated
levels [24]. Average values of gamma representative index
with comparison of world average are also shown in figure
6.
3.5 Annual effective dose equivalent Annual effective dose equivalent (AEDE) was calculated
by using the following relation.
E = Q × T × O × D × 10-6
Where Q is the conversion coefficient for an absorbed dose
in air to effective dose in human body (0.7 SvGy-1), T is
time in hours in one year, O is occupancy factor and D is
dose rate.
Figure 7. Comparison of average AEDE of the present
study with world standard
Average annual effective dose equivalent of the present
study and its comparison with world standard are shown in
figure 7. The variation in annual effective dose equivalent
for soil samples was found to be varied from 0.04 ± 0.01
mSvy-1 to 0.19 ± 0.01 mSvy-1 and shown in table 3. The
lowest value found in soil samples of Noorpur and the
highest value in Bhaun, respectively. The mean annual
effective dose in the soil samples is 0.13 ± 0.01 mSvy-1
which is less than the world mean value of 0.3 mSvy-1
[22,23].
3.6 Annual gonadal dose equivalent (AGDE) The organs of interest by UNSCEAR include, thyroid,
lungs, bone marrow, bone surface cell, gonads and the
female breast [25]. Hence, the annual gonadal dose
equivalent can be given by
AGDE (μSv/y) = 3.09 ARa226 + 4.18 ATh232 + 0.314 AK40
The obtained results of annual gonadal dose equivalent are
listed in table 3. It is obvious from the given table that
AGDE varied from 144.87 ± 12.70 to 730.75 ± 16.34 μSv/y
and mean value came out to be 512.78 ± 15.44 μSv/y.
3.7 Excess lifetime cancer risk (ELCR) ELCR is calculated using the equation given below [5, 10]
and the corresponding results are presented in table 3
ELCR = AEDE × DL × RF
Where AEDE is taken from section 3.5, duration of life
(DL) is assumed to be 70 years and risk factor (RF) values
attributed from ICRP 60 which is 0.05 Sv-1[23, 24, 5].
Average excess lifetime cancer risk of four tehsils of
present study, overall mean and their comparison with
world average are shown in figure 8. The calculated range
of ELCR found to be 0.14 × 10⁻³ to 0.68 × 10⁻³ with an
average value of 0.47 × 10⁻³ for soil samples. The average
value of ELCR in the present study is slightly higher as
compared to the world average 0.29 × 10⁻³ [22]. The
calculated measurements for ELCR are given in table 3.
Figure 8. Comparison of average excess lifetime cancer
risk of the present study
3.8 Mapping of 226Ra, 232Th and 40K Mapping was interpolated for the un-sampled area using
SURFER software version 14. The studied area was
divided into 15×15 km2 cells and represented by grid
system. The maps identified for the concentration
distribution of 226Ra, 232Th, and 40K radionuclides and are
shown in figures 9 (a, b, c). The enhanced activity areas are
indicated with white and red color regions in the plotted
map. Legend shows the detailed scale of all the values. In
these maps, it is noteworthy that the activity of 40K is
higher than world average but comparable to other regional
studies. Similarly, the radiological map created by Kriging
method for ELCR at each sampling location is shown in
figure 9d.

30 S. Rahman et al.Gamma-Ray measurments of naturally………..
© 2018NSP
Natural Sciences Publishing Cor.
(a) Contour Map for Ra226
(b) Contour Map for Th232
(c) Contour Map for K40
(d) Contour Map for ELCR
Figure 9. Contour maps for activity concentrations of
226Ra, 232Th, 40K and ELCR
4 Conclusions The study is conducted in four tehsils of District Chakwal,
Pakistan to investigate the concentrations of naturally
occurring radionuclides using gamma spectrometry
technique. The soil samples analyzed in the present study
shows 226Ra activity ranging from 16.50 ± 1.13Bqkg-1 to
53.51 ± 1.35 Bqkg-1. The activity of 232Th varies from 15.45
± 2.81 Bqkg-1 to 79.89 ± 2.49 Bqkg-1 and 40K activity in
soil samples ranged from 93.32 ± 21.71 Bqkg-1 to 797.07 ±
27.04 Bqkg-1. The calculated mean radium equivalent
activity was 155.02 ± 6.66 Bqkg-1. The mean value of
external and internal radiation hazard indices was found
0.42 and 0.51 in the present study. The mean gamma
representative index and absorbed dose rate were calculated
and came out to be 1.15 ± 0.01 and 73.35 ± 2.69 nGyh-1.
The annual effective dose, annual gonadal dose, and
estimated life time cancer risk for soil samples were 0.13 ±
0.01 mSvy-1,512.78 ± 18.50 mSvy-1, and 0.47 x 10⁻³
respectively. The measured concentration of radionuclides
and calculated radiological parameters shows that the study
area, do not pose any significant radiation hazard to the
inhabitants of the studied area.
References 1. A. Jabbar, W. Arshed, A.S. Bhatti, S.S. Ahmad, P.
Akhter, S.URehman and M.I Anjum. Measurement of
soil radioactivity levels and radiation hazard
assessment in southern Rechnainterfluvial region,
Pakistan. Environ. Monit. Assess 169 (1-4),429 (2010).
2. N. Akhtar, M. Tufail, M.A. Choudhry, S.D. Orfi, M.
Waqas. Radiation dose from natural and manmade
radionuclides in the soil of NIAB, Faisalabad,
Pakistan. The Nucleus, 41 (1-4), 27 (2004).
3. S.U. Rahman, M. Faheem, J. Anwar, M. Ziafat, T.
Nasirand Matiullah. External dose assessment from the
measured radioactivity in soil samples collected from
the Islamabad capital territory, Pakistan. J. Radiol.
Prot29, 499 (2009).
4. A. Jabbar, W. Arshed, A.S. Bhatti, S.S. Ahmad, S.I.
Rehman and M. Dilband, Measurement of soil
radioactivity levels and radiation hazard assessment in
mid Rechnainterfluvial region, Pakistan. J. Radioanal.
Nucl. Chem. 283, 371 (2010).
5. S.U. Rahman. Measurement of indoor radon levels,
natural radioactivity and lung cancer risks estimation.
PhD thesis (2010).
6. N. Ahmed, Matiullah, A.J.A. Hussein. Determination
of natural radioactivity in Jordanian soil and building
materials and the associated radiation hazards. J.
Environ. Radioact. 39, 9 (1998).
7. B.N. Hamid, M.I. Chowdhury, M.N. Alam, M.N.
Islam. Study of natural radionuclide concentrations in
J. Rad. Nucl. Appl.3, No. 1, 23-31 (2018) / http://www.naturalspublishing.com/Journals.asp31
© 2018NSP
Natural Sciences Publishing Cor.
an area of elevated radiation background in the
northern districts of Bangladesh. Radiat. Prot. Dosim.
98, 227 (2002).
8. M. Faheem, S.A. Mujahid, Matiullah. Assessment of
radiological hazards due to the natural radioactivity in
soil and building material samples collected from six
districts of the Punjab province-Pakistan. Radiat. Meas.
43, 1443 (2008).
9. K. Khan,P. Akhter, and S. D. Orfi, Estimation of
radiation doses associated with natural radioactivity in
sand samples of the north western areas of Pakistan
using Monte Carlo simulation J. Radioanal. Nucl.
Chem. 265(3), 371 (2005).
10. S.U. Rahman, Matiullah, F. Malik, M. Rafique, J.
Anwar, M. Ziafat and A. Jabbar. Measurement of
naturally occurring/fallout radioactive elements and
assessment of annual effective dose in soil samples
collected from four districts of the Punjab Province
Pakistan. J. Radioanal. Nucl. Chem. 287, 647 (2011).
11. S. Singh, A. Rani, R.K. Mahajan. 226Ra, 232Th and 40K
analysis in soil samples from some areas of Punjab and
Himachal Pradesh, India using gamma ray
spectrometry. Radiat. Meas. 39, 431 (2005).
12. A. Jabbar, A.S. Bhatti, S.S. Ahmad, W. Arshed and P.
Akhter. Assessment of environmental gamma dose in
northern Rechna Doab, Pakistan. Nuc. Technol. Radiat.
Prot. 1, 56 (2009).
13. H. M. Khan, M. Ismail,K. Khan,P. Akhter.
Radioactivity Levels and Gamma-Ray Dose Rate in
Soil Samples from Kohistan (Pakistan) Using Gamma-
Ray Spectrometry. Chin. Phys. Lett. 28(1), 019301
(2011).
14. S. Rahman, Matiullah, S.A. Mujahid, S. Hussain.
Assessment of the radiological hazards due to naturally
occurring radionuclides in soil samples collected from
the north western areas of Pakistan. Radiat. Prot.
Dosim. 128, 191 (2008).
15. M. Rafique, H. Rehman, Matiullah, F. Malik, M.U.
Rajput, S.U. Rahman and M.H. Rathore. Assessment
of radiological hazards due to soil and building
materials used in Mirpur Azad Kashmir; Pakistan. Iran.
J. Radiat. Res. 9(2), 77 (2011).
16. S.U. Rahman and M. Rafique.226Ra, 232Th and 40K
activities and associated radiological hazards in
building materials of Islamabad Capital Territory,
Pakistan. Nuc. Technol. Radiat. Prot. 27(4), 392
(2012).
17. S. Singh, B. Singh, A. Kumar. Natural radioactivity
measurements in soil samples from Hamirpur district,
Himachal Pradesh, India. Radiat. Meas. 36, 547
(2003).
18. I. Fatima, J.H. Zaidi, M. Arif, M. Daud, S.A. Ahmad,
S.N.A. Tahir. Measurement of Natural Radioactivity
and Dose Rate Assessment of Terrestrial Gamma
Radiation in the Soil of Southern Punjab. Radiat. Prot.
Dosim. 128(2), 206 (2008).
19. M. Rafique, A. Jabbar, A.R. Khan, S.U. Rahman,M.
Bashrat, A. Mehmood and Matiullah. Radiometric
Analysis of Rock and Soil samples of Leepa Valley;
Azad Kashmir, Pakistan. J. Radioanal. Nucl. Chem.
298, 2049 (2013).
20. N. Akhtar, M. Tufail, M. Ashraf, and M.M. Iqbal.
Measurement of environmental radioactivity for
estimation of radiation exposure from saline soil of
Lahore, Pakistan. Radiat. Meas. 39, 11 (2005).
21. N.M. Antovic, N. Svrkota, I. Antovic, R. Svrkota, D.
Jancic. Radioactivity in Montenegro beach sands and
assessment of the corresponding environmental risk.
Isot. Environ. Health Stud. 49(2), 153 (2013).
22. UNSCEAR, Sources and effects of ionizing radiation,
United Nations Scientific Committee on the effects of
atomic radiation, New York, UN, (2000).
23. European Commission, Report on radiological
protection principle concerning the natural
radioactivity of building materials (Directorate-General
Environment, Nuclear safety and civil protection)
Radiation Protection 112 (1999).
24. ICRP, International Commission on Radiological
Protection. ICRP Publication 60. Annals of
ICRP,Pergamon press, Oxford (1990).
25. UNSCEAR, Sources and effects of ionizing radiation,
United Nations Scientific Committee on the effects of
atomic radiation, New York, UN, (2010).