gap analysis cz
TRANSCRIPT
7/27/2019 GAP Analysis CZ
http://slidepdf.com/reader/full/gap-analysis-cz 1/51
JEREMIE
JO I N T EUROPEAN RESOURCES FOR
M I CRO - TO -MED I UM ENTERPR I SES
SM E A c c e s s t o F in a n c e i n Cz e c h
R e p u b l i c
EVALUATION STUDY
October 2007
This document has been produced with the financial assistance of theEuropean Union. The views expressed herein can in no way be taken to
reflect the official opinion of the European Union.

7/27/2019 GAP Analysis CZ
http://slidepdf.com/reader/full/gap-analysis-cz 2/51
2
Table of Contents
1. EXECUTIVE SUMMARY .......................................................................3
1.1. Statement of Position .................................................................... 3
1.2. Major Market Failures & Recommended Actions ................................. 3 1.3. Strategic Priorities and Policies........................................................ 4
1.4. Why JEREMIE ............................................................................... 5
2. BACKGROUND INFORMATION ...........................................................7
2.1. Characteristics of the Economy and Demographics............................. 7
2.2. SME Characteristics and Environment ............................................ 10
2.3. Regional Characteristics ............................................................... 12
2.4. SME-Supporting Institutions & Programmes.................................... 14
3. SUPPLY AND DEMAND ANALYSIS – MARKET FAILURES AND
RECOMMENDATIONS.......................................................................20
3.1. Methodological Framework ........................................................... 20
3.2. Micro Finance ............................................................................. 21
3.3. Debt Financing ........................................................................... 24
3.4. Leasing...................................................................................... 28
3.5. Factoring ................................................................................... 29
3.6. Venture Capital (VC) ................................................................... 30
3.7. Technology Transfer .................................................................... 36
3.8. Business Angels.......................................................................... 40
4. NEXT STEPS.....................................................................................43
4.1. Proposed Actions and Responsibilities ............................................ 43
4.2. Conclusions on the Role of JEREMIE............................................... 44
5. ANNEXES.........................................................................................45
5.1. Charts and Tables Supporting Chapter 1 and 2 ................................ 45
5.2. Charts and Tables Supporting Chapter 3......................................... 48
5.3. Historical Use of EU Pre-Accession and Structural Funds ................... 50

7/27/2019 GAP Analysis CZ
http://slidepdf.com/reader/full/gap-analysis-cz 3/51

7/27/2019 GAP Analysis CZ
http://slidepdf.com/reader/full/gap-analysis-cz 4/51
4
Details of the supply and demand analysis of each financial instrument evidencing thesemarket failures and the JEREMIE proposals are given in chapter 3 of this study. After apositive decision of the Czech Government on the implementation of JEREMIE incooperation with EIF, in-depth discussions with key market players in the debt and equitysector are envisaged during the preparation of the implementation phase. Given the
flexibility of the JEREMIE structure, these instruments can be further developed andadapted and new instruments can be introduced, in line with market developments inCzech Republic in the coming years, in order to best correspond to the needs of the SMEsand thus strengthen the Czech economy.
1.3. Strategic Priorities and Policies
For the period 2007-2013, the Czech Republic has been allocated € 26.7 billion of EUStructural Funds in total, € 25.9 billion under the Convergence objective, € 0.4 billionunder the Regional Competitiveness and Employment objective, and € 0.4 billion underthe European Territorial Cooperation objective. Czech Republic’s contribution tocomplement the EU investment under the National Strategic Framework will be 4.6 billioneuros over 7 years. Central Bohemia, Central Moravia, Moravi Silesia, Southwest,Southeast, Northwest and Northeast regions fall under the Convergence objective, whilethe Prague region is the only one falling under the Regional Competitiveness andEmployment objective.
As laid down in the Czech National Strategic Reference Framework (NSRF), one of thepriorities on which the EU funding should focus during the coming years is enhancing thecompetitiveness of the Czech economy. The Czech Operational Programme “Enterprise &Innovation” (OPEI)1 is the main programming document for the realisation of the policy
for economic and social cohesion in the industry sector and an important tool for therealisation of the strategy for the development of small and medium-sized enterprises(SMEs) for the period 2007-2013 approved by the Government of the Czech Republic. Itbuilds on the Operational Programme Industry and Enterprise (OPIE) which ran between2004-2006 following the Czech Republic’s EU accession. The OPEI has been compiled inthe context of the main strategic documents of the Czech Republic (Economic GrowthStrategy, Strategy of Regional Development, Sustainable Growth Strategy, NationalInnovational Policy, etc).
An important goal of the OPEI – in compliance with the NSRF and the NDP – is theimprovement of the entrepreneurial environment in the Czech Republic as one of the key
elements of the future successful development of the Czech economy. A dynamicentrepreneurial environment creates conditions for successful start-ups and developmentof competitive firms that create new jobs and strengthen economic and social cohesion.Czech businesses still fall short of the EU countries in terms of quality, equipment,efficiency and innovation. The OPEI aims to amend this situation by increasingcompetitiveness of industry and service sectors, developing enterprises, maintaining andincreasing the attractiveness of the Czech Republic for investors, supporting innovation,stimulating demand for R&D results, commercialising R&D outputs, supportingdevelopment of an entrepreneurial culture and growing knowledge-based economythrough the development of new technologies and innovative products.
1 Version November 2007; Managing Authority: Czech Ministry of Industry & Trade”

7/27/2019 GAP Analysis CZ
http://slidepdf.com/reader/full/gap-analysis-cz 5/51
5
The overall financial framework of OPEI lies at about EUR 3.578 bn, of which approx.EUR 3.041 to be financed out of ERDF (European Regional Development Fund) with anational co-financing rate of 15%. It includes measures under the following Priority Axis:
• Establishment of enterprises (total resources of approx. EUR 93 m)
• Development of enterprises (total resources of approx. 780 m)
• Effective energy (total resources of approx. EUR 286 m)• Innovation (total resources of approx. EUR 800 m)
• Environment for enterprise & innovation (total resources of approx.EUR 1,267 m)
• Business development services (total resources of approx. EUR 247 m)
• Technical assistance (total resources of approx. EUR 105 m)
Apart from OPEI, there are different others OP setting the strategic framework formeasures financed out of ERDF, ESF (European Social Fund) and Cohesion Fundallocations for Czech Republic on national and regional level. Seven regional OPs will beadministrated by regional authorities to target specific regional problems, focussing on
supporting businesses in the field of tourism and development of business infrastructure.
1.4. Why JEREMIE
The contribution that SMEs deliver to the EU economy is well documented. Across the EU,Member States appreciate this fact and have focused many policy initiatives at thissector. This is further recognised in a communication by the European Commissionstating that ‘the partnership for growth and jobs depends on Europe’s SMEs achievingtheir potential, as they prove to be crucial in fostering the entrepreneurship, competitionand innovation that leads to sustainable growth and development.’ Recent data shows
that Europe needs to work on the availability of risk capital to SMEs with high growthpotential. After a decrease from EUR 4.2 bn in 2001 as a result of the bursting of thetechnology bubble, European venture capital investment in early stage firms hasstagnated at around EUR 2 bn. A 2004 survey has shown that 14% of the 23 m SMEsregistered in the European Union need better access to finance.
It is for these reasons that the European Commission has created two main EUinstruments to promote entrepreneurship and innovation, and to improve SMEs’ accessto finance, being the Competitiveness and Innovation Framework Programme (CIP) andthe Joint European Resources for Micro to Medium Enterprises (JEREMIE), the latter to befinanced out of the EU Structural Funds 2007-2013. The future of European
competitiveness depends on an integrated, open, and competitive financial market thatcovers risk capital and debt finance instruments and as part of the JEREMIE initiative, theEuropean Investment Fund (EIF) has been asked to evaluate the specific needs of eachEU market to identify market failures and to propose a series of appropriate financiallyengineered instruments.
With the JEREMIE initiative, the EU Member States will be able to use money from theEuropean Regional Development Fund (ERDF) and the European Social Fund (ESF) forthe setting up of financial instruments within a Holding Fund concept to support thecreation and expansion of micro, small and medium-sized enterprises (SME) as part ofEU regional policy. Using the concept of a Holding Fund, JEREMIE enables each MemberState to support the development of venture capital, business angels, technology transfer

7/27/2019 GAP Analysis CZ
http://slidepdf.com/reader/full/gap-analysis-cz 6/51
6
funds to link business, universities and research centres, and to improve the availabilityof micro-credits, loans and guarantees targeted at those who may not have access tocommercial credit or need further debt support for their SME. Funding from instrumentsestablished through JEREMIE may also be combined with business support andinstitution-building measures financed by the EU Structural Funds, but the JEREMIE
Holding Fund does not offer grant or technical assistance money.In previous periods, difficulties with the administrative processes have led to sub-optimallevels of fund utilisation. Time-consuming processes have led in certain cases tosignificant levels of funds earmarked for SMEs, being left unused. Understanding theproblems this causes, the Commission foresees that significant improvements can bemade via the creation of JEREMIE Holding Funds within the Member States and with fulldelegation to the appropriate Managing Authority to oversee the implementation ofJEREMIE programmes aimed at delivering sustainable financially engineered instrumentsthat improve access to finance for SMEs.
Importantly, each programme will be individually tailored to the needs of each Member
State following on from the combined efforts of the EIF and the Member State toevaluate market failures and the appropriate remedies in the context of its OperationalProgramme. The proposed instruments will efficiently engage the private sector and seekto maximise the leverage effect. The flexibility within the portfolio of JEREMIEinstruments in each programme enables a full range of instruments varying from equityand quasi-equity to venture capital, loans or guarantees for the benefit of SMEs in theMember State. Furthermore, the portfolio of instruments used and financial commitmentsmade is flexible enabling alterations in positional allocations to be made during theperiod.
The benefits to EU Member States from JEREMIE include:
• Disbursement of the funds to a ‘Holding Fund’ within the Member State. JEREMIEis designed to optimise the use of Structural Funds in the SME context and tosimplify the management of financial engineering by the Managing Authority.
• A highly adaptable toolbox of financial instruments8 that can be managed flexiblyover a period of time: during the financial period 2007-2013. In consultation andcooperation with the Managing Authorities of Operational Programmes, theJEREMIE Holding Fund will be able to re-allocate the resources to one or otherfinancial instrument and product, depending on the effective demand.
• The revolving nature of the portfolio of instruments and the partnership
approach with the private market will maximise the long-term impact of theFund and invested JEREMIE resources that are repaid become available forreinvestment. This is applicable, for example, when returns are received onventure capital investments, or micro-loans are reimbursed to micro-financeinstitutions. Resources are reinvested into the JEREMIE instruments and areused again in favour of SMEs.
• JEREMIE will principally enhance the supply of SME finance in the regions, bybringing product expertise and decision on investment schemes at a local level.It will also contribute to improve the regional financial conditions targeting areasof need. The EIF’s international experience will be available to all Member
States.

7/27/2019 GAP Analysis CZ
http://slidepdf.com/reader/full/gap-analysis-cz 7/51
7
2. BACKGROUND INFORMATION
2.1. Characteristics of the Economy and Demographics2
In the past three years, the population of the Czech Republic is constantly rising and
stood at about 10.3 m inhabitants mid-2006. Average age of the population is 40 years,almost 6 m people are between 25 and 64 years old. Net migration is positive (+ 3.3%).The economic activity rate3 rose compared to 2005 by 0.2% to almost 60%. According tothe Czech Ministry of Finance the share of people at risk of poverty stood at 10% in2005. Number of people classified in the “poverty risk” category is given in the tablebelow.4 The overall unemployment rate was slowly declining in 2005 to 7.9%; the long-term unemployment remained the same as in 2004 at 4.2%. November 2006 Statisticsconfirm a further decrease in overall unemployment rate to 7.3 %.
The macroeconomic environment of the Czech Republic is stable characterised byincreasing tendency of economic growth. The Czech Republic is rated A- (Standard &Poor’s, Fitch IBCA) and A1 (Moody’s). In 2005 and 2006, the GDP rose to about 6%. Thefollowing chart gives an overview of the development of key macro-economic indicatorsbetween 2003 and autumn 2006:
Development of macroeconomic indicators
3,64,2
6,1 5,8
0,1
2,81,9
2,6
7,8 8,3
7,97,3
0,0
1,0
2,0
3,0
4,05,0
6,0
7,0
8,0
9,0
2003 2004 2005 3Q 2006
GDP
Inflation
Unemployment
Source: Czech statistical office, www.czso.cz
2 Source: Czech Statistical office, www.czso.cz and Ministry of Finance, www.mfcr.cz3 Economic activity rate = share of economically active people (total workforce) on total population older 15years
4 The share of persons with an equivalised disposable income below the risk-of-poverty threshold, which is setat 60 % of the national median equivalised disposable income (after social transfers)
7/27/2019 GAP Analysis CZ
http://slidepdf.com/reader/full/gap-analysis-cz 8/51
8
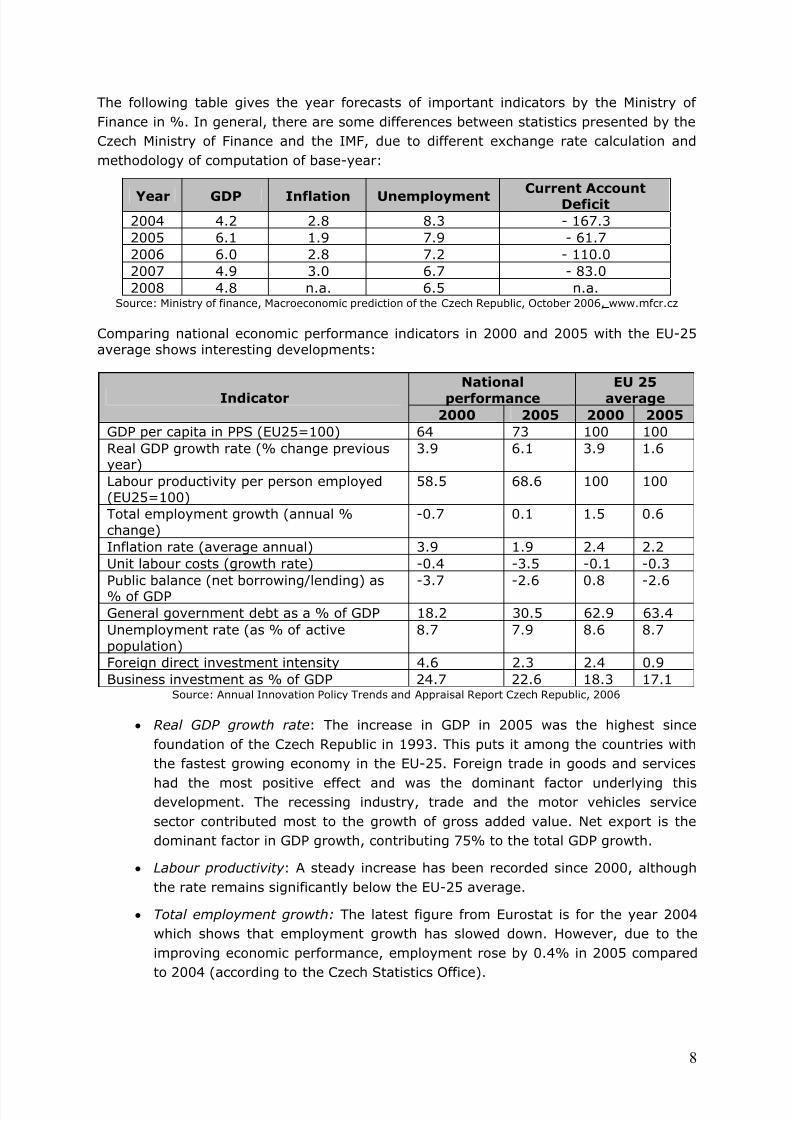
The following table gives the year forecasts of important indicators by the Ministry ofFinance in %. In general, there are some differences between statistics presented by theCzech Ministry of Finance and the IMF, due to different exchange rate calculation andmethodology of computation of base-year:
Year GDP Inflation UnemploymentCurrent Account
Deficit2004 4.2 2.8 8.3 - 167.32005 6.1 1.9 7.9 - 61.72006 6.0 2.8 7.2 - 110.02007 4.9 3.0 6.7 - 83.02008 4.8 n.a. 6.5 n.a.
Source: Ministry of finance, Macroeconomic prediction of the Czech Republic, October 2006, www.mfcr.cz
Comparing national economic performance indicators in 2000 and 2005 with the EU-25average shows interesting developments:
Nationalperformance
EU 25averageIndicator
2000 2005 2000 2005GDP per capita in PPS (EU25=100) 64 73 100 100Real GDP growth rate (% change previousyear)
3.9 6.1 3.9 1.6
Labour productivity per person employed(EU25=100)
58.5 68.6 100 100
Total employment growth (annual %change)
-0.7 0.1 1.5 0.6
Inflation rate (average annual) 3.9 1.9 2.4 2.2Unit labour costs (growth rate) -0.4 -3.5 -0.1 -0.3Public balance (net borrowing/lending) as% of GDP
-3.7 -2.6 0.8 -2.6
General government debt as a % of GDP 18.2 30.5 62.9 63.4Unemployment rate (as % of activepopulation)
8.7 7.9 8.6 8.7
Foreign direct investment intensity 4.6 2.3 2.4 0.9Business investment as % of GDP 24.7 22.6 18.3 17.1
Source: Annual Innovation Policy Trends and Appraisal Report Czech Republic, 2006
• Real GDP growth rate: The increase in GDP in 2005 was the highest sincefoundation of the Czech Republic in 1993. This puts it among the countries withthe fastest growing economy in the EU-25. Foreign trade in goods and services
had the most positive effect and was the dominant factor underlying thisdevelopment. The recessing industry, trade and the motor vehicles servicesector contributed most to the growth of gross added value. Net export is thedominant factor in GDP growth, contributing 75% to the total GDP growth.
• Labour productivity : A steady increase has been recorded since 2000, althoughthe rate remains significantly below the EU-25 average.
• Total employment growth: The latest figure from Eurostat is for the year 2004which shows that employment growth has slowed down. However, due to theimproving economic performance, employment rose by 0.4% in 2005 comparedto 2004 (according to the Czech Statistics Office).
7/27/2019 GAP Analysis CZ
http://slidepdf.com/reader/full/gap-analysis-cz 9/51
9
• Unit labour costs: Although the average wage of employees in 2005 rose, thegrowth rate slowed down, thus reducing the danger of inflation.
• Public balance (net borrowing/lending) in % of GDP: The public balance isnegative, in spite of steady improvements since 2000. The current public balancecomes close to the EU-25 average.
• General government debt in % of GDP has only changed slightly since 2000 andamounts to approx. 30% GDP - about a half of the EU-25 average over the sameperiod (above 60% of GDP).
• Since 2001, the unemployment rate has been below the EU-25 average, risingslightly from 2002 to 2004, then dropping again in 2005 (to the level of 2003).This trend corresponds to the continuing increase in economic performance in2005.
• Business investment as a percentage of GDP is above the EU-25 average,showing a slight decrease from 2000 to 2004.
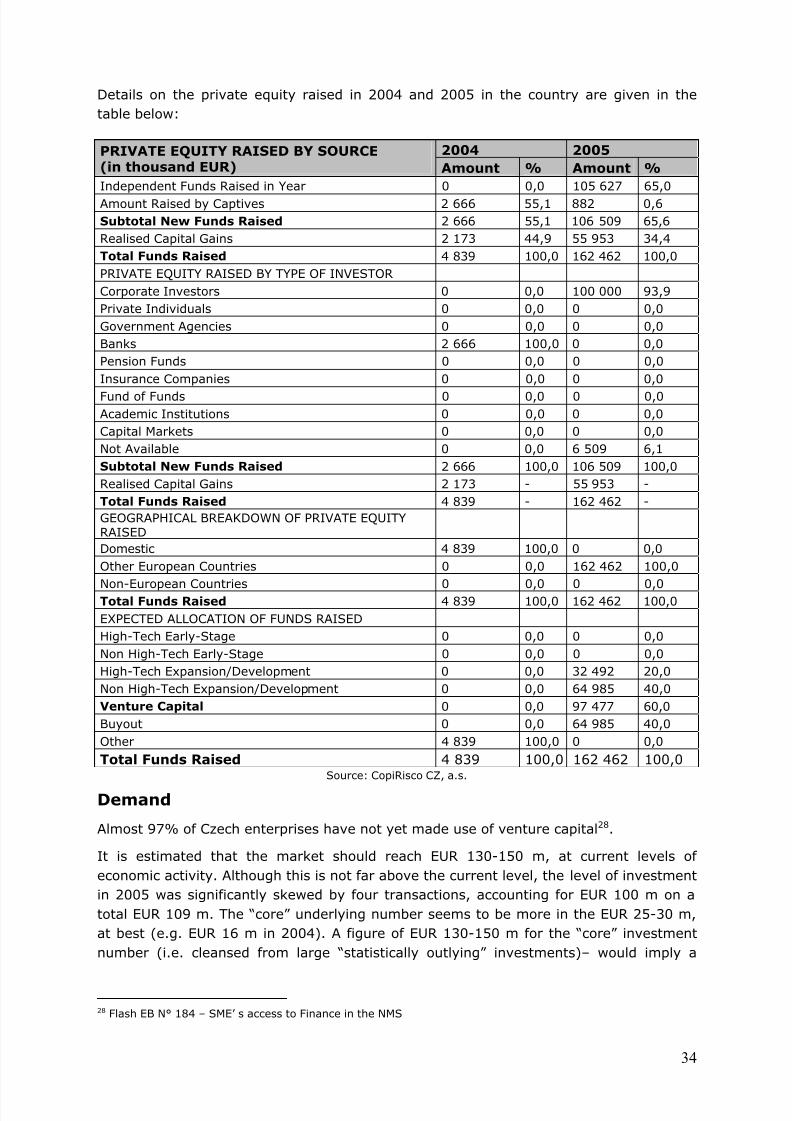
Public and private expenditures for research & development (R&D) are significantlybelow the EU average as well as the availability of financial resources for innovation andventure capital. According to the Summary Innovation Index (SII) of the EuropeanInnovation Scoreboard (EIS) 2005, the Czech Republic falls into the “catching up”category, which is an improvement in comparison to the previous year when it wasclassified as a country “falling further behind”. In terms of innovation indicators, theCzech Republic has a medium-high position with regard to employment in med/high-techmanufacturing (which is a natural consequence of Foreign Direct Investments, especiallyin mid- to higher technology manufacturing or services).
The Czech Republic shows an extremely low performance in all indicators related tointellectual property, although they do show a positive trend (especially the indicator onnew community trademarks). Other indicators where the Czech Republic performs poorlyare broadband penetration, enterprises receiving public funding, business-financeduniversity R&D and early-stage venture capital (which has been an on-going weaknessand continues to show negative trends).
From the global point of view, the competitiveness position of the Czech Republic isimproving slowly5. There were three innovation challenges set6: Better cooperationbetween universities/research institutions and the business sector; more sufficientfinancing of innovative (risky) businesses and start-up companies; higher patent activity.
Recent data taken from the World Competitiveness Yearbook (WCY) of the IMD, whichcompares the competitiveness of 60 countries, show the Czech Republic improving itsposition from 36th place in 2005 to 31st place in 2006 (World CompetitivenessScoreboard 2006).The first National Innovation Policy (2005-2010) was adopted by theCzech government in July 2005. Its strategic objectives are:
• Strengthened research and development as source of innovation,
• Working cooperation between the public and private sector,
5 Source: European Trend Chart on Innovation, Annual Innovation Policy Trends and Appraisal Report, Czech
Republic, 2006 6 Source: see footnote 10 and Assessment of the priorities and formulations of recommendations for
implementation measures towards developing a knowledge economy within the preparation of the NationalProgramming Documents of the Czech Republic for 2007 – 2013.

7/27/2019 GAP Analysis CZ
http://slidepdf.com/reader/full/gap-analysis-cz 10/51
10
• Sufficient human resources for innovation,
• Better performance of government and civil service in R&D and innovation.
In total, 48 concrete measures have been defined to achieve these objectives, includingthe allocation of responsibilities, deadlines and success indicators.
2.2. SME Characteristics and Environment
The SMEs position has been stable in the past seven years; they form a very importantpart of Czech Republic’s economy. They represent 99.85% of all enterprises and create34.72% of GDP and about 30% of export. SMEs make 61.79% of the total employment,this share is growing. The total value added and outputs of SMEs reaches more than50%. Their share of total investment in the Czech Republic is relatively high and growing,representing more than 50% in the year 20047.
The table below shows the development of number of SMEs according to thecategorisation of the European SME definition:
2003 2004 2005
N° of enterprises 929,000 934,000 947,000Share of total 95.6% 95.6% 95.6%Employees 463,000 460,000 482,000
Microenterprises(0-9employees) Contribution to employment 26% 25,7% 26.3%
N° of enterprises 36,100 35,500 35,900Share of total 3.7% 3.7% 3.8%Employees 656,000 647,000 652,000
Smallenterprises(10-49)
Contribution to employment 36,9% 36,1% 36,2%N° of enterprises 6,700 7,000 6,900
Share of total 0.7% 0.7% 0.6%Employees 660,000 686,000 675,000
Medium-
sizedenterprises(50-249) Contribution to employment 37% 38.3% 37%
Total number 971,800 976,600 993,700Total employees 1.780,000 1.792,000 1.934,000All SMEsContribution to employment 61.3% 61.4% 61.8%
Total number 1,930 2,017 2,037Largeenterprises Total employees 512,000 599,000 632,000
Source: Czech statistical office, www.czso.cz
The table above shows a diametrically share of micro enterprises in the Czech economy.
The rate between micro and small enterprises in 2005 was 26:1 and between micro andmedium-size was 137:1. The contribution to employment is relatively identical. Thenumber of micro enterprises is increasing.
7 Source: Conception of SME development in the period 2007 – 2013, April 2006, www.mpo.cz
7/27/2019 GAP Analysis CZ
http://slidepdf.com/reader/full/gap-analysis-cz 11/51
11
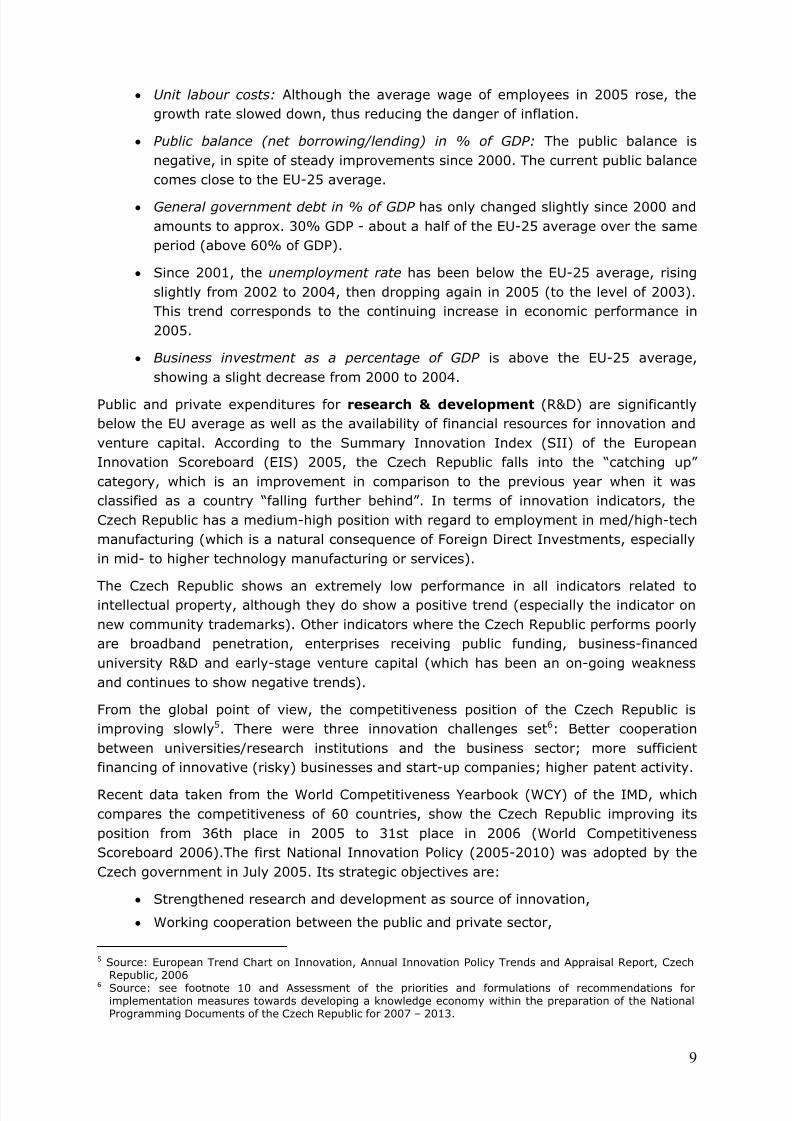
According to the chart below, in 2004, SMEs were mainly active in the service sector aswell as trade and gastronomy:
The s ector al share on to tal numb er o f SME in 2004
35
15,515,4
20,4
4,8 Services
Industry
Construction
Trade, gastronomy
Transport
Source: The economy of SME in 2004, Czech statistical office, www.czso.cz
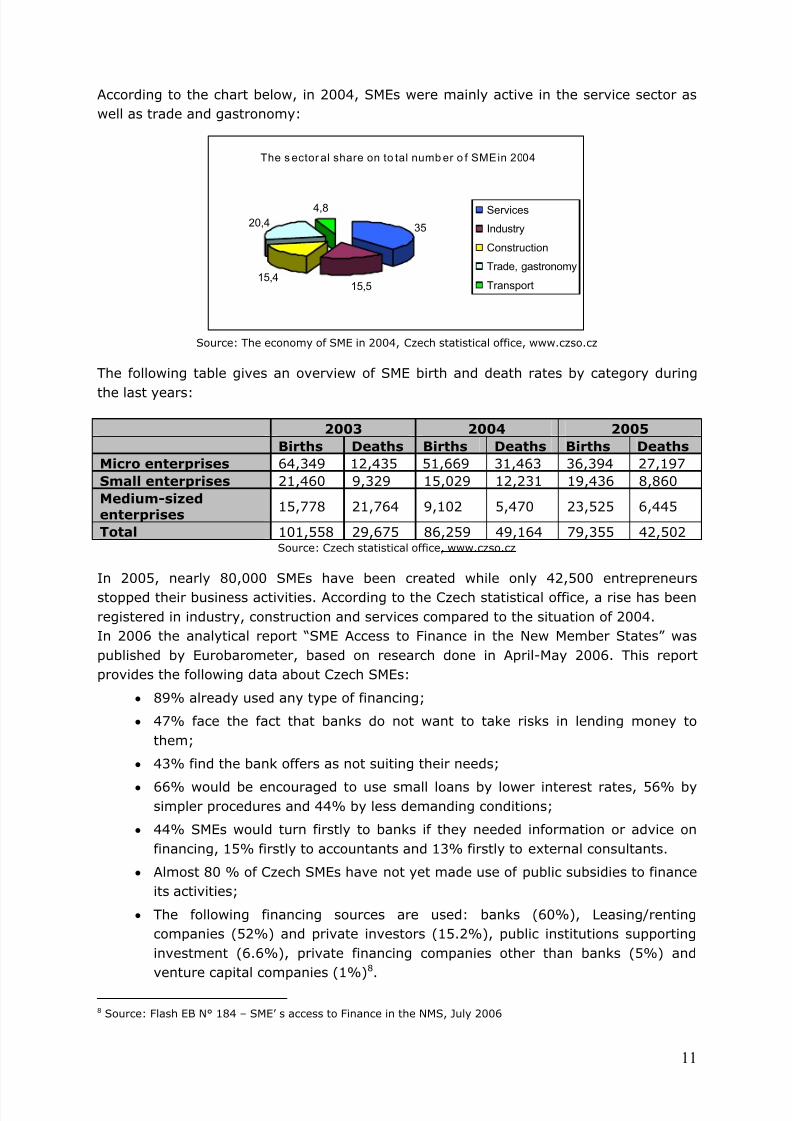
The following table gives an overview of SME birth and death rates by category during
the last years:
2003 2004 2005
Births Deaths Births Deaths Births Deaths
Micro enterprises 64,349 12,435 51,669 31,463 36,394 27,197Small enterprises 21,460 9,329 15,029 12,231 19,436 8,860Medium-sizedenterprises
15,778 21,764 9,102 5,470 23,525 6,445
Total 101,558 29,675 86,259 49,164 79,355 42,502Source: Czech statistical office, www.czso.cz
In 2005, nearly 80,000 SMEs have been created while only 42,500 entrepreneursstopped their business activities. According to the Czech statistical office, a rise has beenregistered in industry, construction and services compared to the situation of 2004.In 2006 the analytical report “SME Access to Finance in the New Member States” waspublished by Eurobarometer, based on research done in April-May 2006. This reportprovides the following data about Czech SMEs:
• 89% already used any type of financing;
• 47% face the fact that banks do not want to take risks in lending money tothem;
• 43% find the bank offers as not suiting their needs;
• 66% would be encouraged to use small loans by lower interest rates, 56% bysimpler procedures and 44% by less demanding conditions;
• 44% SMEs would turn firstly to banks if they needed information or advice onfinancing, 15% firstly to accountants and 13% firstly to external consultants.
• Almost 80 % of Czech SMEs have not yet made use of public subsidies to financeits activities;
• The following financing sources are used: banks (60%), Leasing/rentingcompanies (52%) and private investors (15.2%), public institutions supportinginvestment (6.6%), private financing companies other than banks (5%) andventure capital companies (1%)8.
8 Source: Flash EB N° 184 – SME’ s access to Finance in the NMS, July 2006

7/27/2019 GAP Analysis CZ
http://slidepdf.com/reader/full/gap-analysis-cz 12/51
12
The following table gives information on SMEs investment activities:
SME investment (tangible, intangible, incl. land)
(million EURO)
Corporate body Individuals2005
0-249employees 0-249employees
Total
SMEs
SME investment
share in total inCzech Republic
%
Industry 2 254.0 246.1 2 500.1 32.65Construction 282.4 54.0 336.3 64.76Merchandise 1 209.5 196.6 1 406.1 72.26Restaurants 187.0 95.6 282.6 93.68Transportation 473.2 211.0 684.3 30.24Finance 188.6 15.0 203.5 37.04Services 2 809.4 389.8 3 199.2 90.45Agriculture 558.5 83.8 642.3 88.29
Total 7 962.6 1 291.8 9 254.4 52.88Source: Ministry of Industry and Trade, based on data from Czech Statistical office
Definition:
Individual (according to § 7-17 of the Act No 40/1964 Coll. as amended, Civil Code) isdefined as any individual with legal identity, who has trade license to do business underits personal identification number and is not defined as Corporate body. (in practice 1-5employees)
Corporate body (according to § 18-21 of the Act No 40/1964 Coll. as amended, CivilCode) are those established by written contract or Memorandum of Association. They
start existing after registration in Trade register (or other defined by law) under uniquetrade name with defined company seat. Corporate bodies are: corporations of individualsor corporate bodies, purpose corporations of assets, units of municipal authorities andother subjects as defined by law.
2.3. Regional Characteristics
The Czech Republic is divided in eight NUTS II9 regions listed in the table below:
Self-governingDistrict
Region/NUTSIISelf-governingDistrict
Region/NUTSII
Praha Prague Liberecký krajStředočeský kraj Central Bohemia Královehradecký krajJihočeský kraj Pardubický kraj
North-East
Plzeňský krajSouth-West
Kraj VysočinaKarlovarský kraj Jihomoravský kraj
South-East
Ústecký krajNorth-West
Olomoucký krajMoravskoslezský kraj Moravia-Silesia Zlínský kraj
CentralMoravia
Source: CopiRisco CZ, a.s.
9 Definition: NUTS (Nomenclature des unités territoriales statistiques). NUTS I – Czech Republic, NUTS II –regions, NUTS III - districts

7/27/2019 GAP Analysis CZ
http://slidepdf.com/reader/full/gap-analysis-cz 13/51
13
The map below shows that regional SME statistics and shares of population at risk ofpoverty vary substantially:
RoP= Risk of Poverty
With regard to the economic characteristics of the regions, the Czech Republic can beconsidered as two regions – Prague and the rest of Czech Republic. Prague’s share ofGDP reaches over 200% of the average; the other regions created on average 86.4% ofGDP of the Czech Republic in 2004. The most economically active region beside Prague isthe region of Central Bohemia, benefiting from its neighbouring position with Prague and
creating 93.6% share on Czech GDP. The least economically active region is CentralMoravia with 80.1 % share on GDP.
The following chart shows the unemployment rate in the single regions in 2005:
Unemployment rate, in %
3,2
10,38,3
9,3
6,3
15,4
8,2
14,2
6,7 7,7
10,2
6,4 7,3
10,6
0
4
8
12
16
P r a h
a
K a r l o
v a r s k ý
P a r d u b i c k
ý
Z l í n s k
ý
S t ř e
d o č e
s k ý
Ú s t e c k
ý
V y s o
č i n a
M o r a v
s k o s l e z
s k ý
J i h o č e
s k ý
L i b e r e c k ý
J i h o m o r a v
s k ý
P l z e
ň s k
ý
K r á l o
v e h r
a d e c k ý
O l o m
o u c k ý
Source: Ministry of Labour and Social Affairs, as at 31.12.2005, www.mpsv.cz
Note: Average unemployment in the Czech Republic in 2005 was 7.9 %
According to the “Report on SME Development and its Support in 2005”, published by the
Czech Ministry of Industry and Trade in May 2006, the SMEs received the following public
RoP: 2.1%177 320 SMEs
RoP: 16.2%45 023 SMEs
RoP: 3.9%
102 450 SMEs
RoP: 6.3%
62 870 SMEs
RoP: 16.2%33 764 SMEs
RoP: 15.4%89 007 SMEs
RoP: 7.7%46 266 SMEs
RoP: 9.6%45 401 SMEs
RoP: 18.4%60 321 SMEs
RoP: 6.3%49 080 SMEs
RoP: 16.2%60 338 SMEs
RoP: 7.7%
59 320 SMEs
RoP: 9.6%100 320 SMEs
RoP: 18.4%62 220 SMEs

7/27/2019 GAP Analysis CZ
http://slidepdf.com/reader/full/gap-analysis-cz 14/51
14
support (state budget 66%, EU 12%, private financial sector 22%) in the respectiveregions:
Regional support of SME (million EURO)
5,2
0,9
6,9
11,1
6,8
4,33,4 3,5 3,7 3,0
6,2 6,6 6,4 6,1
0,0
4,0
8,0
12,0
P r a h
a
K a r l o
v a r s k ý
P a r d u b i c k
ý
Z l í n s k ý
S t ř e
d o č e
s k ý
Ú s t e c k ý
V y s o
č i n a
M o r a v
s k o s l e z
s k ý
J i h o č e
s k ý
L i b e r e c k ý
J i h o m o r a v
s k ý
P l z e
ň s k
ý
K r á l o
v e h r
a d e c k ý
O l o m
o u c k ý
2.4. SME-Supporting Institutions & Programmes
2.4.1. Institutional Structure
Public SME support is realised by the Ministry of Industry and Trade (MIT), Ministry ofRegional Development (MRD) and Ministry of Social Affairs (MSA) through theirrespective Operational Programmes. Existing programmes are often implemented bystate owned agencies or banks, i.e. Czech Invest, Czech Trade, Českomoravská záruční arozvojová banka (ČMZRB), Design centrum ČR, Česká exportní banka (ČEB) andEvropská garanční a pojišť ovací společnost (EGAP).
The chart below summarizes total public SME support between 2004 and 2006. In 2005,
8,000 SMEs were supported with allocated EUR 0.23 bn, of which EUR 0.15 bn from statebudget, EUR 0.03 bn from EU Phare and Structural Funds10 and EUR 0.05 bn from thefinancial market11.
SME financial support 2004 - 2006
169 164
235
0
50
100
150
200
250
2004 2005 2006
year
m i l l i o n E u r o
Czech Invest
The investment and business development agency was established under the MIT in1992. Its main purpose is to support the competitiveness of Czech enterprises, mainly inthe manufacturing industry and innovation sector and attracting direct foreigninvestment. Czech Invest provides its services free-of-charge, such as information
10 Pre-accession and regional aid11 Source: Report on SME development and its support in 2005, www.mpo.cz
7/27/2019 GAP Analysis CZ
http://slidepdf.com/reader/full/gap-analysis-cz 15/51
15
assistance, handling of investment incentives, business property identification, location ofCzech suppliers, aftercare services, business infrastructure development. As at December2006, Czech Invest approved grants to 913 projects (mainly SMEs) amounting in total toEUR 221 m. Credit agreements have been concluded for 1,624 projects with a totalamount exceeding EUR 72.3 m. These projects are financed up to 50% from EU
Structural Funds and from the state budget, the rest through own company resources12
.Czech Trade
The Czech agency for trade support was established in 1997 as national pro-exportorganisation of the MIT. Its main purpose is to develop international trade andcooperation of enterprises in the Czech Republic with the foreign business subjects andto improve Czech export activities. It also realises own services as well as developmentprogrammes within the OP Industry and Enterprise of the MIT. 89% of businessessupported by Czech Trade were SMEs. Within the programme “Marketing” 303 projectswere supported between 2004 and 2006 for a total amount of over EUR 16 m. Within theprogramme specialised on “Export Consultancy” 59 studies were devised amounting in
total to almost EUR 1 m13. The scheme of financing projects is similar to the scheme usedby Czech Invest14.
ČMZRB Czech-Moravian Guarantee and Development Bank
Českomoravská záruční a rozvojová banka a.s. was established in 1992 and has thefollowing shareholders: Czech Republic represented by the MIT, Ministry of Finance andMinistry of Regional Development (72% of shares) as well as commercial banks, such asKomerční banka, a.s., Česká spořitelna, a.s. and Československá obchodní banka, a.s..
The bank supports SME development mainly by providing guarantees and preferential
credits using finances from the state budget, structural and regional funds. Someprogrammes are realised solely by the ČMZRB, i.e. Záruka, Trh and Progres; somerealised as part of the MIT´s OP Industry and Enterprise/OP Business and Innovationprogrammes, i.e. Kredit, Start. In 2005, ČMZRB supported about 2,500 SMEs with a totalamount of EUR 82 m. Major support programmes (43%) were provided for smallenterprises and the major amount of finance (41%) was provided for mediumenterprises. The programme START is drawn by 99% by self-employed (0 employees),mainly trade companies (created 33% in 2005), accommodation services (21.8% in2005) and industry (22.3%). These programmes are working on a repayable system. Theprincipal of the loan is payable according to specified conditions; the interest is a grant15.
Design Centre Czech Republic
This organisation was established in 2003 by the MIT with the aim to effectively promotethe use of design in industry, trade and services. This organisation realises nationalprogrammes supporting SMEs. Between 2005 and 2006, 182 projects were supported ina total amount of EUR 300,000. Projects are financed up to 20% from the nationalbudget and the rest through company resources16.
12 Source: www.czechinvest.org 13 Data extracted form the CzechTrade´s Annual report, 2005 14 Source: www.czechtrade.cz 15 Source: www.cmzrb.cz
16 Source: www.designcentrum.cz

7/27/2019 GAP Analysis CZ
http://slidepdf.com/reader/full/gap-analysis-cz 16/51
16
Czech Export Bank
ČEB is a specialised banking institution, directly and indirectly fully state-owned, for thefinancial support of exports. It was set up in 1995 and is one of the pillars of thegovernment's pro-export policy system. The ČEB's mission is to provide official supportfor exports through the provision and financing of export credits and other services
connected with export. ČEB thus supplements the services offered by the domesticbanking system by financing export operations that require long-term financing atinterest rates and in volumes that are not available to exporters on the banking marketunder the current conditions. This allows Czech exporters to compete on internationalmarkets under conditions comparable to those enjoyed by their main foreigncompetitors. In 2005, the financial allocation for SMEs remained as in 2004 – aboutEUR 25 m. These programmes are working on a repayable system. The principal of theloan is payable according to specified conditions and the interest is a grant17.
Export Guarantee and Insurance Company
EGAP was established in 1992 as fully state owned credit insurance company oriented oninsuring export credits against territorial and commercial risks connected with export ofgoods and services of the Czech Republic. EGAP provides its services indiscriminately theenterprises' size, legal form or exporting amount. 73.3% of all clients are SMEs.11,700 SMEs were interested in insurance products in total amount EUR 7.6 m of totalgross insurance. These programmes are working on a repayable system. The principal ofthe insurance or guarantee is payable according to specified conditions and the interestor guarantee fee is a grant for the company18.
2.4.2. Activities and Programmes 2004-200619
ČMZRB
In 2005, ČMZRB realised the following national SME programmes:
• Záruka (Guarantee) – financial preferential guarantees for SMEs;
• Trh (Market) – multipurpose SME support programme providing preferential creditsfor small enterprises and interest-free credits for starting businesses in Prague,newly realised also by subordinated credits. The support was oriented onestablishing certification actions;
• Progres (Progress) – support for dynamically developing SMEs through subordinatedcredits; in 2005,
o 117 loans with interest rate 1% p.a. in total amount EUR 25.6 m
o 40 loans with interest rate 3% p.a. in total amount EUR 14.2 m
o 4 loans with interest rate 4% p.a. in total amount EUR 0.67 m
In general, ČMZRB spent in 2005 EUR 82 m for SME support. The major part wasprovided for small enterprises (43% of total support amount); medium sized enterprisesreceived 30% and micro enterprises 27%. Most support headed to the Moravian–Silesianregion (24% of guarantees, 13% benefits and 7% preferential credits) and Prague (7%
17 Source: www.ceb.cz18 Source: www.egap.cz 19 Source: Detail summary on SME support programmes in 2005, www.mpo.cz

7/27/2019 GAP Analysis CZ
http://slidepdf.com/reader/full/gap-analysis-cz 17/51
17
guarantees, 15% benefits and 17% preferential credits). Most support was provided tothe industry (30%), construction (35%) and trade (16%).
In the context of the OP Industry and Enterprise 2004 – 2006, ČMZRB wasadministrating applications for:
• Credit Programme – Preferential loans for small enterprises (up to 49employees) development projects that have at least 7 years history. Maturityperiod is up to 8 years at a fixed interest rate of 3-4% p.a. SMEs can receiveloans from EUR 7,140 – 250,000.
• Start Programme – Preferential interest-free loans for SME start-ups. Maturity ofthese loans is up to 6 years. SME can receive EUR 3,570 – 30,000.
Czech Invest
Czech Invest realised in 2005 as part of the above-mentioned national programmes thefollowing SME supporting activities:
• Poradenství (Consultancy) – consultancy and educational programmes forstarting or expanding SMEs, realised in cooperation with regional consultancycentres and Business Innovation Centres.
In 2005, the total amount of EUR 920,000 supported SMEs through this programme.About 1,700 consultancy projects were financed and 518 grants were provided foreducational projects. Major receiving region was South Moravia.
Czech Invest was administrating the OP Industry and Enterprise 2004–2006 and willadministrate the OP Business and Innovation 2007–2013.
Czech Trade
Czech Trade realised in 2005 as part of the above-mentioned national programmes thefollowing SME supporting activities:
• Aliance (Alliance) – creating SME alliances and supporting them entering foreignmarkets;
About EUR 275,000 EURO supported in 2005 63 applicants - mainly small enterprises(62%) in the region South-East and Central Moravian region.
Czech Trade was administrating applications in the OP Industry and Enterprise 2004–2006 for:
• Marketing programme – support for marketing activities of SME in foreignmarkets in the form of a grant for SMEs with at least 2 years history. SMEs canreceive EUR 3,570 – 30,000.
Design Centre Czech Republic
• Design support for SMEs; in 2005, 114 enterprises were supported throughEUR 303,000, mainly in South Moravia and Prague.
6th EU Framework Programme for Research and Technological Development
• Support of SMEs during years 2005-2007.
In 2005 in total 6 projects were supported through EUR 32,000, of which four in Pragueand two in Central Bohemia.

7/27/2019 GAP Analysis CZ
http://slidepdf.com/reader/full/gap-analysis-cz 18/51
18
Ministry of Industry and Trade (MIT) Programmes
• Research and Development Programme
In 2005, MIT supported in total 277 projects presented by SMEs through EUR 32 m. Totalsupport of R&D projects including MIT was EUR 65.2 m.
• In cooperation with Czech Invest, various activities were conducted, e.g. thesupport of industrial zones, technological facilities
The following table shows all activities in the context of the OP Industry and Enterprise2004 – 2006:
Programme Number of supported SMEs Amount EURO provided
Prosperity 9 11 799 929Real estate 56 70 232 643Training centres 38 9 039 786Clusters 16 2 801 750Credit* 406 956 428Marketing 303 16 691 036Development 216 105 814 964Start* 381 216 428Innovation 38 32 314 179Renewable resources 39 43 861 357Energy savings 24 9 492 571
Source: Czech Invest, www.czechinvest.org, data as at 2006
Ministry of Regional Development (MRD) Programmes
• Regional programme supporting development of industrial businesses in NUTS 2region North-West and Moravia-Silesia – 2005: EUR 2 m
• State programme of tourism – EUR 3.82 m for SMEs in 2005
• Joint regional OP – infrastructure and business support – EUR 2.15 m in 2005
Replaced in 2007-2013 by seven separate Regional OPs administered by regionalauthorities to better target more specific problems of concerned regions. SMEswill be mainly supported in tourism activities (both infrastructure and services)and partly in business infrastructure development (mainly focused on usingbrownfields, investment in its infrastructure and support of private and publicsector cooperation).
Multi-annual EU Programme for SMEs, 2001-2005 (MAP)MAP projects are realised via Euro Info Centres (consultancy, seminars, trainings,conferences), via EIF through venture capital funds and guarantees and via MIT.Successor programme in 2007-2013 is CIP.
Ministry of Social Affairs (MSA) Programmes
MSA provides minor programmes to support the development of human resources inSMEs as well as to boost employment.
ČEB and EGAP Programmes
EGAP is supporting mainly SMEs in the field of commercial credit insurance. The reason isthe activity of the supported SMEs in consumption goods, materials and spare parts

7/27/2019 GAP Analysis CZ
http://slidepdf.com/reader/full/gap-analysis-cz 19/51
19
where short term credits are used. ČEB is providing exporting SME with short and longterm export credits, partly with state grant, which covers losses.
International Financial Institutions
EBRD is operating in the Czech Republic since 1991. As of 31 August 2005 the Bank had
committed totaling over EUR 1 bn in 50 direct and 39 regional projects which attracted afurther EUR 3.6 bn from sponsors and co-financiers. In 2005, EBRD investments in theCzech Republic amounted to over EUR 50 m.
The EU/EBRD SME Finance Facility, a joint programme of the European Comission andthe EBRD, supporting the development and growth of SMEs by facilitating their access tofinance, was launched in 1999. This programme covers 11 countries and allocated overEUR 1.1 bn20.It operates through financial intermediaries (Czech banks, leasingcompanies and Equity Funds, e.i. Komerční banka, Česká spořitelna, Raiffeisen bank, SGEquipment Finance, Deutsche Leasing, Raiffeisen Leasing, S Morava Leasing or CzechPrivate Equity Fund, GIMV Czech and Slovak SME Fund or Raiffesien EU Enlargement
Fund) and enables Czech financial institutions to provide micro loans to Czech SMEs withamounts up to EUR 25,000. As at 2005, Česká spořitelna received EUR 30 m financeloan, Komerční banka EUR 20 m, Raiffeisen EUR 10 m. Leasing companies received EUR5 – 30 m. Further information of products according to Czech banks or leasinginstitutions can be found in the relevant sub-chapters of chapter 3.
European Investment Bank – Until end of 2006, EIB has provided EUR 790 m in form ofcredit lines to partner financing institutions in Czech Republic. These Global Loans forSMEs were often accompanied by the European Commission’s SME Finance Facilityintended to strengthen the financial intermediaries’ capacity to target SMEs. The EIB’sGlobal Loan activity is expected to continue to play an important role in the Bank’s
business over the coming years. EIB Partner Banks in Czech Republic are the majorcommercial banks mentioned in chapter 3.3.
European Investment Fund – In December 2006, EIF has committed guarantee activitiesamounting to EUR 134.5 m in Czech Republic through MAP, of which EUR 80 m withČeská spořitelna and EUR 54.5 m with CMZR.
20 Source: www.ebrd.com

7/27/2019 GAP Analysis CZ
http://slidepdf.com/reader/full/gap-analysis-cz 20/51

7/27/2019 GAP Analysis CZ
http://slidepdf.com/reader/full/gap-analysis-cz 21/51
7/27/2019 GAP Analysis CZ
http://slidepdf.com/reader/full/gap-analysis-cz 22/51
22
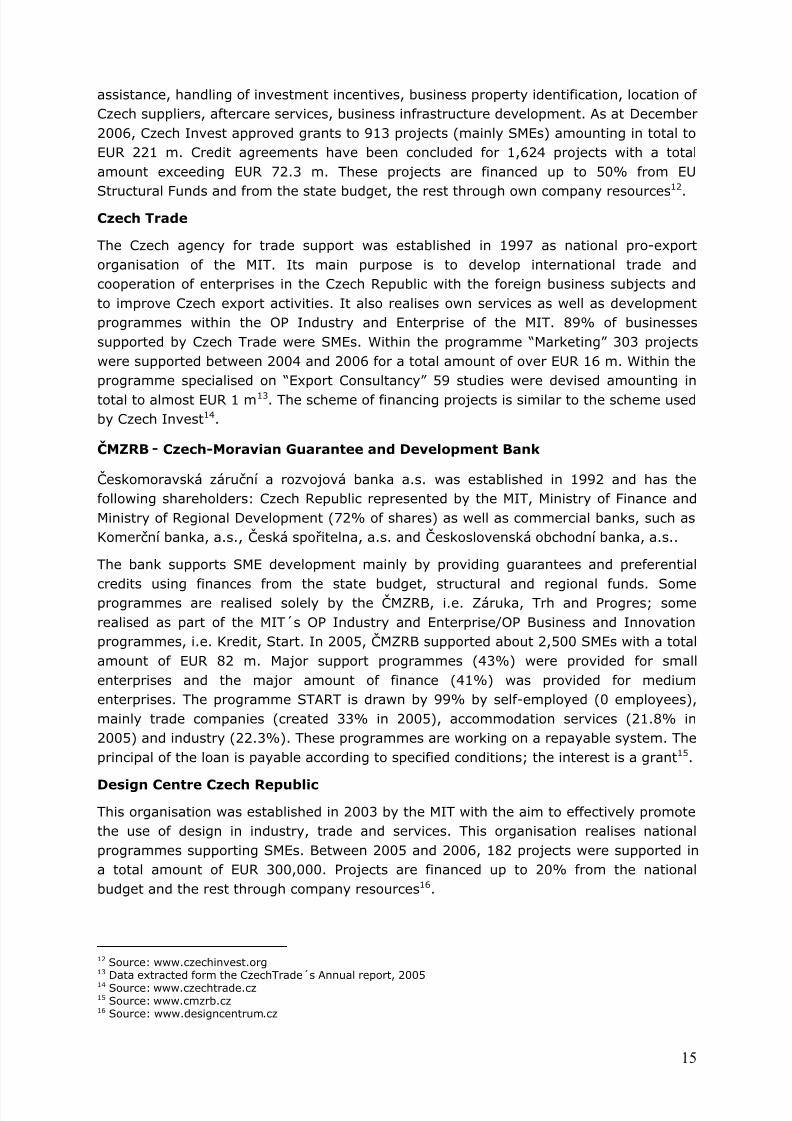
The table below lists the main features of the START, OP Business and Innovation:
Form of support Preferential non-interest-bearing line of creditFinancingmaximum
90 % of total expected costs of the project
Minimum amount EUR 3,570
Individual EUR 26,785Corporate body with 1 partner EUR 26,785Maximum amountCorporate body with more partners EUR 53,571
Maturity Max. 7 years, up to one year grace periodSource: CzechInvest, www.czechinvest.org
In 2006, CMZRB provided 733 micro loans with a total volume of EUR 11.6 m and anaverage loan size of EUR 15,820. In 2007-2013, up to EUR 45 m can be provided in theframework of this programme.
The South-Moravian Innovation Centre (JIC) provides micro finance to SMEs tofinance their innovation projects in the preparatory and realisation phase in the form of
credit. The provided amount of finance ranges from EUR 8,928 to EUR 26,780 withmaturity between one and three years from closing date of the credit contract. It ispossible to postpone the due date by maximum one year. The credit is provided withfixed interest rate not exceeding the usual credit interest rate in commercial banks. In2006, JIC provided 23 micro loans with a total volume of EUR 360,000 and an averageloan size of EUR 15,600. In 2007-2013, about EUR 1.5 m can be provided for microloans.
There are not many commercial banks supporting SMEs with microfinance. Conditionsseem to be difficult and not many SMEs have good chances to receive finance. EBRD isproviding special EU/EBRD SME Finance Facility programme to support Czech financialinstitutions provide such micro finance in amount up to EUR 25,000. For example, Česká
spořitelna, a.s. received EUR 20 m in 2000 and another EUR 10 m from this programmein 2003 to provide micro and small credits to entrepreneurs. It is provided even for thestart-up SMEs in form of investment and working capital. The amount ranges fromEUR 3,570 to EUR 153,570. Komerční banka received a EUR 20 m credit line in 2004for SME-oriented programmes, preferably in the form of micro credit, up to EUR 125,000.Currently, KB provides EU Profi Úvěr, with simplified and shortened approval process upto EUR 140,000. Raiffeisen Bank received EUR 10 m in 2003 to provide micro financeproducts for Czech SMEs up to EUR 25,000. Raiffeisen currently provides these products,co-financed by EBRD: Overdraft facilities and investment credits, both up to EUR 50,000
with flexible due date21
Demand
Self-employment is an important way of getting out of social welfare dependency.Based on the number of population aged 25-64 (6 m) at risk of poverty, estimated inchapter 2.1 at 10%, being 600,000 people, we can estimate the potential demand formicro loans devoted to self-employment business creation. Through consultation withinternational experts in the field of microfinance, it is assumed that about 60% of thispopulation can be considered as potential business creators. Within this subgroup,around 3% can be expected to start entrepreneurial activity if suitable sources of finance
21 Source: www.ebrd.com and relevant banks – www.csas.cz, www.kb.cz, www.rb.cz

7/27/2019 GAP Analysis CZ
http://slidepdf.com/reader/full/gap-analysis-cz 23/51
23
are available. Therefore, the number of at-risk-of-poverty people classified as likelyentrepreneurs stands at 10,800 people. Assuming that an average loan size in the microfinance sector to start being self-employed could stand at EUR 10,00022 a total demandof EUR 108 m is theoretically possible.
About 947,000 micro enterprises existed in Czech Republic in 2005. The share of those
investing and the average investment size does not seem to be recorded by the CzechStatistical Office; we only got data on the share of all SMEs investing by sector, whichlies at about 50% on average (see chapter on SME characteristics). If only 6% of theexisting micro enterprises would invest EUR 12,000 (which is not an unrealisticassumption compared to other Central European EU member states), a potential demandfor micro finance from existing micro companies of about EUR 680 m could be assumed.Comparing birth and death rates of micro enterprises in 2005, a positive balance of onlyabout 10,000 newly created micro enterprises was recorded. This figure could increase ifmore appropriate means of finance would be provided in the coming years.
In general, a developing economy, requiring higher investment levels from companies,
will have growing demand for capital by SMEs, thus micro lending activities to existingenterprises can be expected to expand.
Market failure & JEREMIE Recommendations
Comparing the existing supply of micro finance in Czech Republic and the theoreticaldemand of existing micro companies and potential self-employed for adequate means offinance shows a market failure in both segments, leading to a financing gap. In order toaddress these market failures, it is proposed to implement the following schemes in theframework of the JEREMIE portfolio:
Micro Loan Guarantee Scheme targeting start-up companies
In order to develop a guarantee instrument which addresses the market failure, a deeperanalysis of the market and its players during the finalisation period of this report isrecommended. The instrument could be linked to a new start up loan programmedesigned in cooperation with commercial banks and with characteristics tailor made tobetter address the needs of start up companies such as low collateral requirements,possibility of grace period, advantageous interest and costs. Another option could be arefinancing facility, which would however offer less leverage.
The lenders would manage the client relation and retain a portion of the risk, theremainder to be covered by the guarantee scheme (e.g. on a 20:80 basis). In order to
increase the uptake of the start up loan and to ensure lean procedures for the granting ofthe guarantee, the guarantee scheme could be implemented as a portfolio guarantee, i.e.all the start up loans granted by the participating and in compliance with certain pre-agreed eligibility criteria would be “automatically” covered.
Subject to further analysis and interview with key market players, an initial budgetallocation of EUR 50 m for a micro loan guarantee scheme out of ERDF is recommended.
Social Micro Loan Scheme
Support to self-employment making the beneficiaries gain independence from socialwelfare subsidies. A loan scheme could target individuals having less access to
22 Compared to micro loans offered, which are more targeting existing small enterprises

7/27/2019 GAP Analysis CZ
http://slidepdf.com/reader/full/gap-analysis-cz 24/51
24
mainstream banking services, e.g. specific segments of the unemployed and those at riskof poverty, and encourage them to start self-employment. EIF’s proposal would be tostart the programme with a pilot project amounting to EUR 5 m.
Further research is required in the context of modelling the JEREMIE business portfolio todesign the appropriate financial instrument to address the market failure.
3.3. Debt Financing
Supply
Commercial Banks
In terms of the number of banks and their ownership, the sector has been stable instructure for several years now. More than 96% of the sector’s total assets are directly orindirectly controlled by foreign banks; in total 24 banks (including 6 building societies)and 12 foreign bank branches were operating in the Czech Republic as of December of
2005 (see table below). In 2005, the total assets of the banking sector rose byEUR 11.5 bn to EUR 107 bn. The continuing growth in lending, above all to households,was particularly significant. Loans to households showed annual growth of almost 34%.Loans to corporations rose by 14.3%. Capital adequacy ratio for banks with licences at30 Sept 2006 stood at 11.3%, decreased from 14.5% in 2003.
19% of SMEs use commercial credits, mainly small and medium-sized enterprises, asmicro enterprises are not very attractive to the commercial banks. A comparison of
overall loan volume and average loan size figures of major commercial banks operating

7/27/2019 GAP Analysis CZ
http://slidepdf.com/reader/full/gap-analysis-cz 25/51
25
in Czech Republic is quite difficult as the banks are applying substantially different SMEdefinitions.
As part of EIF Guarantee instrument activities in the Czech Republic, Česká spořitelna provides the product Investment credit 5 PLUS. This product is also aimed at start-upSMEs with maximum 100 employees to finance in/tangible assets. Credits are provided
as either mid-term or long-term, with maturity of 3-10 years. Launched in 2004,864 credits were provided amounting to EUR 60 m in total at the end of 2005.
The activities conducted through the EU/EBRD SME Finance Facility are described inchapter 3.2, as they represent both microfinance and debt financing products.
SME support provided under the OP Industry and Enterprise via ČMZRB in theprogramme “KREDIT” is in the form of preferential (subordinated) credit directed at SMEswith maximum 7 years of existence. The table below shows the major features of theprogramme. However, the programme will not be available under the new OP Businessand Innovation.
Form of support Preferential credit (1-2)/Subordinated credit (3)
Type 1-3 1 2 3Minimum/maximum amount ofprovided credit in EUR
7,140 –71,400
71,400 –178,570
17,800 –250,000
Maturity up to 5 years 6 years 8 yearsPostpone possibilities - - 5 yearsFixed interest rate p.a. 4% 4% 3%Up to amount of total project costs 90% 80% 50%
Source: ČMZRB, www.cmzrb.cz
In 2005, ČMZRB provided through the programme PROGRES (Progress):• 117 loans with interest rate 1% p.a. in total amount EUR 25.6 m,
• 40 loans with interest rate 3% p.a. in total amount EUR 14.2 m,
• 4 loans with interest rate 4% p.a. in total amount EUR 0.67 m.
Average loan sizes: EUR 71,428 – EUR 0.9 m.
Guarantee is a commonly offered product by the Czech commercial banks. Conditionson providing guarantees are flexible. Some banks set rules, such as minimum andmaximum guarantee limit with SME history (i.e.: e-Banka sets minimum guaranteeamount on EUR 21,000, HVB Bank on EUR 7,140). They vary and again, they are more-the-less subject to individualisation according to SME history, needs and conditions.Guarantees are provided for example by Živnostenská banka, a.s., Komerční banka, a. s.and Československá obchodní banka, a.s.
More rigid rules are offered by ČMZRB in the programme Záruka (Guarantee). In tablebellow are volumes of provided guarantees by ČMZRB in 2005. These guarantees areprovided on bank credits (up to 80% of the credit security), leasing (up to 70% of thepurchase price of the leased product) or tender offers (guarantee amount EUR 3,500 –EUR 179,000). Guarantee distribution according to regions: 14.2% of ČMZRB guaranteeswere provided in Moravia-silesia region, 13.3% in Pilsner district (South-West region).
7/27/2019 GAP Analysis CZ
http://slidepdf.com/reader/full/gap-analysis-cz 26/51
26
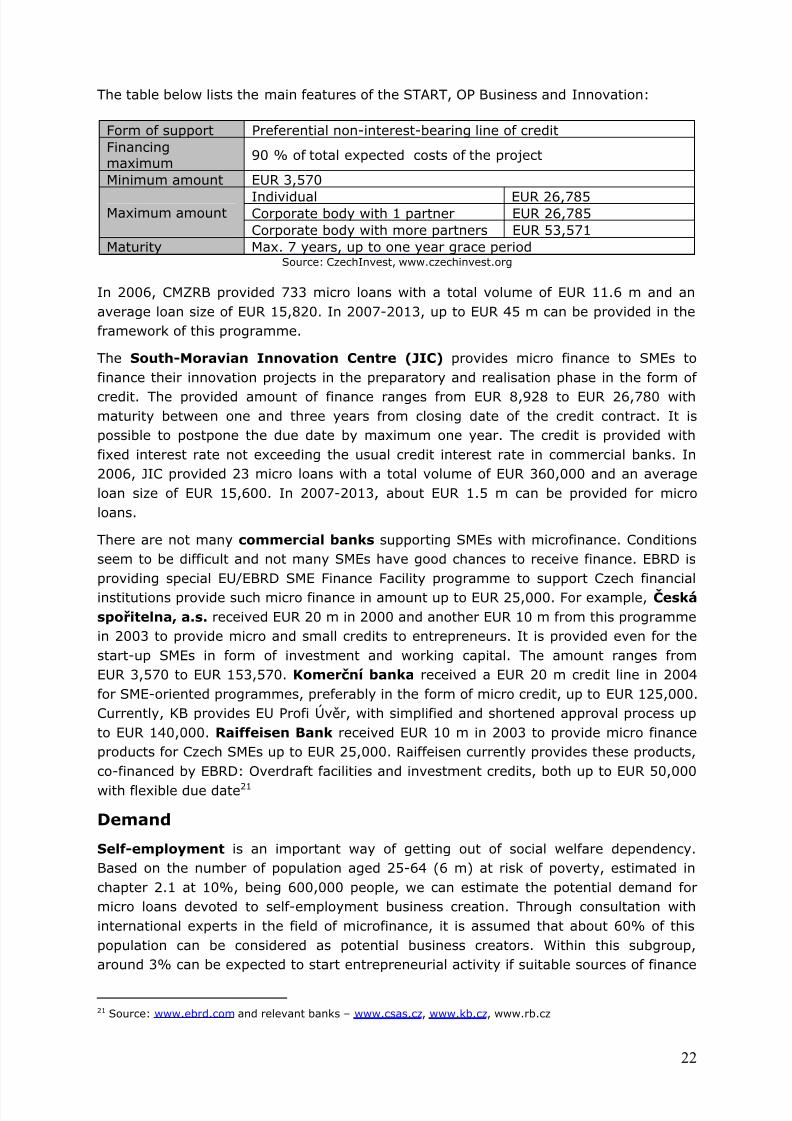
The following table shows the volume of provided guarantees in 2005:
SME Number % m EUR %Guarantees on bank credit and leasing
0-9 131 22.8 27.9 23.010-49 258 44.9 43.9 36.1
50-249 185 32.2 49.8 40.9TOTAL 574 100.0
121.6 100.0
Guarantees on tender offers0-249 251 - 4.3 -Guarantees total0-249 825 - 125.9 -
Source: ČMZRB, www.cmzrb.cz, Annual report 2005
Demand
In the context of a Eurobarometer survey published in July 2006 on “SME Access toFinance in the New Member States”, about 200 companies were interviewed in CzechRepublic on their access to finance situation. It is remarkable that the situation of SMEsseems to be the less positive in Czech Republic (together with Hungary). According to thesurvey, 60% of the SMEs turn to banks in order to obtain financing, although only 44%have a positive attitude to gain access to finance through banks. The table below showsaverage amounts of loan applications in Czech Republic compared to the other new EUmember states:
Source: Flash EB N° 184 – SME’s access to Finance in the NMS
The SMEs consider difficulties in obtaining bank loans for the following reasons:
• Banks request too much information (61.1%)
• The administration of the bank loan application is very demanding (58.2%)
• Loan granting procedures are too long (55.1%)
Amount of loans % of applying companies NMS average
< 25,000 EURO 41.6 52.825,000 – 100,000 EURO 29.6 24.1
> 100,000 EURO 15.8 14.7
7/27/2019 GAP Analysis CZ
http://slidepdf.com/reader/full/gap-analysis-cz 27/51
27
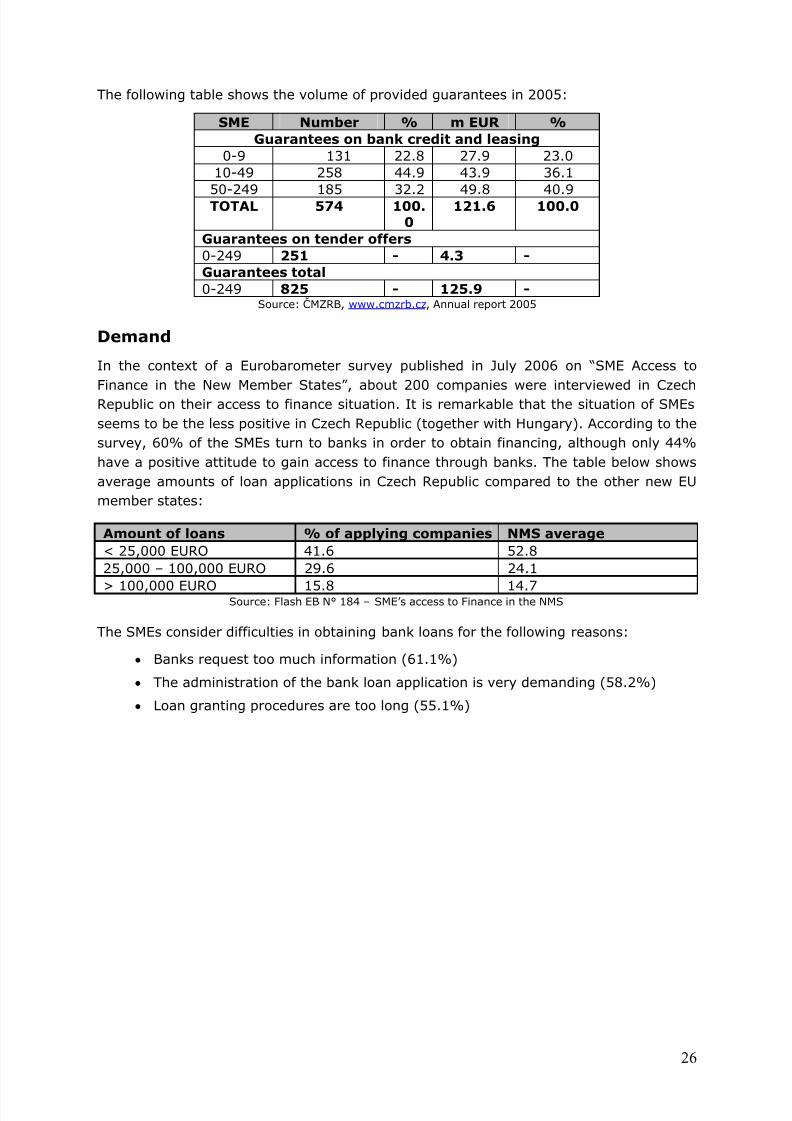
In 2005, the total number of SMEs in Czech Republic stood at about 994,000 and anincrease can be assumed according to the economic growth in the country. In general,banking activities remain the major source of external financing for SMEs. Comparing thefinancial and economic development of Czech Republic with other European countries
shows a clear demand for increased activities in countries with rising GDP23, as shown by
the chart below:
The share of those investing and the average investment size does not seem to berecorded by the Czech Statistical Office; we only got data on average investment shareof all SMEs which lies at about 50% (see chapter on SME characteristics). Compared toother Central European EU member states, the share of investing small and medium-sized enterprises could be assumed to stand at approx. 60% and 80% respectively withaverage investment sizes between EUR 80,000 and EUR 400,000. Resulting from thisassumption, a substantial theoretical demand seems obvious in the coming years.
Another strong indicator for a potential demand is a strong death rate in parallel to arelatively weak birth rate, as stated in the table comparing birth and death rates of SMEsin chapter 2.2. A stronger positive balance between birth and death rates of SMEs inCzech Republic can be assumed with better access to finance.
Market failure & JEREMIE Recommendations
Although a considerable debt financing activity for SMEs exists in the country, asubstantial part of the demand is not being satisfied. This is also visible from the data ondomestic credit as percentage of GDP, which show Czech Republic on par level with somesurrounding countries, but behind some of the best performing new EU member states.
23 Chart source: AECM: European SMEs and the way they are financed – Loan guarantee schemes”, 2006

7/27/2019 GAP Analysis CZ
http://slidepdf.com/reader/full/gap-analysis-cz 28/51
28
With such an impressive growth ratio, Czech Republic is clearly in need of more creditfacilities. The supply-demand gap analysis above shows a certain market failure in thedebt financing sector and the existing guarantee volumes in the country are very lowcompared to the amount of debt financing provided to SMEs.
Subject to further analysis through interviews with key market players in this field, the
implementation of a portfolio guarantee scheme is proposed to address this marketfailure. It reflects the “revolving” aspect of the JEREMIE portfolio and has a high potentialin terms of leverage as well as visibility for the Czech government. It also presents a leanstructure allowing for the outsourcing of certain activities, such as the monitoring of theguaranteed loans. More in particular, a Portfolio Loan Guarantee Scheme wouldincrease and strengthen the co-operation with the financial institutions operating in theCzech Republic as they would maintain the main contact with the final beneficiaries andcould use the guarantee also to expand their activities in the SME segment; furthermore,it would enhance SME access to finance and lower the overall cost of financing and itwould permit to reach a high number of final beneficiaries throughout the country.
According to the results of the further study of the market in this field, an assessment ofthe possibility of ERDF use for more structured transactions, like a securitisation windowcould be conducted. Furthermore, the coverage of leasing instruments if considerednecessary could be envisaged.
An overall initial budget allocation of EUR 100 m for this scheme out of ERDF isrecommended. It will be of paramount importance to involve the major SME-orientedbanks operating in the Czech Republic during the structuring phase in order to set up astructure that on one hand enhances SME access to debt finance and on the othercorresponds to the expectations of the lenders in terms of quality of the guarantee andprocedures required, and provides an appropriate return to the JEREMIE Holding Fund.
Depending on the envisaged portfolio composition in terms of final beneficiaries andoperations covered, as well as the estimated absorption capacity, typically a leverage of10-15 is possible for an SME guarantee fund.
Further research is required in the context of modelling the JEREMIE business portfolio todesign the appropriate financial instrument to address the market failure.
3.4. Leasing
Supply
According to Leaseurope, the European Federation of Leasing Company Associations(www.leaseurope.org), the total amount of leasing activities in Czech Republic amountedto EUR 3.99 bn in 2005, which represents a 17.5% growth rate compared to 2004. Thepenetration rate, defined as new business divided by investment lay at 17.2% in 2005.This is more than in Poland and Slovakia, but considerably less than in Slovenia andHungary. The growth rate 2004/05 lies above the European average (13.75%); whereasthe penetration rate approx. corresponds to the average of 17.45%. In 2005, leasingactivities represented approx. 4.06% of GDP which is only topped by Estonia, Hungaryand Slovenia. According to the Czech Leasing Association (http://www.clfa.cz/), themajor players in the leasing sector in terms of volume were ČSOB Leasing, a.s., CAC
LEASING, a.s., ŠkoFIN s.r.o. and VB Leasing CZ, s.r.o. in 2005.

7/27/2019 GAP Analysis CZ
http://slidepdf.com/reader/full/gap-analysis-cz 29/51
29
Demand
According to the Flash Eurobarometer N° 184 on SME’s Access to Finance in the NMSalready cited before, leasing companies are in the second place to which Czech SMEsturn to obtain financing - more than 30 % of all financing in the Czech Republic are in theform of leasing. Almost 65 % of Czech enterprises have already used leasing. In general,
leasing is the preferred type of financing used by SMEs in EU-15, gradually replacingtraditional debt financing. A continued growth in demand for leasing in Czech Republiccan be expected in the coming years.
Market failure & JEREMIE Recommendations
Given the leasing market’s rapid growth in Czech Republic, the existing marketcompetition and the sufficient funds available for leasing institutions from their parentcompanies, no specific instrument is proposed in the JEREMIE context, as no obviousevidence of a market failure can be observed.
However, leasing guarantees might be useful in certain cases and it is thusrecommended that the country’s guarantee fund includes leasing guarantees in itsoperations. In terms of allocation of financial resources in the framework of theOperational Programme for 2007-2013, it is estimated that the resources proposed forthe loan guarantee scheme should be sufficient to enhance the guarantee activity forleasing transactions.
3.5. Factoring24
Supply
According to T. Morávek, CEO of ČSOB Factoring and chairperson of the Association ofFactoring Companies (AFS ČR), factoring, as a way of financing and managing cash flow,still remains relatively unknown in the Czech Republic25.
EIF commissioned International Factors Group26 to conduct a study on the factoringactivities in all European countries. For Czech Republic, the following supply informationcan be summarized:
Currently 9 factoring companies exist in Czech Republic compared to 7 in 2001. 85% ofprovided factoring products are in the form with recourse. Czech banks started to providefactoring services internally as they were still looking for new ways how to finance SME
based on positive sentiment because of growing economy. The average amount offactoring turnover (assigned receivables in a year) per client is estimated at EUR 2.8 m(60–80% realised by SME clients) and the average amount of factoring financing(borrowed amount at year end) per client at EUR 600,000.
The main players in the market in terms of volume were in 2005 Factoring Ceskésporitelny, TRANSFINANCE a.s., CSOB Factoring a.s. and NLB Factoring a.s.; overallactivities amounted to EUR 2.85 bn. One of ČLFA members, NLB Factoring, will as at endof 2006 bring out to the market two new factoring instruments for SME - Small Factoring
24 EIF and IFG Analysis on Factoring, 200525 Czech Business Weekly, article of 2 October 2006, http://www.cbw.cz/phprs/2006100217.html 26 http://www.ifgroup.com; international factoring association with around 84 factoring members & 15 sponsors
in 50 countries

7/27/2019 GAP Analysis CZ
http://slidepdf.com/reader/full/gap-analysis-cz 30/51
30
and Micro factoring. Conditions of these two products are given in the annex to thisreport.
Currently, there are no regulations towards Factoring in the country and no significantincentives on impediments are currently in place. The following table compares theestimated shares of factoring business in 2005 in Czech Republic, Slovakia and Poland:
Czech Republic Slovakia Poland
Domestic 75 % 69.77 % 91 %Import 5 % 2.56 % 6 %Export 20% 27.67 % 3 %
Source: EIF and IFG Analysis on Factoring, 2005
The penetration ratio (ratio factoring turnover 2005 / GDP of the country) lies at 2.86 inCzech Republic, compared to 2.34 in EU-10+2, 5.96 in EU-25+2 and 6.2 in EU-15, sothere is still substantial room for improvement, but Czech Republic lies above theaverage of its Central European neighbours.
The table below compares the average growth rate of the last five years with selectedother European countries/country groups:
Growth rate in %Czech Republic 22%Slovakia 30.4%Poland 9%EU-10+2 28%EU 25+2 12.2%
Demand
Czech Republic is still expecting a growth of about 5% to 10% annually as the Czecheconomy is predicted to growth in the rate of 5-7%. Furthermore, a growing demand fornon-recourse factoring is expected. There is also strong demand from specific sectors ofeconomy – e.g. construction. The average growth rate lies above EU-25+2, but belowEU-10+2 and well below Slovakia, which can be considered as emerging market forfactoring.
Market failure & JEREMIE Recommendations
Given an average penetration rate and a moderate growth rate in the coming years, anurgent need for public intervention given a proven market failure cannot be observed.
However, an instrument supporting factoring in Czech Republic in the framework of theJEREMIE initiative could be developed if requested.
3.6. Venture Capital (VC)
The availability of risk capital in all its variants is a critical resource for a modern andadaptive economy. The effective exploitation of new knowledge requires acommercialisation process that is conditional on informed, skilled and risk acceptinginvestors both as individuals (Business Angels) and professionals (Venture Capitalists).
7/27/2019 GAP Analysis CZ
http://slidepdf.com/reader/full/gap-analysis-cz 31/51
31
Supply
Early stage venture capital financing is very low in the Czech Republic and is following anegative trend since 2001. Seed and start-up capital only amounts 4% of the EU 25average in 2004. One of the main venture capital influencing factors are the reluctance ofthe management of many companies to lose control over the company after the entry of
the investor’s capital, as well as an insufficient preparedness of most companies forventure capital investments and the relatively high investment threshold27. One of thechallenges for the CVCA is to create a system of statistics reports. Until now, investorshad a relative discretion on the level and format of reporting. Only very little informationabout invested deals is available which makes it difficult to quantify the existing supply ofventure capital activities in Czech Republic.
An integral part of the sector of SMEs is financing from an early stage to expansionfinancing of existing companies through Venture Capital or Business Angels. CVCA (CzechVenture Capital Association) presently formally includes some 30 subjects operating inaccordance with the principles of Private Equity (“PE”) and Venture Capital funds (“VC”)(ref. tolist is in chapter 5.2). However, according to CVCA Chairman Jaroslav Horák, thenumber of active players in the Czech VC market has been steadily decling in recentyears – from 18 funds active in the country in 2001 to 11 as per today - with mostly thesmaller ones (less able to attract foreign capital) exiting the market. He added that theCzech private equity market nonetheless has reached its peak volume in 2005, withEUR 100 m invested, though he indicated that this figure is skewed by four larger buyouttransactions. In the preceding years, the number had remained relatively stable in theEUR 20-30 m range (75% if which is, on average, invested in buyouts).
Nearly all PE funds operating in the Czech Republic are members of the CVCA. The
investment criteria of these funds, excludes investments in the seed and start-up stagesof SME development. Even investments through the expansion stage are limited giventhe minimum investment size of c. EUR 1 m for most funds. Consequently, the majorityof realized transactions are management buyouts or buy-ins and replacement orsecondary purchase transactions.
Currently, there is a rising supply of PE money from mostly foreign funds with targetingeven start-up companies. However, most of these funds are orienting to ICT sector onlyor applying investment criteria, which do not match with entrepreneurs demand(especially minimum size of one individual investment).
Still, there is lack of money flowing into VC industry from pension funds and insurancecompanies. The source of fund capital for VC industry mostly comes form HNWI (HighNet Worth Individual) via their investment companies. However, these investors arerarely organised and do not cooperate with local or international institutions. Some ofthese investors are associate members of the CVCA.
Czech venture capital Funds are not transparent for tax purposes, i.e. revenues derivedby funds are subject to tax at the level of the fund. Dividend income from a Czechcompany is excluded from the tax base of funds, as it is subject to a 15% finalwithholding tax. There is no separate capital gains tax in the Czech Republic. The capital
27 European Trend Chart on Innovation, Annual Innovation Policy Trends and Appraisal Report, Czech Republic,2006

7/27/2019 GAP Analysis CZ
http://slidepdf.com/reader/full/gap-analysis-cz 32/51

7/27/2019 GAP Analysis CZ
http://slidepdf.com/reader/full/gap-analysis-cz 33/51
33
In addition, there are other subjects concentrating on Private Equity that are notmembers of CVCA. Most funds, however, are limited by a whole range of conditions (theminimum amount of investment is, for instance, often set at EUR 2 - 3 m) that can bemet only by medium-sized companies with several years of history. Small companies andespecially start-ups have, therefore, only a very limited opportunity to acquire financial
means from Private Equity funds, or Venture Capitalists. If we compared the situation inCentral Europe, we would find out that unlike Slovakia (Seed Capital Company s.r.o.),Hungary or Poland, the Czech Republic had no state-owned and/or state-managed fundsupporting SMEs.
The following graph shows the stage distribution of the investments in 2005:
Stage distribution of investments in 2005
4%
26%
70%
Expansion
Replacement
CapitalBuyout
Source: CopiRisco CZ
7/27/2019 GAP Analysis CZ
http://slidepdf.com/reader/full/gap-analysis-cz 34/51
34
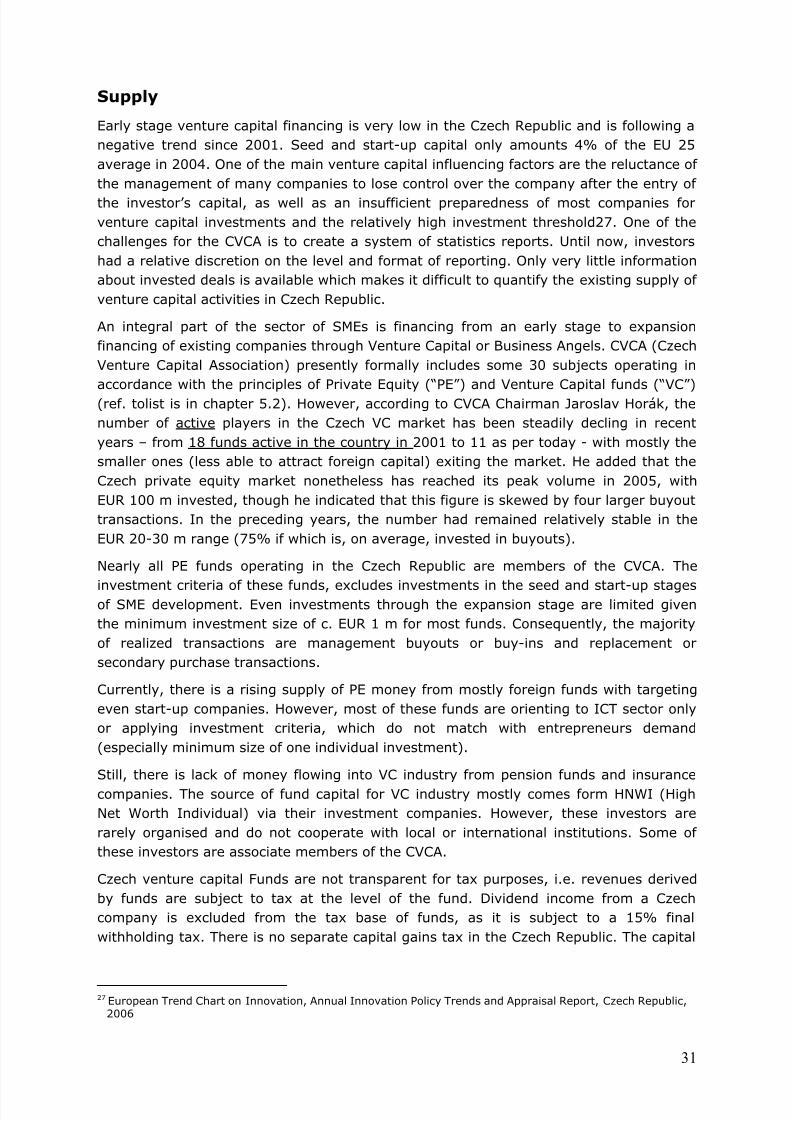
Details on the private equity raised in 2004 and 2005 in the country are given in thetable below:
2004 2005PRIVATE EQUITY RAISED BY SOURCE(in thousand EUR) Amount % Amount %
Independent Funds Raised in Year 0 0,0 105 627 65,0Amount Raised by Captives 2 666 55,1 882 0,6Subtotal New Funds Raised 2 666 55,1 106 509 65,6Realised Capital Gains 2 173 44,9 55 953 34,4Total Funds Raised 4 839 100,0 162 462 100,0PRIVATE EQUITY RAISED BY TYPE OF INVESTORCorporate Investors 0 0,0 100 000 93,9Private Individuals 0 0,0 0 0,0Government Agencies 0 0,0 0 0,0Banks 2 666 100,0 0 0,0Pension Funds 0 0,0 0 0,0Insurance Companies 0 0,0 0 0,0
Fund of Funds 0 0,0 0 0,0Academic Institutions 0 0,0 0 0,0Capital Markets 0 0,0 0 0,0Not Available 0 0,0 6 509 6,1Subtotal New Funds Raised 2 666 100,0 106 509 100,0Realised Capital Gains 2 173 - 55 953 -Total Funds Raised 4 839 - 162 462 -GEOGRAPHICAL BREAKDOWN OF PRIVATE EQUITYRAISEDDomestic 4 839 100,0 0 0,0Other European Countries 0 0,0 162 462 100,0
Non-European Countries 0 0,0 0 0,0Total Funds Raised 4 839 100,0 162 462 100,0EXPECTED ALLOCATION OF FUNDS RAISEDHigh-Tech Early-Stage 0 0,0 0 0,0Non High-Tech Early-Stage 0 0,0 0 0,0High-Tech Expansion/Development 0 0,0 32 492 20,0Non High-Tech Expansion/Development 0 0,0 64 985 40,0Venture Capital 0 0,0 97 477 60,0Buyout 0 0,0 64 985 40,0Other 4 839 100,0 0 0,0
Total Funds Raised 4 839 100,0 162 462 100,0Source: CopiRisco CZ, a.s.
Demand
Almost 97% of Czech enterprises have not yet made use of venture capital28.
It is estimated that the market should reach EUR 130-150 m, at current levels ofeconomic activity. Although this is not far above the current level, the level of investmentin 2005 was significantly skewed by four transactions, accounting for EUR 100 m on atotal EUR 109 m. The “core” underlying number seems to be more in the EUR 25-30 m,at best (e.g. EUR 16 m in 2004). A figure of EUR 130-150 m for the “core” investmentnumber (i.e. cleansed from large “statistically outlying” investments)– would imply a
28 Flash EB N° 184 – SME’ s access to Finance in the NMS

7/27/2019 GAP Analysis CZ
http://slidepdf.com/reader/full/gap-analysis-cz 35/51
35
level of private equity amounting to 0.12% of GDP, better in line with possiblebenchmarks in the region (Hungary: 0.16%, Estonia: 0.12% or Belgium’s 0.16%.
Market Failure & JEREMIE Recommendations
Based on our estimates of potential demand for private equity, the current yearly equity
gap in the Czech market should be approximately EUR 100 m per annum, on the basis of2005 figures. This number would need to be extraopolated over the coming 7 years,factoring in the growth of the Czech economy, but alo the likely evolution of supply –which typically would tend to progressively catch up with demand.
One of the potential solutions is to set up an Early Stage Fund with investment criteriamatching SME demand (see below Investment Criteria). The fund could receive publicfunding, possibly through the JEREMIE mechanism, but private funding should be sought,possibly from strategic investors and, more generally, players that have a stake in andwish to be associated to the healthy development of innovative SMEs in the country.Such a “national” fund could be established in conjunction with the City of Prague, which
also aims to improve the access to equity investments by SMEs in the region of thecapital. This could also be done throught the JEREMIE mechanism, provided that the fundwould invest a portion at least equal to the share of the City of Prague in the fund’s totalcommitments.
Although it ought to be privately (and independently) managed, it is essential for such apublicly backed fund to establish an effective cooperation with all the Czech institutionsinvolved in the support of SMEs. Cheifly among those would be CzechInvest, which hasbeen active in enhancing access to finance for Czech enterprises. Others mightencompass regional development structures, SME/entrepreneurs’ associations, etc.
Such a fund ought to exceed a minimum threshold of critical mass, to allow it to operateat an economically sustainable scale:
• Operationally: the size of the team as well as the reach and visibility of the fundneed to be commensurate with the targeted market;
• Financially; as management fees need to cover the remuneration of team of highprofessional calibre).
Consequently, the size of the fund probably ought to be no less than EUR 60m – up to
EUR 80m. Indicatively, the investment criteria for such a fund might be:
• Minimum deal size (EUR 100,000) and average investment over the lifetime of
an investment (i.e. through successive financing rounds) of EUR 1.5m.• Maturity of company (seed, start-up, expansion stage)
• Equity investment
• Business plan (including financial plan)
• Market potential
• Product
• Management
• Investment horizon (3-5 years)
• Exit (trade sale, MBO, IPO)
• Return (IRR 30%+, cash multiple min. 2x)
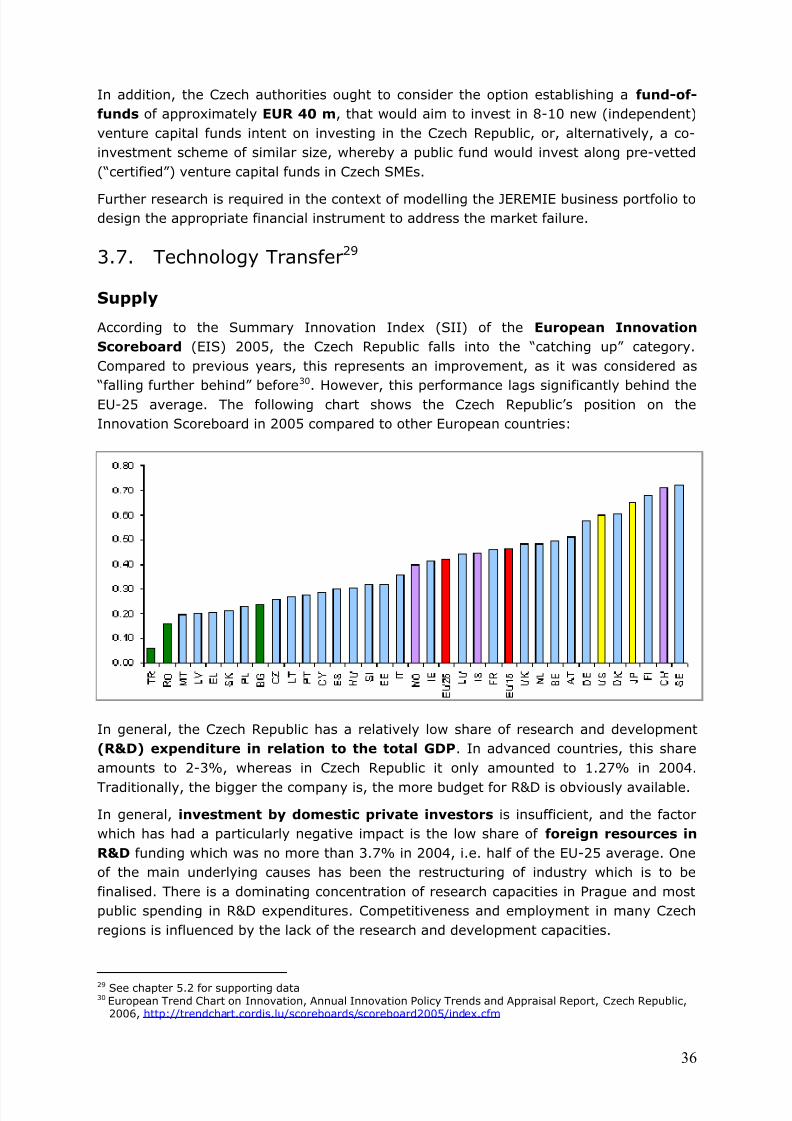
7/27/2019 GAP Analysis CZ
http://slidepdf.com/reader/full/gap-analysis-cz 36/51
36
In addition, the Czech authorities ought to consider the option establishing a fund-of-
funds of approximately EUR 40 m, that would aim to invest in 8-10 new (independent)venture capital funds intent on investing in the Czech Republic, or, alternatively, a co-investment scheme of similar size, whereby a public fund would invest along pre-vetted(“certified”) venture capital funds in Czech SMEs.
Further research is required in the context of modelling the JEREMIE business portfolio todesign the appropriate financial instrument to address the market failure.
3.7. Technology Transfer29
Supply
According to the Summary Innovation Index (SII) of the European Innovation
Scoreboard (EIS) 2005, the Czech Republic falls into the “catching up” category.Compared to previous years, this represents an improvement, as it was considered as
“falling further behind” before30. However, this performance lags significantly behind theEU-25 average. The following chart shows the Czech Republic’s position on theInnovation Scoreboard in 2005 compared to other European countries:
In general, the Czech Republic has a relatively low share of research and development(R&D) expenditure in relation to the total GDP. In advanced countries, this shareamounts to 2-3%, whereas in Czech Republic it only amounted to 1.27% in 2004.
Traditionally, the bigger the company is, the more budget for R&D is obviously available.
In general, investment by domestic private investors is insufficient, and the factorwhich has had a particularly negative impact is the low share of foreign resources in
R&D funding which was no more than 3.7% in 2004, i.e. half of the EU-25 average. Oneof the main underlying causes has been the restructuring of industry which is to befinalised. There is a dominating concentration of research capacities in Prague and mostpublic spending in R&D expenditures. Competitiveness and employment in many Czechregions is influenced by the lack of the research and development capacities.
29 See chapter 5.2 for supporting data30 European Trend Chart on Innovation, Annual Innovation Policy Trends and Appraisal Report, Czech Republic,
2006, http://trendchart.cordis.lu/scoreboards/scoreboard2005/index.cfm

7/27/2019 GAP Analysis CZ
http://slidepdf.com/reader/full/gap-analysis-cz 37/51
37
In total about 25 Business Innovation Centres exist in the Czech Republic. Some ofthem are full or associated members of the European Business Net (EBN). These mainlyprovide consultations on SME projects – on the processing of the projects and on theirfinancing. Some of these offices also provide finance gathered from various activities.These are good source of finance to micro companies.
The South-Moravian Innovation Centre (JIC) is an NGO running the InnovationIncubator, established by Brno University of Technology, South-Moravian district and thecounty borough Brno to fulfil measures of the South-Moravian district’s RegionalInnovation Strategy. The JIC also established a Micro-Credit Fund, which collects financeresources to provide SMEs with micro-finance to realise their innovation projects. TheFund is financed form its activities, from the South-Moravian district, state budget, EUprogrammes and private sources both from JIC members or other private bodies.
The Science and Technology Parks Association (STPA) belongs to the foundingorganisations of the Association of Innovation Entrepreneurship of the Czech Republic.The Association started its activities in 1990 and since that time it actively participates in
the activities of science and technology parks. A table summarizing existing science andtechnology parks in the Czech Republic is given in Annex.
The Czech Republic has an inadequate infrastructure in the area of technology
transfers. Only four centres exist which are truly operational. Even though theestablishment of science and technology parks was receiving support in the past period,with approx. 30 facilities set up, the services provided by these parks still have notattained the same level and the same quality as those of the advanced countries –transfers of technologies and knowledge, or launching new start-ups or spin-offs.
The development of innovation clusters and their support are still in a preliminary
stage in the Czech Republic. Real innovative clusters, capable of boosting the potential ofthe SMEs to launch their own research projects as well as to be able to commissionresearch and development work tailored to their needs, to access affordable training fortheir professional and executive staff and to engage in long-term cooperation with theresearch establishments and universities, are almost non-existent in the Czech Republic.A serious problem faced by some Czech universities and research institutions as well asby businesses is their insufficient involvement in international research and
innovation networks and. Outside the large centres (especially Prague, Brno, Ostrava) itis extremely difficult not just to boost this capability to a comparable level but also to setup and launch new regional innovation systems.
International benchmarking of the Czech Republic in research, development andinnovation revealed the following main barriers in generating and exploiting knowledge31:
Human resources:
• Low number of university graduates and PhD students,
• Low participation in life-long learning,
• Low number of researchers, particularly in the business sector.
R&D financing:
• Low investments in research by private sector,
31 “International Benchmarking of the Czech Republic in Research, Development and Innovation”, Ministry ofRegional Development

7/27/2019 GAP Analysis CZ
http://slidepdf.com/reader/full/gap-analysis-cz 38/51
38
• R&D expenses are the main innovation expenditures only in a low number ofcompanies,
• High share of basic research expenditures (40% of public funds),
• Low expenditures in experimental development.
R&D results:
• Low number of scientific publications,
• Very low number of EPO and USPTO patents.
Innovations:
• Difficult access to financial resources (particularly for start-up companies),
• Innovations are expensive and risky,
• Low innovation expenses in enterprises,
• Low number of high-tech firms,
• Adopting foreign innovations prevails,
• Technology transfer sector is not sufficiently developed.
The charts below compare Czech Republic with Finland and the EU-15 average for thestate of human resources, financing and innovations. The EU-15 average is taken as100% (comparison level), values of indicators for the Czech Republic and Finland arecalculated as percentages of this basis:
0
50
100
150
200
250
Population aged 25-64 with tertiary education
Employees in research with tertiary education
Researchers (FTE) per 1 000 of total employment
R&D employees per 1 000 of total employment
R&D employees in business sector per 1 000 of total employment
Life-long learning in po pulation aged 25-64
Czech Republic
EU15
Finland

7/27/2019 GAP Analysis CZ
http://slidepdf.com/reader/full/gap-analysis-cz 39/51
39
The chart illustrates that the Czech Republic has a limiting factor of small number of workforce in R&D and is lagging behind the EU average in all significant indicators to havehigh quality HR needed for knowledge economy.
This chart shows that spending on R&D in the Czech Republic is strongly influenced byFDI flows and at the same time the relative amounts of public money spend on R&D arealmost reaching EU average levels.
Source: Final Report of the Project on CSF Evaluation, 4/04 Barriers to the Growth of Competitiveness of theCzech Republic
This chart demonstrates the fact that few FDI-based companies with significant R&Dexpenditure are key spenders in R&D. It also shows the tendency to spend most of theR&D funds on equipment.
Demand
According to a Eurobarometer survey, 64% of Czech SMEs are attracted towards
innovative products or services and 54% do use/try new innovative products or servicesat least once. Only 37% of Czech SMEs do not use innovative products freshly launched.
0
50
100
150
200
250
Total R&D expenditures (calculated as % of
GDP)
Public R&D expenditures (calculated as % of GDP)
Private R&D expenditures (calculated as % of
GDP)
Share of foreign firms in private R&D expenditures
Private R&D expenditures (calculated as % of
added-value invested in r esearch)
Early-stage venture capital (calculated as % of GDP)
Expansion venture capital (calculated as % of GDP)
Czech Republic
EU15 Finland
0
50
100
150
200
250
Enterprise expenditures in i nnovation
(calculated as % of t urnover)
R&D expenses are the main innovation expenditures in th e enterprise
Expenditures related to purchase of equipment are the main innovation
expenditures in the enterprise
Share of enterprises with successful innovations
Share of small in novative enterprises
Share of medium innovative enterprises
Share of large innovative enterprises
Share of enterprises witho ut innovation
activities
Czech Republic
EU15
Finland
7/27/2019 GAP Analysis CZ
http://slidepdf.com/reader/full/gap-analysis-cz 40/51
40
At the same time, 48% of the SMEs would replace an old product with an innovative oneonly if this would cost the same32. In the past 3 years, 29% of SMEs invested in thedevelopment of new products 10% of their turnover and 23% of the SMEs invested 11-20% of the turnover. A share of 28% even invested about 50% of their turnover.
In general, demand for strengthening R&D non-grant measures exists in all European
countries, given its proven impact on performance and competitiveness. Also in CzechRepublic, this strong demand for innovative technology transfer and innovationinstruments is substantial to make and keep the economy competitive in the Europeanand global context in the coming years.
Market failure & JEREMIE Recommendations
Effective management of technology transfer is key to improve an economy’s innovationlevel, which is a major priority of the EU Lisbon Strategy. The R&D-to-GDP ratiomentioned above is very low compared to EU-25 which proves insufficient supply in thisfield. Consequently, the enhancement of technology transfer activities is recommended.
Technology transfer offices (TOs) would need to be established/reinforced in keyresearch institutions and networked nationally and possibly internationally, thus enablingan overview of R&D in the country (or part thereof) and the exchange of best practisesbetween TOs.
The establishment of a Technology Transfer Pilot Fund in the framework of JEREMIEcould be envisaged given the potential for strong improvement of the effectiveness of thetechnology transfer process in the country and in order to substitute non-repayable aid,like pre-seed grants with a self-sustaining financial instrument that could benefit fromexternal/private leverage.
Such a pilot fund could initially amount to EUR 10 m, structured to finance about 50projects at EUR 200,000 each. The Fund would need to be managed by appropriatelyqualified investment professionals, combining legal (IP) and investment expertise. Anextension of the Fund could be envisaged in some years if considered appropriate.
Further research is required in the context of modelling the JEREMIE business portfolio todesign the appropriate financial instrument to address the market failure.
3.8. Business Angels
A Business Angel is a private individual who invests part of his personal assets in a start-
up and also shares his personal business management experience with the entrepreneur.A Business Angel network is an organisation whose aim is to facilitate the matching ofentrepreneurs (looking for venture capital) with business angels. Business Angelnetworks tend to remain neutral and generally refrain from formally evaluating businessplans or angels. BANs make a market place for matching services. The majority ofBusiness Angel networks operating in the EU are legally set up as not-for-profitorganisations, private entities, or possibly foundations. Most of them receive publicsupport and very few are commercially oriented. Main activities are: Raising awareness,training, creation of investment-readiness, financing through public support. The number
32 Population Innovation readiness, Special Eurobarometer 236/Wave 63.4 – TNS Opinion & Social

7/27/2019 GAP Analysis CZ
http://slidepdf.com/reader/full/gap-analysis-cz 41/51
41
of networks has strongly evolved in the past few years. In Europe, they are particularlyactive in Germany, France, UK, Sweden and Spain. 33 Supply
According to the European Business Angels Network (www.eban.org), the following two
official business angels networks exist in Czech Republic since 2004:Business Angels Czech (BA Czech) - finalized 5 projects by business angel, each lessthan EUR 1 m.
Angel Investor Association –not providing data about their volume of investments.
Demand
Business financing through informal, individual investors is strongly needed in everycountry. Absence or limited activities restricts significantly the number of new enterprisescreated, especially the most innovative ones which, at their early stages, are very oftenfinanced by business angels. Strengthened technology transfer activities and the
potential deal flow coming from this development will result in an even increased demandfor this type of financing in the coming years.
Market Failure & JEREMIE Recommendation
The market failure in the Business Angels segment in Czech Republic is obvious due tostrong potential demand and low existing supply. As business angels tend to operatewithin limited geographical and sectoral areas, the existence of a well-functioning andefficient network is an important condition preparing the ground for increasing activities.It is thus recommended to help enhancing Business Angels activities in Czech Republicthrough the JEREMIE Programme with a total amount of EUR 5 m for:
• Capacity-building:
Establishment of a fund to stimulate the development of a Business Angel
network in wide geographical and industry areas. Operational costs which arebeyond the JEREMIE scope could be financed by grants.
After some years of capacity-building to establish a network, a pilot project isrecommended:
• Pilot project: “Pool Fund” to stimulate investment readiness
Limited investment provided by business angels stems from aversion to taking
risk by individual investors. Based on EIF’s experience, it is expected that suchreluctance can be overcome by setting up a fund, supported by privatecontributions from business angels as well as JEREMIE contribution, which willpool the expected risk among limited partners. Alternatively, a pilot co-investment facility can be established. Such a fund would provide matchinginvestments at a fixed proportion, alongside selected networks if BusinessAngels.
The operational costs of setting up business angels networks need to be covered throughtechnical assistance grants, as this does not lie in the scope of JEREMIE, which onlycontains revolving instruments. The Pool Fund pilot project proposed in the JEREMIE
33 European Business Angels Network, www.eban.org

7/27/2019 GAP Analysis CZ
http://slidepdf.com/reader/full/gap-analysis-cz 42/51
42
context should then encourage the members of the established business angels networkto do investments by giving a 50/50 contribution in a matching fund or a co-investmentfacility. Further research is required in the context of modelling the JEREMIE businessportfolio to design the appropriate financial instrument to address the market failure.
7/27/2019 GAP Analysis CZ
http://slidepdf.com/reader/full/gap-analysis-cz 43/51
43
4. NEXT STEPS
4.1. Proposed Actions and Responsibilities
This evaluation report was prepared by EIF and is considered as final after presentation
to the Managing Authority and request for feedback and comments. Subject to thepositive decision by the Czech Government on the implementation of the JEREMIEinitiative in cooperation with the EIF, further work is to be done complete the evaluationand prepare for implementation. These tasks include the establishment of the legalframework, business planning and modelling of flows, organisational, governance andprocedural issues. In order to prepare for the implementation of the JEREMIE HoldingFund, the following actions are to be undertaken:
№ Action Responsibility Date
1. Presentation of draft evaluation study to
Czech Government
EIF January 2007
(done)2. Feedback received from Czech Government EIF 20074. Finalisation of Evaluation study EIF 20075. Decision on implementation of JEREMIE in
cooperation with EIFCzech Government As soon as
possible
6. Set up of legal structure and contractnegotiations
EIF + CzechGovernment
As soon aspossible
The gap analysis is an evaluation of the existing supply of and potential demand foraccess to finance of SMEs in a country or region. It is a horizontal activity which theEuropean Commission has asked EIF to perform in all countries interested in JEREMIE.
The legal environment, structuring of the holding fund and modelling of a business planhow to run investments according to the JEREMIE portfolio proposed are separate issueswhich are tackled in cooperation between the government in charge of implementing EUStructural Funds 2007-2013, the European Commission and EIF, once a decision hasbeen taken by the respective Government to implement JEREMIE and to implement itwith EIF involvement. A "roadmap" of JEREMIE implementation steps will be establishedthereafter. An MoU between EIF and Czech Government is not mandatory.
The start of investment activities of the JEREMIE Holding Fund depends on signature ofFunding Agreement between the Managing Authority and the Holding Fund on the basisof the legal structuring of JEREMIE in the country, and on the availability of Structural
Funds means related to OP(s) approval. The JEREMIE Holding Fund can receive fromcontributions from different OPs managed by different Managing Authorities.
As presented to the Czech Government in different letters, there are different options forthe legal structuring of the Holding Fund and private investor's involvement (co-financing) might be possible for example through the European Investment Bank. Thestructuring of the financial instruments will go into more details in the context of thepreparation of the investment strategy and initial business plan of the JEREMIE portfolioin Czech Republic, after a positive decision by the government has been taken. In thecontext of the elaboration of the business plan, the manager of the holding fund issupposed among others to take into account opinions of established market players, e.g.
major financial intermediaries active in Czech Republic.

7/27/2019 GAP Analysis CZ
http://slidepdf.com/reader/full/gap-analysis-cz 44/51
44
A key role of the JEREMIE Holding Fund is to promote the instruments under the JEREMIEportfolio jointly with the selected financial intermediaries among SMEs; according to thespecific demand situation in the country. In addition, for example, training to SMEs onmodern financial engineering instruments could be arranged, if considered necessary. Acentral role of the JEREMIE Holding Fund is to develop the market for the financial
instruments as contained in the JEREMIE portfolio.
4.2. Conclusions on the Role of JEREMIE
As a result of this gap analysis on SME access to finance supply and demand in CzechRepublic, EIF comes to the conclusion that the Czech Republic can draw substantialbenefits from the implementation of the JEREMIE Programme during the next EUbudgetary period 2007-2013. The programme should adopt an appropriate portfolio offinancial instruments, identified in this report and should implement them together withall local institutions involved with maximum participation from the private sector. Inorder for the portfolio to be constantly updated, it should be balanced in nature andshould not shift balance to the benefit of one specific instrument. Moreover, the JEREMIEHolding Fund should have a range of flexibility to meet the dynamic market conditionsthroughout the implementation phase and thus bring substantial advantages to CzechSMEs by facilitating access to finance.

7/27/2019 GAP Analysis CZ
http://slidepdf.com/reader/full/gap-analysis-cz 45/51
45
5. ANNEXES
5.1. Charts and Tables Supporting Chapter 1 and 2
Development of the number of active SME in Czech Republic in years 1997-2005
2000 2001 2002 2003 2004 2005
Number of SMEs - corporate body 102476 111298 134499 148440 144724 143235
Number of SMEs - individuals 658416 634829 679306 840347 847408 850477
Number of SMEs - total 760892 746127 813805 988787 992132 993712Source: Czech Statistical Office, Ministry of Industry and Trade
Number of economically active SMEs
Number of economically active SME
2005 Corporate body Individuals Total SME share34
%
Industry 25 959 133 884 159 843 99,42
Construction 6 581 96 869 103 450 99,93
Merchandise 43 280 190 048 233 328 99,94
Restaurants 5 067 43 631 48 698 99,96
Transportation 5 880 40 556 46 436 99,79
Finance 1 019 14 684 15 703 99,82
Services 52 957 289 761 342 718 99,95
Agriculture 2 492 41 044 43 536 99,92
Total 143 235 850 477 993 712 99,85
Source: Ministry of Industry and Trade, based on data from Czech Statistical office
Number of employees in SMEs
Number of employees (thousands)
2005 Corporate body
0-249 employees
Individuals
0-249
employees
Total
SMEs
Share of SME
employees on total
number
%
Industry 553 108 661 49,96
Construction 126 50 176 78,92
Merchandise 281 112 393 77,06
Restaurants 48 56 104 88,89
Transportation 71 30 101 34,95
Finance 12 1 13 20,00
Services 284 79 363 78,74
Agriculture 107 16 123 86,62
Total 1 482 452 1 934 61,79Source: Ministry of Industry and Trade, based on data from Czech Statistical office
34 on total number of businesses in Czech Republic

7/27/2019 GAP Analysis CZ
http://slidepdf.com/reader/full/gap-analysis-cz 46/51
46
Output of SMEs
Output (million CZK)
2005 Corporate body
0-249
employees
Individuals
0-249
employees
Total SME Share of SME
output on total in
Czech Republic
%
Industry 1 016 931 150 039 1 166 970 36,45
Construction 251 028 66 033 317 061 63,47
Merchandise 414 237 107 273 521 510 82,54
Restaurants 42 550 43 980 86 530 88,49
Transportation 176 417 69 751 246 168 48,07
Finance 36 715 5 875 42 590 21,61
Services 476 224 153 495 629 719 88,03
Agriculture 100 246 26 174 126 420 86,68
Total 2 514 348 622 620 3 136 968 52,27
Source: Ministry of Industry and Trade, based on data from Czech Statistical office
Main macroeconomic indicators in the Czech Republic
Indicator 1999 2000 2001 2002 2003 2004 2005GDP bn CZK, c.p. 2 080,80 2 189,20 2 352,20 2 464,40 2 577,10 2 781,10 2 970,30
GDP/capitaCZK/capita,c.p. 202 357 213 110 230 064 241 593 252 617 272 468 290 232
Number ofemployees %, r/r -2,4 1,3 0,6 0 -0,4 -1 0,7Registeredunemploymentrate %, average 8,54 9,02 8,54 9,15 9,9 10,24 .
Generalunemploymentrate %, average 8,7 8,8 8,1 7,3 7,8 8,3 7,9Average grossnominal wage %, r/r 8,4 6,4 8,7 7,3 6,6 6,6 5,4Average realwage %, r/r 6,2 2,4 3,8 5,4 6,5 3,7 3,4
Inflation rate%, r/r,average 2,1 3,9 4,7 1,8 0,1 2,8 1,9
Financialaccount Balanceof payment billion CZK -50,6 -104,9 -124,5 -136,4 -160,6 -167,3 -61,7Current account
Balance ofpayment billion CZK 106,6 148 172,8 347,8 157,1 183,7 137,9Source: Czech statistical office (ČSÚ)

7/27/2019 GAP Analysis CZ
http://slidepdf.com/reader/full/gap-analysis-cz 47/51
47
The share of the regions in GDP (in %, Czech Republic = 100)
Cohesion Region 2003 2004
Central Bohemia 81,8 93,6
South-West 90,5 90,8
North-West 79,5 82,2
North-East 83,7 85,6
South-East 85,5 90,2
Central Moravia 77,6 80,1
Moravia-Silesia 83,5 82,1
The average 83,2 86,4
Prague 226,0 201,8
Source: Czech Statistical office (ČSÚ)
Population of the Czech Republic
Population of the Czech Republic
10 282 784
10 272 503
10 224 192
10 200 774 10 201 651
10 206 923
10 234 092
10 140 000
10 160 000
10 180 000
10 200 000
10 220 000
10 240 000
10 260 000
10 280 000
10 300 000
1999 2000 2001 2002 2003 2004 2005
Population
Source: Czech Statistical office (ČSÚ)

7/27/2019 GAP Analysis CZ
http://slidepdf.com/reader/full/gap-analysis-cz 48/51
48
5.2. Charts and Tables Supporting Chapter 3
List of Science and Technology Parks in the Czech Republic
Accredited parks
Akademicke a univerzitni centrum, Nove Hrady
BIC Brno, Podnikatel. a inovační centrum, s.r.o., BrnoBIC Ostrava, s.r.o., Ostrava
BIC Plzeň, společnost s ručením omezeným, Plzeň
CTTV - INOTEX, s.r.o., Dvůr Králové n.L.
Podnikatelské a inovační centrum Most, Most
Podnikatelský a inovační park Agritec, s.r.o., Šumperk
Podnikatelský a inovační park H. Brod, s.r.o., Havlí čkův Brod
Regionální inov. centrum Frýdek-Místek, s.r.o., Dobrá
Středisko rozvoje IT OLLI, s.r.o., Brno - sever
Technologický inkubátor VUT v Brně, Brno, U Vodárny 2
Technologický park Chomutov o.p.s., Chomutov
Technologický Park Řež, a.s., Husinec - Řež
TIC ČVUT Praha, Praha
Třeboňské inovační centrum (TIC), Třeboň
Vědecko - technologický park Ostrava, a.s., Ostrava
Vědecko technologický park Dakol, s.r.o., Petrovice u Karviné
Vědeckotechnický park UP v Olomouci, Olomouc
Vědeckotechnický park VZLÚ Praha, a.s., Praha
VTP Agrien, s.r.o., České Budě jovice
VTP Inovační technologické centrum - VÚK, a.s., Panenské Břežany
Parks in process of accreditation
Podnikatelský inkubátor Kroměříž, s.r.o., Kroměříž
Technologické centrum Akademie věd ČR, Praha
Technologické inovační centrum, s.r.o., Zlín
Technologický park Karlovy Vary, s.r.o., Karlovy
Technologický park při VÚTS Liberec, a.s., U Jezu 525/4,Liberec
Parks under preparation
Laboratories, s.r.o., Brno
Podnikatelský inkubátor Vsetín,
Přerovský podnikatelský INKUBÁTOR,
Region.centrum progresivních technologii, Plzeň
Středočeské inovační centrum o.p.s., Zlatníky - Hodkovice
Výzkumný ústav pivovarský a sladařský, a.s., Brno
Source: Science Technology Parks Association,http://eng.svtp.cz/esearch.php3?search=1&output=1akce=temata

7/27/2019 GAP Analysis CZ
http://slidepdf.com/reader/full/gap-analysis-cz 49/51
49
List of the factoring companies established in the country
Company nameFactoringturnover35
Majority shareholderType ofcompany
D.S. Factoring, s.r.o.(1993) 48 Dimension, a.s. (100 %) IC
Factoring České spořitelny,a.s. (1997) 765,5 Česká spořitelna, a.s. (100%) SBFactoring KB, a.s. (1997) 460 Komerční banka, a.s. (100%) SBHVB Factoring, s.r.o.(2004)
33,6 HVB Bank Czech Republic a.s.,(100%) SB
NLB Factoring, a.s. (1994) 345,8 Nova Ljubljanska banka d.d.,Ljubljana (100%)
SB
ČSOB Factoring, a.s.(1992)
557,4 Československá obchodní banka,a.s. (50%), NNB Heller HoldingN.V. Holandsko (50%)
SB
TRANSFINANCE a.s.(1991)
738,7BRE BANK S.A., Warszaw -controlled by Commerzbank (50%), Intermarket Bank A.G., Wien,controlled by BRE BANK (50 %)
SB
HP FINANCE s.r.o. (2002) 80,6 HOPI s.r.o. (80%) ICCASH REFORM, a.s. (1996) 114,2 Mr. Jan Kudera (90%) IC
Division of bank (DB), Subsidiary of bank (SB) or Independent company (IC)Source: EIF and IFG Analysis on Factoring, 2005
NLB Factoring new products
Condition Small Factoring Micro factoringCompany revenue 0, 17- 0,71 M EURO Minimum 71 420 EUROClient Individual or corporate body
with double-entry accountingand minimum one closed fiscalperiod
Individual or corporate bodywith one closed fiscal period
Economy of the client Shareholders´capital in plus,operating profit, maximumamount of external financialresources 50 % of the turnover
Shareholders´capital in plus
Factoring limit 53 570 EURO 10 710 EUROAdvance paymentMaximum maturityMinimum invoice amountInterest rate from financing
80 %90 days
1 780 EURO1M Pribor + 3 % p.a.
Factoring payment Up 1 % Up 1,5 %Security Bill of exchange with aval, assignment of claimsBackground documents Contract with customer or binding order; excerpt form the
Trade register or trade licenses; evidence of economic resultsSource: Econom magazine, 14.-20.12.2006, page 70
35 in 2005, in millions EURO

7/27/2019 GAP Analysis CZ
http://slidepdf.com/reader/full/gap-analysis-cz 50/51

7/27/2019 GAP Analysis CZ
http://slidepdf.com/reader/full/gap-analysis-cz 51/51
programme intends to promote investment in the private sector and to foster thecreation of Joint Ventures.
EU Structural Funds allocated to the Czech Republic for the period between June 2004and the end of 2006 in total amounted to EUR 2.6 bn. There were five OperationalProgrammes dedicated to individual sectors:
Operational programme for EU Structural Funds 2004-06 %Joint Regional Operational Programme 33OP Industry and Business Support 18OP Infrastructure 15OP Human Resources Development 22OP Rural Development and Multifunctional Agriculture 12
Source: CopiRisco CZ, a.s.
Just before the end of 2006, the Czech Republic draw 160% of the Structural Fundsallocation for the year 2004, therefore the implementation has finally reached the criticallimit of the so-called N+2 rule:
Programmes36 Amount spent (m EURO) 2004 spent (%)JROP (ERD) 111.2 116,2%JROP (ESF) 5.19 46,7 %OP HRD (ESF) 30.2 41,0%OP IE (ERDF) 67.13 128,3%OP Infrastructure (ERDF) 87.14 153,8%OP RDMA (EAGGF) 49 128,0%OP RDMA (FIFG) 0.64 18,0%JPD 2 (ERDF) 15.23 66,4%JPD 3 (ESF) 6.75 34,7%