gbta bti™ outlook – western europe · the gbta foundation, the education and research arm of...
TRANSCRIPT

GBTA BTI™ Outlook – Western Europe
Prospects for Domestic & International Outbound Business Travel 2014-2015
2014H2
The European economy lost momentum in 2014H1, delaying progress in
the recovery that began last year. Tight credit conditions, high
unemployment, weak exports, and wary consumers and businesses took
their toll. Business travel, likewise, slowed the pace of its ascent. Despite
abundant risks, 2014 is still shaping up to be a true bounce‐back year for
European business travel, however. Business travel spending will advance
4.9% in 2014, followed by an even stronger 6.6% advance in 2015.

GBTA BTI™ Outlook – Western Europe 2014H2
Page 2
©November2014GBTAanditsaffiliates.Allrightsreserved.Membersmaycopythispublicationinitsentiretyforinternalcompanyuse.
The GBTA Foundation, the education and research arm of the Global Business Travel Association (GBTA), commissioned
Rockport Analytics, LLC to build the first‐ever semiannual business travel outlook for Western Europe, specifically
focusing on the economies of Germany, France, the UK, Spain and Italy. Sponsored by Visa, the purpose is to provide
corporate travel professionals and the broader business community insight into both short‐ and long‐term trends in
domestic and international outbound business travel activity.
The GBTA BTI™ Outlook – Western Europe – 2014H2 projects aggregate business travel trends over the next eight
quarters. The report tracks business travel spending in total and by domestic and outbound segments. It relates
unfolding economic events at home and abroad to their resulting impacts on Europe’s business travel markets. GBTA
BTI™ Outlook – Western Europe 2014H2 is our sixth report in the semi‐annual series. Releases are planned for March
and November for 2014.
Rockport Analytics developed an econometric model to better inform the forecast process. The model explicitly relates
measures of business travel spending, uniquely sourced from other GBTA Foundation research1, to key economic and
market drivers of European business travel including:
Gross Domestic Product (GDP) and its components
Employment & Unemployment
Measures of Business & Consumer Confidence
International Trade, Foreign Direct Investment, and Exchange Rates
Commodity Prices
Oil Prices
Inflation Measures
Productivity Rates for Business Travel
International Air Transport Association (IATA) Passenger and Revenue Performance2
Smith Travel Research (STR) Global Hotel Performance3
CONTACT:
Colleen Lerro Communications & Public relations GBTA 703‐684‐0836 ext. 133 [email protected]
Andy Gerlt Corporate Relations Visa Inc. 650‐432‐8375 [email protected]
1 GBTA BTI™ Outlook – Annual Global Report & Forecast, GBTA Foundation, July 2014. Please see Methodology Notes beginning on page 71 for specific sources and approach. International Air Transportation Association (IATA) quarterly data on premium class revenue performance was also integral to the process. 2 Please see www.iata.org/pa/intelligence_statistics for more information. 3 Please see http://www.str.com/Products/Trend_Reports.aspx for more information.
GBTA BTI™ Outlook – Western Europe 2014H2
Page 3
©November2014GBTAanditsaffiliates.Allrightsreserved.Membersmaycopythispublicationinitsentiretyforinternalcompanyuse.
GBTA BTI™ Outlook – Western Europe PROSPECTS FOR DOMESTIC & INTERNATIONAL OUTBOUND BUSINESS TRAVEL 2014-2015
Executive Summary
The last few years have been extremely challenging for business travel across Western Europe4. The sovereign
debt crisis, which weighed heavily on business spending, hiring, confidence, and borrowing in 2012, continued to
lock many European firms into a defensive state and, as a result, management continued to tighten travel
policies and reduce budgets. Business travel spending in Germany and the UK witnessed small positive growth
rates in 2012, but in Italy, Spain, and France growth tumbled – falling 7.8%, 7.4%, and 2.2%, respectively. The
first two quarters of 2013 brought more deterioration, but as the year progressed, rates of decline began to fall,
indicating the beginning of a turnaround. Following a softer than expected 2014H1, business travel growth will
get back on track for the remainder of 2014 and 2015, expanding by 4.9% and 6.6%, respectively.
Evidence of a European economic recovery was building quickly late last year. Though never expected to be
robust, improving debt imbalances and strengthening bank balance sheets were giving way to better economic
growth. Then came 2014H1. With the exception of the U.K, many northern tier economies began to give back
some of 2013’s hard‐fought momentum while key southern periphery markets stalled. Total Euro Area GDP
advanced by only 0.8% in Q1 (qtr/qtr@ annual rates) and showed no growth in Q2. Why the delay in recovery?
European consumers remain hesitant to buy big ticket items such as cars and appliances, this despite favorable
credit conditions. High unemployment persists and household income has not yet expanded at rates sufficient
to bolster confidence. Exports were also weaker than hoped. Businesses have also been reluctant to borrow,
hire, and invest. Finally, the first half of 2014 saw inventories being drawn down at the expense of new
production.
There is also a great deal of variation in the performance of member countries. GDP growth has been lifted by
welcome performances from the United Kingdom, Sweden, and, even, Spain. With growth of 3.6% (qtr/qtr
annualized) in 2014Q2, the UK has been leading the charge. Meanwhile, Spain quietly moved into positive
growth territory late last year on the strength of both domestic and external demand. Among the stalled
economies during 2014H1 were Italy, France, and Denmark. France has shown no growth in 2014 so far and
Italy retrenched by ‐0.4% and ‐0.8% in the first two quarters of the year, respectively. Even Germany, the
biggest economy in the EU and fourth largest in the world, gave back some momentum in the second quarter,
falling by ‐0.8% in the second quarter.
Businesses may be slowly starting to hire again across Europe, but they remain unconvinced of sustained
forward momentum. Many measures of business confidence are signaling a weak start for the second half of
2014. Investors are likewise bearish about near‐term European economic prospects. And credit markets remain
extremely sluggish. Banks are starting to reawaken to new loan opportunities but risk tolerances remain quite
low. Meanwhile, consumers and businesses are still deleveraging, causing tepid demand for new loans.
4 France, German, Italy, Spain, United Kingdom plus Austria, Belgium, Denmark, Finland, Greece, Ireland, Netherlands, Norway, Portugal, Sweden, Switzerland

GBTA BTI™ Outlook – Western Europe 2014H2
Page 4
©November2014GBTAanditsaffiliates.Allrightsreserved.Membersmaycopythispublicationinitsentiretyforinternalcompanyuse.
Our expectation for economic growth incorporates the first‐half delay but still calls for modest recovery with
low inflation. This is predicated on more favorable credit conditions, slowly improving domestic demand, and
healthier external conditions. Euro Area Real GDP will advance by 0.9% in 2014, a downgrade from our 2014H1
forecast. The following year is essentially the same as our H1 projection with 2015 GDP growth reaching 1.7%.
Meanwhile, inflation will remain well below Europe Central Bank (ECB) targets, due to persistent slack in the
economy and despite continued ECB efforts to stimulate demand. Consumer price inflation will reach only 0.5%
this year and advance by 0.9% in 2015.
While much of the European continent began recovering late last year, 2014 is shaping up to be a true bounce‐
back year for European business travel. In 2014Q1, business travel spending in our five European business
travel markets advanced 4.3% over the first quarter of 2013. These same markets posted a 4.5% annual gain in
the second quarter of 2014. In aggregate for the year, we expect these business travel markets to gain 4.9%
over 2013 spending levels. This represents the largest gain in business travel spending since 2010.
Despite a weak second quarter, the German economy continues to remain one of the most robust in all of
Europe. We remain optimistic about the prospects for German business travel and our forecast remains in line
with our expectations from the first half of the year. Despite potential risks, we expect German business travel
to grow 7.4% in 2014. German business travel will continue to pick up the pace in 2015, growing a projected
10.8%.
Beginning in late 2013, UK business travel has been slowly gaining momentum. Business travel spending is
poised to grow nearly 5% this year and almost 6% next year. Employment growth and both consumer and
business confidence will drive this robust growth in business travel spending. Much like Germany, however,
some downside risks remain, particularly from potential fallout stemming from the Ukrainian situation.
The French economy began to gain momentum in late 2013 and business travel has followed suit. This
momentum has been challenged of late as economic growth has been more tepid than expected, although we
still expect the recovery to pick up steam in the latter half of 2014. Even as French business travel has begun to
recover, our outlook has been downgraded from our expectation in the first half of the year. We expect total
business travel spending to rise by 3.3% in 2014 to $36 billion USD. The growth in business travel spending will
accelerate in 2015, expanding by 4.6% to $38 billion USD.
The Spanish economy has been extremely challenged over the last few years – battling high levels of public debt,
soaring unemployment and stagnating economic growth. The Spanish economy witnessed ten straight quarters
of contraction before finally experiencing growth in late 2013. These economic woes took their toll on Spanish
business travel performance as spending plummeted over the period 2011‐2013. The Spanish economy
appears to be on the mend, however. In fact, economic growth turned positive at the end of 2013 and has
picked up steam every quarter since. Our forecast for Spanish business travel has received the largest upward
revision of all five of our covered markets. We expect total business travel spending to rise 6.3% this year and
another 6.8% in 2015.
Our forecast for Italian business travel has been downgraded for the second time this year. Italy’s economy
continues to lack necessary structural and political reforms necessary for getting the economy back on its feet.
We expect business travel activity will experience some growth over the next six quarters but it will be a slow
recovery, as business confidence remains restrained in light of economic conditions. In 2014, we expect total
business travel spending to gain 1.4%, followed by another 2% gain in 2015. Annual business travel spending in
Italy is projected to reach $31.5 billion USD in 2015.

GBTA BTI™ Outlook – Western Europe 2014H2
Page 5
©November2014GBTAanditsaffiliates.Allrightsreserved.Membersmaycopythispublicationinitsentiretyforinternalcompanyuse.
EUROPEAN ECONOMIC PERFORMANCE
Current Conditions
Evidence of a European economic recovery was building quickly late last year. Though never expected to be robust, improving debt imbalances and strengthening bank balance sheets were giving way to better economic growth. Then came 2014H1. With the exception of the U.K, many northern tier economies began to give back some of 2013’s hard‐fought momentum while key southern periphery markets stalled. GDP growth disappointed in the first half of 2014, particularly during the second quarter. Euro Area (18 country definition) GDP expanded at the anemic rate of only 0.8% (vs.2013Q4 annualized). The second quarter saw no gain vs. Q1 and only 0.7% growth relative to year‐earlier results.
Why the delay? European consumers remain hesitant to buy big ticket items such as cars and appliances, this despite favorable credit conditions. High unemployment persists and household income has not yet expanded at rates sufficient
to bolster confidence. Exports were also weaker than hoped with Chinese growth moderating, the U.S. still thawing out from winter, and some fallout from the Ukrainian situation. Businesses have also been reluctant to borrow, hire, and invest. Finally, the first half of 2014 saw inventories being drawn down at the expense of new production.
There is also a great deal of variation in the performance of member countries. Euro Area GDP growth has been lifted by welcome performances from the likes of the United Kingdom, Sweden, and, even, Spain (see adjacent chart). With growth of 3.6% (qtr/qtr annualized) in 2014Q2, the UK has been leading the charge. Meanwhile, Spain quietly moved into positive growth territory late last year and has been building momentum since. Once a southern periphery growth laggard, Spain is expanding on the strength of improving domestic consumption, investment, and exports. Sweden and other Nordic countries have also been lifting overall EU results, albeit with slightly more volatility.
‐12
‐10
‐8
‐6
‐4
‐2
0
2
4
Euro Area GDP Growth Disappoints During 2014H1
2014Q2 @ 0.7%
Source: Eurostat
2014Q2 @ 0%
Qtr/Qtr % @ Annualized Rates
Yr/Yr %
‐8.0
‐6.0
‐4.0
‐2.0
0.0
2.0
4.0
6.0
2011 2012 2013 2014Qtr/Q
tr % at Annualized Rates
Spain, UK, Sweden Lifting EU GDP Growth…
Sweden: '14Q2 @ 2.8%
Source: Statistics Sweden, UK Office for National Statistics. National Statistics Institute (Spain
United Kingdom
Spain
Sweden Spain: '14Q2 @ 2.4%
UK: '14Q2 @ 3.6%
‐5.0
‐4.0
‐3.0
‐2.0
‐1.0
0.0
1.0
2.0
3.0
4.0
5.0
2011 2012 2013 2014
Qtr/Q
tr % at Annualized Rates
...while Italy, France, and Denmark Stalled
Denmark: '14Q2 @ 0.8%
Source: Statistics Sweden, UK Office for National Statistics. National Statistics Institute (Spain
France
Denmark
Italy France: '14Q2 @ 0.0%Italy: '14Q2 @ ‐0.8%

GBTA BTI™ Outlook – Western Europe 2014H2
Page 6
©November2014GBTAanditsaffiliates.Allrightsreserved.Membersmaycopythispublicationinitsentiretyforinternalcompanyuse.
Among those Euro Area economies that stalled during 2014H1 were Italy, France, and Denmark. France has thus far shown no growth in 2014, and Italy retrenched by ‐0.4% and ‐0.8% in the first two quarters of the year, respectively. Meanwhile, Denmark’s growth was positive‐but‐lackluster during 2014H1. Even Germany, the biggest economy in the EU and fourth largest in the world, gave back some momentum in the second quarter, falling by 0.8% vs. Q1 (annualized rate).
The growth distinction between northern tier and southern periphery countries is beginning to fade away, replaced by differences in the pace of implemented reforms following the worst of the sovereign debt crisis. For example, Germany and Spain were among those to quickly implement sharp cuts in unit labor costs and drastic labor market reforms. This has already boosted exports. On the other hand, France, Italy, and Greece have resisted more drastic reforms leaving behind more rigid labor markets and still deteriorating global competitive positions. Profit margins are
also suffering in these countries, a condition less conducive for investment growth.
And the rest of the world desperately needs Europe to recover and grow. Europe is a major trading partner of many of the world’s largest economies including China (12 percent of total imports), the United States, Russia, and Japan. Moreover, the financial linkages between Europe and the developing world provide much of the capital necessary for growth. A rising tide in Europe will help to lift all economic boats. This is arguably even
truer for business travel activity. The chart above identifies the share of total business travel spending (2013) below each global region. At 24%, Western Europe’s continuing progress is necessary for the sustained recovery of global travel activity.
Unemployment has finally stopped rising in Europe ,yet remains stubbornly high at 11.5% (Aug 2014). Job growth has also been sluggish and, along with it, household income gains. Moreover, consumers continue to deleverage. This has made European consumers reluctant to purchase big ticket items such as car, homes, and appliances. After five years of declining durables purchases, however, there is ample pent‐up demand. By way of example, the chart at left tracks Euro Area auto registrations. After averaging over 950,000 per year from 2000‐2008, registrations have been languishing in the 700‐750k range since late 2012. Big ticket
650
700
750
800
850
900
950
1,000
1,050
1,100
New Auto Registrations (x 1000)
Europeans Have Been Reluctant to Buy Big Ticket Items
Source: European Central Bank
June 2014@738k
2000‐2008 Average @956k

GBTA BTI™ Outlook – Western Europe 2014H2
Page 7
©November2014GBTAanditsaffiliates.Allrightsreserved.Membersmaycopythispublicationinitsentiretyforinternalcompanyuse.
purchases are often cited as catalysts for broader economic growth.
Staying with the theme of European consumers, there is good news in rising total retail sales figures. Total Euro Area retail sales advanced 1.1% in August versus year‐earlier levels, this after averaging +0.6% growth for the first 7 months of 2014. Like other economic indicators, there is significant disparity among the member countries. The chart at left contrasts the UK and Italy with overall Euro Area results. Three‐month moving averages have been calculated to reduce monthly volatility and help amplify underlying trends.
The current fear is that this upward trend in sales will falter. Europe needs consumers to reawaken to help overcome austerity‐driven declines in government spending and convince businesses that ramping up capital spending is necessary. At the moment, indicators such as consumer confidence are not encouraging, however. After bottoming out in October of 2013, two key measures of consumer sentiment began to trend higher (see chart at right). Unfortunately, both turned over in late spring and have since been declining, indicating eroding confidence.
The key to sustainability of consumer spending is most often found in the employment statistics. Even though it is generally considered a lagging economic indicator, job growth is also indicative of improving management confidence and rising incomes. The good news is that Euro Area employment is no longer declining, having added about 115,000 jobs (vs. year‐earlier levels) in the first quarter. The cyclical trend is also clearly up. Even if the second quarter numbers prove to be weaker, we believe the momentum is still positive.
‐6
‐4
‐2
0
2
4
6
3MMA Yr/Yr % Chan
ge
Retail Sales Gathering Steam…3 Month Moving Averages
Euro Area (17 countries) United Kingdom Italy
UK: Aug 2014 @ 3.0%
Source: Eurostat
Italy: Aug 2014 @ ‐0.1%
Euro Area: Aug 2014 @ 0.7%
60
70
80
90
100
110
‐35
‐30
‐25
‐20
‐15
‐10
‐5
0
5 Valu
es ab
ove 100 = R
ising Se
ntim
ent
‐100 to 100, Zero = Neutrality
European Consumers Lost Some Faith in 2014 H1...
Source: European Commission
Sep 2014 @ ‐11.4
Sep 2014 @ 103.6Eurozone Economic
Euro Area Consumer Confidence (left)
‐4,000
‐3,000
‐2,000
‐1,000
0
1,000
2,000
3,000
4,000
Yr/Yr Chan
ge in
Jobs (x1000)
Euro Area Employment No Longer Declining...
2014Q1 @ +114.5k
Source: Eurostat

GBTA BTI™ Outlook – Western Europe 2014H2
Page 8
©November2014GBTAanditsaffiliates.Allrightsreserved.Membersmaycopythispublicationinitsentiretyforinternalcompanyuse.
Businesses may be starting to hire again across Europe, but they are not yet convinced of sustained forward momentum. Measures of business confidence, such as the European Commission’s Business Confidence Index (see green line in chart at right) and Markit’s Purchasing Managers Indexes for Manufacturing & Services (no pictured), are all signaling a weak start for the second half of 2014. Investors are likewise bearish about near‐term European economic prospects. Sentix’s Investor Sentiment Index (blue line) crossed into negative territory in September (@‐9.8) and fell even farther in October.
European credit markets are still extremely sluggish. Banks are starting to reawaken to new loan opportunities after four years of balance sheet repair, but risk tolerance remains quite low. Meanwhile, consumers and businesses are still deleveraging, causing tepid new loan demand. The chart at left tracks growth in consumer and business loans across Europe. Still falling relative to year‐earlier levels, August registered a decline of ‐1.9%. Perhaps the silver lining is that year‐over‐year comparisons continue to improve. Europe needs credit to flow more freely and loan demand to begin to grow in order to build economic momentum. Indeed,
the European Central Bank (ECB) continues to take significant steps to make that happen.
Both the ECB and the Bank of England (BoE) continue to keep policy rates near zero (see chart at right). Moreover, the ECB recently announced its intention to purchase asset‐backed securities in an effort to provide direct injections of liquidity into the ailing economy. This is akin to the Quantitative Easing (QE) programs of both the BoE and US Federal Reserve. ECB President Draghi has vowed even more measures if economic conditions do not sufficiently improve.
‐4%
‐2%
0%
2%
4%
6%
8%
10%
12%
Yr‐on‐Yr %
Euro Area Consumer & Business Loans
Aug 2014 @ ‐1.9%
Still negative, but slowly improving
Source: European Central Bank
‐4
‐3
‐2
‐1
0
1
2
‐50
‐40
‐30
‐20
‐10
0
10
20
30
2008 2009 2010 2011 2012 2013 2014
Index: Ze
ro = N
eutralityIn
dex: Zero = Neutrality
Businesses and Investors Suggesting a Weak Start to H2
Investors Sentiment Index (left) EC Business Confidence (right)
Oct 2014 @‐13.7
Source: European Commission, Sentix
Sep 2014 @ 0.07

GBTA BTI™ Outlook – Western Europe 2014H2
Page 9
©November2014GBTAanditsaffiliates.Allrightsreserved.Membersmaycopythispublicationinitsentiretyforinternalcompanyuse.
With the exception of Germany and Spain, Europe is still waiting on exports to spark growth. Some of the current lethargy is caused by competitiveness losses from the slow pace of labor market reforms mentioned earlier in this report. Yet another cause is slower growth among key trading partners such as China, Russia, Latin America, and intra‐European partners. This continues to weigh on international outbound business travel spending (IOB) as well. The flow of both imports and exports drive IOB. As noted in the chart at left, growth has been difficult to come by in 2014.
Risks at Home and Abroad Also Weigh on Progress
Geopolitical threats abound, the risk of European deflation remains ominous, and fiscal and financial imbalances are far from resolved. While difficult to measure at this juncture, the Ukrainian situation is undoubtedly slowing Europe’s advance. Economic sanctions on Russia have both a real and emotional impact. Moreover, Russia’s economy, a key trading partner, was already faltering even before the annexation of Crimea. Sanctions on individuals, companies, and sectors have slowed the flow of trade in some areas and arguably damaged confidence across many others. And the threat of a possible Russian energy embargo looms like a huge storm cloud over continued European (perhaps even global) economic progress. Indeed, even a short‐lived restriction would likely vault Europe back into recession.
Many countries in the European Union and especially Eastern Europe are highly dependent on Russia to meet their energy needs. The charts below illustrate the deep dependence of Europe on Russian energy. The bottom left graph shows the degree to which key European economies depend upon Russian crude oil. The grey bars depict Russian crude as a percent of all oil imports, while the blue bars depict its share of total oil demand in that country. [Note the lower share of demand in the UK and US where each has its own domestic sources.] The bottom right chart illustrates Russia’s influence on natural gas imports and demand. Although not without pain, Europe could, given time, switch to alternative crude supplies from the North Sea, OPEC, or other exporters. Gas is largely distributed by pipeline, however,
‐30%
‐20%
‐10%
0%
10%
20%
30%
40%
2008 2009 2010 2011 2012 2013 2014
Yr/Yr % Growth in
Trade Volume
Euro Area Trade Growth Still BouncingAround Zero...
July 2014 @ 1.7%
Source: Eurostat
July 2014 @ 1.6%
3Mo Moving Average
Exports plus Imports

GBTA BTI™ Outlook – Western Europe 2014H2
Page 10
©November2014GBTAanditsaffiliates.Allrightsreserved.Membersmaycopythispublicationinitsentiretyforinternalcompanyuse.
something that cannot be altered quickly [witness the many delays in constructing new pipelines that circumvent the Ukraine on their way into Eastern Europe]. In fact, the graph at right shows the almost total dependence of Emerging Europe on Russian oil. Meanwhile, natural gas supplies to Eastern Europe (not depicted) are virtually 100% Russian.
Playing the energy card would also impose tremendous economic costs on the Russian economy as well. As much as 25% of Russian GDP is directly related to energy exports. Even a short‐lived embargo would further curtail an already weak domestic economy and almost certainly plunge Russia into recession. Despite the severity of such a decision, if Russian authorities felt the geopolitical gains outweighed these economic costs, they could yet choose to utilize this leverage.
Whilst the Ukrainian situation, Middle East conflicts, and various independence movements dominate the headlines, we must also remain vigilant to the threat of European deflation.
Falling prices (deflation) may sound beneficial to individual consumers and businesses but from a macroeconomic perspective, it can be debilitating. Expectations of lower prices in the future freeze current spending. Europe’s fledgling recovery can ill‐afford such conditions. The chart at left tracks current rates of consumer inflation. From a cyclical high of 3% reached in November of 2011, inflation has been ratcheting downward culminating in the latest reading of 0.3% (September 2014). Prices are still rising (versus year‐earlier levels) but are dangerously close to crossing into decline.
2013-2014 Economic Outlook
The Euro Area stagnated in 2014Q2 but the recovery has not been derailed. Financial markets continue on edge but credit conditions are still slowly improving. The fallout from the financial crisis, namely high unemployment and debt levels, weak demand, and continuing fiscal imbalances, is far from eradicated. This has kept the recovery slow and tepid, and poses a continuing threat to sustainability. The pace of recovery is also very uneven across Europe –Germany, UK, Sweden, Ireland, and Spain are stronger, while France, Italy, and the Netherlands (among others) are weaker.
Our new growth projections incorporate the first‐half delay while still calling for modest recovery with low inflation. This is predicated on more favorable credit conditions, slowly improving domestic demand, and healthier external circumstances. Euro Area Real GDP will advance by 0.9% in 2014, a downgrade from our 2014H1 forecast (1.2%). The following year is essentially the same as our H1 projection, with 2015 GDP growth reaching 1.7%. Meanwhile, inflation
‐1.0
0.0
1.0
2.0
3.0
4.0
5.0
Yr‐to‐Yr %
Euro Area Inflation Continuing to Decelerate...
Sep [email protected]%
Consumer Price Index ‐All Items
Deflation remains a threat...
Source: Eurostat
GBTA BTI™ Outlook – Western Europe 2014H2
Page 11
©November2014GBTAanditsaffiliates.Allrightsreserved.Membersmaycopythispublicationinitsentiretyforinternalcompanyuse.
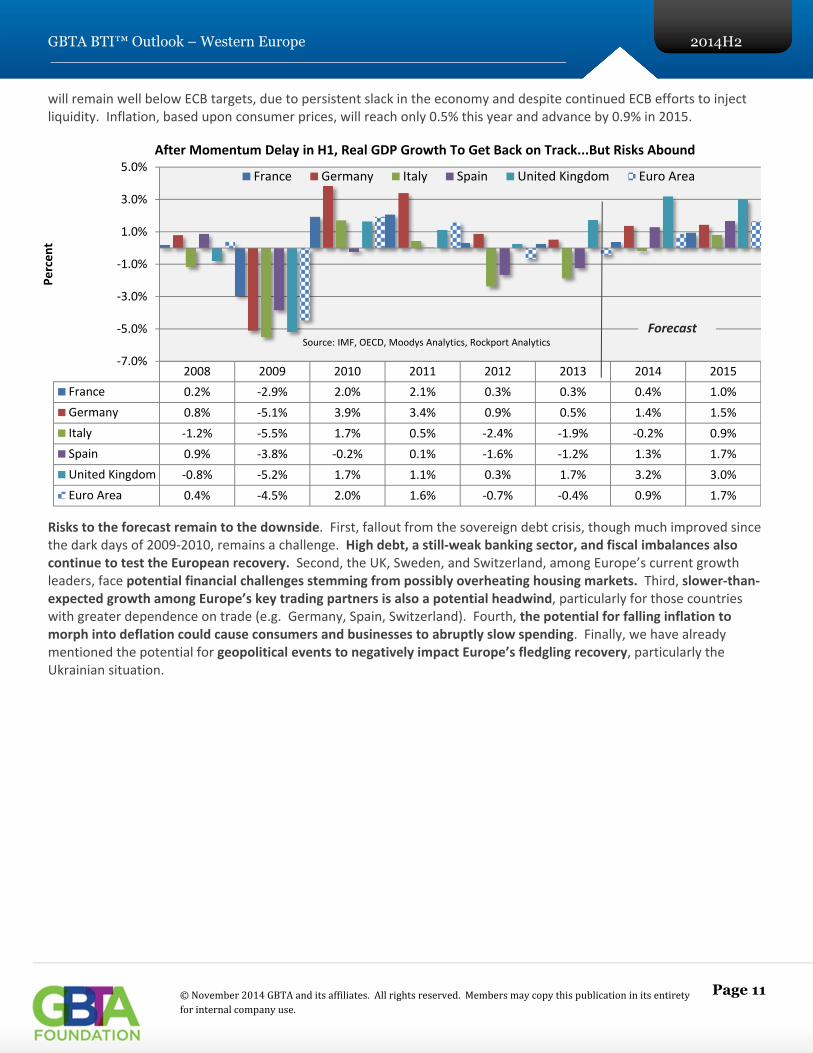
will remain well below ECB targets, due to persistent slack in the economy and despite continued ECB efforts to inject liquidity. Inflation, based upon consumer prices, will reach only 0.5% this year and advance by 0.9% in 2015.
Risks to the forecast remain to the downside. First, fallout from the sovereign debt crisis, though much improved since the dark days of 2009‐2010, remains a challenge. High debt, a still‐weak banking sector, and fiscal imbalances also continue to test the European recovery. Second, the UK, Sweden, and Switzerland, among Europe’s current growth leaders, face potential financial challenges stemming from possibly overheating housing markets. Third, slower‐than‐expected growth among Europe’s key trading partners is also a potential headwind, particularly for those countries with greater dependence on trade (e.g. Germany, Spain, Switzerland). Fourth, the potential for falling inflation to morph into deflation could cause consumers and businesses to abruptly slow spending. Finally, we have already mentioned the potential for geopolitical events to negatively impact Europe’s fledgling recovery, particularly the Ukrainian situation.
2008 2009 2010 2011 2012 2013 2014 2015
France 0.2% ‐2.9% 2.0% 2.1% 0.3% 0.3% 0.4% 1.0%
Germany 0.8% ‐5.1% 3.9% 3.4% 0.9% 0.5% 1.4% 1.5%
Italy ‐1.2% ‐5.5% 1.7% 0.5% ‐2.4% ‐1.9% ‐0.2% 0.9%
Spain 0.9% ‐3.8% ‐0.2% 0.1% ‐1.6% ‐1.2% 1.3% 1.7%
United Kingdom ‐0.8% ‐5.2% 1.7% 1.1% 0.3% 1.7% 3.2% 3.0%
Euro Area 0.4% ‐4.5% 2.0% 1.6% ‐0.7% ‐0.4% 0.9% 1.7%
‐7.0%
‐5.0%
‐3.0%
‐1.0%
1.0%
3.0%
5.0%
Percent
After Momentum Delay in H1, Real GDP Growth To Get Back on Track...But Risks Abound
France Germany Italy Spain United Kingdom Euro Area
Source: IMF, OECD, Moodys Analytics, Rockport AnalyticsForecast

GBTA BTI™ Outlook – Western Europe 2014H2
Page 12
©November2014GBTAanditsaffiliates.Allrightsreserved.Membersmaycopythispublicationinitsentiretyforinternalcompanyuse.
Key European Economic Forecasts 2014H2
Economic Driver
France Germany Italy
2012 2013 2014 2015 2012 2013 2014 2015 2012 2013 2014 2015
Real GDP % Y/Y 1.7 0.2 0.4 1.0 3.1 0.5 1.4 1.5 0.5 -1.8 -0.2 0.9
Consumer Inflation
% Y/Y 2.2 1.0 0.7 0.9 2.1 1.6 0.9 1.2 3.3 1.6 0.1 0.5
Imports % Y/Y 5.2 -0.9 3.1 3.2 1.4 3.1 4.8 5.0 -7.7 -4.3 1.3 2.7
Exports % Y/Y 2.4 1.2 3.4 4.8 3.2 2.8 4.0 4.7 2.3 -0.6 2.0 3.5
Unemployment Rate
% 10.3 11.0 10.0 10.0 5.5 5.6 5.3 5.3 10.7 12.5 12.6 12.0
Employment Mils Persons 25.7 25.7 25.9 26.0 41.5 41.7 40.7 41.0 22.9 22.7 22.4 22.7
Fiscal Balance % GDP –4.8 –4.2 –4.4 –4.3 0.1 -0.4 0.3 0.2 -2.9 -3.2 -3.0 -2.3
Current Account Balance
% GDP -2.2 -1.6 -1.4 -1.0 7.0 6.0 6.2 5.8 -0.7 0.0 1.2 1.2
Economic Driver
Spain United
Kingdom
2012 2013 2014 2015 2012 2013 2014 2015
Real GDP % Y/Y 0.4 -1.3 1.3 1.7 1.0 1.4 3.2 3.0
Consumer Inflation
% Y/Y 2.4 1.8 0.0 0.6 2.8 2.7 1.6 1.8
Imports % Y/Y -5.7 -1.0 4.2 4.5 2.8 -0.1 0.5 3.0
Exports % Y/Y 2.1 5.7 4.1 5.5 0.9 2.2 1.0 3.3
Unemployment Rate
% 25.0 26.9 24.6 23.5 8.0 7.7 6.3 5.8
Employment Mils Persons 17.3 16.6 17.2 17.4 29.5 29.8 30.6 31.0
Fiscal Balance % GDP -10.8 -6.7 -5.7 -4.7 -7.9 -6.1 -5.3 -4.1
Current Account Balance
% GDP -1.1 1.4 0.1 0.4 -3.8 -2.8 -4.2 -3.8
Source: GBTA Foundation, IMF, OECD, European Commission, Rockport Analytics

GBTA BTI™ Outlook – Western Europe 2014H2
Page 13
©November2014GBTAanditsaffiliates.Allrightsreserved.Membersmaycopythispublicationinitsentiretyforinternalcompanyuse.
EUROPEAN BUSINESS TRAVEL PERFORMANCE
Overview
The GBTA BTI™ Outlook – Western Europe includes an analysis of five of the most critical business travel markets in
Europe: Germany, the UK, France, Italy, and Spain. These five markets together form the lion’s share of business travel
in Europe, approaching 70%, and remain a good barometer of
the health of the entire European business travel market.
The last few years have been extremely challenging for business
travel across Western Europe6. The sovereign debt crisis, which
weighed heavily on business spending, hiring, confidence, and
borrowing in 2012, continued to lock many European firms into a
defensive state and, as a result, management continued to
tighten travel policies and reduce budgets. Business travel
spending in Germany and the UK witnessed small positive
growth rates in 2012, but in Italy, Spain, and France spending
tumbled – falling 7.8%, 7.4%, and 2.2%, respectively. The first two quarters of 2013 brought more deterioration but as
the year progressed, rates of decline began to fall, indicating the beginning of a turnaround. Following a softer than
expected 2014H1, business travel growth will get back on track for the remainder of 2014 and 2015.
Total travel spend across the 5 key markets combined to register a gain of 1% in 2013, to $177.7 billion USD (€134B).
Germany remained the largest business travel market in Europe reaching $53.7 billion USD (€40.5) in 2013. In 2013, our
5 key markets comprised roughly 68% of all Western European business travel spending.
While much of the European continent began to recover late last year, 2014 is shaping up to be a true bounce‐back
year for European business travel. In the first quarter, business travel spending in our five European business travel
markets advanced 4.3% versus year‐
earlier levels. These same markets
posted a 4.5% annual gain in the
second quarter of 2014. In
aggregate for the year, we expect
these business travel markets to
gain 4.9% over 2013 spending
levels. This represents the largest
gain in business travel spending
since 2010. These markets have a
long way to go to return to their
former status, but clearly Western
Europe business travel is trending in
the right direction.
5 GBTA BTI™ Global Business Travel Report, July 2013 6France, German, Italy, Spain, United Kingdom plus Austria, Belgium, Denmark, Finland, Greece, Ireland, Netherlands, Norway, Portugal, Sweden, Switzerland
Total Business Travel Spend By Country (2013; MM $USD)5
Germany $53,737 40,450 € United Kingdom $41,288 30,788 € France $35,305 26,013 € Italy $30,522 22,679 € Spain $16,838 12,800 € Other $84,763 66,462 € Total Western Europe $262,453 213,811 €
2.9% 2.7%
‐3.0%
1.0%
4.9%
6.6%
‐4.0%
‐2.0%
0.0%
2.0%
4.0%
6.0%
8.0%
2010 2011 2012 2013 2014f 2015f
Y/Y % Chan
ge
Annual Spending Change Among Five Key Western European Markets

GBTA BTI™ Outlook – Western Europe 2014H2
Page 14
©November2014GBTAanditsaffiliates.Allrightsreserved.Membersmaycopythispublicationinitsentiretyforinternalcompanyuse.
In order to forecast individual domestic and IOB business travel spending in these five countries, we look for the
strongest and most reliable correlations with European economic and market indicators. The indicators are chosen
based upon both statistical testing and economic fundamentals. For example, corporate profits and domestic business
travel spending show a strong and consistent relationship over the course of the business cycle. The following chart
illustrates this correlation by tracking French corporate profits (nonfinancial operating surplus) and domestic business
travel spending over the same time period. Converting each to year‐over‐year percentages, the business cycle becomes
very evident, as does the tight association between the two indicators.
The GBTA Foundation has used statistical methods to determine the strength this relationship and then folds
corporate profits into our econometric model of France domestic travel spending, alongside other travel drivers. Two
interesting takeaways are evident in the graph above. First, French domestic business travel is roughly coincident with
profits over time. Secondly, the correlation would seem to suggest that domestic travel spending should be growing
faster than it actually did over the past few quarters. In other words, profit growth had been strong from mid‐2011
through 2012, but a commensurate bump in travel spending did not materialize. Instead, French domestic travel
spending growth flattened and began to move sideways. The behavior of other travel drivers might account for this
break in the usual pattern (e.g. management confidence was weak during that period). The GBTA Foundation has noted
this same pattern in other BTI™ countries where it appears that, despite relatively strong profit growth, firms have kept
business travel under tight control.
‐20.0%
‐15.0%
‐10.0%
‐5.0%
0.0%
5.0%
10.0%
15.0%
20.0%
‐20.0%
‐15.0%
‐10.0%
‐5.0%
0.0%
5.0%
10.0%
15.0%
20.0%
Yr‐on‐Yr % Chan
ge
France: Corporate Profits* & Business Travel Closely Correlated
Corporate Profits* Business Travel Spending
Source: Eurostat, GBTA Foundation, Rockport Analytics
* Nonfinancial Gross Operating Surplus

GBTA BTI™ Outlook – Western Europe 2014H2
Page 15
©November2014GBTAanditsaffiliates.Allrightsreserved.Membersmaycopythispublicationinitsentiretyforinternalcompanyuse.
Country-Level Business Travel Outlook
Germany
Spending on business travel in Germany totaled $14.3
billion USD in 2014 Q2 (€10.4 billion), on a seasonally
adjusted basis. This represents a 7.5% annual gain in
business travel spend and is on par with the Q2
forecast presented in our GBTA BTI™ Outlook 2014H1
released in March. According to final tallies, spending
on German business travel finished 2013 up 5.6% over
2012, coinciding with a 3.1% increase on the volume of
German business trips as reported by VDR7. The most
recent report by VDR also points to increased average
travel costs of 0.7% in 2013, mainly due to slightly
shorter average trip duration – 2.1 days, down from
2.2 days in 2012.
Despite a weak second quarter, the German economy continues to remain one of the most robust in all of Europe. We
continue to be optimistic about the prospects for German business travel and our forecast remains in line with our
expectations from the first half of the year. There are some additional downside risks in our second half forecast: (1)
business confidence has recently slipped from the measure reported in the spring – this is a key indicator to watch with
respect to German business travel performance; (2) the demand for German exports is falling, particularly from China
and the rest of Europe; and (3) potential fallout from the sanctions placed on Russia over the situation in the Ukraine.
Despite these potential risks, we expect German business travel to grow 7.4% in 2014. German business travel will
continue to pick up the pace in 2015, growing a projected 10.8%.
7VDRBusinessTravelReport2014
$‐
$5,000
$10,000
$15,000
$20,000
Forecast of German BTS: 2014H1 vs. 2014H2millions USD$ (seasonally adjusted)
Germany BTS ‐ 2014 H1
Germany BTS ‐ 2014 H2
$4,000
$6,000
$8,000
$10,000
$12,000
$14,000
$16,000
$18,000
2000 2001 2002 2003 2004 2005 2006 2007 2008 2009 2010 2011 2012 2013 2014 2015
in m
illions of current $US dollars
Total German Business Travel Spendingper Quarter
2014Q2 @ $14.3bil
Source: GBTA Foundation, IATA, Rockport Analytics
Forecast

GBTA BTI™ Outlook – Western Europe 2014H2
Page 16
©November2014GBTAanditsaffiliates.Allrightsreserved.Membersmaycopythispublicationinitsentiretyforinternalcompanyuse.
Spending on domestic business travel in Germany is expected to post its second consecutive year of accelerating growth
in 2014 – surging 5.7% over last year. We expect this growth to again accelerate in 2015 reaching 12.3% over 2014
totals.
International outbound travel from Germany rebounded in 2013, expanding 5.3% over 2012. This followed an abysmal
year in 2012 when IOB fell ‐4.2% on the heels of poor economic performance in Southern Europe and less trade with
both China and the US. We expect IOB spending will grow 6.5% in 2014 but will be tested by slower export growth in
2015 when growth will decelerate to 4.5%.
One of the objectives of the GBTA BTI™ Outlook – Western Europe is to construct a headline measure of the current and
projected level of business travel spending –an index of business travel activity. The GBTA BTI in Germany has been
derived from total business travel spending, the most holistic measure in our database since it reflects the volume of
travel, spending‐per‐trip, and travel prices. An index base year of 2005 was chosen for consistency with the GBTA BTI
in other countries. Specifically, the GBTA BTI in Germany is set equal to 100 in 2005 Q2.
4.3%4.9%
3.3%
5.7%
7.6%
12.3%
0.0%
2.0%
4.0%
6.0%
8.0%
10.0%
12.0%
14.0%
2010 2011 2012 2013 2014f 2015f
Yr/Yr % Chan
ge
German Domestic SpendingAnnual % Change
6.6%
0.8%
‐4.2%
5.3%6.5%
4.5%
‐6.0%
‐4.0%
‐2.0%
0.0%
2.0%
4.0%
6.0%
8.0%
2010 2011 2012 2013 2014f 2015fYr/Yr % Chan
ge
German IOB SpendingAnnual % Change

GBTA BTI™ Outlook – Western Europe 2014H2
Page 17
©November2014GBTAanditsaffiliates.Allrightsreserved.Membersmaycopythispublicationinitsentiretyforinternalcompanyuse.
The GBTA BTI™ in Germany eclipsed its former peak of 136 (achieved in the third quarter of 2008) in the third quarter of 2013 when it reached 137. The Great Recession shaved 26 points from the index, which fell into a slow growth pattern from 2010 to 2012. Through 2013 and early 2014, momentum has been slowly building in German business travel performance.
The GBTA BTI™ in Germany came in at 147 in 2014 Q2, representing an eleven point annual gain. This represents the largest annual gain in the GBTA BTI™ in Germany since 2007.
We expect the GBTA BTI™ in Germany will advance another five points in 2014, reaching 152 by the end of the year. In 2015, growth in the index will continue to pick up momentum, surging to 170 by the end of the year.
104106108110
122124126128
132134136
133
110116118
125120122
125125127128129128129129128
135135136137142145
147148152
158161
166170
0
20
40
60
80
100
120
140
160
180
2006 2007 2008 2009 2010 2011 2012 2013 2014 2015
2005Q2 = 100
GBTA Business Travel Index™ in Germany
Forecast

GBTA BTI™ Outlook – Western Europe 2014H2
Page 18
©November2014GBTAanditsaffiliates.Allrightsreserved.Membersmaycopythispublicationinitsentiretyforinternalcompanyuse.
United Kingdom
The UK has the second highest level of spending on
business travel in Western Europe ‐ $41.3 billion USD
(£26.5 billion) in 2013. Business travel spend rose at an
annual rate of 4.8% in 2014 Q2 and came in slightly
higher than our expectation in the GBTA BTI™ Outlook
2014H1.
The UK economy performed poorly in 2011 and 2012,
which was reflected in its relatively abysmal business
travel performance, particularly in 2012 as international
outbound business travel from the UK plummeted. We
began to see improvements in the UK economy in late
2013 and business travel followed suit, growing nearly 2% in the fourth quarter. Since this time business travel in the UK
has been gaining momentum and business travel spending is poised to grow nearly 5% this year and almost 6% next
year. Employment growth and both consumer and business confidence will drive this robust growth in business travel
spending. Much like Germany, however, some downside risks remain, including potential fallout from the situation in
the Ukraine.
After underperforming International Outbound (IOB) business travel in 2013, domestic business travel is experiencing a
strong bounce back in 2014 and we project annual growth of 5.6% in domestic spending this year. This momentum
should carry over into next year when domestic spending will advance another 7.7%, reaching a total of $30.6 billion
USD. Spending on IOB business travel in the UK is projected to grow 3.7% in 2014 and another 12.1% in 2015, hitting
$11.5 billion USD.
$6,000
$7,000
$8,000
$9,000
$10,000
$11,000
$12,000
$13,000
2000 2001 2002 2003 2004 2005 2006 2007 2008 2009 2010 2011 2012 2013 2014 2015
in m
illions of current $US dollars
Total UK Business Travel Spendingper Quarter
2014Q2 @ $10.7bil
Source: GBTA Foundation, IATA, Rockport Analytics
Forecast
$9,000
$9,500
$10,000
$10,500
$11,000
$11,500
$12,000
Forecast of UK BTS: 2014H1 vs. 2014H2millions USD$ (seasonally adjusted)
UK BTS ‐ 2014 H1
UK BTS ‐ 2014 H2

GBTA BTI™ Outlook – Western Europe 2014H2
Page 19
©November2014GBTAanditsaffiliates.Allrightsreserved.Membersmaycopythispublicationinitsentiretyforinternalcompanyuse.
One of the objectives of the GBTA BTI™ Outlook – Western Europe is to construct a headline measure of the current and
projected level of business travel spending –an index of business travel activity. The GBTA BTI in the UK has been
derived from total business travel spending, the most holistic measure in our database since it reflects the volume of
travel, spending‐per‐trip, and travel prices. An index base year of 2005 was chosen for consistency with the GBTA BTI
in other countries. Specifically, the GBTA BTI in the UK is set equal to 100 in 2005 Q2.
The Great Recession took a significant toll on business travel in the UK. The GBTA BTI™ in the UK shed 31 points between the end of 2007 and the third quarter of 2009. The recovery in business travel spending has not been robust in the UK either. The index has gained only one point per year since 2011.
7.9%
3.2% 3.1%
0.6%
5.6%
7.7%
0.0%
1.0%
2.0%
3.0%
4.0%
5.0%
6.0%
7.0%
8.0%
9.0%
2010 2011 2012 2013 2014f 2015f
Yr/Yr % Chan
ge
UK Domestic SpendingAnnual % Change
0.9%
4.9%
‐3.8%
5.1%
3.7%
2.1%
‐5.0%
‐4.0%
‐3.0%
‐2.0%
‐1.0%
0.0%
1.0%
2.0%
3.0%
4.0%
5.0%
6.0%
2010 2011 2012 2013 2014f 2015f
Yr/Yr % Chan
ge
UK IOB SpendingAnnual % Change
109112
107107
124126128130
117118119
110
103102 99 101
108106107106109111
112 111 112 113115116117118
121123124125
127129
0
20
40
60
80
100
120
140
2006 2007 2008 2009 2010 2011 2012 2013 2014 2015
2005Q2 = 100
GBTA Business Travel Index™ in the UK
Forecast

GBTA BTI™ Outlook – Western Europe 2014H2
Page 20
©November2014GBTAanditsaffiliates.Allrightsreserved.Membersmaycopythispublicationinitsentiretyforinternalcompanyuse.
The UK GBTA BTI™ is finally beginning to pick up and the index has advanced four points over last year. The weak economic environment on the European mainland has been a tremendous drag on the index but it appears that business travel in the UK is moving back to a healthier trajectory.
We estimate that growth of the GBTA BTI™ in the UK will continue to pick up pace through the forecast horizon. The index is projected to gain two points per quarter through 2015, when it will reach 129.

GBTA BTI™ Outlook – Western Europe 2014H2
Page 21
©November2014GBTAanditsaffiliates.Allrightsreserved.Membersmaycopythispublicationinitsentiretyforinternalcompanyuse.
France
French business travel spending totaled $9 billion
USD in 2014 Q2 (€6.6 billion) on a seasonally
adjusted basis. This represents a 1.3% annual gain in
business travel spending. This total is down from the
$9.1 billion projected for Q2 in our 2014H1 BTI™
Outlook. Final totals show that French business
travel spending grew only 0.4% in 2013 after falling ‐
3.6% in 2012.
The French economy began to gain momentum in
late 2013 and business travel has followed suit. This
momentum has been challenged of late as economic
growth has been more tepid than expected, although we still expect the recovery to pick up steam in the latter half of
2014. Even as French business travel has begun to recover, our outlook has been downgraded from our expectation in
the first half of the year. We expect total business travel spending to rise by 3.3% in 2014 to $36 billion USD. The
growth in business travel spending will accelerate in 2015, expanding by 4.6% to $38 billion USD.
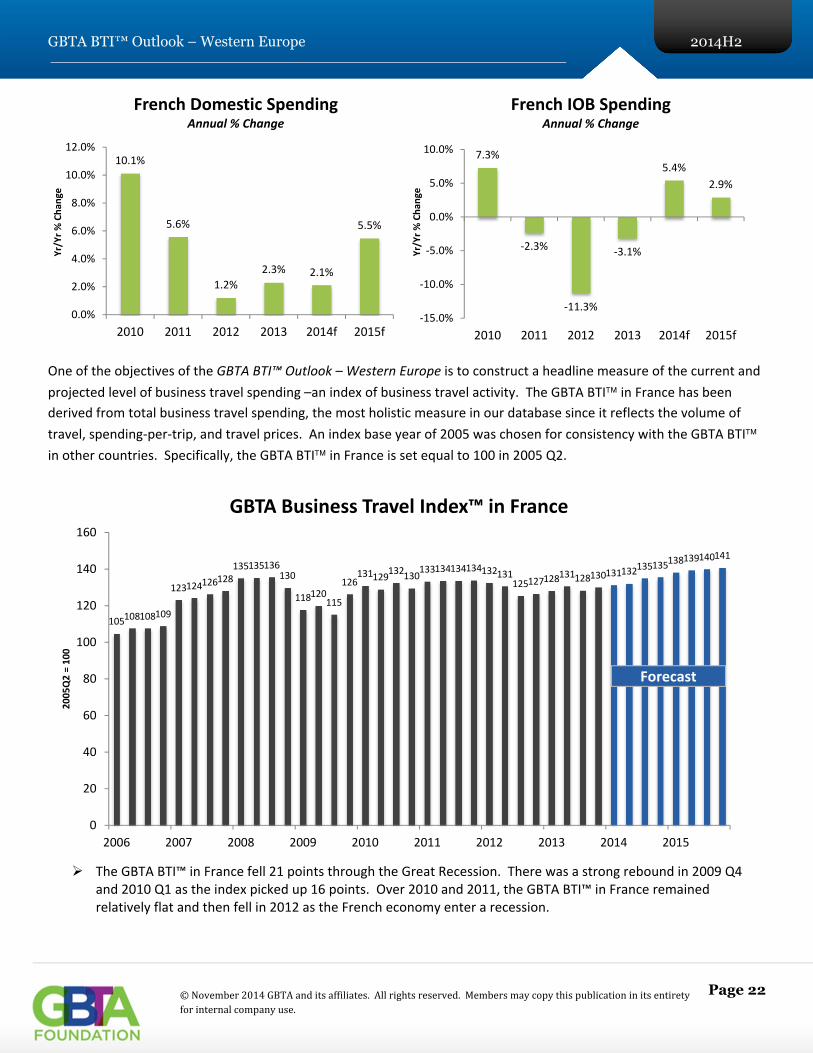
Domestic business travel spending grew 2.3% in 2013. We expect the growth in domestic spending to slow slightly to
2.1% in 2014 before reaching 5.1% in 2015. International outbound spending is expected to grow aggressively this year
–by 5.4%. This is mainly a cyclical snapback from significant declines in 2012 and 2013. Spending on IOB business travel
will moderate to 2.9% next year.
$4,000
$5,000
$6,000
$7,000
$8,000
$9,000
$10,000
2000 2001 2002 2003 2004 2005 2006 2007 2008 2009 2010 2011 2012 2013 2014 2015
in m
illions of current $US dollars
Total French Business Travel Spendingper Quarter
2014Q2 @ $9bil
Source: GBTA Foundation, IATA, Rockport Analytics
Forecast
$7,500
$8,000
$8,500
$9,000
$9,500
$10,000
$10,500
Forecast of French BTS: 2014H1 vs. 2014H2millions USD$ (seasonally adjusted)
France BTS ‐ 2014 H1
France BTS ‐ 2014 H2
GBTA BTI™ Outlook – Western Europe 2014H2
Page 22
©November2014GBTAanditsaffiliates.Allrightsreserved.Membersmaycopythispublicationinitsentiretyforinternalcompanyuse.
One of the objectives of the GBTA BTI™ Outlook – Western Europe is to construct a headline measure of the current and
projected level of business travel spending –an index of business travel activity. The GBTA BTI in France has been
derived from total business travel spending, the most holistic measure in our database since it reflects the volume of
travel, spending‐per‐trip, and travel prices. An index base year of 2005 was chosen for consistency with the GBTA BTI
in other countries. Specifically, the GBTA BTI in France is set equal to 100 in 2005 Q2.
The GBTA BTI™ in France fell 21 points through the Great Recession. There was a strong rebound in 2009 Q4 and 2010 Q1 as the index picked up 16 points. Over 2010 and 2011, the GBTA BTI™ in France remained relatively flat and then fell in 2012 as the French economy enter a recession.
10.1%
5.6%
1.2%
2.3% 2.1%
5.5%
0.0%
2.0%
4.0%
6.0%
8.0%
10.0%
12.0%
2010 2011 2012 2013 2014f 2015f
Yr/Yr % Chan
ge
French Domestic SpendingAnnual % Change
7.3%
‐2.3%
‐11.3%
‐3.1%
5.4%
2.9%
‐15.0%
‐10.0%
‐5.0%
0.0%
5.0%
10.0%
2010 2011 2012 2013 2014f 2015f
Yr/Yr % Chan
ge
French IOB SpendingAnnual % Change
105108108109
123124126128
135135136130
118120115
126131129
132130133134134134132131
125127128131128130131
132135135138
139140141
0
20
40
60
80
100
120
140
160
2006 2007 2008 2009 2010 2011 2012 2013 2014 2015
2005Q2 = 100
GBTA Business Travel Index™ in France
Forecast

GBTA BTI™ Outlook – Western Europe 2014H2
Page 23
©November2014GBTAanditsaffiliates.Allrightsreserved.Membersmaycopythispublicationinitsentiretyforinternalcompanyuse.
The GBTA BTI™ in France slowly began to recover in late 2012 and early 2013 but dropped again to 128 in the third quarter of 2013. Growth in business travel activity over the last three quarters has been tepid and the GBTA BTI™ in France has gained only a point per quarter.
While we believe the GBTA BTI™ in France has bottomed, we expect a weak French economy will continue to
shackle robust growth in the index over the next six quarters. The index is projected to amass 10 more points through next year on its way to a value of 141.

GBTA BTI™ Outlook – Western Europe 2014H2
Page 24
©November2014GBTAanditsaffiliates.Allrightsreserved.Membersmaycopythispublicationinitsentiretyforinternalcompanyuse.
Spain
Spanish business travel spending totaled $4.5 billion
USD in 2014 Q2 on a seasonally adjusted basis. This
represents a 6.7% annual gain in spend, and is
notably higher than the $4.4 billion we projected for
Q2 in our GBTA BTI™ Outlook 2014H1. Spending on
business travel in Spain totaled an estimated $16.8
billion USD in 2013 (€12.7 billion), down ‐4.8% from
$17.7 billion USD in 2012.
The Spanish economy has been extremely
challenged over the last few years – battling high
levels of public debt, soaring unemployment and stagnating economic growth. The Spanish economy witnessed ten
straight quarters of contraction before finally experiencing growth in late 2013. These economic woes took their toll on
Spanish business travel performance as spending plummeted over the period 2011‐2013. The Spanish economy appears
to be on the mend, however. In fact, economic growth turned positive at the end of 2013 and has picked up steam every
quarter since. The IMF recently issued its revised economic forecast for the Spanish economy and expects it will grow by
1.3% in 2014 and by 1.7% in 2015, up from July’s forecasts of 1.2% growth this year and 1.6% growth next year. This
represents the fastest growth among all advanced European economies. Likewise, our forecast for Spanish business
travel has received the largest upward revision of all five of our covered markets. We expect total business travel
spending to rise 6.3% this year and another 6.8% in 2015.
Domestic and international outbound travel spending both witnessed declines in 2013, falling an estimated ‐4.5% and ‐
6.2%, respectively. And both are poised for a significant turnaround in 2014, as spending domestic business travel will
expand by 4.6% and IOB spending will surge 12.7%. In 2015, domestic business travel will pick up the pace growing 7.4%
as IOB spending growth moderates to 4.6%.
$3,500
$4,000
$4,500
$5,000Forecast of Spanish BTS: 2014H1 vs. 2014H2
millions USD$ (seasonally adjusted)
Spain BTS ‐ 2014 H1
Spain BTS ‐ 2014 H2
$1,500
$2,000
$2,500
$3,000
$3,500
$4,000
$4,500
$5,000
$5,500
$6,000
2000 2001 2002 2003 2004 2005 2006 2007 2008 2009 2010 2011 2012 2013 2014 2015
in m
illions of current $US dollars
Total Spanish Business Travel Spendingper Quarter
2014Q2 @ $4.5bil
Source: GBTA Foundation, IATA, Rockport Analytics
Forecast

GBTA BTI™ Outlook – Western Europe 2014H2
Page 25
©November2014GBTAanditsaffiliates.Allrightsreserved.Membersmaycopythispublicationinitsentiretyforinternalcompanyuse.
One of the objectives of the GBTA BTI™ Outlook – Western Europe is to construct a headline measure of the current and
projected level of business travel spending –an index of business travel activity. The GBTA BTI in Spain has been
derived from total business travel spending, the most holistic measure in our database since it reflects the volume of
travel, spending‐per‐trip, and travel prices. An index base year of 2005 was chosen for consistency with the GBTA BTI
in other countries. Specifically, the GBTA BTI in Spain is set equal to 100 in 2005 Q2.
The GBTA BTI™ in Spain shed 24 points during the Great Recession, from a high of 148 in 2008 Q3 down to 124 in 2009 Q3, but saw a significant recovery in the late 2009 and early 2010, bouncing back to 144.
6.7%
‐3.3%
‐6.2%
‐4.5%
4.6%
7.4%
‐8.0%
‐6.0%
‐4.0%
‐2.0%
0.0%
2.0%
4.0%
6.0%
8.0%
10.0%
2010 2011 2012 2013 2014f 2015f
Yr/Yr % Chan
ge
Spanish Domestic SpendingAnnual % Change
8.8%
‐0.2%
‐17.9%
‐6.2%
12.7%
4.6%
‐20.0%
‐15.0%
‐10.0%
‐5.0%
0.0%
5.0%
10.0%
15.0%
2010 2011 2012 2013 2014f 2015f
Yr/Yr % Chan
ge
Spanish IOB SpendingAnnual % Change
109111113
114
131134136137
146147148
139
126126124
138144
137135134135135134131129125
117118115115115119120
123125126129
130133135
0
20
40
60
80
100
120
140
160
2006 2007 2008 2009 2010 2011 2012 2013 2014 2015
2005Q2 = 100
GBTA Business Travel Index™ in Spain
Forecast

GBTA BTI™ Outlook – Western Europe 2014H2
Page 26
©November2014GBTAanditsaffiliates.Allrightsreserved.Membersmaycopythispublicationinitsentiretyforinternalcompanyuse.
Business travel in Spain has been extremely challenged over the last few years and the GBTA BTI™ in Spain has been on a downhill ride. The index finally saw positive growth in the last quarter of 2013 and has picked up some positive momentum over the first two quarters of 2014.
We expect growth in the index to continue to gain momentum over the next six quarters as the Spanish economy improves. The GBTA BTI™ in Spain will gain another 10 points by the end of next year on its way to 135.

GBTA BTI™ Outlook – Western Europe 2014H2
Page 27
©November2014GBTAanditsaffiliates.Allrightsreserved.Membersmaycopythispublicationinitsentiretyforinternalcompanyuse.
Italy
Spending on business travel in Italy totaled
$30.5 billion USD (€22.9 billion) in 2013,
down ‐3.8% from $31.7 billion USD in 2012.
Total business travel spending hit $7.7 billion
USD in 2014 Q2, up 1.1%, year‐over‐year but
down from the $7.8 billion second quarter
spending total that we expected in our GBTA
BTI™ Outlook 2014H1.
Our forecast for Italian business travel has
been downgraded for the second time this
year. Italy’s economy continues to lack the
structural and political reforms necessary for
getting the economy back on its feet. Burdensome public debt continues to plague the Italian economy and with weak
growth and low inflation, the public debt‐to‐GDP ratio will not begin to fall before 2016. The IMF’s latest forecast
projects a 0.1% decline in Italy’s GDP in 2014, followed by 1.1% growth in 2015. We expect business travel activity will
experience some growth over the next six quarters but it will be a slow recovery, as business confidence remains
restrained in light of economic conditions. In 2014, we expect total business travel spending to gain 1.4%, followed by
another 2% advance in 2015. Annual business travel spending in Italy is projected to reach $31.5 billion USD in 2015.
Spending on domestic business travel in Italy will rise 1% in 2014 after falling ‐4.2% in 2013. The rate of growth in
domestic spending will increase slightly in 2015, as spending levels advance 1.5% versus 2014 levels. International
outbound business travel is projected to perform significantly better than domestic travel – spending is projected to
grow 4.7% in 2014 and another 6.7% in 2015.
$7,000
$7,200
$7,400
$7,600
$7,800
$8,000
$8,200Forecast of Italian BTS: 2014H1 vs. 2014H2
millions USD$ (seasonally adjusted)
Italy BTS ‐ 2014 H1
Italy BTS ‐ 2014 H2
$1,500
$2,500
$3,500
$4,500
$5,500
$6,500
$7,500
$8,500
$9,500
$10,500
2000 2001 2002 2003 2004 2005 2006 2007 2008 2009 2010 2011 2012 2013 2014 2015
in m
illions of current $US dollars
Total Italian Business Travel Spending per Quarter
2014Q2 @ $7.7bil
Source: GBTA Foundation, IATA, Rockport Analytics
Forecast

GBTA BTI™ Outlook – Western Europe 2014H2
Page 28
©November2014GBTAanditsaffiliates.Allrightsreserved.Membersmaycopythispublicationinitsentiretyforinternalcompanyuse.
One of the objectives of the GBTA BTI™ Outlook – Western Europe is to construct a headline measure of the current and
projected level of business travel spending –an index of business travel activity. The GBTA BTI in Italy has been derived
from total business travel spending, the most holistic measure in our database since it reflects the volume of travel,
spending‐per‐trip, and travel prices. An index base year of 2005 was chosen for consistency with the GBTA BTI in
other countries. Specifically, the GBTA BTI in Italy is set equal to 100 in 2005 Q2.
1.8%
3.5%
‐9.7%
‐4.2%
1.0% 1.5%
‐12.0%
‐10.0%
‐8.0%
‐6.0%
‐4.0%
‐2.0%
0.0%
2.0%
4.0%
6.0%
2010 2011 2012 2013 2014f 2015f
Yr/Yr % Chan
ge
Italian Domestic SpendingAnnual % Change
10.8%
‐0.6%
‐13.9%
‐0.2%
4.7%6.5%
‐20.0%
‐15.0%
‐10.0%
‐5.0%
0.0%
5.0%
10.0%
15.0%
2010 2011 2012 2013 2014f 2015f
Yr/Yr % Chan
ge
Italian IOB SpendingAnnual % Change
105107107107
122125126125
131133132130
97
112
130126
118119118123123125123
120116115
106105105106106107107108108108109110
110111
0
20
40
60
80
100
120
140
2006 2007 2008 2009 2010 2011 2012 2013 2014 2015
2005Q2 = 100
GBTA Business Travel Index™ in Italy
Forecast

GBTA BTI™ Outlook – Western Europe 2014H2
Page 29
©November2014GBTAanditsaffiliates.Allrightsreserved.Membersmaycopythispublicationinitsentiretyforinternalcompanyuse.
The GBTA BTI™ in Italy took a huge one‐quarter hit in 2009 Q1 as the index dropped 130 to 97. It recovered just as sharply over the next two quarters but fell again in early 2010.
The GBTA BTI™ in Italy slid hard in 2011 and early 2012. Over the last two years the index has moved essentially sideways – gaining only one point over the period.
We expect the GBTA BTI™ in Italy will continue to grow at an extremely slow pace over the next six quarters. We expect the index will only pick up two more points in 2014 and four more points in 2015, ending the year at 111 – only 11% higher than its base year of 2005.

GBTA BTI™ Outlook – Western Europe 2014H2
Page 30
©November2014GBTAanditsaffiliates.Allrightsreserved.Membersmaycopythispublicationinitsentiretyforinternalcompanyuse.
FORECAST TABLES 2014H2: ANNUAL & QUARTERLY
Total Business Travel Spending (in US Dollars) 2012-2015 (Quarterly)
UK Germany France Spain Italy
BTS ($MM) Y/Y % BTS ($MM) Y/Y % BTS ($MM) Y/Y % BTS ($MM) Y/Y % BTS ($MM) Y/Y %
2012Q1 $10,105 2.3% $12,591 1.9% $9,044 -0.6% $4,667 -4.6% $8,343 -5.8%
2012Q2 $10,069 0.2% $12,646 1.5% $8,916 -2.2% $4,515 -7.7% $8,248 -8.2%
2012Q3 $10,118 -0.1% $12,468 -1.2% $8,560 -6.2% $4,243 -12.9% $7,600 -14.3%
2012Q4 $10,143 0.3% $13,164 5.0% $8,651 -5.4% $4,270 -10.3% $7,540 -12.4%
2013Q1 $10,212 1.1% $13,188 4.7% $8,746 -3.3% $4,164 -10.8% $7,526 -9.8%
2013Q2 $10,203 1.3% $13,311 5.3% $8,915 0.0% $4,179 -7.4% $7,643 -7.3%
2013Q3 $10,390 2.7% $13,406 7.5% $8,766 2.4% $4,185 -1.4% $7,641 0.5%
2013Q4 $10,482 3.3% $13,832 5.1% $8,878 2.6% $4,310 0.9% $7,712 2.3%
2014Q1 $10,591 3.7% $14,130 7.1% $8,961 2.5% $4,336 4.1% $7,694 2.2%
2014Q2 $10,691 4.8% $14,316 7.5% $9,029 1.3% $4,459 6.7% $7,726 1.1%
2014Q3 $10,933 5.2% $14,466 7.9% $9,212 5.1% $4,517 8.0% $7,747 1.4%
2014Q4 $11,117 6.0% $14,811 7.1% $9,251 4.2% $4,582 6.3% $7,770 0.7%
2015Q1 $11,277 6.5% $15,392 8.9% $9,434 5.3% $4,670 7.7% $7,800 1.4%
2015Q2 $11,360 6.3% $15,734 9.9% $9,516 5.4% $4,722 5.9% $7,871 1.9%
2015Q3 $11,529 5.5% $16,218 12.1% $9,557 3.7% $4,815 6.6% $7,924 2.3%
2015Q4 $11,679 5.1% $16,633 12.3% $9,616 3.9% $4,909 7.1% $7,969 2.6%
Source: GBTA Foundation, Rockport Analytics
Total Business Travel Spending (in US Dollars) 2011-2015 (Annual)
UK Germany France Spain Italy
BTS ($MM) Y/Y % BTS ($MM) Y/Y % BTS ($MM) Y/Y % BTS ($MM) Y/Y % BTS ($MM) Y/Y %
2011 $40,162 3.8% $49,976 4.0% $36,494 2.4% $19,420 -2.6% $35,324 3.0%
2012 $40,435 0.7% $50,869 1.8% $35,171 -3.6% $17,695 -8.9% $31,731 -10.2%
2013 $41,288 2.1% $53,737 5.6% $35,305 0.4% $16,838 -4.8% $30,522 -3.8%
2014 $43,331 4.9% $57,722 7.4% $36,453 3.3% $17,894 6.3% $30,937 1.4%
2015 $45,845 5.8% $63,977 10.8% $38,123 4.6% $19,116 6.8% $31,564 2.0%
Source: GBTA Foundation, Rockport Analytics

GBTA BTI™ Outlook – Western Europe 2014H2
Page 31
©November2014GBTAanditsaffiliates.Allrightsreserved.Membersmaycopythispublicationinitsentiretyforinternalcompanyuse.
GBTA BTI™ in Europe 2012-2015
UK Germany France Spain Italy 2012Q1 111 129 132 129 116 2012Q2 111 129 131 125 115 2012Q3 112 128 125 117 106 2012Q4 112 135 127 118 105 2013Q1 113 135 128 115 105 2013Q2 113 136 131 115 106 2013Q3 115 137 128 115 106 2013Q4 116 142 130 119 107 2014Q1 117 145 131 120 107 2014Q2 118 147 132 123 108 2014Q3 121 148 135 125 108 2014Q4 123 152 135 126 108 2015Q1 124 158 138 129 109 2015Q2 125 161 139 130 110 2015Q3 127 166 140 133 110 2015Q4 129 170 141 135 111 Source: GBTA Foundation, Rockport Analytics
Total Domestic Business Travel Spending (in US Dollars) 2012-2015 (Quarterly)
UK Germany France Spain Italy
BTS ($MM) Y/Y % BTS ($MM) Y/Y % BTS ($MM) Y/Y % BTS ($MM) Y/Y % BTS ($MM) Y/Y %
2012Q1 $6,647 4.7% $10,145 4.1% $5,580 1.5% $3,608 -3.9% $7,425 -5.8%
2012Q2 $6,598 2.8% $10,185 3.8% $5,508 -0.3% $3,572 -5.1% $7,365 -8.1%
2012Q3 $6,793 3.6% $10,013 -0.4% $5,754 2.3% $3,470 -7.7% $6,871 -13.1%
2012Q4 $6,719 1.4% $10,662 5.8% $5,762 1.4% $3,399 -8.3% $6,744 -11.9%
2013Q1 $6,700 0.8% $10,642 4.9% $5,768 3.4% $3,331 -7.7% $6,699 -9.8%
2013Q2 $6,610 0.2% $10,737 5.4% $5,781 5.0% $3,342 -6.4% $6,817 -7.4%
2013Q3 $6,769 -0.4% $10,790 7.8% $5,788 0.6% $3,356 -3.3% $6,815 -0.8%
2013Q4 $6,840 1.8% $11,185 4.9% $5,793 0.5% $3,389 -0.3% $6,874 1.9%
2014Q1 $6,913 3.2% $11,426 7.4% $5,846 1.4% $3,400 2.1% $6,846 2.2%
2014Q2 $6,974 5.5% $11,552 7.6% $5,883 1.8% $3,498 4.7% $6,871 0.8%
2014Q3 $7,194 6.3% $11,685 8.3% $5,935 2.5% $3,545 5.7% $6,869 0.8%
2014Q4 $7,347 7.4% $12,000 7.3% $5,955 2.8% $3,597 6.2% $6,878 0.1%
2015Q1 $7,493 8.4% $12,536 9.7% $6,138 5.0% $3,679 8.2% $6,894 0.7%
2015Q2 $7,559 8.4% $12,854 11.3% $6,215 5.6% $3,719 6.3% $6,958 1.3%
2015Q3 $7,714 7.2% $13,312 13.9% $6,253 5.4% $3,804 7.3% $6,986 1.7%
2015Q4 $7,857 7.0% $13,718 14.3% $6,308 5.9% $3,885 8.0% $7,027 2.2%
Source: GBTA Foundation, Rockport Analytics
GBTA BTI™ Outlook – Western Europe 2014H2
Page 32
©November2014GBTAanditsaffiliates.Allrightsreserved.Membersmaycopythispublicationinitsentiretyforinternalcompanyuse.
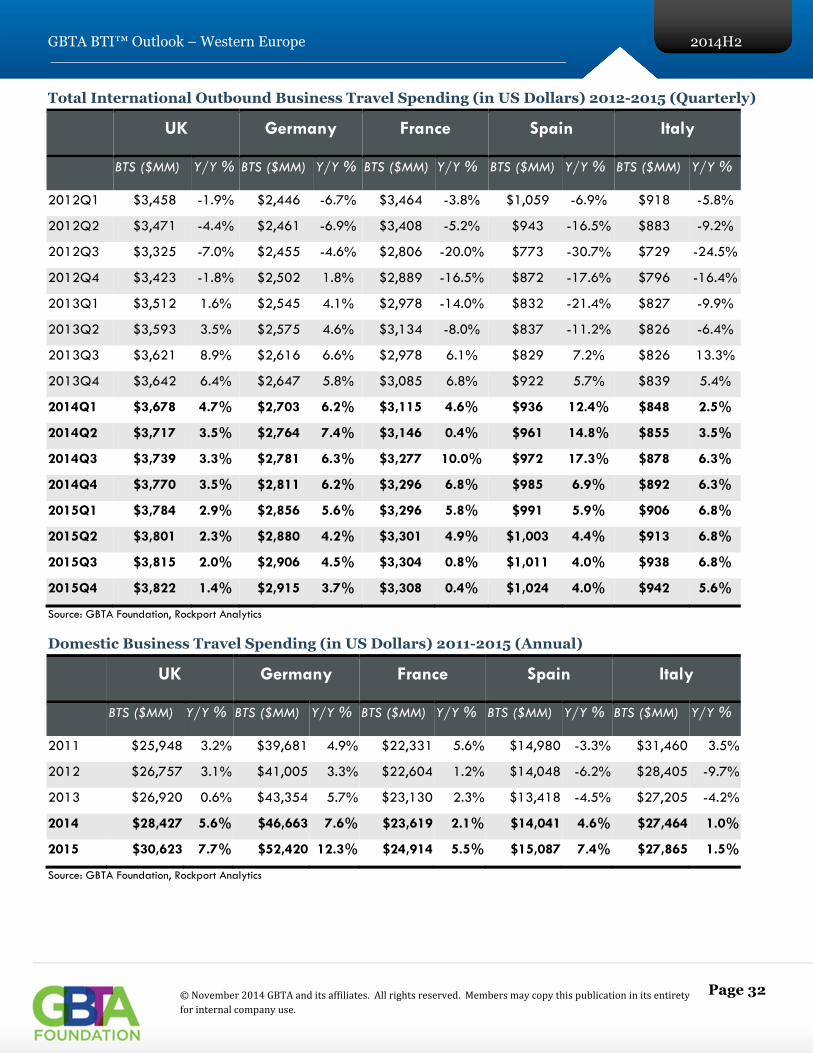
Total International Outbound Business Travel Spending (in US Dollars) 2012-2015 (Quarterly)
UK Germany France Spain Italy
BTS ($MM) Y/Y % BTS ($MM) Y/Y % BTS ($MM) Y/Y % BTS ($MM) Y/Y % BTS ($MM) Y/Y %
2012Q1 $3,458 -1.9% $2,446 -6.7% $3,464 -3.8% $1,059 -6.9% $918 -5.8%
2012Q2 $3,471 -4.4% $2,461 -6.9% $3,408 -5.2% $943 -16.5% $883 -9.2%
2012Q3 $3,325 -7.0% $2,455 -4.6% $2,806 -20.0% $773 -30.7% $729 -24.5%
2012Q4 $3,423 -1.8% $2,502 1.8% $2,889 -16.5% $872 -17.6% $796 -16.4%
2013Q1 $3,512 1.6% $2,545 4.1% $2,978 -14.0% $832 -21.4% $827 -9.9%
2013Q2 $3,593 3.5% $2,575 4.6% $3,134 -8.0% $837 -11.2% $826 -6.4%
2013Q3 $3,621 8.9% $2,616 6.6% $2,978 6.1% $829 7.2% $826 13.3%
2013Q4 $3,642 6.4% $2,647 5.8% $3,085 6.8% $922 5.7% $839 5.4%
2014Q1 $3,678 4.7% $2,703 6.2% $3,115 4.6% $936 12.4% $848 2.5%
2014Q2 $3,717 3.5% $2,764 7.4% $3,146 0.4% $961 14.8% $855 3.5%
2014Q3 $3,739 3.3% $2,781 6.3% $3,277 10.0% $972 17.3% $878 6.3%
2014Q4 $3,770 3.5% $2,811 6.2% $3,296 6.8% $985 6.9% $892 6.3%
2015Q1 $3,784 2.9% $2,856 5.6% $3,296 5.8% $991 5.9% $906 6.8%
2015Q2 $3,801 2.3% $2,880 4.2% $3,301 4.9% $1,003 4.4% $913 6.8%
2015Q3 $3,815 2.0% $2,906 4.5% $3,304 0.8% $1,011 4.0% $938 6.8%
2015Q4 $3,822 1.4% $2,915 3.7% $3,308 0.4% $1,024 4.0% $942 5.6%
Source: GBTA Foundation, Rockport Analytics
Domestic Business Travel Spending (in US Dollars) 2011-2015 (Annual)
UK Germany France Spain Italy
BTS ($MM) Y/Y % BTS ($MM) Y/Y % BTS ($MM) Y/Y % BTS ($MM) Y/Y % BTS ($MM) Y/Y %
2011 $25,948 3.2% $39,681 4.9% $22,331 5.6% $14,980 -3.3% $31,460 3.5%
2012 $26,757 3.1% $41,005 3.3% $22,604 1.2% $14,048 -6.2% $28,405 -9.7%
2013 $26,920 0.6% $43,354 5.7% $23,130 2.3% $13,418 -4.5% $27,205 -4.2%
2014 $28,427 5.6% $46,663 7.6% $23,619 2.1% $14,041 4.6% $27,464 1.0%
2015 $30,623 7.7% $52,420 12.3% $24,914 5.5% $15,087 7.4% $27,865 1.5%
Source: GBTA Foundation, Rockport Analytics

GBTA BTI™ Outlook – Western Europe 2014H2
Page 33
©November2014GBTAanditsaffiliates.Allrightsreserved.Membersmaycopythispublicationinitsentiretyforinternalcompanyuse.
International Outbound Business Travel Spending (in US Dollars) 2011-2015 (Annual)
UK Germany France Spain Italy
BTS ($MM) Y/Y % BTS ($MM) Y/Y % BTS ($MM) Y/Y % BTS ($MM) Y/Y % BTS ($MM) Y/Y %
2011 $14,214 4.9% $10,295 0.8% $14,163 -2.3% $4,440 -0.2% $3,864 -0.6%
2012 $13,677 -3.8% $9,864 -4.2% $12,567 -11.3% $3,647 -17.9% $3,325 -13.9%
2013 $14,368 5.1% $10,383 5.3% $12,175 -3.1% $3,420 -6.2% $3,317 -0.2%
2014 $14,904 3.7% $11,059 6.5% $12,834 5.4% $3,854 12.7% $3,473 4.7%
2015 $15,222 2.1% $11,557 4.5% $13,209 2.9% $4,029 4.6% $3,699 6.5%
Source: GBTA Foundation, Rockport Analytics