gbta bti™ outlook – united states -...
TRANSCRIPT

2013 Q1
2014 Q3
GBTA BTI™ Outlook – United States Prospects for Domestic & International Outbound Business Travel 2014-2015
2012 Q2

2
GBTA BTI™ OUTLOOK – UNITED STATES 2014 Q3
GBTA BTI™ Outlook – United States 2014Q3
GBTA BTI™ Outlook – United States
2014 Q3
GoToMeeting WebEx
CONTACT:
GBTA BTI™ Outlook – United States

3
GBTA BTI™ OUTLOOK – UNITED STATES 2014 Q3
GBTA BTI™ Outlook –United States 2014 Q3
PROSPECTS FOR DOMESTIC & INTERNATIONAL OUTBOUND BUSINESS TRAVEL 2014-2015
Executive Summary
Our forecast for USoriginated business travelis more or less in line withthe expectations in our Q2outlook GBTA BTI™
Outlook – United States, July
2014)
Despite theslight downgrade in ourgrowth forecast for Person Trips for this year, we continue to be optimistic that the U.S. economywill remain on track, producing robust growth in business travel activity through the rest of 2014and into 2015.
As expected, the US economy quickly snapped back from its winter doldrums. GDPgrowth reached 4.6%
Personal consumption increased by 2.5%Investment advanced by 8.4%
Exports expanded by 10.1%Inventories rose by $84 billion in Q2
Many key indicators of business activity are signaling even stronger growth in the second half of2014 and 2015.
both signaling improvingperformance for equipment purchases, hiring, and business travel in the months and quartersahead.
With unemployment falling and GDP growth accelerating, attention has been shifting over to therisk of rising inflation.
Is
Private U.S. Jobs Scorecard

4
GBTA BTI™ OUTLOOK – UNITED STATES 2014 Q3
accelerating inflation an inevitable side effect of years of monetary stimulus?
Overall U.S. economic performance is very much about what the consumer is or is not doing.
Rising sentiment, jobs gains, and slowly advancing wages should spell gatheringstrength for consumer spending and housing activity over the next 18 24 months.
We expect that Group trip volume will decline 3.3% in2014 before rising 1.4% in 2015.
Momentum has been sustained thus far in 2014, evidenced by transient volumegrowth of 3.1% (qtr/qtr annualized) in the first quarter. For 2014 in total, we expect transientvolume to grow 2.3% versus 2013.
we have witnessedmomentum building in IOB business travel since the middle of 2013 and we expect that trend tocontinue through our forecast horizon. International outbound trip volume grew 1.1% in 2013 andwe expect 5.6% growth in 2014 followed by another 6.5% in 2015.
Led by expectations for increasingly higher F&B costs and airfares, we have raised expectations fortravel price increases over last quarter and now expect TPI growth of 2.9% this year and 3.5% in2015.

5
GBTA BTI™ OUTLOOK – UNITED STATES 2014 Q3
U.S. ECONOMIC PERFORMANCE
Current Conditions
As we had anticipated, the USeconomy quickly snappedback from its winterdoldrums. GDPgrowth reached 4.2%
Personal consumptionincreased by 2.5%
Investment advanced by 8.4%
Exports expanded by 10.1%
Inventories rose by $84 billion in Q2
JOBS
September brought another encouraging month of job growth.
Net JobGains(x1000)
2012 2013 2014
Total 2,294 2,365 1,983
Shading Key:
Job Loss 0 150k150200k
GT 200k
Private U.S. Jobs Scorecard
8
6
4
2
0
2
4
6
GDPGrowthin%
Q2 GDP Growth Snaps Back fromWeather Related Hiccup
Yr/Yr % Qtr/Qtr Annualized
Source: Bureau of Economic Analysis
Yr/Yr: 2014Q2 @ 2.5%
Qtr/Qtr: 2014Q2 @ 4.2%

6
GBTA BTI™ OUTLOOK – UNITED STATES 2014 Q3
During the current recovery, a commoncomplaint is that we are creating jobs, justnot high “quality” ones quality beingdefined as higher paying jobs.
GBTA BTI™ Outlook –United States,
BUSINESS PERFORMANCE INDICTORS
Many key indicators ofbusiness confidence aresignaling even strongergrowth in the secondhalf of 2014 and 2015.
The bottom line is that both
30
35
40
45
50
55
60
65
80
82
84
86
88
90
92
94
96
98
100 PurchasingManagersIndexGT50IndicatesExpansion
NFIBOptimismIndex1986=100
Rising Business Confidence Across the Board…
NFIB Business Optimism Index ISM's PMI
NFIB July 2014 @ 95.7
ISM Aug 2014@ 59.0
Source: National Federation of Independent Business, Institute for Supply Management

7
GBTA BTI™ OUTLOOK – UNITED STATES 2014 Q3
are signaling improving performance for equipment purchases, hiring, and business travel in the monthsand quarters ahead.
Yet another indicator of rising business optimismcomes from the Wells Fargo/Gallop SmallBusiness Index.
Monitoring the “dark” side of business health canalso lend insight into current and futureconditions.
EXPORTS
As mentioned earlier, exports added nicely toQ2 GDP growth, something that analysts hadbeen hoping for.
10,000
20,000
30,000
40,000
50,000
60,000
#ofCompaniesperQuarter
Declining Bankruptcies Suggest Healthier Biz Environment
Source: Administrative Office of the U.S. Courts
2014Q2 @ 30,113
20 yr Average
15%
10%
5%
0%
5%
10%
15%
20%
25%
30%
Yr/Yr%
U.S. Exports to the European Union Gathering
Steam
Source: U.S. Census Bureau
June 2014 @ 7.8%

8
GBTA BTI™ OUTLOOK – UNITED STATES 2014 Q3
.
Coupling themathematical relationship with the consensus outlook for exports suggests rising strength in U.S. IOB
INFLATION
With unemployment fallingand GDP growthaccelerating, attention hasbeen shifting over to the riskof rising inflation, however.
Is accelerating inflation aninevitable side effect of years of monetary stimulus?
3
2
1
0
1
2
3
4
5
6
Yr/Yr%ChangeinPrices
Inflation Currently at Fed Target But is Acceleration Ahead?
Consumer Price Index All Items Core Inflation (less food & energy)
CPI June 2014 @2.1%
Core June 2014 @ 1.9%
Source: Bureau of Labor Statistics

9
GBTA BTI™ OUTLOOK – UNITED STATES 2014 Q3
Why the confidence that the economy cancontinue to absorb this monetarystimulus with acceptable levels ofinflation?
From a demand sideperspective, consumer and businessspending has been on the sluggish sidesince the early days of the recovery.
“demand pull” inflationdeterminants are currently quite mild by historical standards
Employment Cost Index
With labor comprising upwardsof 50% of business costs, year on year change of 2.5% in the ECI suggests favorable inflation conditions ahead.
Commodity pricesacross the board have been moving sideways or actually declining
70
120
170
220
2005=100
Commodity Prices Have Been Flat to Down
Since mid 2011
All Commodities Metals Energy
Source: International Monetary Fund
20%
15%
10%
5%
0%
5%
10%
15%
20%
25%
Yr/Yr%Change
Import Prices Have Also Been Favorable...
July 2014 @ 0.8%
Source: U.S. Bureau of Labor Statistics

10
GBTA BTI™ OUTLOOK – UNITED STATES 2014 Q3
CONSUMERS
Overall U.S. economic performance isvery much about what the consumer isor is not doing.
Retail saleshave recently re accelerated, albeitmoderately, following the weather relatedslowdown of the first quarter.
15
10
5
0
5
10Retail Sales Re Accelerates After Winter Freeze
July 2014 @ 3.7%
Source: US Census Bureau
Yr/Yr in %
But recent growth has been
fueled more by borrowing than
rising income…
250
350
450
550
650
750
850
950
3,000
3,500
4,000
4,500
5,000
5,500
6,000Housing Market Improving But Still A Long Way to Go
Existing Home Sales (left)
Source: US Census Bureau
New Home Sales (right)
in thousands of units
6
8
10
12
14
16
18
20Vehicle Sales Already Past Previous Peak
Aug 2014 @17.5 million
Source: Autodata Corp
in millions of units

11
GBTA BTI™ OUTLOOK – UNITED STATES 2014 Q3
Economic Outlook
With the hangover from the winter doldrums over and underlying economic momentum breaking throughthe clouds, the U.S. economy is back on track to register solid gains in 2014, with even better performancenext year.
Households and businesses are feeling better about the near term future and their spending behavior willbegin to reflect that optimism.
Meanwhile, inflation will slowly yield to rising pressure from wages, falling productivity, and othermaterial cost gains.
Corporate profit growthwill begin to slow in the coming quarters.
2014 Q3 U.S. Economic Forecast for 2014-2015
Source: IMF, Wells Fargo Securities, Moodys Analytics, OECD, Rockport Analytics
Economic Driver 2011 2012 2013 2014 2015 Real GDP (Yr-to-Yr %) 1.8 2.2 1.9 2.3 3.4
Inflation (CPI) (Yr-to-Yr %) 3.1 2.1 1.5 2.1 2.5
Consumption (Yr-to-Yr %) 2.5 1.9 2.0 2.8 3.1
Equipment Investment (Yr-to-Yr %) 11.0 6.9 3.1 5.6 6.3
Real Exports (Yr-to-Yr %) 6.7 3.4 2.7 3.7 6.8
Corporate Profits Pre-Tax (Yr-to-Yr %) 7.3 6.8 4.6 2.6 5.9
Total Employment (x1000) Avg. Jobs/mo 175.3 182.8 194 227 223

12
GBTA BTI™ OUTLOOK – UNITED STATES 2014 Q3
U.S. Economic Driver of Business Travel –Latest Performance
Indicator Relationship
with Biz Travel Latest Value
Expected for 2014
Progress Versus Last Qtr
Real GDP (Yr/Yr%)
Positive –rising tide lifts all boats
+4.6% (2014 Q2)
+2.3% Better
Corporate Profits Before Tax
Positive financial & sentiment indicator -0.3%
(2014Q2) +2.6%
Slightly Worse
Job Growth (monthly nonfarm payroll gain)
Positive - more jobs indicates greater confidence, rising incomes, and more travelers
+248,000
(Sep’14)
+227,000/
Monthly Avg
Better
Unemployment Rate
Negative economic & sentiment indicator
5.9% (Sep’14)
6.2% Slightly Better
Oil Prices (Brent Crude)
Negative for prices & spending
$106.98/bbl (July ‘14)
$108.6/bbl Better
Real Exports
Positive for Int’l Outbound
+10.1% (2014Q2)
3.7% Better
CPI for: Air Fare Rental Cars Lodging
Negative for travel prices
-0.2% (Jul’14) 2.8% (Jul’14) 3.1% (Jul ’14)
4.0% 1.2% 4.1%
Slightly Better
ISM Sentiment Index (PMI-Mfg)
Positive for travel & hiring
59.0 (Aug ’14)
59.2 Better
13
GBTA BTI™ OUTLOOK – UNITED STATES 2014 Q3
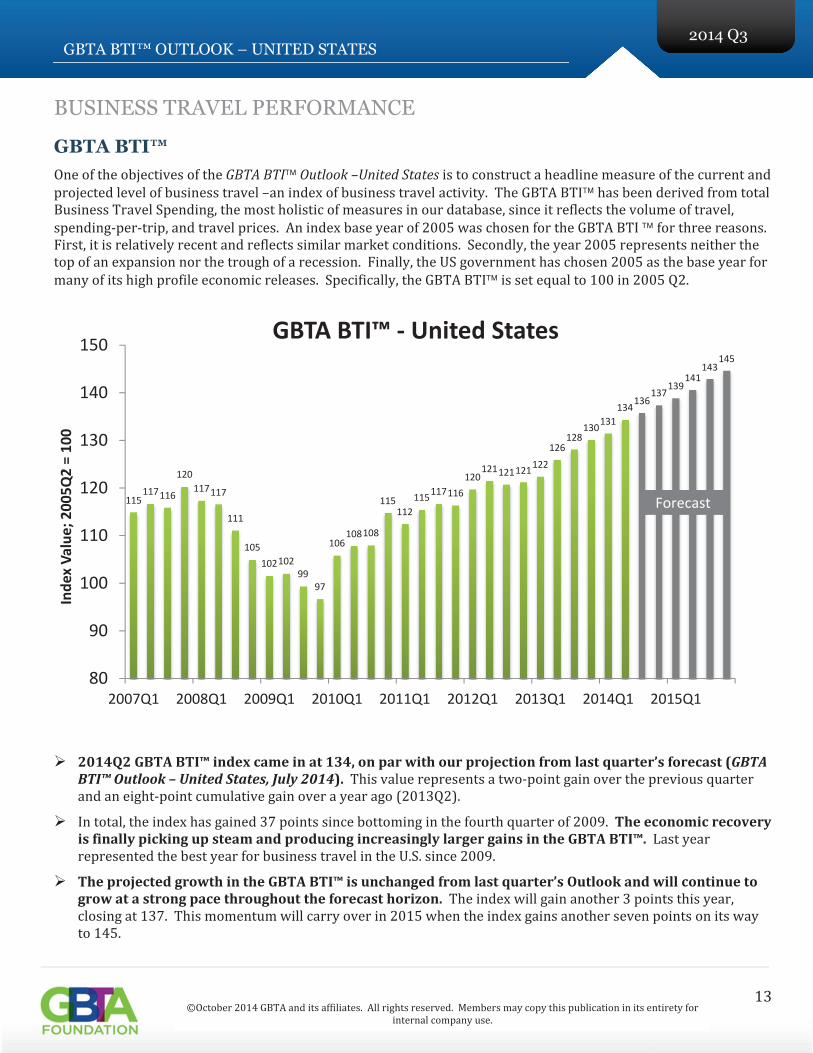
BUSINESS TRAVEL PERFORMANCE
GBTA BTI™
GBTA BTI Outlook –United States
2014Q2 GBTA BTI™ index came in at 134, on par with our projection from last quarter’s forecast (GBTABTI™ Outlook – United States, July 2014).
The economic recoveryis finally picking up steam and producing increasingly larger gains in the GBTA BTI™.
The projected growth in the GBTA BTI™ is unchanged from last quarter’s Outlook and will continue togrow at a strong pace throughout the forecast horizon.
115117116
120
117117
111
105
102102
99
97
106108108
115112
115117116
120121121121
122
126128
130131
134136
137139
141143
145
80
90
100
110
120
130
140
150
2007Q1 2008Q1 2009Q1 2010Q1 2011Q1 2012Q1 2013Q1 2014Q1 2015Q1
IndexValue;2005Q2=100
GBTA BTI™ United States
Forecast

14
GBTA BTI™ OUTLOOK – UNITED STATES 2014 Q3
BUSINESS TRAVEL QUARTERLY OUTLOOK DETAILS
Total U.S.-Originated Business Travel Spending & Trip Volumes3
GBTA BTI™ Outlook – United States, July 2014)
Group Meeting & Convention vs. Transient Business Travel
$65.0
$70.0
$75.0
$80.0
114
116
118
120
122
124
126
TotalSpending(BillionsUSD)
TotalPersonTripVolume(millions)
BT Forecast Comparisons: 2014 Q2 vs. 2014 Q3
Total Person Trips (Q2 Outlook) Total Person Trips (Q3 Outlook)
Total Spending (Q2 Outlook) Total Spending (Q3 Outlook)

15
GBTA BTI™ OUTLOOK – UNITED STATES 2014 Q3
American Express Meetings &
Events 2014 Global
Meetings Forecast,
International Outbound Business Travel
80
90
100
110
120
130
140
0
50
100
150
200
250
300
350
2010 2011 2012 2013 2014 2015
TotalSpending(billionsUSD)
PersonTrips(millionsUSD)
Group & Transient Business Travel: Person Trips &
Spending
Transient Person Trips Group Person Trips
Transient Spend Group Spend
Forecast

16
GBTA BTI™ OUTLOOK – UNITED STATES 2014 Q3
U.S. Business Travel Inflation
0.0%
0.5%
1.0%
1.5%
2.0%
2.5%
3.0%
3.5%
4.0%
4.5%
5.0%
2010Q1 2011Q1 2012Q1 2013Q1 2014Q1 2015Q1
YroverYrPercent
Travel Price Inflation
Forecast
Source: US Bureau Labor Statistics, Rockport Analytics
6.5
7
7.5
8
8.5
9
9.5
10
10.5
1.5
1.55
1.6
1.65
1.7
1.75
1.8
1.85
1.9
1.95
2
2010Q1 2011Q1 2012Q1 2013Q1 2014Q1 2015Q1
Spending(BillionsUSD)
TripVolume(Millions)
International Business Travel from The U.S.
International Person Trips
International Spend
Source: U.S. Department of Commerce (OTTI), GBTA Foundation, Rockport Analytics
Forecast

17
GBTA BTI™ OUTLOOK – UNITED STATES 2014 Q3
Air
18%
Food
20%
Ground
9%
Lodging
22%
Rental Cars
6%
Other
25%
TPI Components and 2014 Inflation
ExpectationsColor Indicates Direction of Change in Estimate from Last Quarter:
red=falling, green=rising, grey=no change
+1.9%+2.4%
+2.4%+2.2%
+5.0%+0.8%
Source: Rockport Analytics, Moody's, DKSA
$535.5
$564.0$576.4 $575.4
$613.1
$638.1
1%
0%
1%
2%
3%
4%
5%
6%
7%
$480
$500
$520
$540
$560
$580
$600
$620
$640
$660
2010 2011 2012 2013 2014 2015
%Change
SpendperTrip($USD)
Growth In Business Travel Spend: More than Just Travel Price
Inflation
Spend per trip (left) Spend Per Trip Growth (right) Travel Price Inflation (right)
2.6%
1.2%
0.3%
1.4%3.6%
Source: GBTA Foundation, Rockport Analytics
0.6%

18
GBTA BTI™ OUTLOOK – UNITED STATES 2014 Q3
Forecast Tables 2014 Q3: Annual & Quarterly†

19
GBTA BTI™ OUTLOOK – UNITED STATES 2014 Q3