gci annual compliance survey – 2007 -...
TRANSCRIPT

GCI Annual Compliance Survey – 2007

Key Findings
• For most of the Implementation Measures, there has been little change over the past 4 years. The industry must change its approach if it really hopes to drive implementation.
• The use of barcodes is dropping off as a result of the shift from consumer units to cases and pallets.
• Despite the demonstrated cost savings and reduction in cycle times attributable to the use of EDI for orders and invoices, the capability is under-utilized in developing markets.
• Other EDI transaction sets are even less utilized including the Advanced Shipping Notice which is most likely to provide a good return on investment. The industry should put a drive behind ASN adoption.
• Data Synchronization usage is flat over the past four years. Manufacturers have continued to build capability but until broadly implemented by retailers, the industry will not derive value.
• There is a large gap between the adoption levels amongst the global and multi-national consumer products companies and smaller, local companies. Until there is widespread adoption in second and third tier consumer products companies, retailers cannot benefit from the use of industry standards.
GCI Annual Compliance Survey – 2007This document provides an executive summary to the GCI Annual Compliance Survey for 2007, which reports on the adoption of industry standards as reported by partici-pating companies through the GlobalScorecard.net. The Global Scorecard is a capa-bility assessment tool that enables companies and business partners to measure their collaborative business performance with each other and against best practices. The GCI Scorecard Working Group has developed three levels of scorecards to accommodate all types of business relationships supported by a globally agreed set of Key Performance Indicators (KPI) definitions that measure the quantitative output of the collaborative effort. These “Implementation Measures” allow companies to track their implementation of global standards and benchmark against the rest of the industry. Additionally this enables GCI to track progress on implementing global standards and helps the GCI Board to determine the appropriate actions to increase implementation levels where necessary. The full report which provides a detailed breakdown by region, is available for download from: http://www.globalscorecard.net/download/GCI_Compliance_Survey_2007.pdf.
2
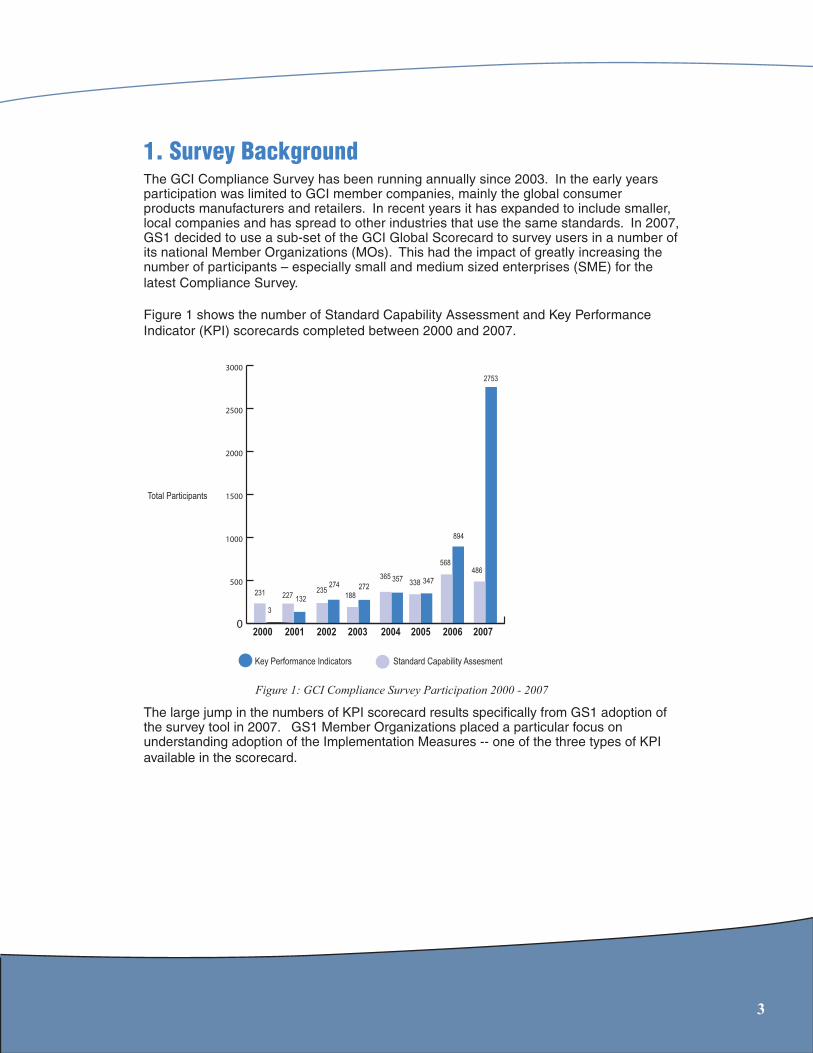
The GCI Compliance Survey has been running annually since 2003. In the early years participation was limited to GCI member companies, mainly the global consumer products manufacturers and retailers. In recent years it has expanded to include smaller, local companies and has spread to other industries that use the same standards. In 2007, GS1 decided to use a sub-set of the GCI Global Scorecard to survey users in a number of its national Member Organizations (MOs). This had the impact of greatly increasing the number of participants – especially small and medium sized enterprises (SME) for thelatest Compliance Survey.
Figure 1 shows the number of Standard Capability Assessment and Key Performance Indicator (KPI) scorecards completed between 2000 and 2007.
The large jump in the numbers of KPI scorecard results specifically from GS1 adoption of the survey tool in 2007. GS1 Member Organizations placed a particular focus on understanding adoption of the Implementation Measures -- one of the three types of KPI available in the scorecard.
1. Survey Background
3
Figure 1: GCI Compliance Survey Participation 2000 - 2007
Key Performance Indicators Standard Capability Assesment
Total Participants
0
500
1000
1500
2000
2500
3000
2000 2001 2002 2003 2004 2005 2006 2007

Number of KPI records accepted Value of revenue captured (US$ Billions)
329
226
258
1,968
652
106137
911
Figure 2: 2007 GCI Compliance Survey Participation
Figure 2 breaks down the number of scorecards submitted by type of business and the total revenues for each of those four segments. Although retailers account for only 12% of the scorecards, they represent 50% of the total revenue captured.
The “Other” business segment is included here for completeness. However the data entered by these companies is excluded from any further analysis.
2. Objective
The objective of the GCI Compliance Survey is to report on the extent to which companies have adopted and are using GS1 global standards for item and location identification, electronic messaging and master data synchronization. The GCI charter directs it to “drive the implementation of GS1 standards and best practices”, in the belief that this will lead to greater efficiency in the supply chain and higher shopper satisfaction. The annual Compliance Survey provides a snapshot on how well the industry is meeting this objective.
There are three areas of focus which comprise the GCI Global Scorecard. The specific instruments are:
• Business Measures – a set of supply chain key performance indicators used to determine whether improved efficiency is being achieved
• Implementation Measures – numerical measure which reveals the extent to which the various GS1 standards have been implemented
• Capability Scores for “Enablers” – a self-assessment of each participating company’s capability in implementing GS1 standards, rated on a scale of 0 to 4 scale where 0 means no capability and 4 means fully capable with demonstrated improvements achieved
4
Consumer products manufacturersConsumer products retailers
Consumer products wholesalers Others (Not included)

IM01 % of consumer units allocated Global Trade Item Number (GTIN) (%)
IM02 % of cases/cartons/inners allocated a Global Trade Item Number (GTIN) (%)
IM03 % of finished goods items allocated a Global Trade Item Number (%)
IM04 % of pallets/unit loads labeled with Serial Shipping Container Code
(SSCC) (%)
IM05 % of shipping or receiving locations that have been allocated a Global
Location Number (GLN) (%)
IM06 % of orders transacted via EDI using EANCOM, web-EDI, X-12,
Tradacoms, JCA or standard GS1 XML formats (%)
IM07 % of invoices transacted via EDI using EANCOM, web-EDI, X-12,
Tradacoms, JCA or standard GS1 XML formats (%)
IM08 % of shipments for which a despatch advice was transmitted via EDI using
EANCOM, web-EDI, X-12, Tradacoms, JCA or standard GS1 XML formats (%)
IM09 % of shipments for which a receiving advice was transacted via EDI using
EANCOM, web-EDI, X-12, Tradacoms, JCA or standard GS1 XML formats (%)
IM10 % of sales with synchronized master data between trading partners via
the GS1 Global Data Synchronization Network (GDSN) (%)
IM11 % of sales with master data loaded into a GS1-certified data pool (%)
IM12 % of active SKUs where the master data has been synchronized using
the GS1 Global Data Synchronization Network (%)
IM13 % of GTINs that are catalogued consistently with a GS1 Global Product
Classification brick code (not using 9999 designation) (%)
89.3 99.2 97.4
93.0 94.9 77.2
** ** **
55.6 45.8 42.7
38.7 34.1 43.3
70.1 50.2 56.6
62.6 41.6 46.2
** 20.9 21.0
** 8.1 6.6
24.0 13.4 16.0
** 29.1 42.0
** ** **
44.7 47.3 41.6
96.5 97.8 91.3
79.7 91.8 77.5
** ** **
59.5 59.0 52.5
60.4 62.9 63.7
89.4 81.8 69.7
87.2 77.0 63.6
** 10.8 28.6
** 7.4 30.8
14.7 11.4 10.0
** ** **
** ** 2.7
** ** **
2005 2006 2007 2005 2006 2007
Consumer Products Retailers & Wholesalers
Consumer Products Manufacturer
3. 2007 Global Compliance Survey Results for Key Performance Indicators
Implementation Measures
Whilst it would appear that some of the Implementation Measures have declined from 2005 to 2007, readers should bear in mind that 2007 represents a significantly increased sample base, including many small and medium enterprises that have more recently begun adoption of GS1 standards.
Figure 3: Implementation Measures 2005 - 2007
Implementation Measures
5

6
Despite the problem of comparing different sample sizes, a number of observations can be made:
• Use of GTINs on consumer units is signifi cantly higher than GTIN use on cases, especially among the small and medium enterprises.
• The trend for Serial Shipping Container codes usage is declining rather than improving.
• Global Location Numbers use is growing steadily across all consumer products segments.
• Electronic messages are used with relatively high frequency for orders and invoices (although less so amongst SME retailers) while electronic messages for dispatch advice and for receiving advice is still very low.
• Measured as a percent of sales the consumer products manufacturers who have loaded master data into a GS1-certifi ed data pool is growing rapidly. However the use of synchronized master data – also measured as a percent of sales, does not appear to be growing.
• Adoption of the Global Product Classifi cation standards appears to be stagnating.
Geographic Differences for Implementation Measures
Breaking out the Implementation Measures by region reveals some deeper insights:
• GLNs are widely used in Europe but less so in North America and in Asia they are hardly used at all.
• Use of GS1 Standard electronic messages for orders and invoices is very advanced in North America, to a lesser extent in Europe and to a very low extent in South America and Asia.
• Measured as a percent of sales, synchronized master data has climbed to 24% in North America, but in the rest of the world it is still below 10%.
• Master data (also measured as a percent of sales) loaded onto a GS1-certifi ed data pool by the CP manufacturer but not necessarily synchronized with the retailer, has climbed to 60% in North America, 24% in Europe but is still very low elsewhere.
• Although weighted average for adoption of Global Location Numbers by North American retailers is 65%, a more detailed analysis reveals that this is due to a small number of retailers with 100% adotpion and the balance at 0% adoption. One of the 100% adopters has very large revenues, and thus skews the overall weighted average.
Geographic Differences for Implementation Measures

7
Performance of GCI Members
A comparison between the weighted average Implementation Measures for GCI members and the total survey population reveals a much higher implementation level amongst GCI members. This should not be a surprise because GCI members already believe that adopting GS1 standards will lead to greater efficiency. However, the challenge remains to drive broad adoption in order to improve overall industry benefit.
IM01 % of consumer units allocated Global Trade Item Number (GTIN) (%)IM02 % of cases/cartons/inners allocated a Global Trade Item Number (GTIN) (%)IM03 % of finished goods items allocated a Global Trade Item Number (%)IM04 % of pallets/unit loads labeled with Serial Shipping Container Code (SSCC) (%)IM05 % of shipping or receiving locations that have been allocated a Global Location Number (GLN) (%)IM06 % of orders transacted via EDI using EANCOM, web-EDI, X-12, Tradacoms, JCA or standard GS1 XML formats (%)IM07 % of invoices transacted via EDI using EANCOM, web-EDI, X-12, Tradacoms, JCA or standard GS1 XML formats (%)IM08 % of shipments for which a despatch advice was transmitted via EDI using EANCOM, web-EDI, X-12, Tradacoms, JCA or standard GS1 XML formats (%)IM09 % of shipments for which a receiving advice was transacted via EDI using EANCOM, web-EDI, X-12, Tradacoms, JCA or standard GS1 XML formats (%)IM10 % of sales with synchronized master data between trading partners via the GS1 Global Data Synchronization Network (GDSN) (%)IM11 % of sales with master data loaded into a GS1-certified data pool (%)IM12 % of active SKUs where the master data has been synchronized using the GS1 Global Data Synchronization Network (%)IM13 % of GTINs that are catalogued consistently with a GS1 Global Product Classification brick code (not using 9999 designation) (%)
97.4 99.3 91.3 91.2
77.2 98.6 77.5 81.2 42.7 61.9 52.5 56.1
43.3 53.2 63.7 85.4
56.6 59.9 69.7 80.5
46.2 54.8 63.6 72.2
21.0 23.5 28.6 35.2
6.6 9.1 30.8 46.9
16.0 22.6 10.0 15.3
42.0 63.4 2.7 4.0
41.6 71.2
Consumer Products Retailers & Wholesalers
Consumer Products ManufacturerWORLD GCI WORLD GCI
Figure 4: GCI Member Performance for 2007 Compliance Survey

Business Measures
Generally speaking, the survey would indicate an improving trend in service levels and de-clining inventory -- although there are some figures which do not fit the trend. The following table highlights the variation of revenue-weighted average Business Measures over the last three years. The unit for each Business Measure is shown in brackets after its name.
The sample set for Business Measures is much smaller than other parts of the survey. Thus a degree of caution must be used in drawing conclusions from this data. Additionally, these measures are greatly affected by the type of product as well as local market conditions. Therefore companies should use the scorecard web site to run benchmark reports for peer groups which more closely match their own business.
8
BM01 Annual Growth Rate (%)BM02 Supplier Service Level / Unit Fill Rate to Customer Distribution Centre (%)BM03 Store Service Level / Unit Fill Rate (%)BM04 On-Time Delivery (%)BM05 Perfect Order Rate (%)BM06 Raw Materials Inventory Cover (days)BM07 Manufacturer/Supplier’s Finished Goods Inventory Cover (days)BM08 Retail Distribution Centre Inventory Cover (days)BM09 Retail Store Inventory Cover (days)BM10 On-Shelf/Point-of-Sale Out-of-Stocks (%)BM11 Lead Time (hours)BM12 Distribution Costs (% of sales value) (%)BM13 Invoice Accuracy (%)
** 5.6 5.497.6 97.6 95.1** 97.1 96.090.7 91.6 91.979.6 79.9 86.420.7 21.4 18.133.3 32.4 32.516.3 14.2 14.214.7 13.5 14.74.9 4.8 5.188.5 77.6 85.57.2 7.6 7.792.3 94.4 94.0
** 4.2 4.991.7 89.1 90.190.0 93.8 93.683.7 86.2 87.978.9 83.0 85.1** ** **** ** **29.4 15.5 15.326.7 25.7 23.66.5 3.9 3.7142.3 63.2 62.34.9 3.0 3.284.9 88.3 89.9
2005 2006 2007 2005 2006 2007
Consumer Products Retailers & Wholesalers
Consumer Products Manufacturer
Figure 5: Revenue-weighted Business Measures 2005 - 2007
Business Measures
9
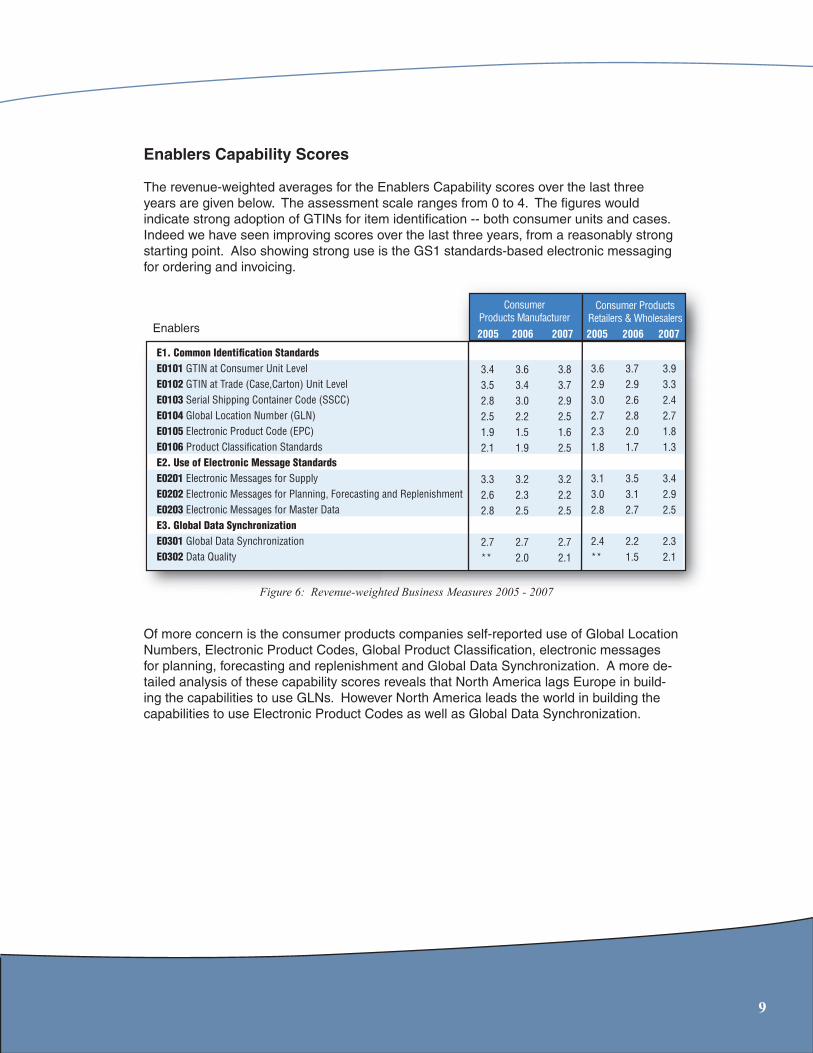
Enablers Capability Scores
The revenue-weighted averages for the Enablers Capability scores over the last three years are given below. The assessment scale ranges from 0 to 4. The figures would indicate strong adoption of GTINs for item identification -- both consumer units and cases. Indeed we have seen improving scores over the last three years, from a reasonably strong starting point. Also showing strong use is the GS1 standards-based electronic messaging for ordering and invoicing.
Of more concern is the consumer products companies self-reported use of Global Location Numbers, Electronic Product Codes, Global Product Classification, electronic messages for planning, forecasting and replenishment and Global Data Synchronization. A more de-tailed analysis of these capability scores reveals that North America lags Europe in build-ing the capabilities to use GLNs. However North America leads the world in building the capabilities to use Electronic Product Codes as well as Global Data Synchronization.
3.4 3.6 3.83.5 3.4 3.72.8 3.0 2.92.5 2.2 2.51.9 1.5 1.62.1 1.9 2.5 3.3 3.2 3.22.6 2.3 2.22.8 2.5 2.5 2.7 2.7 2.7** 2.0 2.1
3.6 3.7 3.92.9 2.9 3.33.0 2.6 2.42.7 2.8 2.72.3 2.0 1.81.8 1.7 1.3 3.1 3.5 3.43.0 3.1 2.92.8 2.7 2.5 2.4 2.2 2.3** 1.5 2.1
Consumer Products Retailers & Wholesalers
Consumer Products Manufacturer
Enablers
E1. Common Identification Standards E0101 GTIN at Consumer Unit LevelE0102 GTIN at Trade (Case,Carton) Unit LevelE0103 Serial Shipping Container Code (SSCC)E0104 Global Location Number (GLN)E0105 Electronic Product Code (EPC)E0106 Product Classification StandardsE2. Use of Electronic Message Standards E0201 Electronic Messages for SupplyE0202 Electronic Messages for Planning, Forecasting and ReplenishmentE0203 Electronic Messages for Master DataE3. Global Data Synchronization E0301 Global Data SynchronizationE0302 Data Quality
2005 2006 2007 2005 2006 2007
Figure 6: Revenue-weighted Business Measures 2005 - 2007

4. The Global Scorecard Web Site – New Features, New ToolsThe GCI Compliance Survey report is based on data collected through the GCI Global Score-card -- hosted on-line at www.globalscorecard.net. This web site allows users to access a scorecard in a number of different language versions for use interactively on-line and available for download. The Scorecard site also contains a large databank of all of the assessments which have been entered since 1998. Whilst individual company scores cannot be accessed, the data can be tapped to generate anonymous reports covering at least 5 data sets. This database is available for all interested in benchmarking performance. In fact, the primary purpose of this web site is a benchmarking service rather than a survey tool.
Open for every company to join
All companies actively engaged in the adoption of GS1 standards are invited to use the GCI Scorecard, enter their scorecards and run benchmark reports. We strongly recommend that they do this in order to demonstrate value from using the GCI Scorecard. The site is open to all and use of the tool is free. All data entered into the site can only be viewed by the owner of the data and the site manager at IBM, who administers the site and manages the data quality.
10

Trading Partner support: one-to-one scorecarding
The site not only supports individual companies entering their own data, it also supports trading partners who want to carry out collaborative scorecarding. The site supports entry of data by one of the trading partners for review and edit by the other partner.
Data quality
As with all benchmarking programs, the quality of the benchmark is only as good as the quality of the data submitted. All submitted data is reviewed by the site manager at IBM, who checks the validity of the company entering the data (identified by company name and e-mail address) and the plausibility of the data entered. Any scorecards which do not come from genuine companies or have incorrect or inconsistent data are rejected.
At the end of the year, the site manager generates a report by country showing the average, the 20th and the 80th centile for every variable. This is then reviewed by the GCI Data Quality Committee so that there can be followup and correction of any anomalies. As a result you can be confident in the quality of the benchmark data reported in the Annual Compliance Survey.
Participating organizations (like GS1 MOs, ECR, etc.) that collect survey data from their members and then upload this into the database are responsible for the quality of the data that they enter. Since 2007 was the first year that GS1 MOs had participated, the IBM site manager liaised closely with each MO to ensure that the data was indeed reliable. If the site manager was not satisfied with the data quality management of a particular MO, their entire submission was rejected.
Upgrade for 2008
The web site is undergoing a series of improvements and upgrades for 2008. Users can expect to see the following:
• New report building tool to create and store customized reports. This tool has been launched and can be accessed from the welcome menu after signing on
• New home page with re-arranged menus making it easier to navigate the site and access downloadable material, including off-line versions of the scorecard in various languages, KPI definitions, data preparation forms and user guides
• New profile structure introducing Industry Sectors, with different product categories per sector. Since the tool is being adopted by many industries outside of consumer goods it is important that the data is correctly classified so that like-for-like comparisons can be made. This will affect both data entry and benchmark analysis.
11

• A new business measure for retailers which captures “percent of sales lost due to shrinkage”.
• New bulk upload tool for organizations such as GS1 MOs and national ECR initiatives, that wish to collect survey results from their members and to upload them to the database as a bulk file.
• Automatic generation and e-mail of benchmark reports for each company, to support users with many corecards from subsidiaries or from different member companies.
• Improved dashboarding to monitor scorecard completion and support trend analysis. We will upgrade this to show not only the numbers of scorecards but also the total revenue captured, and will support trend analysis for weighted averages. An example report showing number of scorecards entered by region by year is shown below.
12

• Extended language capability of the web site, the dashboard and the report building tool. A full set of user guides can be downloaded from the “User guides and brochures” link on the home page. A screen shot from the new report building tool is shown below:
5. The GCI Compliance Survey 2008The GCI Compliance Survey for 2008 kicks off on 1 July. Companies are strongly encour-aged to submit their data before the end of October 2008. This will prevent delays in data verification which must be completed by 31 December, 2008 for inclusion in the next report.
Participants should visit www.globalscorecard.net, look for the box titled “GCI Compliance Survey 2008” then download the off-line data preparation form. This form lists the profile data you need to submit, shows the list of data items required and provides the definitions. It then gives you the instructions for how to enter your data into the database. If you use this form and follow the instructions, you will find this an easy to follow process.
Please do not be tempted to jump straight into the web site, start filling in a scorecard and then discover that you do not have a particular piece of information, forcing you to abandon a half completed scorecard!
13

6. Your feedback is ImportantIBM has supported GCI with the Global Scorecard since its inception. We design, build, maintain and host the global scorecard web site at http://www.globalscorecard.net. We support individual companies with the use of the scorecard as well as industry as-sociations such as GCI, national ECR bodies and GS1 member organizations. If you require additional information or have any comments or suggestions about the GCI Global Scorecard, the web site www.globalscorecard.net, or the 2007 GCI Compliance Survey, please email the site manager at [email protected].
About IBM in the Consumer Products IndustryIBM is the world’s largest information technology company, with almost 100 years of leadership in helping businesses innovate. Drawing on resources from across IBM and its Business Partners, IBM offers a wide range of services, solutions and technologies that enable Consumer Products firms to take full advantage of the new challenges in the marketplace, including environmental sustainability, products traceability and cost reduction.
For more information, please visit http://www.ibm.com/consumerproducts
About GCIGCI is the single unifying force that brings manufacturers and retailers together and enhances global commerce and improves consumer value in the overall value chain. GCI’s mission is to lead global value chain collaboration through the identification of business needs and the implementation of best practices and standards to serve consumers better, faster and at less cost.
14