gdp, wellbeing, and health: thoughts on the 2017 round of
TRANSCRIPT
1
GDP, wellbeing, and health: thoughts on the 2017 round of the International Comparison Program
Angus Deaton, Princeton University, University of Southern California, and NBER
Paul Schreyer, OECD
November 2020
The authors are co-chairs of the Technical Advisory Group (TAG) for the 2017 round of the International Comparison Program (ICP). This document was prepared in a personal capacity and is not an official document of the ICP. Nevertheless, we are grateful to other members of the TAG for their insights and discussions over many years. The authors’ views do not necessarily reflect those of the OECD or its Members. For the material on health, income, and COVID-19, Deaton acknowledges support from the National Institute for Aging to the NBER, award No. 5R01AG060104-03

2
ABSTRACT In March 2020, the International Comparison Project published its latest results, for the calendar year 2017. This round presents common-unit or purchasing-power-parity data for 137 countries on Gross Domestic Product and its components. We review a number of important issues, what is new, what is not new, and what the new data can and cannot do. Of great importance is the lack of news, that the results are broadly in line with earlier results from 2011. We consider the relationship between national accounts measures and health, particularly in light of the COVID-19 epidemic which may reduce global inequality, even as it increases inequality within countries. We emphasize things that GDP cannot do, some familiar—like its silence on distribution—and some less familiar—including its increasing detachment from national material wellbeing in a globalized world where international transfers of capital and property rights can have enormous effects on GDP, such as the 26 percent increase in Ireland’s GDP in 2015.

3
1. Introduction In early March, 2020, just as the world was going into lockdown in the face of the COVID-19
pandemic, the International Comparison Program1 (ICP) completed its most recent set of results,
for 2017. The ICP is one of the world’s largest statistical initiatives, whether by cost, geographical
coverage (176 countries in 2017), institutional involvement or longevity (it began in 1968). From its
start, the ICP has aimed to yield internationally comparable—common unit—comparisons of Gross
Domestic Product (GDP) and its main components. Not surprisingly, the new results received less
attention than normal, a timely reminder, if one were needed, that material wellbeing comes second
when there is a threat to health. GDP omits much that is central to people’s wellbeing.
Yet GDP remains one of our more important and useful measures and any more
comprehensive measure of wellbeing is impossible without the national accounts, properly
interpreted and adjusted. GDP measures run alongside other measures—currently health-related
measures—in assessing the consequences of the pandemic and, as seen from the statistical offices of
the OECD, the demand for information about GDP and its components has risen dramatically
since March 2020. The ICP is distinct in focusing on measures that are internationally comparable,
removing the gross distortions that can come from using market exchange rates to convert national
accounts. Without it, it would be impossible to make like-for-like international comparisons of
material living standards and of poverty rates.
Still, GDP leaves much undone even beyond health. If we want to use the ICP to look at
distribution, at who gets what, at poverty or inequality, it must be combined with other data,
typically from household surveys. Less obviously perhaps, GDP not only leaves much uncounted,
1 The ICP (https://www.worldbank.org/en/programs/icp) is led by the World Bank. The Eurostat-OECD PPP Programme (http://www.oecd.org/sdd/purchasingpowerparitiespppsdata.htm) constitutes a region of the ICP and delivers the relevant data for its members.

4
but includes transactions that have little to do with material wellbeing, making it dangerous to make
uncritical international comparisons across countries.
In this brief account, we highlight the most important new findings, as well as using the new
estimates to highlight what the numbers do not tell us, as well as some areas where, in the absence
of careful interpretation, they can be seriously misleading.
2. Important new findings
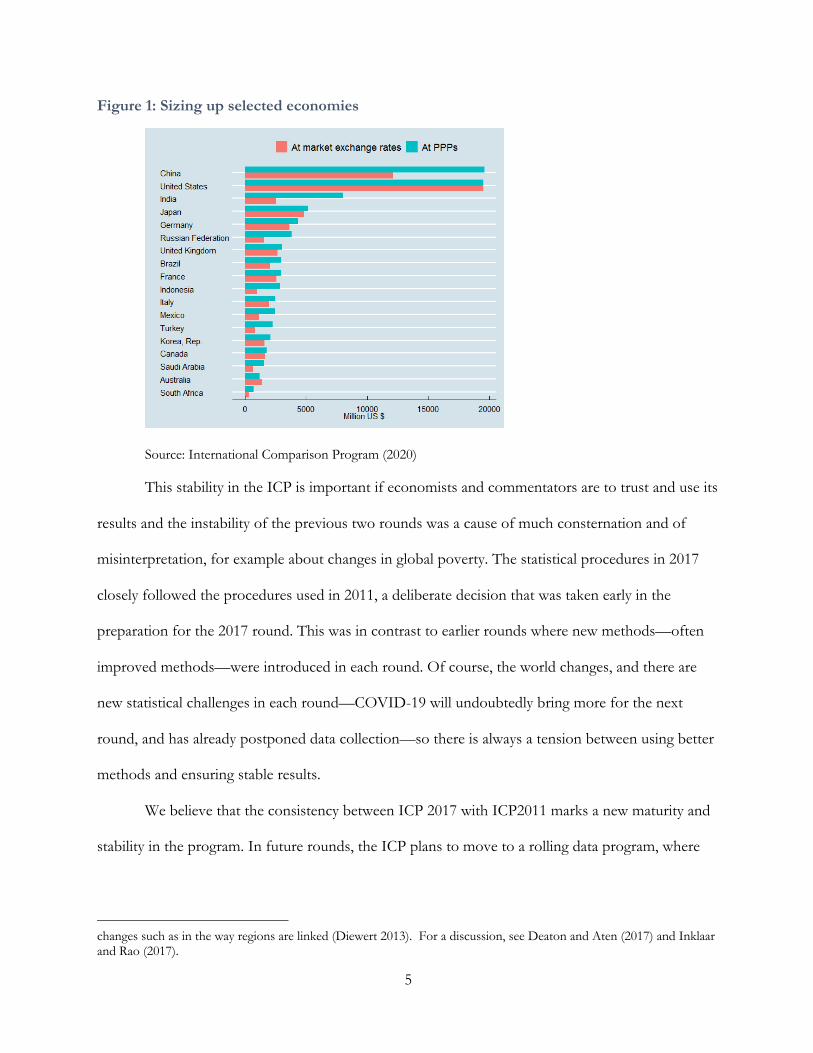
Figure 1 shows what is arguably the headline result of ICP2017, that the Chinese economy is now as
large or a little larger than that of the United States. In terms of market exchange rates, which take
no account of the fact that prices are lower in China, China is much smaller than the US. The new
result confirms the same finding of ICP2011, the first round to document the comparable sizes of
the two economies. Indeed, price levels in most countries are lower than in the US, so that for all of
the countries in Figure 1, their GDPs are larger in purchasing power parity dollars than in market
dollars. World GDPs are closer to one another when measured in common units.
A key finding of the 2017 results is that they are not very different from what we would have
expected if we had extrapolated the 2011 results using national GDP growth rates and the relevant
national price indexes, such as CPIs and price deflators of GDP. This may seem like a non-result,
and an odd thing to emphasize, but it is in sharp contrast to results in previous years. The 2011
results for consumption and income did not line up with the levels that would have been expected
by applying growth rates to the results of the preceding round in 2005. Nor did ICP2005 line up well
with extrapolations from the previous round in 19932. We will return to the consequences of these
discrepancies below when we discuss distributional issues.
2 Even under perfect conditions and error-free measurement, extrapolated and benchmark results need not line up exactly as established by Krijnse, Locker and Faerber (1984). Discrepancies arise in particular when patterns of expenditure are very different between countries, when data quality is weak or when there are important methodological
5
Figure 1: Sizing up selected economies
Source: International Comparison Program (2020)
This stability in the ICP is important if economists and commentators are to trust and use its
results and the instability of the previous two rounds was a cause of much consternation and of
misinterpretation, for example about changes in global poverty. The statistical procedures in 2017
closely followed the procedures used in 2011, a deliberate decision that was taken early in the
preparation for the 2017 round. This was in contrast to earlier rounds where new methods—often
improved methods—were introduced in each round. Of course, the world changes, and there are
new statistical challenges in each round—COVID-19 will undoubtedly bring more for the next
round, and has already postponed data collection—so there is always a tension between using better
methods and ensuring stable results.
We believe that the consistency between ICP 2017 with ICP2011 marks a new maturity and
stability in the program. In future rounds, the ICP plans to move to a rolling data program, where
changes such as in the way regions are linked (Diewert 2013). For a discussion, see Deaton and Aten (2017) and Inklaar and Rao (2017).

6
new data are collected and incorporated on a continuous basis, and this should further guarantee the
consistency over time that users require and expect.
3. An important item that is not included: health outcomes
GDP includes health expenditure, but it tells us nothing about health outcomes – a notable example of
an important component of well-being that is omitted and one that is of obvious salience during a
pandemic. The US spends twice as much on healthcare as do other countries, but has the lowest life
expectancy of any of the rich countries; see Figure 2 below. Beyond that, Covid-19 has shown that
almost all countries, rich and poor, are willing to save lives by giving up GDP in order to reduce
infection and mortality. This is true in the short run by accepting lock-downs and possibly in the
longer run, too: building more resilient health care systems and infection-proofing economies will
imply foregoing some productivity and GDP growth in return for safety and longer-term well-being.
Somewhat paradoxically, infection-proofing—a defensive expenditure to take us back to where we
were before—will count as part of GDP, and like repairs after a hurricane, will raise GDP above
what it otherwise would have been. Production has increased, but our ability to consume and invest
has been returned to what it was in a world without a pandemic.
There is a strong cross-country association between mortality, morbidity and GDP per
capita (Preston, 1975, Deaton 2003, 2013, Mackenbach and Looman 2013, Shkolnikov et al 2019),
so that people in poor countries live shorter lives than people in rich countries (mostly because of
higher infant and child mortality), while the world’s richest countries enjoy a life expectancy at birth
that today averages almost 80 across the OECD region (Figure 2). Of course, there are many
exceptions, poor countries with relatively high life expectancy (Rwanda, Bangladesh) as well as rich
countries with relatively low life expectancy (Equatorial Guinea, USA). High GDP per capita doesn’t
guarantee low morbidity and mortality: wealthier is not automatically healthier.

7
Figure 2. Life Expectancy at Birth and Actual Individual Consumption per Capita, 2017
Source: International Comparison Program (2020), World Development Indicators (2020): the areas of the circles are proportional to population of each country.
The COVID-19 virus and its associated mortality is further altering the relationship between
per capita GDP and mortality. Rich countries have many advantages—better health systems, greater
ability to substitute electronic for physical contact, and higher wealth to fall back when income
falls—but, at least up to the time of writing (November, 2020) and being mindful of measurement
problems in low-income countries, there appears to be a strong positive relationship across countries,
as well as across regions within countries, between per capita GDP and COVID fatalities per million
inhabitants. 3 (Note that this is in sharp contrast to what is happening within countries or regions,
where poor people are more likely than rich people to die from the virus.) One factor that genuinely
3 See https://ourworldindata.org/coronavirus-data#by-gdp-per-capita .

8
favors poorer countries is their younger age structure, given that COVID fatality rates are higher
among older people.
COVID appears to have first spread along trade routes (Wuhan, Milan, Paris, London, New
York) bringing the disease to some of the world’s richest cities first, cities where people live close
together and have a great deal of contact with one another. The cross-country correlation between
per capita GDP and per capita mortality is falling over time, as richer places bring the disease under
control, as the disease spreads to poorer places, and as the full impact of the pandemic becomes
clear in countries where reporting of mortality is weak.
In the end, the familiar pattern of health and wealth may reassert itself, but it is too early to
be sure and the pandemic may leave a permanent mark on the global relationship between health
and wealth, as well as on global inequality. It would certainly be a mistake to point to the long-term
positive correlation between GDP and life expectancy and argue that with economic growth re-
established, health will look after itself. GDP per capita is not a short-cut measure of the health
status of the population. And high levels of GDP per capita did nothing to protect countries against
fatalities in the pandemic, and may not protect countries against large losses of income as a result of
the pandemic, either directly because people cannot work, or because of government responses in
the form of lockdowns. The IMF, in its October 2020 report,4 forecasts a positive 1.9 percent
growth in 2020 for China, as opposed to a 4.3 percent decline for the US and a 9.8 percent decline for
the UK. African per capita GDP is forecast to contract by 2.6 percent, compared with 5.8 percent
for “advanced countries” and 8.3 percent for the Euro area. These forecasts, if they or numbers like
them come to pass, will bring about a sharp reduction in global inequality.
4 International Monetary Fund (2020).

9
Health apart, there are many other aspects of the quality of life that GDP does not capture:
social interaction, clean air, work-life balance, democracy, safety, happiness5. These were never
designed to be captured by GDP as noted since the inception of national accounts (Kuznets 1934).
Indeed, many supplements to GDP have been proposed to provide a perspective on these broader
dimensions, ranging from Nordhaus and Tobin’s 1972 Measure of Economic Well-being to the UNDP’s
Human Development Index6. French President Nicolas Sarkozy raised the choice, use and
communication of key societal indicators to a new political level by commissioning the Stiglitz-Sen-
Fitoussi Report (2009) which brought strong new impetus to the Beyond GDP agenda including the
OECD’s Better Life Initiative7. In short, the wise use of GDP and of all PPP measures must start from
the realization that important aspects of well-being do not go through the market and supplementary
indicators are necessary.
4. GDP, even in international dollars, can be misleading
If our main concern is material well-being, consumption8 per capita is a better choice than GDP per
capita. While the two measures correlate, they do so imperfectly, and the differences can sometimes
be of great importance. Some of this is familiar, for example that the share of consumption in GDP
is much smaller in China than in America. A less familiar case comes from Figure 3, which shows
the top 12 countries ranked by GDP per capita in the 2017 round of the ICP.
5 Nor is GDP, or for that matter, household consumption a gauge for the sustainability of environmental, social and economic conditions over time. For comprehensive overviews of the institutional and academic debate around (Beyond) GDP see Jorgenson (2018), Fleurbaey and Blanchet (2013) or Schreyer (2016). 6 See http://hdr.undp.org/en/content/human-development-index-hdi 7 See https://www.oecd.org/statistics/better-life-initiative.htm with its How’s Life? Series (OECD 2020) and also. Stiglitz, Durand and Fitoussi (2019) 8 Consumption is measured here as Actual Individual Consumption (AIC) which factors in the value of health services, education and housing services that are provided to households for free or at reduced costs. AIC thus paints a more accurate picture of household’s material living standards than a simple measure of household consumption expenditure. That said, many authors have argued that consumer durables that are treated as current consumption expenditure ought to be recognized as investment products so as to better gauge the flow of services they provide beyond the accounting period (see for instance Diewert and Shimizu 2019).

10
Figure 3: Top twelve countries by GDP per capita in ICP 2017
Source: International Comparison Program (2020).
The United States apart, all of them fall into two categories: they are either investment hubs
(defined as economies where the stock of foreign direct investment is 150 percent of GDP or more)
or resource-based countries (defined as economies where resource rents account for 10 percent of
GDP or more). In both cases, consumption is a relatively low share of total GDP, typically because
profits account for a much larger part of national income than wages and salaries. Over time, profits
will contribute to the income of at least some households in the country and, in turn, their
consumption. But at any given moment GDP per capita includes amounts that are not part of
people’s current material wellbeing. Even more sharply, the income from stocks of foreign-owned
capital are part of Gross Domestic Product, because it originates within the country, but it is not part
of Gross National Income because it is not owned by nationals.

11
Ireland provides an interesting example. Attracted in large part by low corporation tax rates,
several large multinational corporations relocated their economic activities, including intellectual
property assets, to Ireland so that income generated from the use of intellectual property now
contributes to Irish GDP. In 2015, there was a spectacular example where Irish real GDP increased by
26 percent in a single year, mainly driven by multi-national firms’ transfer of intellectual property assets
into Ireland. By contrast, per capita disposable income of Irish households grew at “only” 4.6
percent in real terms and GNI at constant market prices by 13.6 percent9. Globalization,
digitalization, a well-educated labor force and an attractive tax regime are all at work together in the
Irish case. There is also substantial evidence that profit shifting via a variety of channels such as
transfer mis-pricing, can lead to very high profit rates, and GDP, in investment hubs.
Exactly how GDP and GNI differ can be bewilderingly complex; the faint of heart might
wish to skip the rest of this paragraph. For example, it depends on whether headquarters are set up
in the country or not. If an affiliate is set up in an investment hub but headquarters remain abroad,
GNI should not be affected by profit shifting behavior: suppose the affiliate delivers some
overpriced services to the headquarters, then profits will show up in the GDP of the investment hub
but not its GNI because the System of National Accounts imputes an income flow back to the
headquarter country even if profits are reinvested in the affiliate and not actually transferred back. If,
on the other hand, headquarters are set up in the investment hub whose profits are artificially
inflated, no such imputation happens. GNI will remain high, in line with GDP, unless profits are
actually transferred abroad as dividend payments – then GNI would be reduced10
9 See https://www.cso.ie/en/releasesandpublications/in/nie/in-mgnicp/ 10 In this case one might ask why the whole operation was undertaken in the first place. One answer may be that there are bilateral agreements that stipulate non-taxation of transferred profits in the receiving country if profits have already been taxed, however low, in the sending country.

12
GDP is gross domestic product, meaning it was produced in the country, but not necessarily
owned by its residents. We have already seen this in the case of Ireland. Another point is that domestic
product counts workers where they produce, not where they live. About 180,000 people work in
Luxembourg, but live in France, Germany or Belgium; these workers commuting across the border
are not counted as part of Luxembourg’s 600,000 or so resident population although they are
counted as part of its workforce of which they constitute some 40 percent (Eurostat 2018). If cross-
border commuters were added to the resident population, overall GDP per capita would be smaller
by some 20 percent. A more accurate picture of the income accruing to the resident population is
again GNI per resident person. In 2017, this was 36 percent below GDP per resident person in
Luxembourg (though still among the highest in the OECD).
Figure 4. The relationship between consumption and GDP, 2017
Source: Authors’ calculations, based on International Comparison Program (2020).

13
Resource-rich countries point to another issue with GDP, that it is measured Gross, not Net
as neither depletion or deterioration nor discoveries of natural assets are reflected. Indeed, for a
fuller picture of sustainability of economic activity, accounts need to be taken of the stocks of wealth
– natural, produced, financial – and their change over time that reflects additions (such as
investment or new discoveries) as well as deductions (such as depreciation, deterioration or
depletion).
The top 12 league table illustrates another general point. The consumption to GDP ratio in
investment hubs and resource-rich countries lies systematically below average; Figure 4 illustrates.
The ratio is smaller, and the phenomenon more obvious, when consumption shares are calculated
using PPPs, because the price of consumption—with many non-tradeables—is lower than the price
of GDP, something that is not recognized when market exchange rates are applied to both GDP
and consumption. Note that a low consumption to GDP ratio reflects both an economic reality
(likely triggered by relatively high profits as opposed to wages and salaries) as well as the impacts of
profit shifting, which can increase GDP in investment hubs relative to other jurisdictions. Either
way, when we are interested in material wellbeing, we need to place a greater focus on measures on
the economic situation of households. Fortunately, such data can be found in the national accounts
for virtually all countries11, and can be compared internationally with the help of PPPs though it
must be enriched by distributional information, because averages are oblivious to which households
are getting what.
5. Can we check the ICP numbers using proxies, like light emitted and seen from space?
The discussion of the previous section makes it clear that there are many different animals in the
National Accounting menagerie, each different from the other, each with its own uses, each with its
11 See, for instance, the OECD Household Dashboard https://www.oecd.org/sdd/na/household-dashboard.htm .

14
own measurement strengths and weaknesses, which is even true when the underlying concepts
appear to be very similar. There is no single measure of national income, of national economic
activity, or of national economic growth. GNI is different from GDP, and NNI is different from
either. As the Irish example shows, if we are interested in the resources available for people’s
consumption, we may want to work with disposable income, or with actual consumption. If we want
to exclude publicly provided consumption, we need household final consumption. If we are
interested in production, we need to measure gross output, including intermediate production,
which is excluded from GDP, because GDP measures value added, not output.
Beyond these conceptual differences, there are also differences between real and nominal,
and, most relevantly for the ICP, between using domestic market prices, or one of the several
available constructs of international prices.
All of these concepts can be used to measure growth, something that is often the main focus
of interest.
There is no such thing as true GDP, true national income, true economic activity, or true
economic growth. The different concepts all exist for a reason, usually because they measure
different things, all of which we might be interested in for some purposes. To say that one of them,
or some hybrid, is the true national income, is like saying a Shetland pony is the true horse, or that
the grey wolf is the true dog, or that the number of ivory-billed woodpeckers in a forest is the true
measure of the forest’s fauna.
All of this hardly bears repeating, yet there is a growing recent literature that works with
proxy measures that, it is argued, are useful for cross-checking national accounts measures, including
those in the ICP. This literature is motivated by the evident difficulties of measuring national
accounts, especially in poor countries that lack well-funded statistical offices or the data
infrastructure on which well-funded offices rely. In these circumstances, there is a role for proxies
15
that might give us new or different insights or that might help with often necessary imputations.
One such, with a long history, is to use the share of food in household disposable income as a proxy
for household living standards, a suggestion that goes all the way back to Engel in the 19th century,
see Ålmas (2012) for a recent example.
A more recent proxy for economic activity is a measure of light intensity, collected from
satellites in space. Light intensity has the advantage of being measured in the same way for all
countries. Its measurement is most likely independent of the way countries measure their national
accounts, useful in any cross-check. Henderson, Storeygard and Weil (2012) show how the lights
data can “illuminate” various issues, while recognizing that lights will vary with a number of
factors—such as the number of hours of daylight, the local temperature, the fraction of lighting that
comes from electricity, and the shares of consumption and investment in GDP. Indeed, lighting
could easily be more closely related to gross duplicated output—intermediate production uses power
too—than to GDP, which excludes duplication. This is a serious problem for the lights measure,
that we do not know what concept or set of concepts it is supposed to proxy.
Beyond that, as there is no “true” measure of national income, or of national economic
activity, light (or the food share) cannot be a correct measure to adjudicate whether “true” income is
better measured by GDP at market or international prices, as in and Pinkovskiy and Sala-i-Martin
(2020), notwithstanding the fact that statistical correlations can be helpful in imputing or nowcasting
missing values. GDP at market prices and GDP at international prices are two different things that
are used for different purposes.
We have a great deal of sympathy for those who have been frustrated by the changing
measures in successive editions of the International Comparison Program, but we cannot use
proxies to assess their reliability without understanding how the proxies relate to the many different
concepts in the national accounts.
16
6. What does the ICP tell us about global inequality?
The ICP cannot inform us about the distribution of income between households within countries, but it
addresses two other key aspects of global distribution. First, the ICP is instrumental in the
construction of the World Bank’s estimates of extreme poverty that paint a picture of the number
and geographical distribution of the world’s poorest (Atamanov et al 2020). Second, by accounting
for price level differences between countries, the ICP provides us with appropriate measures of
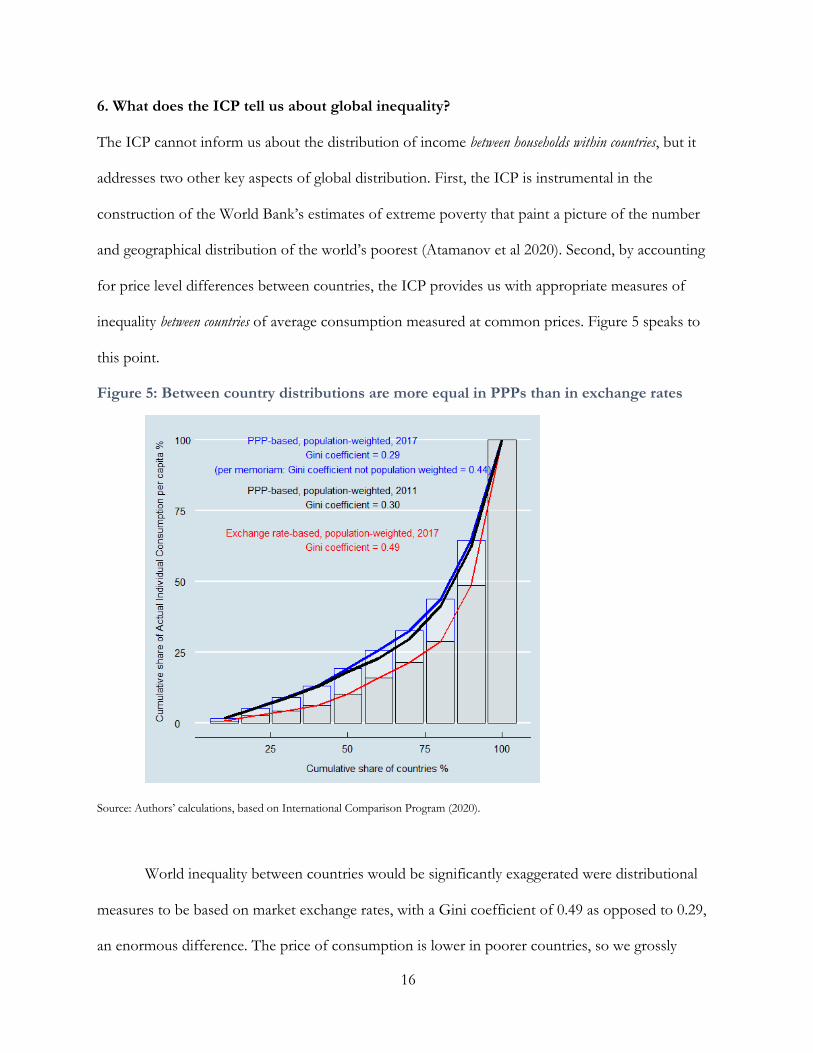
inequality between countries of average consumption measured at common prices. Figure 5 speaks to
this point.
Figure 5: Between country distributions are more equal in PPPs than in exchange rates
Source: Authors’ calculations, based on International Comparison Program (2020).
World inequality between countries would be significantly exaggerated were distributional
measures to be based on market exchange rates, with a Gini coefficient of 0.49 as opposed to 0.29,
an enormous difference. The price of consumption is lower in poorer countries, so we grossly
17
exaggerate global inequality if we use market exchange rates. And this is not to speak of the fact that
exchange rates sometimes move quickly and with large swings in a way that has nothing to do with
the global distribution of living standards. As it tuns out, the international distribution of per capita
consumption as measured here has hardly budged between 2011 and 2017, though the latter
distribution is a little more equal, with a gini of 0.29 versus 0.30. These estimates use population
weights for each country so that the Lorenz curves and gini coefficients would be accurate for the
world as a whole if everyone in each country had the mean country consumption12. Of course, each
person in each country does not have the same consumption, so that, if we are interested in the
global distribution of income between individuals, or households, these data need to be
supplemented with data from household surveys, as is done, for example, by Milanovic (2016).
When thinking about distribution we should recognize some of the difficulties that the ICP
faces in tabulating the world as a whole. How those difficulties are handled has been responsible for
some of the disconcerting changes between ICP rounds, especially between ICP1993, ICP2005,
ICP2011, and ICP2017, with 2005 something of an outlier. There are many methodological
challenges, but one of the most severe is how to make accurate and meaningful comparisons
between very different countries, countries at different levels of development, or countries with very
different patterns of relative prices, of consumption, government expenditure, and investment. The
European statistical authority, EUROSTAT, calculates PPPs for the countries in the EU, and those
numbers are used to set financial transfers between countries, so their importance goes beyond the
curiosity of academic researchers. The countries involved in the EU comparisons are all relatively
advanced, and have relatively similar patterns of GDP and of relative prices. But that is most
12 The unweighted Gini coefficient that treats each country as one household would be a great deal larger.

18
definitely not true when we move to much poorer countries, for example in Africa, or when we try
to compare prices in Japan, Bolivia, Yemen, and Chad, just to take four wildly different countries.
The ICP works at a regional level, so that Eurostat and the OECD gather data for the EU
and OECD, the African Development Bank for Africa, the Asian Development Bank for Asia, and
so on. Once each region has collected its data, the regional offices calculate a set of PPPs (and the
associated PPP-based accounts) for their region. Those estimates avoid at least some of the extreme
problems of comparing very different places. But if we want to know about global inequality, or
living standards in India or Peru relative to the US, which go into the global poverty estimates, all of
the regions need to be somehow glued together into a single global table of accounts, and it is those
numbers, in the World Development Indicators, or in successive versions of the Penn World Tables,
that most users start from. Yet this is not always the best thing to do, and for users interested in a
region, the regional numbers within the global table are likely preferable.
The “gluing-together” stage of the ICP construction leaves the within-region accounts alone,
but calculates prices for each regional block that are used to bring them into a common set of units;
think of these prices as “tectonic” shifters that move whole continents up or down to bring them
into a single set of accounts. Calculating these tectonic factors is not straightforward and there are
several different ways of doing so, and estimates of global inequality, such as those in Figure 4, are
sensitive to the details, because we are moving all the countries of Africa, or all the countries of Asia,
closer to or further away from Europe and North America.
Most informed commentators now agree that the tectonic procedure used for the 2005
round—which used a few countries in each region to give the continental prices—was inferior to
the procedure used in 2011 and 2017—which used information from all the countries in all regions.
The result was that the world was made artificially unequal in 2005 compared with earlier estimates,
an inequality that shrank markedly in 2011, and was maintained in 2017, as is seen in Figure 5. As we

19
noted at the outset, this stability is likely to be maintained into the future, in part because of a
deliberate decision to limit methodological changes in the future, but also because of a commitment
to move to a program of annual estimates in the post-COVID world.
7. Conclusion
In the times of Covid-19, as at other times, GDP is carefully watched – policy-makers need to know
where market activity is heading and what is happening to jobs and income. But the limits of GDP
are equally worth repeating lest we forget about vulnerable parts of the population, the fact that
there are sometimes large elements of GDP that are irrelevant for the median (or sometimes even
any) consumer and that GDP does not capture many things that people care about, health outcomes
being a prominent example. There is little prospect of and indeed no need to turn GDP into a
measure of well-being. We also need to understand just how GDP is measured, the difficulties in
doing so, and how many other useful measures are included in the national accounts. But strong
supplementary indicators are needed as is a consistent view of material well-being around the globe.
The next revision of the System of National Accounts has taken up the challenge of embarking
some way down this avenue13. And the ICP continues to provide a great service to analysts, policy-
makers and the public alike.
References Ålmas, I., 2012, “International income inequality: measuring PPP bias by estimating Engel curves for food,” American Economic Review, 102(1), 1093-1117. Atamanov A., Ch. Lakner, D. G. Mahler, S. K.T. Baah and J. Yang (2020), “The Effect of New PPP Estimates on Global Poverty: A First Look”, World Bank Global Poverty Monitoring Technical Note;
13 See https://www.oecd.org/sdd/theoecdstatisticsnewsletter-allissues.htm.
20
http://documents.worldbank.org/curated/en/191631589896884566/pdf/The-Effect-of-New-PPP-Estimates-on-Global-Poverty-A-First-Look.pdf Deaton A. and B. Aten (2017), “Trying to understand the PPPs in ICP2011: why are the results so different?” American Economic Journal: Macroeconomics, 9(1), 243�64. Deaton, A. (2003) Health, Inequality, and Economic Development Journal of Economic Literature Vol. XLI March 2003) pp. 113–158. Deaton, A. (2013) The Great Escape, Princeton University Press. Diewert, W. E. (2013), “Methods of Aggregation above the Basic Heading Level: Linking the Regions.” In Measuring the Real Size of the World Economy: The Framework, Methodology and Results of the International Comparison Program, edited by Fred A. Vogel and D. S. Prasada Rao, 169–96. Washington, DC: World Bank. Diewert, W.E. and C. Shimizu (2019), “Measuring the Services of Durables and Owner Occupied Housing”, Discussion Paper 19-02, School of Economics, University of British Columbia, Vancouver, B.C., Canada, V6T 1Z1. Eurostat (2018), ‘Statistics on commuting patterns at regional level’, Statistics Explained, September, https://ec.europa.eu/eurostat/statistics-explained/pdfscache/50943.pdf. Fleurbaey M. and D. Blanchet (2013) Beyond GDP: Measuring Welfare and Assessing Sustainability, Oxford University Press. Henderson, J. V., A. Storeygard, and D. N. Weil (2012) “Measuring economic growth from outer space,” American Economic Review, 102(2), pp. 994-1028. Hoekstra, R. (2019), Replacing GDP by 2030, Cambridge University Press. Inklaar, R. and D.S. P. Rao (2017) “Cross-country income levels over time: did the developing world suddenly become much richer?” American Economic Journal: Macroeconomics, 9(1), 265�90. International Monetary Fund ( 2020), World Economic Outlook: a long and difficult ascent, October. https://www.imf.org/en/Publications/WEO/Issues/2020/09/30/world-economic-outlook-october-2020. Jorgenson, D. W. (2018); “Production and Welfare: Progress in Economic Measurement”, Journal of Economic Literature, 56(3), 867–919. Krijnse Locker, H., and H. D. Faerber (1984), “Space and Time Comparisons of Purchasing Power Parities and Real Values.” Review of Income and Wealth 30 (1): 53–83. Kuznets, S. (1934); National Income 1929-1932: A report to the US Senate, 73rd Congress, Washington DC, U.S. Government Printing Office.

21
Mackenbach, J. P. and C. W. N. Looman (2013) “Life expectancy and national income in Europe, 1900–2008: An update of Preston's analysis,” International Journal of Epidemiology 42: 1100–1110. https://doi.org/10.1093/ije/dyt122. Milanovic, B., 2016, Global Inequality: A New Approach for the Age of Globalization. Harvard University Press. Nordhaus, W. and J. Tobin (1972) “Is Growth Obsolete?”, in Economic Research and Prospect, Vol.5: Economic Growth, NBER. OECD (2020) How’s Life? 2020 Measuring Well-being, OECD Publishing, http://www.oecd.org/statistics/how-s-life-23089679.htm Pinkovskiy, M. and X. Sala-i-Martin (2020) “Shining a light on Purchasing Power Parities,” American Economic Journal: Macroeconomics, 12(4), pp. 71-108. Preston, S. H. (1975) ‘The Changing Relation between Mortality and Level of Economic Development’; Population Studies, Vol. 29, No. 2, pp. 231-248. Schreyer, P. (2016) ‘GDP’; in Matthew D. Adler and Marc Fleurbaey (eds.) The Oxford Handbook of Well-being and Public Policy ; pp. 21-46; Oxford University Press. Shkolnikov, V., E. Andreev, R. Tursunzade, D. A. Leon (2019), “Patterns in the relationship between life expectancy and gross domestic product in Russia in 2005–15: a cross-sectional analysis”, The Lancet Public Health, Vol 4, Issue 4, E181-E188. Stiglitz, J., A. Sen, J.-P. Fitoussi (2009), Report by the Commission on the Measurement of Economic Performance and Social Progress, https://www.economie.gouv.fr/files/finances/presse/dossiers_de_presse/090914mesure_perf_eco_progres_social/synthese_ang.pdf Stiglitz, J., M. Durand, J-P. Fitoussi (2019), Beyond GDP: Measuring What Counts for Economic and Social Performance, OECD Publications, https://www.oecd.org/publications/beyond-gdp-9789264307292-en.htm