ge matics for ge smart punjab - geosmart india
TRANSCRIPT

Dr. BRIJENDRA PATERIYA
DIRECTOR PUNJAB REMOTE SENSING CENTRE (PRSC)
LUDHIANA, INDIA
GEOMATICS FOR DIGITAL INDIA -Requisites for successful implementation of Geomatics in Digital India
GE MATICS FOR GE SMART PUNJAB

A BRIEF ABOUT PRSC
GEOMATICS Vs GIS
GOVERNANCE Vs SMART GOVERNANCE
APPROACH & APPLICATIONS
GEOSMART PUNJAB – Towards Good Governance
TANGIBLE BENEFITS
DISCUSSION
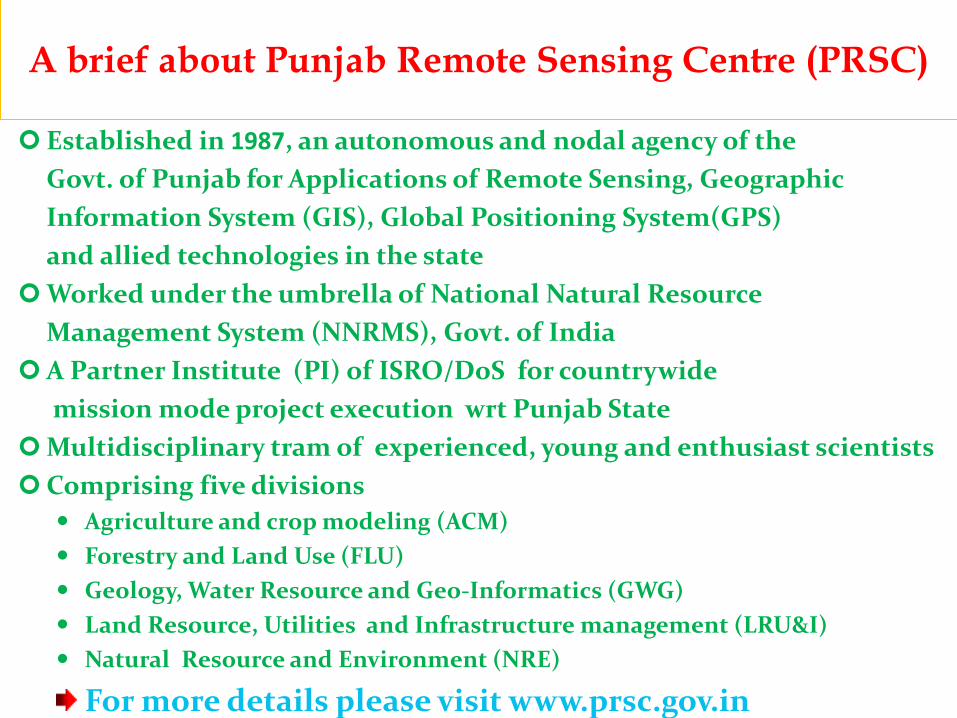
A brief about Punjab Remote Sensing Centre (PRSC)
Established in 1987, an autonomous and nodal agency of the
Govt. of Punjab for Applications of Remote Sensing, Geographic
Information System (GIS), Global Positioning System(GPS)
and allied technologies in the state
Worked under the umbrella of National Natural Resource
Management System (NNRMS), Govt. of India
A Partner Institute (PI) of ISRO/DoS for countrywide
mission mode project execution wrt Punjab State
Multidisciplinary tram of experienced, young and enthusiast scientists
Comprising five divisions
Agriculture and crop modeling (ACM)
Forestry and Land Use (FLU)
Geology, Water Resource and Geo-Informatics (GWG)
Land Resource, Utilities and Infrastructure management (LRU&I)
Natural Resource and Environment (NRE)
For more details please visit www.prsc.gov.in

GEOMATICS Vs GEOGRAPHIC INFORMATION SYSTEM GIS
Roger Tomlinson - recognized importance of accurate and relevant data by
creating the Canadian Land Inventory and the first GIS. A tool to respond to
land planning and decision making
Michel Paradis - a every method and tool for geographic data acquisition.
From photogrammetry to land surveying, Geomatics a scientific term in
response to modern data acquisition techniques in these fields.
Roots of the definitions of Geomatics and GIS.
The definitions can evolve and encompass
latest technological development
The term Geomatics was introduced in 1981
and GIS in 1968.
… both are progressing exponentially with new, exciting developments
Filed Surveys, aerial photographs satellite imaging, GPS, LIDAR, smart
phones- UAVs ......Collecting, measuring, analyzing and computing for decision
making and serving the cause meant for.....
Source: www.gisgeography.com

GOVERNANCE Vs SMART GOVERNANCE
GOVERNANCE
o Formed by vote bank of caste, colour,
religion, region etc…
o Lack of transparency
o Plan with inadequate informed facts
and figures
o With a objective to win election to rule
o Work for ruling not governing to serve
MOBOCRACY (The Tribune-29Feb16)
Democratic system of Governance

o Elected on wisdom of voters
and not by fear, favour or
compulsion
o Transparent system
o Well informed, plan ahead
with effective and efficient
system
o Ensure to win with good
governance
o Work for good governance to
serve
GOVERNANCE Vs SMART GOVERNANCE
SMART GOVERNANCE

APPROACH & APPLICATIONS
Elected Head of Govt
Public Representatives
PPP- POWER PROJECTS PROPERTY
PUBLIC

BEST PRACTICES OF GOVERNANCE-
GEOMATICS - A way forward
GEOSMART – To see the change , development , well being and prosperity
APPROACH & APPLICATIONS
PPP -PEOPLE PRIORITIES POWER
PUBLIC
Elected Head of Govt
Public Representatives

BEST PRACTICES OF GOVERNANCE- GEOMATICS - A WAY FORWARD

APPROACH & APPLICATIONS

GEOSMART PUNJAB – Towards Good Governance
Natural Resource
Public Utility & Facility
LUDHIANA – SMART CITY

Application Areas of g- Governance in Punjab
• GEOSAMRT Punjab - Action Plan
• User departments covered:
o Department of Agriculture
o Department of Animal Husbandry
o Department of School Education
o Department of Governance Reforms
o Department of Health & Family Welfare
o Department of Higher Education
o Department of Irrigation
o Department of Local Government
o Department of Planning
o Department of Rural Development & Panchayats
o Department of Science, Technology & Environment
o Department of Technical education & Industrial Training
o Department of Tourism & Cultural Affairs
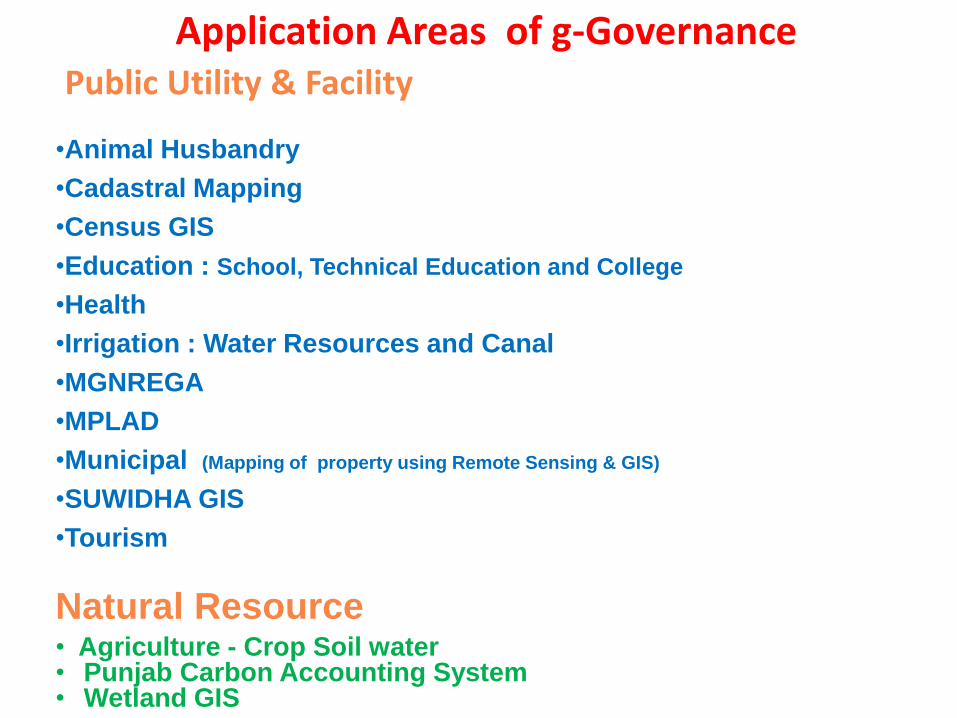
Application Areas of g-Governance
Public Utility & Facility
•Animal Husbandry
•Cadastral Mapping
•Census GIS
•Education : School, Technical Education and College
•Health
•Irrigation : Water Resources and Canal
•MGNREGA
•MPLAD
•Municipal (Mapping of property using Remote Sensing & GIS)
•SUWIDHA GIS
•Tourism
Natural Resource
• Agriculture - Crop Soil water • Punjab Carbon Accounting System • Wetland GIS

Census GIS Suwidha GIS Education GIS Animal Husbandry GIS Tourism GIS Health GIS
Agriculture GIS
Users Wetland GIS
Cadastral Mapping Web GIS
Irrigation GIS MPLAD GIS
Conceptual Framework for Application of g-Governance

MPLAD GIS
(Member of Parliament Local Area Development Scheme)
Each MP has
the choice to
suggest to the
District
Collector for,
works to the
tune of Rs.5
Crores per
annum to be
taken up in
constituency.
Development of SDSS – details of work
- funds released for particular work
- duration
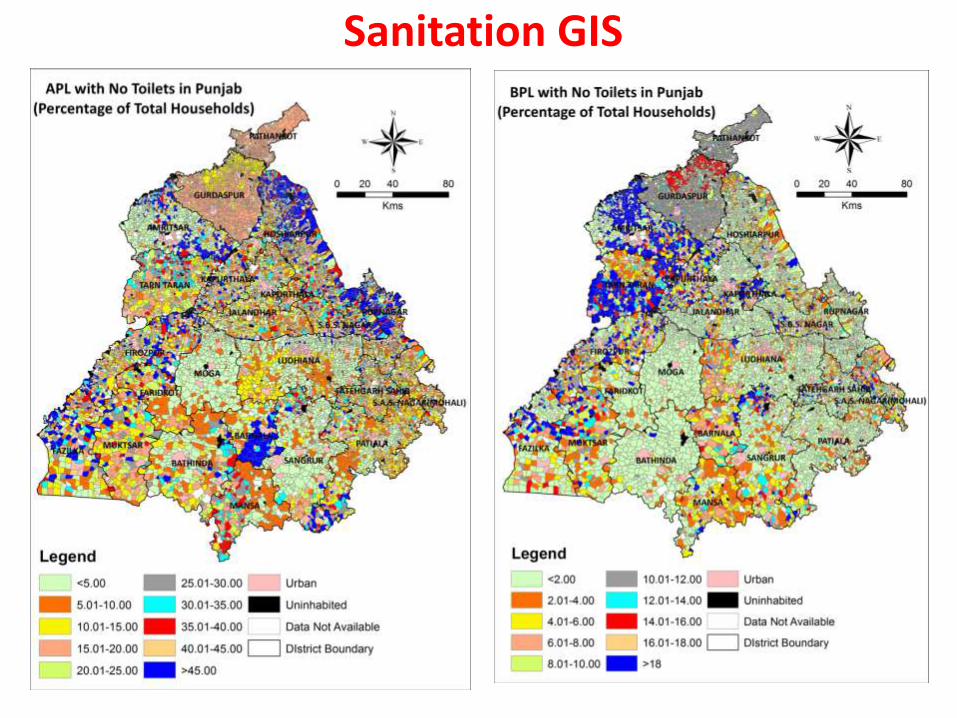
Sanitation GIS

Cadastral Mapping
Using Worldview-2 Satellite
data

MUNICIPAL CORPORATION LUDHIANA (SELECTED UNDER SMART CITY SCHEME OF GOI

ADMINISTRATIVE UNITS ZONE BOUNDARY
21 Sq.
Km
42 Sq.
Km
32 Sq.
Km
47 Sq.
Km
BLOCK BOUNDARY
ZONE BOUNDARY
WARD BOUNDARY

SATELLITE DATA
CAPTURED VECTORS
LANDUSE CLASSIFICATION

PERFORMA FOR DATA COLLECTION
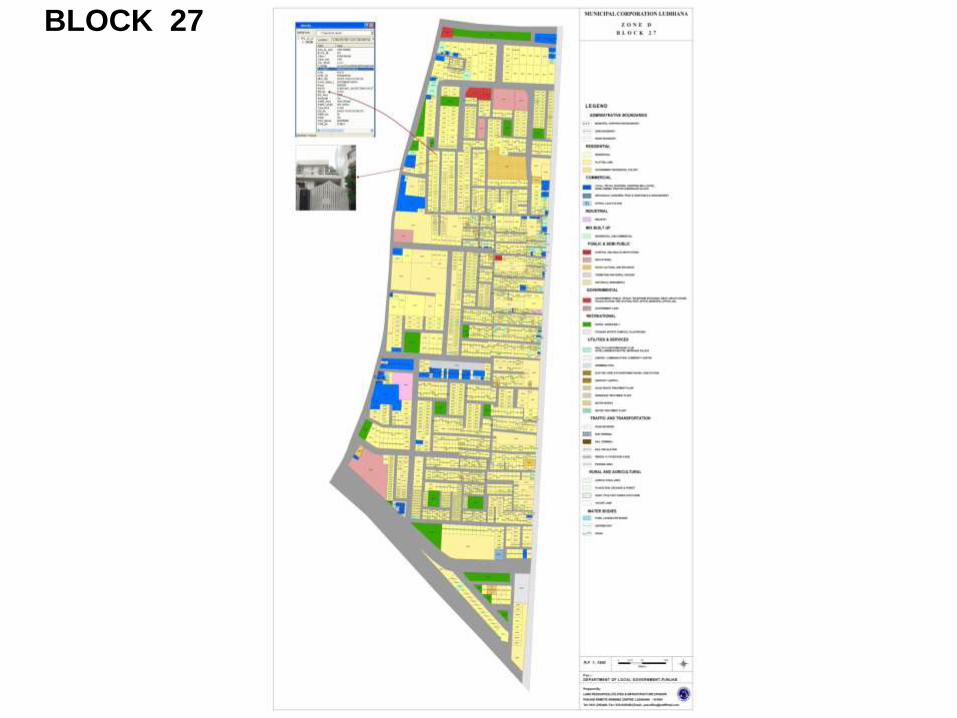
BLOCK 27
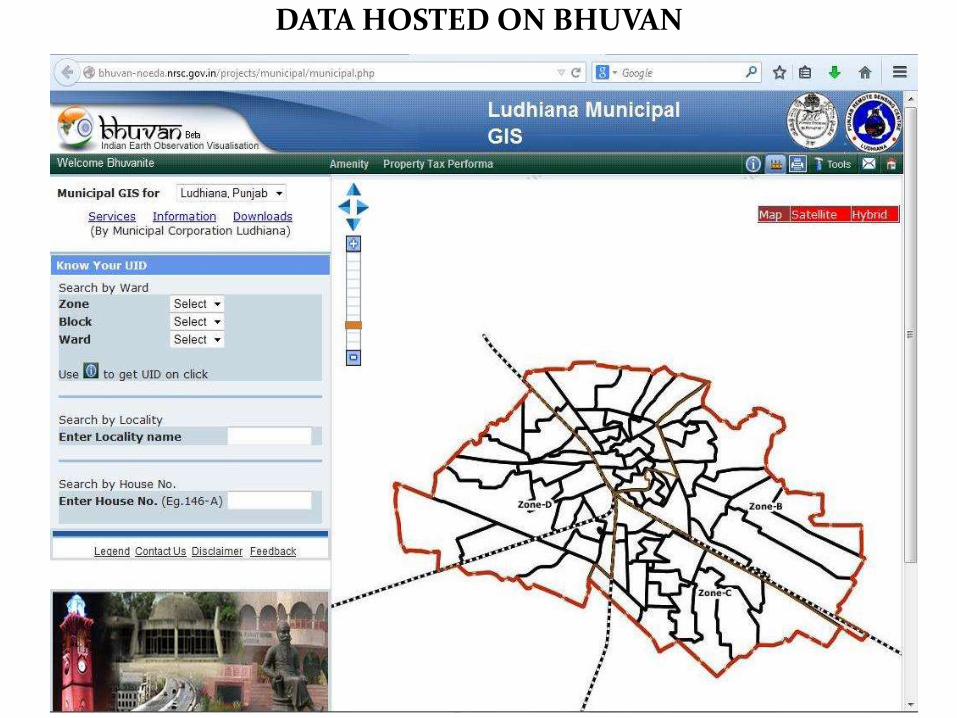
DATA HOSTED ON BHUVAN
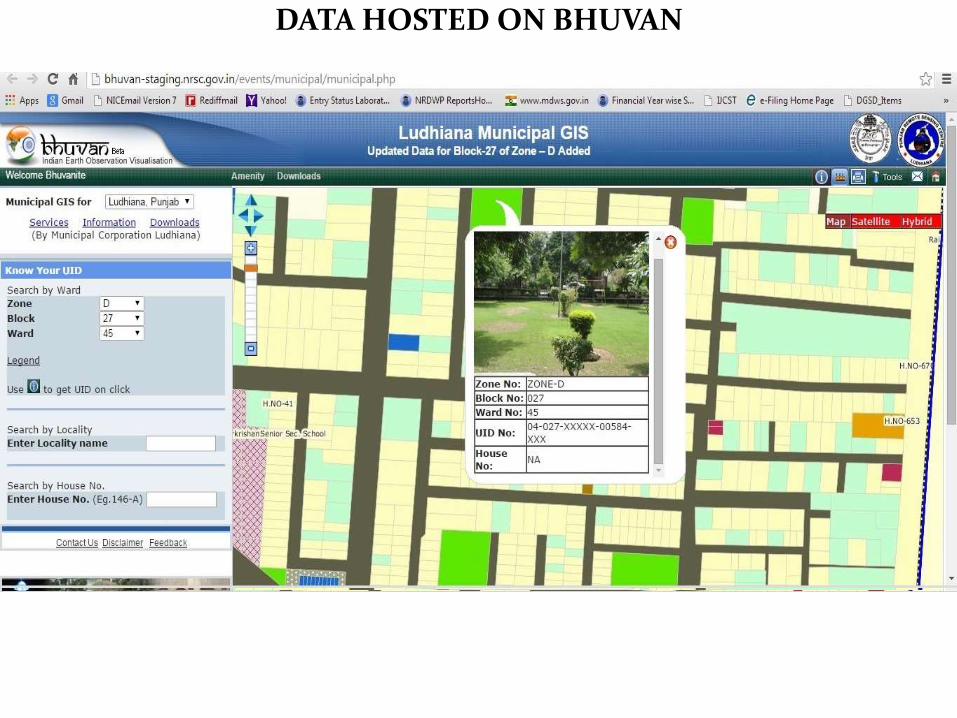
DATA HOSTED ON BHUVAN

PROPERTY ZONES

MICRO LEVEL PLANNING: Pakhowal Block

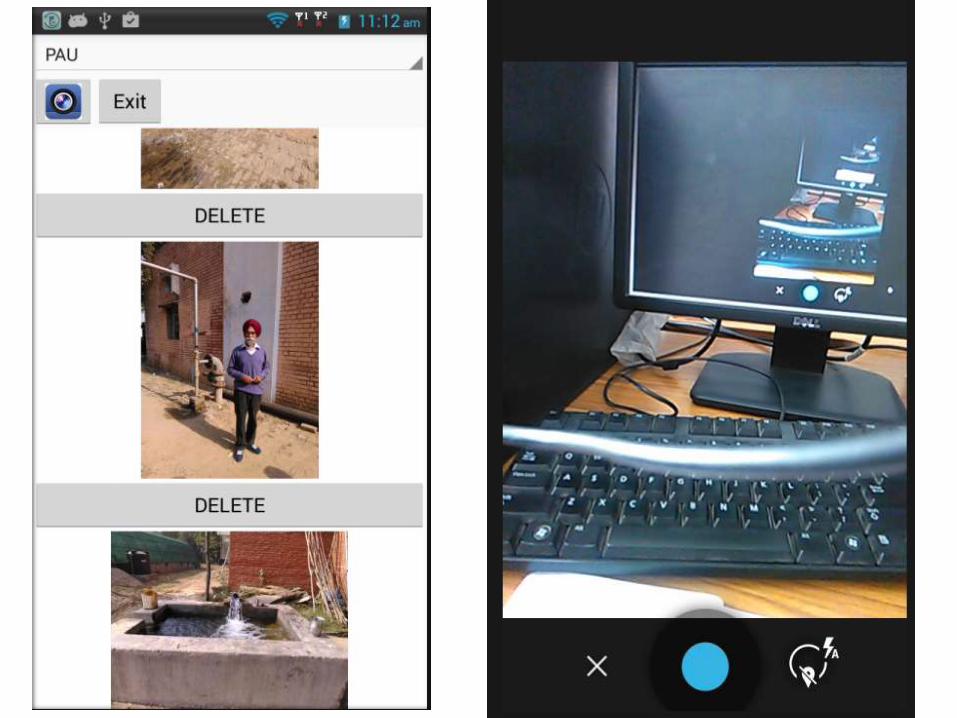
Rural Drinking Water Supply Sources

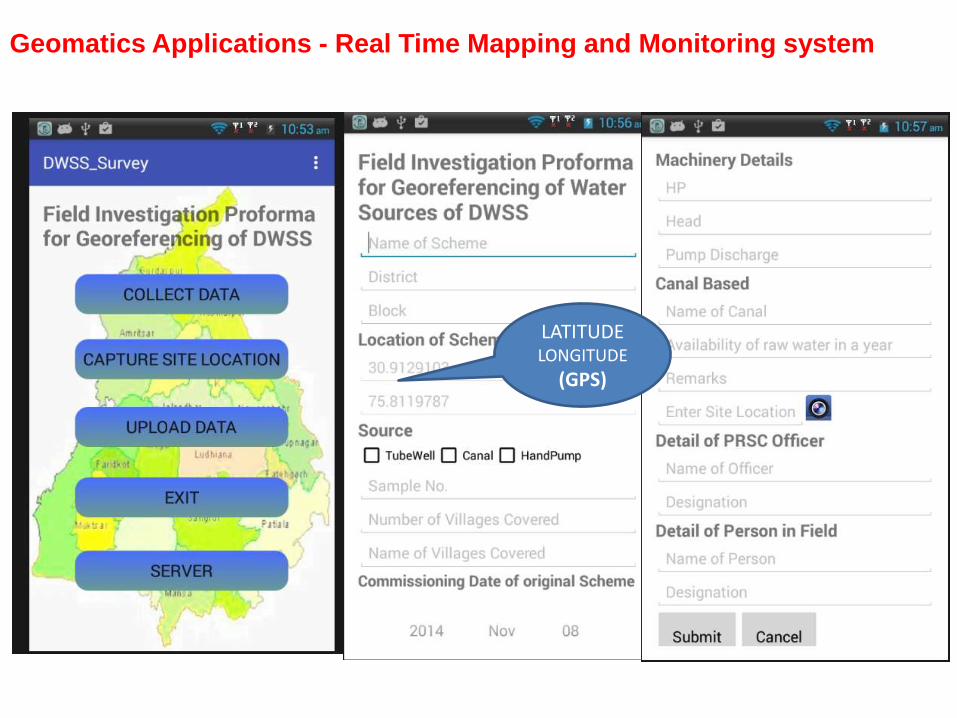
LATITUDE LONGITUDE
(GPS)
Geomatics Applications - Real Time Mapping and Monitoring system


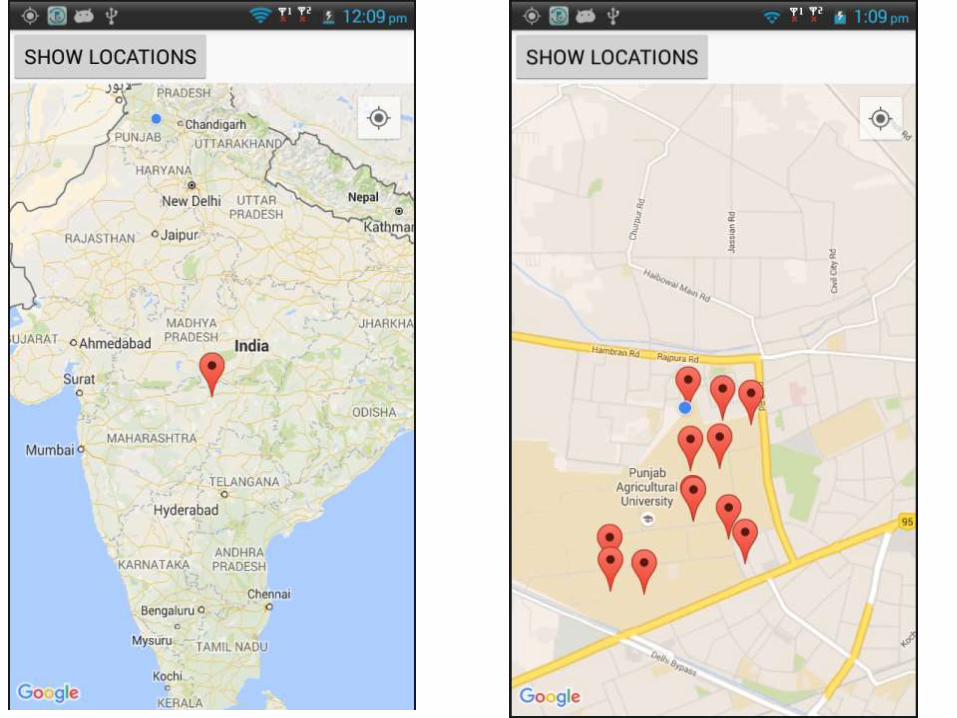

Automation of Sewa Kendra Application
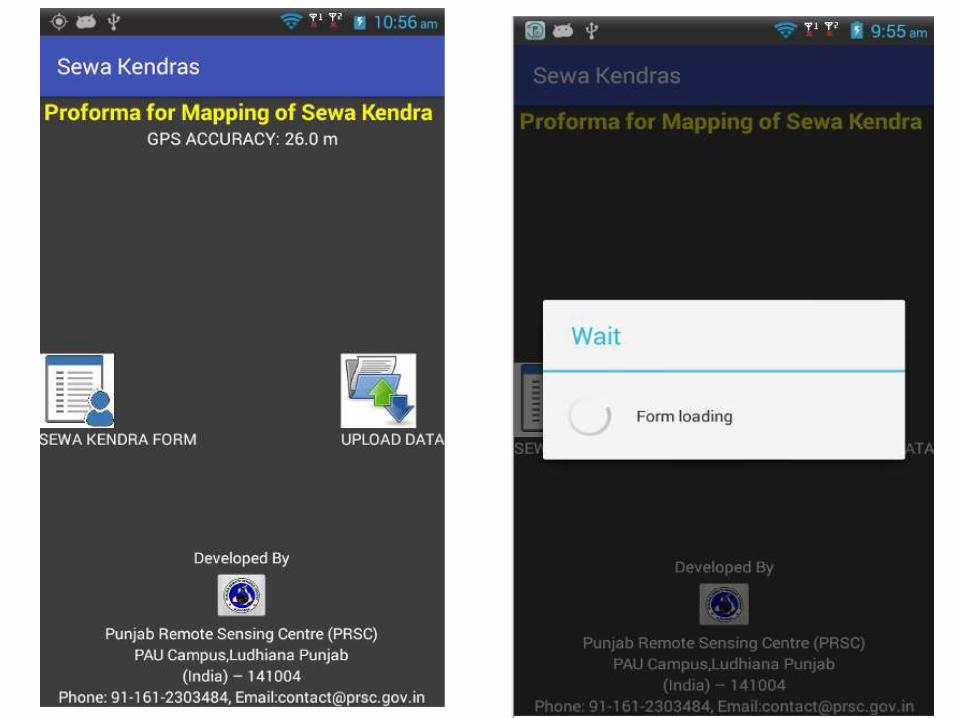
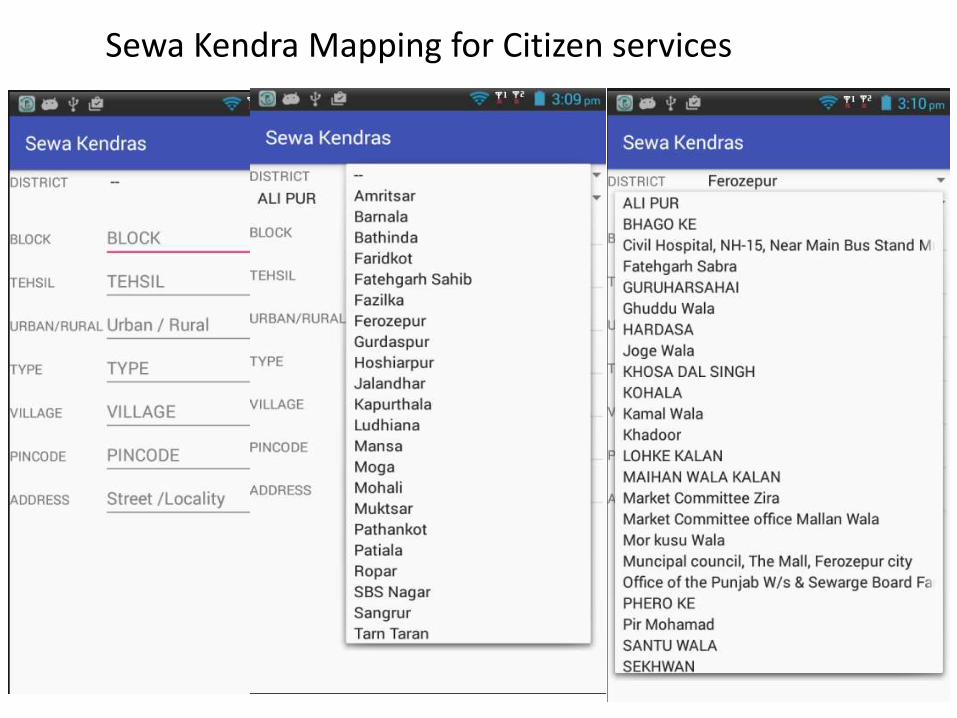
Sewa Kendra Mapping for Citizen services


LATITUDE LONGITUDE
GPS


Health Canters Mapping


Play Button
Enabled
Audio Playing
Stop Enabled

LATITUDE LONGITUDE
GPS


Play Button
Enabled
Audio Playing
Stop Enabled

Location by GPS


HEALTH INSTITUTIONS IN FATEHGARH SAHIB DISTRICT

HEALTH INSTITUTIONS IN SANGRUR DISTRICT


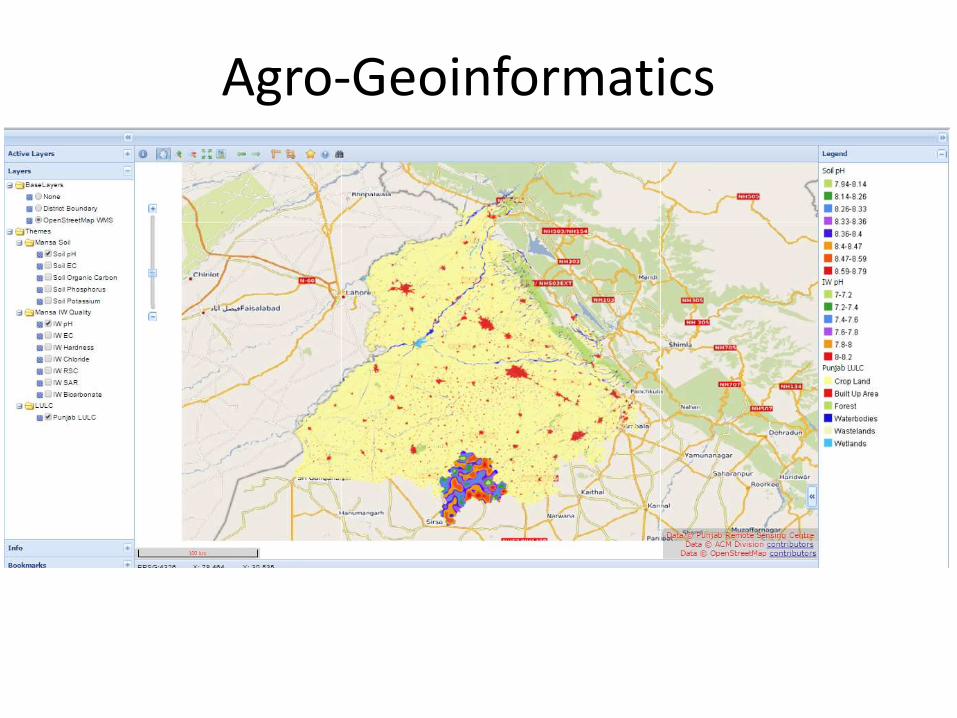
Agro-Geoinformatics


Near Real Time Monitoring of Events & Disasters

Flood Mapping in Punjab
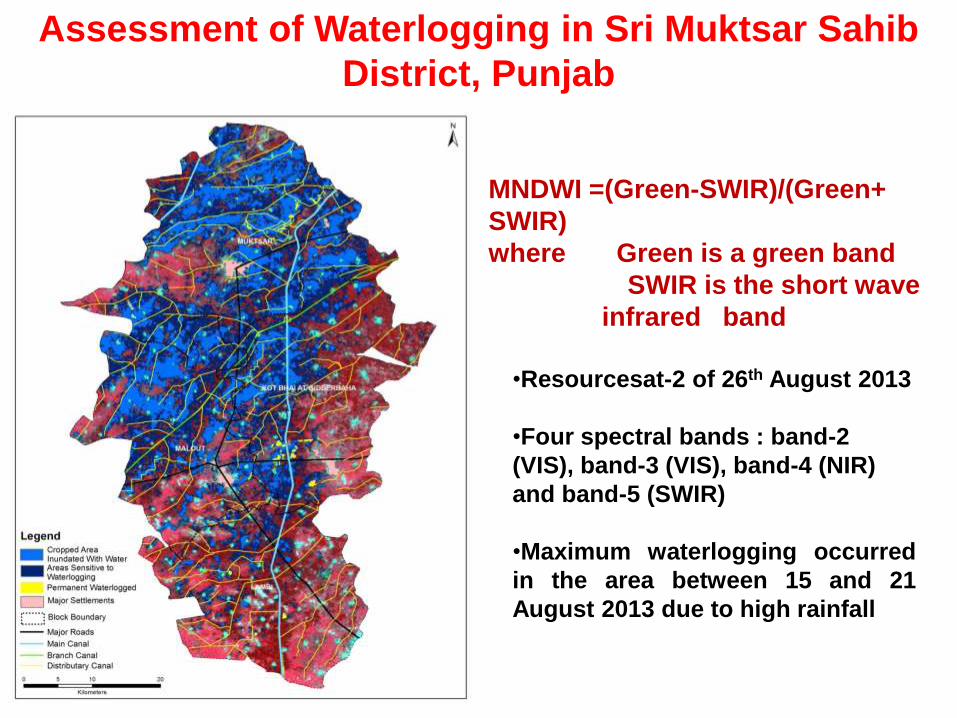
Assessment of Waterlogging in Sri Muktsar Sahib
District, Punjab
MNDWI =(Green-SWIR)/(Green+
SWIR)
where Green is a green band
SWIR is the short wave
infrared band
•Resourcesat-2 of 26th August 2013
•Four spectral bands : band-2
(VIS), band-3 (VIS), band-4 (NIR)
and band-5 (SWIR)
•Maximum waterlogging occurred
in the area between 15 and 21
August 2013 due to high rainfall
Use of Remote Sensing for Studying Carbon Dynamics
1. Identifying land use
C content in forest >> C content in
cropland
2. Prediction of carbon content from
satellite imagery using
(a) fine spatial and spectral resolution data
(b) Hyperspectral data

Spectral reflectance of air
dry soil at various SOC
concentrations.
Relationship between
organic carbon and NDVI
Source : Luo et al (2012), JAL 4: 450-456 Source Stephens et al, Discussion paper

2. Saline Patches
1. Satellite Imagery
3. Field Survey
4. Sampling Sites
5. Soil Analysis
DPM
RPM
IOM
CO2
BIO
HUM
CO2
BIO
HUM
6. Modelling 5. Modification
Organic Carbon Dynamics in Saline Soils - Approach
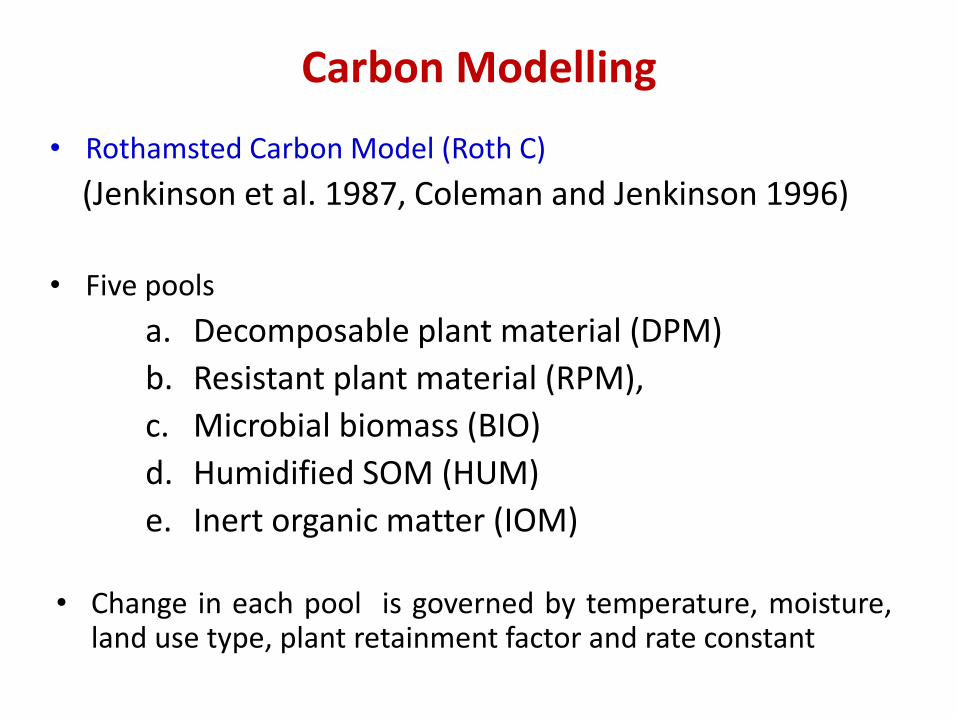
Carbon Modelling
• Rothamsted Carbon Model (Roth C)
(Jenkinson et al. 1987, Coleman and Jenkinson 1996)
• Five pools
a. Decomposable plant material (DPM)
b. Resistant plant material (RPM),
c. Microbial biomass (BIO)
d. Humidified SOM (HUM)
e. Inert organic matter (IOM)
• Change in each pool is governed by temperature, moisture, land use type, plant retainment factor and rate constant
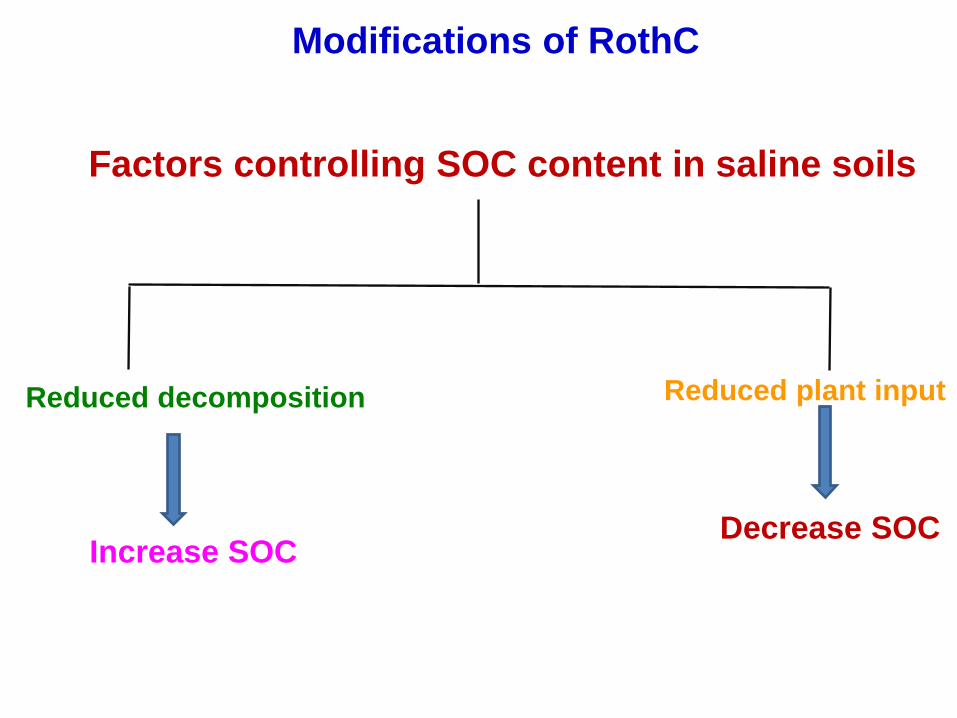
Factors controlling SOC content in saline soils
Reduced decomposition Reduced plant input
Increase SOC Decrease SOC
Modifications of RothC

0.0
10.0
20.0
30.0
40.0
50.0
60.0
70.0
2008 2018 2028 2038 2048 2058 2068 2078 2088 2098SO
C (
t h
a-1
)
Year
Non-saline
Low salinity
Medium salinity
High salinity
0.0
10.0
20.0
30.0
40.0
50.0
60.0
70.0
2008 2018 2028 2038 2048 2058 2068 2078 2088 2098
SO
C (
t h
a-1
)
Year
Non-saline
Low salinity
Projected SOC content of non-saline and saline
soils
Scenario 1 (without
calibration of
model)
• SOC content in non-saline
and saline soils will
decrease under future
climate
Scenario 2 (with
calibration of
model)
• SOC content in non-
saline and saline soils will
decrease under future
climate, but decrease
would be more in saline
soils

NATIONAL CARBON PROJECT – ISRO/DOS
PRSC currently supporting work for Measurement of
Vegetation and Biomass parameters under Vegetation-
Carbon Pool Assessment (VCP)
SUB‐PROJECTS
– Vegetation C Pool Assessment
– Soil C Pool Assessment Assessment
– Soil‐Vegetation Atmosphere C fluxes

Vegetation Carbon Pool
• Assessment of terrestrial vegetation biomass in the country
using ground sampling and satellite remote sensing data
• To generate geospatial data of the terrestrial phytomass
Carbon of India along with estimates of uncertainty
• APPROACH
• Estimate by a combination of f ld ie work, geospatial
mod ll e ing, grid‐wise C density (biomass contribution)
of forests, trees outside outside forest (TOF), crop &
other vegetation vegetation.
• Grid‐wise area under each of land cover category
above for refernce year is obtained by remote sensing.


Floods in Punjab & Haryana (July2010)
14July2010
Pre Flood
09July2010


Classification of satellite imagery of Sri Muktsar
Sahib district using MNDWI
MNDWI =(Green-SWIR)/(Green+ SWIR)
where Green is a green band
SWIR is the short wave
infrared band
•Resourcesat-2 of 26th August 2013
•Four spectral bands : band-2
(VIS), band-3 (VIS), band-4 (NIR)
and band-5 (SWIR)
•Maximum waterlogging occurred
in the area between 15 and 21
August 2013 due to high rainfall
MNDWI- Modified Normalized Difference Water Index

Relationships among waterlogging, elevation and water level recorded from observations wells in Sri Muktsar Sahib district
Elevation from ASTER GDEM

STUDY TO MONITOR BURNING OF PADDY STRAW IN AGRICULTURAL FIELDS

Aqua, 22 Oct, 2015
Active fire points overlaid on MODIS satellite imagery
Active Fire point

Active fire points overlaid on MODIS satellite imagery
Aqua, 23 Oct, 2015 Active Fire point

Note: As these points are captured by MODIS/Terra (10:30 am) and Aqua (1.30 pm) during their
time of pass, the number of fire events may be more than those shown in the map.

Week-wise Fire Events for the Period 15 October to 18 November 2015:

District-wise Total Fire Events for the Period 15 October to 15 November 2015:

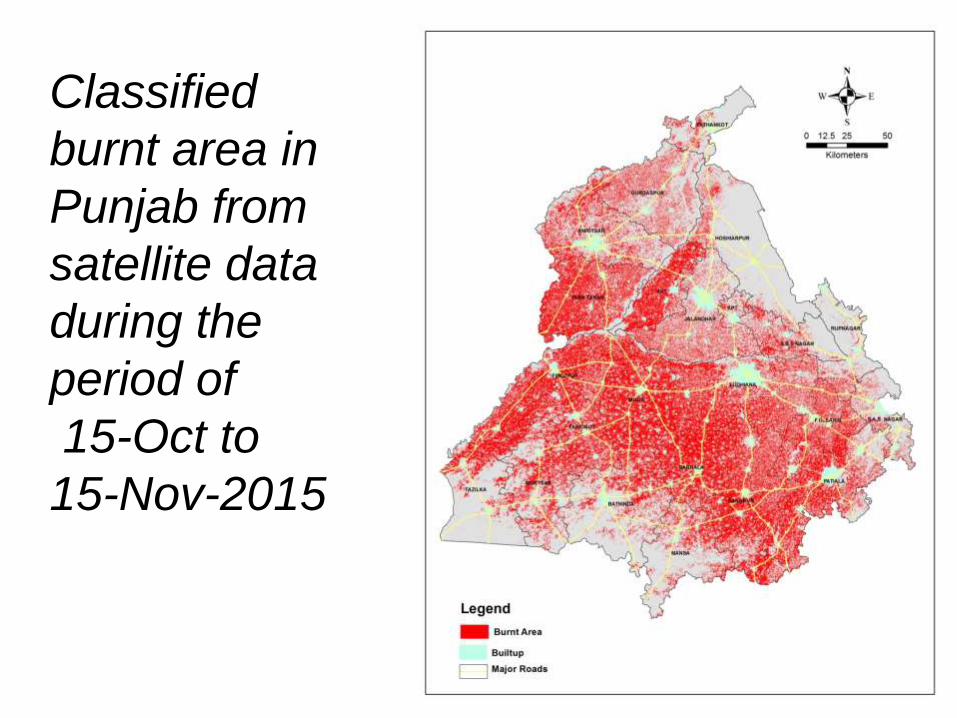
Classified
burnt area in
Punjab from
satellite data
during the
period of
15-Oct to
15-Nov-2015

Identified burnt area in Punjab using IRS R2 AWiFS
data, 18 October 2015

Burning of crop residue may be a regional incident but its
impact is not bound to a specific area, state or country. This
issue is of national concern and all the states should act
together to mitigate the menace

Capacity Building & Data Dissemination Space Based Information Support for Decentralized Planning ( SISDP)

Awareness Workshop Space Based Information Support for Decentralized Planning ( SISDP)
Interaction and Discussion with Villagers at
Pakhowal, 10 December 2015

Awareness Workshop Space Based Information Support for Decentralized Planning ( SISDP)
Demonstration and Awareness to students
at Pakhowal, 10 December 2015
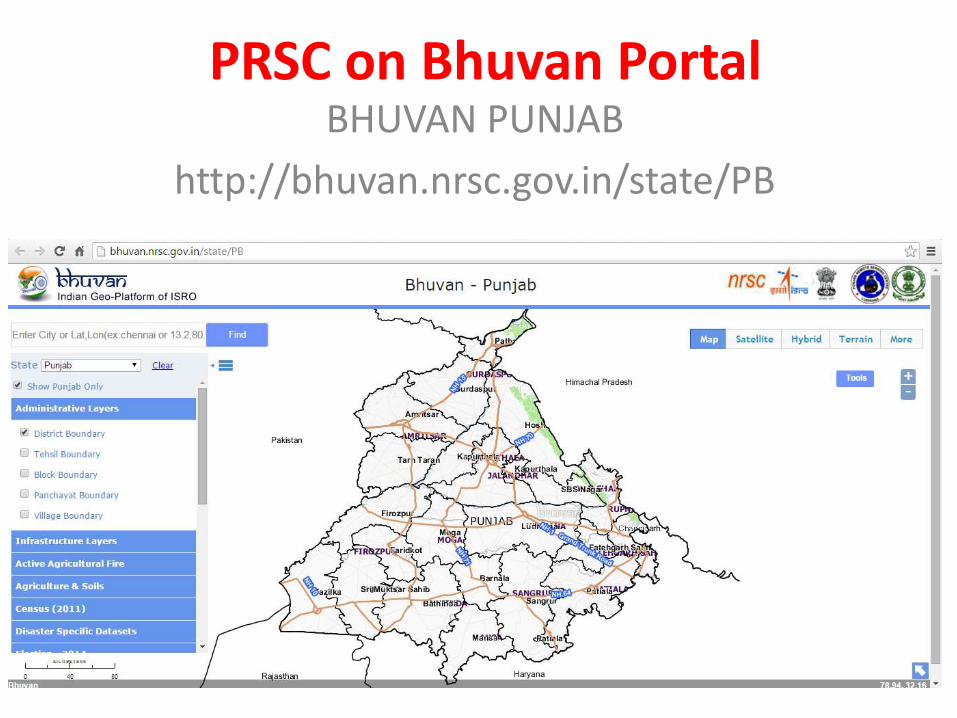
PRSC on Bhuvan Portal BHUVAN PUNJAB
http://bhuvan.nrsc.gov.in/state/PB


PUBLIC HEALTH & GROUND WATER GIS

Public Health & Ground Water GIS
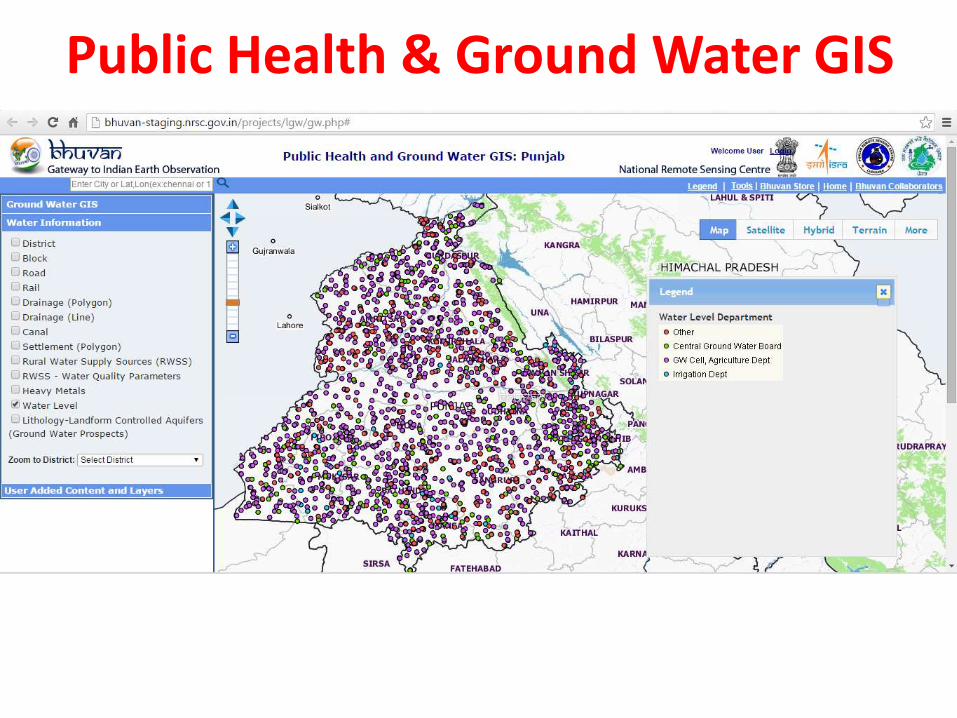
Public Health & Ground Water GIS

Tourism WebGIS : Amritsar

Municipal GIS : Ludhiana

TANGIBLE BENEFITS
Accurate and Scientific assessment of spatio-temporal
conditions
Economics of Govt. and stake holders–analyzing key
concerns
Highlighting key areas of Technological innovations
Timely flow of information to stake holders
Periodic assessment of outcomes
Scaling-up of right approaches
Bring consistency and improvement in the system

DISCUSSION

www.prsc.gov.in
Email :[email protected]
Tel: 01612303484 , Fax : 01612303484
https://www.facebook.com/Punjab-Remote-Sensing-Centre-
Ludhiana-1549030372045452/?ref=hl