ge wind study update - electric reliability council …ge wind study update 1 august 16, 2013...
TRANSCRIPT

T h e E l e c t r i c R e l i a b i l i t y
C o u n c i l o f T e x a s
O p e r a t i o n s A n a l y s i s D e p t .
M a n a g e r : B i l l B l e v i n s
S u p e r v i s o r : S a n d i p S h a r m a
A u g u s t 1 6 , 2 0 1 3
JenniferHowardThis study re‐evaluates the 2008 GE Study titled
“Analysis of Wind Generation Impact on ERCOT
Ancillary Services Requirements” using ERCOT historical
data from 2008‐2012.
GEWindStudyUpdate

G E W i n d S t u d y U p d a t e
1
August 16, 2
013
Background
Many events on the grid are inherently stochastic, such as those driven by renewable energy and load.
As we cannot control when the wind will blow, the sun will shine, or exactly when people will turn on
their home heaters, power systems rely on sophisticated forecasts to determine what will be needed to
balance generation and load. Then they dispatch generation resources on a short time scale to address
the predicted load. However, additional services are necessary to compensate for any generation‐load
imbalance caused by an imperfect forecast.
Called ancillary services, these services are defined by FERC as "those services necessary to support the
transmission of electric power from seller to purchaser given the obligations of control areas and
transmitting utilities within those control areas to maintain reliable operations of the interconnected
transmission system." They support the frequency response of the system, the ability of the electric grid
to react upon an unexpected change in frequency. Since many grid events are stochastic in nature and
difficult to predict (load variability, forced outages, renewables variability), ancillary services on the time
scales of seconds to thirty minutes are essential for grid reliability.
In the ERCOT system, the operator runs Security‐Constrained Economic Dispatch (SCED) on a five‐minute
basis to dispatch online generation resources based on forecasts of renewable generation and load, and
an economic and reliability optimization. Then, the operator calls upon Ancillary Services to
compensate for the differences between the SCED output (called Base Points) and the system load [1].
ERCOT uses three categories of ancillary services. [2]
Regulation Service (also known as +REG and –REG) is used to compensate for ERCOT system
frequency deviations due to forecast uncertainty in expected generation and load. It operates
on the order of seconds.
Responsive Reserve is used to restore ERCOT system frequency in the event that a major event
occurs on the grid and significantly affects system frequency. The minimum requirement for
this service is 2800 MW and resources must be online around 5 minutes.
Non‐Spinning Reserve Service consists of generators that must ramp to the desired amount in
thirty minutes, and maintain for at least one hour. This service is used when reserve is depleted
or when there is a limited amount of capacity available in SCED.
Together, these ancillary services maintain a balance between generation and load and maintain system
frequency.
Increasing wind penetration in the ERCOT system will have a profound effect on ancillary services. The
inherent increased variability of wind will lead to additional regulation service requirements. The fact
that wind tends to be higher during off‐peak hours and may significantly ramp up or down may lead to
an increase in Non‐Spinning Reserve Service, as generation units may not be capable of fulfilling the
absence/extra presence of the wind as quickly as the wind unit ramps.

G E W i n d S t u d y U p d a t e
2
August 16, 2
013
Before deploying ancillary services, it is necessary to first determine how much will be needed and then
procure them ahead of time. Regulation Service and Non‐Spin reserve capacity requirements are
determined historically each month. The basis for the calculation is historical deployment in the same
month in the preceding year and the preceding month in the same year.
In particular, the Regulation Service requirements have an additional input: tables developed by GE in
2008 to quantify the additional regulation requirements due to increasing wind capacity. The direct
impact of these tables can be seen in Figure 1 below.
Figure 1: Regulation Service Requirements from the ERCOT Methodology for Determining Ancillary Services
Together, these calculations determine ERCOT’s regulation service requirements on a monthly basis.
1.StudyMotivation
Because the results of the 2008 GE Wind study are significant inputs to the Regulation Service section of
the ERCOT Methodology for Determining Ancillary Services, it is important to ensure that the
recommendations of the study are still relevant to today’s system.
Main differences between the GE study system and today’s ERCOT system include:
Transition to Nodal: ERCOT has changed its operation significantly between 2008 and today,
most notably by introducing a five‐minute SCED dispatch cycle (as opposed to the fifteen‐minute
SCED used in Zonal).
Different generation mix / shale gas revolution: There is a boom in natural gas units due to the
low price of natural gas. Such units are capable of faster response than conventional
generation.

G E W i n d S t u d y U p d a t e
3
August 16, 2
013
New requirements/ technology for wind farms: In 2009, wind farms were required to limit
their ramp rates to 10% per minute of its nameplate rating (MWs). In 2012, this requirement
was modified to 20% per minute of nameplate rating to make wind farms dispatchable in SCED.
More installed wind: As seen in the table, there was only 2,875 MW of generation available in
2006, the year that GE used for its study. As a result, most of the data used in the GE study was
generated by AWS Truewind using meso‐scale numerical models.
Wind has been steadily increasing in the ERCOT
system, and it is planned to have over 15,000 MW
of installed wind capacity by 2016. Therefore it is
important to determine the effects of wind on
ancillary services and adjust regulation
requirements as necessary. Today in 2013 there is
10,570 MW of installed wind, meaning there is
now a wealth of historical data available for study.
This report will re‐evaluate the results of the 2008
GE study using ERCOT historical data and test that
its recommendations are still relevant for today’s
system. Since this report focuses on the impacts of
wind due to typical increase in variability, the main impact will be on Regulation Service procurement.
Main conclusions
The model of additional regulation service requirements with increasing wind penetration
presented by GE is consistent with the model illustrated by historical ERCOT data on a high level
Specific recommendations are slightly different due to the lack of wind data available when the
GE study was performed
Although additional regulation is necessary with increasing wind penetration, the main driver is
still load variance rather than wind variance.
2.ExistingWork:GEMethodology
The goal of the GE Study was to qualitatively assess the impact of wind integration on the levels of
required ancillary services. They used time‐series wind and load modeling and statistical analysis to
assess the amount of required ancillary services with increasing installed wind capacity. The wind
scenarios under study ranged from 5,000 MW to 15,000 MW.
2.1DefinitionofNetLoadGE then defined the net load, the “the aggregate customer load demand minus the aggregate wind
generation output.” This is justified by the fact that both wind and load are cyclical, non‐dispatchable,
difficult to perfectly predict, and are mutually dependent on weather conditions. This mutual
Figure 2: Planned ERCOT Wind Installations as of April 2013

G E W i n d S t u d y U p d a t e
4
August 16, 2
013
dependence indicates that the variability of wind and load cannot be calculated separately and
combined; it must be analyzed from the combined data. By studying the variability of net load, the
study creates a measure of the regulation requirements that arise from unpredictable or imperfectly
predicted events.
2.2GEStudyDataThe GE team obtained minute‐by‐minute load data from ERCOT and subcontracted AWS Truewind to
provide the wind data. Minute‐by‐minute load data for 2005‐2006 was supplied from ERCOT.
For the wind data, AWS used a meso‐scale numerical weather model, historic wind recordings from
2005‐2006 and typical wind turbine‐generator performance curves to develop their hourly data. For
minute‐to‐minute data, AWS received two years of one‐minute plant output for 16 ERCOT substations
serving five wind projects. AWS synthesized this data by sampling four‐hour windows of historical one‐
minute data, removing the one‐hour trends, removing extreme events (the tails of the distribution) and
adding the residuals to the simulated hourly output. The wind data was organized into the twenty‐four
CREZ zones in the below figure.
To create the different scenarios, GE increased the number of wind farms that were considered in the
dataset for each CREZ zone. There were four scenarios: 5000 MW, 10000 MW including Panhandle
wind, 10000 MW including coastal wind, and 15000 MW including coastal wind. The GE Study did not
consider transmission constraints or geographic diversity, and did not use wind forecasts.
This “layering” of wind farm data and CREZ zones allowed for the flexible creation of scenarios with
incrementally increasing wind while keeping all other factors constant.
Figure 3: Wind Capacity Allocation from the 2008 GE Study

G E W i n d S t u d y U p d a t e
5
August 16, 2
013
2.3GERegulationRequirementsNext, GE assumed a five minute dispatch with full resources available to SCED. Under this approach, the
regulation requirements are calculated as the minute‐by‐minute deviation of the net load from the SCED
base point. It assumes that SCED has all available
capacity and does not use forecast information.
Using this measure for regulation requirements, the GE
performed a statistical analysis on the regulation
requirements for each wind scenario. The 98th percentile
of maximum regulation over 5 minutes was calculated for
each hour‐of‐day in the year, followed by a weighted
average across the twelve months of the year. This
approach effectively considers the typical effects of wind
variability in the ERCOT system due to a steady increase
in installed wind capacity. Extreme wind events are not
considered in this analysis, as they would be handled
through forecast rather than a constant addition of
regulation reserve by year.
The main result of the GE study was that the effects of adding wind capacity result in a nearly perfectly
linear increase in regulation requirements, as seen in the table below.
Figure 5: Linear Trends for Regulation Requirements from the 2008 GE Study
This creates a simple model for calculating the effects of increasing wind penetration on regulation
reserves; the incremental increase of regulation requirements due to wind is simply the slope of each of
the hour‐of‐day plot lines.
Figure 4: Illustration of Regulation from the 2008 GE Study

G E W i n d S t u d y U p d a t e
6
August 16, 2
013
These slopes, calculated for each month and time‐of‐day of the year, create the tables that are a direct
input to the ERCOT Methodology for Determining Ancillary Services. These are found in Appendix F of
the GE report, and are henceforth referred to as the “GE Tables.”
3.ERCOTStudyMethodology
This analysis completes the GE study by checking its recommendations against five years of ERCOT
historical wind and load data instead of modeled data. The following section presents results from using
ERCOT 2012 data alone, and the following section shows the analysis of multi‐year data from ERCOT
2008 to ERCOT 2012.
3.1ERCOT2012DataFirst, individual wind scenarios for 5000 MW, 6000 MW, 7000 MW, 8000 MW, 9000 MW, and 10000
MW of wind generation were created by incrementally adding ERCOT 2012 wind plant data. Wind farms
that came online together in the year were same wind scenario to avoid introducing artifacts into the
data. And, only wind farms that were operation for the duration of the study were included to isolate
the effect of additional wind capacity, all other factors being equal (wind farms that came online in the
middle of 2012 were excluded). This ensures that yearly changes in load and sub‐yearly changes in wind
generation will not skew the results of the analysis.
Figure 6: Appendix F of the 2008 GE Study containing the "GE Tables"
G E W i n d S t u d y U p d a t e
7
August 16, 2
013
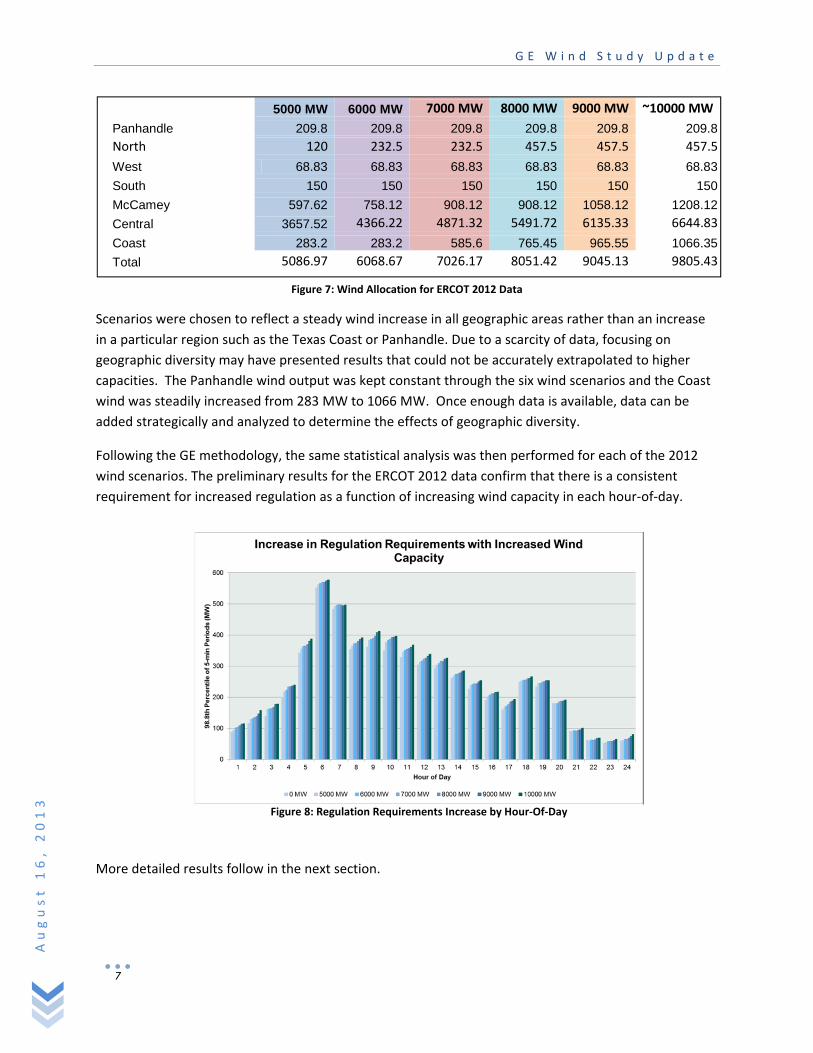
Figure 7: Wind Allocation for ERCOT 2012 Data
Scenarios were chosen to reflect a steady wind increase in all geographic areas rather than an increase
in a particular region such as the Texas Coast or Panhandle. Due to a scarcity of data, focusing on
geographic diversity may have presented results that could not be accurately extrapolated to higher
capacities. The Panhandle wind output was kept constant through the six wind scenarios and the Coast
wind was steadily increased from 283 MW to 1066 MW. Once enough data is available, data can be
added strategically and analyzed to determine the effects of geographic diversity.
Following the GE methodology, the same statistical analysis was then performed for each of the 2012
wind scenarios. The preliminary results for the ERCOT 2012 data confirm that there is a consistent
requirement for increased regulation as a function of increasing wind capacity in each hour‐of‐day.
More detailed results follow in the next section.
5000 MW 6000 MW 7000 MW 8000 MW 9000 MW ~10000 MW
Panhandle 209.8 209.8 209.8 209.8 209.8 209.8
North 120 232.5 232.5 457.5 457.5 457.5
West 68.83 68.83 68.83 68.83 68.83 68.83
South 150 150 150 150 150 150
McCamey 597.62 758.12 908.12 908.12 1058.12 1208.12
Central 3657.52 4366.22 4871.32 5491.72 6135.33 6644.83
Coast 283.2 283.2 585.6 765.45 965.55 1066.35
Total 5086.97 6068.67 7026.17 8051.42 9045.13 9805.43
Figure 8: Regulation Requirements Increase by Hour‐Of‐Day

G E W i n d S t u d y U p d a t e
8
August 16, 2
013
3.1.1.ERCOT2012ComparisontoGETwo plots are shown to demonstrate the results; an averaged, high level metric of the 98.8th percentile
by wind capacity and the 98.8th percentile as considered by time‐of‐day.
First, high‐level results and their trendlines show that the ERCOT 2012 data matches the GE predicted
results very closely:
Figure 9: Comparison of GE and ERCOT 2012 High‐Level Results
The closeness of the ERCOT data to the GE data indicates that the linear approximation is consistent
with actual ERCOT historical data and high‐level results of their study were correct as compared to
actual historical data.
The slopes of the lines are critically important to the implications of the study. The following figure
shows the results of the GE study with a superimposed triangle to demonstrate the effects of slope on
the figure.
Figure 10: Illustration of the Impact of Slope on Results

G E W i n d S t u d y U p d a t e
9
August 16, 2
013
The horizontal bottom of the triangle represents the level of regulation reserves that are necessary to
satisfy the load alone. As wind capacity is increased, the amount of regulation reserves requirement
due to wind alone is represented by the height of the triangle at that point, or the green arrow.
Therefore, a lower slope indicates a lesser need for ancillary services due to wind, and a higher slope
indicates a greater need for ancillary services due to wind.
The following figure shows the results of the ERCOT 2012 results superimposed on top of the GE results.
It can be seen that the assumption of a linear model is reasonable, but the slopes are slightly different.
Figure 11: Comparison of GE and ERCOT 2012 Results
Figure 12: Detailed View of GE and ERCOT 2012 Compared Results
A closer inspection reveals that the slopes of the ERCOT 2012 data are consistently lower than the
slopes of the GE results. This suggests that if we follow the results of the GE study, we are procuring
more regulation than we need.

G E W i n d S t u d y U p d a t e
10
August 16, 2
013
3.1.2.ERCOT2012VersionoftheGETablesThe GE tables represent the incremental increase in regulation that is required for each 1000 MW of
additional wind capacity. Essentially, this represents the slope of the lines in earlier figures. This section
presents the equivalent of the GE tables, but calculated using historical ERCOT data.
These tables can be visualized using a contour map for easier identification of differing patterns; the GE
study table for +Reg and the results of the 2012 data for +Reg are compared below. The red color
represents a value of 12 MW, and the blue color represents 0 MW. The axes follow the same
convention as the GE Tables; the vertical axis lists the months of the year from January to December,
and the horizontal axis lists the hours‐of‐day from 0 to 24. This map represents a “snapshot”
visualization of both the diurnal and seasonal trends for regulation reserve requirements.
Figure 13: Comparison of GE and ERCOT 2012 verison of "GE Table"
As expected from the earlier results, it can be seen that there are fewer red and yellow “heat” spots for
the ERCOT 2012 results than the GE study results. This finding emphasizes that the slopes of the lines
are lower (i.e. have smaller numerical values) for the ERCOT 2012 data than for the GE study data.
Overall, the results suggest that due to the lack of wind data in 2007 for the GE study, the GE tables
predict a higher‐than‐necessary requirement for ancillary services due to increased variability resulting
from an increase in wind generation.

G E W i n d S t u d y U p d a t e
11
August 16, 2
013
3.2ERCOT2008‐2012DataNext, ERCOT year‐by‐year aggregate data from 2008 to 2012 was used to perform the same statistical
analysis. By using multiple years of data, the results introduce some “real‐life” effects such as annual
load changes, the addition of new wind generation every few months, and differing annual weather
conditions back into the study. This results in much more variation as compared with the ERCOT 2012
data.
Figure 14: ERCOT 2008‐2012 High Level Comparison
From looking at this plot, it is clear that the “real‐world” effects have significant impact on this high‐level
metric. The year 2011 is a clear outlier as it required much more regulation than other years; a clear
reason for this is the “once‐in‐a‐hundred‐years” extreme weather patterns (including wind) and
resulting operations decisions (load shedding, curtailment) experienced that year. The years 2008, 2010
and 2012 were average years, and the year 2009 was a better‐than‐average year for ancillary service
requirements.
The blue GE plot line demonstrates that with additional wind capacity, regulation requirements steadily
increase. The red ERCOT 2008‐2012 plot line shows that if wind capacity increases and weather or
generation fluctuate as well, there will be slightly more or less regulation required.
This finding highlights the difficulty in choosing a particular year or timeframe to form the basis of the
ancillary services requirements. A conservative metric based on data from 2011 will help ERCOT
maintain reliability through all record‐setting years, but will be economically inefficient and result in
higher cost. On the other hand, a less conservative metric based on 2009 will be very economically
efficient, but may endanger system reliability during extreme years.

G E W i n d S t u d y U p d a t e
12
August 16, 2
013
3.2.1.ERCOT2012ComparisontoGEAs a continuation of the multi‐year analysis, the equivalents of the GE Tables are calculated using ERCOT
2008‐2012 data and shown below:
Figure 15: ERCOT 2008‐2009 Version of the GE Table
There is not a clear pattern from year to year due to the inherent variability of each year (different load,
generation, weather). And, the different patterns show that any one plot will reflect the particular and
unique events of that one year, not the constant trend that we should be following. Therefore, choosing
a single year to base the new GE tables is not recommended.

G E W i n d S t u d y U p d a t e
13
August 16, 2
013
ConclusionandRecommendationA recommendation for updating the GE table is to use a table that uses an input of multiple years of
data. The following is a table based on the median of five years of ERCOT. This gives the Methodology
for Determining Ancillary Services a historically‐based measure for increasing regulation reserves due to
increased penetration of wind, while simultaneous minimizing the unique quirks of the preceding year.
Figure 16: Contour Map of Recommended Replacement for GE Table
Incremental MW Adjustment to Prior‐Year Up‐Regulation 98.8th Percentile Values per 1,000 MW
Incremental Wind Generation Capacity
Incremental MW Adjustment to Prior‐Year Down‐Regulation 98.8th Percentile Values per 1,000 MW
Incremental Wind Generation Capacity
1 3 5 7 9 11 13 15 17 19 21 23
Nov
Sep
Jul
May
Mar
Jan
0
2
4
6
8
10
12
1 2 3 4 5 6 7 8 9 10 11 12 13 14 15 16 17 18 19 20 21 22 23 24
Jan 4.1 3.9 6.1 2.8 4.4 2.3 2.8 3.1 1.3 7.5 4.7 5.5 4.3 2.5 5.1 4.1 3.2 ‐1.0 ‐2.0 2.5 0.7 2.1 1.8 1.4
Feb 3.8 6.9 3.0 7.4 4.5 3.6 0.7 2.4 5.0 4.1 3.5 3.4 0.6 3.9 4.0 2.4 4.8 3.7 3.9 ‐0.8 2.5 5.3 2.0 5.3
Mar 1.9 2.3 2.9 2.2 4.0 7.0 1.5 5.0 5.1 10.2 5.6 3.7 4.8 6.6 4.1 4.7 6.8 8.5 6.5 3.6 5.4 4.2 8.8 2.2
Apr 5.6 5.5 4.9 6.1 7.3 2.2 4.5 8.2 6.2 8.2 6.8 4.2 3.4 2.2 1.8 1.5 2.2 7.6 3.2 1.8 3.8 5.8 4.6 5.0
May 4.9 7.1 5.2 6.9 2.7 2.2 4.6 5.2 2.7 8.2 3.7 4.0 3.5 4.6 6.1 2.3 2.1 5.0 8.5 3.7 1.5 0.1 2.1 4.7
Jun 3.1 8.8 4.7 7.0 8.9 3.1 5.2 3.0 5.7 5.9 3.2 3.3 3.9 1.2 1.8 3.0 0.6 ‐0.1 3.3 1.3 1.9 1.9 1.2 5.0
Jul 2.1 1.2 3.5 2.7 1.9 3.0 3.9 3.0 2.3 6.3 3.1 1.8 0.9 0.7 1.2 1.7 1.2 1.5 1.5 2.7 0.5 ‐1.1 ‐0.1 0.6
Aug 1.6 1.4 1.8 2.0 1.2 1.1 4.6 3.7 4.3 3.1 3.9 3.1 ‐0.8 0.6 1.1 3.1 ‐0.4 0.2 2.1 1.5 ‐0.2 ‐0.1 ‐0.2 1.3
Sept 1.2 1.5 1.2 1.7 2.2 2.6 3.2 4.9 2.2 2.3 2.1 1.7 3.8 1.8 1.5 2.0 2.1 0.6 2.2 1.7 ‐0.2 0.2 0.6 1.2
Oct 2.0 3.1 2.8 2.9 3.8 2.6 2.8 4.8 7.3 2.6 6.2 5.5 2.2 4.1 ‐1.0 1.0 2.8 1.2 ‐1.3 1.2 2.9 1.6 2.2 2.5
Nov 0.4 2.6 2.9 5.3 4.1 3.5 2.2 4.6 3.7 3.1 5.9 2.7 3.6 2.7 2.6 3.7 5.6 0.2 2.8 0.6 2.6 1.2 3.0 0.5
Dec 5.4 5.4 3.3 5.3 3.4 4.0 1.9 4.2 4.5 3.8 6.1 5.3 3.8 5.1 4.0 3.1 6.2 ‐0.4 ‐0.1 3.7 4.0 3.1 3.4 3.9
1 2 3 4 5 6 7 8 9 10 11 12 13 14 15 16 17 18 19 20 21 22 23 24
Jan ‐3.1 ‐1.4 ‐1.4 ‐1.7 ‐4.1 ‐0.7 ‐0.9 ‐0.2 1.5 ‐0.2 ‐1.8 ‐0.5 ‐3.4 ‐5.7 ‐1.1 ‐1.6 ‐0.5 0.8 ‐7.8 ‐5.2 ‐5.8 ‐4.7 ‐3.7 ‐4.0
Feb ‐5.2 ‐1.5 ‐1.2 ‐2.8 ‐3.1 ‐1.4 ‐0.7 ‐0.7 ‐1.8 ‐3.2 0.2 ‐1.5 ‐1.8 ‐2.3 ‐0.7 ‐1.7 ‐2.3 ‐0.7 ‐6.0 ‐5.9 ‐3.7 ‐3.7 ‐9.2 ‐4.1
Mar ‐6.6 ‐1.7 ‐2.6 ‐5.7 ‐2.4 ‐1.4 ‐0.8 ‐1.8 ‐0.9 ‐5.9 ‐3.5 ‐6.0 ‐3.8 ‐3.6 ‐4.1 ‐3.3 ‐4.4 ‐7.1 ‐2.5 ‐8.7 ‐5.6 ‐2.9 ‐8.7 ‐3.4
Apr ‐5.4 ‐6.3 ‐5.9 ‐1.5 ‐1.0 ‐1.5 ‐7.1 ‐0.2 ‐5.4 ‐6.1 ‐4.2 ‐2.8 ‐5.6 ‐6.4 ‐3.6 ‐4.2 ‐4.3 ‐6.4 ‐3.6 ‐8.1 ‐7.8 ‐6.3 ‐4.7 ‐3.7
May ‐3.7 ‐1.5 ‐2.0 ‐3.5 ‐3.3 ‐3.8 ‐1.9 ‐2.7 ‐3.3 ‐1.4 ‐2.0 ‐1.2 ‐4.4 ‐4.8 ‐2.5 ‐4.6 ‐4.9 ‐5.5 ‐3.6 ‐4.5 ‐8.6 ‐9.5 ‐4.5 ‐6.3
Jun ‐3.8 ‐5.6 ‐3.6 ‐1.5 ‐0.5 ‐0.1 0.2 ‐3.5 ‐1.3 ‐0.6 ‐1.5 ‐0.1 ‐0.2 ‐3.6 ‐3.6 ‐3.4 ‐5.2 ‐9.1 ‐5.6 ‐4.1 ‐6.8 ‐7.1 ‐6.6 ‐4.9
Jul ‐4.2 ‐3.4 1.1 0.2 1.1 1.1 0.9 ‐0.6 0.0 ‐0.4 ‐0.4 ‐1.6 ‐2.0 ‐1.4 ‐2.1 ‐5.4 ‐4.4 ‐4.8 ‐1.5 ‐2.4 ‐5.8 ‐5.9 ‐5.6 ‐4.3
Aug ‐1.5 ‐0.6 ‐0.5 0.0 1.5 0.7 0.4 0.1 0 0.1 0.1 0.0 ‐0.9 ‐2.4 ‐4.1 ‐2.2 ‐2.8 ‐4.3 ‐4.7 ‐2.7 ‐5.0 ‐3.4 ‐6.0 ‐6.6
Sept 0.0 ‐1.8 ‐0.9 ‐1.0 ‐0.2 ‐1.3 ‐1.2 0.5 ‐0.4 ‐1.1 1.1 ‐0.2 ‐1.1 0.4 ‐3.3 ‐3.2 ‐2.7 ‐3.1 ‐0.8 ‐5.2 ‐7.6 ‐5.1 ‐4.3 ‐3.5
Oct ‐1.5 ‐1.0 ‐1.8 ‐0.7 ‐0.1 ‐1.7 0.6 ‐0.36 ‐0.7 ‐2.3 ‐0.5 ‐0.6 ‐0.4 ‐0.3 ‐0.4 ‐2.0 ‐1.6 1.1 ‐9.3 ‐7.3 ‐3.8 ‐4.4 ‐3.1 ‐3.4
Nov ‐2.6 ‐3.8 ‐2.4 0.0 ‐1.5 ‐2.6 ‐2.5 ‐1.3 0.2 ‐1.0 ‐1.8 ‐1.2 ‐2.4 ‐1.1 ‐1.3 ‐0.1 ‐1.1 0.7 ‐8.2 ‐5.2 ‐3.5 ‐8.1 ‐3.7 ‐5.8
Dec ‐6.8 ‐4.7 ‐3.8 ‐4.2 ‐3.1 ‐0.5 ‐4.0 ‐0.6 4.3 1.0 ‐6.7 ‐1.7 ‐1.6 ‐2.8 ‐3.6 ‐1.3 ‐0.6 1.3 ‐5.0 ‐6.0 ‐5.7 ‐3.4 ‐5.2 ‐3.3

G E W i n d S t u d y U p d a t e
14
August 16, 2
013
AppendixSimilar contour plots can be made for regulation including wind and load. If you take those plots and
turn them clockwise, an extremely clear annual pattern becomes evident.
Figure 17: Annual Trends for Regulation Requirements
It is interesting to note that there is a clear pattern from year‐to‐year, even during the “once‐in‐a‐million
years” event. This plot indicates that at this point, the regulation requirements for ERCOT are driven by
load, not wind.
WorksCited
[1] "ERCOT Nodal Protcols: Section 6: Adjustment Period and Real‐Time Operations," June 2013. [Online].
Available: http://www.ercot.com/content/mktrules/nprotocols/current/06‐061313_Nodal.doc.
[2] "ERCOT Methodologies for Determining Ancillary Service Requirements," 2013.
[3] A. W. E. A. (AWEA), "AWEA U.S. Wind Industry Second Quarter 2013 Market Report," 30 July 2013. [Online].
Available: http://awea.files.cms‐
plus.com/FileDownloads/pdfs/AWEA2Q2013WindEnergyIndustryMarketReport_Executive%20Summary.pdf.
[Accessed 5 August 2013].
[4] M. A. C. Photos, "Creative Commons," [Online]. Available:
http://www.flickr.com/photos/48509939@N07/8060153200/sizes/l/in/photolist‐dhfoJC‐8fKNfX‐e2JkXm‐
boChZR‐d63bwQ‐bzVUat‐9JuEzq‐bCYHRZ‐8UEyyD‐7UsgJZ‐8vJgpP‐8M8n86‐aqygqv‐9vxgdF‐ahtHqc‐dhntGM‐
dhnuLo‐dow61i‐andD9g‐angscs‐angrWA‐angs4J‐dbFV6s‐cvEGLQ‐apa9yn‐9WWxFi. [Accessed July 2013].
(Front page graphic)