ged science focus sheet: lesson 5 - pwcstv.compwcstv.com/pdf/ged/science_lesson_5.pdf · lesson 5:...
TRANSCRIPT
CLN Televised CoursesGED Preparation/ScienceNina Beegle, Instructor
GED ScienceFocus Sheet: Lesson 5
FOCUS: • Earth Science: Weather and Climate• Seasons of the Earth• Weather and meteorology
ISSUES/ACTIVITIES: • Vocabulary• Visit with meteorologists at the US Weather
Service• Seasons demonstration• Science in the Kitchen: making rain• Rain shadow effect, deserts
MATERIALS: • El Nino – Vocabulary / Worksheet• Earth Science in the Kitchen: Making Rain• Weather Systems, Weather and Forecasts
worksheets
TEXTS: • Contemporary’s GED Science: Earth’s Seasons, pp. 356-357 Earth’s Weather, pp. 353-355 Analyzing Science Material, pp. 67-94
• Steck-Vaughn’s GED Science: Weather and Climate, pp. 126-135
SKILLS AND STANDARDS:• SCANS
Workplace CompetenciesInformation: C5, C7
Foundation Skills:Basic Skills: F1-F6Thinking Skills: F7, F12
• CASAS Community Resources
2.3.3 interpret information aboutweather conditions
CLN Televised CoursesGED ScienceNina Beegle, Instructor
GED ScienceAssignment Sheet: Lesson 5
ASSIGNMENT DATE DU E DONE SCORE COMMENTS
TEXTBOOKS:CONTEMPORARY’S GED SCIENCE:• Earth’s Seasons, pp. 356-357
• Earth’s Weather, pp. 353-355
• Analyzing Science Material, pp. 67-94
STECK-VAUGHN’S GED SCIENCE:
• Weather and Climate, pp. 126-135
WORKSHEETS:
• El Nino – Vocabulary / Worksheet
• Weather Systems, Weather andForecasts worksheet
• Earth Science in the Kitchen Activities(Rain in a Jar, Stalactites & Stalagmitesand What causes Deltas)
RATINGS1. I felt confident doing this assignment.2. I was able to do the assignment, but it took a long time.3. This assignment was very challenging to me4. I need more explanation/practice in this area5. I never want to do this again.
CLN Televised CoursesGED ScienceNina Beegle, Instructor
GED ScienceLesson 5: El Nino - Vocabulary / Worksheet
A. Match the following words with the correct definitions:
La Nina a) Originally referred to warmer thannormal sea temperatures in thePacific Ocean off the coast of SouthAmerica.
El Nino b) A sea-saw shift in surface air pressurebetween Australia and Tahiti. If theair pressure is high in Australia then itis low in Tahiti, and vice-versa.
ENSO c) “Cold event” where the waters of thePacific are colder than normal thatfrequently follows a “warm event.”
Jet Stream d) Imaginary line dividing warm wateron the surface of the ocean from thecold water below.
Southern Oscillation e) Winds traveling over 57 mph at highaltitudes above the earth.
Thermocline f) Any consistent system of prevailingwinds that blow at low altitudesacross the surface of the earth.
Tradewinds g) Scientists use this term to refer to awarm climatic event that happensevery 2-8 years.
1. In the narrowest sense, an El Nino is a giant pool of warm water 1 1/2 times
the size of the United States. Because the water is so warm, there arecontinuous rain and thunderstorms over an El Nino. This water is like aniceberg in that it floats on the surrounding ocean and is piled up about 150centimeters (almost 5 feet) above sea level. Give two reasons why the El Ninowater is less dense than the surrounding ocean.
GED Science: Lesson 5 - El Nino, Vocabulary/Worksheet p. 2
2. The Pacific tradewinds near the equator push the El Nino waters against
Indonesia and Australia, bringing the rainy season to these areas. However,every 2-10 years the winds are not strong enough to “hold the wall of waterup, and it begins flowing back ‘downhill.’ Like a teeter-totter, what was highbecomes low, and what was low becomes high. Water levels actually dip belowsea level near Australia, and as the pile traverses the Pacific, waters rise in theeast near South America. ...In a sense, El Nino is like a slow-motion explosionof pent-up heat that makes a violent killer out of a small tropical storm...” Itcan bring drought Australia or life-giving rains to a Chilean desert.
From the above passage we can infer that:a) El Nino is caused by global warmingb) El Nino is Spanish for “the Christ child.”c) El Nino causes warm ocean water to flow down hill from the Western to
the Eastern Pacific and back again.d) El Nino brings unseasonably wet weather around the world.
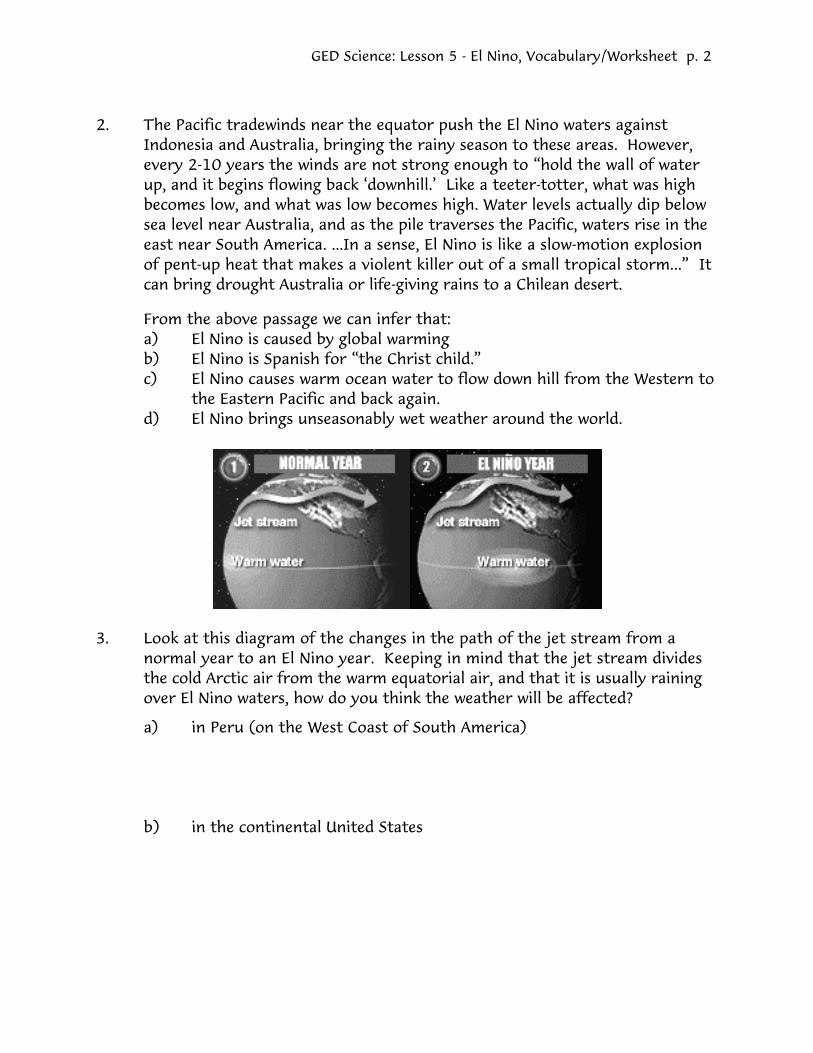
3. Look at this diagram of the changes in the path of the jet stream from anormal year to an El Nino year. Keeping in mind that the jet stream dividesthe cold Arctic air from the warm equatorial air, and that it is usually rainingover El Nino waters, how do you think the weather will be affected?
a) in Peru (on the West Coast of South America)
b) in the continental United States
CLN Televised CoursesGED ScienceNina Beegle, Instructor
GED ScienceLesson 5: El Nino - Vocabulary / Worksheet
Answer Key
A. Match the following words with the correct definitions:
c La Nina a) Originally referred to warmer thannormal sea temperatures in thePacific Ocean off the coast of SouthAmerica.
a El Nino b) A sea-saw shift in surface air pressurebetween Australia and Tahiti. If theair pressure is high in Australia then itis low in Tahiti, and vice-versa.
g ENSO c) “Cold event” where the waters of thePacific are colder than normal thatfrequently follows a “warm event.”
e Jet Stream d) Imaginary line dividing warm water onthe surface of the ocean from thecold water below.
b Southern Oscillation e) Winds traveling over 57 mph at highaltitudes above the earth.
d Thermocline f) Any consistent system of prevailingwinds that blow at low altitudesacross the surface of the earth.
f Tradewinds g) Scientists use this term to refer to awarm climatic event that happensevery 2-8 years.
GED Science: Lesson 5 - El Nino, Vocabulary/Worksheet Key p. 2
QUESTIONS:
1. Give two reasons why the El Nino water is less dense than the surroundingocean.
Answers will vary. Possible answers might include: Warmer water is less dense than cooler water. El Nino water is less salty because of all the rain that falls on it.
2. From the above passage we can infer that:
c) El Nino causes warm ocean water to flow down hill from the Western tothe Eastern Pacific and back again.
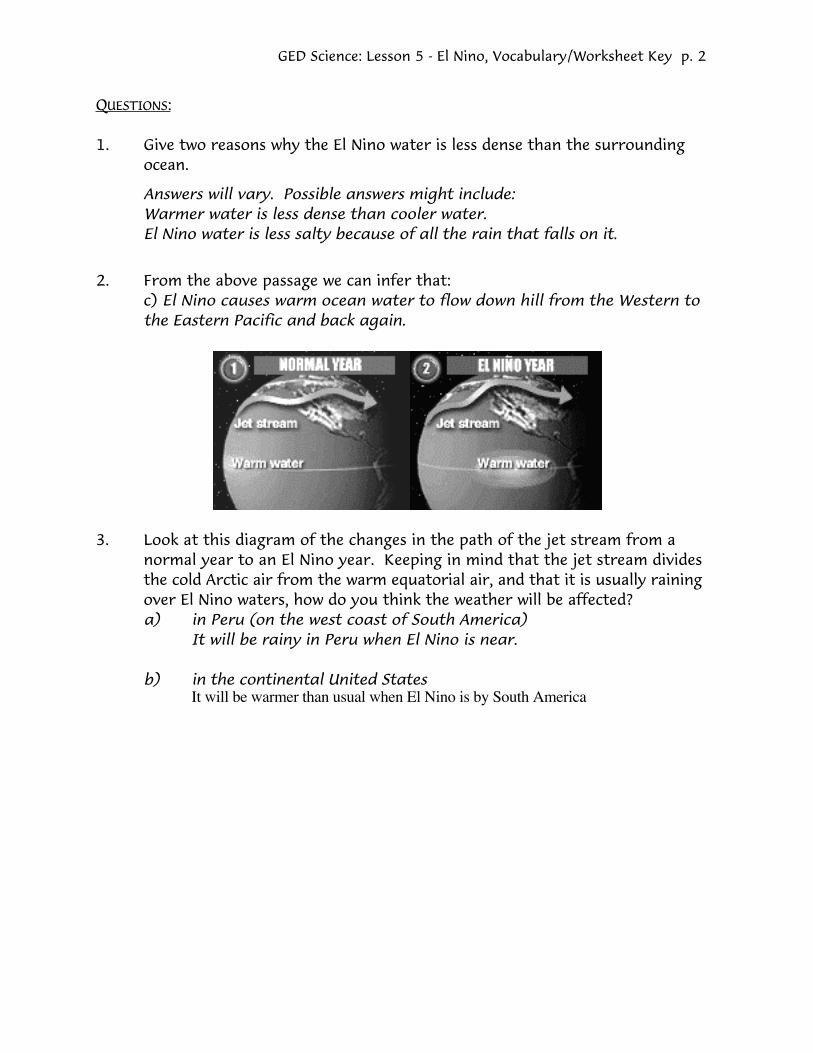
3. Look at this diagram of the changes in the path of the jet stream from a
normal year to an El Nino year. Keeping in mind that the jet stream dividesthe cold Arctic air from the warm equatorial air, and that it is usually rainingover El Nino waters, how do you think the weather will be affected?a) in Peru (on the west coast of South America)
It will be rainy in Peru when El Nino is near. b) in the continental United States
It will be warmer than usual when El Nino is by South America
CLN Televised CoursesGED ScienceNina Beegle, Instructor
GED ScienceLesson 5: Weather Systems / Weather Forecasts - Worksheet
You have probably noticed that weather can change dramatically overnight.One day is hot, humid and drizzling, and the next day is clear and dry. It feels as ifthe air has changed. In fact, the air has changed. One large body of air has replacedanother.
AIR MASSESLarge areas of air near Earth’s surface take on the same temperature and
moisture as the surface. For example, the air over a tropical ocean becomes warmand humid. A large body of air with a specific temperature and moisture is called anair mass. The term used to describe an air mass tells you where it came from.The word continental refers to a continent. The word maritime refers to the sea.There are four types of air masses:
Continental polar air masses are cold and dry. They form over Canada and theNorthern United States.
Continental tropical air masses are warm and dry. They form oversouthwestern United States.
Maritime polar air masses form over the northern Atlantic Ocean and thenorthern Pacific Ocean. These air masses are cold and moist.
Maritime tropical air masses form over the Caribbean Sea, the middle of theAtlantic Ocean, and the middle of the Pacific Ocean. These air masses are warm andmoist.
Air masses do not stay where they form. They may move thousands of miles.Think of a moving air mass as a large flattened bubble of air. In the United States,air masses are usually pushed from west to east by winds. As the air mass moves, itmay keep nearly the same temperature and moisture.
FrontsThe weather changes when one air mass moves out of an area and another
moves in. The leading edge of a moving air mass is called a front. A cold front is atthe front of a cold air mass. A warm front is at the front of a warm air mass. Theweather can change quickly when a front passes through. A front often brings rain orsnow to an area as it passes. When air masses stop moving for a while, the zonebetween them is called a stationary front.
GED Science: Lesson 5 - Weather Systems/Weather Forecasts p. 2
What does a Weather Map Show?Most newspapers print a weather map each day. A weather map shows
where cold, warm and stationary fronts are. It shows temperature andprecipitation, such as rain, snow, and sleet.
Weather maps also show areas of high and low pressure. These areas ofpressure are important because certain types of weather go with each. Most of thetime, a high pressure means fair weather and no clouds. A low-pressure area is oftencloudy with rain or snow.
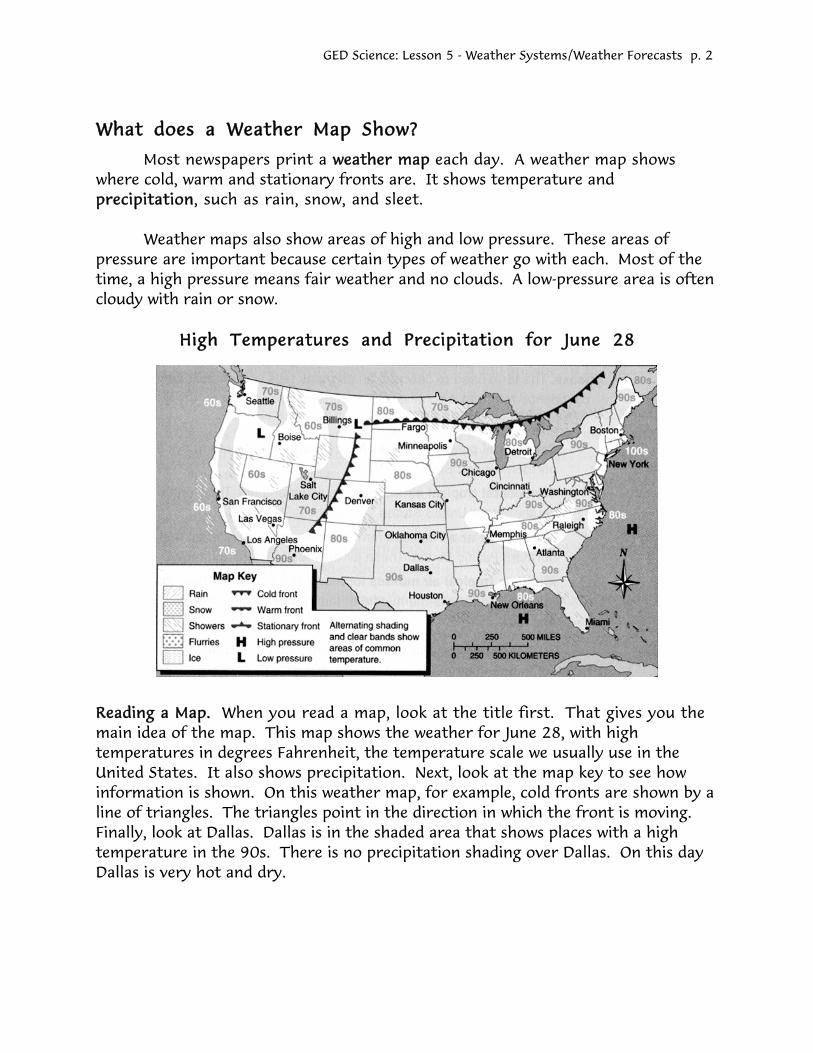
High Temperatures and Precipitation for June 28
Reading a Map. When you read a map, look at the title first. That gives you themain idea of the map. This map shows the weather for June 28, with hightemperatures in degrees Fahrenheit, the temperature scale we usually use in theUnited States. It also shows precipitation. Next, look at the map key to see howinformation is shown. On this weather map, for example, cold fronts are shown by aline of triangles. The triangles point in the direction in which the front is moving.Finally, look at Dallas. Dallas is in the shaded area that shows places with a hightemperature in the 90s. There is no precipitation shading over Dallas. On this dayDallas is very hot and dry.
GED Science: Lesson 5 - Weather Systems/Weather Forecasts p. 3
Questions:1. The symbol for a warm front looks like
a. a row of semicircles. b. a row of triangles.
2. The city closest to a warm front isa. Fargo b. Chicago
3. A cold air mass is behind a cold front. The high temperature in the cold airmass over the western United States is in the
a. 80s and 90s. b. 60s and 70s.
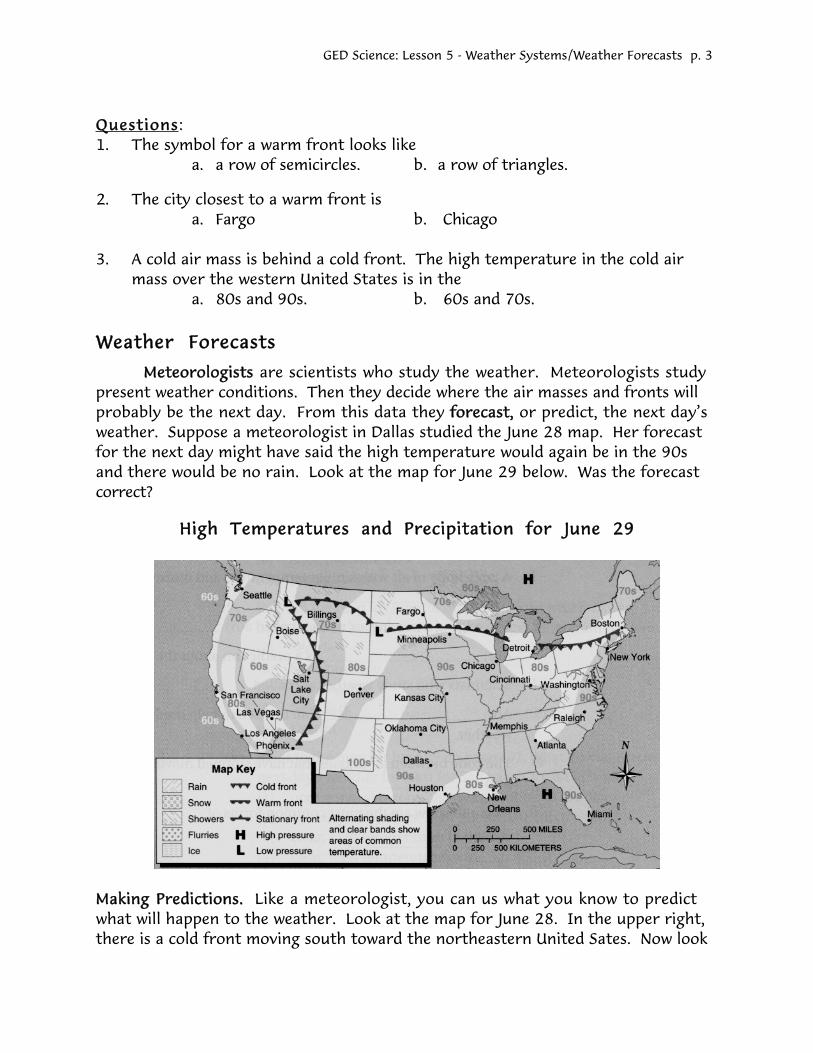
Weather ForecastsMeteorologists are scientists who study the weather. Meteorologists study
present weather conditions. Then they decide where the air masses and fronts willprobably be the next day. From this data they forecast, or predict, the next day’sweather. Suppose a meteorologist in Dallas studied the June 28 map. Her forecastfor the next day might have said the high temperature would again be in the 90sand there would be no rain. Look at the map for June 29 below. Was the forecastcorrect?
High Temperatures and Precipitation for June 29
Making Predictions. Like a meteorologist, you can us what you know to predictwhat will happen to the weather. Look at the map for June 28. In the upper right,there is a cold front moving south toward the northeastern United Sates. Now look
GED Science: Lesson 5 - Weather Systems/Weather Forecasts p. 4
at the map for June 29. The cold front has reached Boston. You can predict thatsoon the high temperature in the Boston area will drop from the 80s to the 70s.Use the map to answer these questions.
1. What is the weather like in New York City on June 29?
a. high temperature in the 70s, rainb. high temperature in the 90s, dry
2. What kind of weather would you predict for New York City on June 30?
a. high temperature in the 70s, dryb. high temperature in the 90s, rain
People often make jokes about the accuracy of weather forecasts. Yet,meteorologists are pretty good at predicting tomorrow’s weather. However, theirlong-range forecasts are not so accurate. Many factors can affect the weather. So,forecasting more than a few days in advance involves guessing as well as predicting.
Practice VocabularyThe words below are in the passage in bold type. Study the way each word is used.Then complete each sentence by writing the correct word.
air mass stationary front front weather mapprecipitation meteorologists forecast
1. A large body of air with similar temperature and moisture is called a(n) .
2. The edge of a moving air mass is called a(n) .
3. A(n) is a prediction about the weather.
4. Scientists who study weather are called .
5. A(n) can be used to help predict the comingweather.
6. The zone between air masses that have stopped moving is called a(n) .
7. Rain and snow are the most common forms of .
GED Science: Lesson 5 - Weather Systems/Weather Forecasts p. 5
Understand the ArticleMatch the air mass with its characteristics. You may have more than one answer foreach air mass.
Air mass Characteristic
8. continental polar a. cold
9. continental tropical b. warm
10. maritime polar c. dry
11. maritime tropical d. moist
Write the answer to each question.
12.In what directions does weather in the United States generally move?
.
13.Why are long-range weather forecasts often inaccurate?
.
Apply Your SkillsCircle the number of the best answer for each question.
14.On a weather map, there is a line of alternating triangles and half circlespointing in opposite directions. Look at the map key on page 2. What doesthis symbol indicate?(1) cold front(2) warm front(3) stationary front(4) high-pressure area(5) precipitation
15.Refer to the map for June 28 on page 2. In which city are people most likelyto be going?(1) Seattle(2) San Francisco(3) Los Angeles(4) New York(5) Detroit
Excerpted from Steck-Vaughn’s PreGED ScienceSteck-Vaughn Publishers

CLN Televised CoursesGED ScienceNina Beegle, Instructor
GED ScienceLesson 5: Weather Systems/Weather Forecasts
Worksheet Answer Key
Reading a MapQuestions:1. The symbol for a warm front looks like
a . a row of semicircles.
2. The city closest to a warm front isa . Fargo
3. A cold air mass is behind a cold front. The high temperature in the cold airmass over the western Unites Sates is in theb . 60s and 70s.
Weather ForecastsMaking Predictions1. What is the weather like in New York City on June 29?
b . high temperature in the 90s, dry
2. What kind of weather would you predict for New York City on June 30?a . high temperature in the 70s, dry
Practice Vocabulary1. air mass 2. front 3. forecast4. meteorologists 5. weather map 6. stationary front7. precipitation
Understand the ArticleMatch the air mass with its characteristics. You may have more than one answer foreach air mass.
8. a, c9. b, c10. a, d11. b, d
Write the answer to each question.12. from west to east
13. There are too many factors affecting the weather over a long period of timefor accurate predictions to be possible.

GED Science: Lesson 5 - Weather Systems/Weather Forecasts Key p. 2
Apply Your SkillsCircle the number of the best answer for each question.
14.On a weather map, there is a line of alternating triangles and half circlespointing in opposite directions. Look at the map key on page 2. What doesthis symbol indicate?(3) stationary front
15.Refer to the map for June 28 on page 2. In which city are people most likelyto be going?(4) New York
Excerpted from Steck-Vaughn’s PreGED ScienceSteck-Vaughn Publishers
CLN Televised CoursesGED ScienceNina Beegle, Instructor
GED ScienceLesson 5: Weather Systems/Weather Forecasts
Worksheet Answer Key
Reading a MapQuestions:1. The symbol for a warm front looks like
a . a row of semicircles.
2. The city closest to a warm front isa . Fargo
3. A cold air mass is behind a cold front. The high temperature in the cold airmass over the western Unites Sates is in theb . 60s and 70s.
Weather ForecastsMaking Predictions1. What is the weather like in New York City on June 29?
b . high temperature in the 90s, dry
2. What kind of weather would you predict for New York City on June 30?a . high temperature in the 70s, dry
Practice Vocabulary1. air mass 2. front 3. forecast4. meteorologists 5. weather map 6. stationary front7. precipitation
Understand the ArticleMatch the air mass with its characteristics. You may have more than one answer foreach air mass.
8. a, c9. b, c10. a, d11. b, d
Write the answer to each question.12. from west to east
13. There are too many factors affecting the weather over a long period of timefor accurate predictions to be possible.
GED Science: Lesson 5 - Weather Systems/Weather Forecasts Key p. 2
Apply Your SkillsCircle the number of the best answer for each question.
14.On a weather map, there is a line of alternating triangles and half circlespointing in opposite directions. Look at the map key on page 2. What doesthis symbol indicate?(3) stationary front
15.Refer to the map for June 28 on page 2. In which city are people most likelyto be going?(4) New York
Excerpted from Steck-Vaughn’s PreGED ScienceSteck-Vaughn Publishers