gemalogic software platform … description (energy efficiency modul) solvera lynx d.o.o. stegne 23a...
TRANSCRIPT

1
GEMALOGIC SOFTWAREPLATFORM DESCRIPTION(ENERGY EFFICIENCY MODUL)

Solvera Lynx d.o.o.Stegne 23ASI-1000 Ljubljana
T +386 1 40 12 860F +386 1 40 12 861 W solvera-lynx.com
Solvera Lynx d.o.o. is entered in the Court at Ljubljana District | Share capital: 53.434,75 EUR | ID number: 1716808000 | VAT ID: SI98578537 | Board Chairman: dr. Otmar Zorn Bank account: SI56 0203 6009 1956 438 at NLB d.d., SWIFT: LJBASI2X
Product description
ADVANCED ENERGY MANAGEMENT SOFTWARE
3
CONTENTS
1. Information about the document . . . . . . . . . . . . . . . . . . . . . . . . . . . . . . . . . . . . . . . . . . . . . . . . . . . . . . . . .41.1. Document data. . . . . . . . . . . . . . . . . . . . . . . . . . . . . . . . . . . . . . . . . . . . . . . . . . . . . . . . . . . . . . . . . . . . . . . .41.2. Disclaimer . . . . . . . . . . . . . . . . . . . . . . . . . . . . . . . . . . . . . . . . . . . . . . . . . . . . . . . . . . . . . . . . . . . . . . . . . . . .41.3. Technical support . . . . . . . . . . . . . . . . . . . . . . . . . . . . . . . . . . . . . . . . . . . . . . . . . . . . . . . . . . . . . . . . . . . . . .42. Product presentation . . . . . . . . . . . . . . . . . . . . . . . . . . . . . . . . . . . . . . . . . . . . . . . . . . . . . . . . . . . . . . . . . . . . 52.1. Description . . . . . . . . . . . . . . . . . . . . . . . . . . . . . . . . . . . . . . . . . . . . . . . . . . . . . . . . . . . . . . . . . . . . . . . . . . . 52.2. Proposed forms of displays and analyses . . . . . . . . . . . . . . . . . . . . . . . . . . . . . . . . . . . . . . . . . . . . . . . . . 52.2.1. General overview . . . . . . . . . . . . . . . . . . . . . . . . . . . . . . . . . . . . . . . . . . . . . . . . . . . . . . . . . . . . . . . . . . . . 52.2.2. Balance and Balances Archive . . . . . . . . . . . . . . . . . . . . . . . . . . . . . . . . . . . . . . . . . . . . . . . . . . . . . . . . .62.2.3. Contour Display . . . . . . . . . . . . . . . . . . . . . . . . . . . . . . . . . . . . . . . . . . . . . . . . . . . . . . . . . . . . . . . . . . . . . 72.2.4. Energy efficiency analyses . . . . . . . . . . . . . . . . . . . . . . . . . . . . . . . . . . . . . . . . . . . . . . . . . . . . . . . . . . . .92.2.5. Alarming . . . . . . . . . . . . . . . . . . . . . . . . . . . . . . . . . . . . . . . . . . . . . . . . . . . . . . . . . . . . . . . . . . . . . . . . . . 132.2.6. Manual data entry . . . . . . . . . . . . . . . . . . . . . . . . . . . . . . . . . . . . . . . . . . . . . . . . . . . . . . . . . . . . . . . . . . 142.2.7. Overview Panel . . . . . . . . . . . . . . . . . . . . . . . . . . . . . . . . . . . . . . . . . . . . . . . . . . . . . . . . . . . . . . . . . . . . . 152.3. System security . . . . . . . . . . . . . . . . . . . . . . . . . . . . . . . . . . . . . . . . . . . . . . . . . . . . . . . . . . . . . . . . . . . . . . 162.4. System requirements for the GemaLogic Software. . . . . . . . . . . . . . . . . . . . . . . . . . . . . . . . . . . . . . . .16

4
1. INFORMATION ABOUT THE DOCUMENT
Title GemaLogic Software Platform Description
Subtitle Advanced energy management software
Document type Product description
Version V 1.1
1.1. DOCUMENT DATA
1.2. DISCLAIMER
1.3. TECHNICAL SUPPORT
All rights to this document and the information contained herein are the property of Solvera Lynx Company. Reproduction, use or disclosure to third parties without expressed permission is prohibited.
Solvera Lynx Company reserves the right to change the technical specifications of its products without notice in writing and urges its customers to make sure that the information they have is valid.
If you have technical problems or cannot find the required information in the provided documents, contact our Technical Support by e-mail using our dedicated e-mail address:[email protected]. Your request will be processed as soon as possible.
Solvera Lynx d.o.o.Stegne 23ASI-1000 LjubljanaSloveniaEmail: [email protected]: +386 1 40 12 860Fax: +386 1 40 12 861

5
2.1. DESCRIPTION
2.2.1. GENERAL OVERVIEW
2.2. PROPOSED FORMS OF DISPLAYS AND ANALYSES
• The data analysis system will entail a relation database with hourly records (or 15-minute records for electricity) on the consumed energy products per individual sectors. The database comprises data for a longer period (typically 10 years).
• The General Overview will display a chart of dependent variables in a certain period.• The total consumption of an energy product will be displayed per individual centres for energy
control and per cost centre in a certain period. Together with the data on the specific price of an energy product, an instant calculation of the cost of an individual energy product will be available.
• The General Overview provides the generation of analyses with the possibility of opting for various data on individual energy products available on a certain period level (e.g. hourly, daily, monthly, annual) and for various time intervals (¼ hour, ½ hour, 1 hour, 1 week, 1 month and 1 year). These are the data that demonstrate the consumption of individual energy products or values and that are available to an individual user.
• It is proposed that all energy products except for electricity (15 min) be gathered on an hourly basis.• The analyses may be organised per individual energy products or per individual monitoring points
and facilities. The availability of individual data is determined for each user separately.• All analyses may be stored and the data simply transferred into other programs (e.g. Excel) for
eventual further analyses, if needed. It is also possible to generate the already prepared analyses in a pdf file.
The information system for energy management provides the following records and analyses:
2. PRODUCT PRESENTATION
Picture 1: Example of the General Overview analysis for various energy products

6
2.2.2. BALANCE AND BALANCES ARCHIVE
• The Balance analysis (Picture 2) provides an overview of the current balance, as it demonstrates the process data (analogous and digital) that we gather in the GemaLogic system. These are the data that demonstrate current values (pressure, temperature, power, operation of pumps, compressors, etc.). The selection of parameters is the same as in the General Overview analysis.
• The analysis provides a table demonstration of data, whereas a process layout is also available (optional). Along the current values of data, the table also provides a link (“Show archive”) to the Balances Archive analysis where we may also carry out a quick review of the history of the data displayed.
• The Balances Archive analysis (Picture 3) demonstrates the archive of process data. The analysis provides a chart and table display for the data history.
Picture 2: Example of the Balance analysis
Picture 3: Example of the Balances Archive analysis

7
2.2.3. CONTOUR DISPLAY
• The Contour Display tool provides an overview of various data in table form with specifically coloured fields. This makes the overview of energy consumption transparent and clear. The use of the Contour Display is quite simple, as the analysis always only displays the hourly level of data for the selected month of the year. When selecting the data, we must therefore only make sure that there are hourly data available for the selected data.
• The Contour Display also provides some other useful options for the monitoring of energy consumption, i.e. total daily consumption, monthly comparison, average daily temperature, export to Excel, etc.
Picture 4: Example of the Contour Display analysis
• The analysis provides various settings of viewing, including the exchange of columns and rows (Picture 5).
Picture 5: Contour Display-“Flip the table” function applied

8
• The Contour Display analysis also provides a display of the average daily temperature that is laid out at the bottom of the table, thus providing the reason for the increased/decreased energy consumption on a given day. In additional settings, there is also a selection of extremes that determine the value of the greatest (red) and lowest (green) consumption.
• The Contour Display analysis also provides simple and quick comparisons of energy consumption. When two tables are displayed, we can compare data simply and quickly - e.g. December 2013 and December 2012. This way, we can see very simply whether consumption was lower/greater in the previous year and when are the critical hours during the day.
Picture 6: Comparison of tables in the Contour Display

9
• measuring energy consumption per individual sectors in a certain period;• determination of specific energy consumption in individual energy control centers CNE (e.g.
kWh/hl; m3/kg; kWh/Nm3);• determination of the targeted or desired consumption for the decrease of energy
consumption in CNE;• assessment and comparison of energy consumption in sectors with targeted consumption;• reporting on changed energy consumption in sectors;• correction of faults and quick action in case of changes.
2.2.4. ENERGY EFFICIENCY ANALYSES
Targeted monitoring of energy consumption (CSRE) marks the application of managerial techniques for the control and monitoring of energy consumption and costs. Essential elements of target monitoring are the following:
M&T MANNER OF DISPLAY
M&T analyses allow the introduction and application of targeted monitoring of energy consumption (CSRE) or, in English terms, Monitoring and Targeting (M&T). The M&T analyses provide the following displays:
• characteristic indicator analysis (specific consumption);• M&T chart;• CUSUM-analysis.
The key data of the M&T analysis are the data on the production in an individual CNE as well as on the consumption of energy products (kWh, m3) that are being consumed in a certain type of production.
CHARACTERISTIC INDICATOR ANALYSIS (SPECIFIC CONSUMPTION)
The Characteristic Indicator or specific consumption demonstrates the value of energy consumption per product unit or benchmark hour. The data pair (e.g. electricity consumption [kWh] and production [t]) is selected in the “Parameters” window along with other options (period, time interval). The data pair is set in the Administrator tool beforehand.
The analysis generates a chart and a table containing data where the values measured can be seen (Picture 7).
As in the cases of other analyses, it is possible to export data into a PDF and Excel file.

10
M&T analysis–chart or targeted monitoring of energy consumption is an advanced analysis that demonstrates the dependency of two types of data–the dependent and independent variable. It is the key analysis of energy efficiency, as we set the target line for the desired energy consumption in this analysis.
The target line is a linear function that links the independent variable (production, temperature shortage, etc.) and the energy consumption that is dependent on it, in a specified time interval. It therefore defines how much energy may be consumed at a certain level of production.
Upon the selection of the parameters, the M&T chart is generated in the analysis, and a table containing values below it (Picture 8). An independent variable lies on the x axis of the chart and the dependent variable on the y axis. Each point in the chart represents 1 hour, 1 day, 1 month–dependent on the selection of the interval within the parameters. The (dotted) line displayed is the regression line that represents the average connection of the points displayed.
The two main factors are the dispersion and the inclination of the line. The intersection of the regression line and the y axis determines the energy consumption that is independent of the scope of production–the consumption pair. A small inclination of the regression line demonstrated the poor codependency between the compared variables. A great dispersion of results demonstrates that other factors also effect the codependency between the compared variables. One of the factors that effect the dispersion may also be the human factor or uncontrolled losses. The introduction of targeted monitoring of energy consumption also greatly contributes to the decrease of energy costs due to the better quality control over energy consumption.
Picture 7: Example of the Characteristic Indicator analysis
M&T ANALYSIS CHART (TARGETED MONITORING OF ENERGY

11
DETERMINATION OF THE TARGET LINE
Along the displayed regression line, a new target line can be selected in the settings dependent on the former, saved and monitored in the future with individual measures. There are three options at our disposal, namely:
Picture 8: Display of the M&T report–chart in the M&T analysis
• the target line should be lower than the regression line by X% of the demonstrated trend;• the target line should be equal to the trend of X% of the best values displayed;• the target line may also be set manually given the prescribed indicators (benchmarking).

12
Picture 9: Determination of the new target consumption (target line)
Once we save the target line, we must also enter the price of the energy product (dependent variable) that we monitor. In case of manual entry, we also enter the data on the target together with the price–equation of the linear line y = k*x + n. The articles “k” (line inclination) and “n” (time consumption) must be entered.
Picture 10: Manual determination of the target line
CUSUM ANALYSIS
Once the target line is set, we can the efficiency of the target set can be monitored regularly with the CUSUM analysis–in English: CUmulative SUM deviation. The Cumulative Sums analysis is a statistical technique that defines the deviations between actual energy consumption and the target value that we have set in the M&T chart. The CUSUM analysis therefore directly depends on the selected target value of the typical energy consumption–target line.
A rising curve represents a negative trend–we are regressing from the target value. On the contrary, a falling curve is a sign of a successful trend. The points below the x axis–negative values, mean that we achieved the targets. A greater incllination of increase of decrease represents the intensity of this (in)efficiency (Picture 11).
Picture 11: Demonstration of the CUSUM chart

13
Once the target line is set, we can the efficiency of the target set can be monitored regularly with the CUSUM analysis–in English: CUmulative SUM deviation. The Cumulative Sums analysis is a statistical technique that defines the deviations between actual energy consumption and the target value that we have set in the M&T chart. The CUSUM analysis therefore directly depends on the selected target value of the typical energy consumption–target line.
A rising curve represents a negative trend–we are regressing from the target value. On the contrary, a falling curve is a sign of a successful trend. The points below the x axis–negative values, mean that we achieved the targets. A greater incllination of increase of decrease represents the intensity of this (in)efficiency (Picture 11).
2.2.5. ALARMING
It is possible to create an alarm for all the data in the GemaLogic system. Upon the selection of the desired data, a window appears offering the setting of a time attribute (alarm on an hourly basis, daily basis, etc.), the condition for the alarm to be triggered, importance of the alarm, etc.
Alarming contains 3 analyses, namely, “Stop the new alarm”, “Set alarms” and “Alarms triggered”. In the “Create a new alarm” analysis, new alarm are created, whereas in the remaining two analyses, alarms that are saved in the systems and the alarms that have already been triggered, are reviewed.
There can be several recipients of an alarm. We enter their names in the settings and the manner of sending which can be the following:
• GemaLogic (alarm is only sent in the GemaLogic system);• E-mail (alarm is sent to the entered e-mail address);• SMS (alarm is sent via text message to the entered telephone number).
Picture 12: Demonstration of alarm setting
14
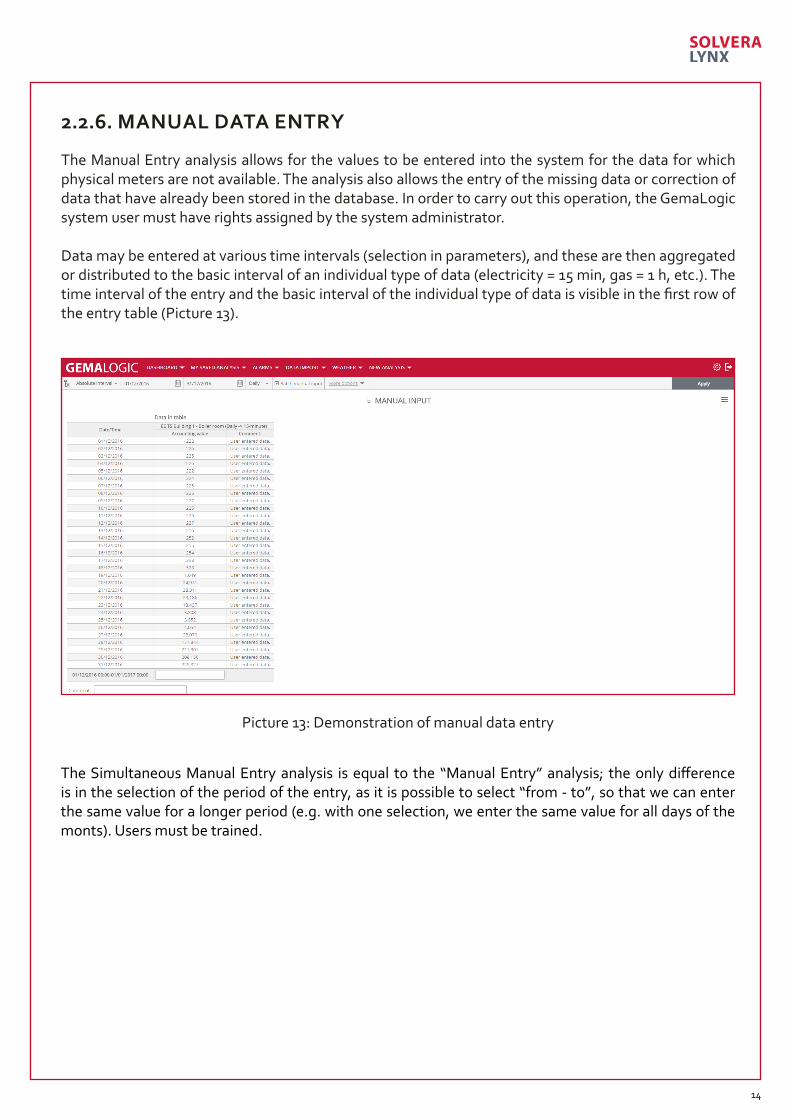
2.2.6. MANUAL DATA ENTRY
The Manual Entry analysis allows for the values to be entered into the system for the data for which physical meters are not available. The analysis also allows the entry of the missing data or correction of data that have already been stored in the database. In order to carry out this operation, the GemaLogic system user must have rights assigned by the system administrator.
Data may be entered at various time intervals (selection in parameters), and these are then aggregated or distributed to the basic interval of an individual type of data (electricity = 15 min, gas = 1 h, etc.). The time interval of the entry and the basic interval of the individual type of data is visible in the first row of the entry table (Picture 13).
Picture 13: Demonstration of manual data entry
The Simultaneous Manual Entry analysis is equal to the “Manual Entry” analysis; the only difference is in the selection of the period of the entry, as it is possible to select “from - to”, so that we can enter the same value for a longer period (e.g. with one selection, we enter the same value for all days of the monts). Users must be trained.

15
2.2.7. OVERVIEW PANEL
The Overview Panel tool provides the display and overview of various analyses in one place. Each user may set the display of the information that is relevant to him/her. The user does not need to click on various analyses for the main information, as it is always available in one place.
The Overview Panel also allows, along the quick overview of various data, daily, weekly or monthly sending of reports to various e-mail addresses (Picture 14).
The saved analyses are added to the Overview Panel by clicking on the “Overview Panel” button located at the bottom of the “Parameters” window in each analysis displayed. It is also possible to add building blocks to the Overview Panel by clicking on the New building block button at the bottom of the Overview Panel.
Picture 14: Overview Panel with various analyses
The sending of reports with analyses is set in the Sending settings (button at the top of the Overview Panel). We select the sending interval (1x per day/week/month) and the exact time of sending. The time entry must be in the HH:mm or only HH format.
As recipients, the e-mail addresses are entered to which reports are to be sent. The recipients’ e-mail addresses must be separated with a semicolon (;). In order to confirm the data entered, click the “Save!” button. To return to the Overview Panel click on the “Close” button.

16
Nowadays GemaLogic software is usually installed on virtual servers, installation on physical servers is also an option. Servers can be part of end user IT environment or provided as SaaS. Best practice is installation on two separate servers (application server and database server), for small scale energy management projects one all-in-one server installation is recommended.
2.3.SYSTEM SECURITY
System access is enabled via an internet browser over SSL secured connection (HTTPS) for all users that were assigned a username and password. Given a user’s status, the display of reports and the possibility of entry and change of data varies.
We anticipate the following levels of users:
• Administrator: has access to all data, may also change existing data and enter new data into the database. In principle, only the heads of energetics are to have this authorization.
• Head of Department or CNE: depending on the sector type, they only have access to the data pertaining to their sector where they may enter the missing production data. An overview of the energy products’ consumption for their sector is also available to them.
• Management Board and Middle Management: the data is condensed so that the user may easily access a general overview of the energy costs and the company’s energy efficiency.
2.4. SYSTEM REQUIREMENTS FOR THE GEMALOGIC SOFTWARE
Hardware system requirements (CPU, RAM, storage):
• depends on a scale of a project.
Software system requirements:
• Application server: Microsoft Windows Server, Linux;• Database server: Microsoft SQL Server, Oracle Database.

17