gender-based indicators of labor and · pdf filegender-based indicators of labor and...
TRANSCRIPT

GENDER-BASED INDICATORS OF LABOR AND EMPLOYMENT IN AGRICULTURE
PHILIPPINE STATISTICS AUTHORITY
PHILIPPINE STATISTICS AUTHORITY 16
th Floor, Eton Cyberpod Centris 3
EDSA, corner Quezon Avenue, Quezon City, Philippines 1100
Telefax No.: +63(2) 376-1954
URL: http://psa.gov.ph
/PhilippineStatisticsAuthority /PSAgovph
ISSN-2012-0435
REPORT No. 2017-09
GENDER-BASED INDICATORS OF
LABOR AND EMPLOYMENT IN
AGRICULTURE

GENDER-BASED INDICATORS OF LABOR AND EMPLOYMENT IN AGRICULTURE
PHILIPPINE STATISTICS AUTHORITY
TERMS OF USE Agricultural Indicators System (AIS) is a publication of the Philippine Statistics Authority. The PSA reserves exclusive right to reproduce this publication in whatever form. Should any portion of this publication be included in a report/article, the title of the publication and the PSA should be cited as the source of the data. The PSA will not be responsible for any information derived from the processing of data contained in this publication.
ISSN-2012-0435 DECEMBER 2017


GENDER-BASED INDICATORS OF LABOR AND EMPLOYMENT IN AGRICULTURE
PHILIPPINE STATISTICS AUTHORITY
TABLE OF CONTENTS
iii 32
Table 7.2b
Daily real wage rate of female agricultural workers, by region, Philippines, 2012-2016(in pesos)
Philipines 160.10 169.27 171.05 177.47 181.10
CAR 174.30 188.19 192.60 194.36 190.88Ilocos Region 220.39 222.79 190.87 198.20 233.37Cagayan Valley 196.49 195.34 194.94 198.92 222.11Central Luzon 197.96 232.70 192.52 214.48 242.78CALABARZON 189.28 222.17 166.67 172.59 231.60MIMAROPA 163.95 171.34 170.98 181.20 168.76Bicol Region 159.04 147.76 116.07 119.74 156.40Western Visayas 148.39 151.69 154.74 156.18 159.69Central Visayas 132.61 140.05 140.77 150.08 147.50Eastern Visayas 128.95 141.67 112.75 112.02 157.05Zamboanga Peninsula 135.92 142.28 146.16 152.39 146.33Northern Mindanao 136.91 135.11 137.91 151.03 146.12Davao Region 135.08 149.50 153.09 158.30 155.32SOCCSKSARGEN 145.86 147.86 149.03 158.57 154.94Caraga 151.65 170.58 175.57 187.60 179.39ARMM 142.94 158.66 88.64 102.97 154.58
Source: Philippine Statistics Authority (PSA)
REGION 2012 2013 2014 2015 2016
FOREWORD i
LIST OF TABLES i i i
GENDER-BASED INDICATORS OF LABOR AND EMPLOYMENT IN AGRICULTURE
Table 1.1a Total male household population 15 years old and over, by region, Philippines, 2012-2016 7
Table 1.1b Total female household population 15 years old and over, by region, Philippines, 2012-2016 8
Table 2.1a Male labor force, by region, Philippines, 2012-2016 9
Table 2.1b Female labor force, by region, Philippines, 2012-2016 10
Table 2.2a Male labor force participation rate, by region, Phill ippines, 2012-2016 11
Table 2.2b Female labor force participation rate, by region, Philippines, 2012-2016 12
Table 3.1a Number of employed males, by region, Philippines,2012-2016 13
Table 3.1b Number of employed females, by region, Philippines,2012-2016 14
Table 3.2a Male employment rate, by region, Philippines,2012-2016 15
Table 3.2b Female employment rate, by region, Philippines, 2012-2016 16
Table 4.1a Number of unemployed males, by region, Philippines,2012-2016 17
Table 4.1b Number of unemployed females, by region, Philippines,2012-2016 18
Table 4.2a Male unemployment rate, by region, Philippines, 2012-2016 19
Table 4.2b Female unemployment rate, by region, Philippines, 2012-2016 20

GENDER-BASED INDICATORS OF LABOR AND EMPLOYMENT IN AGRICULTURE
PHILIPPINE STATISTICS AUTHORITY
31
TABLE OF CONTENTS
iv
Table 7.2a
Daily real wage rate of male agricultural workers, by region,
Philippines, 2012-2016
(in pesos)
Philipines 171.81 176.44 181.01 192.01 193.22
CAR 183.83 197.73 204.33 209.68 204.80Ilocos Region 233.79 238.68 233.66 238.18 242.33Cagayan Valley 196.56 217.21 222.24 231.40 225.07Central Luzon 237.02 256.96 260.28 254.27 262.51CALABARZON 213.33 228.64 230.07 231.59 231.98MIMAROPA 180.91 190.56 192.64 195.12 189.97Bicol Region 153.55 153.83 168.14 170.26 183.33Western Visayas 158.18 160.87 164.42 166.93 161.03Central Visayas 141.10 151.02 152.34 160.02 157.88Eastern Visayas 145.30 147.90 159.43 158.97 158.94Zamboanga Peninsula 142.31 155.48 154.36 158.14 152.12Northern Mindanao 145.90 150.87 153.87 159.69 150.86Davao Region 144.69 165.71 163.96 169.19 165.42SOCCSKSARGEN 152.58 155.06 156.23 166.16 159.21Caraga 164.20 176.19 182.50 195.26 190.56ARMM 150.63 151.61 153.70 162.33 160.52
Source: Philippine Statistics Authority (PSA)
REGION 2012 2013 2014 2015 2016
Table 5.1a Number of visibly underemployed males, by region, Philippines, 2012-2016 21
Table 5.1b Number of visibly underemployed females, by region, Philippines, 2012-2016 22
Table 5.2a Male visible underemployment rate, by region,Philippines, 2012-2016 23
Table 5.2b Female visible underemployment rate, by region, Philippines, 2012-2016 24
Table 6.1a Number of employed males in agriculture, by region, Philippines, 2012-2016 25
Table 6.1b Number of employed females in agriculture, by region, Philippines, 2012-2016 26
Table 6.2a Proportion of employed males in agriculture to total male employment, by region, Philippines, 2012-2016 27
Table 6.2b Proportion of employed females in agriculture to total female employment, by region, Philippines, 2012-2016 28
Table 7.1a Daily nominal wage rate of male agricultural workers, by region, Philippines, 2012-2016 29
Table 7.1b Daily nominal wage rate of female agricultural workers, by region, Philippines, 2012-2016 30
Table 7.2a Daily real wage rate of male agricultural workers,by region, Philippines, 2012-2016 31
Table 7.2b Daily real wage rate of female agricultural workers, by region, Philippines, 2012-2016 32

GENDER-BASED INDICATORS OF LABOR AND EMPLOYMENT IN AGRICULTURE
PHILIPPINE STATISTICS AUTHORITY
30
Table 7.1b
Daily nominal wage rate of female agricultural workers, by region, Philippines, 2012-2016(in pesos)
Philipines 208.30 226.73 238.69 251.11 260.78
CAR 223.28 249.27 264.57 270.93 271.05Ilocos Region 272.62 282.54 252.95 266.18 319.01Cagayan Valley 257.79 264.94 274.98 286.24 329.17Central Luzon 260.91 315.13 270.11 304.77 352.52CALABARZON 245.69 296.01 230.88 241.11 326.33MIMAROPA 218.54 234.21 244.20 262.38 249.42Bicol Region 210.56 202.42 167.42 174.34 230.22Western Visayas 195.72 207.68 221.85 229.11 244.00Central Visayas 170.27 188.87 199.38 216.41 218.15Eastern Visayas 172.41 197.65 168.20 170.16 241.70Zamboanga Peninsula 184.99 201.89 218.95 234.07 231.34Northern Mindanao 189.35 195.03 208.04 230.92 226.49Davao Region 183.31 209.43 222.35 235.87 238.88SOCCSKSARGEN 198.67 208.74 221.27 238.81 240.15Caraga 215.95 252.21 273.35 299.41 291.69ARMM 202.54 232.48 135.13 161.04 248.88Source: Philippine Statistics Authority (PSA)
REGION 2012 2013 2014 2015 2016

GENDER-BASED INDICATORS OF LABOR AND EMPLOYMENT IN AGRICULTURE
PHILIPPINE STATISTICS AUTHORITY
1 28
Household Population Aged 15 Years Old and Over Gender-specific information on the number of persons aged 15 years old and over indicates the distribution of males and females who are available for work. This serves as input for assessing the surplus or shortages of males and/ or females in the labor market and consequently, for the formulation and implementation of relevant programs and policies regarding labor. In 2016, the country’s working population aged 15 years and over consisted of 34.18 million males and 34.13 million females. Across regions, CALABARZON reported the biggest number of working age population for the males at 4.65 million and for the females at 4.89 million. NCR came next with 4.27 million males and 4.65 million females. Majority of the regions had about 1.0 million each of males and females who belonged to the working age population. The least counts were noted in CAR at 0.62 million males and 0.59 million females. The numbers were also minimal in Caraga at 0.93 million males and 0.87 million females (Tables 1.1a and 1.1b).
Labor Force Sex-disaggregated data on labor force gives the composition of population aged 15 year old and over, whether employed or unemployed, who contributed to the production of goods and services in the country. It also indicates the proportions of males and females of working age who join the labor force stream. In 2016, the total number of males in the labor force was estimated at 26.52 million while females figured to 16.84 million. Labor force participation rates (LFPRs) stood at 77.6 percent for males and 49.3 percent for females. At the regional level, CALABARZON had more males at 3.57 million and females at 2.55 million who were in the labor force in 2016. In NCR, the labor force population comprised of 3.17 million males and 2.44 million females. A greater number of males in labor force ranging from 1.01 million to 1.98 million were reported in many regions. The counts of
females in the labor force were less than 1.0 million in
Table 6.2bProportion of employed females in agriculture to total female employment,by region, Philippines, 2012-2016(in percent)
Philippines 21.0 20.1 20.3 19.0 17.3
NCR 0.1 0.1 0.2 0.1 0.1CAR 44.2 43.2 44.8 44.5 39.8Ilocos Region 22.5 20.5 21.2 19.6 19.7Cagayan Valley 47.9 46.8 44.0 43.3 40.2Central Luzon 10.9 11.6 10.9 8.5 6.2CALABARZON 7.5 6.5 7.6 6.3 4.4MIMAROPA 35.0 32.3 31.8 31.8 30.1Bicol Region 21.7 20.4 20.4 22.2 22.0Western Visayas 24.3 23.5 25.7 24.0 23.5Central Visayas 22.7 23.6 23.7 22.2 24.5Eastern Visayas 24.4 24.8 29.7 25.1 21.9Zamboanga Peninsula 36.2 36.9 33.6 33.5 32.2Northern Mindanao 35.0 30.7 33.9 29.9 26.8Davao Region 24.1 23.9 23.2 19.2 20.3SOCCSKSARGEN 36.3 35.8 33.3 31.9 28.5Caraga 23.7 24.1 23.3 22.9 22.5ARMM 58.7 54.0 54.6 55.2 48.7Source: Philippine Statistics Authority (PSA)
REGION 2015 20162012 2013 2014

GENDER-BASED INDICATORS OF LABOR AND EMPLOYMENT IN AGRICULTURE
PHILIPPINE STATISTICS AUTHORITY
females in the labor force were less than 1.0 million in majority of the regions. CAR accounted for the least labor force at 0.48 million males and 0.32 million females (Tables 2.1a and 2.1b). Cagayan Valley indicated the highest male LFPR at 81.4 percent followed by Northern Mindanao at 80.0 percent. For the females, LFPR topped in Central Visayas at 55.6 percent and CAR at 54.7 percent. Male LFPRs of around 79 percent were reported in MIMAROPA, Zamboanga Peninsula, Davao Region and SOCCSKSARGEN. LFPRs of females of about 52.0 percent were noted in NCR, CALABARZON and Northern Mindanao. LFPRs were lowest in NCR at 74.2 percent for the males and ARMM at 29.2 percent for females (Tables 2.2a and 2.2b).
Employment Sex-disaggregated data on employment indicates the rate of absorption of available males and females in the production of goods and services. It is also a measure of gender equality in the labor market. Countrywide, there were 25.04 million employed males and 15.96 employed females in 2016. These corresponded to employment rates of 94.4 percent and 94.8 percent. The biggest male and female employment was located in CALABARZON at 3.28 million and 2.40 million, respectively, in 2016. Higher numbers were also recorded in NCR at 2.94 million males and 2.30 million females. Central Luzon had 2.72 million and 1.66 million of the employed males and females, respectively. CAR reported the least employment at 0.46 million males and 0.31 million females (Tables 3.1a and 3.1b). By region, male employment rate (ER) was highest in Cagayan Valley at 97.4 percent in 2016. This was followed by ARMM at 97.0 percent. ER of around 96 percent was posted each in CAR, MIMAROPA, Zamboanga Peninsula and SOCCSKSARGEN. The least ER was registered in CALABARZON at 91.8 percent. Meanwhile, employment rates of females were leading in Cagayan Valley and Central Visayas at 96.0 percent each. In contrast, ARMM and Central Luzon had the lowest ERs corresponding to 93.7 percent and 93.8 percent (Tables 3.2a and 3.2b).
27 2
Table 6.2aProportion of employed males in agriculture to total male employment, by region, Philippines, 2012-2016(in percent)
Philippines 39.4 38.1 37.2 35.8 33.2
NCR 1.1 1.0 1.0 0.8 0.7CAR 51.2 49.9 52.7 50.8 46.5Ilocos Region 44.4 40.6 40.0 38.8 36.0Cagayan Valley 64.0 63.1 61.4 60.7 56.7Central Luzon 27.4 27.1 25.9 24.2 20.4CALABARZON 20.9 19.2 19.1 17.6 13.7MIMAROPA 59.7 57.9 55.1 52.7 51.8Bicol Region 49.4 48.1 46.9 45.5 44.4Western Visayas 46.6 45.4 45.9 45.1 41.5Central Visayas 35.3 34.5 33.2 32.4 32.5Eastern Visayas 56.4 55.4 59.0 54.6 48.1Zamboanga Peninsula 54.3 53.2 51.7 50.7 51.4Northern Mindanao 49.1 46.2 48.0 43.8 42.4Davao Region 46.2 44.7 43.7 41.4 42.1SOCCSKSARGEN 58.2 57.4 56.1 54.5 49.2Caraga 44.9 43.5 43.0 42.8 44.3ARMM 74.9 74.2 74.3 75.1 71.2Source: Philippine Statistics Authority (PSA)
2012 2013REGION 2015 20162014

GENDER-BASED INDICATORS OF LABOR AND EMPLOYMENT IN AGRICULTURE
PHILIPPINE STATISTICS AUTHORITY
Unemployment Unemployment by sex indicates the incapacity of the labor market to
absorb the available males and females to contribute to production
activities.
In 2016, the number of unemployed males totaled 1.49 million while the
unemployed females summed up to 0.88 million. Unemployment rates
(URs) figured to 5.6 percent for males and 5.2 percent for females.
For both sexes, more unemployed persons were reported in
CALABARZON at 0.29 million males and 0.15 million females and in NCR at
0.23 million males and 0.14 million females. The counts of unemployed
males in Western and Central Visayas and Central Luzon ranged from
0.10 million to 0.20 million. Bigger number of unemployed females was
also noted in Central Luzon at 0.11 million. CAR had the lowest
unemployment at 19,000 males and 16,000 females (Tables 4.1a and
4.1b).
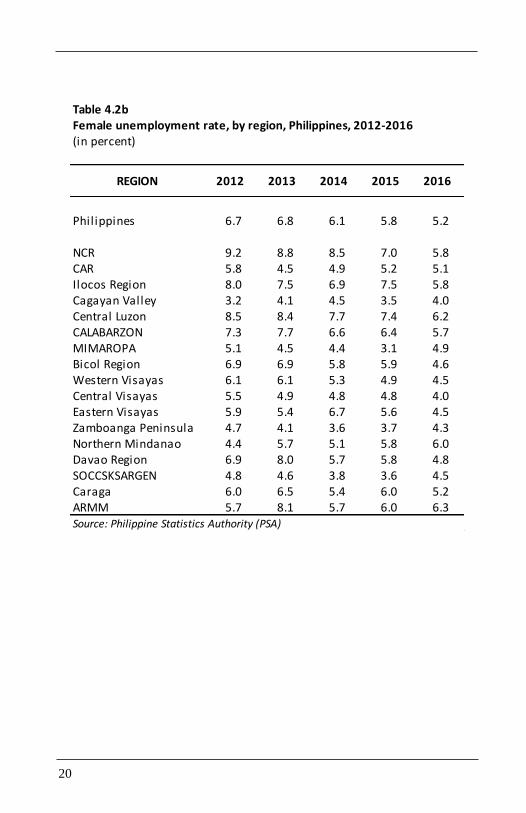
Unemployment rates (URs) for males were highest in CALABARZON at 8.2 percent and NCR at 7.3 percent. Female URs were leading in ARMM at 6.3 percent, Central Luzon at 6.2 percent and Northern Mindanao at 6.0 percent. The least unemployment rates were posted in Cagayan Valley at 2.6 percent for males and 4.0 percent for females. Similarly, UR of 4.0 percent for females was registered in Central Visayas. Male UR was, likewise, low in ARMM at 3.0 percent (Tables 4.2a and 4.2b).
Visible Underemployment Persons who are visibly underemployed are those who work for less than 40 hours during the reference week and are still wanting additional hours of work. Nationwide, there were 2.75 million males and 1.40 million females in 2016 who were considered as visibly underemployed persons. Visible underemployment rates were 11.0 percent for males and 8.7 percent for females (Tables 5.1a and 5.1b).
3 26
Table 6.1bNumber of employed females in agriculture, by region, Philippines, 2012-2016(in '000 persons)
Philippines 3,093 3,013 3,106 2,908 2,757
NCR 2 3 4 3 3 CAR 130 128 138 137 122 Ilocos Region 155 147 160 149 144 Cagayan Valley 248 249 236 238 211 Central Luzon 161 177 172 133 102 CALABARZON 151 134 166 138 105 MIMAROPA 168 150 158 161 142 Bicol Region 182 173 173 198 190 Western Visayas 287 278 325 304 299 Central Visayas 287 304 321 310 334 Eastern Visayas 159 168 115 94 142 Zamboanga Peninsula 189 191 171 168 181 Northern Mindanao 282 239 283 242 208 Davao Region 163 158 166 135 143 SOCCSKSARGEN 225 222 210 206 188 Caraga 92 100 98 94 90 ARMM 212 190 209 198 153 Source: Philippine Statistics Authority (PSA)
2012 2015 2016REGION 2013 2014

GENDER-BASED INDICATORS OF LABOR AND EMPLOYMENT IN AGRICULTURE
PHILIPPINE STATISTICS AUTHORITY
Among regions, Bicol Region posted the most number of visible
underemployed males at 0.31 million males in 2016. For the females, it
was CALABARZON at 0.16 million. About 0.20 million to 0.27 million
visibly underemployed males were recorded in Central Luzon,
CALABARZON, Western Visayas, Eastern Visayas and Northern Mindanao.
On the other hand, higher underemployment for females was noted in
Bicol Region at 0.14 million. CAR had the lowest number of
underemployed males at 47,000 while ARMM indicated the least count
for females at 27,000 (Tables 5.1a and 5.1b)
Visible underemployment rates in 2016 were highest in Bicol Region at
21.1 percent for males and 16.6 percent for females. This was followed by
Eastern Visayas at 19.7 percent for males and 16.3 percent for females.
NCR had the least underemployment rates at 3.3 percent for males and
3.2 percent for females (Tables 5.2a and 5.2b).
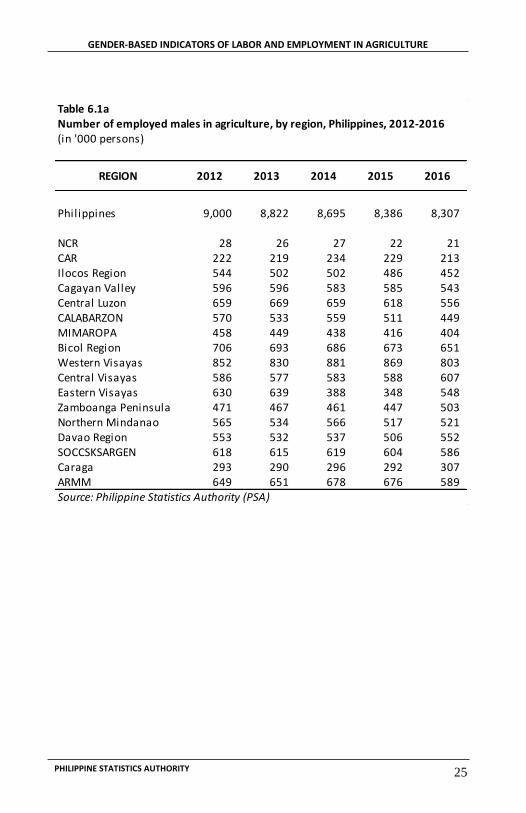
Employment in Agriculture Information on the employment of male and female agricultural workers indicates gender differences in the use of agricultural labor. The country’s employed persons in agriculture numbered 8.31 million males and 2.76 million females in 2016 (Tables 6.1a and 6.1b). By region, Western Visayas had the most number of male agricultural workers at 0.80 million and Central Visayas recorded the biggest number of female agricultural workers at 0.33 million. About half a million males were employed in agriculture in Cagayan Valley, Central Luzon, Eastern Visayas, Zamboanga Peninsula, Northern Mindanao, Davao Region, SOCCSKSARGEN and ARMM. Female agricultural workers were also high in number in Cagayan Valley at 0.21 million, Western Visayas at 0.30 million and Northern Mindanao at 0.21 million. NCR accounted for the least number of employment in agriculture at 21,000 males and 3,000 females. Fewer counts of employed persons were also registered in CAR at 0.21 million males and in Caraga at 90,000 females.
25 4
Table 6.1aNumber of employed males in agriculture, by region, Philippines, 2012-2016(in '000 persons)
Philippines 9,000 8,822 8,695 8,386 8,307
NCR 28 26 27 22 21 CAR 222 219 234 229 213 Ilocos Region 544 502 502 486 452 Cagayan Valley 596 596 583 585 543 Central Luzon 659 669 659 618 556 CALABARZON 570 533 559 511 449 MIMAROPA 458 449 438 416 404 Bicol Region 706 693 686 673 651 Western Visayas 852 830 881 869 803 Central Visayas 586 577 583 588 607 Eastern Visayas 630 639 388 348 548 Zamboanga Peninsula 471 467 461 447 503 Northern Mindanao 565 534 566 517 521 Davao Region 553 532 537 506 552 SOCCSKSARGEN 618 615 619 604 586 Caraga 293 290 296 292 307 ARMM 649 651 678 676 589 Source: Philippine Statistics Authority (PSA)
2012 20162014REGION 20152013

GENDER-BASED INDICATORS OF LABOR AND EMPLOYMENT IN AGRICULTURE
PHILIPPINE STATISTICS AUTHORITY
Countrywide, the male agricultural workers comprised 33.2 percent of the total male employment in 2016. In the same year, the females employed in agriculture shared 17.3 percent of the total female employment. At the regional level, ARMM had 71.2 percent of the region’s total male employment who were working in agriculture. Likewise, the female agricultural workers accounted for 48.7 percent of the region’s total female employment. The shares of the male agricultural employment were also biggest in Cagayan Valley at 56.7 percent and in Zamboanga Peninsula at 51.4 percent. Higher proportions of employed females in the agricultural sector were noted in CAR at 39.8 percent and Cagayan Valley at 40.2 percent. NCR recorded the least proportions for both sexes at 0.7 percent for males and 0.1 percent for females. In CALABARZON and Central Luzon, the proportions of male agricultural employment were also lower at 13.7 percent and 20.4 percent, respectively. On the other hand, the female agricultural workers shared 4.4 percent in CALABARZON and 6.2 percent in Central Luzon (Tables 6.2a and 6.2b).
Agricultural Wage Rates
Agricultural wage rate is an indicator of progress and welfare of
agricultural workers. It tracks the rate of payment received by workers on
the basis of some units of payment for services rendered in farm
operations. Sex-disaggregated information on wage rates indicates the
wage differential between male and female workers in agriculture.
At the national level, the daily nominal wage rate received by male
agricultural workers in 2016 amounted to P278.23. This was
P17.45 higher than was paid to female agricultural workers at P260.78. In
real terms, the agricultural wage rate of the males averaged
P193.22 per day while that of the females averaged P181.10. Wage
differential was P12.12 in favor of males.
5 24
Table 5.2b
Female visible underemployment rate, by region, Philippines, 2012-2016
(in percent)
Philippines 10.3 9.7 9.7 9.4 8.7
NCR 5.7 4.6 4.5 4.2 3.2
CAR 7.9 8.4 8.1 10.1 11.4
Ilocos Region 10.8 11.3 9.4 10.8 10.9
Cagayan Valley 8.1 8.6 7.6 6.5 8.2
Central Luzon 6.7 6.6 6.5 6.9 7.6
CALABARZON 8.1 7.9 8.8 8.1 6.6
MIMAROPA 13.7 13.5 12.1 12.8 11.3
Bicol Region 17.9 18.9 17.5 16.6 16.6
Western Visayas 11.5 11.6 13.0 11.0 9.7
Central Visayas 10.3 6.9 9.4 8.8 6.7
Eastern Visayas 12.3 14.0 17.1 16.8 16.3
Zamboanga Peninsula 17.2 11.6 10.4 9.0 9.6
Northern Mindanao 17.5 14.4 14.3 15.5 14.5
Davao Region 8.2 8.0 8.4 8.0 6.4
SOCCSKSARGEN 13.3 12.9 10.5 11.3 11.2
Caraga 10.6 13.0 12.6 11.2 12.4
ARMM 10.9 9.1 9.7 9.7 8.6
Source: Philippine Statistics Authority (PSA)
20132012REGION 201620152014
GENDER-BASED INDICATORS OF LABOR AND EMPLOYMENT IN AGRICULTURE
PHILIPPINE STATISTICS AUTHORITY
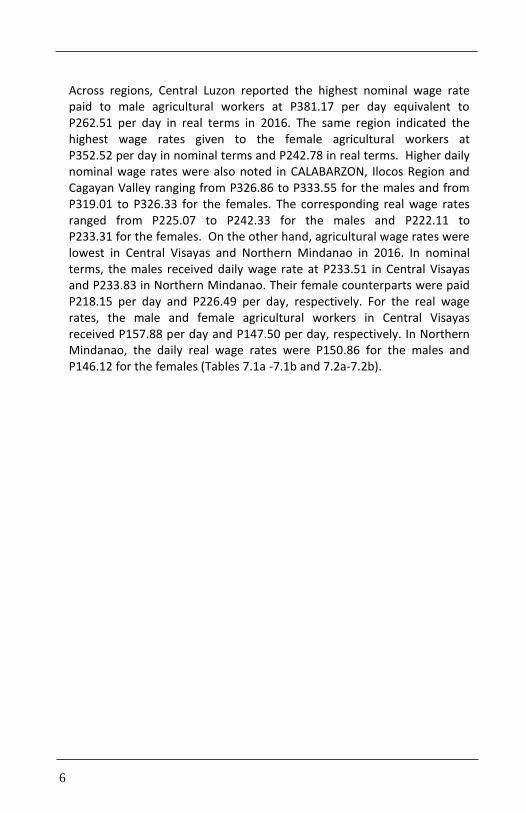
Across regions, Central Luzon reported the highest nominal wage rate paid to male agricultural workers at P381.17 per day equivalent to P262.51 per day in real terms in 2016. The same region indicated the highest wage rates given to the female agricultural workers at P352.52 per day in nominal terms and P242.78 in real terms. Higher daily nominal wage rates were also noted in CALABARZON, Ilocos Region and Cagayan Valley ranging from P326.86 to P333.55 for the males and from P319.01 to P326.33 for the females. The corresponding real wage rates ranged from P225.07 to P242.33 for the males and P222.11 to P233.31 for the females. On the other hand, agricultural wage rates were lowest in Central Visayas and Northern Mindanao in 2016. In nominal terms, the males received daily wage rate at P233.51 in Central Visayas and P233.83 in Northern Mindanao. Their female counterparts were paid P218.15 per day and P226.49 per day, respectively. For the real wage rates, the male and female agricultural workers in Central Visayas received P157.88 per day and P147.50 per day, respectively. In Northern Mindanao, the daily real wage rates were P150.86 for the males and P146.12 for the females (Tables 7.1a -7.1b and 7.2a-7.2b).
23 6
Table 5.2a
Male visible underemployment rate, by region, Philippines, 2012-2016
(in percent)
Philippines 13.0 12.4 12.4 11.9 11.0
NCR 5.5 4.5 4.6 4.1 3.3
CAR 7.9 7.5 8.1 9.5 10.2
Ilocos Region 12.1 13.1 10.9 11.5 11.1
Cagayan Valley 8.5 9.5 9.4 8.9 8.5
Central Luzon 8.0 7.5 7.1 7.3 7.4
CALABARZON 10.6 10.2 11.5 10.2 8.3
MIMAROPA 17.2 17.5 15.5 15.7 15.0
Bicol Region 24.2 26.1 23.8 21.8 21.1
Western Visayas 17.1 16.6 15.7 15.0 12.2
Central Visayas 12.1 8.7 11.3 10.5 9.0
Eastern Visayas 18.1 17.8 23.1 21.5 19.7
Zamboanga Peninsula 20.4 14.8 17.2 15.4 14.7
Northern Mindanao 19.1 18.1 16.9 16.9 17.4
Davao Region 12.2 12.0 13.0 12.3 8.5
SOCCSKSARGEN 15.8 15.2 14.9 15.9 16.1
Caraga 16.4 18.4 16.1 18.5 19.2
ARMM 8.2 8.2 8.0 7.6 7.7
Source: Philippine Statistics Authority (PSA)
20132012REGION 201620152014

GENDER-BASED INDICATORS OF LABOR AND EMPLOYMENT IN AGRICULTURE
PHILIPPINE STATISTICS AUTHORITY
7 22
Table 5.1bNumber of visibly underemployed females, by region, Philippines, 2012-2016(in '000 persons)
Philippines 1,525 1,445 1,478 1,441 1,396
NCR 112 94 94 89 74 CAR 23 25 25 31 35 Ilocos Region 74 81 71 82 80 Cagayan Valley 42 46 41 36 43 Central Luzon 99 100 102 108 127 CALABARZON 164 163 192 177 158 MIMAROPA 66 62 60 65 53 Bicol Region 150 161 148 148 144 Western Visayas 135 137 164 139 124 Central Visayas 130 89 128 123 91 Eastern Visayas 80 95 66 63 106 Zamboanga Peninsula 90 60 53 45 54 Northern Mindanao 141 112 119 125 112 Davao Region 55 53 60 56 45 SOCCSKSARGEN 83 80 66 73 74 Caraga 41 54 53 46 49 ARMM 39 32 37 35 27 Source: Philippine Statistics Authority (PSA)
REGION 201520132012 2014 2016
Table 1.1a
Total male household population 15 years old and over by region,Philippines, 2012-2016(in '000 persons)
Philippines 31,369 31,974 31,905 32,417 34,184
NCR 3,806 3,868 3,923 3,953 4,273CAR 576 586 598 609 622Ilocos Region 1,715 1,748 1,785 1,809 1,729Cagayan Valley 1,167 1,185 1,199 1,218 1,208Central Luzon 3,404 3,479 3,534 3,600 3,758CALABARZON 3,940 4,017 4,118 4,190 4,653MIMAROPA 971 996 1,021 1,047 1,023Bicol Region 1,919 1,956 1,989 2,024 1,983Western Visayas 2,543 2,586 2,647 2,691 2,650Central Visayas 2,366 2,408 2,451 2,505 2,532Eastern Visayas 1,487 1,518 868 868 1,541Zamboanga Peninsula 1,103 1,127 1,146 1,166 1,275Northern Mindanao 1,478 1,505 1,532 1,564 1,613Davao Region 1,555 1,585 1,610 1,629 1,720SOCCSKSARGEN 1,358 1,387 1,417 1,442 1,555Caraga 866 884 899 913 926ARMM 1,115 1,138 1,168 1,189 1,122Source: Philippine Statistics Authority (PSA)
2013 2014 2016REGION 20152012

GENDER-BASED INDICATORS OF LABOR AND EMPLOYMENT IN AGRICULTURE
PHILIPPINE STATISTICS AUTHORITY
21 8
Table 1.1b Total female household population 15 years old and over by region,Philippines, 2012-2016(in '000 persons)
Philippines 31,616 32,199 32,128 32,519 34,127
NCR 4,163 4,212 4,272 4,297 4,646CAR 552 562 573 579 588Ilocos Region 1,699 1,728 1,765 1,778 1,688Cagayan Valley 1,076 1,089 1,101 1,114 1,119Central Luzon 3,506 3,568 3,630 3,681 3,797CALABARZON 4,160 4,252 4,344 4,386 4,886MIMAROPA 932 954 981 997 974Bicol Region 1,842 1,883 1,917 1,948 1,921Western Visayas 2,524 2,570 2,623 2,668 2,598Central Visayas 2,429 2,477 2,527 2,569 2,552Eastern Visayas 1,455 1,479 841 832 1,465Zamboanga Peninsula 1,072 1,092 1,110 1,128 1,228Northern Mindanao 1,466 1,497 1,520 1,545 1,559Davao Region 1,486 1,512 1,533 1,553 1,635SOCCSKSARGEN 1,287 1,314 1,334 1,356 1,454Caraga 831 848 863 878 872ARMM 1,136 1,162 1,194 1,209 1,144Annualized data for 2016 was computed as the average of the four survey
rounds using the January 2016 round that was based on the 2010 CPH population projections
Source: Philippine Statistics Authority (PSA)
REGION 20152012 20142013 2016
Table 5.1aNumber of visibly underemployed males, by region, Philippines, 2012-2016(in '000 persons)
Philippines 2,965 2,876 2,886 2,782 2,753
NCR 139 116 121 109 97 CAR 34 33 36 43 47 Ilocos Region 149 162 137 144 140 Cagayan Valley 79 90 89 86 81 Central Luzon 192 186 181 186 201 CALABARZON 289 284 337 296 272 MIMAROPA 132 136 123 124 117 Bicol Region 345 376 348 323 309 Western Visayas 313 304 302 289 236 Central Visayas 201 145 198 190 169 Eastern Visayas 202 205 152 137 225 Zamboanga Peninsula 177 130 153 136 144 Northern Mindanao 220 209 200 199 214 Davao Region 147 143 160 150 112 SOCCSKSARGEN 167 163 165 176 192 Caraga 107 123 111 126 133 ARMM 71 72 73 68 64 Source: Philippine Statistics Authority (PSA)
2012 2014 2016REGION 20152013

GENDER-BASED INDICATORS OF LABOR AND EMPLOYMENT IN AGRICULTURE
PHILIPPINE STATISTICS AUTHORITY
9 20
Table 2.1aMale labor force, by region, Philippines, 2012-2016(in '000 persons)
Philippines 24,616 24,968 25,093 25,062 26,521
NCR 2,863 2,897 2,992 2,936 3,172 CAR 458 460 469 472 478 Ilocos Region 1,337 1,355 1,378 1,377 1,343 Cagayan Valley 955 969 981 992 983 Central Luzon 2,651 2,709 2,776 2,779 2,921 CALABARZON 3,034 3,100 3,219 3,205 3,574 MIMAROPA 796 807 831 817 810 Bicol Region 1,515 1,539 1,555 1,566 1,535 Western Visayas 1,965 1,974 2,044 2,044 2,037 Central Visayas 1,811 1,805 1,878 1,949 1,981 Eastern Visayas 1,175 1,218 694 673 1,193 Zamboanga Peninsula 896 906 923 914 1,013 Northern Mindanao 1,210 1,226 1,251 1,248 1,291 Davao Region 1,267 1,273 1,300 1,297 1,371 SOCCSKSARGEN 1,105 1,119 1,142 1,149 1,241 Caraga 690 708 725 722 727 ARMM 889 905 934 922 852 Source: Philippine Statistics Authority (PSA)
201620152013 2014REGION 2012
Table 4.2bFemale unemployment rate, by region, Philippines, 2012-2016(in percent)
Philippines 6.7 6.8 6.1 5.8 5.2
NCR 9.2 8.8 8.5 7.0 5.8CAR 5.8 4.5 4.9 5.2 5.1Ilocos Region 8.0 7.5 6.9 7.5 5.8Cagayan Valley 3.2 4.1 4.5 3.5 4.0Central Luzon 8.5 8.4 7.7 7.4 6.2CALABARZON 7.3 7.7 6.6 6.4 5.7MIMAROPA 5.1 4.5 4.4 3.1 4.9Bicol Region 6.9 6.9 5.8 5.9 4.6Western Visayas 6.1 6.1 5.3 4.9 4.5Central Visayas 5.5 4.9 4.8 4.8 4.0Eastern Visayas 5.9 5.4 6.7 5.6 4.5Zamboanga Peninsula 4.7 4.1 3.6 3.7 4.3Northern Mindanao 4.4 5.7 5.1 5.8 6.0Davao Region 6.9 8.0 5.7 5.8 4.8SOCCSKSARGEN 4.8 4.6 3.8 3.6 4.5Caraga 6.0 6.5 5.4 6.0 5.2ARMM 5.7 8.1 5.7 6.0 6.3Source: Philippine Statistics Authority (PSA)
2012 2013 2014 2016REGION 2015

GENDER-BASED INDICATORS OF LABOR AND EMPLOYMENT IN AGRICULTURE
PHILIPPINE STATISTICS AUTHORITY
19 10
Table 2.1bFemale labor force, by region, Philippines, 2012-2016(in '000 persons)
Philippines 15,810 16,055 16,286 16,280 16,840
NCR 2,162 2,233 2,289 2,258 2,441 CAR 312 311 324 324 322 Ilocos Region 751 775 812 822 776 Cagayan Valley 535 555 561 570 546 Central Luzon 1,610 1,661 1,708 1,697 1,772 CALABARZON 2,184 2,231 2,323 2,324 2,551 MIMAROPA 505 486 520 523 495 Bicol Region 900 913 899 950 908 Western Visayas 1,255 1,261 1,334 1,334 1,332 Central Visayas 1,339 1,355 1,425 1,469 1,419 Eastern Visayas 694 717 415 396 681 Zamboanga Peninsula 548 539 528 520 587 Northern Mindanao 842 825 881 859 825 Davao Region 726 716 760 745 741 SOCCSKSARGEN 651 650 655 670 692 Caraga 414 444 444 436 417 ARMM 383 383 406 382 335 Source: Philippine Statistics Authority (PSA)
2016201520142013REGION 2012
Table 4.2aMale unemployment rate, by region, Philippines, 2012-2016(in percent)
Philippines 7.2 7.3 6.9 6.6 5.6
NCR 11.7 11.4 11.5 9.6 7.3CAR 5.2 4.6 5.3 4.7 3.9Ilocos Region 8.4 8.7 8.9 9.0 6.4Cagayan Valley 2.5 2.6 3.2 3.0 2.6Central Luzon 9.3 8.9 8.4 8.1 6.8CALABARZON 10.1 10.3 9.1 9.2 8.2MIMAROPA 3.6 3.8 4.5 3.4 3.6Bicol Region 5.7 6.3 5.9 5.5 4.6Western Visayas 6.9 7.4 6.1 5.8 5.0Central Visayas 8.3 7.3 6.4 6.8 5.6Eastern Visayas 4.8 5.3 5.2 5.3 4.4Zamboanga Peninsula 3.2 3.1 3.5 3.4 3.5Northern Mindanao 4.8 5.7 5.7 5.4 4.8Davao Region 5.4 6.4 5.5 5.8 4.3SOCCSKSARGEN 3.9 4.3 3.3 3.5 3.9Caraga 5.5 5.6 5.1 5.5 4.8ARMM 2.5 3.1 2.5 2.4 3.0Source: Philippine Statistics Authority (PSA)
2014 2016REGION 2012 20152013

GENDER-BASED INDICATORS OF LABOR AND EMPLOYMENT IN AGRICULTURE
PHILIPPINE STATISTICS AUTHORITY
11 18
Table 2.2a
Male labor force participation rate, by region, Philippines, 2012-2016
(in percent)
Philippines 78.5 78.1 78.6 77.3 77.6
NCR 75.2 74.9 76.3 74.3 74.2
CAR 79.5 78.5 78.4 77.5 76.9
Ilocos Region 77.9 77.5 77.2 76.1 77.6
Cagayan Valley 81.9 81.8 81.8 81.4 81.4
Central Luzon 77.9 77.9 78.6 77.2 77.7
CALABARZON 77.0 77.2 78.2 76.5 76.8
MIMAROPA 82.0 81.0 81.4 78.0 79.2
Bicol Region 78.9 78.7 78.2 77.4 77.4
Western Visayas 77.3 76.3 77.2 76.0 76.9
Central Visayas 76.6 75.0 76.6 77.8 78.2
Eastern Visayas 79.0 80.2 80.0 77.5 77.4
Zamboanga Peninsula 81.3 80.4 80.5 78.4 79.4
Northern Mindanao 81.8 81.5 81.7 79.8 80.0
Davao Region 81.5 80.3 80.7 79.6 79.7
SOCCSKSARGEN 81.4 80.7 80.6 79.7 79.8
Caraga 79.7 80.1 80.6 79.1 78.5
ARMM 79.7 79.5 80.0 77.5 76.0
Source: Philippine Statistics Authority (PSA)
REGION 20132012 20162014 2015
Table 4.1bNumber of unemployed females, by region, Philippines, 2012-2016(in '000 persons)
Philippines 1,059 1,087 1,000 945 877
NCR 199 197 195 158 141CAR 18 14 16 17 16Ilocos Region 60 58 56 62 45Cagayan Valley 17 23 25 20 22Central Luzon 137 139 132 125 110CALABARZON 159 172 153 148 147MIMAROPA 26 22 23 16 24Bicol Region 62 63 52 56 42Western Visayas 76 77 71 65 59Central Visayas 74 67 69 70 56Eastern Visayas 41 39 28 22 31Zamboanga Peninsula 26 22 19 19 25Northern Mindanao 37 47 45 50 49Davao Region 50 57 43 43 35SOCCSKSARGEN 31 30 25 24 31Caraga 25 29 24 26 22ARMM 22 31 23 23 21Source: Philippine Statistics Authority (PSA)
REGION 20162015201420132012

GENDER-BASED INDICATORS OF LABOR AND EMPLOYMENT IN AGRICULTURE
PHILIPPINE STATISTICS AUTHORITY
17 12
Table 2.2b
Female labor force participation rate, by region, Philippines, 2012-2016
(in percent)
Philippines 50.0 49.9 50.7 50.1 49.3
NCR 51.9 53.0 53.6 52.5 52.5
CAR 56.4 55.3 56.5 56.0 54.7
Ilocos Region 44.2 44.8 46.0 46.2 46.0
Cagayan Valley 49.7 51.0 51.0 51.2 48.8
Central Luzon 45.9 46.6 47.1 46.1 46.7
CALABARZON 52.5 52.5 53.5 53.0 52.2
MIMAROPA 54.2 50.9 53.0 52.5 50.8
Bicol Region 48.9 48.5 46.9 48.8 47.3
Western Visayas 49.7 49.1 50.9 50.0 51.3
Central Visayas 55.1 54.7 56.4 57.2 55.6
Eastern Visayas 47.7 48.5 49.3 47.6 46.5
Zamboanga Peninsula 51.1 49.4 47.6 46.1 47.8
Northern Mindanao 57.5 55.1 58.0 55.6 52.9
Davao Region 48.9 47.4 46.6 48.0 45.3
SOCCSKSARGEN 50.5 49.5 49.1 49.4 47.6
Caraga 49.8 52.4 51.4 49.7 47.8
ARMM 33.7 33.0 34.0 31.6 29.2
Source: Philippine Statistics Authority (PSA)
REGION 20132012 20162014 2015
Table 4.1aNumber of unemployed males, by region, Philippines, 2012-2016(in '000 persons)
Philippines 1,767 1,818 1,728 1,656 1,486
NCR 336 330 343 283 233 CAR 24 21 25 22 19 Ilocos Region 112 118 123 124 87 Cagayan Valley 24 25 31 30 26 Central Luzon 247 240 232 225 200 CALABARZON 306 318 292 296 291 MIMAROPA 29 31 37 28 29 Bicol Region 86 97 91 86 71 Western Visayas 136 147 124 119 102 Central Visayas 150 132 121 133 111 Eastern Visayas 56 64 36 36 53 Zamboanga Peninsula 29 28 32 31 35 Northern Mindanao 59 70 71 67 62 Davao Region 69 82 72 75 60 SOCCSKSARGEN 43 48 38 40 49 Caraga 38 40 37 40 35 ARMM 22 28 23 22 26 Source: Philippine Statistics Authority (PSA)
20132012REGION 201620152014

GENDER-BASED INDICATORS OF LABOR AND EMPLOYMENT IN AGRICULTURE
PHILIPPINE STATISTICS AUTHORITY
13 16
Table 3.2b
Female employment rate, by region, Philippines, 2012-2016
(in percent)
Philippines 93.3 93.2 93.9 94.2 94.8
NCR 90.8 91.2 91.5 93.0 94.2
CAR 94.2 95.4 95.1 95.1 94.9
Ilocos Region 91.9 92.5 93.1 92.5 94.2
Cagayan Valley 96.8 95.8 95.5 96.5 96.0
Central Luzon 91.5 91.6 92.2 92.6 93.8
CALABARZON 92.7 92.3 93.4 93.6 94.3
MIMAROPA 95.0 95.5 95.6 96.9 95.1
Bicol Region 93.2 93.1 94.2 94.0 95.4
Western Visayas 94.0 93.9 94.7 95.1 95.5Central Visayas 94.5 95.0 95.2 95.2 96.0
Eastern Visayas 93.9 94.5 93.3 94.4 95.5
Zamboanga Peninsula 95.3 96.0 96.4 96.3 95.7
Northern Mindanao 95.7 94.3 94.8 94.2 94.0
Davao Region 93.3 92.1 94.3 94.2 95.2
SOCCSKSARGEN 95.2 95.4 96.3 96.9 95.5
Caraga 94.0 93.5 94.6 94.0 94.8
ARMM 94.3 91.9 94.3 94.0 93.7
Source: Philippine Statistics Authority (PSA)
20132012REGION 201620152014
Table 3.1aNumber of employed males, by region, Philippines, 2012-2016(in '000 persons)
Philippines 22,849 23,150 23,365 23,406 25,035
NCR 2,527 2,567 2,649 2,653 2,939 CAR 434 439 444 451 460 Ilocos Region 1,225 1,237 1,255 1,254 1,256 Cagayan Valley 931 944 950 963 957 Central Luzon 2,404 2,469 2,543 2,554 2,722 CALABARZON 2,728 2,782 2,927 2,908 3,283 MIMAROPA 767 776 795 789 780 Bicol Region 1,428 1,442 1,464 1,480 1,464 Western Visayas 1,828 1,827 1,919 1,926 1,935 Central Visayas 1,661 1,673 1,758 1,816 1,870 Eastern Visayas 1,118 1,154 658 637 1,140 Zamboanga Peninsula 867 878 891 882 978 Northern Mindanao 1,151 1,156 1,180 1,180 1,229 Davao Region 1,198 1,191 1,229 1,223 1,311 SOCCSKSARGEN 1,062 1,071 1,104 1,109 1,192 Caraga 652 667 688 682 692 ARMM 867 877 912 900 826 Source: Philippine Statistics Authority (PSA)
2014 201620152012REGION 2013

GENDER-BASED INDICATORS OF LABOR AND EMPLOYMENT IN AGRICULTURE
PHILIPPINE STATISTICS AUTHORITY
15 14
Table 3.1bNumber of employed females, by region, Philippines, 2012-2016(in '000 persons)
Philippines 14,751 14,968 15,286 15,335 15,963
NCR 1,963 2,036 2,094 2,099 2,300 CAR 294 296 308 308 306 Ilocos Region 690 717 756 760 731 Cagayan Valley 518 532 536 550 525 Central Luzon 1,473 1,522 1,575 1,572 1,661 CALABARZON 2,024 2,060 2,170 2,176 2,404 MIMAROPA 480 465 497 507 471 Bicol Region 839 850 847 893 866 Western Visayas 1,180 1,183 1,263 1,269 1,273 Central Visayas 1,265 1,288 1,356 1,399 1,363 Eastern Visayas 652 678 387 374 650 Zamboanga Peninsula 522 517 509 501 562 Northern Mindanao 806 778 835 809 775 Davao Region 676 660 717 702 705 SOCCSKSARGEN 620 620 631 649 661 Caraga 389 415 420 410 395 ARMM 361 352 383 359 314 Source: Philippine Statistics Authority (PSA)
2014 20162013REGION 20152012
Table 3.2a
Male employment rate, by region, Philippines, 2012-2016
(in percent)
Philippines 92.8 92.7 93.1 93.4 94.4
NCR 88.3 88.6 88.5 90.4 92.7
CAR 94.8 95.5 94.7 95.6 96.1
Ilocos Region 91.6 91.3 91.1 91.1 93.6
Cagayan Valley 97.5 97.4 96.8 97.1 97.4
Central Luzon 90.7 91.1 91.6 91.9 93.2
CALABARZON 89.9 89.8 90.9 90.7 91.8
MIMAROPA 96.4 96.2 95.7 96.6 96.4
Bicol Region 94.3 93.7 94.1 94.5 95.4
Western Visayas 93.0 92.6 93.9 94.2 95.0
Central Visayas 91.7 92.7 93.6 93.2 94.4
Eastern Visayas 95.1 94.8 94.8 94.7 95.6
Zamboanga Peninsula 96.8 96.9 96.5 96.5 96.5
Northern Mindanao 95.1 94.3 94.3 94.6 95.2
Davao Region 94.6 93.6 94.5 94.3 95.7
SOCCSKSARGEN 96.1 95.7 96.7 96.5 96.1
Caraga 94.5 94.3 94.9 94.5 95.2
ARMM 97.5 96.9 97.6 97.6 97.0
Source: Philippine Statistics Authority (PSA)
20132012REGION 201620152014

GENDER-BASED INDICATORS OF LABOR AND EMPLOYMENT IN AGRICULTURE
PHILIPPINE STATISTICS AUTHORITY
13 16
Table 3.2b
Female employment rate, by region, Philippines, 2012-2016
(in percent)
Philippines 93.3 93.2 93.9 94.2 94.8
NCR 90.8 91.2 91.5 93.0 94.2
CAR 94.2 95.4 95.1 95.1 94.9
Ilocos Region 91.9 92.5 93.1 92.5 94.2
Cagayan Valley 96.8 95.8 95.5 96.5 96.0
Central Luzon 91.5 91.6 92.2 92.6 93.8
CALABARZON 92.7 92.3 93.4 93.6 94.3
MIMAROPA 95.0 95.5 95.6 96.9 95.1
Bicol Region 93.2 93.1 94.2 94.0 95.4
Western Visayas 94.0 93.9 94.7 95.1 95.5Central Visayas 94.5 95.0 95.2 95.2 96.0
Eastern Visayas 93.9 94.5 93.3 94.4 95.5
Zamboanga Peninsula 95.3 96.0 96.4 96.3 95.7
Northern Mindanao 95.7 94.3 94.8 94.2 94.0
Davao Region 93.3 92.1 94.3 94.2 95.2
SOCCSKSARGEN 95.2 95.4 96.3 96.9 95.5
Caraga 94.0 93.5 94.6 94.0 94.8
ARMM 94.3 91.9 94.3 94.0 93.7
Source: Philippine Statistics Authority (PSA)
20132012REGION 201620152014
Table 3.1aNumber of employed males, by region, Philippines, 2012-2016(in '000 persons)
Philippines 22,849 23,150 23,365 23,406 25,035
NCR 2,527 2,567 2,649 2,653 2,939 CAR 434 439 444 451 460 Ilocos Region 1,225 1,237 1,255 1,254 1,256 Cagayan Valley 931 944 950 963 957 Central Luzon 2,404 2,469 2,543 2,554 2,722 CALABARZON 2,728 2,782 2,927 2,908 3,283 MIMAROPA 767 776 795 789 780 Bicol Region 1,428 1,442 1,464 1,480 1,464 Western Visayas 1,828 1,827 1,919 1,926 1,935 Central Visayas 1,661 1,673 1,758 1,816 1,870 Eastern Visayas 1,118 1,154 658 637 1,140 Zamboanga Peninsula 867 878 891 882 978 Northern Mindanao 1,151 1,156 1,180 1,180 1,229 Davao Region 1,198 1,191 1,229 1,223 1,311 SOCCSKSARGEN 1,062 1,071 1,104 1,109 1,192 Caraga 652 667 688 682 692 ARMM 867 877 912 900 826 Source: Philippine Statistics Authority (PSA)
2014 201620152012REGION 2013

GENDER-BASED INDICATORS OF LABOR AND EMPLOYMENT IN AGRICULTURE
PHILIPPINE STATISTICS AUTHORITY
17 12
Table 2.2b
Female labor force participation rate, by region, Philippines, 2012-2016
(in percent)
Philippines 50.0 49.9 50.7 50.1 49.3
NCR 51.9 53.0 53.6 52.5 52.5
CAR 56.4 55.3 56.5 56.0 54.7
Ilocos Region 44.2 44.8 46.0 46.2 46.0
Cagayan Valley 49.7 51.0 51.0 51.2 48.8
Central Luzon 45.9 46.6 47.1 46.1 46.7
CALABARZON 52.5 52.5 53.5 53.0 52.2
MIMAROPA 54.2 50.9 53.0 52.5 50.8
Bicol Region 48.9 48.5 46.9 48.8 47.3
Western Visayas 49.7 49.1 50.9 50.0 51.3
Central Visayas 55.1 54.7 56.4 57.2 55.6
Eastern Visayas 47.7 48.5 49.3 47.6 46.5
Zamboanga Peninsula 51.1 49.4 47.6 46.1 47.8
Northern Mindanao 57.5 55.1 58.0 55.6 52.9
Davao Region 48.9 47.4 46.6 48.0 45.3
SOCCSKSARGEN 50.5 49.5 49.1 49.4 47.6
Caraga 49.8 52.4 51.4 49.7 47.8
ARMM 33.7 33.0 34.0 31.6 29.2
Source: Philippine Statistics Authority (PSA)
REGION 20132012 20162014 2015
Table 4.1aNumber of unemployed males, by region, Philippines, 2012-2016(in '000 persons)
Philippines 1,767 1,818 1,728 1,656 1,486
NCR 336 330 343 283 233 CAR 24 21 25 22 19 Ilocos Region 112 118 123 124 87 Cagayan Valley 24 25 31 30 26 Central Luzon 247 240 232 225 200 CALABARZON 306 318 292 296 291 MIMAROPA 29 31 37 28 29 Bicol Region 86 97 91 86 71 Western Visayas 136 147 124 119 102 Central Visayas 150 132 121 133 111 Eastern Visayas 56 64 36 36 53 Zamboanga Peninsula 29 28 32 31 35 Northern Mindanao 59 70 71 67 62 Davao Region 69 82 72 75 60 SOCCSKSARGEN 43 48 38 40 49 Caraga 38 40 37 40 35 ARMM 22 28 23 22 26 Source: Philippine Statistics Authority (PSA)
20132012REGION 201620152014

GENDER-BASED INDICATORS OF LABOR AND EMPLOYMENT IN AGRICULTURE
PHILIPPINE STATISTICS AUTHORITY
11 18
Table 2.2a
Male labor force participation rate, by region, Philippines, 2012-2016
(in percent)
Philippines 78.5 78.1 78.6 77.3 77.6
NCR 75.2 74.9 76.3 74.3 74.2
CAR 79.5 78.5 78.4 77.5 76.9
Ilocos Region 77.9 77.5 77.2 76.1 77.6
Cagayan Valley 81.9 81.8 81.8 81.4 81.4
Central Luzon 77.9 77.9 78.6 77.2 77.7
CALABARZON 77.0 77.2 78.2 76.5 76.8
MIMAROPA 82.0 81.0 81.4 78.0 79.2
Bicol Region 78.9 78.7 78.2 77.4 77.4
Western Visayas 77.3 76.3 77.2 76.0 76.9
Central Visayas 76.6 75.0 76.6 77.8 78.2
Eastern Visayas 79.0 80.2 80.0 77.5 77.4
Zamboanga Peninsula 81.3 80.4 80.5 78.4 79.4
Northern Mindanao 81.8 81.5 81.7 79.8 80.0
Davao Region 81.5 80.3 80.7 79.6 79.7
SOCCSKSARGEN 81.4 80.7 80.6 79.7 79.8
Caraga 79.7 80.1 80.6 79.1 78.5
ARMM 79.7 79.5 80.0 77.5 76.0
Source: Philippine Statistics Authority (PSA)
REGION 20132012 20162014 2015
Table 4.1bNumber of unemployed females, by region, Philippines, 2012-2016(in '000 persons)
Philippines 1,059 1,087 1,000 945 877
NCR 199 197 195 158 141CAR 18 14 16 17 16Ilocos Region 60 58 56 62 45Cagayan Valley 17 23 25 20 22Central Luzon 137 139 132 125 110CALABARZON 159 172 153 148 147MIMAROPA 26 22 23 16 24Bicol Region 62 63 52 56 42Western Visayas 76 77 71 65 59Central Visayas 74 67 69 70 56Eastern Visayas 41 39 28 22 31Zamboanga Peninsula 26 22 19 19 25Northern Mindanao 37 47 45 50 49Davao Region 50 57 43 43 35SOCCSKSARGEN 31 30 25 24 31Caraga 25 29 24 26 22ARMM 22 31 23 23 21Source: Philippine Statistics Authority (PSA)
REGION 20162015201420132012

GENDER-BASED INDICATORS OF LABOR AND EMPLOYMENT IN AGRICULTURE
PHILIPPINE STATISTICS AUTHORITY
19 10
Table 2.1bFemale labor force, by region, Philippines, 2012-2016(in '000 persons)
Philippines 15,810 16,055 16,286 16,280 16,840
NCR 2,162 2,233 2,289 2,258 2,441 CAR 312 311 324 324 322 Ilocos Region 751 775 812 822 776 Cagayan Valley 535 555 561 570 546 Central Luzon 1,610 1,661 1,708 1,697 1,772 CALABARZON 2,184 2,231 2,323 2,324 2,551 MIMAROPA 505 486 520 523 495 Bicol Region 900 913 899 950 908 Western Visayas 1,255 1,261 1,334 1,334 1,332 Central Visayas 1,339 1,355 1,425 1,469 1,419 Eastern Visayas 694 717 415 396 681 Zamboanga Peninsula 548 539 528 520 587 Northern Mindanao 842 825 881 859 825 Davao Region 726 716 760 745 741 SOCCSKSARGEN 651 650 655 670 692 Caraga 414 444 444 436 417 ARMM 383 383 406 382 335 Source: Philippine Statistics Authority (PSA)
2016201520142013REGION 2012
Table 4.2aMale unemployment rate, by region, Philippines, 2012-2016(in percent)
Philippines 7.2 7.3 6.9 6.6 5.6
NCR 11.7 11.4 11.5 9.6 7.3CAR 5.2 4.6 5.3 4.7 3.9Ilocos Region 8.4 8.7 8.9 9.0 6.4Cagayan Valley 2.5 2.6 3.2 3.0 2.6Central Luzon 9.3 8.9 8.4 8.1 6.8CALABARZON 10.1 10.3 9.1 9.2 8.2MIMAROPA 3.6 3.8 4.5 3.4 3.6Bicol Region 5.7 6.3 5.9 5.5 4.6Western Visayas 6.9 7.4 6.1 5.8 5.0Central Visayas 8.3 7.3 6.4 6.8 5.6Eastern Visayas 4.8 5.3 5.2 5.3 4.4Zamboanga Peninsula 3.2 3.1 3.5 3.4 3.5Northern Mindanao 4.8 5.7 5.7 5.4 4.8Davao Region 5.4 6.4 5.5 5.8 4.3SOCCSKSARGEN 3.9 4.3 3.3 3.5 3.9Caraga 5.5 5.6 5.1 5.5 4.8ARMM 2.5 3.1 2.5 2.4 3.0Source: Philippine Statistics Authority (PSA)
2014 2016REGION 2012 20152013
GENDER-BASED INDICATORS OF LABOR AND EMPLOYMENT IN AGRICULTURE
PHILIPPINE STATISTICS AUTHORITY
9 20
Table 2.1aMale labor force, by region, Philippines, 2012-2016(in '000 persons)
Philippines 24,616 24,968 25,093 25,062 26,521
NCR 2,863 2,897 2,992 2,936 3,172 CAR 458 460 469 472 478 Ilocos Region 1,337 1,355 1,378 1,377 1,343 Cagayan Valley 955 969 981 992 983 Central Luzon 2,651 2,709 2,776 2,779 2,921 CALABARZON 3,034 3,100 3,219 3,205 3,574 MIMAROPA 796 807 831 817 810 Bicol Region 1,515 1,539 1,555 1,566 1,535 Western Visayas 1,965 1,974 2,044 2,044 2,037 Central Visayas 1,811 1,805 1,878 1,949 1,981 Eastern Visayas 1,175 1,218 694 673 1,193 Zamboanga Peninsula 896 906 923 914 1,013 Northern Mindanao 1,210 1,226 1,251 1,248 1,291 Davao Region 1,267 1,273 1,300 1,297 1,371 SOCCSKSARGEN 1,105 1,119 1,142 1,149 1,241 Caraga 690 708 725 722 727 ARMM 889 905 934 922 852 Source: Philippine Statistics Authority (PSA)
201620152013 2014REGION 2012
Table 4.2bFemale unemployment rate, by region, Philippines, 2012-2016(in percent)
Philippines 6.7 6.8 6.1 5.8 5.2
NCR 9.2 8.8 8.5 7.0 5.8CAR 5.8 4.5 4.9 5.2 5.1Ilocos Region 8.0 7.5 6.9 7.5 5.8Cagayan Valley 3.2 4.1 4.5 3.5 4.0Central Luzon 8.5 8.4 7.7 7.4 6.2CALABARZON 7.3 7.7 6.6 6.4 5.7MIMAROPA 5.1 4.5 4.4 3.1 4.9Bicol Region 6.9 6.9 5.8 5.9 4.6Western Visayas 6.1 6.1 5.3 4.9 4.5Central Visayas 5.5 4.9 4.8 4.8 4.0Eastern Visayas 5.9 5.4 6.7 5.6 4.5Zamboanga Peninsula 4.7 4.1 3.6 3.7 4.3Northern Mindanao 4.4 5.7 5.1 5.8 6.0Davao Region 6.9 8.0 5.7 5.8 4.8SOCCSKSARGEN 4.8 4.6 3.8 3.6 4.5Caraga 6.0 6.5 5.4 6.0 5.2ARMM 5.7 8.1 5.7 6.0 6.3Source: Philippine Statistics Authority (PSA)
2012 2013 2014 2016REGION 2015

GENDER-BASED INDICATORS OF LABOR AND EMPLOYMENT IN AGRICULTURE
PHILIPPINE STATISTICS AUTHORITY
21 8
Table 1.1b Total female household population 15 years old and over by region,Philippines, 2012-2016(in '000 persons)
Philippines 31,616 32,199 32,128 32,519 34,127
NCR 4,163 4,212 4,272 4,297 4,646CAR 552 562 573 579 588Ilocos Region 1,699 1,728 1,765 1,778 1,688Cagayan Valley 1,076 1,089 1,101 1,114 1,119Central Luzon 3,506 3,568 3,630 3,681 3,797CALABARZON 4,160 4,252 4,344 4,386 4,886MIMAROPA 932 954 981 997 974Bicol Region 1,842 1,883 1,917 1,948 1,921Western Visayas 2,524 2,570 2,623 2,668 2,598Central Visayas 2,429 2,477 2,527 2,569 2,552Eastern Visayas 1,455 1,479 841 832 1,465Zamboanga Peninsula 1,072 1,092 1,110 1,128 1,228Northern Mindanao 1,466 1,497 1,520 1,545 1,559Davao Region 1,486 1,512 1,533 1,553 1,635SOCCSKSARGEN 1,287 1,314 1,334 1,356 1,454Caraga 831 848 863 878 872ARMM 1,136 1,162 1,194 1,209 1,144Annualized data for 2016 was computed as the average of the four survey
rounds using the January 2016 round that was based on the 2010 CPH population projections
Source: Philippine Statistics Authority (PSA)
REGION 20152012 20142013 2016
Table 5.1aNumber of visibly underemployed males, by region, Philippines, 2012-2016(in '000 persons)
Philippines 2,965 2,876 2,886 2,782 2,753
NCR 139 116 121 109 97 CAR 34 33 36 43 47 Ilocos Region 149 162 137 144 140 Cagayan Valley 79 90 89 86 81 Central Luzon 192 186 181 186 201 CALABARZON 289 284 337 296 272 MIMAROPA 132 136 123 124 117 Bicol Region 345 376 348 323 309 Western Visayas 313 304 302 289 236 Central Visayas 201 145 198 190 169 Eastern Visayas 202 205 152 137 225 Zamboanga Peninsula 177 130 153 136 144 Northern Mindanao 220 209 200 199 214 Davao Region 147 143 160 150 112 SOCCSKSARGEN 167 163 165 176 192 Caraga 107 123 111 126 133 ARMM 71 72 73 68 64 Source: Philippine Statistics Authority (PSA)
2012 2014 2016REGION 20152013

GENDER-BASED INDICATORS OF LABOR AND EMPLOYMENT IN AGRICULTURE
PHILIPPINE STATISTICS AUTHORITY
7 22
Table 5.1bNumber of visibly underemployed females, by region, Philippines, 2012-2016(in '000 persons)
Philippines 1,525 1,445 1,478 1,441 1,396
NCR 112 94 94 89 74 CAR 23 25 25 31 35 Ilocos Region 74 81 71 82 80 Cagayan Valley 42 46 41 36 43 Central Luzon 99 100 102 108 127 CALABARZON 164 163 192 177 158 MIMAROPA 66 62 60 65 53 Bicol Region 150 161 148 148 144 Western Visayas 135 137 164 139 124 Central Visayas 130 89 128 123 91 Eastern Visayas 80 95 66 63 106 Zamboanga Peninsula 90 60 53 45 54 Northern Mindanao 141 112 119 125 112 Davao Region 55 53 60 56 45 SOCCSKSARGEN 83 80 66 73 74 Caraga 41 54 53 46 49 ARMM 39 32 37 35 27 Source: Philippine Statistics Authority (PSA)
REGION 201520132012 2014 2016
Table 1.1a
Total male household population 15 years old and over by region,Philippines, 2012-2016(in '000 persons)
Philippines 31,369 31,974 31,905 32,417 34,184
NCR 3,806 3,868 3,923 3,953 4,273CAR 576 586 598 609 622Ilocos Region 1,715 1,748 1,785 1,809 1,729Cagayan Valley 1,167 1,185 1,199 1,218 1,208Central Luzon 3,404 3,479 3,534 3,600 3,758CALABARZON 3,940 4,017 4,118 4,190 4,653MIMAROPA 971 996 1,021 1,047 1,023Bicol Region 1,919 1,956 1,989 2,024 1,983Western Visayas 2,543 2,586 2,647 2,691 2,650Central Visayas 2,366 2,408 2,451 2,505 2,532Eastern Visayas 1,487 1,518 868 868 1,541Zamboanga Peninsula 1,103 1,127 1,146 1,166 1,275Northern Mindanao 1,478 1,505 1,532 1,564 1,613Davao Region 1,555 1,585 1,610 1,629 1,720SOCCSKSARGEN 1,358 1,387 1,417 1,442 1,555Caraga 866 884 899 913 926ARMM 1,115 1,138 1,168 1,189 1,122Source: Philippine Statistics Authority (PSA)
2013 2014 2016REGION 20152012

GENDER-BASED INDICATORS OF LABOR AND EMPLOYMENT IN AGRICULTURE
PHILIPPINE STATISTICS AUTHORITY
Across regions, Central Luzon reported the highest nominal wage rate paid to male agricultural workers at P381.17 per day equivalent to P262.51 per day in real terms in 2016. The same region indicated the highest wage rates given to the female agricultural workers at P352.52 per day in nominal terms and P242.78 in real terms. Higher daily nominal wage rates were also noted in CALABARZON, Ilocos Region and Cagayan Valley ranging from P326.86 to P333.55 for the males and from P319.01 to P326.33 for the females. The corresponding real wage rates ranged from P225.07 to P242.33 for the males and P222.11 to P233.31 for the females. On the other hand, agricultural wage rates were lowest in Central Visayas and Northern Mindanao in 2016. In nominal terms, the males received daily wage rate at P233.51 in Central Visayas and P233.83 in Northern Mindanao. Their female counterparts were paid P218.15 per day and P226.49 per day, respectively. For the real wage rates, the male and female agricultural workers in Central Visayas received P157.88 per day and P147.50 per day, respectively. In Northern Mindanao, the daily real wage rates were P150.86 for the males and P146.12 for the females (Tables 7.1a -7.1b and 7.2a-7.2b).
23 6
Table 5.2a
Male visible underemployment rate, by region, Philippines, 2012-2016
(in percent)
Philippines 13.0 12.4 12.4 11.9 11.0
NCR 5.5 4.5 4.6 4.1 3.3
CAR 7.9 7.5 8.1 9.5 10.2
Ilocos Region 12.1 13.1 10.9 11.5 11.1
Cagayan Valley 8.5 9.5 9.4 8.9 8.5
Central Luzon 8.0 7.5 7.1 7.3 7.4
CALABARZON 10.6 10.2 11.5 10.2 8.3
MIMAROPA 17.2 17.5 15.5 15.7 15.0
Bicol Region 24.2 26.1 23.8 21.8 21.1
Western Visayas 17.1 16.6 15.7 15.0 12.2
Central Visayas 12.1 8.7 11.3 10.5 9.0
Eastern Visayas 18.1 17.8 23.1 21.5 19.7
Zamboanga Peninsula 20.4 14.8 17.2 15.4 14.7
Northern Mindanao 19.1 18.1 16.9 16.9 17.4
Davao Region 12.2 12.0 13.0 12.3 8.5
SOCCSKSARGEN 15.8 15.2 14.9 15.9 16.1
Caraga 16.4 18.4 16.1 18.5 19.2
ARMM 8.2 8.2 8.0 7.6 7.7
Source: Philippine Statistics Authority (PSA)
20132012REGION 201620152014

GENDER-BASED INDICATORS OF LABOR AND EMPLOYMENT IN AGRICULTURE
PHILIPPINE STATISTICS AUTHORITY
Countrywide, the male agricultural workers comprised 33.2 percent of the total male employment in 2016. In the same year, the females employed in agriculture shared 17.3 percent of the total female employment. At the regional level, ARMM had 71.2 percent of the region’s total male employment who were working in agriculture. Likewise, the female agricultural workers accounted for 48.7 percent of the region’s total female employment. The shares of the male agricultural employment were also biggest in Cagayan Valley at 56.7 percent and in Zamboanga Peninsula at 51.4 percent. Higher proportions of employed females in the agricultural sector were noted in CAR at 39.8 percent and Cagayan Valley at 40.2 percent. NCR recorded the least proportions for both sexes at 0.7 percent for males and 0.1 percent for females. In CALABARZON and Central Luzon, the proportions of male agricultural employment were also lower at 13.7 percent and 20.4 percent, respectively. On the other hand, the female agricultural workers shared 4.4 percent in CALABARZON and 6.2 percent in Central Luzon (Tables 6.2a and 6.2b).
Agricultural Wage Rates
Agricultural wage rate is an indicator of progress and welfare of
agricultural workers. It tracks the rate of payment received by workers on
the basis of some units of payment for services rendered in farm
operations. Sex-disaggregated information on wage rates indicates the
wage differential between male and female workers in agriculture.
At the national level, the daily nominal wage rate received by male
agricultural workers in 2016 amounted to P278.23. This was
P17.45 higher than was paid to female agricultural workers at P260.78. In
real terms, the agricultural wage rate of the males averaged
P193.22 per day while that of the females averaged P181.10. Wage
differential was P12.12 in favor of males.
5 24
Table 5.2b
Female visible underemployment rate, by region, Philippines, 2012-2016
(in percent)
Philippines 10.3 9.7 9.7 9.4 8.7
NCR 5.7 4.6 4.5 4.2 3.2
CAR 7.9 8.4 8.1 10.1 11.4
Ilocos Region 10.8 11.3 9.4 10.8 10.9
Cagayan Valley 8.1 8.6 7.6 6.5 8.2
Central Luzon 6.7 6.6 6.5 6.9 7.6
CALABARZON 8.1 7.9 8.8 8.1 6.6
MIMAROPA 13.7 13.5 12.1 12.8 11.3
Bicol Region 17.9 18.9 17.5 16.6 16.6
Western Visayas 11.5 11.6 13.0 11.0 9.7
Central Visayas 10.3 6.9 9.4 8.8 6.7
Eastern Visayas 12.3 14.0 17.1 16.8 16.3
Zamboanga Peninsula 17.2 11.6 10.4 9.0 9.6
Northern Mindanao 17.5 14.4 14.3 15.5 14.5
Davao Region 8.2 8.0 8.4 8.0 6.4
SOCCSKSARGEN 13.3 12.9 10.5 11.3 11.2
Caraga 10.6 13.0 12.6 11.2 12.4
ARMM 10.9 9.1 9.7 9.7 8.6
Source: Philippine Statistics Authority (PSA)
20132012REGION 201620152014
GENDER-BASED INDICATORS OF LABOR AND EMPLOYMENT IN AGRICULTURE
PHILIPPINE STATISTICS AUTHORITY
Among regions, Bicol Region posted the most number of visible
underemployed males at 0.31 million males in 2016. For the females, it
was CALABARZON at 0.16 million. About 0.20 million to 0.27 million
visibly underemployed males were recorded in Central Luzon,
CALABARZON, Western Visayas, Eastern Visayas and Northern Mindanao.
On the other hand, higher underemployment for females was noted in
Bicol Region at 0.14 million. CAR had the lowest number of
underemployed males at 47,000 while ARMM indicated the least count
for females at 27,000 (Tables 5.1a and 5.1b)
Visible underemployment rates in 2016 were highest in Bicol Region at
21.1 percent for males and 16.6 percent for females. This was followed by
Eastern Visayas at 19.7 percent for males and 16.3 percent for females.
NCR had the least underemployment rates at 3.3 percent for males and
3.2 percent for females (Tables 5.2a and 5.2b).
Employment in Agriculture Information on the employment of male and female agricultural workers indicates gender differences in the use of agricultural labor. The country’s employed persons in agriculture numbered 8.31 million males and 2.76 million females in 2016 (Tables 6.1a and 6.1b). By region, Western Visayas had the most number of male agricultural workers at 0.80 million and Central Visayas recorded the biggest number of female agricultural workers at 0.33 million. About half a million males were employed in agriculture in Cagayan Valley, Central Luzon, Eastern Visayas, Zamboanga Peninsula, Northern Mindanao, Davao Region, SOCCSKSARGEN and ARMM. Female agricultural workers were also high in number in Cagayan Valley at 0.21 million, Western Visayas at 0.30 million and Northern Mindanao at 0.21 million. NCR accounted for the least number of employment in agriculture at 21,000 males and 3,000 females. Fewer counts of employed persons were also registered in CAR at 0.21 million males and in Caraga at 90,000 females.
25 4
Table 6.1aNumber of employed males in agriculture, by region, Philippines, 2012-2016(in '000 persons)
Philippines 9,000 8,822 8,695 8,386 8,307
NCR 28 26 27 22 21 CAR 222 219 234 229 213 Ilocos Region 544 502 502 486 452 Cagayan Valley 596 596 583 585 543 Central Luzon 659 669 659 618 556 CALABARZON 570 533 559 511 449 MIMAROPA 458 449 438 416 404 Bicol Region 706 693 686 673 651 Western Visayas 852 830 881 869 803 Central Visayas 586 577 583 588 607 Eastern Visayas 630 639 388 348 548 Zamboanga Peninsula 471 467 461 447 503 Northern Mindanao 565 534 566 517 521 Davao Region 553 532 537 506 552 SOCCSKSARGEN 618 615 619 604 586 Caraga 293 290 296 292 307 ARMM 649 651 678 676 589 Source: Philippine Statistics Authority (PSA)
2012 20162014REGION 20152013

GENDER-BASED INDICATORS OF LABOR AND EMPLOYMENT IN AGRICULTURE
PHILIPPINE STATISTICS AUTHORITY
Unemployment Unemployment by sex indicates the incapacity of the labor market to
absorb the available males and females to contribute to production
activities.
In 2016, the number of unemployed males totaled 1.49 million while the
unemployed females summed up to 0.88 million. Unemployment rates
(URs) figured to 5.6 percent for males and 5.2 percent for females.
For both sexes, more unemployed persons were reported in
CALABARZON at 0.29 million males and 0.15 million females and in NCR at
0.23 million males and 0.14 million females. The counts of unemployed
males in Western and Central Visayas and Central Luzon ranged from
0.10 million to 0.20 million. Bigger number of unemployed females was
also noted in Central Luzon at 0.11 million. CAR had the lowest
unemployment at 19,000 males and 16,000 females (Tables 4.1a and
4.1b).
Unemployment rates (URs) for males were highest in CALABARZON at 8.2 percent and NCR at 7.3 percent. Female URs were leading in ARMM at 6.3 percent, Central Luzon at 6.2 percent and Northern Mindanao at 6.0 percent. The least unemployment rates were posted in Cagayan Valley at 2.6 percent for males and 4.0 percent for females. Similarly, UR of 4.0 percent for females was registered in Central Visayas. Male UR was, likewise, low in ARMM at 3.0 percent (Tables 4.2a and 4.2b).
Visible Underemployment Persons who are visibly underemployed are those who work for less than 40 hours during the reference week and are still wanting additional hours of work. Nationwide, there were 2.75 million males and 1.40 million females in 2016 who were considered as visibly underemployed persons. Visible underemployment rates were 11.0 percent for males and 8.7 percent for females (Tables 5.1a and 5.1b).
3 26
Table 6.1bNumber of employed females in agriculture, by region, Philippines, 2012-2016(in '000 persons)
Philippines 3,093 3,013 3,106 2,908 2,757
NCR 2 3 4 3 3 CAR 130 128 138 137 122 Ilocos Region 155 147 160 149 144 Cagayan Valley 248 249 236 238 211 Central Luzon 161 177 172 133 102 CALABARZON 151 134 166 138 105 MIMAROPA 168 150 158 161 142 Bicol Region 182 173 173 198 190 Western Visayas 287 278 325 304 299 Central Visayas 287 304 321 310 334 Eastern Visayas 159 168 115 94 142 Zamboanga Peninsula 189 191 171 168 181 Northern Mindanao 282 239 283 242 208 Davao Region 163 158 166 135 143 SOCCSKSARGEN 225 222 210 206 188 Caraga 92 100 98 94 90 ARMM 212 190 209 198 153 Source: Philippine Statistics Authority (PSA)
2012 2015 2016REGION 2013 2014

GENDER-BASED INDICATORS OF LABOR AND EMPLOYMENT IN AGRICULTURE
PHILIPPINE STATISTICS AUTHORITY
females in the labor force were less than 1.0 million in majority of the regions. CAR accounted for the least labor force at 0.48 million males and 0.32 million females (Tables 2.1a and 2.1b). Cagayan Valley indicated the highest male LFPR at 81.4 percent followed by Northern Mindanao at 80.0 percent. For the females, LFPR topped in Central Visayas at 55.6 percent and CAR at 54.7 percent. Male LFPRs of around 79 percent were reported in MIMAROPA, Zamboanga Peninsula, Davao Region and SOCCSKSARGEN. LFPRs of females of about 52.0 percent were noted in NCR, CALABARZON and Northern Mindanao. LFPRs were lowest in NCR at 74.2 percent for the males and ARMM at 29.2 percent for females (Tables 2.2a and 2.2b).
Employment Sex-disaggregated data on employment indicates the rate of absorption of available males and females in the production of goods and services. It is also a measure of gender equality in the labor market. Countrywide, there were 25.04 million employed males and 15.96 employed females in 2016. These corresponded to employment rates of 94.4 percent and 94.8 percent. The biggest male and female employment was located in CALABARZON at 3.28 million and 2.40 million, respectively, in 2016. Higher numbers were also recorded in NCR at 2.94 million males and 2.30 million females. Central Luzon had 2.72 million and 1.66 million of the employed males and females, respectively. CAR reported the least employment at 0.46 million males and 0.31 million females (Tables 3.1a and 3.1b). By region, male employment rate (ER) was highest in Cagayan Valley at 97.4 percent in 2016. This was followed by ARMM at 97.0 percent. ER of around 96 percent was posted each in CAR, MIMAROPA, Zamboanga Peninsula and SOCCSKSARGEN. The least ER was registered in CALABARZON at 91.8 percent. Meanwhile, employment rates of females were leading in Cagayan Valley and Central Visayas at 96.0 percent each. In contrast, ARMM and Central Luzon had the lowest ERs corresponding to 93.7 percent and 93.8 percent (Tables 3.2a and 3.2b).
27 2
Table 6.2aProportion of employed males in agriculture to total male employment, by region, Philippines, 2012-2016(in percent)
Philippines 39.4 38.1 37.2 35.8 33.2
NCR 1.1 1.0 1.0 0.8 0.7CAR 51.2 49.9 52.7 50.8 46.5Ilocos Region 44.4 40.6 40.0 38.8 36.0Cagayan Valley 64.0 63.1 61.4 60.7 56.7Central Luzon 27.4 27.1 25.9 24.2 20.4CALABARZON 20.9 19.2 19.1 17.6 13.7MIMAROPA 59.7 57.9 55.1 52.7 51.8Bicol Region 49.4 48.1 46.9 45.5 44.4Western Visayas 46.6 45.4 45.9 45.1 41.5Central Visayas 35.3 34.5 33.2 32.4 32.5Eastern Visayas 56.4 55.4 59.0 54.6 48.1Zamboanga Peninsula 54.3 53.2 51.7 50.7 51.4Northern Mindanao 49.1 46.2 48.0 43.8 42.4Davao Region 46.2 44.7 43.7 41.4 42.1SOCCSKSARGEN 58.2 57.4 56.1 54.5 49.2Caraga 44.9 43.5 43.0 42.8 44.3ARMM 74.9 74.2 74.3 75.1 71.2Source: Philippine Statistics Authority (PSA)
2012 2013REGION 2015 20162014

GENDER-BASED INDICATORS OF LABOR AND EMPLOYMENT IN AGRICULTURE
PHILIPPINE STATISTICS AUTHORITY
1 28
Household Population Aged 15 Years Old and Over Gender-specific information on the number of persons aged 15 years old and over indicates the distribution of males and females who are available for work. This serves as input for assessing the surplus or shortages of males and/ or females in the labor market and consequently, for the formulation and implementation of relevant programs and policies regarding labor. In 2016, the country’s working population aged 15 years and over consisted of 34.18 million males and 34.13 million females. Across regions, CALABARZON reported the biggest number of working age population for the males at 4.65 million and for the females at 4.89 million. NCR came next with 4.27 million males and 4.65 million females. Majority of the regions had about 1.0 million each of males and females who belonged to the working age population. The least counts were noted in CAR at 0.62 million males and 0.59 million females. The numbers were also minimal in Caraga at 0.93 million males and 0.87 million females (Tables 1.1a and 1.1b).
Labor Force Sex-disaggregated data on labor force gives the composition of population aged 15 year old and over, whether employed or unemployed, who contributed to the production of goods and services in the country. It also indicates the proportions of males and females of working age who join the labor force stream. In 2016, the total number of males in the labor force was estimated at 26.52 million while females figured to 16.84 million. Labor force participation rates (LFPRs) stood at 77.6 percent for males and 49.3 percent for females. At the regional level, CALABARZON had more males at 3.57 million and females at 2.55 million who were in the labor force in 2016. In NCR, the labor force population comprised of 3.17 million males and 2.44 million females. A greater number of males in labor force ranging from 1.01 million to 1.98 million were reported in many regions. The counts of
females in the labor force were less than 1.0 million in
Table 6.2bProportion of employed females in agriculture to total female employment,by region, Philippines, 2012-2016(in percent)
Philippines 21.0 20.1 20.3 19.0 17.3
NCR 0.1 0.1 0.2 0.1 0.1CAR 44.2 43.2 44.8 44.5 39.8Ilocos Region 22.5 20.5 21.2 19.6 19.7Cagayan Valley 47.9 46.8 44.0 43.3 40.2Central Luzon 10.9 11.6 10.9 8.5 6.2CALABARZON 7.5 6.5 7.6 6.3 4.4MIMAROPA 35.0 32.3 31.8 31.8 30.1Bicol Region 21.7 20.4 20.4 22.2 22.0Western Visayas 24.3 23.5 25.7 24.0 23.5Central Visayas 22.7 23.6 23.7 22.2 24.5Eastern Visayas 24.4 24.8 29.7 25.1 21.9Zamboanga Peninsula 36.2 36.9 33.6 33.5 32.2Northern Mindanao 35.0 30.7 33.9 29.9 26.8Davao Region 24.1 23.9 23.2 19.2 20.3SOCCSKSARGEN 36.3 35.8 33.3 31.9 28.5Caraga 23.7 24.1 23.3 22.9 22.5ARMM 58.7 54.0 54.6 55.2 48.7Source: Philippine Statistics Authority (PSA)
REGION 2015 20162012 2013 2014

GENDER-BASED INDICATORS OF LABOR AND EMPLOYMENT IN AGRICULTURE
PHILIPPINE STATISTICS AUTHORITY
29
Table 7.1a
Daily nominal wage rate of male agricultural workers, by region, Philippines, 2012-2016(in pesos)
Philipines 223.53 236.34 252.59 271.69 278.23
CAR 235.48 261.91 280.68 292.30 290.81Ilocos Region 289.20 302.68 309.66 319.87 331.26Cagayan Valley 257.89 294.61 313.49 332.99 333.55Central Luzon 312.40 347.99 365.18 361.32 381.17CALABARZON 276.90 304.63 318.70 323.53 326.86MIMAROPA 241.15 260.48 275.14 282.54 280.77Bicol Region 203.29 210.73 242.53 247.91 269.86Western Visayas 208.64 220.24 235.72 244.89 246.06Central Visayas 181.17 203.68 215.78 230.75 233.51Eastern Visayas 194.26 206.33 237.83 241.47 244.61Zamboanga Peninsula 193.69 220.61 231.23 242.90 240.50Northern Mindanao 201.78 217.78 232.12 244.17 233.83Davao Region 196.34 232.15 238.14 252.09 254.42SOCCSKSARGEN 207.82 218.91 231.96 250.23 246.78Caraga 233.82 260.50 284.13 311.63 309.85ARMM 213.44 222.15 234.32 253.88 258.43Source: Philippine Statistics Authority (PSA)
REGION 2012 2013 2014 2015 2016

GENDER-BASED INDICATORS OF LABOR AND EMPLOYMENT IN AGRICULTURE
PHILIPPINE STATISTICS AUTHORITY
30
Table 7.1b
Daily nominal wage rate of female agricultural workers, by region, Philippines, 2012-2016(in pesos)
Philipines 208.30 226.73 238.69 251.11 260.78
CAR 223.28 249.27 264.57 270.93 271.05Ilocos Region 272.62 282.54 252.95 266.18 319.01Cagayan Valley 257.79 264.94 274.98 286.24 329.17Central Luzon 260.91 315.13 270.11 304.77 352.52CALABARZON 245.69 296.01 230.88 241.11 326.33MIMAROPA 218.54 234.21 244.20 262.38 249.42Bicol Region 210.56 202.42 167.42 174.34 230.22Western Visayas 195.72 207.68 221.85 229.11 244.00Central Visayas 170.27 188.87 199.38 216.41 218.15Eastern Visayas 172.41 197.65 168.20 170.16 241.70Zamboanga Peninsula 184.99 201.89 218.95 234.07 231.34Northern Mindanao 189.35 195.03 208.04 230.92 226.49Davao Region 183.31 209.43 222.35 235.87 238.88SOCCSKSARGEN 198.67 208.74 221.27 238.81 240.15Caraga 215.95 252.21 273.35 299.41 291.69ARMM 202.54 232.48 135.13 161.04 248.88Source: Philippine Statistics Authority (PSA)
REGION 2012 2013 2014 2015 2016

GENDER-BASED INDICATORS OF LABOR AND EMPLOYMENT IN AGRICULTURE
PHILIPPINE STATISTICS AUTHORITY
31
TABLE OF CONTENTS
iv
Table 7.2a
Daily real wage rate of male agricultural workers, by region,
Philippines, 2012-2016
(in pesos)
Philipines 171.81 176.44 181.01 192.01 193.22
CAR 183.83 197.73 204.33 209.68 204.80Ilocos Region 233.79 238.68 233.66 238.18 242.33Cagayan Valley 196.56 217.21 222.24 231.40 225.07Central Luzon 237.02 256.96 260.28 254.27 262.51CALABARZON 213.33 228.64 230.07 231.59 231.98MIMAROPA 180.91 190.56 192.64 195.12 189.97Bicol Region 153.55 153.83 168.14 170.26 183.33Western Visayas 158.18 160.87 164.42 166.93 161.03Central Visayas 141.10 151.02 152.34 160.02 157.88Eastern Visayas 145.30 147.90 159.43 158.97 158.94Zamboanga Peninsula 142.31 155.48 154.36 158.14 152.12Northern Mindanao 145.90 150.87 153.87 159.69 150.86Davao Region 144.69 165.71 163.96 169.19 165.42SOCCSKSARGEN 152.58 155.06 156.23 166.16 159.21Caraga 164.20 176.19 182.50 195.26 190.56ARMM 150.63 151.61 153.70 162.33 160.52
Source: Philippine Statistics Authority (PSA)
REGION 2012 2013 2014 2015 2016
Table 5.1a Number of visibly underemployed males, by region, Philippines, 2012-2016 21
Table 5.1b Number of visibly underemployed females, by region, Philippines, 2012-2016 22
Table 5.2a Male visible underemployment rate, by region,Philippines, 2012-2016 23
Table 5.2b Female visible underemployment rate, by region, Philippines, 2012-2016 24
Table 6.1a Number of employed males in agriculture, by region, Philippines, 2012-2016 25
Table 6.1b Number of employed females in agriculture, by region, Philippines, 2012-2016 26
Table 6.2a Proportion of employed males in agriculture to total male employment, by region, Philippines, 2012-2016 27
Table 6.2b Proportion of employed females in agriculture to total female employment, by region, Philippines, 2012-2016 28
Table 7.1a Daily nominal wage rate of male agricultural workers, by region, Philippines, 2012-2016 29
Table 7.1b Daily nominal wage rate of female agricultural workers, by region, Philippines, 2012-2016 30
Table 7.2a Daily real wage rate of male agricultural workers,by region, Philippines, 2012-2016 31
Table 7.2b Daily real wage rate of female agricultural workers, by region, Philippines, 2012-2016 32

GENDER-BASED INDICATORS OF LABOR AND EMPLOYMENT IN AGRICULTURE
PHILIPPINE STATISTICS AUTHORITY
TABLE OF CONTENTS
iii 32
Table 7.2b
Daily real wage rate of female agricultural workers, by region, Philippines, 2012-2016(in pesos)
Philipines 160.10 169.27 171.05 177.47 181.10
CAR 174.30 188.19 192.60 194.36 190.88Ilocos Region 220.39 222.79 190.87 198.20 233.37Cagayan Valley 196.49 195.34 194.94 198.92 222.11Central Luzon 197.96 232.70 192.52 214.48 242.78CALABARZON 189.28 222.17 166.67 172.59 231.60MIMAROPA 163.95 171.34 170.98 181.20 168.76Bicol Region 159.04 147.76 116.07 119.74 156.40Western Visayas 148.39 151.69 154.74 156.18 159.69Central Visayas 132.61 140.05 140.77 150.08 147.50Eastern Visayas 128.95 141.67 112.75 112.02 157.05Zamboanga Peninsula 135.92 142.28 146.16 152.39 146.33Northern Mindanao 136.91 135.11 137.91 151.03 146.12Davao Region 135.08 149.50 153.09 158.30 155.32SOCCSKSARGEN 145.86 147.86 149.03 158.57 154.94Caraga 151.65 170.58 175.57 187.60 179.39ARMM 142.94 158.66 88.64 102.97 154.58
Source: Philippine Statistics Authority (PSA)
REGION 2012 2013 2014 2015 2016
FOREWORD i
LIST OF TABLES i i i
GENDER-BASED INDICATORS OF LABOR AND EMPLOYMENT IN AGRICULTURE
Table 1.1a Total male household population 15 years old and over, by region, Philippines, 2012-2016 7
Table 1.1b Total female household population 15 years old and over, by region, Philippines, 2012-2016 8
Table 2.1a Male labor force, by region, Philippines, 2012-2016 9
Table 2.1b Female labor force, by region, Philippines, 2012-2016 10
Table 2.2a Male labor force participation rate, by region, Phill ippines, 2012-2016 11
Table 2.2b Female labor force participation rate, by region, Philippines, 2012-2016 12
Table 3.1a Number of employed males, by region, Philippines,2012-2016 13
Table 3.1b Number of employed females, by region, Philippines,2012-2016 14
Table 3.2a Male employment rate, by region, Philippines,2012-2016 15
Table 3.2b Female employment rate, by region, Philippines, 2012-2016 16
Table 4.1a Number of unemployed males, by region, Philippines,2012-2016 17
Table 4.1b Number of unemployed females, by region, Philippines,2012-2016 18
Table 4.2a Male unemployment rate, by region, Philippines, 2012-2016 19
Table 4.2b Female unemployment rate, by region, Philippines, 2012-2016 20

GENDER-BASED INDICATORS OF LABOR AND EMPLOYMENT IN AGRICULTURE
PHILIPPINE STATISTICS AUTHORITY
MODULES OF THE AGRICULTURAL INDICATORS SYSTEM
1. Output and Productivity
2. Agricultural Structure and Resources
3. Economic Growth: Agriculture
4. Agricultural Exports and Imports
5. Food Sufficiency and Security
6. Food Consumption and Nutrition
7. Redistribution of Land
8. Population and Labor Force
9. Gender-based Indicators of Labor and Employment in Agriculture
10. Prices and Marketing of Agricultural Commodities
11. Agricultural Credit
12. Inputs

GENDER-BASED INDICATORS OF LABOR AND EMPLOYMENT IN AGRICULTURE
PHILIPPINE STATISTICS AUTHORITY
PHILIPPINE STATISTICS AUTHORITY 16
th Floor, Eton Cyberpod Centris 3
EDSA, corner Quezon Avenue, Quezon City, Philippines 1100
Telefax No.: +63(2) 376-1954
URL: http://psa.gov.ph
/PhilippineStatisticsAuthority /PSAgovph