gender pay gap group database as a proxy for the market # of jobs % total database % total coded...
TRANSCRIPT
Gender Pay GapSEPTEMBER 2014 TREVOR WARDEN

Introduction
3© 2014 Hay Group. All rights reserved
Agenda
Introduction
Measuring the gap
The data
The real problem
What now?
12345
4© 2014 Hay Group. All rights reserved
About Hay Group
We help clients globally to solve their organisational and people related business problems.
We help them to make their organisations work through our knowledge and insights into people, jobs and organisations.
Organisation transformation Organisation Design Talent management Leadership development Capability assessment Executive reward Performance management Work measurement Employee and organisational effectiveness Reward strategies
5© 2014 Hay Group. All rights reserved
Why is Gender Pay Gap an issue?
An overview of the issue:
Pay inequity means less lifetime earnings for women Increasingly women are the breadwinners The economy needs to attract women into the workforce Companies with more women in top jobs perform better A societal issue
It is simply unfair and affects us all!
Measuring the gap
7© 2014 Hay Group. All rights reserved
The data
Statistics are used much like a drunk uses a lamppost: for support, not illumination. Vin Scully
Facts are stubborn, but statistics are more pliable. Mark Twain
There are three kinds of lies: lies, damned lies, and statistics. Unknown (Attributed by Twain and others to Disraeli but
contested)
But…the numbers speak for themselves in this case!
It is easy to be cynical when it comes to data….
8© 2014 Hay Group. All rights reserved
Calculating the gap
Approaches Average earnings over a period e.g. WGEA Life time earnings Equal pay for equal work
9© 2014 Hay Group. All rights reserved
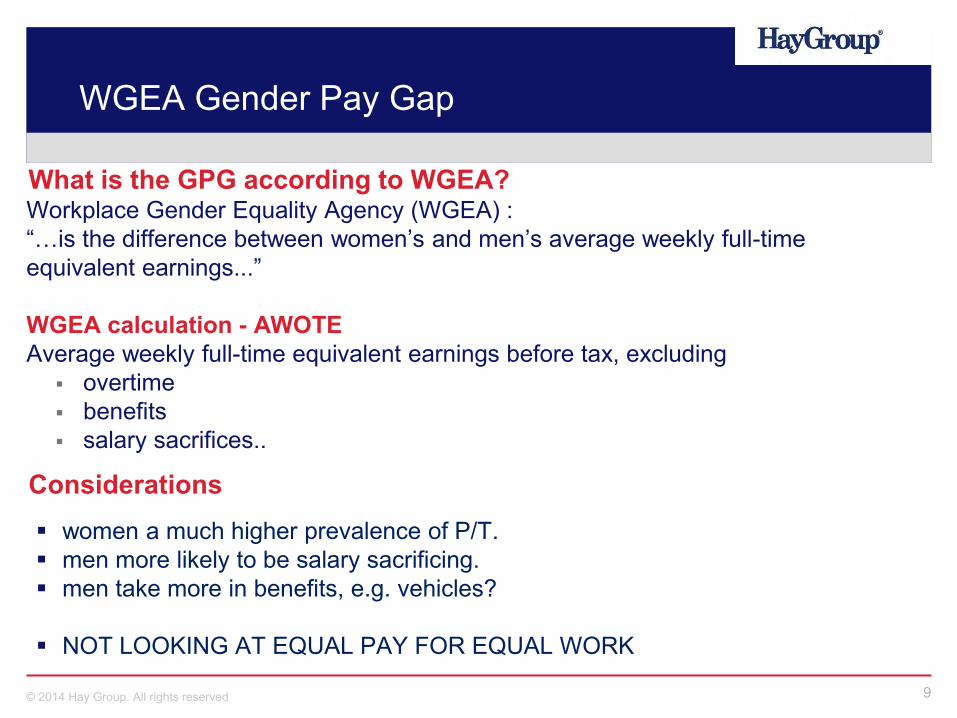
WGEA Gender Pay Gap
What is the GPG according to WGEA?Workplace Gender Equality Agency (WGEA) :“…is the difference between women’s and men’s average weekly full-time equivalent earnings...”
WGEA calculation - AWOTEAverage weekly full-time equivalent earnings before tax, excluding
overtime benefits salary sacrifices..
Considerations women a much higher prevalence of P/T. men more likely to be salary sacrificing. men take more in benefits, e.g. vehicles?
NOT LOOKING AT EQUAL PAY FOR EQUAL WORK
10© 2014 Hay Group. All rights reserved
Lifetime earnings
Fully inclusive populist approach great headlines
Considerations complex calculations – not easily replicable many assumptions
11© 2014 Hay Group. All rights reserved
Equal pay for work of equal value
Job sizing approach
apples-to-apples comparisons
Considerations no “official” (government) data point in time Most businesses understand method Comprehensive - all financial valued remuneration aggregates/elements
The data
13© 2014 Hay Group. All rights reserved
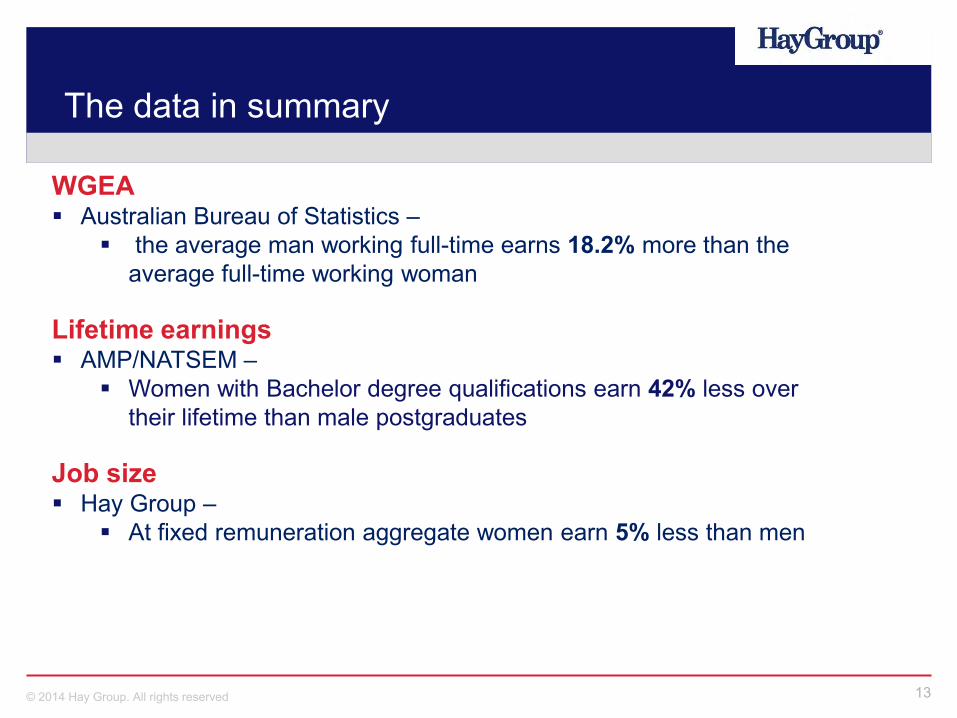
The data in summary
WGEA Australian Bureau of Statistics –
the average man working full-time earns 18.2% more than the average full-time working woman
Lifetime earnings AMP/NATSEM –
Women with Bachelor degree qualifications earn 42% less over their lifetime than male postgraduates
Job size Hay Group –
At fixed remuneration aggregate women earn 5% less than men
14© 2014 Hay Group. All rights reserved
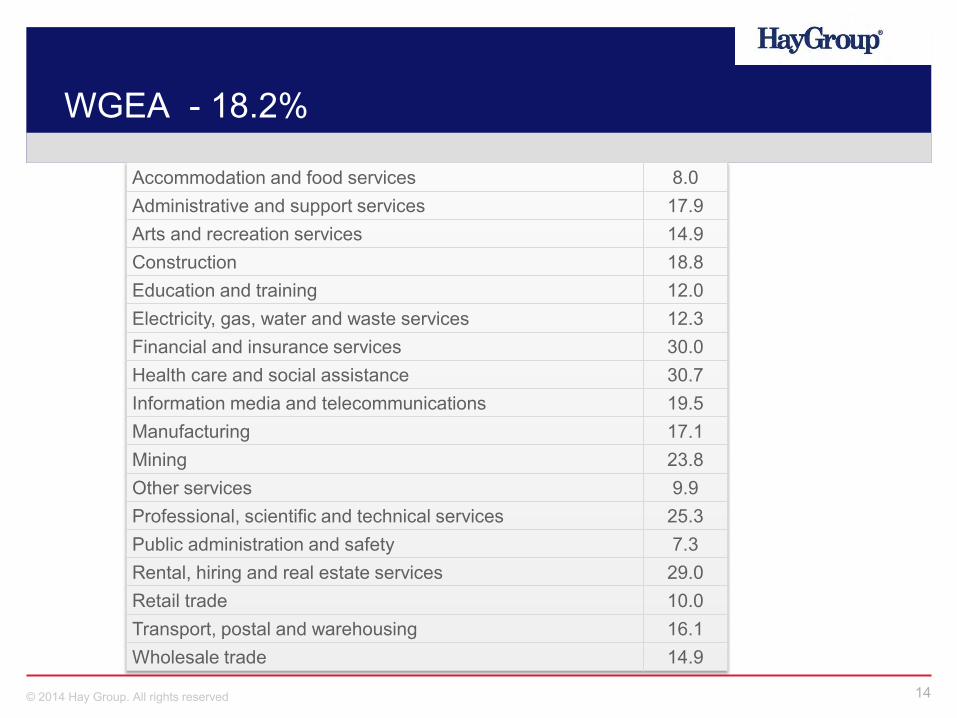
WGEA - 18.2%
Accommodation and food services 8.0Administrative and support services 17.9Arts and recreation services 14.9Construction 18.8Education and training 12.0Electricity, gas, water and waste services 12.3Financial and insurance services 30.0Health care and social assistance 30.7Information media and telecommunications 19.5Manufacturing 17.1Mining 23.8Other services 9.9Professional, scientific and technical services 25.3Public administration and safety 7.3Rental, hiring and real estate services 29.0Retail trade 10.0Transport, postal and warehousing 16.1Wholesale trade 14.9
15© 2014 Hay Group. All rights reserved
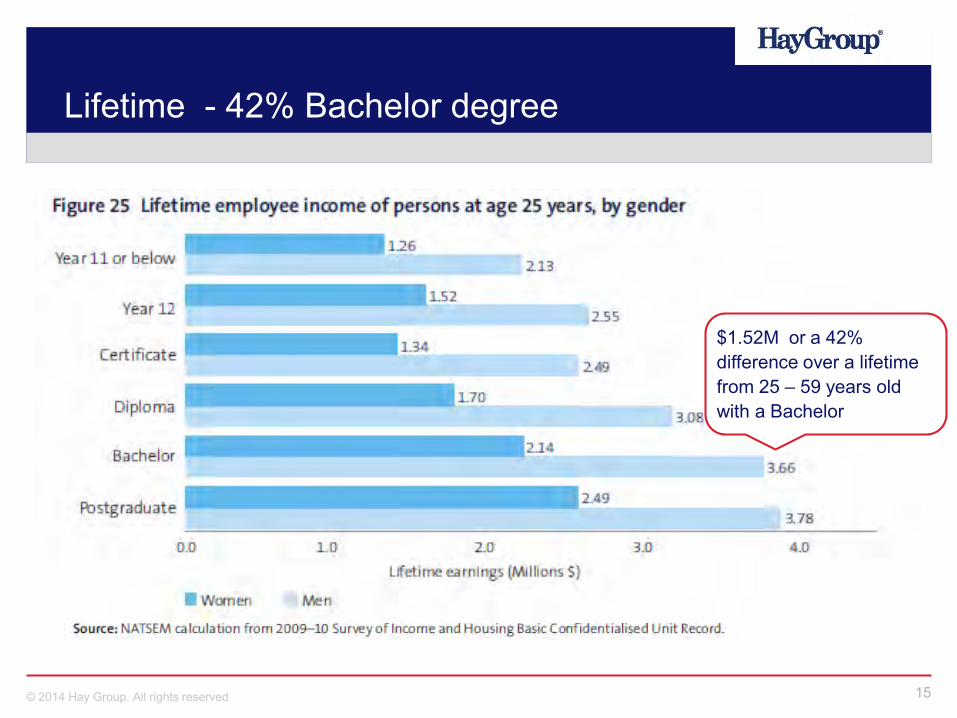
Lifetime - 42% Bachelor degree
$1.52M or a 42% difference over a lifetime from 25 – 59 years old with a Bachelor
16© 2014 Hay Group. All rights reserved
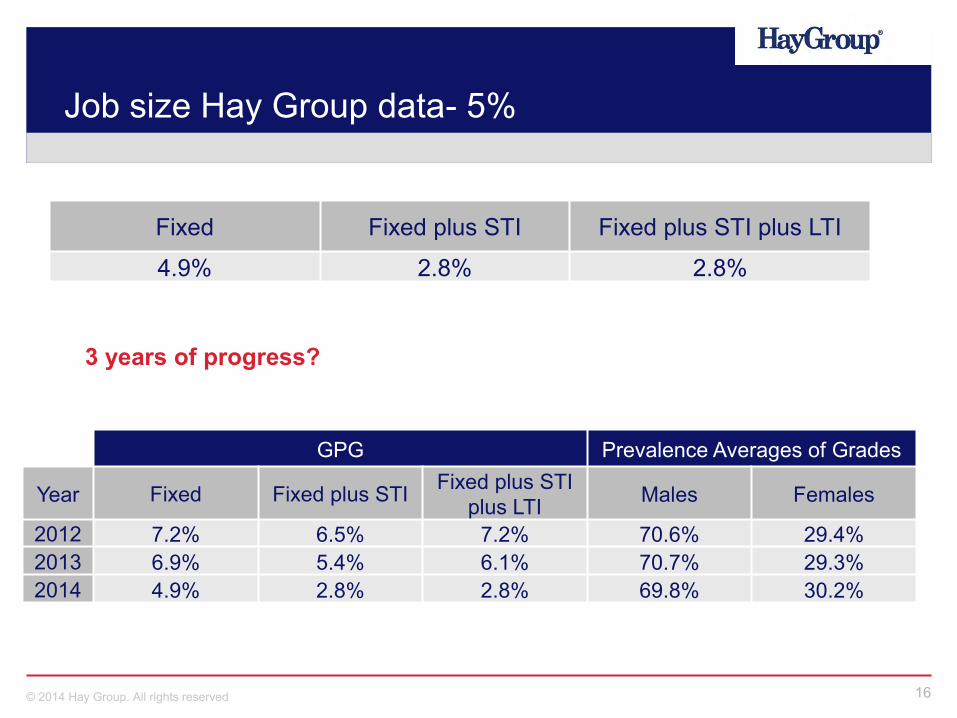
Job size Hay Group data- 5%
Fixed Fixed plus STI Fixed plus STI plus LTI
4.9% 2.8% 2.8%
3 years of progress?
GPG Prevalence Averages of Grades
Year Fixed Fixed plus STI Fixed plus STI plus LTI Males Females
2012 7.2% 6.5% 7.2% 70.6% 29.4%2013 6.9% 5.4% 6.1% 70.7% 29.3%2014 4.9% 2.8% 2.8% 69.8% 30.2%
17© 2014 Hay Group. All rights reserved
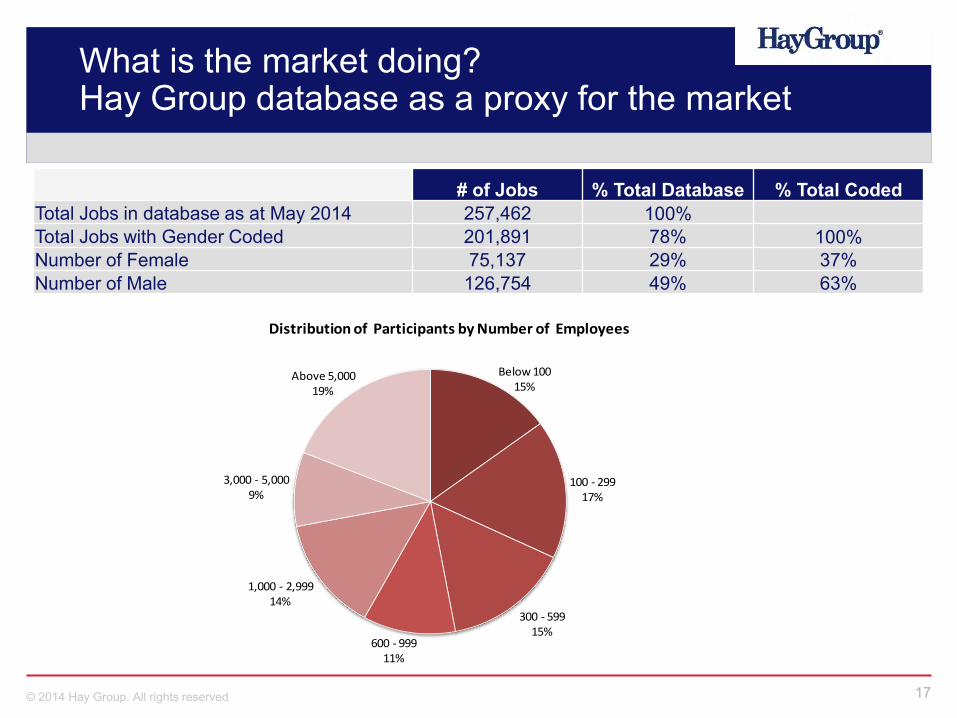
What is the market doing?Hay Group database as a proxy for the market
# of Jobs % Total Database % Total CodedTotal Jobs in database as at May 2014 257,462 100%Total Jobs with Gender Coded 201,891 78% 100%Number of Female 75,137 29% 37%Number of Male 126,754 49% 63%
Below 10015%
100 - 29917%
300 - 59915%
600 - 99911%
1,000 - 2,99914%
3,000 - 5,0009%
Above 5,00019%
Distribution of Participants by Number of Employees
18© 2014 Hay Group. All rights reserved
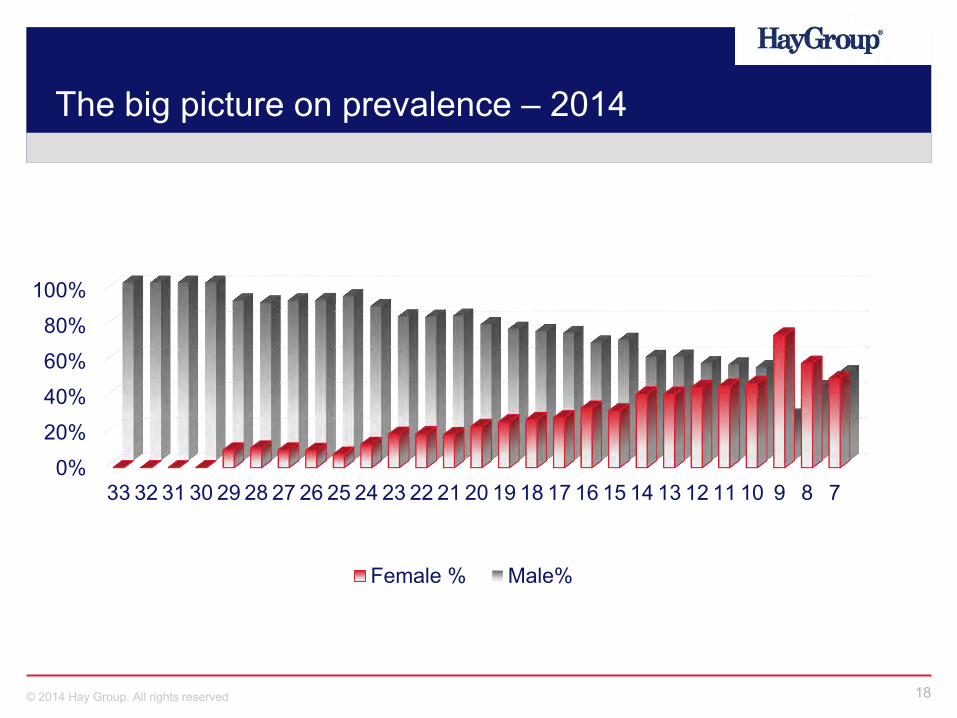
The big picture on prevalence – 2014
0%
20%
40%
60%
80%
100%
33 32 31 30 29 28 27 26 25 24 23 22 21 20 19 18 17 16 15 14 13 12 11 10 9 8 7
Female % Male%
19© 2014 Hay Group. All rights reserved
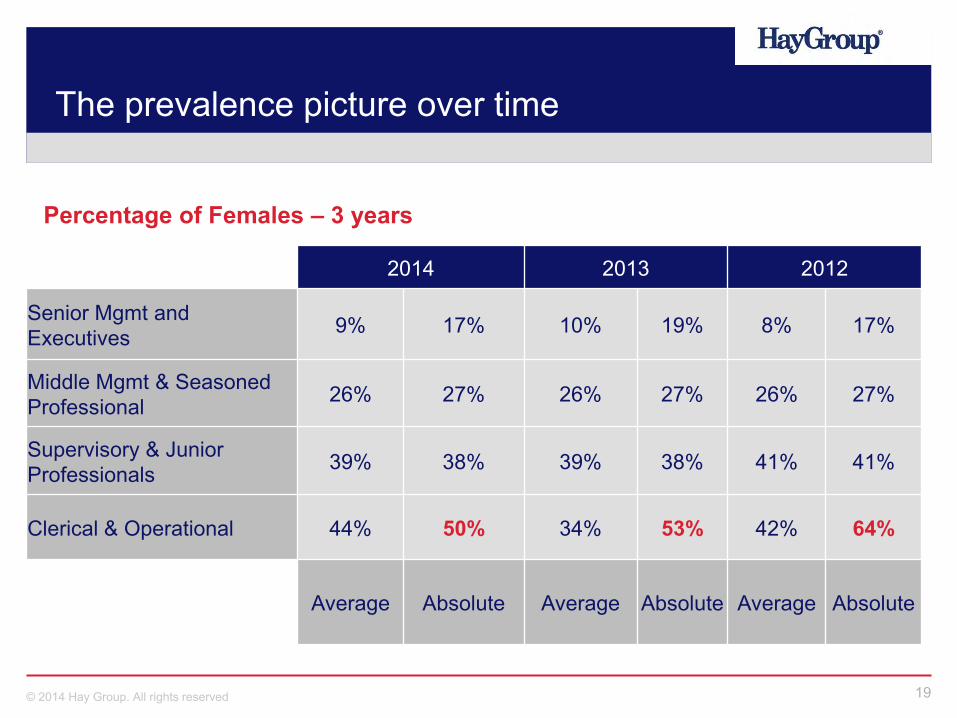
The prevalence picture over time
2014 2013 2012
Senior Mgmt and Executives 9% 17% 10% 19% 8% 17%
Middle Mgmt & Seasoned Professional 26% 27% 26% 27% 26% 27%
Supervisory & Junior Professionals 39% 38% 39% 38% 41% 41%
Clerical & Operational 44% 50% 34% 53% 42% 64%
Average Absolute Average Absolute Average Absolute
Percentage of Females – 3 years
20© 2014 Hay Group. All rights reserved
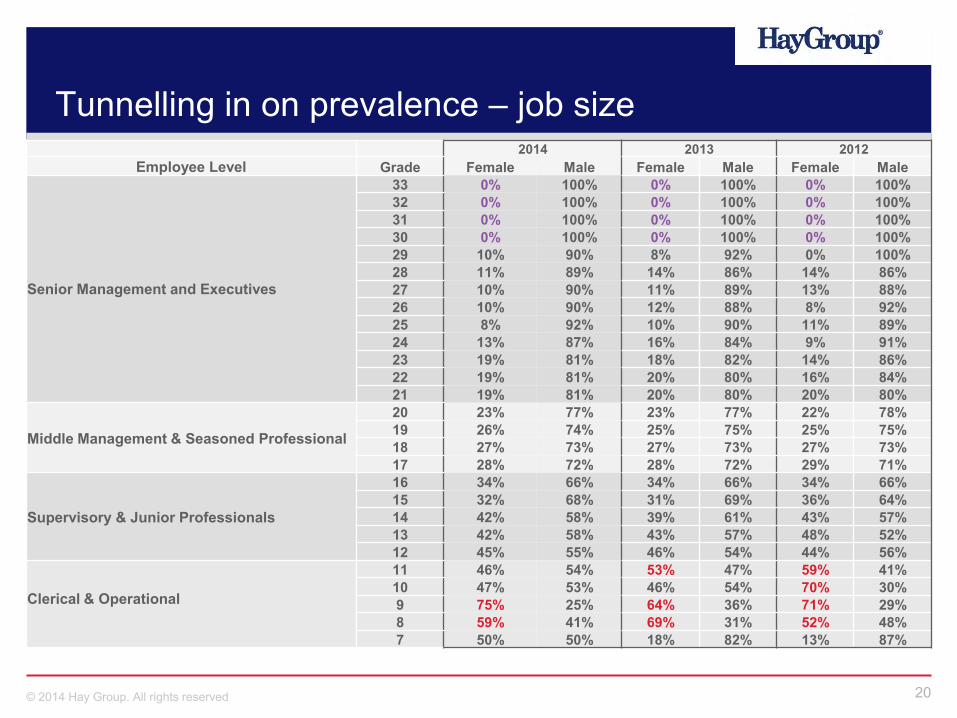
Tunnelling in on prevalence – job size2014 2013 2012
Employee Level Grade Female Male Female Male Female Male
Senior Management and Executives
33 0% 100% 0% 100% 0% 100%32 0% 100% 0% 100% 0% 100%31 0% 100% 0% 100% 0% 100%30 0% 100% 0% 100% 0% 100%29 10% 90% 8% 92% 0% 100%28 11% 89% 14% 86% 14% 86%27 10% 90% 11% 89% 13% 88%26 10% 90% 12% 88% 8% 92%25 8% 92% 10% 90% 11% 89%24 13% 87% 16% 84% 9% 91%23 19% 81% 18% 82% 14% 86%22 19% 81% 20% 80% 16% 84%21 19% 81% 20% 80% 20% 80%
Middle Management & Seasoned Professional
20 23% 77% 23% 77% 22% 78%19 26% 74% 25% 75% 25% 75%18 27% 73% 27% 73% 27% 73%17 28% 72% 28% 72% 29% 71%
Supervisory & Junior Professionals
16 34% 66% 34% 66% 34% 66%15 32% 68% 31% 69% 36% 64%14 42% 58% 39% 61% 43% 57%13 42% 58% 43% 57% 48% 52%12 45% 55% 46% 54% 44% 56%
Clerical & Operational
11 46% 54% 53% 47% 59% 41%10 47% 53% 46% 54% 70% 30%9 75% 25% 64% 36% 71% 29%8 59% 41% 69% 31% 52% 48%7 50% 50% 18% 82% 13% 87%
21© 2014 Hay Group. All rights reserved
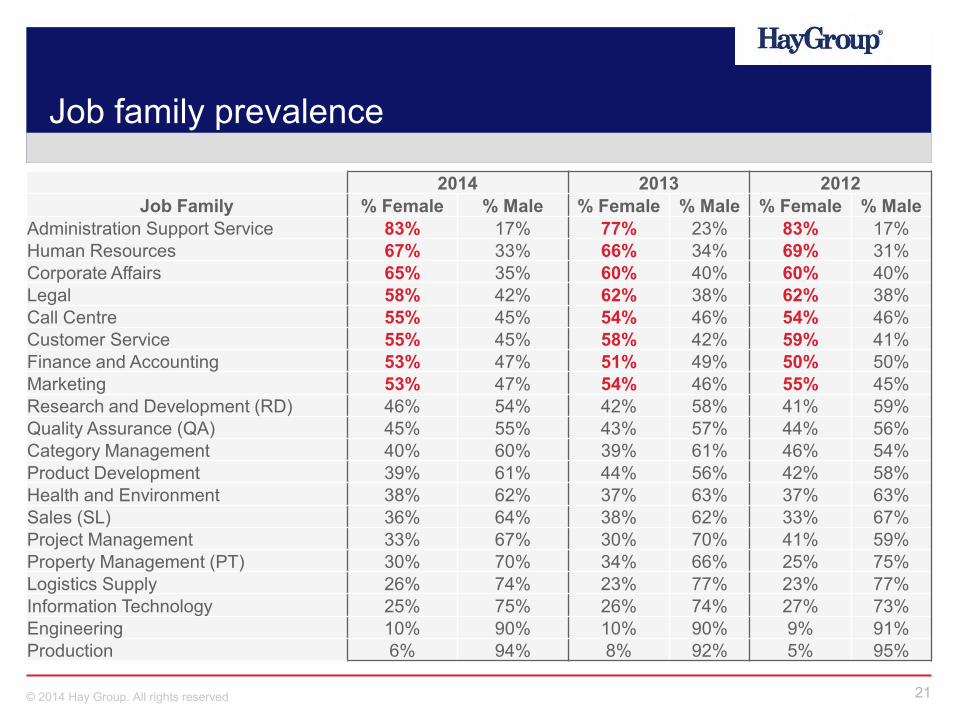
Job family prevalence
2014 2013 2012Job Family % Female % Male % Female % Male % Female % Male
Administration Support Service 83% 17% 77% 23% 83% 17%Human Resources 67% 33% 66% 34% 69% 31%Corporate Affairs 65% 35% 60% 40% 60% 40%Legal 58% 42% 62% 38% 62% 38%Call Centre 55% 45% 54% 46% 54% 46%Customer Service 55% 45% 58% 42% 59% 41%Finance and Accounting 53% 47% 51% 49% 50% 50%Marketing 53% 47% 54% 46% 55% 45%Research and Development (RD) 46% 54% 42% 58% 41% 59%Quality Assurance (QA) 45% 55% 43% 57% 44% 56%Category Management 40% 60% 39% 61% 46% 54%Product Development 39% 61% 44% 56% 42% 58%Health and Environment 38% 62% 37% 63% 37% 63%Sales (SL) 36% 64% 38% 62% 33% 67%Project Management 33% 67% 30% 70% 41% 59%Property Management (PT) 30% 70% 34% 66% 25% 75%Logistics Supply 26% 74% 23% 77% 23% 77%Information Technology 25% 75% 26% 74% 27% 73%Engineering 10% 90% 10% 90% 9% 91%Production 6% 94% 8% 92% 5% 95%
22© 2014 Hay Group. All rights reserved
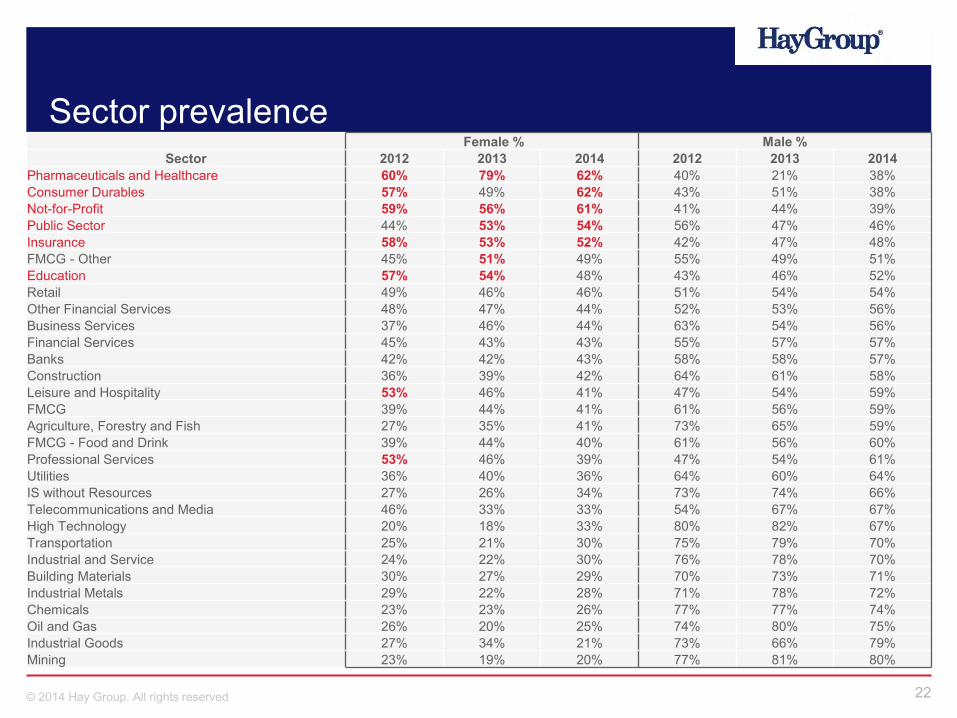
Sector prevalenceFemale % Male %
Sector 2012 2013 2014 2012 2013 2014Pharmaceuticals and Healthcare 60% 79% 62% 40% 21% 38%Consumer Durables 57% 49% 62% 43% 51% 38%Not-for-Profit 59% 56% 61% 41% 44% 39%Public Sector 44% 53% 54% 56% 47% 46%Insurance 58% 53% 52% 42% 47% 48%FMCG - Other 45% 51% 49% 55% 49% 51%Education 57% 54% 48% 43% 46% 52%Retail 49% 46% 46% 51% 54% 54%Other Financial Services 48% 47% 44% 52% 53% 56%Business Services 37% 46% 44% 63% 54% 56%Financial Services 45% 43% 43% 55% 57% 57%Banks 42% 42% 43% 58% 58% 57%Construction 36% 39% 42% 64% 61% 58%Leisure and Hospitality 53% 46% 41% 47% 54% 59%FMCG 39% 44% 41% 61% 56% 59%Agriculture, Forestry and Fish 27% 35% 41% 73% 65% 59%FMCG - Food and Drink 39% 44% 40% 61% 56% 60%Professional Services 53% 46% 39% 47% 54% 61%Utilities 36% 40% 36% 64% 60% 64%IS without Resources 27% 26% 34% 73% 74% 66%Telecommunications and Media 46% 33% 33% 54% 67% 67%High Technology 20% 18% 33% 80% 82% 67%Transportation 25% 21% 30% 75% 79% 70%Industrial and Service 24% 22% 30% 76% 78% 70%Building Materials 30% 27% 29% 70% 73% 71%Industrial Metals 29% 22% 28% 71% 78% 72%Chemicals 23% 23% 26% 77% 77% 74%Oil and Gas 26% 20% 25% 74% 80% 75%Industrial Goods 27% 34% 21% 73% 66% 79%Mining 23% 19% 20% 77% 81% 80%
23© 2014 Hay Group. All rights reserved
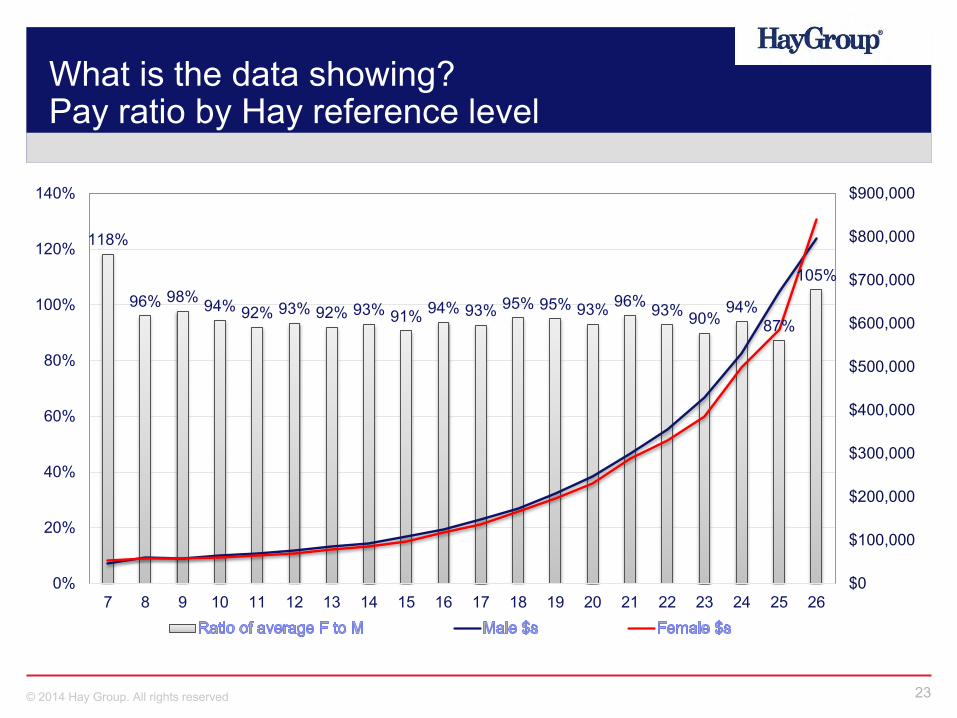
What is the data showing?Pay ratio by Hay reference level
118%
96% 98% 94% 92% 93% 92% 93% 91% 94% 93% 95% 95% 93% 96% 93% 90%94%
87%
105%
$0
$100,000
$200,000
$300,000
$400,000
$500,000
$600,000
$700,000
$800,000
$900,000
0%
20%
40%
60%
80%
100%
120%
140%
7 8 9 10 11 12 13 14 15 16 17 18 19 20 21 22 23 24 25 26
24© 2014 Hay Group. All rights reserved
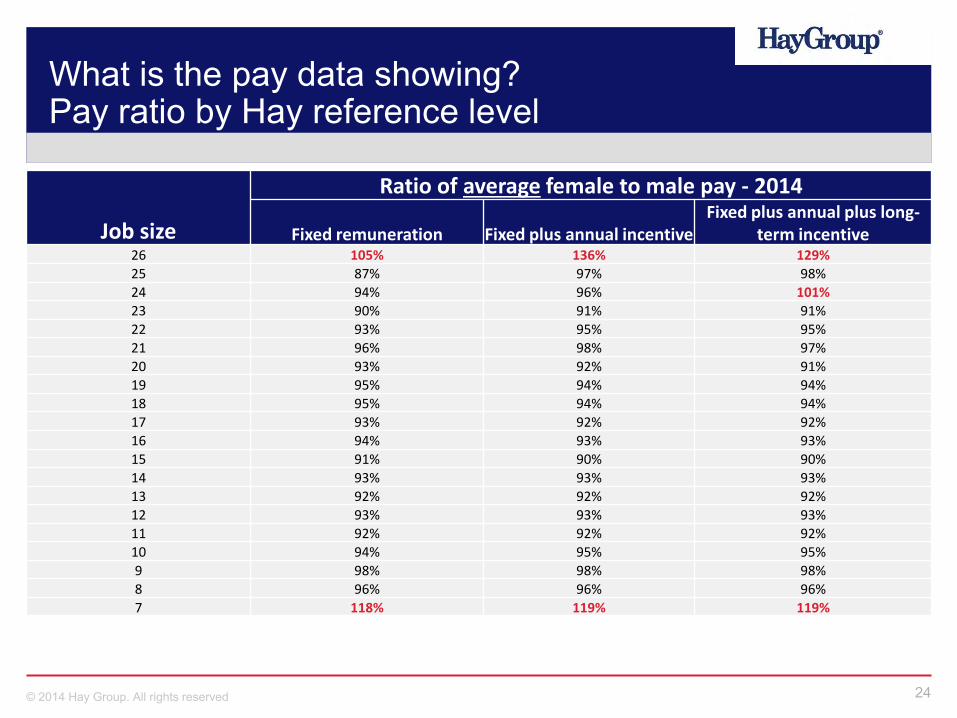
What is the pay data showing?Pay ratio by Hay reference level
Job size
Ratio of average female to male pay - 2014
Fixed remuneration Fixed plus annual incentiveFixed plus annual plus long-
term incentive26 105% 136% 129%
25 87% 97% 98%
24 94% 96% 101%
23 90% 91% 91%
22 93% 95% 95%
21 96% 98% 97%
20 93% 92% 91%
19 95% 94% 94%
18 95% 94% 94%
17 93% 92% 92%
16 94% 93% 93%
15 91% 90% 90%
14 93% 93% 93%
13 92% 92% 92%
12 93% 93% 93%
11 92% 92% 92%
10 94% 95% 95%
9 98% 98% 98%
8 96% 96% 96%
7 118% 119% 119%
25© 2014 Hay Group. All rights reserved
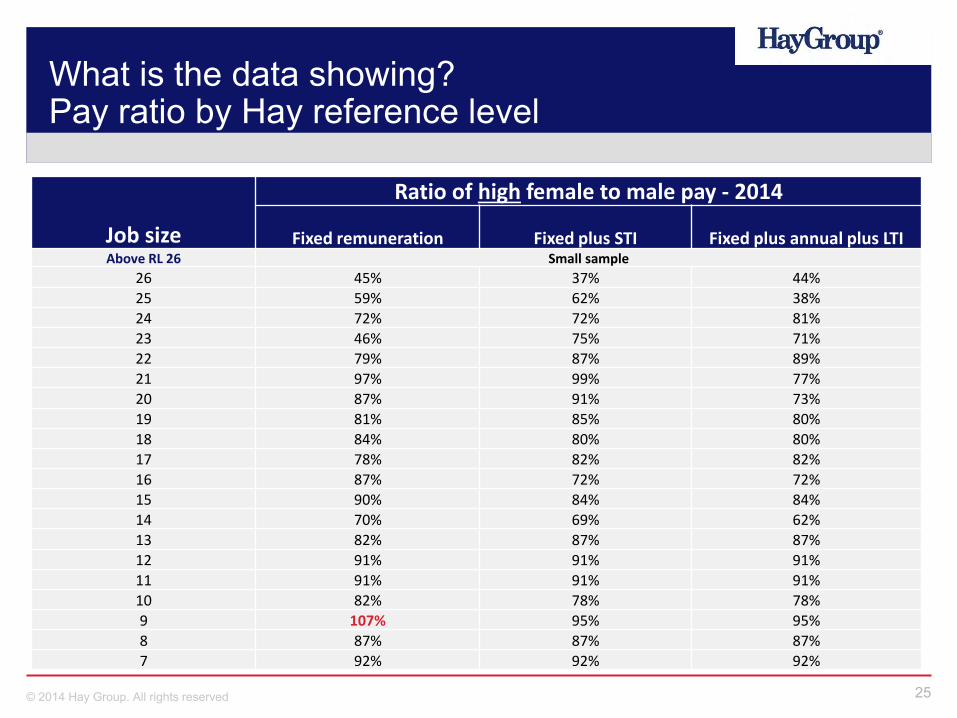
What is the data showing?Pay ratio by Hay reference level
Job size
Ratio of high female to male pay - 2014
Fixed remuneration Fixed plus STI Fixed plus annual plus LTIAbove RL 26 Small sample
26 45% 37% 44%
25 59% 62% 38%
24 72% 72% 81%
23 46% 75% 71%
22 79% 87% 89%
21 97% 99% 77%
20 87% 91% 73%
19 81% 85% 80%
18 84% 80% 80%
17 78% 82% 82%
16 87% 72% 72%
15 90% 84% 84%
14 70% 69% 62%
13 82% 87% 87%
12 91% 91% 91%
11 91% 91% 91%
10 82% 78% 78%
9 107% 95% 95%
8 87% 87% 87%
7 92% 92% 92%
26© 2014 Hay Group. All rights reserved
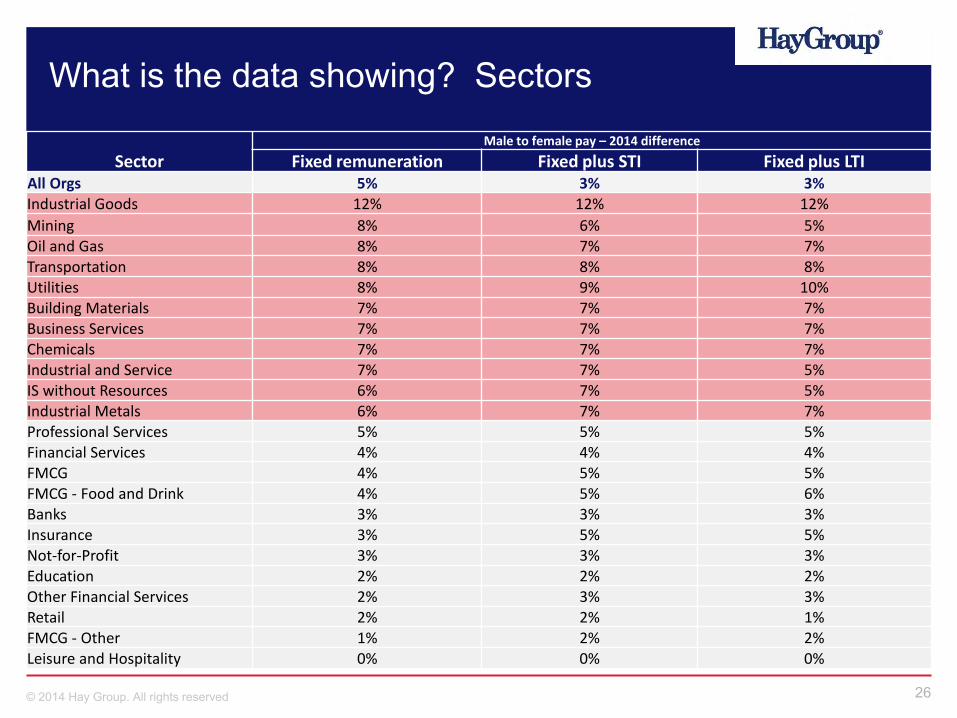
What is the data showing? Sectors
SectorMale to female pay – 2014 difference
Fixed remuneration Fixed plus STI Fixed plus LTIAll Orgs 5% 3% 3%Industrial Goods 12% 12% 12%
Mining 8% 6% 5%Oil and Gas 8% 7% 7%Transportation 8% 8% 8%Utilities 8% 9% 10%Building Materials 7% 7% 7%Business Services 7% 7% 7%Chemicals 7% 7% 7%Industrial and Service 7% 7% 5%IS without Resources 6% 7% 5%Industrial Metals 6% 7% 7%Professional Services 5% 5% 5%Financial Services 4% 4% 4%FMCG 4% 5% 5%FMCG - Food and Drink 4% 5% 6%Banks 3% 3% 3%Insurance 3% 5% 5%Not-for-Profit 3% 3% 3%Education 2% 2% 2%Other Financial Services 2% 3% 3%Retail 2% 2% 1%FMCG - Other 1% 2% 2%Leisure and Hospitality 0% 0% 0%
The real problem
28© 2014 Hay Group. All rights reserved
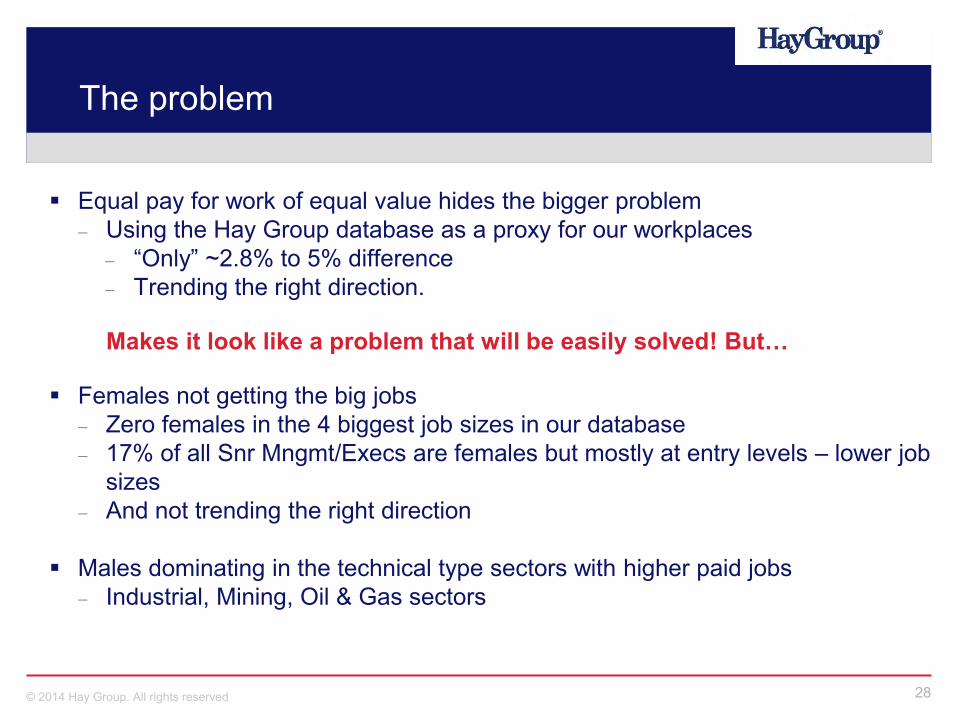
The problem
Equal pay for work of equal value hides the bigger problem Using the Hay Group database as a proxy for our workplaces
“Only” ~2.8% to 5% difference Trending the right direction.
Makes it look like a problem that will be easily solved! But…
Females not getting the big jobs Zero females in the 4 biggest job sizes in our database 17% of all Snr Mngmt/Execs are females but mostly at entry levels – lower job
sizes And not trending the right direction
Males dominating in the technical type sectors with higher paid jobs Industrial, Mining, Oil & Gas sectors
29© 2014 Hay Group. All rights reserved
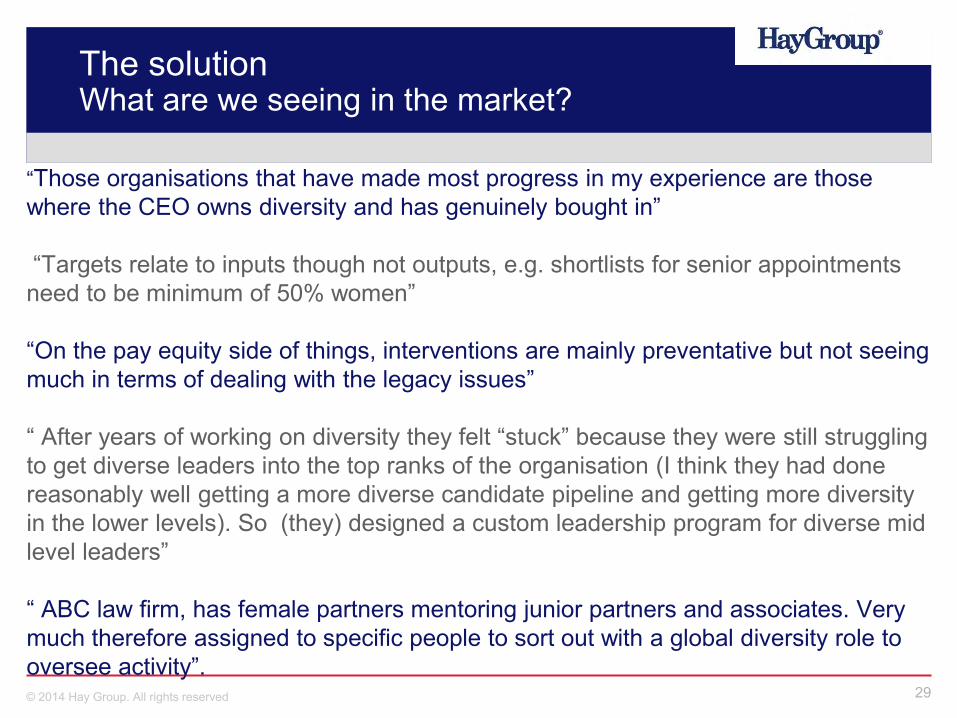
The solutionWhat are we seeing in the market?
“Those organisations that have made most progress in my experience are those where the CEO owns diversity and has genuinely bought in”
“Targets relate to inputs though not outputs, e.g. shortlists for senior appointments need to be minimum of 50% women”
“On the pay equity side of things, interventions are mainly preventative but not seeing much in terms of dealing with the legacy issues”
“ After years of working on diversity they felt “stuck” because they were still struggling to get diverse leaders into the top ranks of the organisation (I think they had done reasonably well getting a more diverse candidate pipeline and getting more diversity in the lower levels). So (they) designed a custom leadership program for diverse mid level leaders”
“ ABC law firm, has female partners mentoring junior partners and associates. Very much therefore assigned to specific people to sort out with a global diversity role to oversee activity”.
30© 2014 Hay Group. All rights reserved
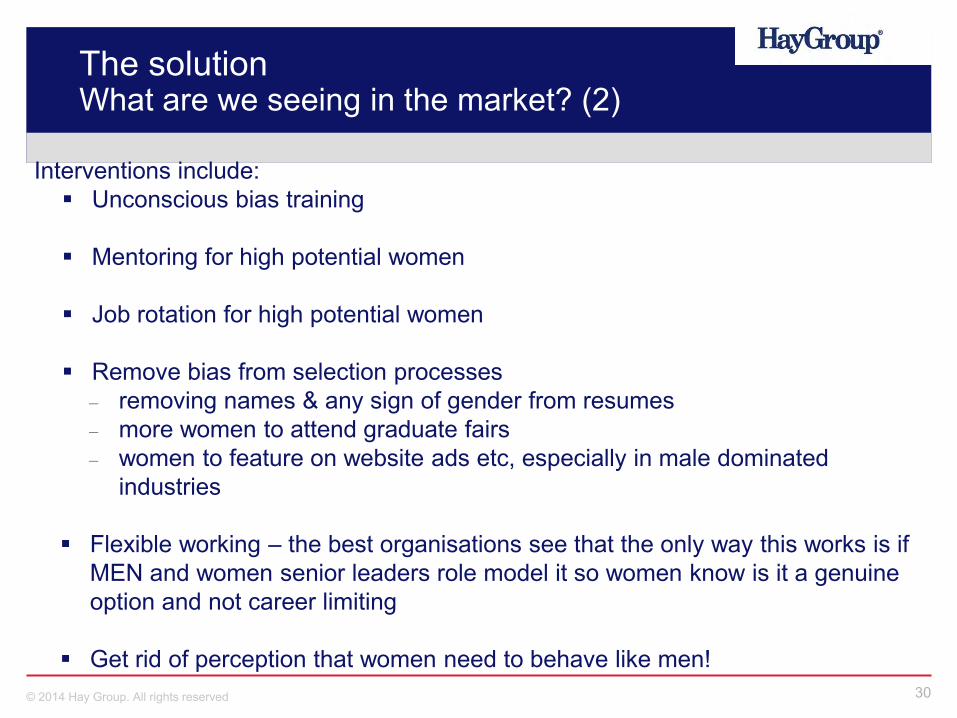
The solutionWhat are we seeing in the market? (2)
Interventions include: Unconscious bias training
Mentoring for high potential women
Job rotation for high potential women
Remove bias from selection processes removing names & any sign of gender from resumes more women to attend graduate fairs women to feature on website ads etc, especially in male dominated
industries
Flexible working – the best organisations see that the only way this works is if MEN and women senior leaders role model it so women know is it a genuine option and not career limiting
Get rid of perception that women need to behave like men!
31© 2014 Hay Group. All rights reserved
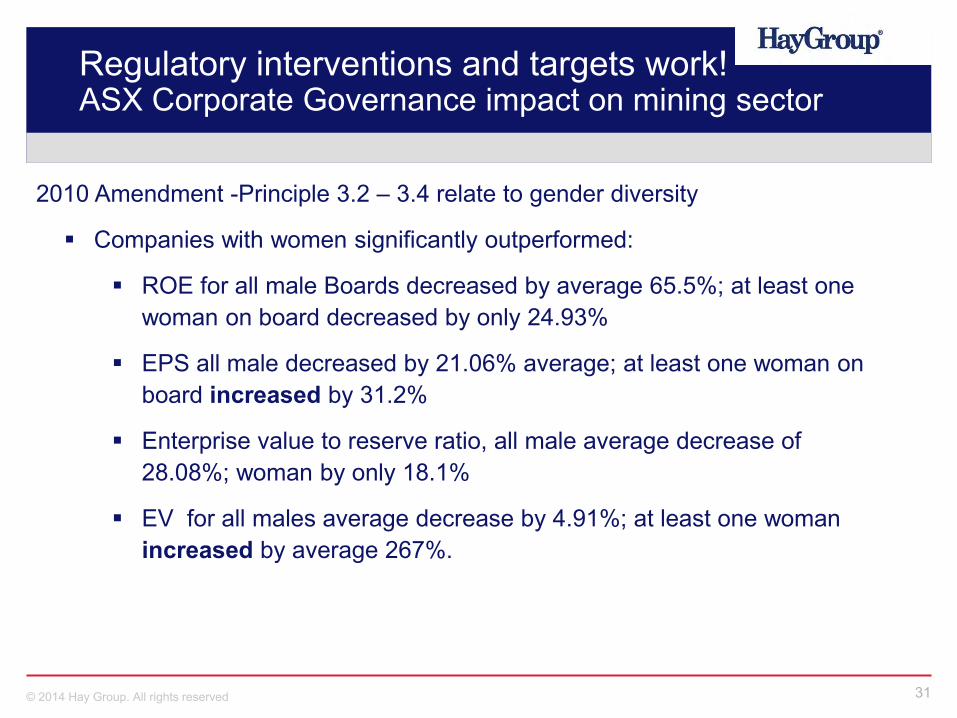
Regulatory interventions and targets work!ASX Corporate Governance impact on mining sector
2010 Amendment -Principle 3.2 – 3.4 relate to gender diversity
Companies with women significantly outperformed:
ROE for all male Boards decreased by average 65.5%; at least one woman on board decreased by only 24.93%
EPS all male decreased by 21.06% average; at least one woman on board increased by 31.2%
Enterprise value to reserve ratio, all male average decrease of 28.08%; woman by only 18.1%
EV for all males average decrease by 4.91%; at least one woman increased by average 267%.
32© 2014 Hay Group. All rights reserved
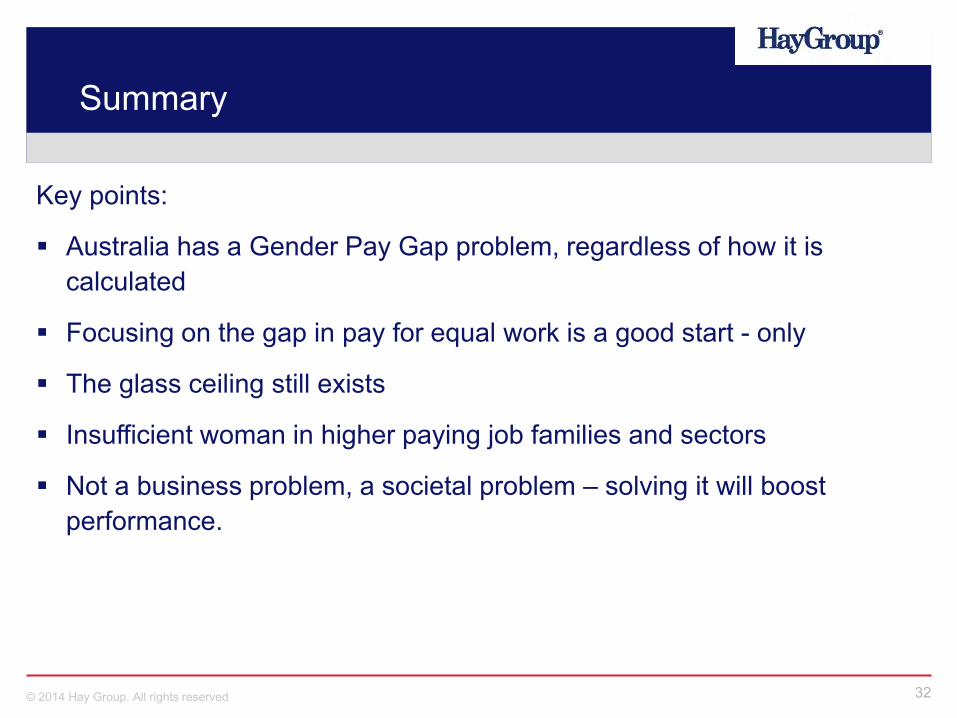
Summary
Key points:
Australia has a Gender Pay Gap problem, regardless of how it is calculated
Focusing on the gap in pay for equal work is a good start - only
The glass ceiling still exists
Insufficient woman in higher paying job families and sectors
Not a business problem, a societal problem – solving it will boost performance.

What now?
34© 2014 Hay Group. All rights reserved
What now
Have you set gender diversity targets by job level?
Are you specifically targeting starting at the lower levels in order to increase your talent pool?
Are you focusing on the BIG problems of glass ceiling and prevalence or solving the “relatively smaller” problem of equal pay for equal work?
Do leaders know what is expected from them and what role they play in implementing the changes required to meet the organisation’s gender goals?
Are you “doing” diversity at home or only in the workplace?