general fate model for microconstituents in an activated ... › bitstream › 10393 ›...
TRANSCRIPT

General Fate Model for Microconstituents in an
Activated Sludge System
Bahman Banihashemi
Thesis submitted to the
Faculty of Graduate and Postdoctoral Studies
in partial fulfilment of the requirements
for the Doctorate in Philosophy degree in Environmental Engineering
Ottawa-Carleton Institute for Environmental Engineering
Department of Civil Engineering
Faculty of Engineering
University of Ottawa
© Bahman Banihashemi, Ottawa, Canada 2014
ii
Abstract
Mathematical models elaborated for removal of microconstituents (MCs) in activated
sludge (AS) system have not incorporated developments in International Water
Association (IWA) models. In this thesis, sorption and biodegradation kinetic models that
can be applied to describe transformation of MCs in an AS process were evaluated
(volatilization and photodegradation were considered negligible).
Bisphenol-A (BPA), 17α-ethinylestradiol (EE2), and triclosan (TCS) have been
selected as target compounds in this thesis. Sorption batch tests were conducted to
retrieve kinetic and equilibrium data. Nine lab-scale continuous flow porous-pot
bioreactors operating at various solids retention times (SRTs) and hydraulic retention
times (HRTs) were studied for biodegradation of MCs. The effects of SRT, HRT and the
biomass concentration on sorption and removal of MCs were also investigated and the
results of each phase were incorporated into MCs fate models. Freundlich and linear
sorption isotherms and pseudo-second-order kinetic models with different kinetic rates
were found to best fit the sorption and desorption results. The result of biodegradation
study in the presence of 20 µg/L of MCs demonstrated 90-98, 63-91 and 97-98% mean
removal rates of BPA, EE2 and TCS, respectively, in systems operating at SRT of 5–15 d

iii
and HRT of 4-10 h. Calculation of mass fluxes of selected MCs in the dissolved and
particulate phases showed that biotransformation was the principal removal mechanism
of targeted MCs.
The fate models for the degradation mechanism of selected MCs were evaluated by
applying various mathematical models. The pseudo-second-order model was found to
best fit the results when active MCs degraders (XC) were used in the model. It was found
that biodegradation studies should incorporate XC and not mixed liquor suspended solids
concentration in their kinetic formulations. Therefore, the result of this study could be
seen in the context, where the active MCs degraders are proposed to reduce the
variability of biodegradation kinetic rates in AS systems operating at different operational
conditions. Finally nitrification inhibitors, allylthiourea (ATU) were added to reactors
and it was found that although nitrification process affects the fate of MCs in AS system,
heterotrophs were most likely responsible for the biotransformation of the targeted MCs.

iv
This thesis is dedicated to my beloved wife Sara for her dedicated
support and encouragement;
and also to my dear parents Hossein and Fereshteh for instilling the importance of
hard work and higher education

v
Acknowledgements
It is an honor for me to thank those who made this thesis possible and words fail to
appreciate them in a way that it should be.
First and foremost, I would like to give my sincere gratitude to Dr. Ronald Droste for
his extraordinary supervision, guidance, and contribution which have helped me form and
strengthen this thesis and the work presented herein. I would like to acknowledge all my
friends and colleagues in the department of civil engineering at the University of Ottawa
for their supports specially Drs. Kennedy and Delatolla for their consultations.
Above all I would like to convey particular thanks to my family for their unwavering
encouragement and inseparable supports. Special thanks to my wife, Sara, who always
supported me in every moment in my life; she is my most important motivation to start
such a long journey.
I also acknowledge funding support from the Natural Sciences and Engineering
Research Council of Canada.

vi
Publications
Banihashemi B, Droste RL. Evaluation of Biodegradation Kinetics Models for
Microconstituents Under Typical Sewage Treatment Conditions. Water
Environment Federation 2011: 5049-5061.
Banihashemi B, Droste RL. Trace level determination of bisphenol-A in wastewater and
sewage sludge by high-performance liquid chromatography and UV detection.
Water Quality Research Journal of Canada 2013; 48: 133-144.
Banihashemi B, Droste RL. Sorption-desorption and biosorption of bisphenol A,
triclosan, and 17alpha-ethinylestradiol to sewage sludge. Sci Total Environ 2014;
487: 813-21.
Banihashemi B, Droste RL. Fate of Bisphenol A, Triclosan, and 17α-ethinylestradiol In
Simulated Activated Sludge Bioreactors, 2014. Submitted to Journal of
Environmental Technology & Innovation.
Banihashemi B, Droste RL. The Role of Nitrification and Heterotrophic Biomass on
Biodegradation of MCs in Activated Sludge System, 2014. In preparation.
Banihashemi B, Droste RL. General Fate Model for Microconstituents under Typical
Sewage Treatment Conditions, 2014. Submitted to Water Research Journal.

vii
Table of Contents
Abstract ........................................................................................................................ ii
Acknowledgements ..................................................................................................... v
Publications ................................................................................................................ vi
Table of Contents ...................................................................................................... vii
List of Tables .............................................................................................................. xi
List of Figures ........................................................................................................... xiv
Abbreviations .......................................................................................................... xvii
Nomenclature ............................................................................................................ xx
Chapter 1: Introduction ............................................................................................. 1
1.1 Problem Statement .............................................................................................. 1
1.2 Thesis Motivation and Contributions .................................................................. 6
1.3 Thesis Organization ............................................................................................ 8
1.4 References ......................................................................................................... 14
Chapter 2: Technical Background .......................................................................... 16
2.1 Introduction to Microconstituents ..................................................................... 17
2.2 Occurrence and Transformation of MCs in the Environment .......................... 21
2.3 Choosing Target MCs ....................................................................................... 24
2.3.1 Presence in Canadian environment ............................................................ 25
2.3.2 Chemical-physical properties ..................................................................... 27
2.3.3 Health and environment concern ............................................................... 30
viii
2.3.4 Characterization of selected MCs .............................................................. 33
2.4 Sorption Studies Review ................................................................................... 40
2.5 Biodegradation Studies Review ........................................................................ 44
2.6 Biodegradation Kinetics Models for MCs in AS Systems ................................ 52
2.6.1 Microconstituents fate model development ............................................... 59
2.6.2 Biodegradation models used in commercial modeling software ............... 62
2.7 Summary and Conclusion ................................................................................. 66
2.8 References ......................................................................................................... 67
Chapter 3: Analytical Methods ................................................................................ 84
3.1 Introduction ....................................................................................................... 85
3.2 Material and Methods ....................................................................................... 87
3.2.1 Chemicals ................................................................................................... 87
3.2.2 Extraction of liquid samples ...................................................................... 88
3.2.3 Extraction of solid samples ........................................................................ 90
3.3 Results and Discussion ..................................................................................... 93
3.3.1 Optimization of solid phase extraction ...................................................... 93
3.3.2 Results of method comparison for extraction of BPA in sludge samples .. 99
3.3.3 Validation of the method ......................................................................... 101
3.4 Conclusion ...................................................................................................... 104
3.5 Modification of Analytical Method for TCS and EE2 .................................... 105
3.6 Conventional Chemical Analysis .................................................................... 107
3.7 References ....................................................................................................... 108
Chapter 4: Sorption-desorption and biosorption of MCs to AS......................... 113
4.1 Introduction: .................................................................................................... 115
4.2 Material and Methods: .................................................................................... 120
4.2.1 Chemical and reagents ............................................................................. 120
4.2.2 Activated sludge, synthetic wastewater and inactivation treatment ........ 121
ix
4.2.3 Sorption experiments with activated and inactivated sludge ................... 124
4.2.4 Desorption experiments ........................................................................... 125
4.2.5 Sample preparation and analytical methods ............................................ 126
4.2.6 Calculation methods ................................................................................. 129
4.3 Results and Discussion ................................................................................... 131
4.3.1 Sorption equilibrium to inactive AS ........................................................ 131
4.3.2 Physicochemical sorption versus biosorption to inactive and active AS . 131
4.3.3 Sorption and desorption kinetics of MCs onto inactive AS ..................... 136
4.4 Conclusions ..................................................................................................... 142
4.5 References ....................................................................................................... 143
Chapter 5: Fate of MCs In Simulated AS Bioreactors ........................................ 150
5.1 Introduction: .................................................................................................... 152
5.2 Material and Methods: .................................................................................... 160
5.2.1 Experimental overview ............................................................................ 160
5.2.2 Activated sludge, synthetic wastewater and Porous-Pot Bioreactor ........ 161
5.2.3 Batch sorption experiments ...................................................................... 167
5.2.4 Continuous-flow experiments .................................................................. 168
5.2.5 Chemical and analytical method .............................................................. 170
5.2.6 Calculation methods ................................................................................. 172
5.2.7 Statistical analysis .................................................................................... 175
5.3 Results and Discussion ................................................................................... 176
5.3.1 Sorption to inactive AS ............................................................................ 176
5.3.2 Continuous-flow experiments .................................................................. 181
5.4 Conclusions ..................................................................................................... 197
5.5 References ....................................................................................................... 198
Chapter 6: General Fate Model for MCs under Typical Sewage Treatment
Conditions ...................................................................................................................... 207

x
6.1 Introduction: .................................................................................................... 208
6.2 Methods ........................................................................................................... 215
6.2.1 Bioreactors ............................................................................................... 215
6.2.2 Biodegradation Experiments .................................................................... 216
6.2.3 Estimation of Active Heterotrophic Biomass .......................................... 217
6.2.4 Analytical method .................................................................................... 218
6.2.5 Calculation methods ................................................................................. 219
6.2.6 Model parameter estimation and model validation .................................. 221
6.3 Results and Discussion ................................................................................... 222
6.3.1 MCs biodegradation results ..................................................................... 222
6.3.2 Parameter estimation results .................................................................... 226
6.3.3 Evaluation of biodegradation kinetic models .......................................... 230
6.4 Conclusions ..................................................................................................... 231
6.5 References ....................................................................................................... 232
Chapter 7: Discussions and Conclusions .............................................................. 239
Appendices ............................................................................................................... 242
Appendix A: Extraction systems used for selected MCs ...................................... 243
Appendix B: Reactors performance in phases A and B ........................................ 247
xi
List of Tables
Table 2-1 Physico-chemical characteristics and biodegradability of selected MCs ... 39
Table 2-2 Model of the AS Process for Carbon Removal .......................................... 52
Table 2-3 Zero-, first- and pseudo first-order models for biological degradation of
MCs found in the literature. .............................................................................................. 54
Table 2-4 Growth kinetic models of biomass with substrate inhibition ..................... 55
Table 2-5 Possible Rate Formulations for biological degradation of MCs ................ 56
Table 2-6 Petersen matrix for specific MC degrading biomass model (Lindblom et al.,
2009) ................................................................................................................................. 57
Table 3-1 SPE and analytical condition for liquid chromatography-ultraviolet analysis
of BPA .............................................................................................................................. 99
Table 3-2 Spiked concentration of BPA in sludge samples, mean recovery, and
relative standard deviation (RSD) ................................................................................... 100
Table 3-3 Precision and mean recovery data of the extraction and analytical procedure
to detect BPA in solid and liquid samples ...................................................................... 104
Table 3-4 Result of one-way ANOVA and Tukey analysis for BPA recoveries from
three porous pot reactors (Multiple Comparisons) ......................................................... 104
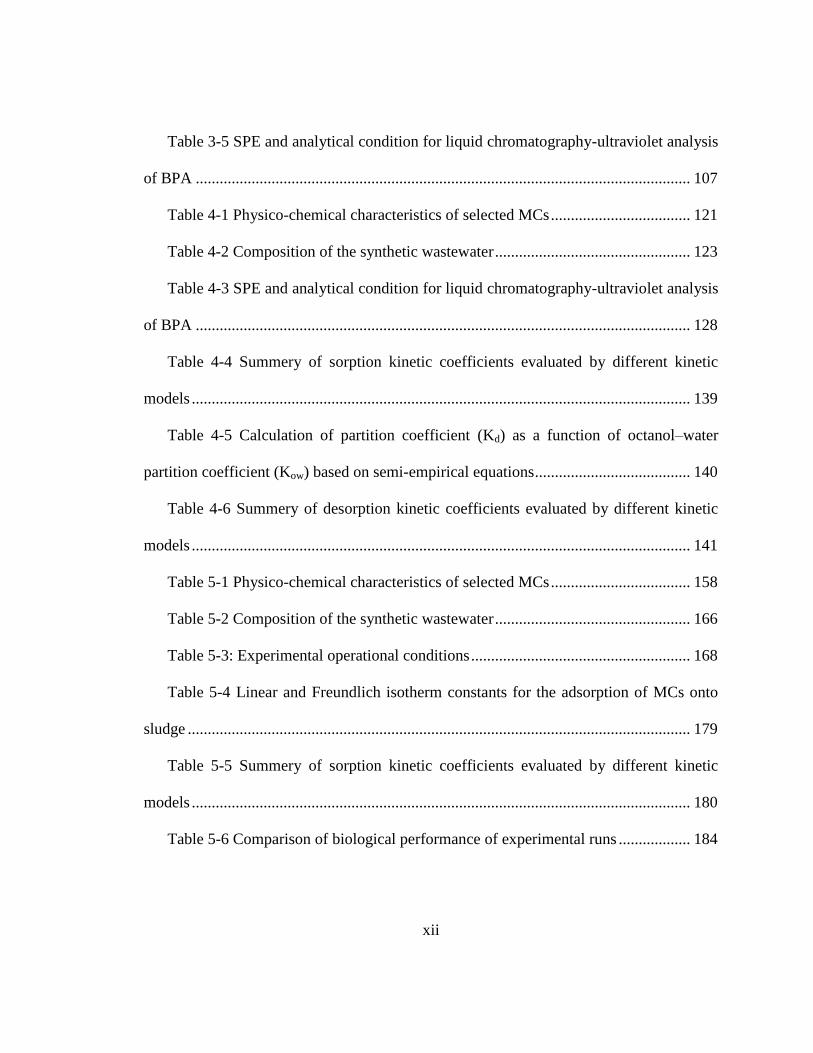
xii
Table 3-5 SPE and analytical condition for liquid chromatography-ultraviolet analysis
of BPA ............................................................................................................................ 107
Table 4-1 Physico-chemical characteristics of selected MCs ................................... 121
Table 4-2 Composition of the synthetic wastewater ................................................. 123
Table 4-3 SPE and analytical condition for liquid chromatography-ultraviolet analysis
of BPA ............................................................................................................................ 128
Table 4-4 Summery of sorption kinetic coefficients evaluated by different kinetic
models ............................................................................................................................. 139
Table 4-5 Calculation of partition coefficient (Kd) as a function of octanol–water
partition coefficient (Kow) based on semi-empirical equations ....................................... 140
Table 4-6 Summery of desorption kinetic coefficients evaluated by different kinetic
models ............................................................................................................................. 141
Table 5-1 Physico-chemical characteristics of selected MCs ................................... 158
Table 5-2 Composition of the synthetic wastewater ................................................. 166
Table 5-3: Experimental operational conditions ....................................................... 168
Table 5-4 Linear and Freundlich isotherm constants for the adsorption of MCs onto
sludge .............................................................................................................................. 179
Table 5-5 Summery of sorption kinetic coefficients evaluated by different kinetic
models ............................................................................................................................. 180
Table 5-6 Comparison of biological performance of experimental runs .................. 184

xiii
Table 5-7 Mean total removal efficiency (%) of selected MCs in simulated AS
operating at different HRTs and SRTs (n= number of determination) ........................... 187
Table 5-8 Effects of HRT and SRT on total removal rate of MCs using Two-way
ANOVA .......................................................................................................................... 191
Table 5-9 The effect of nitrification inhibition on total removal rate of MCs using
two-way ANOVA (the inhibition factor was presented as 01 and 00 for presence and
absence of ATU) ............................................................................................................. 196
Table 6-1 Zero-, first- and pseudo first-order models for biological degradation of
MCs found in the literature ............................................................................................. 212
Table 6-2 Possible rate formulations for biological degradation of MCs ................. 213
Table 6-3 Physico-chemical characteristics of selected MCs ................................... 215
Table 6-4 Experimental operational conditions ........................................................ 216
Table 6-5 Comparison of biological performance of experimental runs .................. 223
Table 6-6 Mass balances (%) of the target MCs in continuous-flow AS systems .... 224
Table 6-7 Estimation of biodegradation kinetics for each model and the sum of chi
squares............................................................................................................................. 226
Table 6-8 Estimation of active MCs degraders (XC) and comparison with active
biomass (XH) ................................................................................................................... 228
Table 6-9 Evaluation of biodegradation kinetics models based on linear least squares
method............................................................................................................................. 230

xiv
List of Figures
Figure 1-1. Different types of MCs ............................................................................... 2
Figure 1-2. Structure of this thesis and summary of chapters ..................................... 13
Figure 2-1. Chemical structures of selected MCs ....................................................... 39
Figure 2-2. Proposed state model variables applied to ASM1 model after Lidblom
2009................................................................................................................................... 59
Figure 3-1. Effect of sample pH on recovery of BPA from wastewater effluent sample
........................................................................................................................................... 94
Figure 3-2. Effect of sample volume on recovery of BPA in SPE sample loading step
........................................................................................................................................... 95
Figure 3-3. Effect of volume of MeOH in solvent solution on recovery of BPA in
washing step ...................................................................................................................... 96
Figure 3-4. Effect of solvent selection on recovery of BPA in SPE elution step ....... 96
Figure 3-5. Effect of solvent ratio on recovery of BPA in HPLC-UV system ........... 97
Figure 3-6. Effect of injection volume on recovery of BPA in HPLC-UV system .... 98
Figure 3-7. Schismatic diagram of analytical procedure for analysis of BPA in liquid
and solid phases .............................................................................................................. 101
Figure 4-1. Porous pot system .................................................................................. 122
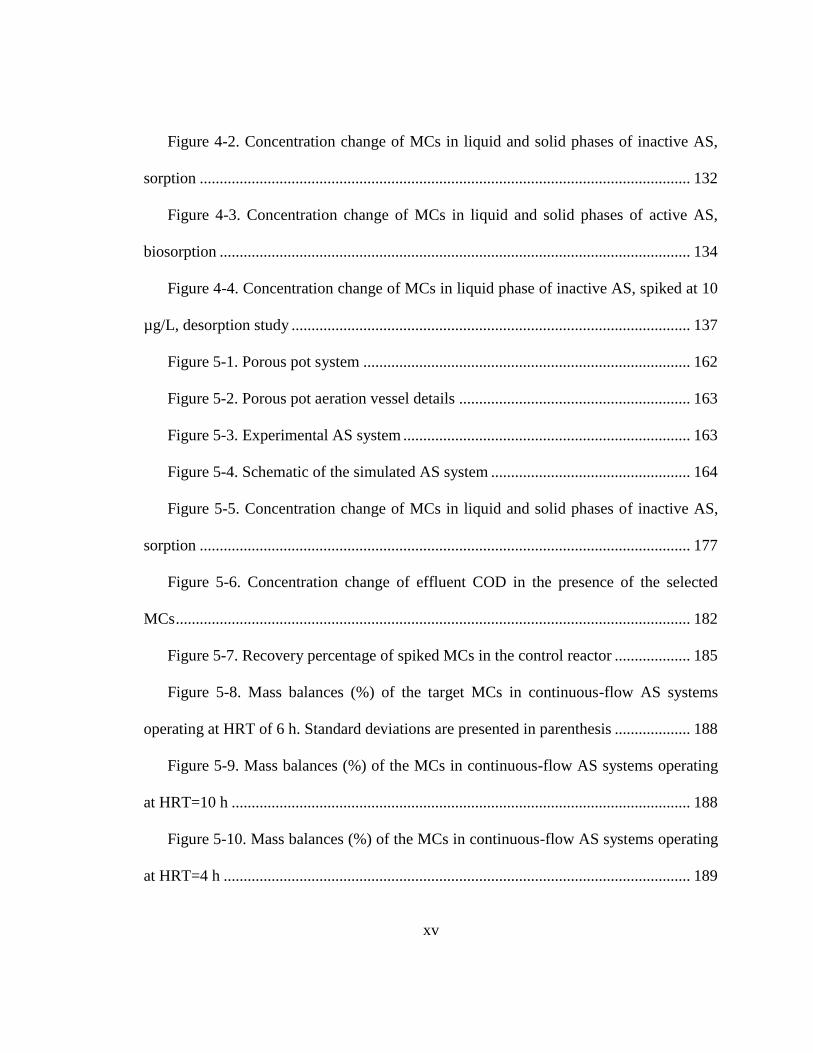
xv
Figure 4-2. Concentration change of MCs in liquid and solid phases of inactive AS,
sorption ........................................................................................................................... 132
Figure 4-3. Concentration change of MCs in liquid and solid phases of active AS,
biosorption ...................................................................................................................... 134
Figure 4-4. Concentration change of MCs in liquid phase of inactive AS, spiked at 10
µg/L, desorption study .................................................................................................... 137
Figure 5-1. Porous pot system .................................................................................. 162
Figure 5-2. Porous pot aeration vessel details .......................................................... 163
Figure 5-3. Experimental AS system ........................................................................ 163
Figure 5-4. Schematic of the simulated AS system .................................................. 164
Figure 5-5. Concentration change of MCs in liquid and solid phases of inactive AS,
sorption ........................................................................................................................... 177
Figure 5-6. Concentration change of effluent COD in the presence of the selected
MCs ................................................................................................................................. 182
Figure 5-7. Recovery percentage of spiked MCs in the control reactor ................... 185
Figure 5-8. Mass balances (%) of the target MCs in continuous-flow AS systems
operating at HRT of 6 h. Standard deviations are presented in parenthesis ................... 188
Figure 5-9. Mass balances (%) of the MCs in continuous-flow AS systems operating
at HRT=10 h ................................................................................................................... 188
Figure 5-10. Mass balances (%) of the MCs in continuous-flow AS systems operating
at HRT=4 h ..................................................................................................................... 189

xvi
Figure 5-11. Total removal of selected MCs with and without ATU inhibitor in
continuous-flow AS systems operating at different SRTs .............................................. 195
Figure 6-1. Effect of operational conditions on biomass degradation performance
normalized to VSS .......................................................................................................... 225
xvii
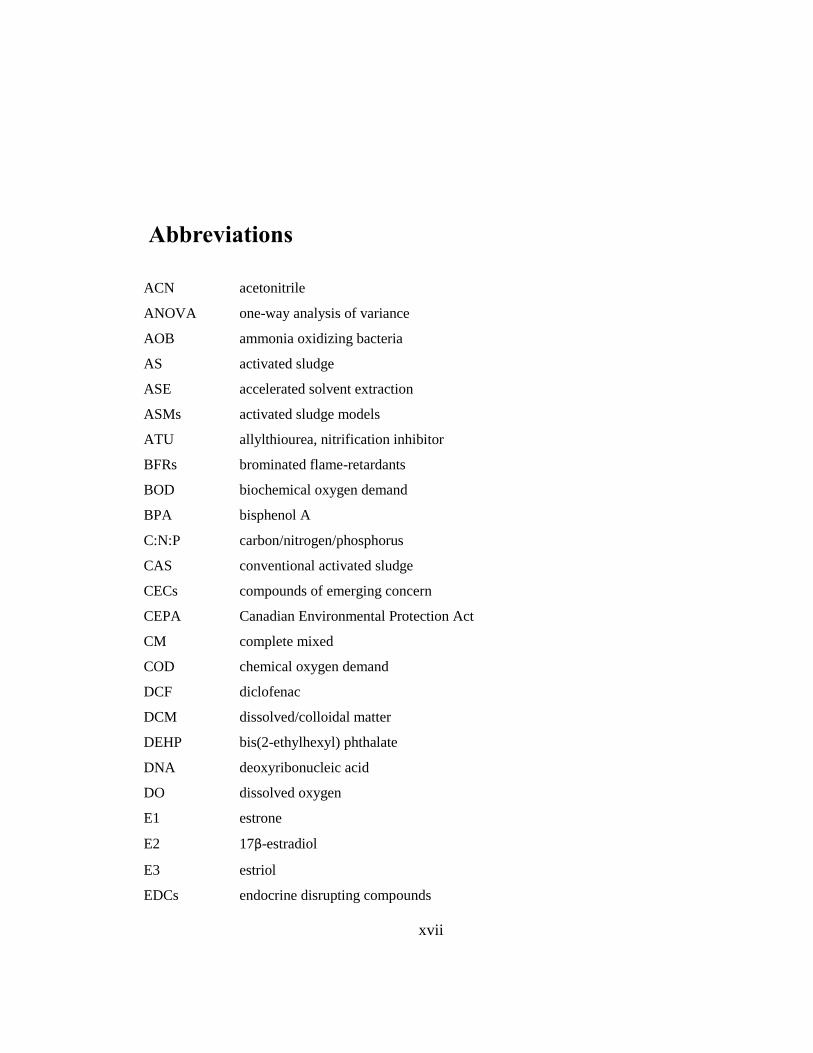
Abbreviations
ACN acetonitrile
ANOVA one-way analysis of variance
AOB ammonia oxidizing bacteria
AS activated sludge
ASE accelerated solvent extraction
ASMs activated sludge models
ATU allylthiourea, nitrification inhibitor
BFRs brominated flame-retardants
BOD biochemical oxygen demand
BPA bisphenol A
C:N:P carbon/nitrogen/phosphorus
CAS conventional activated sludge
CECs compounds of emerging concern
CEPA Canadian Environmental Protection Act
CM complete mixed
COD chemical oxygen demand
DCF diclofenac
DCM dissolved/colloidal matter
DEHP bis(2-ethylhexyl) phthalate
DNA deoxyribonucleic acid
DO dissolved oxygen
E1 estrone
E2 17β-estradiol
E3 estriol
EDCs endocrine disrupting compounds

xviii
EE2 17α-ethynilestradiol
EFSA European food safety authority
FISH fluorescent in situ hybridization
GC gas chromatography
GEM gemfibrozil
HBCDs hexabromocyclododecanes
HHCP galaxolide
HPH high-pressure homogenizer
HPLC high-performance liquid chromatography
HRT hydraulic retention time
HRT hydraulic retention time
IBP ibuprofen
IWA international water association
LC liquid chromatography
LOD limit of detection
LOQ limits of quantification
MAE microwave assistant extraction
MBR membrane bioreactor
MCs microconstituents
MeOH methanol
MLSS mixed liquor suspended solid
MLVSS mixed liquor volatile suspended solids
MS mass spectrometric
MW molecular weight
NP nonylphenol
NPEO nonylphenol ethoxylates
OP 4-tert-octylphenol
PBDEs polybrominated diphenyl ethers
PBT persistent, bioaccumulative and toxic
PF plug flow
PhACs pharmaceutically active compounds
xix
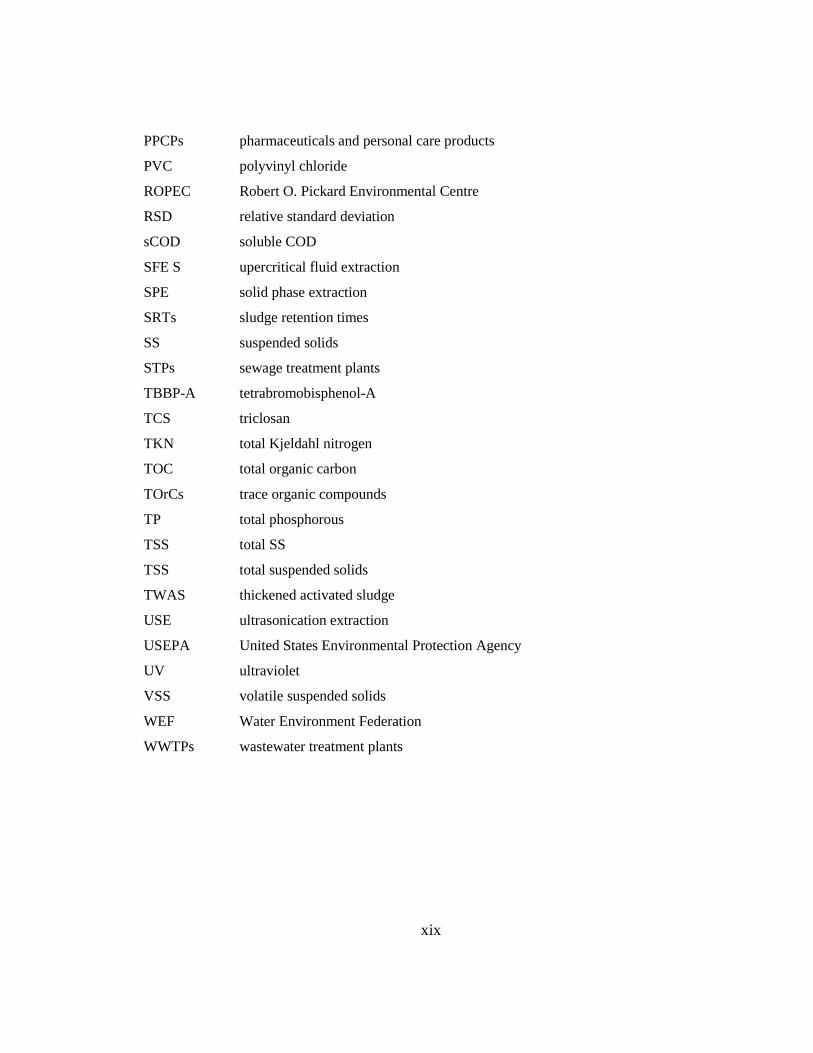
PPCPs pharmaceuticals and personal care products
PVC polyvinyl chloride
ROPEC Robert O. Pickard Environmental Centre
RSD relative standard deviation
sCOD soluble COD
SFE S upercritical fluid extraction
SPE solid phase extraction
SRTs sludge retention times
SS suspended solids
STPs sewage treatment plants
TBBP-A tetrabromobisphenol-A
TCS triclosan
TKN total Kjeldahl nitrogen
TOC total organic carbon
TOrCs trace organic compounds
TP total phosphorous
TSS total SS
TSS total suspended solids
TWAS thickened activated sludge
USE ultrasonication extraction
USEPA United States Environmental Protection Agency
UV ultraviolet
VSS volatile suspended solids
WEF Water Environment Federation
WWTPs wastewater treatment plants
xx
Nomenclature
µ maximum growth rate (d1
)
µCm maximum growth rate of MC degrading biomass (d1
)
µHm maximum growth rate of heterotrophic biomass (d1
)
b endogenous decay rate constant (d1
)
bC decay rate of specific microorganisms degrading the MC (d-1
)
bH endogenous decay (lysis) coefficient of heterotrophic bacteria (h1
)
C conc. of dissolved MC in the effluent or inside reactor (mg L1
)
C`ps conc. of MCs sorbed to non-active solids at equilibrium state (mg L1
)
C0 conc. of dissolved MC in the influent (mg L1
)
C0 initial concentrations of BPA in sludge sample (ng g-1
)
Ce equilibrium soluble concentrations of MCs (µg L-1
)
Cm measured concentrations of BPA in spiked sample (µg L-1
)
Cps concentrations of MCs sorbed to biomass at equilibrium (mg L1
)
Cs concentrations of BPA spiked into sample (µg L-1
)
fav fraction of active heterotrophic biomass
fH endogenous residue fraction
fXI fraction of nbd particulate COD released in biomass decay
H Henry coefficient (atm m3 mol
−1)
K first order rate constant (L d1
)
K1 equilibrium sorption rate constant for pseudo-first-order (L h1
)
K2 equilibrium sorption rate constant for pseudo-second-order (L h1
)
K3 equilibrium rate constant of the intra-particle transport (µg g-1
h1
)
KC half-velocity coefficient for MC degrading biomass (mg L1
)
Kd sludge-water distribution coefficient
xxi
Kdes desorption rate coefficient (d1
)
KF Freundlich isotherm constant (µg(1-1/n)
L1/n
g-1
)
kh hydrolysis rate coefficient (h-1
, g BOD g1
TSS. h1
)
KI inhibition constant
KL Langmuir isotherm constant (Lg-1
)
Km degradation constant for MCs (L g−1
SS. d−1
)
KM overall first-order degradation rate constant for MCs (d−1
)
Kmp degradation constant for sorbed MCs (L g−1
SS. d−1
)
Kms degradation constant for soluble MCs (L g−1
SS. d−1
)
Kow octanol-water partition coefficient
KS half-velocity constant for soluble degradable substrate (mg L1
)
Mb mass of biotransformed MCs (µg d-1
)
Meff mass of MCs in the effluent (µg d-1
)
Msor mass of MCs sorbed to the wasted AS (µg d-1
)
MW molecular weight
Pi estimated model parameter
pKa dissociation constant
Q flow rate (m3 s1
)
q*e calculated concentrations of MCs sorbed to inactive biomass (µg g
-1)
qe measured concentrations of MCs sorbed to inactive biomass (µg g-1
)
qt measured concentrations of sorbed MCs at time t (µg g-1
)
Qtotal total flowrate (sewage + MCs solution) (mL min-1
)
Qwasted volume of sludge wasted per day (L d-1
)
r reaction rate (mg L1
d1
)
S soluble component except for a microconstituent (mg L1
)
SI inert soluble COD (mg L1
)
SO DO/DO saturation concentration (mg O2 L1
)
SS concentration of substrate in terms of soluble COD (mg L1
)
Sw solubility in water (mg L−1
)
V volume (m3)
xxii
XC active biomass that degrade the microconstituent (mg L1
)
XH concentration of active heterotrophic biomass (mg L1
)
XI concentration of substrate in terms inert COD (mg L1
)
XS concentration of substrate in terms of particulate COD (mg L1
)
XT total concentration of solids (mg L1
)
Xv volatile SS concentration (mg L1
)
Xve VSS concentration in the effluent (mg L1
)
YC yield factor of the active mass degrading the MC (g g1
)
YH yield factor of the active heterotrophic biomass (g g1
)
σ standard deviation
χ2 chi-squared
d hydraulic retention time (h)
X solids retention time (d)

| 1 P a g e
Chapter 1: Introduction
1.1 Problem Statement
The occurrence and the fate of toxic, biopersistent microconstituents (MCs) in water
sources and their removal in wastewater treatment plants (WWTPs) as major point
sources are a growing concern since some of these substances remain at detectable levels
in WWTP effluents. MCs were defined by the Water Environment Federation (WEF) as
“natural and human-made substances, including elements and inorganic and organic
chemicals, detected within water and the environment for which a prudent course of
action is suggested for the continued assessment of the potential impact on human health
and the environment.’’
MCs can be classified as natural and synthetic compounds. Natural sources include
hormones excreted by humans and animals, substances found in metals, inorganic ions,
plants or fungi, and by-products of natural combustion processes. Synthetic MCs include
certain biocides (pesticides, herbicides, and fungicides) and their degradation products,
pharmaceuticals and personal care products (PPCPs), combustion by-products from
burning fossil fuels and incineration of industrial and municipal waste, industrial
chemicals and by-products in their production as well as their environmental degradation
P a g e | 2
products. Although pesticides and other toxins have long been recognized as persistent,
bioaccumulative, and toxic (PBT) agents, only in the past couple of decades through
work in which the Canadian National Water Research Institute (e.g., see NWRI
Publications, 1997) was seminal, has there been recognition of environmental
ramifications of MCs that are indeed in low concentrations at the source, e.g., agents in
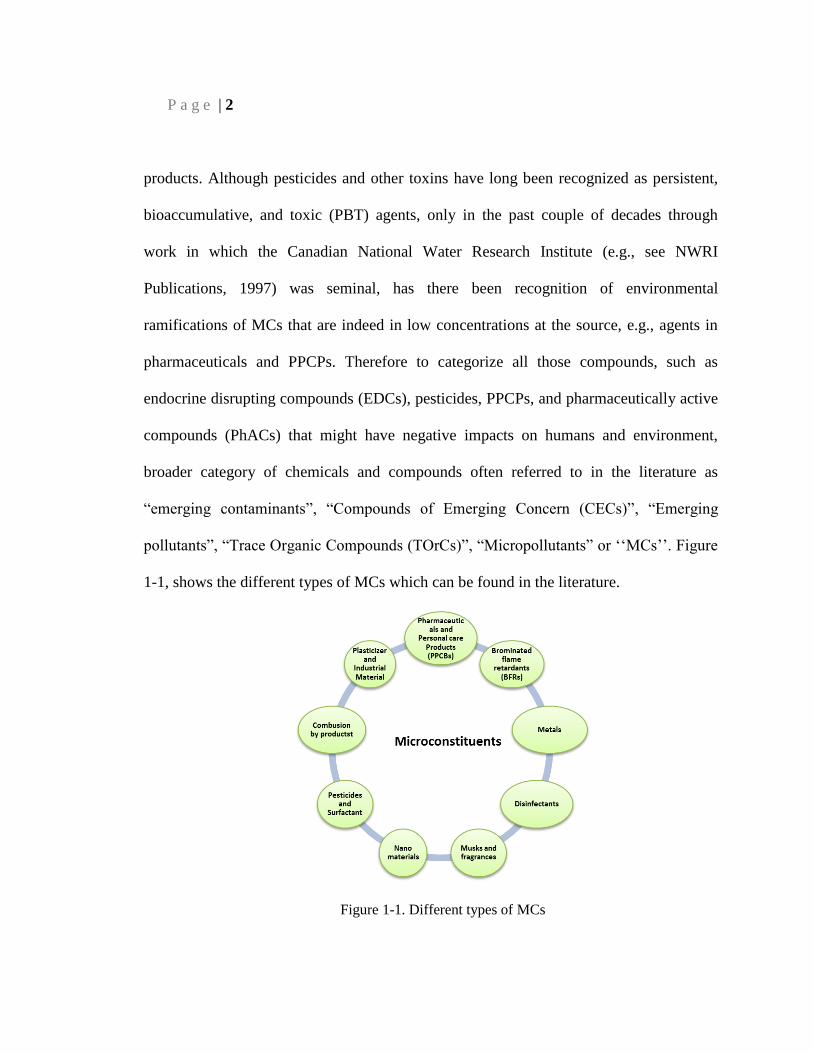
pharmaceuticals and PPCPs. Therefore to categorize all those compounds, such as
endocrine disrupting compounds (EDCs), pesticides, PPCPs, and pharmaceutically active
compounds (PhACs) that might have negative impacts on humans and environment,
broader category of chemicals and compounds often referred to in the literature as
“emerging contaminants”, “Compounds of Emerging Concern (CECs)”, “Emerging
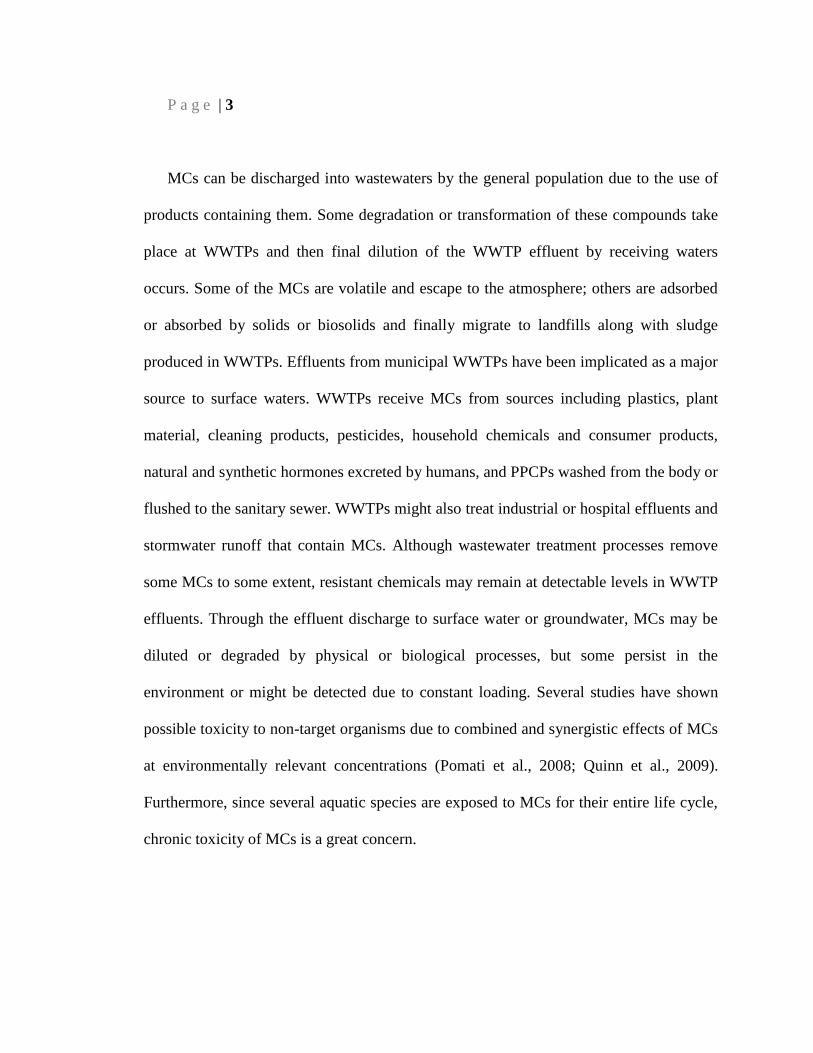
pollutants”, “Trace Organic Compounds (TOrCs)”, “Micropollutants” or ‘‘MCs’’. Figure
1-1, shows the different types of MCs which can be found in the literature.
Figure 1-1. Different types of MCs
P a g e | 3
MCs can be discharged into wastewaters by the general population due to the use of
products containing them. Some degradation or transformation of these compounds take
place at WWTPs and then final dilution of the WWTP effluent by receiving waters
occurs. Some of the MCs are volatile and escape to the atmosphere; others are adsorbed
or absorbed by solids or biosolids and finally migrate to landfills along with sludge
produced in WWTPs. Effluents from municipal WWTPs have been implicated as a major
source to surface waters. WWTPs receive MCs from sources including plastics, plant
material, cleaning products, pesticides, household chemicals and consumer products,
natural and synthetic hormones excreted by humans, and PPCPs washed from the body or
flushed to the sanitary sewer. WWTPs might also treat industrial or hospital effluents and
stormwater runoff that contain MCs. Although wastewater treatment processes remove
some MCs to some extent, resistant chemicals may remain at detectable levels in WWTP
effluents. Through the effluent discharge to surface water or groundwater, MCs may be
diluted or degraded by physical or biological processes, but some persist in the
environment or might be detected due to constant loading. Several studies have shown
possible toxicity to non-target organisms due to combined and synergistic effects of MCs
at environmentally relevant concentrations (Pomati et al., 2008; Quinn et al., 2009).
Furthermore, since several aquatic species are exposed to MCs for their entire life cycle,
chronic toxicity of MCs is a great concern.

P a g e | 4
Because of this growing interest, scientists have studied the environmental fate and
toxicology properties of MCs (Melcer and Klecka, 2011; Radjenovic et al., 2009;
Samaras et al., 2013) and although no legal limits have been established yet, regulatory
authorities around the world have conducted monitoring programs and risk assessments
of different MCs for future guidelines of concentration limits of MCs in water bodies or
in discharged WWTPs effluent (Roig, 2010).
Conventional wastewater treatment systems, such as activated sludge (AS) are not
designed to remove MCs at very low concentration. In addition, advanced treatment
methods, such as membrane bioreactor (Lee et al., 2008), advanced oxidation (Plahuta et
al., 2014), ozonation or use of granulated activated carbon (Margot et al., 2013), are
being explored. However; these treatment options are often expensive to install and
operate and might only be feasible for larger WWTPs. Therefore, information on how
various MCs are removed from current facilities need to be studied and opportunities to
optimize and enhance their treatment need to be explored which requires understanding
of the effect of operational conditions, environmental parameters and compound specific
properties on the fate of MCs in treatment processes.
The environment in a WWTP biotreatment process, which is the most common form
of wastewater treatment, is significantly different from the natural environment. The
environment in a biotreatment reactor is rich in organics with a high concentration of
suspended solids (SS) which includes a significant concentration of acclimated

P a g e | 5
microorganisms. Some MCs can be utilized as primary substrates but others are utilized
as secondary substrates in conjunction with a primary substrate, i.e., co-metabolism. In
biotreatment, the possibility of co-metabolism exists which is a significant route for “real
treatment”, i.e., the rendering of a harmful substance as a completely harmless entity.
The partitioning of MCs between solid and liquid phases is significant due to the
large concentration of biomass and associated solids. Furthermore, stripping of volatile
compounds is enhanced due to the intense aeration required in AS processes and the
favourable environment for stripping in other processes such as a trickling filter.
Accumulation of MCs on solids wasted from a biotreatment operation or losses of them
through volatilization are not real treatments but nonetheless they are significant
phenomena that affect the fate of MCs in biotreatment or throughout a WWTP.
The number of phenomena and factors affecting the fate of MCs is large, demanding
a robust experimental protocol to elucidate all phenomena. Models are still in a state of
development and different conceptualizations and data acquisition commensurate with
the model, coupled with natural variation, have led to a considerable variability and
inconsistency in reported information. The mathematical models developed for design
and operation of biological wastewater treatment such as those from the International
Water Association (IWA) were only developed to describe removal of chemical oxygen
demand (COD), nitrogen and phosphorus and not concerned with specific chemical
compounds. Consequently commercial modeling software for MCs removal in secondary
P a g e | 6
WWTPs such as SimpleTreat, ASTreat, STP, and TOXCHEM+ have been developed,
but the models used in these packages for various MCs with different physico-chemical
properties and biodegradability have not incorporated developments in IWA models
which present numerous possibilities that have not been evaluated.
Although the presence of MCs during wastewater treatment has been studied by a
plethora of reports, significant differences on their concentration levels and removal rates
as well as contradictory results on their fate have been reported (Deblonde et al., 2011;
Stasinakis et al., 2010). Most studies do not report sufficient information to evaluate the
possible fate models for MCs removal and incorporates all those findings from other
researchers; furthermore, assumptions are often not experimentally verified.
Consequently only limited normalization is possible to relate models or rate coefficients.
On the other hand, it should be mentioned that the majority of environmental surveys
previously undertaken have mainly been focused on dissolved concentrations of these
compounds in wastewater at environmentally relevant concentrations (Feng et al., 2010;
Radjenovic et al., 2009; Seyhi et al., 2011). Only in the last few years researchers started
to study the MCs concentration in the solid phase at very low concentrations (Nie et al.,
2009; Stasinakis et al., 2010; Stevens-Garmon et al., 2011; Zhao et al., 2008).
1.2 Thesis Motivation and Contributions
This research provides the new fundamental understanding of the kinetic models for
removal of MCs in AS system. Beyond studying the biodegradation and sorption kinetics,
P a g e | 7
the role of sludge retention time (SRT) and hydraulic retention time (HRT) in removal of
MCs is investigated and the role of nitrification and nitrifiers versus heterotrophs is
studied.
It is important to understand the concept of “removal” when discussing the fate of
MCs in WWTP biotreatment process. Studies have shown that for many MCs,
transformation by-products (conjugated or metabolized form of parent compound) exist
and may even exceed the concentration and/or toxicity of the parent form (Dann and
Hontela, 2011; Kang et al., 2006; Prasse et al., 2012). Nevertheless, the first kinetic step
in any biotreatment systems is the transformation of parent compounds into non-parent
forms that must be quantified as a first measure to understand the fate of MCs in
WWTPs. Therefore, the term “removal” in this thesis generally refers to all the losses of
MCs parent compounds from aqueous or solid phases. Therefore, possible by-products of
MCs and their toxicity level have not been studied in this research. There are two major
facets of the research which are undertaken in experimentation: (1) evaluate both solid
and liquid phase biodegradation kinetics and (2) determine the simplest model that
encompasses all important phenomena. The impacts of active mass and particulate debris
in mixed liquor are delineated. The overall long-term objectives of the study are to
improve biodegradation kinetics models for MCs. The specific objectives of the proposed
research are as follows.
P a g e | 8
1. Review existing kinetic models for MC removal in biotreatment processes in
WWTPs and determine the most general model(s) for adsorption and particularly for
biodegradation to be allied with the data collected in this study that unifies data for
different groups of compounds or specific compounds.
2. Conduct batch sorption studies to develop the best fit adsorption isotherms that
are based on total SS (TSS) and volatile SS (VSS). Both sorption and desorption kinetics
are determined.
3. Conduct bench-scale continuous-flow AS studies to gather data and evaluate the
removal of various MCs under different operating conditions in both the liquid and solid
phases. Nitrification inhibitor is added to reactors to study the role of nitrification and
nitrifiers versus heterotrophic biomass during biotransformation of MCs.
4. Develop biodegradation models for individual MCs based on the laboratory data
acquired in this study and data from the literature. Advantages and disadvantages of
different models are outlined. The most practical model that can be applied in the field,
cognizant of data acquisition limitations at most WWTPs, in addition to the most
theoretically correct model is described.
1.3 Thesis Organization
The first chapter in this study (Chapter 1) consists of the background information on
the significance of this research as well as the objectives of this study.

P a g e | 9
Chapter 2 presents the literature review explaining the different removal pathways of
MCs in typical sewage treatment and the different operational conditions and factors
which influence the removal efficiency of these compounds. Besides, three specific
compounds, namely 17α-ethinylestradiol (EE2), bisphenol-A (BPA), and triclosan (TCS)
that represent the broad range of MCs in environment are identified and a broad
description of selected MCs is provided, detailing their most relevant physico-chemical
properties which influence their fate and behaviour along sewage treatment. The chapter
finishes with the literature review for the kinetic models that can be used to describe
transformation of MCs (volatilization and photodegradation were considered negligible)
in an AS process.
Chapter 3 describes the experimental methods employed to carry out the
experimental work and presents a description of the laboratory reactors to simulate AS
system, and methodologies used. In this chapter, the analytical methods for determination
of conventional parameters (e.g. organic matter, nitrogen, temperature, solids content, pH
and dissolved oxygen) are detailed. Furthermore, a simple and economical method for the
extraction and determination of selected MCs, using high-performance liquid
chromatography (HPLC) coupled with ultraviolent (UV) detection at environmentally
relevant concentrations in both dissolved and particulate phases are explained.
In Chapter 4, batch experiments with activated and deactivated sludge originating
from continuous flow porous-pot reactors operating at SRTs of 5, 10, and 15 days are
P a g e | 10
conducted in order to investigate the sorption kinetics and distinguish physicochemical
sorption and biosorption. The effect of SRT and the biomass concentration on sorption
kinetics is also studied. Selected MCs shows high sorption affinity to the non-active
biomass during the first 30 min of the experiment, which is gradually reduced until
equilibrium is reached. Desorption results shows two distinct stages, a very rapid
desorption within 20 min followed by a slow desorption stage. Biosorption study
indicates that the soluble concentrations of target compounds decreased rapidly for
selected MCs similar to the sorption study; however, the soluble and solid phase
concentrations continues to decrease slowly during the length of the experiment which
indicates the possible biodegradation of these compounds in both phases. Finally,
mathematical models are applied to describe the sorption and desorption mechanism and
Freundlich isotherms with values of 1/n close to 1 are found to best fit the results which
demonstrate that all tested concentrations result on the linear part of the Freundlich
isotherm. Calculation of the Freundlich constant, KF and distribution coefficient, Kd
exhibits the greater tendency of EE2 and TCS for sorption, compared to BPA. The results
of this study indicates that the SRT has a clear effect on the sorption kinetics where the
highest sorption rate constant is achieved for a SRT of 10 days for all three target
substances. This could be due to change of the morphology of the biomass from reactors
operating at different SRTs.
P a g e | 11
Chapter 5 describes the fate of selected MCs in simulated AS systems. In this
chapter biodegradation and sorption were investigated at the µg/L range for EE2, BPA,
and TCS. The effects of SRT, HRT and the biomass concentration on sorption and
removal of MCs were also studied. The result of batch study in chapter 4 is used to
compare with the sorption rates estimated using the concentration of MCs in solid and
liquid phases from continuous-flow reactors. The sorption kinetic data are modeled using
intra-particle diffusion model, pseudo-first-order and pseudo-second-order equations. The
operation of continuous-flow AS systems in the presence of 20 µg/L of MCs indicated
that 90-98, 63-91 and 97-98% of BPA, EE2 and TCS, respectively, can be removed
during the AS process in systems operating at SRT of 5–15 d and HRT of 4-10 h.
Determination of MCs in the dissolved and particulate phase and calculation of their
mass flux showed that biotransformation was the principal removal mechanism of
selected MCs. Statistical analysis revealed that both SRT and HRT had a significant
effect on the fate of MCs where highest biotransformation removal rate was found for
TCS and BPA in reactors operating at higher SRTs whereas the lower rate of 58% was
found for EE2 in the reactor operating at SRT of 5 d and HRT of 4 h. The MCs removal
rate in the presence of nitrification inhibitor illustrated the role of heterotrophs versus
autotrophs in fate of MCs. It was found that heterotrophs were most likely responsible for
the degradation of selected MCs.

P a g e | 12
In Chapter 6, mathematical models were applied to describe the degradation
mechanism of selected MCs. In this chapter the mixed liquor aliquots were decanted from
reactors at beginning of each experimental phase and the active fraction of the mixed
liquor was determined. The biological degradation rate constants (Km, Kms, Kmp) as well
as the concentration of active MC degraders (XC) were estimated from fitting the
analytical solution to the measured data found in previous chapter by minimizing the sum
of the squares of the weighted derivatives χ2 between measurements and the calculated
model results. The AQUASIM and Excel software were used in this study for parameter
estimation and model comparison. The result of XC estimation showed that the SRT plays
an important role in formation of the biomass capable of degrading selected MCs. It is
also observed that the MCs degraders are naturally present in the AS system even at low
SRTs, however the concentration of XC is much lower in SRTs of 5 d comparing to SRT
15 d. Evaluation of various biodegradation kinetic models showed poor agreement
between measured data and modeled values except for pseudo-second-order model with
degradation by active MCs degraders only in soluble phase. The result of this study could
be seen in the context, where the active MCs degraders are proposed to reduce the
variability of Km in AS systems operating at different operational conditions.
Finally, Chapter 7 presents all conclusions drawn from this research in regards to
fate of MCs in AS system and biodegradation kinetic models that describe their fate as
well as possible future extensions to this thesis.

P a g e | 13
Figure 1-2, illustrates the structure of this thesis as well as the summary of chapters
and published or submitted journal papers.
Figure 1-2. Structure of this thesis and summary of chapters
Paper III:
Sorption-desorption and biosorption of selected MCs to AS
Theoretical and Technical Background
Introduction
Paper II:
Development of analytical technique for selected MCs in both solid and
liquid phases using HPLC-UV
Background on fate of MCs in AS
systems
Background on sorption mechanism
of MCs to AS
Paper I:
Background on biodegradation kinetic models for MCs
Analytical method development
Sorption batch study
Paper VI:
Evaluation of biodegradation kinetic models
Conclusions and Recommendations
Chapter 2
Chapter 3 Chapter 4
Chapter 6
Chapter 5
Paper IV:
Fate of selected MCs in
AS system
Biodegradation study
Paper V:
Role of heterotrophs
versus autotrophs in
fate of MCs
Chapter 7

P a g e | 14
1.4 References
Dann AB, Hontela A. Triclosan: environmental exposure, toxicity and mechanisms of
action. J Appl Toxicol 2011; 31: 285-311.
Deblonde T, Cossu-Leguille C, Hartemann P. Emerging pollutants in wastewater: a
review of the literature. Int J Hyg Environ Health 2011; 214: 442-8.
Feng Y, Zhang Z, Gao P, Su H, Yu Y, Ren N. Adsorption behavior of EE2 (17 alpha-
ethinylestradiol) onto the inactivated sewage sludge: kinetics, thermodynamics
and influence factors. J Hazard Mater 2010; 175: 970-6.
Kang JH, Katayama Y, Kondo F. Biodegradation or metabolism of bisphenol A: from
microorganisms to mammals. Toxicology 2006; 217: 81-90.
Lee J, Lee BC, Ra JS, Cho J, Kim IS, Chang NI, et al. Comparison of the removal
efficiency of endocrine disrupting compounds in pilot scale sewage treatment
processes. Chemosphere 2008; 71: 1582-92.
Margot J, Kienle C, Magnet A, Weil M, Rossi L, de Alencastro LF, et al. Treatment of
micropollutants in municipal wastewater: ozone or powdered activated carbon?
Sci Total Environ 2013; 461-462: 480-98.
Melcer H, Klecka G. Treatment of wastewaters containing bisphenol A: state of the
science review. Water Environ Res 2011; 83: 650-66.
Nie Y, Qiang Z, Zhang H, Adams C. Determination of endocrine-disrupting chemicals in
the liquid and solid phases of activated sludge by solid phase extraction and gas
chromatography-mass spectrometry. J Chromatogr A 2009; 1216: 7071-80.
Plahuta M, Tišler T, Toman M. J, Pintar A. Efficiency of advanced oxidation processes in
lowering bisphenol A toxicity and oestrogenic activity in aqueous samples.
Archives of Industrial Hygiene and Toxicology. 65, 2014, pp. 77.
Pomati F, Orlandi C, Clerici M, Luciani F, Zuccato E. Effects and interactions in an
environmentally relevant mixture of pharmaceuticals. Toxicol Sci 2008; 102: 129-
37.
Prasse C, Wagner M, Schulz R, Ternes TA. Oxidation of the antiviral drug acyclovir and
its biodegradation product carboxy-acyclovir with ozone: kinetics and
identification of oxidation products. Environ Sci Technol 2012; 46: 2169-78.
Quinn B, Gagne F, Blaise C. Evaluation of the acute, chronic and teratogenic effects of a
mixture of eleven pharmaceuticals on the cnidarian, Hydra attenuata. Sci Total
Environ 2009; 407: 1072-9.
Radjenovic J, Petrovic M, Barcelo D. Fate and distribution of pharmaceuticals in
wastewater and sewage sludge of the conventional activated sludge (CAS) and
advanced membrane bioreactor (MBR) treatment. Water Res 2009; 43: 831-41.
P a g e | 15
Roig B. Pharmaceuticals in the environment. Current knowledge and need assessment to
reduce presence and impact: IWA Publishing, 2010.
Samaras VG, Stasinakis AS, Mamais D, Thomaidis NS, Lekkas TD. Fate of selected
pharmaceuticals and synthetic endocrine disrupting compounds during
wastewater treatment and sludge anaerobic digestion. J Hazard Mater 2013; 244-
245: 259-67.
Seyhi B, Drogui P, Buelna G, Blais JF. Modeling of sorption of bisphenol A in sludge
obtained from a membrane bioreactor process. Chemical Engineering Journal
2011; 172: 61-67.
Stasinakis AS, Kordoutis CI, Tsiouma VC, Gatidou G, Thomaidis NS. Removal of
selected endocrine disrupters in activated sludge systems: effect of sludge
retention time on their sorption and biodegradation. Bioresour Technol 2010; 101:
2090-5.
Stevens-Garmon J, Drewes JE, Khan SJ, McDonald JA, Dickenson ER. Sorption of
emerging trace organic compounds onto wastewater sludge solids. Water Res
2011; 45: 3417-26.
Zhao J, Li Y, Zhang C, Zeng Q, Zhou Q. Sorption and degradation of bisphenol A by
aerobic activated sludge. J Hazard Mater 2008; 155: 305-11.

P a g e | 16
Chapter 2: Technical Background
Summary1
This technical background presents the literature review explaining the different
removal pathways of MCs in typical sewage treatment condition and the different
operational conditions and factors which influence the removal efficiency of these
compounds. Besides, three specific compounds that represent the broad range of MCs in
environment are identified and a broad description of selected MCs is provided, detailing
their most relevant physico-chemical properties which influence their fate and behaviour
along sewage treatment. The literature were also reviewed for the kinetic models that can
be used to describe transformation of MCs (volatilization and photodegradation were
considered negligible) in an AS process.
1 Part of this chapter has been submitted for publication to WER journal and published in WEFTEC
2011:
Banihashemi B, Droste RL. Evaluation of Biodegradation Kinetics Models for Microconstituents
Under Typical Sewage Treatment Conditions. Water Environment Federation 2011: 5049-5061.
P a g e | 17
2.1 Introduction to Microconstituents
Microconstituents (MCs), also referred to in the literature as “emerging
contaminants”, “Compounds of Emerging Concern (CECs)”, “Emerging pollutants”,
“Trace Organic Compounds (TOrCs)”, consist of a vast and expanding array of
anthropogenic as well as natural substances which commonly exist in waters and
environment at trace level concentrations, ranging from a few ng/L to several μg/L. These
compounds present in the environment as long as they have been made and their ability
to mimic endogenous hormones has been known since at least the 1930’s (Walker and
Janney, 1930) and more importantly by the fish deformation report in UK in 1990s
(Desbrow et al., 1998). However, thanks to recent developments in analytical techniques
their occurrence can be monitored in various environmental samples at very low
concentrations.
The presence of MCs in lakes, rivers, drinking water and their fate in wastewater
treatment plants (WWTPs) as major point sources are a growing concern since some of
these substances persist at detectable levels in WWTP effluents, and discharge into the
rivers (Anderson, 2005; Ashton et al., 2004). Because of this growing interest, scientists
have studied the environmental fate and toxicology properties of MCs (Melcer and
Klecka, 2011; Radjenovic et al., 2009; Samaras et al., 2013) and although no legal limits
have been established yet, regulatory authorities around the world have conducted
monitoring programs and risk assessments of different MCs for future guidelines of
P a g e | 18
concentration limits of MCs in water bodies or in discharged WWTPs effluent (Roig,
2010); Advanced Industrial Science and Technology, 2007; Environment Canada and
Health Canada, 2008; European Commission, 2008).
MCs can be classified as natural and synthetic compounds which cover broad range
of compounds from hormones excreted by humans and animals to pharmaceuticals and
personal care products (PPCPs), combustion by-products and metals. The following
paragraphs describe the categories of MCs which has been found in the literature.
Pharmaceuticals and personal care products: In the late 1970s, the human drugs
have been found in environmental samples (Hignite and Azarnoff, 1977). The effect of
these compounds in the environment started to be focused in 1990s, when it was
discovered that some of these compounds interfere with ecosystems at very low
concentration (Halling-Sorensen et al., 1998). Pharmaceuticals are not completely
metabolized by humans or animals; as a result, they are excreted via urine and faeces as
unchanged parent compounds and as metabolites or conjugates (Heberer, 2002a).
Personal care products can be found in products used for beautification and personal
hygiene (skin care products, soaps). Man-made organic chemicals such as sunscreen
agents, antimicrobial disinfectants (e.g., triclosan, TCS), and preservatives, are also
classified as PPCPs, which are introduced to the aquatic environment during regular use
(Ternes et al., 2003).

P a g e | 19
Brominated flame retardants (BFRs): BFRs, such as hexabromocyclododecanes
(HBCDs), polybrominated diphenyl ethers (PBDEs), and tetrabromobisphenol-A (TBBP-
A), have been used in consumer products for a long time to reduce fire-related injury and
property damage. Recently, due to their occurrence in the environment and in human
biota, the fate and removal methods for this emerging class of chemicals have been
studied (Segev et al., 2009).
Steroid Hormones: Steroid hormones are a group of compounds that control the
endocrine and immune systems. Natural hormones are classified as estrogens (e.g.,
estradial), progestagents, androgens (e.g., androstenedione), and corticoids (e.g., cortisol).
Other synthetic hormones such as ethinylestradiol and mestranol have also been produced
that can be considered as endogenous compounds. Among these compounds, estrone
(E1), 17β-estradiol (E2), estriol (E3) and 17α-ethinylestradiol (EE2) have received more
scientific attention since they are considered to be the most important contributors to
estrogenicity of treated wastewater and surface waters (Fernandez et al., 2007; Hamid
and Eskicioglu, 2012).
Plasticizer and Industrial Material: Plasticizers are used to make plastics last
longer and improve the flexibility of plastics. Plasticizers can also be used as perfume
fixatives in production of cosmetic and personal care products (e.g., baby products). The
plastic monomer and plasticizer bisphenol A (BPA) are one of worldwide produced
P a g e | 20
chemicals that have been used extensively in recent years. BPA is used in the production
of polycarbonate plastics and epoxy resins used in many consumer products.
Pesticides and Surfactant: A pesticide is an organic compound (or mixture of
compounds) that have been used to remove pest’s problems by several ways such as
prevention, destruction, repulse or mitigation. Today, many different classes of pesticides
are used which can be beneficial to humans such as chlorinated hydrocarbons, triazines,
organphosphoric compounds, and substituted urea. Despite the positive effects from their
usage, the extensive use of pesticides resulted in serious environmental contamination
and health problems.
Disinfectants: The use of antiseptics and disinfectants can be found in hospitals and
other health care settings for different daily applications which demonstrate broad
antibacterial activities (Magee, 2012). A broad diversity of active chemical agents is
found in these products, including alcohols, phenols, iodine, and chlorine that have been
used for a long period of time (Magee, 2012).
Musks and fragrances: The term musk is used to describe a various range of
chemically defined substances, which has a common, distinct, and typical flavour but are
widely different in their chemical structure. These musk compounds comprise
representatives occurring naturally in animals and plants as well as artificial substances
posing musk-like odour properties. Synthetic musk and fragrances could be found in
soaps, perfumes, air fresheners, detergents, fabric softeners and other household cleaning
P a g e | 21
products. Many of these products are ultimately end up in sewers. Intrinsically, a large
proportion will pass through the WWTP and discharge to rivers (Sun et al., 2014). There
are four synthetic musk fragrances accounting for 95% of those used. These are the nitro-
musks (musk xylene, used in detergents and soaps, and musk ketone, used in cosmetics)
and two polycyclic musks.
Metals: Metals (inorganic MCs) are natural components that can be found in aquatic
systems and most of them are important elements to maintain human and animal lives.
Although burning fossil fuels and smelting of metallic ores would provide energy,
essential metals and minerals to human, but also it can be harmful to human at the toxic
concentration, such as cadmium, mercury or lead.
2.2 Occurrence and Transformation of MCs in the Environment
The environmental and health effects of MCs are receiving increased attention from
scientists, regulators, and the public due to their profound impacts on the health of all life
forms. It should be emphasized that not all MCs are substances that can affect the
endocrine system in humans and animals. To better understand the effect of MCs on the
environment, their fate and pathways in the environment need to be studied.
MCs can be discharged into wastewaters by the general population due to the use of
products containing them. Some degradation or transformation of these compounds take
place at WWTPs and then final dilution of the WWTP effluent by receiving waters
occurs. Some of the MCs are volatile and escape to the atmosphere; others are adsorbed
P a g e | 22
or absorbed by solids or biosolids and finally migrate to landfills along with sludge
produced in WWTPs. Effluents from municipal WWTPs have been implicated as a major
source to surface waters (Andersen et al., 2005; Kasprzyk-Hordern et al., 2009). WWTPs
receive MCs from sources including plastics, plant material, cleaning products,
pesticides, household chemicals and consumer products, natural and synthetic hormones
excreted by humans, and PPCPs washed from the body or flushed to the sanitary sewer.
Studies showed a good correlation between MCs concentrations in wastewater and their
production amounts and usage/consumption patterns (Kasprzyk-Hordern et al., 2008).
WWTPs might also treat industrial, livestock or hospital effluents and stormwater runoff
that contain MCs. Some of these compounds specially pharmaceuticals can be
metabolized to varying degrees and reached the WWTPs in conjugated forms. However,
these conjugated MCs could later be transformed into free (unconjugated) forms by
bacterial populations present in WWTP (Gomes et al., 2009).
WWTPs were designed and upgraded with the principal aim of eliminating easily or
moderately biodegradable carbon, nitrogen and phosphorus compounds which regularly
present in the influent at milligram per liter concentrations. However, MCs in raw
wastewaters are generally in the range of µg/L to ng/L, in addition, their chemical and
physical properties, vary greatly (Le-Minh et al., 2010; Ziylan and Ince, 2011), which
influence their fate during the treatments and consequently their removal efficiencies.
Although wastewater treatment processes remove some MCs to some extent, resistant

P a g e | 23
chemicals may remain at detectable levels in WWTP effluents. Through the effluent
discharge to surface water or groundwater, MCs may be diluted or degraded by physical
or biological processes, but some persist in the environment or might be detected due to
constant loading.
The occurrence of MCs in the environment has been studied by a plethora of reports
and the typical concentrations and most detected MCs were identified (Aris et al., 2014;
Klecka et al., 2009; Luo et al., 2014; Verlicchi et al., 2012).
Studies on the presence of MCs in WWTP influent showed high occurrence
concentrations of some pharmaceutical compounds such as acetaminophen, caffeine,
ibuprofen (IBP), naproxen and salicylic acid, antibacterial agent (TCS), surfactant
(nonylphenol) and one industrial chemical (Bis(2-ethylhexyl) phthalate, DEHP) in the
concentration range between 0.1 and 10 μg/L. In addition, ibuprofen, atenolol, caffeine
and nonylphenol were found to have the highest concentrations in WWTP influent. The
concentrations of most MCs in effluent were one to two orders of magnitude lower than
those in influent and ranged from 0.001 to 1 μg/L (Luo et al., 2014).
MCs were also monitored in surface water and carbamazepine, sulfamethoxazole and
TCS were the most frequently reported compounds in surface water (Luo et al., 2014).
The maximum concentrations of 36.8, 9.8, 17.0 and 1121.4 μg/L were detected for
ibuprofen, ketoprofen, gemfibrozil (GEM) and caffeine, respectively. The review paper
by Luo et al. (2014) showed that MCs occurs in the natural water bodies of the densely
P a g e | 24
populated regions more severely due to the massive usage of these chemicals by the large
population. The fate study on MCs in rivers reveled that natural attenuation of MCs is the
result of river water dilution, or sorption to solids, and not degradation (Gómez et al.,
2012). Carbamazepine, sulfamethoxazole, caffeine and TCS were the most commonly
detected compounds in groundwater with reported concentration of less than 100 ng/L. It
was also found that the concentrations of MCs in drinking water are dependent on water
sources, seasons and the type of drinking water treatment systems (Luo et al., 2014).
2.3 Choosing Target MCs
MCs consist of a broad range of compounds from PPCBs, pesticides, metals to EDCs.
Goals in this proposed research are to study specific compounds that represent the broad
range of MCs in the environment. Different factors have been considered to find the best
representatives: (a) well-studied MCs to compare our results with available studies in the
literature, (b) physical and chemical properties of MCs, (c) available analytical
methodology, (d) known negative impact on environment, (e) presence in conventional
WWTP effluent and water bodies especially in the Canadian environment, and finally (f)
the cost of study. In order to simplify our kinetic models in AS WWTPs, only compounds
with very low volatility that are biodegradable have been chosen.
P a g e | 25
2.3.1 Presence in Canadian environment
Burnison et al. (2002) investigated EDCs in municipal sewage effluents in Ontario
and found that the major estrogenic substances were natural and synthetic human
hormones (17ß-estradiol, E1, and EE2), alkylphenolics, and occasionally BPA (an
industrial contaminant) and a polar metabolic breakdown product of estriol/estrone.
Fernandez et al. (2007) also measured the 30 primarily estrogenic organic wastewater
contaminants in several influent and effluent wastewater samples in Canada and showed
that EE2 was the more frequently detected synthetic estrogens/progesterone in the
effluent occurring at or below 5 to up to 178 ng/L, other steroidal estrogens were
E1>E2>E3 which were all <20 ng/L.
Bennie (2008) investigated the acidic pharmaceuticals in surface waters of selected
Ontario watersheds and found out that Ibuprofen, gemfibrozil, naproxen and TCS were
detected in surface waters with maximum concentrations of 1590, 103, 753 and 428 ng/L,
respectively. Lishman et al. (2006) also studied 10 acidic pharmaceuticals, TCS and six
polycyclic musks in twelve WWTPs discharging into the Thames River and found that
PPCPs enter Canadian waterways at trace levels (e.g., TCS 0.01–4.01 μg/L in influent
samples and 0.01–0.324 μg/L in effluent samples), and WWTPs can only reduce some of
them in a significant proportion. They also found that the mean influents concentration of
IBP, GEM, and diclofenac (DCF) were 8.45, 0.453 and 0.204 µg/L, respectively, while
mean effluent concentrations were 0.384, 0.246, and 0.194 µg/L, respectively.
P a g e | 26
Servos et al. (2005) investigated the presence of selected PPCPs in drinking water in
Ontario, and they showed that the highest levels of TCS in southern Ontario source water
were 34 and 150 ng/L, respectively. Lee and Peart (2000a) conducted a large-scale study
on BPA contamination in Canadian sewage treatment plants (STPs) and found BPA
contamination in all of 72 sewage samples. The concentration of BPA ranged from 0.08
to 4.98 µg/L for the influent, and from 0.01 to 1.08 µg/L for the effluent and 0.033-
36.7µg/g for sewage sludge. Mohapatra et al. (2011) measured BPA in samples from an
urban community Quebec WWTP located in Quebec City and the results showed that
BPA was present in the influent and the effluent with mean concentrations of 1.68 µg/L
and 0.41µg/L, respectively.
Ternes et al. (1999) studied the occurrence of natural estrogens and synthetic
contraceptives in Germany and Canadian STP discharges and found a median
concentration of 0.009 µg/L for EE2 in the WWTPs effluents. Chan et al. (2002)
investigated the existence of EDCs in industrial wastewater samples in Toronto and
found the widely divergent concentrations ranging from <0.01 to 195 μg/L for 4-tert-
octylphenol (OP), from <0.1 to 253 μg/L for nonylphenol (NP), from <2 to 117,570 μg/L
for nonylphenol ethoxylates (NPEO), and from <0.01 to 149 μg/L for BPA in the
wastewater samples.
Boyd et al. (2003) investigated PPCPs in surface and treated waters in Ontario and
found concentrations of naproxen in the Mississippi River and Lake Pontchartrain from

P a g e | 27
22 to 107 ng/L. Hao et al. (2006) also studied the occurrence of pharmaceutical and
EDCs in source and finished drinking water in Ontario and found carbamazapine,
gemfibrozil, ibuprofen, BPA, lincomycin, naproxen, monensin, sulfamethoxazole,
tylosin, trimethoprin, bezafibrate, and acetamindophenol in source and drinking water
samples. In one of the most recent studies in Ontario, Kleywegt et al. (2011) found
carbamazepine, gemfibrozil, ibuprofen, and BPA in finished drinking water at
concentration of 4 to 10 times lower than those measured in the source water. Lishman et
al. (2006) conducted a study to investigate polycyclic and nitro musks in Canadian
municipal wastewater and found out that the maximum influent concentrations of
polycyclic and nitro musks were 7,030 and 158 ng/L for Galaxolide and ketone,
respectively. The maximum secondary effluent concentrations were found to be 2,000
ng/L for Galaxolide and 51 ng/L for musk ketone.
In another study, Jeffries et al. (2010) showed the presence of organic contaminants
and potential fish health impact in two rivers in Alberta. In their study, synthetic
estrogens and natural hormones were detected near wastewater effluents and it was
suggested that synthetic estrogens and natural hormones has potential health impacts in
male long-nose dace.
2.3.2 Chemical-physical properties
Once a MC is released into wastewater, it will be scattered between the different
environmental media (e.g., water, soil, surface, sediment) due to its physico-chemical
P a g e | 28
properties, such as volatility, solubility, lipophilicity, acidity, and sorption potential.
Moreover, depending on its resistance to biologically or abiotically degradation
processes, it can remain in WWTPs and discharge to the environment through the
effluent. Joss et al. (2006) showed that a significant amount of a compound will be
stripped in a bioreactor with fine bubble aeration if Henry’s constant (H) > 0.003.
Therefore, it can be concluded that stripping process during wastewater treatment is in
general not relevant for the removal of those MCs that has low Henry’s constant (Suárez
et al., 2008b). However, in activated sludge processes intensified volatilization behavior
could be found due to the additional air supply and removal of some MCs can occur
(Suarez et al., 2010).
Acidity (i.e., dissociation constant pKa) indicates if a specific ionic interaction is or is
not relevant for the sorption potential of a given compound. Moreover, for compounds
containing functional groups which can be protonated and de-protonated, the pH value
might play a crucial role. Schäfer et al. (2011) indicated that the phenolic hydroxyl group
of hormones can dissociate at the pH above the acid dissociation constant (pKa) and the
compounds would become negatively charged. Therefore, the removal of MCs can also
be expected due to the charge repulsion between negatively charged compounds and
biomass in the activated sludge reactors.
The octanol-water partition coefficient (Kow) is an indication of the substance
hydrophobicity (lipophilicity) and thus it indicates if a specific compound tends to
P a g e | 29
migrate from the aqueous phase into the lipophilic cell membrane of lipid fraction of the
biomass. Ter Laak et al. (2005) have observed that compounds exert: (a) low sorption
potential if log Kow < 2.5, (b) medium sorption potential if log Kow between 2.5 and 4.0,
and, (c) high sorption potential if log Kow > 4.0.
The sorption potential of a given MC is identified by the solid-water distribution
coefficient (Kd), which includes two driving forces for sorption: acidity and lipophilicity.
Joss et al. (2006) showed that compounds can only sorbs significantly onto primary and
secondary sludge if they have Kd values higher than 500 L/kg. Carballa et al. (2007) also
found that in sludge treatment process, sorption could be neglected if the Kd value is less
than l L/kg. They also indicated that the amount of MCs that can be sorbed to the sludge
is not only dependent on the distribution coefficient but also on the concentration of
solids. Suárez et al. (2008a) showed that based on partition coefficient between solid and
liquid phase values and biodegradability of MCs, their removal in WWTPs can be
predicted. They suggested that the effect of HRT and SRT on MCs removal could be
different when the compound has moderate, high, or low Kd and biodegradation constant
values.
Chemical structure of MCs also plays an important role in determining the
biodegradability of MCs which depends on the complexity of the compound (e.g.
monocyclic or polycyclic) and its functional groups (e.g. halogen groups). In general,
linear compounds with short side chains, unsaturated aliphatic compounds, and
P a g e | 30
compounds possessing electron donating functional groups can be easily degraded.
Whereas, compounds with long, highly branched side chains, saturated or polycyclic
compounds, and compounds possessing sulfate, halogen or electron withdrawing
functional groups would be more persistence (Tadkaew et al., 2011). Nevertheless, no
obvious relationship between chemical structure, functional groups and the removal of
MCs were identified. For example, although ibuprofen and ketoprofen have similar
chemical structures, their removal rate in WWTPs are different, with ibuprofen (>90%
removal) being eliminated more efficiently (Camacho-Muñoz et al., 2012).
2.3.3 Health and environment concern
The structure of the compound and different segment attached to initial molecule
would affect toxicity of organochlorine pesticides. In many cases, compounds are known
as moderately toxic to mammals and highly toxic to aquatic organism (e.g., Aldrin, and
heptachlor). Organophosphates can also have neurotoxic effects on humans. For instance,
methyl parathion could interact with double-stranded deoxyribonucleic acid (DNA) and
could produce chromatid exchange in human lymphocytes (Blasiak et al., 1995).
Studies on single compounds have shown that for environmental relevant
concentrations of most pharmaceuticals, acute toxicity on aquatic organisms are not
likely to occur (Choi et al., 2008; Zhang et al., 2008); however, several studies have
shown possible toxicity to non-target organisms due to combined and synergistic effects
of MCs at environmentally relevant concentrations (Pomati et al., 2008; Quinn et al.,

P a g e | 31
2009). On the other hand, since several aquatic species are exposed to these compounds
for their entire life cycle, chronic toxicity of pharmaceuticals is a great concern. Brown et
al. (2007) reported the bioaccumulation of diclofenac, ibuprofen, and gemfibrozil in fish
blood of rainbow trout. Studies have been reported estrogenic activity as well as
mutagenic and genotoxic potential of gemfibrozil (Isidori et al., 2009). Finally, Thomas
and Foster (2005) and Costanzo et al. (2005) showed that the release of antibiotics and
their metabolites into the environment could develop bacterial resistance to antibiotics in
aquatic ecosystems.
Steroid hormones can cause feminization of male fish even at concentrations close to
detection limit for advanced analytical systems. For instance, at concentration of 4 ng/L
of EE2, the development of normal secondary sexual characteristics on male fathead
minnows was prevented (Lange et al., 2001). Adverse effects of steroids have also been
reported in other organism such as amphibians, reptiles or invertebrate. Steroids can also
affect humans, for example, EE2 has been linked with prostate cancer development
(Hess-Wilson and Knudsen, 2006).
The ability of EE2 to affect the endocrine system of exposed biota were illustrated in
previous studies and altering sex determination, delaying sexual maturity, and decreasing
secondary sexual characteristics even at low concentrations (ng/L) were reported
(Dzieweczynski and Hebert, 2013; Liu et al., 2012; Silva et al., 2012).
P a g e | 32
Some surfactants and personal products such as NP are considered as EDCs. Studies
showed that growth of the mysid crustacean Americamysis bahia can be disrupted by
environmentally relevant concentrations of NP (Hirano et al., 2009). Some intervention
studies have been done on toxicity of MCs, and toxicity of TCS in algae, invertebrates,
and fish have been reported (Dussault et al., 2008). Kumar et al. (2009) also reported the
endocrine disrupting ability of this compound. Recently, TCS was detected in the plasma
of dolphins at concentration ranging between 0.025 to 0.27 ng/g wet weights indicating
its bioaccumulation in marine mammals (Fair et al., 2009).
A well-known plasticizer, BPA is one of the most worldwide produced chemicals and
is a known endocrine disruptor. From preliminary studies, BPA has been considered as a
weak environmental estrogen; however, more recent studies found that BPA is similar in
potency to estradiol in stimulating some cellular responses. In addition, recent evidence
indicates that BPA could affect the various endocrine-related pathways. Adverse effects
of BPA on the reproduction of wildlife, including annelids, mollusks, crustaceans,
insects, fish, and amphibians, as well as on the embryonic development and the induction
of genetic aberrations in crustaceans and amphibians has been shown by (Oehlmann et
al., 2009).
Studies have also reported that BPA can act as an estrogen agonist and disrupt normal
cell function after entering the human body (Wozniak et al., 2005), as well as an
androgen antagonist (Lee et al., 2003). Rubin and Soto (2009) reported that BPA may

P a g e | 33
affect human development throughout the fetal period, and may be carcinogenic,
potentially resulting in the precursors of breast cancer. Because of estrogenic activity of
BPA, sperm count and activity reduction, toxicity to liver and obesity by affecting fat-cell
activity has been reported (European Food Safety Authority, EFSA, 2006). Moreover,
exposure to BPA has been related to chronic disease conditions in humans such as
cardiovascular disease and diabetes (Lang et al., 2008). It has also been shown that BPA-
containing products in dental composite resin, food filling using polyvinyl chloride
gloves, production of heat-sensitive facsimile paper, adhesives for reinforcing circuit
boards and manufacturing of wind turbine systems could result in occupational
photosensitive dermatitis, and allergies (Rasmussen, 2006).
In April 2008, Health Canada declared BPA “CEPA toxic” (CEPA is the Canadian
Environmental Protection Act). The designation arose because of concerns about
potential neuro- developmental and behavioural effects at doses ranging from those equal
to current levels in the general public at doses 1-2 orders of magnitude greater.
2.3.4 Characterization of selected MCs
To address all the requirements and factors of representative MCs, EE2, BPA and
TCS have been chosen as target compounds in this study. These representatives are well-
known and well-studied compounds, have known negative impacts on the environment,
have been found in Canadian WWTP effluent and water bodies and based on their
physico-chemical properties can cover wide range of MCs in the environment. Carballa
P a g e | 34
et al. (2008) identified representative MCs by considering their physico-chemical and
biological properties and suggested that EE2, BPA, TCS and some other organic MCs
can be used as representative compounds. Rauch-Williams et al. (2010) also identified
the short list of indicator TOrC to characterize the performance of secondary treatment
processes. The indicator candidates were selected based on three key criteria; frequency
of occurrence, analytical amenability, and bio-physicochemical properties and they
suggested BPA and TCS among some other TOrC to be monitored in WWTPs (Rauch-
Williams et al., 2010). Cotton et al. (2010) conducted a systematic approach for
evaluating CECs to determine what CECs to monitor, determine CEC levels, and identify
a CEC control approach. They concluded the proposed CECs based on literature review,
regulatory documents, laboratory standards and compounds representing different
categories (e.g., pharmaceuticals, industrial compounds, steroids) and they proposed EE2
and TCS among some other CECs in their final prioritized CEC monitoring list. To better
understand the importance of selected compounds in this study, the fate of selected MCs
is discussed here.
EE2 is a synthetic hormone that has attracted considerable attention in the literature
due to its contribution to endocrine disrupting activity in WWTP effluent (Jeffries et al.,
2010; Vajda et al., 2008). EE2 could be discharged to sewer from human sources in either
gluconorides or sulphates conjugated forms (Koh et al., 2008); however the conjugate
steroids could later be transformed into free (unconjugated) forms by bacterial
P a g e | 35
populations present in WWTP that are capable of producing-glucuronidase and
arylsulfatase enzymes (Gomes et al., 2009). EE2 adsorption onto AS particles in
municipal WWTP might be an important removal pathway in WWTP due to its nonpolar
behaviour and hydrophobic properties (Andersen et al., 2005; Cirja et al., 2007; Zhou et
al., 2010). WWTPs influent concentrations of EE2 range from below detection to 70 ng/L
(Atkinson et al., 2012; Clara et al., 2005b; Vethaak et al., 2005). Biodegradation has been
reported as the most substantial estrogen removal method in AS wastewater treatment
(Muller et al., 2008), however, studies showed that presence of EE2 in WWTP effluent at
concentration levels of 6 ng/L might cause estrogenic effects on fathead minnow
populations (Kidd et al., 2007; Parrott and Blunt, 2005).
TCS (2,4,40-trichloro-20-hydroxydiphenyl ether; Irgasan) is a broad spectrum
antibacterial agent which can be found in many personal care products such as hand
disinfecting soaps, medical skin creams, dental products, deodorants, toothpastes (Dann
and Hontela, 2011). The use of personal care products containing TCS and the disposal of
these products caused TCS contamination in wastewater, streams, seawater, sediments,
fish, blood, urine and human milk (Allmyr et al., 2006; Kinney et al., 2008; Queckenberg
et al., 2010). TCS can hinder both gram negative and gram positive bacteria by inhibiting
the NADH-dependent enoyl-[acyl-carrier protein] reductase, a key enzyme responsible
for fatty acid synthesis (Sivaraman et al., 2004). It was found that TCS could also be
harmful to AS bacteria (Neumegen et al., 2005). An aid to the development of cross-

P a g e | 36
resistance to antibiotics (Drury et al., 2013) and the formation of chlorodioxins and other
toxic metabolites during TCS photodegradation are two of many concerns about the
widespread contamination of TCS in the environment (Aranami and Readman, 2007;
Braoudaki and Hilton, 2004; Buth et al., 2009; Dann and Hontela, 2011). Furthermore,
studies even suggested that TCS is potentially a weak androgen and exerts both
estrogenic and androgenic effects on human breast cancer cells (Gee et al., 2008). The
TCS concentrations in WWTP influent and effluent were studied by many researchers
and ranged from 0.01-16 µg/L in influent and 0.01-2.7 µg/L in effluent, suggesting
removal efficiencies of 58–97% for trickling filter plants and 95–98% for activated
sludge plants (Bester, 2003; Lishman et al., 2006; Nakada et al., 2010; Thomas and
Foster, 2005). The high octanol-water partition coefficient of TCS, log Kow of 4.5-4.8
(Lopez-Avila and Hites, 1980; Ying et al., 2007), could lead to 30-50% TCS removal due
to sorption onto biosolids in WWTPs (Bester, 2003; Chalew and Halden, 2009; Heidler
and Halden, 2007; Singer et al., 2002).
BPA is a building compound for the manufacturing of plastics, epoxy resins, and
polycarbonate resins. BPA is an endocrine disrupter (Fujimoto et al., 2006; vom Saal and
Myers, 2008) and might be as effective as estradiol in triggering some receptor responses
(Stahlhut et al., 2009). BPA might also act as an androgen receptor antagonist (Urbatzka
et al., 2007). Kd values for BPA are reported in various studies in the literature and
ranged from 0.07 L/g TSS up to 1 L/g TSS (Clara et al., 2004). The Henry’s law constant

P a g e | 37
for BPA is 1 × 10¹⁰
atm.m3/mol (Staples et al., 1998b) and volatility of BPA can thereby
be considered negligible in WWTPs. Lee et al. (2004) studied the BPA concentrations in
Canadian WWTPs and observed BPA in all 30 sewage samples with concentration
ranging from 0.16 to 28.1 µg/L (median 0.75 µg/L) in the influents and from 0.01 to 17.3
µg/L (median 0.13 µg/L) in the effluent. The observed influent-to-effluent reduction in
the five municipal WWTPs in Canada showed 70-76% for BPA indicating that it is not
completely eliminated during wastewater treatment (Fernandez et al., 2007; Mohapatra et
al., 2011). BPA was also found in municipal sewage sludge, in the range of 0.104–0.312
µg/g in Canada (Mohapatra et al., 2011), 1.86–0.02 µg/g in Greek (Samaras et al., 2013;
Stasinakis et al., 2008), and 0.4 µg/g in Spain (Vega-Morales et al., 2010).
There are four major processes that could cause the removal of MCs from the liquid
phase. These are volatilization, photolysis, sorption to wastewater sludge, and
biodegradation. Table 2-1 and Figure 2-1 show the physico-chemical characteristics and
biodegradability of the selected compounds. The wide range of sorption capacity (Kd)
and biodegradation potential (Km) from low, moderate to high in selected MCs shows
that the fate of these compounds in secondary treatment systems could be varied based on
operational parameters such as SRT and HRT.
With a low vapour pressure and a Henry’s law constant ranging from 1.5 × 10⁻⁷
to
7.9× 10⁻¹²
atm.m3/mol for the selected MCs (Table 2-1), removal of these compounds by
volatilization can be considered negligible. Depending on pH, photolysis of these targets
P a g e | 38
could be a significant removal mechanism, especially above pH 8 (Tixier et al., 2002). By
adjusting the pH to 7-8 in the lab test and conducting the test in the dark, losses due
photolysis is expected to be negligible. Thus, only sorption and biodegradation is studied
during the experiment.
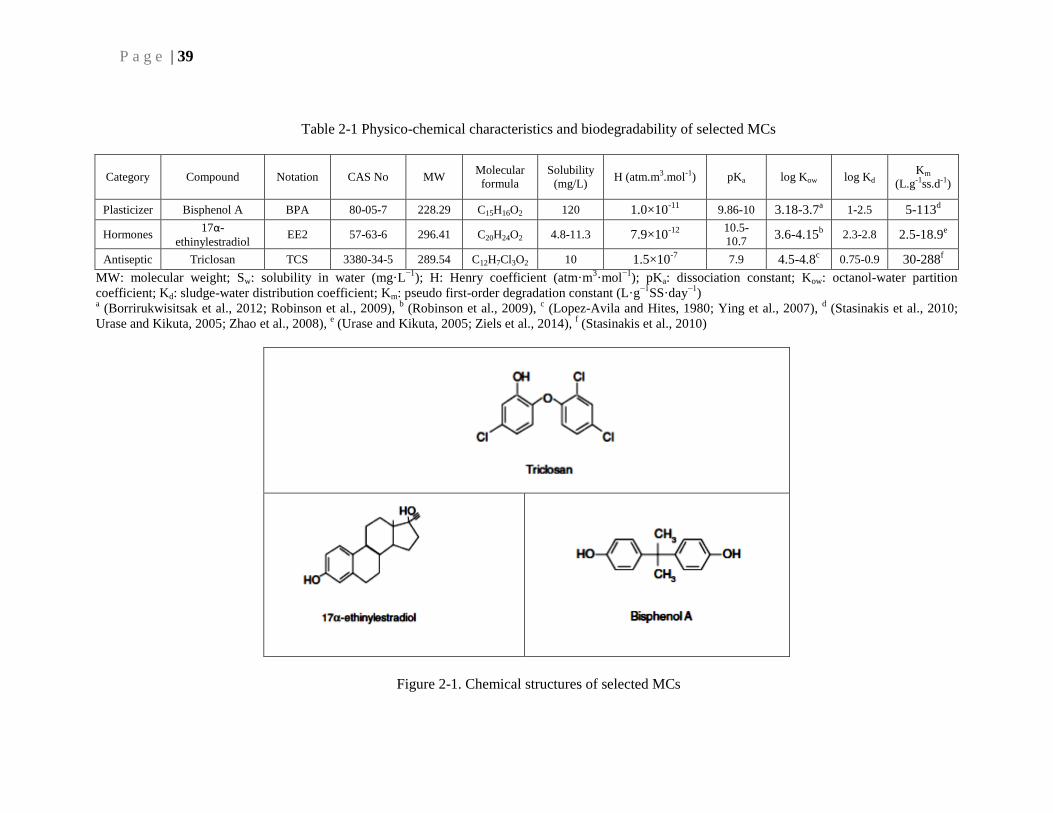
P a g e | 39
Table 2-1 Physico-chemical characteristics and biodegradability of selected MCs
Category Compound Notation CAS No MW Molecular
formula
Solubility
(mg/L) H (atm.m3.mol-1) pKa log Kow log Kd
Km
(L.g-1ss.d-1)
Plasticizer Bisphenol A BPA 80-05-7 228.29 C15H16O2 120 1.0×10⁻¹¹
9.86-10 3.18-3.7a
1-2.5 5-113d
Hormones 17α-
ethinylestradiol EE2 57-63-6 296.41 C20H24O2 4.8-11.3 7.9×10
-12
10.5-
10.7 3.6-4.15
b 2.3-2.8 2.5-18.9
e
Antiseptic Triclosan TCS 3380-34-5 289.54 C12H7Cl3O2 10 1.5×10⁻⁷
7.9 4.5-4.8c
0.75-0.9 30-288f
MW: molecular weight; Sw: solubility in water (mg·L−1
); H: Henry coefficient (atm·m3·mol
−1); pKa: dissociation constant; Kow: octanol-water partition
coefficient; Kd: sludge-water distribution coefficient; Km: pseudo first-order degradation constant (L·g−1
SS·day−1
) a (Borrirukwisitsak et al., 2012; Robinson et al., 2009),
b (Robinson et al., 2009),
c (Lopez-Avila and Hites, 1980; Ying et al., 2007),
d (Stasinakis et al., 2010;
Urase and Kikuta, 2005; Zhao et al., 2008), e (Urase and Kikuta, 2005; Ziels et al., 2014),
f (Stasinakis et al., 2010)
Figure 2-1. Chemical structures of selected MCs
P a g e | 40
2.4 Sorption Studies Review
Sorption onto particulate matter is an important removal mechanism when organic
MCs are tended significantly to partition onto primary and secondary sludge. Two
mechanisms are assumed to be relevant for sorption onto particulate matter: absorption
(MCs move from the aqueous phase and enter into the lipophilic cell membrane of
biomass or into the lipid fraction of the sludge due to their hydrophobicity) and
adsorption (MCs are retained onto solids surface due to electrostatic interactions between
positively charged compounds and the negatively charged surface of biomass cells). A
common method to measure the fraction of PPCPs sorbed onto sludge is the use of Kd
(L/kg), and it can be done by investigating the ratio between the concentrations of MCs in
the solid and liquid phases at equilibrium conditions. Joss et al. (2006) showed that
compounds can only sorbs significantly onto primary and secondary sludge if they have
Kd values higher than 500 L/kg. Carballa et al. (2007) also found that in sludge treatment
process, sorption can be neglected if the Kd value is less than l L/kg.
Kd value, combines two driving forces for sorption: acidity (pKa) which indicates if a
specific ionic interaction is relevant for the sorption potential of a given compound and
the Kow, which is an indication of the substance’s hydrophobicity and determines the
bioavailability of a compound in aquatic environment. Hydrophobic compounds have
high Kow value which indicates poor hydro-solubility and high tendency to sorb on
organic material of sludge matrix (Yoon et al., 2004). Studies showed that the compounds
P a g e | 41
with log Kow <2.5 have high bioavailability and their sorption to AS is not expected to
contribute significantly to the removal of the pollutant via excess sludge withdrawal. For
chemicals having log Kow between 2.5 and 4, moderate sorption is expected and finally,
organic compounds with log Kow higher than 4, show high sorption potential (Ter Laak et
al., 2005).
Studies showed that pharmaceuticals that do not have functional groups (e.g., –OH, -
COOH, or –NH2 functional groups) tend to not be charged at neutral pH; hence, the
sorption for this class of pharmaceuticals is probably caused by nonspecific sorption
interactions. Several studies were conducted to assess the adsorption behaviour of
estrogens on AS. Schäfer et al. (2002) showed that in the concentration range of 5-500
ng/L radio labelled E1 and E2, adsorption to AS was linear. Mes (2007) also indicated
that the adsorption percentage is dependent on the biomass concentration. Another study
showed that in wastewater, containing SS concentration of 2-5 g/L, spiked with radio
labelled EE2, only 20% of EE2 remained in the aqueous phase after one hour, when 20%
mineralisation was observed, concluding that 60% was bound to the sludge (Layton et al.,
2000). Zhao et al. (2008) studied the sorption of BPA by aerobic AS, and showed that the
sorption could be well described by both Freundlich and linear models. Increasing mixed
liquor suspended solids (MLSS) concentration or temperature decreased the BPA
sorption on the sludge and the sorption of BPA was mainly a physical process. The
studies showed that the 4-n-NP and TCS are significantly sorbed on the suspended solids,

P a g e | 42
while BPA was sorbed to a lesser extent. Clara et al. (2004) studied the adsorption of
BPA, E2, and EE2 to activated and inactivated sludge from WWTPs and found that
within a contact time of 24 h, no difference between the adsorption to activated and
inactivated sludge could be detected.
In published studies dealing with MCs sorption in sludge, mixed liquor has been
considered as a two-compartment system, corresponding to two states for MCs: sorbed-
to-particles and aqueous (Carballa et al., 2008; Dionisi et al., 2006). MCs sorption
equilibria in environmental samples including sludge are often modelled by Freundlich
isotherms with a Freundlich coefficient close to 1, which is equivalent to a linear
isotherm (Arias-Estévez et al., 2007; Hung et al., 2004). As a consequence, the
equilibrium of sorption to particles is usually assumed to fit linear equations (Dionisi et
al., 2006; Kasprzyk-Hordern et al., 2008) as well as the equilibrium of sorption to
dissolved/colloidal matter (DCM) (Barret et al., 2010a; Zhou et al., 2007). Although
some studies showed that enhanced coagulation could remove MCs by 20-70 percent (Lai
et al., 2000) where the main removal mechanism is sorption of MCs onto coagulant
surface, adsorption kinetics to inorganic SS have only been modeled using Kow and Kd
values and not coupled with different MCs fate models in recent studies.
A majority of published models for the environmental fate of MCs assume that
equilibrium is reached instantaneously between sorbed and dissolved MCs. Some studies
proposed a general model with sorption-desorption dynamic processes (Lai et al., 2000;
P a g e | 43
Lindblom et al., 2009) where different stages have been suggested in this process: the
first stage or rapid mixing, the second stage which is decrease in sorption due to gradual
exhaustion of binding sites and desorption of MCs into the aqueous phase as a last stage.
Based on these studies, it is found that sorption depends on the total concentration of
solids, XT before equilibrium is established, in contrast when the equilibrium between
sludge and water phase for dissolved compounds exists, e.g., due to longer SRT
compared to HRT in AS systems, only newly generated sludge is available as active sites
for sorption.
Many studies dealing with emerging contaminates focus only on adsorption and
biosorption of MCs to active and non-active AS by measuring the MCs concentration in
the liquid phase (Clara et al., 2004; Feng et al., 2010; Seyhi et al., 2011), only in the last
few years researchers started to study the change of MCs concentration in the solid phase
at very low concentrations (Nie et al., 2009; Stevens-Garmon et al., 2011; Zhao et al.,
2008). Furthermore, although the solid concentration in AS systems, as an active binding
site to MCs, showed evident effect on sorption isotherm in the literature (Barret et al.,
2010b; Zhao et al., 2008), however in these studies solid concentrations in batch reactors
were mostly prepared by diluting the MLSS to desired concentrations and the effect of
biomass characteristics such as morphology of the biomass, the floc size, shape and
density of AS at different SRTs were mainly ignored.

P a g e | 44
2.5 Biodegradation Studies Review
Biodegradability of MCs will depend on their bioavailability, i.e. the potential of
microorganisms to interact with them, which is related to the solubility of trace pollutants
in the aqueous phase (in general very low), but also on the chemical structure of the
compound. In this way, complex structures or toxic groups will make the breaking down
of molecules more difficult. In order to have a measurement of the degree of
biodegradability of MCs, the kinetic constant (Km) can be experimentally determined. As
a consequence of the very low substrate concentrations, the approach commonly used to
model the kinetic behaviour of MCs is pseudo-second-order degradation (Joss et al.,
2006) with direct proportionality of the transformation rate to the soluble substance
concentration, as well as to the sludge concentration, although in a system operated under
steady-state conditions the sludge concentration can be considered as constant. According
to Joss et al.’s study, three groups were identified related to their degradation constants
Km: a) compounds with Km <0.1 L/g SS.d are not removed to a significant extent (<20%),
b) compounds with Km >10 L/g SS.d are transformed by >90%, and c) compounds with
Km between 0.1-10 L/g SS.d have moderate removal.
Suárez et al. (2008a) studied the relationship between HRT, SRT, Kd, and Km and
they suggested that those compounds that have high pseudo-second-order biodegradation
kinetic constant and low Kd values such as BPA are efficiency transformed independently
of HRT or SRT. Compounds with low Km and high Kd values are retained mostly in the

P a g e | 45
bioreactor by sorption and biotransformed at sufficient SRT. Compounds that have low
or medium Km and medium Kd values, such as EE2, are moderately transformed
independently of HRT and slightly dependent on SRT, and finally, compounds that have
low Km and Kd values, such as carbamazepine, remain untreated and unchanged,
regardless of SRT or HRT of the system. Based on high Kd and Km values of TCS, Singer
et al. (2002) reported that approximately 79% of TCS in wastewater was biodegraded;
15% was sorbed into biosolids, and 6% was released into the receiving water bodies.
Several studies have reported removal of TCS by different biological treatment processes
(Kanda R Fau - Griffin et al., 2003), including AS (Federle et al., 2002), rotating
biological contactors and trickling filters (Thompson et al., 2005). Unlike TCS, greater
than 90% of removal has been reported for BPA (Staples et al., 1998a) and its
metabolites (Buser et al., 1999). Samaras et al. (2013) studied the biodegradation of BPA,
NP and TCS and found that 85% of BPA and 81% of TCS were removed due to
biotransformation process, while NP was biologically transformed to a lesser degree (up
to 56%) in two WWTPs using activated sludge.
The factors affecting the biodegradation of MCs and the removal performance of
different bioreactors were also studied in the literature (Luo et al., 2014). It was found
that compounds such as naproxen were not removed in conventional WWTPs, while
membrane bioreactor (MBR) treatment led to their elimination (Kimura et al., 2007). It
was assumed that the poor removal in conventional activated sludge (CAS) is due to their

P a g e | 46
complex molecules including two aromatic rings that make these compounds more
resistant to degradation processes. Radjenovic et al. (2009) showed that MBR systems
effectively remove MCs including those that are resistant to activated sludge processes.
Similar results were found by Spring et al. (2007) and they concluded that the ability of
MBR system to retain sludge, the membrane surface and the longer SRT in MBRs may
promote microbial degradation of the MCs. Full-scale MBR system also showed high
elimination (> 90%) of MCs (Beier et al., 2011; Trinh et al., 2012). Nevertheless, some
compounds such as carbamazepine, diazepam, diclofenac, fluoxetine, gemfibrozil were
incompletely removed (24–68%). Kovalova et al. (2012) investigated the removal of
pharmaceuticals at a pilot-scale MBR to treat hospital effluent and indicated that the large
fraction (80%) of the influent was persistent on iodinated contrast media.
Cirja et al. (2007) has studied the removal of some MCs based on their chemical
structure and proposed three classifications for PPCPs, a) those that are easily removed
by both CAS and MBR, b) compounds which are not efficiently removed in both systems
and c) compounds that are not satisfactorily removed by CAS but well removed by MBR.
Burgess et al. (2005) showed that the bioavailability of the organic pollutants in aqueous
environment is influenced by the presence of different forms of organic carbon like
cellulose or humic acids.
Cirja et al. (2007) reported that the removal of MCs from wastewater could be varied
when acidity or alkalinity of the aqueous environment is different. Some studies showed

P a g e | 47
that depending on the pKa values, pharmaceuticals could exist in various protonation
states because of pH variation in the aquatic environment. Therefore some researchers
such as Cirja et al. (2007) suggested that the control of pH value might be a solution for
the removal of MCs in WWTPs.
HRT is the amount of time that MCs are in contact with biomass; therefore, it affects
the biodegradation and sorption process. Fernandez-Fontaina et al. (2012) suggested that
those MCs with slow/intermediate kinetics will experience less effective biodegradation
at shorter HRTs. Huang et al. (2008) also found minor removal of MCs at HRT range of
5 to 14 h, while higher HRT increased MCs accumulation in the waste sludge. Kirk et al.
(2002) reported high removal efficiency of E1, E2 and EE2 when HRT increased from 2-
5 to 13 h at UK WWTPs. In contrast, Servos et al. (2005) found no statistical correlation
(r2<0.53) between HRT or SRT and hormone or estrogenicity removal for nine
conventional secondary plants and three tertiary plants in Canada. Gros et al. (2007)
studied the removal efficiency of different groups of MCs in 6 WWTPs with AS systems
of different HRTs in Spain and found that the plants with the highest HRTs (25-33 h)
have the highest removal efficiency, while plants with an HRT of 8 h had no or poor
removal of most of the selected compounds.
Temperature variation can also play an important role for biodegradation, sorption
and volatilization of MCs. Temperature influences the solubility and other physico-
chemical properties of MCs as well as the ecology of the bacterial community. Vieno et
P a g e | 48
al. (2006) reported that the removal of MCs, i.e. ibuprofen, was higher during the
summer time when the temperature reached 17oC in comparison to the winter season
when temperature was 7oC. Generally, higher MCs removal rate was observed at warmer
temperature due to promoted microbial activities (Nie et al., 2012; Qiang et al., 2013).
However, high temperature levels (45°C) could lead to lower MCs removal due to
disrupted metabolic activity at such an elevated temperature (Hai et al., 2011). On the
other hand, Suarez et al. (2010) showed that MCs elimination is independent of
temperature fluctuation. Effects of temperature variation were explored in a lab-scale
MBR treating wastewater containing selected MCs (Hai et al., 2011).
In AS systems, biodegradation and biotransformation are possible only by
microorganisms that could reproduce themselves during the designed SRT (Zhang et al.,
2008). Long SRT will increase the diversity of the microorganisms by increasing the
diversification of the microbial community or by diversification of the available enzymes
within the microbial community (Clara et al., 2005a). It was proposed that at short SRT
(<8 d) slowly growing bacteria are removed from the system and in this case, the
biodegradation is less significant and adsorption to sludge will be more important
(Jacobsen et al., 1993). Wick et al. (2009) found higher removal of beta blockers and
psycho-activate drugs in AS system operating at SRT of 18 d compared to the same
treatment with shorter SRT of 12 h. Higher SRT also showed 10% higher removal
efficiency for fluoxetine, citalopram and ethinylestradiol (Suarez et al., 2010). Stasinakis

P a g e | 49
et al. (2010) investigated the removal of MCs in reactors operating at SRTs of 3, 10, and
20 d and found enhanced biodegradation for NP and TCS at SRT of 20 d.
Ternes et al. (2004b) investigated the effect of SRT on MCs removal and reported
that SRTs of 5-15 days are required for biological transformation of benzafibrate,
sulfamethoxazole, ibuprofen, and acetylsalicylic acid. In another study, Clara et al.
(2005a) found that the critical SRT of 10 days is required for removal of BPA,
benzafibrate, and natural estrogens. Koh et al. (2008) stated that sludge loading is a key
parameter influencing the removal of estrogens from WWTPs. He suggested that
microorganisms prefer to degrade other organic compounds over estrogens. Therefore,
researchers proposed that reactor cascade provide better E1 and E2 removal rates than a
completely stirred tank (Joss et al., 2004b). In contrast, some researchers showed that no
noticeable effects on removal efficiency of the targeted MCs by varying the sludge age
between 10 and 60–80 d (Joss et al., 2005). Stasinakis et al. (2010) also found no removal
enhancement of BPA at reactor operating at SRT of 20 d.
Ammonia oxidizing bacteria (AOB) can co-metabolize MCs as well as the slow
growing bacteria. However, there are limited and debatable information on the role of
autotrophs on MCs biodegradation in AS systems operating at different SRTs (Larcher
and Yargeau, 2013; Zhou and Oleszkiewicz, 2010). It was concluded that the AOB are
responsible for the degradation of estrone, estradiol, and ethinylestradiol (Ren et al.,
2007). Some studies also reported some MCs and EDCs could have higher removal in
P a g e | 50
nitrifying AS (Kreuzinger et al., 2004). Natural estrogens are thought to be biodegraded
via a pathway where bacteria can use the conversion for growth, as EE2 is thought to be
biodegraded by co-metabolism, in which an organic compound is modified but not
utilised for bacterial growth (Vader et al., 2000). Nitrifying sludge is shown to be
responsible for biotrasforming EE2 due to use of enzyme ammonium monooxygenase,
which insert oxygen into C-H bonds. Vader et al. (2000) showed that the AOB
transformed EE2 to more hydrophilic metabolites in about six days, while EE2 was not
degraded when sludge with a very low nitrifying capacity was used. There is limited
information on the role of autotrophs in MCs biodegradation. Nitrifier-enriched AS was
used in batch degradation of BPA to investigate the effect of ammonia oxidizing bacteria,
AOB (Kim et al., 2007). It was observed that BPA concentration was decreased with the
oxidation of ammonium to nitrate by nitrifying sludge. However, in presence of
nitrification inhibitors, allylthiourea (ATU), BPA reduction decreased significantly.
Gaulke et al. (2008) suggested that EE2 at high concentration (mg/L) is co-metabolically
degraded by AOB but EE2 removal at low concentration found in municipal conventional
AS systems is not due to co-metabolic degradation by AOB, or to abiotic nitration, but
most likely due to heterotrophic bacteria. This result was also verified by other authors
(Racz et al., 2012; Zhou and Oleszkiewicz, 2010). In contrast, Khunjar et al. (2011)
studied the role of AOB versus heterotrophic bacteria during biotransformation of EE2
and showed that AOB activity was an important contributor towards EE2 biodegradation

P a g e | 51
and the metabolites formed by AOBs during EE2 biodegradation can be mineralized by
heterotrophic cultures.
Lee et al. (1998) studied biodegradation of sorbed MCs and they suggested that the
adsorption to solid phase might not decrease the biodegradability of the compounds when
the sorbing surface is the biomass itself. Drewes et al. (2005) studied the removal of BPA
and EE2 in WWTPs and concluded that their removal rates are dependent on the total
mass of EE2 and BPA and is strongly correlated with the biochemical oxygen demand
(BOD) loading and the SRT. Many researchers dealing with MCs assume that the
degradation only happens in the liquid phase (Lindblom et al., 2009; Plosz et al., 2010;
Pomiès et al., 2013). Although there are some studied that suggests dissolved and sorbed
MCs could be biodegraded with different or same rates (Byrns, 2001; Cowan et al., 1993;
Lee et al., 1998; Urase and Kikuta, 2005); but these authors considered biodegradation of
the sorbed MCs based only on successful calibration of a mathematical model, or indirect
experimental observations, and these assumptions are poorly justified experimentally
Biodegradation of the selected MCs has been reported by mixed cultures in WWTPs
(Kanda R Fau - Griffin et al., 2003; Thompson et al., 2005). Weber et al. (2005) found
that almost 100% of EE2 can be removed by using a mixed culture of microbes (A.
xylosoxidans and Ralstonia picketii). Moreover, bacteria, such as Sphingomonas strain
KC8, Novosphingobium tardaugens (ARI-1), Rhodococcus zopfii, Rhodococcus equi,

P a g e | 52
Proteobacteria, Actinobacteria, and Bacteroidetes, were found to degrade estrogenic
compounds at STPs (Roh and Chu, 2010; Yu et al., 2011b).
Inhibition effect of some MCs on AS biomass was also reported in the literature.
Pasquini et al. (2013) reported that TCS altered the bacterial growth at concentrations
measured in wastewater by investigating the toxicity of TCS on E. coli and comparing
EPS production in reactors with and without MCs addition. In contrast, other studies
reported no deterioration of AS systems performance in the presence of TCS at low µg/L
concentration (Federle et al., 2002; Stasinakis et al., 2010).
2.6 Biodegradation Kinetics Models for MCs in AS Systems
Modeling of AS systems has made dramatic strides in the ‘80s and ‘90s with the
development of IWA’s AS models (ASMs). Table 2-2 presents the Peterson matrix for a
model that is similar to the IWA’s ASM1 (developed in the 80s) which forms the
backbone of many other models for the AS process.
Table 2-2 Model of the AS Process for Carbon Removal
Component i 1 2 3 4 5 6 Process Rate, rj
j Process SI SS XI XS XH SO [ML-3T-1]
1 Hydrolysis of particulate organics
1 1 khXS
2 Aerobic growth of heterotrophs
H
1
Y
1
H
H
1 Y
Y
H
SS
SHm XSK
S
3 Decay of heterotrophs
fXI 1 1 – fXI bHXH
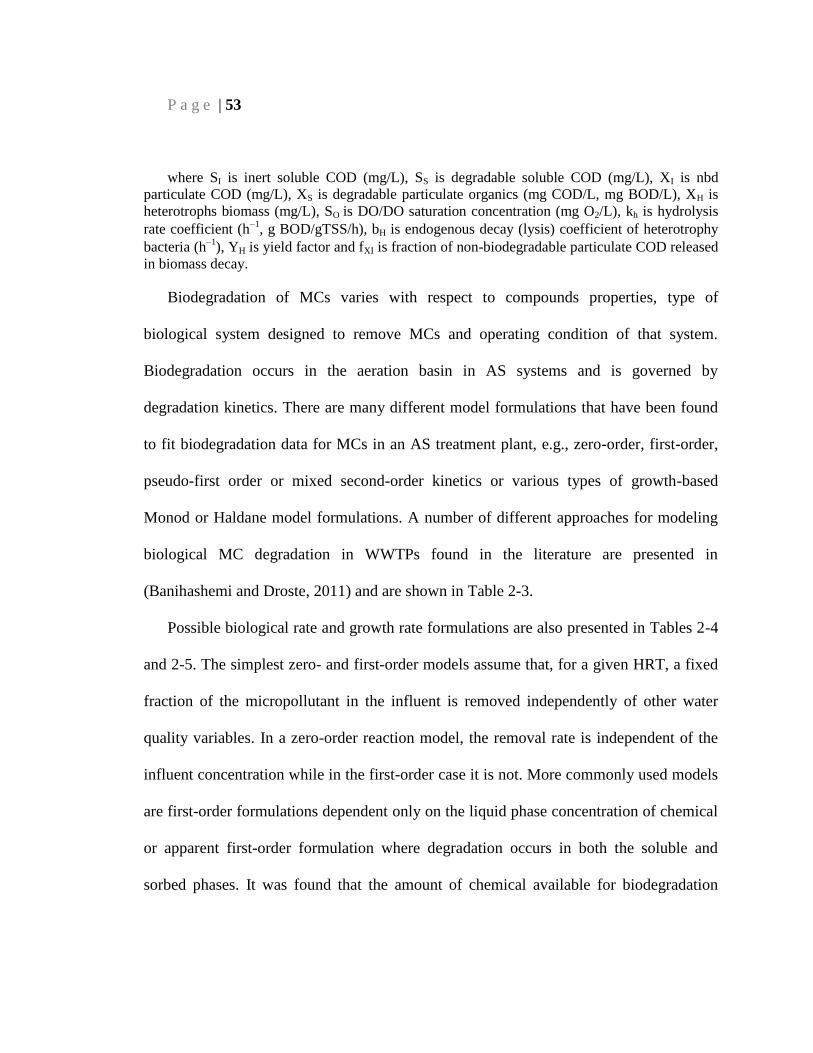
P a g e | 53
where SI is inert soluble COD (mg/L), SS is degradable soluble COD (mg/L), XI is nbd
particulate COD (mg/L), XS is degradable particulate organics (mg COD/L, mg BOD/L), XH is
heterotrophs biomass (mg/L), SO is DO/DO saturation concentration (mg O2/L), kh is hydrolysis
rate coefficient (h1
, g BOD/gTSS/h), bH is endogenous decay (lysis) coefficient of heterotrophy
bacteria (h1
), YH is yield factor and fXI is fraction of non-biodegradable particulate COD released
in biomass decay.
Biodegradation of MCs varies with respect to compounds properties, type of
biological system designed to remove MCs and operating condition of that system.
Biodegradation occurs in the aeration basin in AS systems and is governed by
degradation kinetics. There are many different model formulations that have been found
to fit biodegradation data for MCs in an AS treatment plant, e.g., zero-order, first-order,
pseudo-first order or mixed second-order kinetics or various types of growth-based
Monod or Haldane model formulations. A number of different approaches for modeling
biological MC degradation in WWTPs found in the literature are presented in
(Banihashemi and Droste, 2011) and are shown in Table 2-3.
Possible biological rate and growth rate formulations are also presented in Tables 2-4
and 2-5. The simplest zero- and first-order models assume that, for a given HRT, a fixed
fraction of the micropollutant in the influent is removed independently of other water
quality variables. In a zero-order reaction model, the removal rate is independent of the
influent concentration while in the first-order case it is not. More commonly used models
are first-order formulations dependent only on the liquid phase concentration of chemical
or apparent first-order formulation where degradation occurs in both the soluble and
sorbed phases. It was found that the amount of chemical available for biodegradation
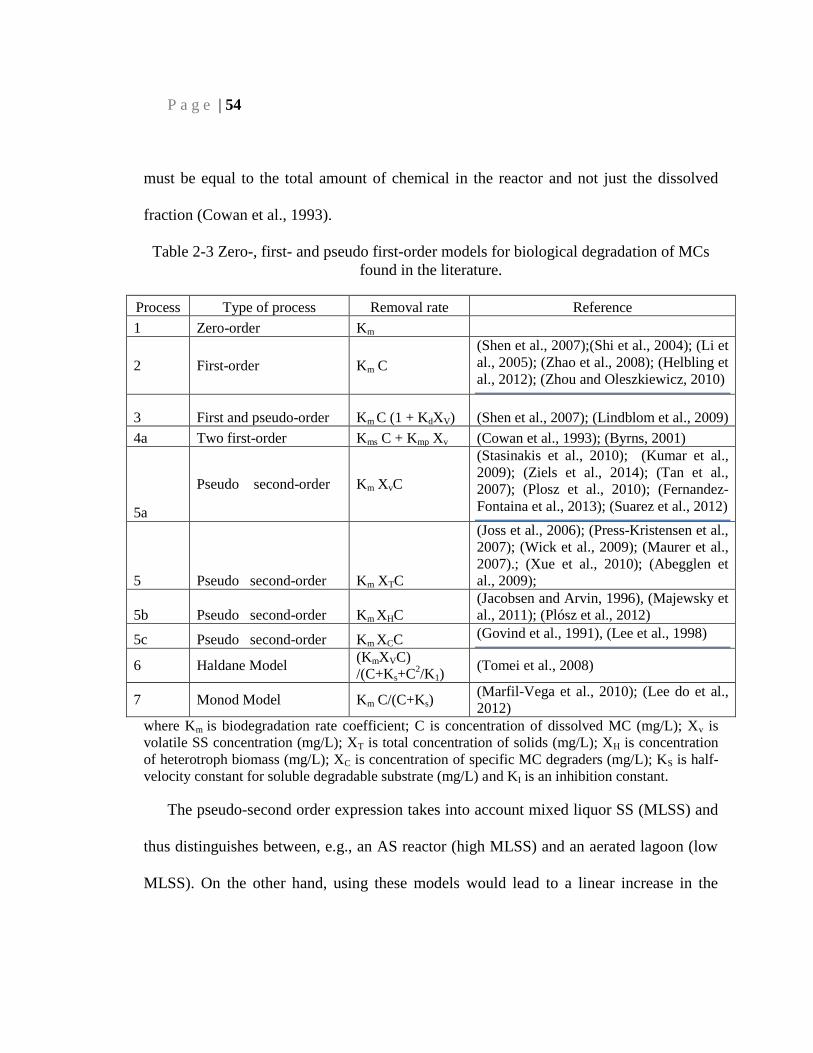
P a g e | 54
must be equal to the total amount of chemical in the reactor and not just the dissolved
fraction (Cowan et al., 1993).
Table 2-3 Zero-, first- and pseudo first-order models for biological degradation of MCs
found in the literature.
Process Type of process Removal rate Reference
1 Zero-order Km
2 First-order Km C
(Shen et al., 2007);(Shi et al., 2004); (Li et
al., 2005); (Zhao et al., 2008); (Helbling et
al., 2012); (Zhou and Oleszkiewicz, 2010)
3 First and pseudo-order Km C (1 + KdXV) (Shen et al., 2007); (Lindblom et al., 2009)
4a Two first-order Kms C + Kmp Xv (Cowan et al., 1993); (Byrns, 2001)
5a
Pseudo second-order Km XvC
(Stasinakis et al., 2010); (Kumar et al.,
2009); (Ziels et al., 2014); (Tan et al.,
2007); (Plosz et al., 2010); (Fernandez-
Fontaina et al., 2013); (Suarez et al., 2012)
5 Pseudo second-order Km XTC
(Joss et al., 2006); (Press-Kristensen et al.,
2007); (Wick et al., 2009); (Maurer et al.,
2007).; (Xue et al., 2010); (Abegglen et
al., 2009);
5b Pseudo second-order Km XHC
(Jacobsen and Arvin, 1996), (Majewsky et
al., 2011); (Plósz et al., 2012)
5c Pseudo second-order Km XCC (Govind et al., 1991), (Lee et al., 1998)
6 Haldane Model (KmXVC)
/(C+Ks+C2/K1)
(Tomei et al., 2008)
7 Monod Model Km C/(C+Ks) (Marfil-Vega et al., 2010); (Lee do et al.,
2012)
where Km is biodegradation rate coefficient; C is concentration of dissolved MC (mg/L); Xv is
volatile SS concentration (mg/L); XT is total concentration of solids (mg/L); XH is concentration
of heterotroph biomass (mg/L); XC is concentration of specific MC degraders (mg/L); KS is half-
velocity constant for soluble degradable substrate (mg/L) and KI is an inhibition constant.
The pseudo-second order expression takes into account mixed liquor SS (MLSS) and
thus distinguishes between, e.g., an AS reactor (high MLSS) and an aerated lagoon (low
MLSS). On the other hand, using these models would lead to a linear increase in the
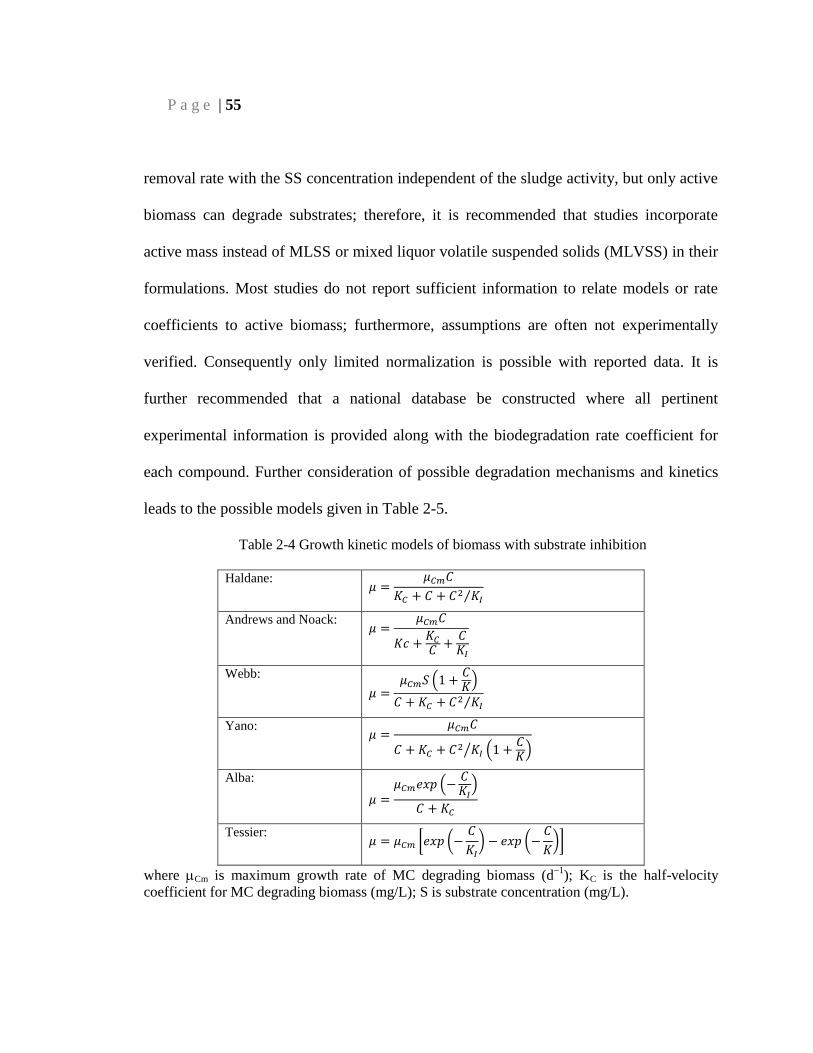
P a g e | 55
removal rate with the SS concentration independent of the sludge activity, but only active
biomass can degrade substrates; therefore, it is recommended that studies incorporate
active mass instead of MLSS or mixed liquor volatile suspended solids (MLVSS) in their
formulations. Most studies do not report sufficient information to relate models or rate
coefficients to active biomass; furthermore, assumptions are often not experimentally
verified. Consequently only limited normalization is possible with reported data. It is
further recommended that a national database be constructed where all pertinent
experimental information is provided along with the biodegradation rate coefficient for
each compound. Further consideration of possible degradation mechanisms and kinetics
leads to the possible models given in Table 2-5.
Table 2-4 Growth kinetic models of biomass with substrate inhibition
Haldane:
⁄
Andrews and Noack:
Webb:
(
)
⁄
Yano:
(
)⁄
Alba:
(
)
Tessier: [ (
) (
)]
where Cm is maximum growth rate of MC degrading biomass (d1
); KC is the half-velocity
coefficient for MC degrading biomass (mg/L); S is substrate concentration (mg/L).

P a g e | 56
Table 2-5 Possible Rate Formulations for biological degradation of MCs
No. Model (r)
1 Km Zero-order model, decay is independent of concentrations of biomass and the
chemical
2 Km C First-order degradation independent of biomass concentration and only
applies to dissolved chemical
3a Km C(1 + KdXV) First-order but chemical decays in both the soluble and solid phases
3b Km C(1 + KdXH) First-order but chemical decays in both the soluble and solid phases; (XI +
XS) is not subject to microbial attack
4a KmsC + KmpKdXVC First-order decay in both liquid and solid phases but different rate
coefficients
4b KmsC + KmpKdXHC First-order decay in both liquid and solid phases but different rate
coefficients; (XI + XS) is not subject to microbial attack
5a
KmXVC Mixed second-order with degradation only in the soluble phase
5b KmXHC Mixed second-order with degradation by active heterotrophs only in the
soluble phase
5c KmXCC Mixed second-order with degradation by active MCs degraders only in the
soluble phase
6a KmXVC(1 + KdXV) Mixed second-order with degradation in both the soluble and solid phases
6b KmXHC(1 + KdXV) Mixed second-order with degradation by active heterotrophs in both the
soluble and solid phases
6c KmXCC(1 + KdXV) Mixed second-order with degradation by active MCs degraders in both the
soluble and solid phases
7a KmsXVC +
KmpXVKdXVC
Mixed second-order with degradation in both the soluble and solid phases
with different rate coefficients in each phase.
7b KmsXHC
+KmpXHKdXVC
Mixed second-order with degradation in both the soluble and solid phases
with different rate coefficients for active heterotrophs in each phase
7c KmsXCC
+KmpXCKdXVC
Mixed second-order with degradation in both the soluble and solid phases
with different rate coefficients foe active MCs degraders in each phase
8 KmXHC(1 + KdXH) Chemical sorbed to inert particulates; (XI + XS) is not subject to microbial
attack
9 KmsXHC +
KmpXH2KdC
Chemical sorbed to inert particulates (XI + XS) is not subject to microbial
attack. Degradation in both the soluble and solid phases with different rate
coefficients in each phase.
10
Monod rate formulation independent of biomass. Only applied to the soluble
phase.
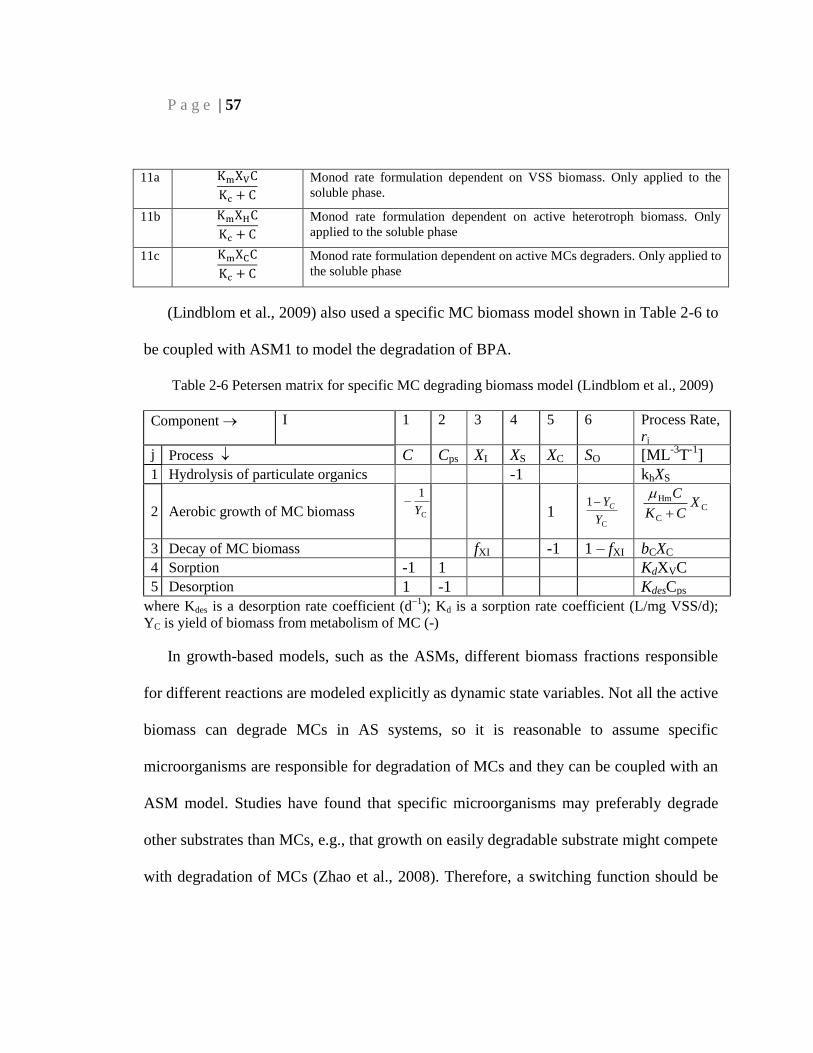
P a g e | 57
11a
Monod rate formulation dependent on VSS biomass. Only applied to the
soluble phase.
11b
Monod rate formulation dependent on active heterotroph biomass. Only
applied to the soluble phase
11c
Monod rate formulation dependent on active MCs degraders. Only applied to
the soluble phase
(Lindblom et al., 2009) also used a specific MC biomass model shown in Table 2-6 to
be coupled with ASM1 to model the degradation of BPA.
Table 2-6 Petersen matrix for specific MC degrading biomass model (Lindblom et al., 2009)
Component I 1 2 3 4 5 6 Process Rate,
rj
j Process C Cps XI XS XC SO [ML-3
T-1
]
1 Hydrolysis of particulate organics -1 khXS
2 Aerobic growth of MC biomass C
1
Y
1
C
1
Y
YC C
C
Hm XCK
C
3 Decay of MC biomass fXI -1 1 – fXI bCXC
4 Sorption -1 1 KdXVC
5 Desorption 1 -1 KdesCps
where Kdes is a desorption rate coefficient (d1
); Kd is a sorption rate coefficient (L/mg VSS/d);
YC is yield of biomass from metabolism of MC (-)
In growth-based models, such as the ASMs, different biomass fractions responsible
for different reactions are modeled explicitly as dynamic state variables. Not all the active
biomass can degrade MCs in AS systems, so it is reasonable to assume specific
microorganisms are responsible for degradation of MCs and they can be coupled with an
ASM model. Studies have found that specific microorganisms may preferably degrade
other substrates than MCs, e.g., that growth on easily degradable substrate might compete
with degradation of MCs (Zhao et al., 2008). Therefore, a switching function should be

P a g e | 58
used to switch off growth on MCs when easily degradable substrate concentration is high.
Studies on MC removal using long SRTs suggested that nitrifying bacteria are also
responsible for biodegradation or co-metabolism transformations, which leads to
incorporating the nitrogenous bacteria into biodegradation kinetic models (Gaulke et al.,
2008; Khunjar et al., 2011). Most of the studies in the literature were conducted at
relatively high MC concentration and not at the environmentally relevant concentrations,
which are in the range of 10 to 50 ng/L in wastewater influent. It has been found that
laboratory tests using chemical concentrations greater than those found in nature may
lead to erroneous conclusions about microbial transformations in nature or biotreatment
systems (Alexander et al., 1988; Berg and Nyholm, 1996; Gaulke et al., 2008); therefore,
it is suggested to implicate the models to low concentrations. Based on literature review
new state model variables, which can be applied to ASM1 for MCs removal, are
proposed (Banihashemi and Droste, 2011). Figure 2-2 shows the new model variables
where Cps and C`ps are concentrations of MCs in the solid phase at equilibrium state, Xc is
concentration of active MCs degrading biomass, XH is active heterotrophic biomass, SS,
XS, and XI are concentration of substrate in terms of soluble COD, particulate COD and
inert COD, respectively. In this model the sorption-desorption process was assumed as a
dynamic process.

P a g e | 59
Figure 2-2. Proposed state model variables applied to ASM1 model after Lidblom 2009
2.6.1 Microconstituents fate model development
The general equation was developed in this study to represent the biodegradation rate
of MC in batch study when compounds with very low volatility were used and sorption
saturation exists. Sorption depends on the total concentration of solids, XV, in the aeration
basin or reactor.
Sorption = KdXv(Cps – Cp) (2-1)
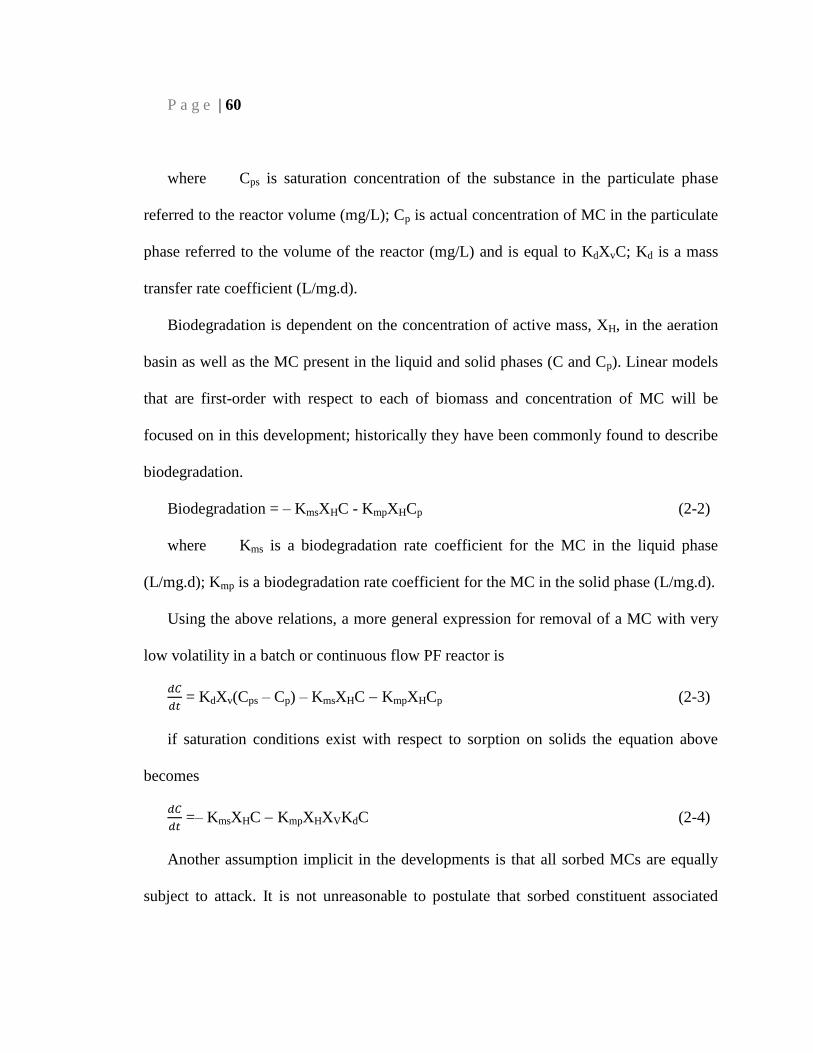
P a g e | 60
where Cps is saturation concentration of the substance in the particulate phase
referred to the reactor volume (mg/L); Cp is actual concentration of MC in the particulate
phase referred to the volume of the reactor (mg/L) and is equal to KdXvC; Kd is a mass
transfer rate coefficient (L/mg.d).
Biodegradation is dependent on the concentration of active mass, XH, in the aeration
basin as well as the MC present in the liquid and solid phases (C and Cp). Linear models
that are first-order with respect to each of biomass and concentration of MC will be
focused on in this development; historically they have been commonly found to describe
biodegradation.
Biodegradation = – KmsXHC - KmpXHCp (2-2)
where Kms is a biodegradation rate coefficient for the MC in the liquid phase
(L/mg.d); Kmp is a biodegradation rate coefficient for the MC in the solid phase (L/mg.d).
Using the above relations, a more general expression for removal of a MC with very
low volatility in a batch or continuous flow PF reactor is
= KdXv(Cps – Cp) – KmsXHC KmpXHCp (2-3)
if saturation conditions exist with respect to sorption on solids the equation above
becomes
=– KmsXHC KmpXHXVKdC (2-4)
Another assumption implicit in the developments is that all sorbed MCs are equally
subject to attack. It is not unreasonable to postulate that sorbed constituent associated
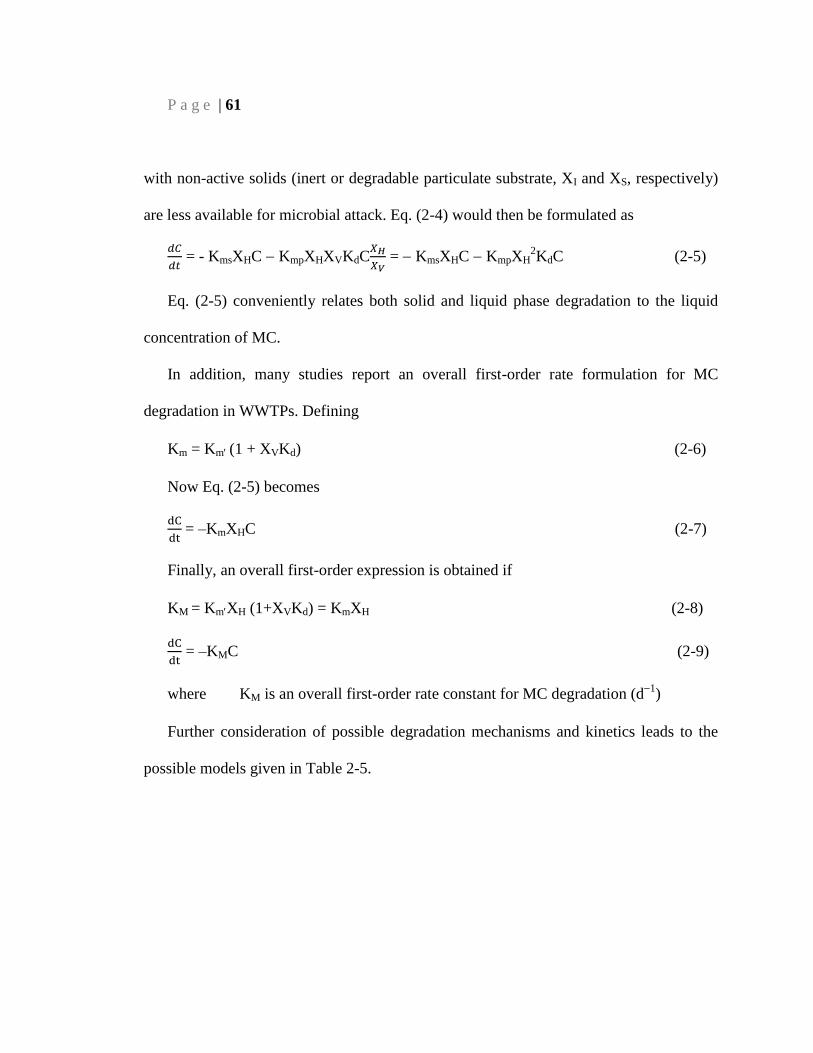
P a g e | 61
with non-active solids (inert or degradable particulate substrate, XI and XS, respectively)
are less available for microbial attack. Eq. (2-4) would then be formulated as
= - KmsXHC KmpXHXVKdC
= KmsXHC KmpXH
2KdC (2-5)
Eq. (2-5) conveniently relates both solid and liquid phase degradation to the liquid
concentration of MC.
In addition, many studies report an overall first-order rate formulation for MC
degradation in WWTPs. Defining
Km = Km (1 + XVKd) (2-6)
Now Eq. (2-5) becomes
= –KmXHC (2-7)
Finally, an overall first-order expression is obtained if
KM = KmXH (1+XVKd) = KmXH (2-8)
= –KMC (2-9)
where KM is an overall first-order rate constant for MC degradation (d1
)
Further consideration of possible degradation mechanisms and kinetics leads to the
possible models given in Table 2-5.
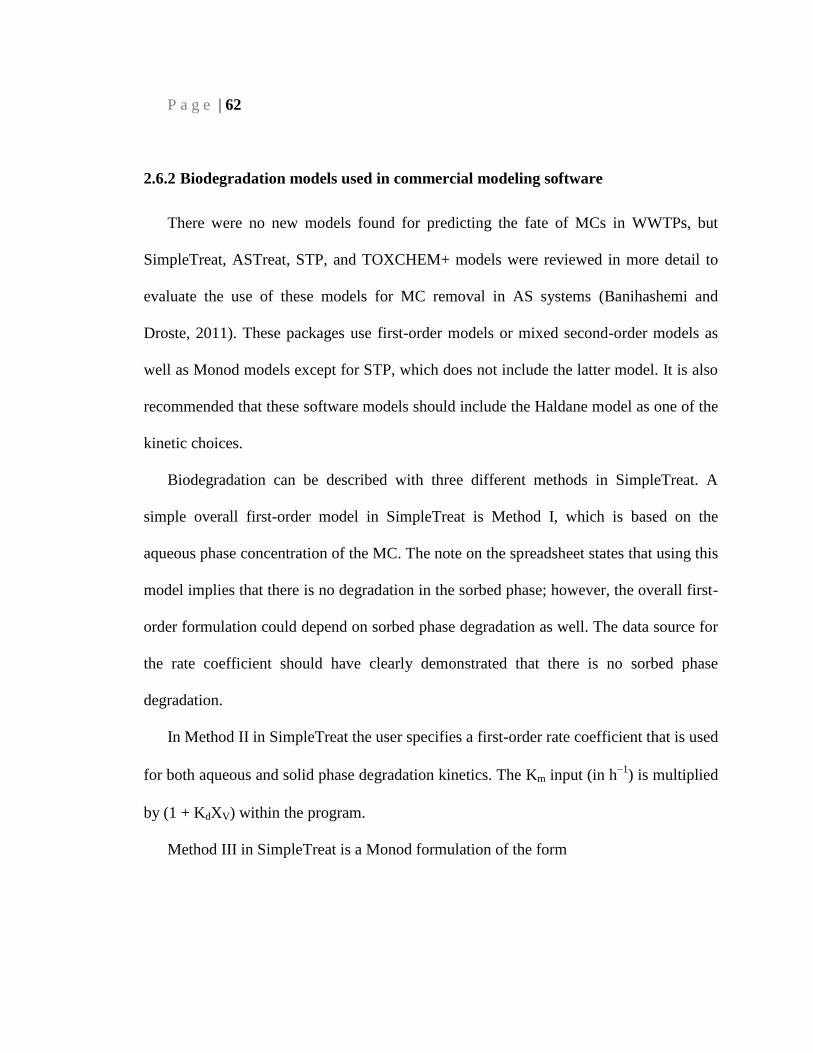
P a g e | 62
2.6.2 Biodegradation models used in commercial modeling software
There were no new models found for predicting the fate of MCs in WWTPs, but
SimpleTreat, ASTreat, STP, and TOXCHEM+ models were reviewed in more detail to
evaluate the use of these models for MC removal in AS systems (Banihashemi and
Droste, 2011). These packages use first-order models or mixed second-order models as
well as Monod models except for STP, which does not include the latter model. It is also
recommended that these software models should include the Haldane model as one of the
kinetic choices.
Biodegradation can be described with three different methods in SimpleTreat. A
simple overall first-order model in SimpleTreat is Method I, which is based on the
aqueous phase concentration of the MC. The note on the spreadsheet states that using this
model implies that there is no degradation in the sorbed phase; however, the overall first-
order formulation could depend on sorbed phase degradation as well. The data source for
the rate coefficient should have clearly demonstrated that there is no sorbed phase
degradation.
In Method II in SimpleTreat the user specifies a first-order rate coefficient that is used
for both aqueous and solid phase degradation kinetics. The Km input (in h1
) is multiplied
by (1 + KdXV) within the program.
Method III in SimpleTreat is a Monod formulation of the form
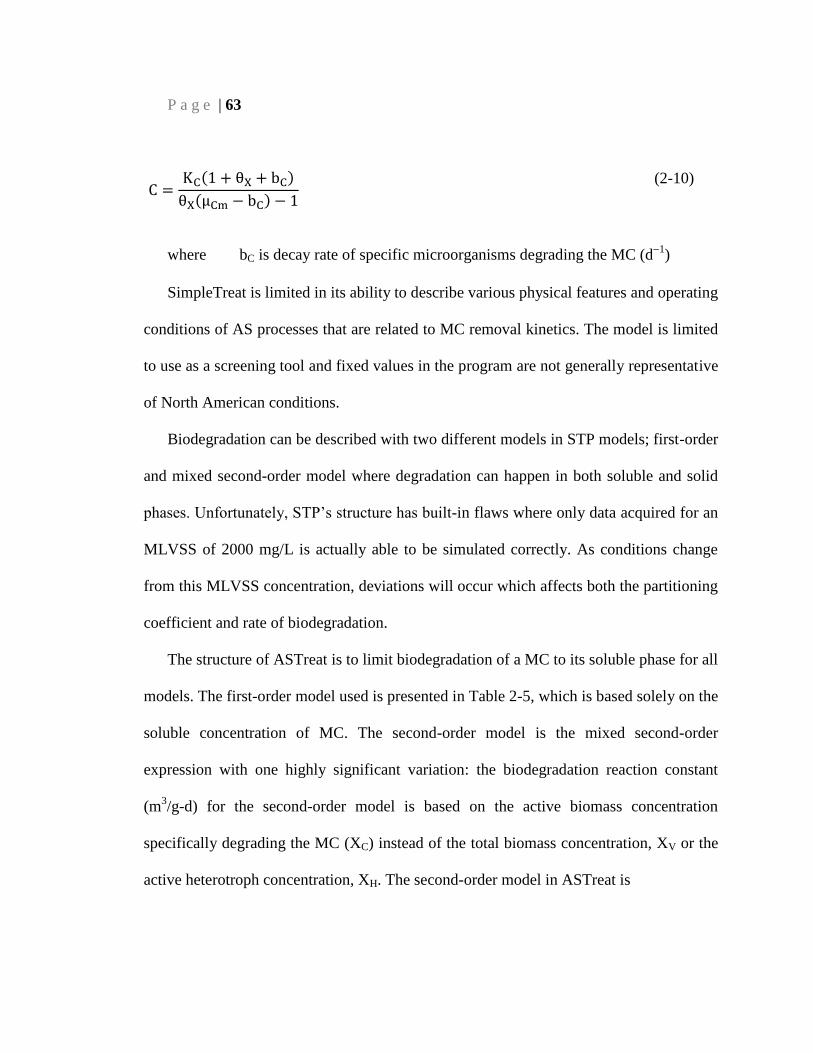
P a g e | 63
( )
( )
(2-10)
where bC is decay rate of specific microorganisms degrading the MC (d1
)
SimpleTreat is limited in its ability to describe various physical features and operating
conditions of AS processes that are related to MC removal kinetics. The model is limited
to use as a screening tool and fixed values in the program are not generally representative
of North American conditions.
Biodegradation can be described with two different models in STP models; first-order
and mixed second-order model where degradation can happen in both soluble and solid
phases. Unfortunately, STP’s structure has built-in flaws where only data acquired for an
MLVSS of 2000 mg/L is actually able to be simulated correctly. As conditions change
from this MLVSS concentration, deviations will occur which affects both the partitioning
coefficient and rate of biodegradation.
The structure of ASTreat is to limit biodegradation of a MC to its soluble phase for all
models. The first-order model used is presented in Table 2-5, which is based solely on the
soluble concentration of MC. The second-order model is the mixed second-order
expression with one highly significant variation: the biodegradation reaction constant
(m3/g-d) for the second-order model is based on the active biomass concentration
specifically degrading the MC (XC) instead of the total biomass concentration, XV or the
active heterotroph concentration, XH. The second-order model in ASTreat is

P a g e | 64
(2-11)
The active mass degrading the constituent (XC) is not related in any way to the active
(heterotroph) mass in the aeration basin. It is calculated from user-defined parameters
(YC, bC) in
( )
(2-12)
where YC is yield factor of the active mass degrading the MC (g/g); bC is endogenous
decay rate of active mass degrading the MC (d1
); C0 and C are influent and effluent
soluble MC concentrations (mg/L), respectively.
The model does not implicitly assume that solids are being degraded in the sorbed
phase as could be the case with the first-order model. The third model offered in ASTreat
is a Monod formulation defined in the following equations.
(2-13)
where Cm is maximum growth rate of MC degrading biomass (d-1
); KC is the half-
velocity coefficient for MC degrading biomass (mg/L)
There are two biodegradation models provided in TOXCHEM+: first-order and a
Monod kinetic model. The original TOXCHEM+ models are provided in (Melcer et al.,
1994) and (Parker et al., 1994). The first-order model used in TOXCHEM+ is:
(2-14)

P a g e | 65
The above equation is based on soluble phase degradation only. As noted above, this
model is readily changed by defining a modified rate coefficient.
( ) (2-15)
Then the model becomes
= ( )C =
The Monod model used is the standard model
μ
(2-16)
which is equivalent to the Monod model in Table 2-5. If C is small compared to KC,
this model reverts to the first-order model with respect to concentration of chemical.
The demands for information in TOXCHEM are higher than for the other models
reviewed but default values are available. The overall flexibility and ease of use make
this program a good choice for modelling chemical fate. Based on kinetic formulation
review in these models TOXCHEM+ and ASTreat are the recommended models for
simulating chemical transformations. TOXCHEM+ is de facto the state-of-the-art
package for evaluating the fate of MCs in comprehensive variety of WWTP
configurations.

P a g e | 66
2.7 Summary and Conclusion
Carbon removal governs the amount of biomass formed in a biological process
regardless of configuration of the process for any of the biological nutrient removal
options. In a MCs removal process, both the total concentration of SS in MLSS is
responsible for sorption and the active biomass is responsible for metabolism of MCs.
Not necessarily all of the active biomass is involved in metabolism of MCs; likewise, not
all sorbed MCs are necessarily subject to microbial attack. Concentrations in the liquid
phase and associated with solids are related by the partitioning factors, pKa and Kd,
between liquid and particulate phase concentrations. It is indeed possible that the
metabolism of a substance accumulated within the inorganic compounds and biomass
matrix occurs at a rate different from its dispersed concentration in the liquid phase.
Sorption of a MC to an inert or non-active organic particulate will reduce its exposure to
microbial attack. Some MCs may only be amenable to microbial attack in the soluble
phase; therefore, sorption of a MC to SS will reduce its maximum possible metabolism
rate. Its concentration in the particulate phase will not, in general, be the same as that in
the liquid phase. To further refine and define the kinetics, it is always necessary to
research degradation in the solid and liquid phases.
Biodegradation is dependent on the concentration of active mass, XH, in the aeration
basin as well as the amounts of MC present in the liquid and solid phases. Studies that
have examined MC degradation have been based on the traditional formulation relating

P a g e | 67
degradation to MLVSS; however, inert particulates clearly would play no role in active
metabolism. There are many different model formulations that have been found to fit
biodegradation data for MCs in an AS treatment plant. More commonly used models are
a first-order formulation dependent only on the liquid phase concentration of chemical or
apparent first-order formulation where degradation occurs in both the soluble and sorbed
phases. Linear models that are first-order with respect to each of biomass and
concentration of MC were introduced in this study; other possible models that have been
found to be valid have also been examined.
SimpleTreat, ASTreat, STP, and TOXCHEM+ models were reviewed in more detail
in this study to evaluate the use of these models for MC removal in AS systems. These
packages use first-order models or mixed second-order models as well as Monod models
except for STP which does not include the latter model. It is also recommended that these
software models should include the Haldane model as one of the kinetic choices. ASTreat
and TOXCHEM+ are the recommended models for simulating chemical transformations.
2.8 References
Abegglen C, Joss A, McArdell CS, Fink G, Schlusener MP, Ternes TA, et al. The fate of
selected micropollutants in a single-house MBR. Water Res 2009; 43: 2036-46.
Alexander HC, Dill DC, Smith LW, Guiney PD, Dorn P. Bisphenol a: Acute aquatic
toxicity. Environmental Toxicology and Chemistry 1988; 7: 19-26.
Allmyr M, Adolfsson-Erici M, McLachlan MS, Sandborgh-Englund G. Triclosan in
plasma and milk from Swedish nursing mothers and their exposure via personal
care products. Sci Total Environ 2006; 372: 87-93.
P a g e | 68
Andersen HR, Hansen M, Kjolholt J, Stuer-Lauridsen F, Ternes T, Halling-Sorensen B.
Assessment of the importance of sorption for steroid estrogens removal during
activated sludge treatment. Chemosphere 2005; 61: 139-46.
Anderson PD. Endocrine disrupting compounds and implications for wastewater
treatment, 2005.
Aranami K, Readman JW. Photolytic degradation of triclosan in freshwater and seawater.
Chemosphere 2007; 66: 1052-6.
Arias-Estévez M, Fernández-Gándara D, García-Falcón MS, García-Río L, Mejuto JC,
Simal-Gándara J. Sorption of PAHs to Colloid Dispersions of Humic Substances
in Water. Bulletin of Environmental Contamination and Toxicology 2007; 79:
251-254.
Aris AZ, Shamsuddin AS, Praveena SM. Occurrence of 17α-ethynylestradiol (EE2) in
the environment and effect on exposed biota: a review. Environment International
2014; 69: 104-119.
Ashton D, Hilton M, Thomas KV. Investigating the environmental transport of human
pharmaceuticals to streams in the United Kingdom. Sci Total Environ 2004; 333:
167-84.
Atkinson SK, Marlatt VL, Kimpe LE, Lean DR, Trudeau VL, Blais JM. The occurrence
of steroidal estrogens in south-eastern Ontario wastewater treatment plants. Sci
Total Environ 2012; 430: 119-25.
Banihashemi B, Droste RL. Evaluation of Biodegradation Kinetics Models for
Microconstituents Under Typical Sewage Treatment Conditions. Water
Environment Federation 2011: 5049-5061.
Barret M, Carrere H, Latrille E, Wisniewski C, Patureau D. Micropollutant and sludge
characterization for modeling sorption equilibria. Environ Sci Technol 2010a; 44:
1100-6.
Barret M, Patureau D, Latrille E, Carrere H. A three-compartment model for
micropollutants sorption in sludge: methodological approach and insights. Water
Res 2010b; 44: 616-24.
Beier S, Cramer C, Köster S, Mauer C, Palmowski L, Schröder HF, et al. Full scale
membrane bioreactor treatment of hospital wastewater as forerunner for hot-spot
wastewater treatment solutions in high density urban areas. Water Science and
Technology 2011; 63: 66-71.
Bennie DT, Struger, J.S. Pharmaceuticals and personal care products (PPCP) in Canadian
urban waters: Research and policy directions. Environment Canada, 2008.
Berg UT, Nyholm N. Biodegradability simulation studies in semicontinuous activated
sludge reactors with low (μg/L range) and standard (ppm range) chemical
concentrations. Chemosphere 1996; 33: 711-735.
Bester K. Triclosan in a sewage treatment process—balances and monitoring data. Water
Research 2003; 37: 3891-3896.
P a g e | 69
Blasiak J, Kleinwachter V, Walter Z, Zaludova R. Interaction of organophosphorus
insecticide methylparathion with calf thymus DNA and a synthetic DNA duplex.
Z Naturforsch C 1995; 50: 820-3.
Borrirukwisitsak S, Keenan HE, Gauchotte-Lindsay C. Effects of salinity, pH and
temperature on the octanol-water partition coefficient of bisphenol A.
International Journal of Environmental Science and Development 2012; 3(5):
460-464.
Boyd GR, Reemtsma H, Grimm DA, Mitra S. Pharmaceuticals and personal care
products (PPCPs) in surface and treated waters of Louisiana, USA and Ontario,
Canada. Sci Total Environ 2003; 311: 135-49.
Braoudaki M, Hilton AC. Low level of cross-resistance between triclosan and antibiotics
inEscherichia coliK-12 andE. coliO55 compared toE. coliO157. FEMS
Microbiology Letters 2004; 235: 305-309.
Brown JN, Paxeus N, Forlin L, Larsson DG. Variations in bioconcentration of human
pharmaceuticals from sewage effluents into fish blood plasma. Environ Toxicol
Pharmacol 2007; 24: 267-74.
Burnison B, Servos M, Sherry J, Lee H-B, Van Der Kraak G, Metcalfe C, (2002). EDCs
in municipal sewage effluents. Toxic Substances Research Initiative (TSRI 174)
Final Report, Environment Canada and Health Canada.
Buser HR, Poiger T, Muller MD. Occurrence and environmental behavior of the chiral
pharmaceutical drug ibuprofen in surface waters and in wastewater.
Environmental Science & Technology 1999; 33: 2529-2535.
Buth JM, Grandbois M, Vikesland PJ, McNeill K, Arnold WA. Aquatic photochemistry
of chlorinated triclosan derivatives: potential source of polychlorodibenzo-p-
dioxins. Environ Toxicol Chem 2009; 28: 2555-63.
Byrns G. The fate of xenobiotic organic compounds in wastewater treatment plants.
Water Res 2001; 35: 2523-33.
Camacho-Muñoz D, Martín J, Santos JL, Aparicio I, Alonso E. Effectiveness of
conventional and low-cost wastewater treatments in the removal of
pharmaceutically active compounds. Water, Air, and Soil Pollution 2012; 223:
2611-2621.
Carballa M, Fink G, Omil F, Lema JM, Ternes T. Determination of the solid-water
distribution coefficient (Kd) for pharmaceuticals, estrogens and musk fragrances
in digested sludge. Water Res 2008; 42: 287-95.
Carballa M, Omil F, Lema JM. Calculation methods to perform mass balances of
micropollutants in sewage treatment plants. application to pharmaceutical and
personal care products (PPCPs). Environ Sci Technol 2007; 41: 884-90.
Chalew TE, Halden RU. Environmental Exposure of Aquatic and Terrestrial Biota to
Triclosan and Triclocarban. J Am Water Works Assoc 2009; 45: 4-13.
P a g e | 70
Chan J, Gris G, Lee H., Peart TE. Endocrine-Disrupting Chemicals in Industrial
Wastewater Samples in Toronto, Ontario. Water Quality Research Journal of
Canada 2002; 37 (2): 459 - 472.
Choi K, Kim Y, Jung J, Kim MH, Kim CS, Kim NH, et al. Occurrences and ecological
risks of roxithromycin, trimethoprim, and chloramphenicol in the Han River,
Korea. Environ Toxicol Chem 2008; 27: 711-9.
Cirja M, Zuehlke S, Ivashechkin P, Hollender J, Schaffer A, Corvini PF. Behavior of two
differently radiolabelled 17alpha-ethinylestradiols continuously applied to a
laboratory-scale membrane bioreactor with adapted industrial activated sludge.
Water Res 2007; 41: 4403-12.
Clara M, Kreuzinger N, Strenn B, Gans O, Kroiss H. The solids retention time-a suitable
design parameter to evaluate the capacity of wastewater treatment plants to
remove micropollutants. Water Res 2005a; 39: 97-106.
Clara M, Strenn B, Gans O, Martinez E, Kreuzinger N, Kroiss H. Removal of selected
pharmaceuticals, fragrances and endocrine disrupting compounds in a membrane
bioreactor and conventional wastewater treatment plants. Water Res 2005b; 39:
4797-807.
Clara M, Strenn B, Saracevic E, Kreuzinger N. Adsorption of bisphenol-A, 17 beta-
estradiole and 17 alpha-ethinylestradiole to sewage sludge. Chemosphere 2004;
56: 843-51.
Costanzo SD, Murby J, Bates J. Ecosystem response to antibiotics entering the aquatic
environment. Mar Pollut Bull 2005; 51: 218-23.
Cowan CE, Larson RJ, Feijtel TCJ, Rapaport RA. An improved model for predicting the
fate of consumer product chemicals in wastewater treatment plants. Water
Research 1993; 27: 561-573.
Dann AB, Hontela A. Triclosan: environmental exposure, toxicity and mechanisms of
action. J Appl Toxicol 2011; 31: 285-311.
Desbrow C, Routledge EJ, Brighty GC, Sumpter JP, Waldock M. Identification of
estrogenic chemicals in STW effluent. 1. Chemical fractionation and in vitro
biological screening. Environmental Science & Technology 1998; 32: 1549-1558.
Dionisi D, Bertin L, Bornoroni L, Capodicasa S, Papini MP, Fava F. Removal of organic
xenobiotics in activated sludges under aerobic conditions and anaerobic digestion
of the adsorbed species. Journal of Chemical Technology and Biotechnology
2006; 81: 1496-1505.
Drewes JE, Hemming J, Ladenburger SJ, Schauer J, Sonzogni W. An assessment of
endocrine disrupting activity changes during wastewater treatment through the
use of bioassays and chemical measurements. Water Environment Research 2005;
77: 12-23.
P a g e | 71
Drury B, Scott J, Rosi-Marshall EJ, Kelly JJ. Triclosan exposure increases triclosan
resistance and influences taxonomic composition of benthic bacterial
communities. Environ Sci Technol 2013; 47: 8923-30.
Dussault EB, Balakrishnan VK, Sverko E, Solomon KR, Sibley PK. Toxicity of human
pharmaceuticals and personal care products to benthic invertebrates. Environ
Toxicol Chem 2008; 27: 425-32.
Dzieweczynski TL, Hebert OL. The effects of short-term exposure to an endocrine
disrupter on behavioral consistency in male juvenile and adult siamese fighting
fish. Archives of Environmental Contamination and Toxicology 2013; 64: 316-
326.
European Food Safety Authority, EFSA. Opinion of the scientific panel on food
additives, flavourings, processing aids and materials in contact with Food on a
request from the Commission related to 2,2-Bis(4-Hydroxyphenyl)Propane
(Bisphenol A) Question number EFSA-Q-2005-100 Adopted on 29 November
2006, The EFSA Journal 2006; 428: 1 – 75.
Fair PA, Lee HB, Adams J, Darling C, Pacepavicius G, Alaee M, et al. Occurrence of
triclosan in plasma of wild Atlantic bottlenose dolphins (Tursiops truncatus) and
in their environment. Environ Pollut 2009; 157: 2248-54.
Federle TW, Kaiser SK, Nuck BA. Fate and effects of triclosan in activated sludge.
Environ Toxicol Chem 2002; 21: 1330-7.
Feng Y, Zhang Z, Gao P, Su H, Yu Y, Ren N. Adsorption behavior of EE2 (17 alpha-
ethinylestradiol) onto the inactivated sewage sludge: kinetics, thermodynamics
and influence factors. J Hazard Mater 2010; 175: 970-6.
Fernandez-Fontaina E, Omil F, Lema JM, Carballa M. Influence of nitrifying conditions
on the biodegradation and sorption of emerging micropollutants. Water Res 2012;
46: 5434-44.
Fernandez-Fontaina E, Pinho I, Carballa M, Omil F, Lema JM. Biodegradation kinetic
constants and sorption coefficients of micropollutants in membrane bioreactors.
Biodegradation 2013; 24: 165-77.
Fernandez MP, Ikonomou MG, Buchanan I. An assessment of estrogenic organic
contaminants in Canadian wastewaters. Sci Total Environ 2007; 373: 250-69.
Fujimoto T, Kubo K, Aou S. Prenatal exposure to bisphenol A impairs sexual
differentiation of exploratory behavior and increases depression-like behavior in
rats. Brain Res 2006; 1068: 49-55.
Gaulke LS, Strand SE, Kalhorn TF, Stensel HD. 17α-ethinylestradiol Transformation via
Abiotic Nitration in the Presence of Ammonia Oxidizing Bacteria. Environmental
Science & Technology 2008; 42: 7622-7627.
Gee RH, Charles A, Taylor N, Darbre PD. Oestrogenic and androgenic activity of
triclosan in breast cancer cells. J Appl Toxicol 2008; 28: 78-91.

P a g e | 72
Gomes RL, Scrimshaw MD, Lester JN. Fate of conjugated natural and synthetic steroid
estrogens in crude sewage and activated sludge batch studies. Environ Sci
Technol 2009; 43: 3612-8.
Gómez MJ, Herrera S, Solé D, García-Calvo E, Fernández-Alba AR. Spatio-temporal
evaluation of organic contaminants and their transformation products along a river
basin affected by urban, agricultural and industrial pollution. Science of The Total
Environment 2012; 420: 134-145.
Govind R, Lai L, Dobbs R. Integrated model for predicting the fate of organics in
wastewater treatment plants. Environmental Progress 1991; 10: 13-23.
Gros M, Petrović M, Barceló D. Wastewater treatment plants as a pathway for aquatic
contamination by pharmaceuticals in the Ebro river basin (Northeast Spain).
Environmental Toxicology and Chemistry 2007; 26: 1553-1562.
Hai FI, Tessmer K, Nguyen LN, Kang JG, Price WE, Nghiem LD. Removal of
micropollutants by membrane bioreactor under temperature variation. Journal of
Membrane Science 2011; 383: 144-151.
Halling-Sorensen B, Nors Nielsen S, Lanzky PF, Ingerslev F, Holten Lutzhoft HC,
Jorgensen SE. Occurrence, fate and effects of pharmaceutical substances in the
environment--a review. Chemosphere 1998; 36: 357-93.
Hamid H, Eskicioglu C. Fate of estrogenic hormones in wastewater and sludge treatment:
A review of properties and analytical detection techniques in sludge matrix. Water
Research 2012; 46: 5813-5833.
Hao C, Lissemore L, Nguyen B, Kleywegt S, Yang P, Solomon K. Determination of
pharmaceuticals in environmental waters by liquid chromatography/electrospray
ionization/tandem mass spectrometry. Analytical and Bioanalytical Chemistry
2006; 384: 505-13.
Heberer T. Occurrence, fate, and removal of pharmaceutical residues in the aquatic
environment: a review of recent research data. Toxicol Lett 2002; 131: 5-17.
Heidler J, Halden RU. Mass balance assessment of triclosan removal during conventional
sewage treatment. Chemosphere 2007; 66: 362-9.
Helbling DE, Johnson DR, Honti M, Fenner K. Micropollutant biotransformation kinetics
associate with WWTP process parameters and microbial community
characteristics. Environ Sci Technol 2012; 46: 10579-88.
Hess-Wilson JK, Knudsen KE. Endocrine disrupting compounds and prostate cancer.
Cancer Lett 2006; 241: 1-12.
Hignite C, Azarnoff DL. Drugs and drug metabolites as environmental contaminants:
chlorophenxoyisobutyrate and salicylic acid in sewage water effluent. Life Sci.
1977; 20: 337-342.
Hirano M, Ishibashi H, Kim JW, Matsumura N, Arizono K. Effects of environmentally
relevant concentrations of nonylphenol on growth and 20-hydroxyecdysone levels
P a g e | 73
in mysid crustacean, Americamysis bahia. Comp Biochem Physiol C Toxicol
Pharmacol 2009; 149: 368-73.
Huang M, Li Y, Gu G. The effects of hydraulic retention time and sludge retention time
on the fate of di-(2-ethylhexyl) phthalate in a laboratory-scale anaerobic-anoxic-
aerobic activated sludge system. Bioresour Technol 2008; 99: 8107-11.
Hung NV, Tateda M, Ike M, Fujita M, Tsunoi S, Tanaka M. Sorption of biodegradation
end products of nonylphenol polyethoxylates onto activated sludge. Journal of
Environmental Sciences 2004; 16: 564-569.
Isidori M, Bellotta M, Cangiano M, Parrella A. Estrogenic activity of pharmaceuticals in
the aquatic environment. Environ Int 2009; 35: 826-9.
Jacobsen BN, Arvin E. Biodegradation kinetics and fate modelling of pentachlorophenol
in bioaugmented activated sludge reactors. Water Research 1996; 30: 1184-1194.
Jacobsen BN, Nyholm N, Pedersen BM, Poulsen O, Ostfeldt P. Removal of Organic
Micropollutants in Laboratory Activated-Sludge Reactors under Various
Operating-Conditions - Sorption. Water Research 1993; 27: 1505-1510.
Jeffries KM, Jackson LJ, Ikonomou MG, Habibi HR. Presence of natural and
anthropogenic organic contaminants and potential fish health impacts along two
river gradients in Alberta, Canada. Environ Toxicol Chem 2010; 29: 2379-87.
Joss A, Andersen H, Ternes T, Richle PR, Siegrist H. Removal of Estrogens in Municipal
Wastewater Treatment under Aerobic and Anaerobic Conditions: Consequences
for Plant Optimization. Environmental Science & Technology 2004; 38: 3047-
3055.
Joss A, Keller E, Alder AC, Gobel A, McArdell CS, Ternes T, et al. Removal of
pharmaceuticals and fragrances in biological wastewater treatment. Water Res
2005; 39: 3139-52.
Joss A, Zabczynski S, Gobel A, Hoffmann B, Loffler D, McArdell CS, et al. Biological
degradation of pharmaceuticals in municipal wastewater treatment: proposing a
classification scheme. Water Res 2006; 40: 1686-96.
Kanda R Fau - Griffin P, Griffin P Fau - James HA, James Ha Fau - Fothergill J, J F. -
Pharmaceutical and personal care products in sewage treatment works. J Environ
Monit 2003; 5: 823-30.
Kasprzyk-Hordern B, Dinsdale RM, Guwy AJ. Multiresidue methods for the analysis of
pharmaceuticals, personal care products and illicit drugs in surface water and
wastewater by solid-phase extraction and ultra performance liquid
chromatography-electrospray tandem mass spectrometry. Analytical and
Bioanalytical Chemistry 2008; 391: 1293-308.
Kasprzyk-Hordern B, Dinsdale RM, Guwy AJ. The removal of pharmaceuticals, personal
care products, endocrine disruptors and illicit drugs during wastewater treatment
and its impact on the quality of receiving waters. Water Res 2009; 43: 363-80.
P a g e | 74
Khunjar WO, Mackintosh SA, Skotnicka-Pitak J, Baik S, Aga DS, Love NG. Elucidating
the relative roles of ammonia oxidizing and heterotrophic bacteria during the
biotransformation of 17alpha-Ethinylestradiol and Trimethoprim. Environ Sci
Technol 2011; 45: 3605-12.
Kidd KA, Blanchfield PJ, Mills KH, Palace VP, Evans RE, Lazorchak JM, et al. Collapse
of a fish population after exposure to a synthetic estrogen. Proc Natl Acad Sci U S
A 2007; 104: 8897-901.
Kim JY, Ryu K, Kim EJ, Choe WS, Cha GC, Yoo IK. Degradation of bisphenol A and
nonylphenol by nitrifying activated sludge. Process Biochemistry 2007; 42: 1470-
1474.
Kimura K, Hara H, Watanabe Y. Elimination of selected acidic pharmaceuticals from
municipal wastewater by an activated sludge system and membrane bioreactors.
Environ Sci Technol 2007; 41: 3708-14.
Kinney CA, Furlong ET, Kolpin DW, Burkhardt MR, Zaugg SD, Werner SL, et al.
Bioaccumulation of pharmaceuticals and other anthropogenic waste indicators in
earthworms from agricultural soil amended with biosolid or swine manure.
Environ Sci Technol 2008; 42: 1863-70.
Kirk LA, Tyler CR, Lye CM, Sumpter JP. Changes in estrogenic and androgenic
activities at different stages of treatment in wastewater treatment works.
Environmental Toxicology and Chemistry 2002; 21: 972-979.
Klecka GM, Staples CA, Clark KE, Van der Hoeven N, Thomas DE, Hentges SG.
Exposure analysis of bisphenol A in surface water systems in North America and
Europe. Environ Sci Technol 2009; 43: 6145-50.
Kleywegt S, Pileggi V, Yang P, Hao C, Zhao X, Rocks C, et al. Pharmaceuticals,
hormones and bisphenol A in untreated source and finished drinking water in
Ontario, Canada--occurrence and treatment efficiency. Sci Total Environ 2011;
409: 1481-8.
Koh YK, Chiu TY, Boobis A, Cartmell E, Scrimshaw MD, Lester JN. Treatment and
removal strategies for estrogens from wastewater. Environ Technol 2008; 29:
245-67.
Kovalova L, Siegrist H, Singer H, Wittmer A, McArdell CS. Hospital wastewater
treatment by membrane bioreactor: Performance and efficiency for organic
micropollutant elimination. Environmental Science and Technology 2012; 46:
1536-1545.
Kreuzinger N, Clara M, Strenn B, Kroiss H. Relevance of the sludge retention time
(SRT) as design criteria for wastewater treatment plants for the removal of
endocrine disruptors and pharmaceuticals from wastewater. Water Science and
Technology 2004; 50: 149-156.
P a g e | 75
Kumar AK, Mohan SV, Sarma PN. Sorptive removal of endocrine-disruptive compound
(estriol, E3) from aqueous phase by batch and column studies: kinetic and
mechanistic evaluation. J Hazard Mater 2009; 164: 820-8.
Lai KM, Johnson KL, Scrimshaw MD, Lester JN. Binding of waterborne steroid
estrogens to solid phases in river and estuarine systems. Environmental Science &
Technology 2000; 34: 3890-3894.
Lang IA, Galloway TS, Scarlett A, Henley WE, Depledge M, Wallace RB, et al.
Association of urinary bisphenol A concentration with medical disorders and
laboratory abnormalities in adults. JAMA 2008; 300: 1303-10.
Lange R, Hutchinson TH, Croudace CP, Siegmund F, Schweinfurth H, Hampe P, et al.
Effects of the synthetic estrogen 17 alpha-ethinylestradiol on the life-cycle of the
fathead minnow (Pimephales promelas). Environ Toxicol Chem 2001; 20: 1216-
27.
Larcher S, Yargeau V. Biodegradation of 17alpha-ethinylestradiol by heterotrophic
bacteria. Environ Pollut 2013; 173: 17-22.
Layton AC, Gregory BW, Seward JR, Schultz TW, Sayler GS. Mineralization of
Steroidal Hormones by Biosolids in Wastewater Treatment Systems in Tennessee
U.S.A. Environmental Science & Technology 2000; 34: 3925-3931.
Le-Minh N, Khan SJ, Drewes JE, Stuetz RM. Fate of antibiotics during municipal water
recycling treatment processes. Water Res 2010; 44: 4295-323.
Lee do G, Zhao F, Rezenom YH, Russell DH, Chu KH. Biodegradation of triclosan by a
wastewater microorganism. Water Res 2012; 46: 4226-34.
Lee HB, Peart TE. Bisphenol a contamination in Canadian municipal and industrial
wastewater and sludge samples. Water Quality Research Journal of Canada 2000;
35: 283-298.
Lee HB, Peart TE, Chan J, Gris G. Occurrence of endocrine-disrupting chemicals in
sewage and sludge samples in Toronto, Canada. Water Quality Research Journal
of Canada 2004; 39: 57-63.
Lee HJ, Chattopadhyay S, Gong EY, Ahn RS, Lee K. Antiandrogenic effects of
bisphenol A and nonylphenol on the function of androgen receptor. Toxicol Sci
2003; 75: 40-6.
Lee KC, Rittmann BE, Shi JC, McAvoy D. Advanced steady-state model for the fate of
hydrophobic and volatile compounds in activated sludge. Water Environment
Research 1998; 70: 1118-1131.
Li F, Yuasa A, Obara A, Mathews AP. Aerobic batch degradation of 17-beta estradiol
(E2) by activated sludge: effects of spiking E2 concentrations, MLVSS and
temperatures. Water Res 2005; 39: 2065-75.
Lindblom E, Press-Kristensen K, Vanrolleghem PA, Mikkelsen PS, Henze M. Dynamic
experiments with high bisphenol-A concentrations modelled with an ASM model

P a g e | 76
extended to include a separate XOC degrading microorganism. Water Res 2009;
43: 3169-76.
Lishman L, Smyth SA, Sarafin K, Kleywegt S, Toito J, Peart T, et al. Occurrence and
reductions of pharmaceuticals and personal care products and estrogens by
municipal wastewater treatment plants in Ontario, Canada. Sci Total Environ
2006; 367: 544-58.
Liu Y, Tam NFY, Guan Y, Gao B. Influence of a marine diatom on the embryonic
toxicity of 17α-ethynylestradiol to the abalone haliotis diversicolor supertexta.
Water, Air, and Soil Pollution 2012; 223: 4383-4395.
Lopez-Avila V, Hites RA. Organic compounds in an industrial wastewater. Their
transport into sediments. Environmental Science & Technology 1980; 14: 1382-
1390.
Luo YL, Guo WS, Ngo HH, Nghiem LD, Hai FI, Zhang J, et al. A review on the
occurrence of micropollutants in the aquatic environment and their fate and
removal during wastewater treatment. Science of The Total Environment 2014;
473: 619-641.
Magee P. 24 - Antiseptic drugs and disinfectants. In: Aronson JK, editor. Side Effects of
Drugs Annual. Volume 34. Elsevier, 2012, pp. 377-383.
Majewsky M, Galle T, Yargeau V, Fischer K. Active heterotrophic biomass and sludge
retention time (SRT) as determining factors for biodegradation kinetics of
pharmaceuticals in activated sludge. Bioresour Technol 2011; 102: 7415-21.
Marfil-Vega R, Suidan MT, Mills MA. Abiotic transformation of estrogens in synthetic
municipal wastewater: an alternative for treatment? Environ Pollut 2010; 158:
3372-7.
Maurer M, Escher BI, Richle P, Schaffner C, Alder AC. Elimination of beta-blockers in
sewage treatment plants. Water Res 2007; 41: 1614-22.
Melcer H, Bell JP, Thompson DJ, Yendt CM, Kemp J, Steel P. Modeling Volatile
Organic Contaminants' Fate in Wastewater Treatment Plants. Journal of
Environmental Engineering 1994; 120: 588-609.
Melcer H, Klecka G. Treatment of wastewaters containing bisphenol A: state of the
science review. Water Environ Res 2011; 83: 650-66.
Mes dTZD. Fate of estrogens in biological treatment of concentrated black water. [s.n.],
[S.l.], 2007.
Mohapatra DP, Brar SK, Tyagi RD, Surampalli RY. Occurrence of bisphenol A in
wastewater and wastewater sludge of CUQ treatment plant. Journal of
Xenobiotics 2011; 1.
Muller M, Rabenoelina F, Balaguer P, Patureau D, Lemenach K, Budzinski H, et al.
Chemical and biological analysis of endocrine-disrupting hormones and
estrogenic activity in an advanced sewage treatment plant. Environ Toxicol Chem
2008; 27: 1649-58.
P a g e | 77
Nakada N, Yasojima M, Okayasu Y, Komori K, Suzuki Y. Mass balance analysis of
triclosan, diethyltoluamide, crotamiton and carbamazepine in sewage treatment
plants. Water Sci Technol 2010; 61: 1739-47.
Neumegen RA, Fernandez-Alba AR, Chisti Y. Toxicities of triclosan, phenol, and copper
sulfate in activated sludge. Environ Toxicol 2005; 20: 160-4.
Nie Y, Qiang Z, Zhang H, Adams C. Determination of endocrine-disrupting chemicals in
the liquid and solid phases of activated sludge by solid phase extraction and gas
chromatography-mass spectrometry. J Chromatogr A 2009; 1216: 7071-80.
Nie YF, Qiang ZM, Zhang HQ, Ben WW. Fate and seasonal variation of endocrine-
disrupting chemicals in a sewage treatment plant with A/A/O process. Separation
and Purification Technology 2012; 84: 9-15.
Oehlmann J, Schulte-Oehlmann U, Kloas W, Jagnytsch O, Lutz I, Kusk KO, et al. A
critical analysis of the biological impacts of plasticizers on wildlife. Philos Trans
R Soc Lond B Biol Sci 2009; 364: 2047-62.
Parker WJ, Bell JP, Melcer H. Modelling the fate of chlorinated phenols in wastewater
treatment plants. Environmental Progress 1994; 13: 98-104.
Parrott JL, Blunt BR. Life-cycle exposure of fathead minnows (Pimephales promelas) to
an ethinylestradiol concentration below 1 ng/L reduces egg fertilization success
and demasculinizes males. Environ Toxicol 2005; 20: 131-41.
Pasquini L, Merlin C, Hassenboehler L, Munoz JF, Pons MN, Gorner T. Impact of
certain household micropollutants on bacterial behavior. Toxicity tests/study of
extracellular polymeric substances in sludge. Sci Total Environ 2013; 463-464:
355-65.
Plósz BG, Langford KH, Thomas KV. An activated sludge modeling framework for
xenobiotic trace chemicals (ASM-X): Assessment of diclofenac and
carbamazepine. Biotechnology and Bioengineering 2012; 109: 2757-2769.
Plosz BG, Leknes H, Thomas KV. Impacts of competitive inhibition, parent compound
formation and partitioning behavior on the removal of antibiotics in municipal
wastewater treatment. Environ Sci Technol 2010; 44: 734-42.
Pomati F, Orlandi C, Clerici M, Luciani F, Zuccato E. Effects and interactions in an
environmentally relevant mixture of pharmaceuticals. Toxicol Sci 2008; 102: 129-
37.
Pomiès M, Choubert JM, Wisniewski C, Coquery M. Modelling of micropollutant
removal in biological wastewater treatments: a review. Sci Total Environ 2013;
443: 733-48.
Press-Kristensen K, Lindblom E, Henze M. Modelling as a tool when interpreting
biodegradation of micro pollutants in activated sludge systems. Water Science
and Technology 2007; 56: 11-16.

P a g e | 78
Qiang Z, Dong H, Zhu B, Qu J, Nie Y. A comparison of various rural wastewater
treatment processes for the removal of endocrine-disrupting chemicals (EDCs).
Chemosphere 2013; 92: 986-992.
Queckenberg C, Meins J, Wachall B, Doroshyenko O, Tomalik-Scharte D, Bastian B, et
al. Absorption, pharmacokinetics, and safety of triclosan after dermal
administration. Antimicrob Agents Chemother 2010; 54: 570-2.
Quinn B, Gagne F, Blaise C. Evaluation of the acute, chronic and teratogenic effects of a
mixture of eleven pharmaceuticals on the cnidarian, Hydra attenuata. Sci Total
Environ 2009; 407: 1072-9.
Racz L, Muller JG, Goel RK. Fate of selected estrogens in two laboratory scale
sequencing batch reactors fed with different organic carbon sources under varying
solids retention times. Bioresour Technol 2012; 110: 35-42.
Radjenovic J, Petrovic M, Barcelo D. Fate and distribution of pharmaceuticals in
wastewater and sewage sludge of the conventional activated sludge (CAS) and
advanced membrane bioreactor (MBR) treatment. Water Res 2009; 43: 831-41.
Rasmussen LS. Postoperative cognitive dysfunction: incidence and prevention. Best Pract
Res Clin Anaesthesiol 2006; 20: 315-30.
Rauch-Williams T, Hoppe-Jones C, Drewes JE. The role of organic matter in the removal
of emerging trace organic chemicals during managed aquifer recharge. Water Res
2010; 44: 449-60.
Ren YX, Nakano K, Nomura M, Chiba N, Nishimura O. Effects of bacterial activity on
estrogen removal in nitrifying activated sludge. Water Res 2007; 41: 3089-96.
Robinson BJ, Hui JP, Soo EC, Hellou J. Estrogenic compounds in seawater and sediment
from Halifax Harbour, Nova Scotia, Canada. Environ Toxicol Chem 2009; 28:
18-25.
Roh H, Chu KH. A 17beta-estradiol-utilizing bacterium, Sphingomonas strain KC8: part
I - characterization and abundance in wastewater treatment plants. Environ Sci
Technol 2010; 44: 4943-50.
Roig B. Pharmaceuticals in the environment. Current knowledge and need assessment to
reduce presence and impact: IWA Publishing, 2010.
Rubin BS, Soto AM. Bisphenol A: Perinatal exposure and body weight. Mol Cell
Endocrinol 2009; 304: 55-62.
Samaras VG, Stasinakis AS, Mamais D, Thomaidis NS, Lekkas TD. Fate of selected
pharmaceuticals and synthetic endocrine disrupting compounds during
wastewater treatment and sludge anaerobic digestion. J Hazard Mater 2013; 244-
245: 259-67.
Schäfer AI, Akanyeti I, Semião AJC. Micropollutant sorption to membrane polymers: A
review of mechanisms for estrogens. Advances in Colloid and Interface Science
2011; 164: 100-117.

P a g e | 79
Schäfer AI, Mastrup M, Jensen RL. Particle interactions and removal of trace
contaminants from water and wastewaters. Desalination 2002; 147: 243-250.
Segev O, Kushmaro A, Brenner A. Environmental impact of flame retardants (persistence
and biodegradability). Int J Environ Res Public Health 2009; 6: 478-91.
Servos MR, Bennie DT, Burnison BK, Jurkovic A, McInnis R, Neheli T, et al.
Distribution of estrogens, 17β-estradiol and estrone, in Canadian municipal
wastewater treatment plants. Science of The Total Environment 2005; 336: 155-
170.
Seyhi B, Drogui P, Buelna G, Blais JF. Modeling of sorption of bisphenol A in sludge
obtained from a membrane bioreactor process. Chemical Engineering Journal
2011; 172: 61-67.
Shen G, Huang J, Yu G. Measurement of the free concentrations of alkyl phenols and
bisphenol A to determine their biodegradation kinetics by activated sludge.
Chinese Science Bulletin 2007; 52: 2766-2770.
Shi J, Fujisawa S, Nakai S, Hosomi M. Biodegradation of natural and synthetic estrogens
by nitrifying activated sludge and ammonia-oxidizing bacterium Nitrosomonas
europaea. Water Res 2004; 38: 2322-9.
Silva P, Rocha MJ, Cruzeiro C, Malhão F, Reis B, Urbatzka R, et al. Testing the effects
of ethinylestradiol and of an environmentally relevant mixture of xenoestrogens
as found in the Douro River (Portugal) on the maturation of fish gonads-A
stereological study using the zebrafish (Danio rerio) as model. Aquatic
Toxicology 2012; 124-125: 1-10.
Singer H, Müller S, Tixier C, Pillonel L. Triclosan: Occurrence and Fate of a Widely
Used Biocide in the Aquatic Environment: Field Measurements in Wastewater
Treatment Plants, Surface Waters, and Lake Sediments. Environmental Science &
Technology 2002; 36: 4998-5004.
Sivaraman S, Sullivan TJ, Johnson F, Novichenok P, Cui G, Simmerling C, et al.
Inhibition of the bacterial enoyl reductase FabI by triclosan: a structure-reactivity
analysis of FabI inhibition by triclosan analogues. J Med Chem 2004; 47: 509-18.
Spring AJ, Bagley DM, Andrews RC, Lemanik S, Yang P. Removal of endocrine
disrupting compounds using a membrane bioreactor and disinfection. Journal of
Environmental Engineering and Science 2007; 6: 131-137.
Stahlhut RW, Welshons WV, Swan SH. Bisphenol A Data in NHANES Suggest Longer
than Expected Half-Life, Substantial Nonfood Exposure, or Both. Environmental
health perspectives 2009; 117: 784-789.
Staples CA, Dome PB, Klecka GM, Oblock ST, Harris LR. A review of the
environmental fate, effects, and exposures of bisphenol A. Chemosphere 1998a;
36: 2149-2173.
P a g e | 80
Staples CA, Dorn PB, Klecka GM, O'Block ST, Harris LR. A review of the
environmental fate, effects, and exposures of bisphenol A. Chemosphere 1998b;
36: 2149-73.
Stasinakis AS, Gatidou G, Mamais D, Thomaidis NS, Lekkas TD. Occurrence and fate of
endocrine disrupters in Greek sewage treatment plants. Water Res 2008; 42:
1796-804.
Stasinakis AS, Kordoutis CI, Tsiouma VC, Gatidou G, Thomaidis NS. Removal of
selected endocrine disrupters in activated sludge systems: effect of sludge
retention time on their sorption and biodegradation. Bioresour Technol 2010; 101:
2090-5.
Stevens-Garmon J, Drewes JE, Khan SJ, McDonald JA, Dickenson ER. Sorption of
emerging trace organic compounds onto wastewater sludge solids. Water Res
2011; 45: 3417-26.
Suárez S, Carballa M, Omil F, Lema JM. How are pharmaceutical and personal care
products (PPCPs) removed from urban wastewaters? Reviews in Environmental
Science and Bio/Technology 2008a; 7: 125-138.
Suárez S, Carballa M, Omil F, Lema JM. How are pharmaceutical and personal care
products (PPCPs) removed from urban wastewaters? Reviews in Environmental
Science and Biotechnology 2008b; 7: 125-138.
Suarez S, Lema JM, Omil F. Removal of Pharmaceutical and Personal Care Products
(PPCPs) under nitrifying and denitrifying conditions. Water Research 2010; 44:
3214-3224.
Suarez S, Reif R, Lema JM, Omil F. Mass balance of pharmaceutical and personal care
products in a pilot-scale single-sludge system: influence of T, SRT and
recirculation ratio. Chemosphere 2012; 89: 164-71.
Sun P, Casteel K, Dai H, Wehmeyer KR, Kiel B, Federle T. Distributions of polycyclic
musk fragrance in wastewater treatment plant (WWTP) effluents and sludges in
the United States. Sci Total Environ 2014.
Tadkaew N, Hai FI, McDonald JA, Khan SJ, Nghiem LD. Removal of trace organics by
MBR treatment: The role of molecular properties. Water Research 2011; 45:
2439-2451.
Tan BL, Hawker DW, Muller JF, Leusch FD, Tremblay LA, Chapman HF. Modelling of
the fate of selected endocrine disruptors in a municipal wastewater treatment plant
in South East Queensland, Australia. Chemosphere 2007; 69: 644-54.
Ter Laak TL, Durjava M, Struijs J, Hermens JL. Solid phase dosing and sampling
technique to determine partition coefficients of hydrophobic chemicals in
complex matrixes. Environ Sci Technol 2005; 39: 3736-42.
Ternes TA, Joss A, Siegrist H. Peer Reviewed: Scrutinizing Pharmaceuticals and
Personal Care Products in Wastewater Treatment. Environmental Science &
Technology 2004; 38: 392A-399A.
P a g e | 81
Ternes TA, Knacker T, Oehlmann J. Personal care products in the aquatic environment—
A neglected group of substances. UWSF—Zeitschrift fu¨r Umweltchemie und O¨
kotoxikologie 2003; 15(3): 169–180.
Ternes TA, Stumpf M, Mueller J, Haberer K, Wilken RD, Servos M. Behavior and
occurrence of estrogens in municipal sewage treatment plants--I. Investigations in
Germany, Canada and Brazil. Sci Total Environ 1999; 225: 81-90.
Thomas PM, Foster GD. Tracking acidic pharmaceuticals, caffeine, and triclosan through
the wastewater treatment process. Environmental Toxicology and Chemistry
2005; 24: 25-30.
Thompson A, Griffin P, Stuetz R, Cartmell E. The fate and removal of triclosan during
wastewater treatment. Water Environ Res 2005; 77: 63-7.
Tixier C, Singer HP, Canonica S, Muller SR. Phototransfomation of ticlosan in surface
waters: a relevant elimination process for this widely used biocide--laboratory
studies, field measurements, and modeling. Environ Sci Technol 2002; 36: 3482-
9.
Tomei MC, Annesini MC, Rita S, Daugulis AJ. Biodegradation of 4-nitrophenol in a
two-phase sequencing batch reactor: concept demonstration, kinetics and
modelling. Applied Microbiology and Biotechnology 2008; 80: 1105-12.
Trinh T, van den Akker B, Stuetz RM, Coleman HM, Le-Clech P, Khan SJ. Removal of
trace organic chemical contaminants by a membrane bioreactor. Water Sci
Technol 2012; 66: 1856-63.
Urase T, Kikuta T. Separate estimation of adsorption and degradation of pharmaceutical
substances and estrogens in the activated sludge process. Water Res 2005; 39:
1289-300.
Urbatzka R, van Cauwenberge A, Maggioni S, Vigano L, Mandich A, Benfenati E, et al.
Androgenic and antiandrogenic activities in water and sediment samples from the
river Lambro, Italy, detected by yeast androgen screen and chemical analyses.
Chemosphere 2007; 67: 1080-7.
Vader JS, van Ginkel CG, Sperling FM, de Jong J, de Boer W, de Graaf JS, et al.
Degradation of ethinyl estradiol by nitrifying activated sludge. Chemosphere
2000; 41: 1239-43.
Vajda AM, Barber LB, Gray JL, Lopez EM, Woodling JD, Norris DO. Reproductive
disruption in fish downstream from an estrogenic wastewater effluent. Environ
Sci Technol 2008; 42: 3407-14.
Vega-Morales T, Sosa-Ferrera Z, Santana-Rodriguez JJ. Determination of alkylphenol
polyethoxylates, bisphenol-A, 17alpha-ethynylestradiol and 17beta-estradiol and
its metabolites in sewage samples by SPE and LC/MS/MS. J Hazard Mater 2010;
183: 701-11.
P a g e | 82
Verlicchi P, Al Aukidy M, Zambello E. Occurrence of pharmaceutical compounds in
urban wastewater: removal, mass load and environmental risk after a secondary
treatment--a review. Sci Total Environ 2012; 429: 123-55.
Vethaak AD, Lahr J, Schrap SM, Belfroid AC, Rijs GB, Gerritsen A, et al. An integrated
assessment of estrogenic contamination and biological effects in the aquatic
environment of The Netherlands. Chemosphere 2005; 59: 511-24.
Vieno N, Tuhkanen T, Kronberg L. Removal of pharmaceuticals in drinking water
treatment: effect of chemical coagulation. Environ Technol 2006; 27: 183-92.
vom Saal FS, Myers JP. Bisphenol A and risk of metabolic disorders. JAMA 2008; 300:
1353-5.
Walker BS, Janney JC. Estrogenic substances II An analysis of plant sources.
Endocrinology 1930; 14: 389-392.
Weber S, Leuschner P, Kampfer P, Dott W, Hollender J. Degradation of estradiol and
ethinyl estradiol by activated sludge and by a defined mixed culture. Applied
Microbiology and Biotechnology 2005; 67: 106-12.
Wick A, Fink G, Joss A, Siegrist H, Ternes TA. Fate of beta blockers and psycho-active
drugs in conventional wastewater treatment. Water Res 2009; 43: 1060-74.
Wozniak AL, Bulayeva NN, Watson CS. Xenoestrogens at picomolar to nanomolar
concentrations trigger membrane estrogen receptor-alpha-mediated Ca2+ fluxes
and prolactin release in GH3/B6 pituitary tumor cells. Environmental health
perspectives 2005; 113: 431-439.
Xue W, Wu C, Xiao K, Huang X, Zhou H, Tsuno H, et al. Elimination and fate of
selected micro-organic pollutants in a full-scale anaerobic/anoxic/aerobic process
combined with membrane bioreactor for municipal wastewater reclamation.
Water Res 2010; 44: 5999-6010.
Ying GG, Yu XY, Kookana RS. Biological degradation of triclocarban and triclosan in a
soil under aerobic and anaerobic conditions and comparison with environmental
fate modelling. Environ Pollut 2007; 150: 300-5.
Yoon Y, Westerhoff P, Yoon J, Snyder S. Removal of 17β Estradiol and Fluoranthene by
Nanofiltration and Ultrafiltration. Journal of Environmental Engineering 2004;
130: 1460-1467.
Yu Y, Huang Q, Cui J, Zhang K, Tang C, Peng X. Determination of pharmaceuticals,
steroid hormones, and endocrine-disrupting personal care products in sewage
sludge by ultra-high-performance liquid chromatography-tandem mass
spectrometry. Analytical and Bioanalytical Chemistry 2011; 399: 891-902.
Zhang Y, Geissen SU, Gal C. Carbamazepine and diclofenac: removal in wastewater
treatment plants and occurrence in water bodies. Chemosphere 2008; 73: 1151-61.
Zhao J, Li Y, Zhang C, Zeng Q, Zhou Q. Sorption and degradation of bisphenol A by
aerobic activated sludge. J Hazard Mater 2008; 155: 305-11.

P a g e | 83
Zhou H, Huang X, Wang X, Zhi X, Yang C, Wen X, et al. Behaviour of selected
endocrine-disrupting chemicals in three sewage treatment plants of Beijing,
China. Environmental Monitoring and Assessment 2010; 161: 107-21.
Zhou JL, Liu R, Wilding A, Hibberd A. Sorption of selected endocrine disrupting
chemicals to different aquatic colloids. Environ Sci Technol 2007; 41: 206-13.
Zhou X, Oleszkiewicz JA. Biodegradation of oestrogens in nitrifying activated sludge.
Environ Technol 2010; 31: 1263-9.
Ziels RM, Lust MJ, Gough HL, Strand SE, Stensel HD. Influence of Bioselector
Processes on 17alpha-Ethinylestradiol Biodegradation in Activated Sludge
Wastewater Treatment Systems. Environ Sci Technol 2014.
Ziylan A, Ince NH. The occurrence and fate of anti-inflammatory and analgesic
pharmaceuticals in sewage and fresh water: treatability by conventional and non-
conventional processes. J Hazard Mater 2011; 187: 24-36.

P a g e | 84
Chapter 3: Analytical Methods
Summary1
The purpose of this chapter was to develop and optimize a simple and economical
method for the extraction and determination of BPA, EE2 and TCS using high-
performance liquid chromatography (HPLC) coupled with ultraviolent (UV) detection at
environmentally relevant concentrations in both dissolved and particulate phases.
To clean-up and pre-concentrate the liquid sample, solid phase extraction (SPE)
method was optimized for high recovery of selected MCs and good clean-up. For sludge
samples, four extraction methods were compared for isolation of BPA from activated
sludge samples and modified for EE2 and TCS. Analysis was performed by optimized
procedures using HPLC-UV. MAE had the highest recovery among examined extraction
methods. The recoveries of BPA, TCS and EE2 in liquid samples were found to be 106 ±
2, 95 ± 6 and 88 ± 5%, respectively. Also satisfactory recoveries were obtained in solid
samples (>75%), except for TCS, where recoveries of 55 ± 6% were obtained. For this
reason, recovery correction was made for TCS by dividing the observed concentrations
by recovery rates. The limit of detection (LOD) of the target compounds in liquid and
solid samples were 100 ng/L and 100 ng/g, respectively.
1 Part of this chapter has been published as:
Banihashemi B, Droste RL. Trace level determination of bisphenol-A in wastewater and sewage sludge
by high-performance liquid chromatography and UV detection. Water Quality Research Journal of Canada
2013; 48: 133-144.

P a g e | 85
3.1 Introduction
Several extraction procedures have been developed for the isolation of BPA from
environmental samples. For liquid samples the most common method used is solid-phase
extraction (Kuch and Ballschmiter, 2001; Lee et al., 2005), although liquid–liquid
extraction (González-Casado et al., 1998; Varelis and Balafas, 2000), soxhlet extraction
(Pryor et al., 2002), and solid-phase microextraction (Chang et al., 2005; Helaleh et al.,
2001; Huang et al., 2005) have also been reported. Among these extraction techniques,
SPE has the advantages of relative low solvent usage, good reproducibility and
repeatability, and convenient operation (Gang et al., 2005). For solid samples, several
extraction methods have been used, including pressurized liquid extraction (Agüera et al.,
2003; Ferrer et al., 2011), supercritical fluid extraction (Lee and Peart, 2000b), MAE (Liu
et al., 2004; Pedersen and Lindholst, 1999), soxhlet extraction (Zhao et al., 2008), soxtec
extraction (Jeannot et al., 2002), and ultrasonic extraction (Petrovic et al., 2001; Petrovic
et al., 2002). The microwave assisted extraction (MAE) technique has proven to be more
efficient than the soxhlet extraction due to less solvent consumption and low extraction
time (Diagne et al., 2002). The determination of BPA in WWTPs has been analyzed
mostly by chromatographic methods either by liquid chromatography (LC) (Benijts et al.,
2004; Carabias-Martínez et al., 2004; Motoyama et al., 1999) or by gas chromatography
(GC) (Meesters and Schröder, 2002; Urase and Kikuta, 2005) with or without mass
P a g e | 86
spectrometric (MS) detection. GC/MS as a commonly used method has been reported to
have good sensitivity and low detection limit for BPA trace determination (Gatidou et al.,
2007; Hernando et al., 2004; Petrovic et al., 2001); however, it requires a derivatization
procedure, which generally takes up to several hours to be completed. On the contrary,
the micropollutant analyses using HPLC with choice of detectors such as UV,
fluorescence and electrochemical detection only requires a simple and rapid pre-treatment
method (Sajiki, 2001). Mohapatra et al. (2011) reviewed the analytical methods in the
literature and concluded that among the possible detection methods, MS detection,
especially LC/MS showed significant selectivity when the target compound existed in a
complex matrix such as sludge and sediments. High sensitivity and popularity of the LC–
MS/MS system makes it a powerful tool for quantifying BPA in very low concentrations,
ng/L (Baugros et al., 2008; Laganà et al., 2004; Mohapatra et al., 2010; Seyhi et al.,
2011). However, MS detector is a complex machine that requires skilled personnel for
operation. Also it is not easy to maintain high stability of analytical results, especially for
low concentrations of analyte (Hammarling et al., 2000; Le Blanc et al., 2009).
Additionally, this detection method is not available in every environmental laboratory
and it is costly. Therefore researchers have tried to develop analytical methods using
widely used HPLC systems to make it more feasible for laboratory technicians to detect
BPA in environmental samples (Clara et al., 2004; Hadjmohammadi and Saeidi, 2010;
Naassner et al., 2002; Zhao et al., 2008). Nevertheless, most of these researchers have
P a g e | 87
looked at higher BPA concentrations than those found in the environment and mainly in
liquid samples or they have used other detection methods such as fluorescence instead of
widely used UV detection.
The purpose of this study was to develop, optimise and fully validate a simple, fast
and precise integrated extraction and analytical method for the trace determination of
BPA in the dissolved and particulate phases of wastewater, as well as, in sewage sludge.
SPE and HPLC-UV were used for liquid samples based on their availability and ease of
operation, while MAE, high-pressure homogenizer (HPH), accelerated solvent extraction
(ASE), ultrasonication extraction (USE), followed by SPE were applied and compared
for solid samples before the HPLC analysis.
3.2 Material and Methods
3.2.1 Chemicals
Methanol (MeOH), hexane, acetonitrile (ACN), dichloromethane, and acetone used
for cleaning and extraction purposes, were purchased from Fisher Scientific (ON,
Canada) and were all of HPLC grade. BPA (>97% purity assay) was obtained from
Sigma-Aldrich (ON, Canada). BPA stock solution was prepared in 45% ACN/55% Milli-
Q water at 1 mg/L and was used to regularly prepare working standard solutions for
calibration and spiking experiments. Supelclean LC-18 (3 mL, 500 mg) cartridges used
for extraction and clean-up of samples were supplied by Sigma-Aldrich (Oakville, ON,
P a g e | 88
Canada). The Zorbax Eclipse plus C18 chromatography column (4.6 mm× 150 mm, 5
µm) was purchased from Chromatographic Specialties Inc. (ON, Canada). All other
chemical used in this study were supplied by Fisher scientific (ON, Canada) and were of
analytical grade. Milli-Q water was prepared in the laboratory using a Milli-Q/ Millipore
system with Super-C carbon, Ion-Ex, and Orgonex-Q cartridges.
3.2.2 Extraction of liquid samples
To clean-up and pre-concentrate the liquid samples, the SPE method using
commercial SPE cartridge (Supelclean LC-18) was optimized with regards to sample pH,
sample volume, washing and elution solvents, for high recovery of BPA and good clean-
up. The LC-18 cartridge was chosen in this study due to its higher recovery and
reproducibility found in the literature (Gatidou et al., 2007).
For the optimization experiments, a set of 100 mL wastewater effluent samples were
collected from lab-scale porous pot reactor and filtered through a pre-ashed glass fiber
filter (GF/C, pore size 0.45 µm). Then samples were spiked with the 1 mL of 1 mg/L
BPA standard solution. The spiked samples were mixed in an ultrasonic bath for 15 min
to ensure efficient distribution of the compounds in the solution. LC-18 cartridges fitted
on a vacuum apparatus (CHROMABOND, Fishersci, ON, Canada) were used to isolate
BPA from the spiked wastewater effluent samples. SPE requires four main steps:
conditioning, sample loading, washing and elution. Each step can be optimized based on
the compound properties and matrix effect to increase the recovery rate. Although many
P a g e | 89
SPE procedures that are introduced in the literature such as EPA method 3535A, however
these methods are not specific for every compounds nor for all cartridges and can only be
used as a very good starting point. Therefore, the optimization of each step in SPE
method is important if highest recovery of compound of interest is of concern.
Conditioning the reversed phase cartridges such as LC-18, is usually proceeded with two
tube-volumes of water-miscible organic solvent such as MeOH, and followed by two
tube-volumes of buffer solution or water. Sample loading was performed by applying
vacuum pressure at flow rate of 5 mL/min. Studies have shown that the sample pH and
total sample volume affect the extraction efficiency and sample recovery (Gatidou et al.,
2007; Hadjmohammadi and Saeidi, 2010; Hennion, 2000); consequently, the sample pH
and the breakthrough volume were optimized in this study. To remove unwanted
impurities from the sample and enhance the selectivity in the separation step, the washing
solution needs to be stronger than the sample matrix to remove impurities, while it must
not be able to extract and remove the compound of interest. Hence, the method was
optimized based on the solvent composition in the washing step. In the final step, the
elution solvent was chosen to remove the compounds of interest from the tube packing
and increase the recovery of BPA. It is generally accepted that using small aliquots is
more efficient than using larger aliquots in the elution step; therefore, 3 aliquots of tube
size volume (3×3 mL) were chosen with drop-wise flow in the elution step.
P a g e | 90
3.2.3 Extraction of solid samples
To find the proper extraction method with highest recovery, low cost and ease of
operation, extraction of the target compounds from sewage sludge was performed and
compared by ASE, MAE, USE, and HPH. Initially, a set of 100 mL mixed liquor
suspended solids (MLSS) samples was homogenized and deactivated using sodium azide
solution (0.2% w/w) to prevent biodegradation. This concentration has been shown to
inhibit the biodegradation process without causing any cell lysis, and also it does not
cause change to sludge hydrophobicity (Guellil et al., 1998; Xu et al., 2008; Yi and
Harper, 2007). Deactivated samples were mixed on an orbital shaker for 2 h at 200 rpm,
and then were centrifuged for 30 min at 10000 rpm. 2 g of wet sludge cake were
collected, dried at 60ºC for 12 h and spiked with 1 mL of 200 µg/L BPA standard
solution and allowed to accumulate in the biomass for 12 h. These prepared dried sludge
samples (0.2 g) were used for MAE and ASE extraction while wet sludge samples (2 g)
were collected for USE and HPH extraction. Prior to extraction 5 g of anhydrous sodium
sulfate was added to each sample to remove the moisture. Two additional control samples
were prepared with the same procedure using Milli-Q water with no biomass and un-
spiked biomass to measure the BPA loss to the glassware, as well as calculating the
background BPA level. To investigate any BPA loss during the drying procedure, wet
sludge samples were also prepared. All samples were extracted using ASE, USE, HPH
and MAE, and then extracts were filtered through 0.22 µm filters (Millipore, nylon

P a g e | 91
hydrophilic), evaporated by gentle nitrogen gas to dryness and re-dissolved in 10 mL of
MeOH for further treatment by SPE. Since the compound of interest is already in MeOH
and might be eluted along with other impurities existed in sample, SPE extraction method
was modified to increase the reaction time between the sample and bonding silica inside
the cartridge by eliminating the vacuum pressure and using the gravity force in sample
loading step.
The ASE system, Dionex ASE 200, was used to extract BPA from sludge samples.
The samples were extracted in a 1:1 (v/v) mixture of acetone/hexane solvent solution (15
mL). The procedure for ASE system for BPA extraction was reported in Gang et al.
(2005). It consists of 5 min static time, two extraction cycles, 50% flush, 120 s purge, and
repeating the flush and purge twice. For ultrasound extraction, a sonifier system (Branson
model S-450D) with frequency of 20 KHz was used. A procedure for extracting
nonvolatile and semi-volatile organic compounds from solids such as soils, sludges, and
wastes is presented in EPA method 3550C (February, 2007). A 2 g wet sludge sample
was extracted with 1:1 (v/v) acetone/hexane solvent solution (100 mL) three times, using
ultrasonic extraction with 50% energy cycle for 10 min. MAE extraction was carried out
with a Mars 5® (MW Accelerated Reaction System; CEM Corporation) MW oven. This
extraction method uses MW energy to produce elevated temperature and pressure
conditions in a closed vessel containing the sample and organic solvents to achieve
analyte recoveries equivalent to those from Soxhlet extraction, using less solvent and
P a g e | 92
taking significantly less time than the Soxhlet procedure. It is also validated on
commercially-available solvent extraction systems in EPA method, SW-846-3546
(February 2007). The sample was extracted in a 1:1 (v/v) mixture of acetone/hexane
solvent solution (20 mL) with MW power of 1200 W (100%) and the extraction was
performed in the temperature-controlled mode. The extraction procedure was a modified
protocol based on the method reported at Mohapatra et al. (2011). Temperature was
ramped to 110⁰C for 10 min, and then held at 110⁰C for 10 min. The extract was
removed from the cell and the procedure was repeated three times. High pressure
homogenizing extraction was carried out with the EmulsiFlex-C3 homogenizer which is
powered by an electric motor, homogenizing valve, pressurized tank (adjustable between
500 and 30000 psi or 35 and 2000 bar) and temperature control system by heat
exchanger. 2 g of wet spiked sludge was extracted with 30 mL of 1:1 (v/v)
acetone/hexane solvent solution three times at 15000 psi.
BPA was detected by HPLC (Hewlett-Packard, HP 1100). The system consisted of
the degasser (G1322A), a quaternary pump (G1311A), an ALS auto sampler (G1313A), a
Colcomp column oven (G1314A) and multi-wavelength UV-VIS detector (G1365A). A
ZORBAX Eclipse Plus C18 (4.6×150 mm, 5 µm) column was used. The HPLC detection
method was optimized as a part of this study based on the organic mobile phase selection
and injection volume.

P a g e | 93
3.3 Results and Discussion
3.3.1 Optimization of solid phase extraction
Effluent samples of 100 mL volume were collected, filtered and spiked with 1 mL of
1 mg/L BPA standard solution to investigate the effect of sample pH on recovery of BPA.
Generally, the speciation of weakly acidic compounds in aqueous solutions depends on
the solution properties, such as its pH value. Acidification of water solution is likely to
decrease the dissociation of weakly acidic analytes; this may lead to increasing extraction
efficiency of the target compounds if the non-dissociated form binds strongly to the SPE
cartridges. Also, the extraction efficiency of polar ionisable molecules using SPE
columns is normally enhanced by suppressing ionization of the analytes by pH control of
the sample. Since the pKa value of BPA is around 9.8-10, therefore at least a 2 pH
difference between the pH of the sample solution and pKa value of BPA is needed in
order to prohibit the BPA from ionization. pH of samples was modified by adding HCl or
NaOH to each sample before spiking with standard solution, and the recoveries of BPA
samples with different pHs (2, 7, and 11) were compared (Figure 3-1). pH control of the
sample may also be advantageous if retention of ionizable polar interferences can be
reduced by adjusting the sample pH to ensure the interferences are ionized and retained
less strongly by the column. This can be the reason why pH of 2 had a higher recovery
than pH of 7 for BPA.
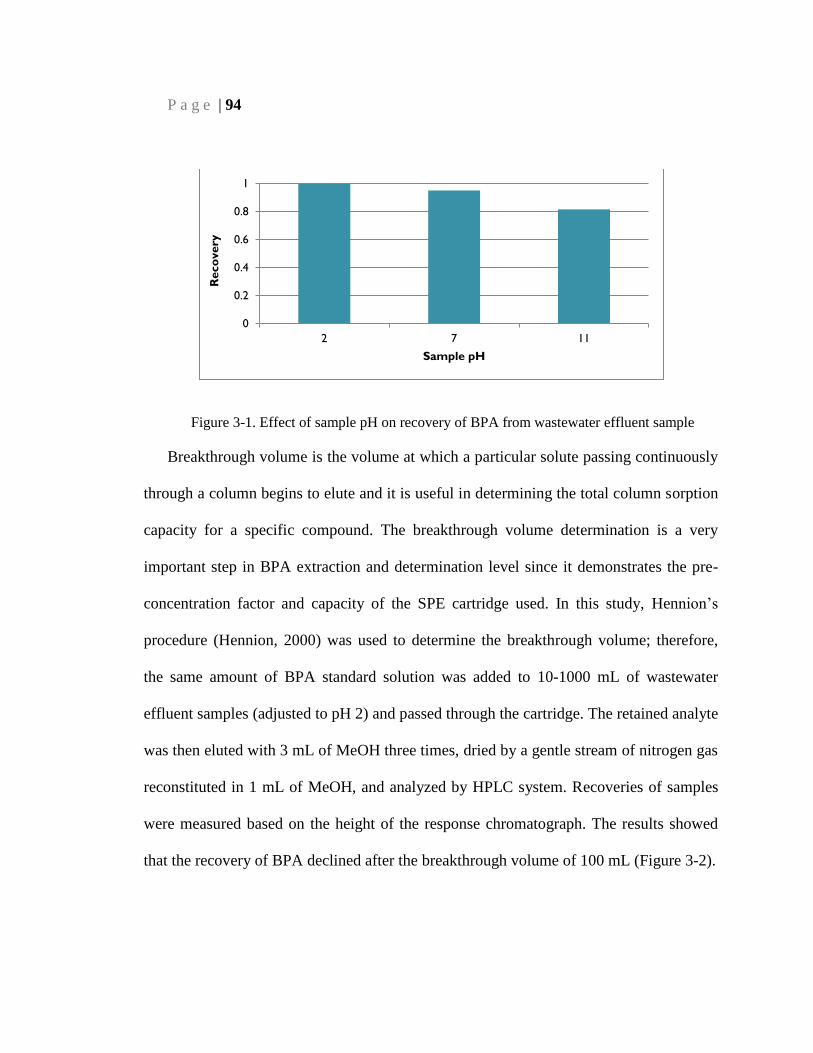
P a g e | 94
Figure 3-1. Effect of sample pH on recovery of BPA from wastewater effluent sample
Breakthrough volume is the volume at which a particular solute passing continuously
through a column begins to elute and it is useful in determining the total column sorption
capacity for a specific compound. The breakthrough volume determination is a very
important step in BPA extraction and determination level since it demonstrates the pre-
concentration factor and capacity of the SPE cartridge used. In this study, Hennion’s
procedure (Hennion, 2000) was used to determine the breakthrough volume; therefore,
the same amount of BPA standard solution was added to 10-1000 mL of wastewater
effluent samples (adjusted to pH 2) and passed through the cartridge. The retained analyte
was then eluted with 3 mL of MeOH three times, dried by a gentle stream of nitrogen gas
reconstituted in 1 mL of MeOH, and analyzed by HPLC system. Recoveries of samples
were measured based on the height of the response chromatograph. The results showed
that the recovery of BPA declined after the breakthrough volume of 100 mL (Figure 3-2).
0
0.2
0.4
0.6
0.8
1
2 7 11
Reco
very
Sample pH
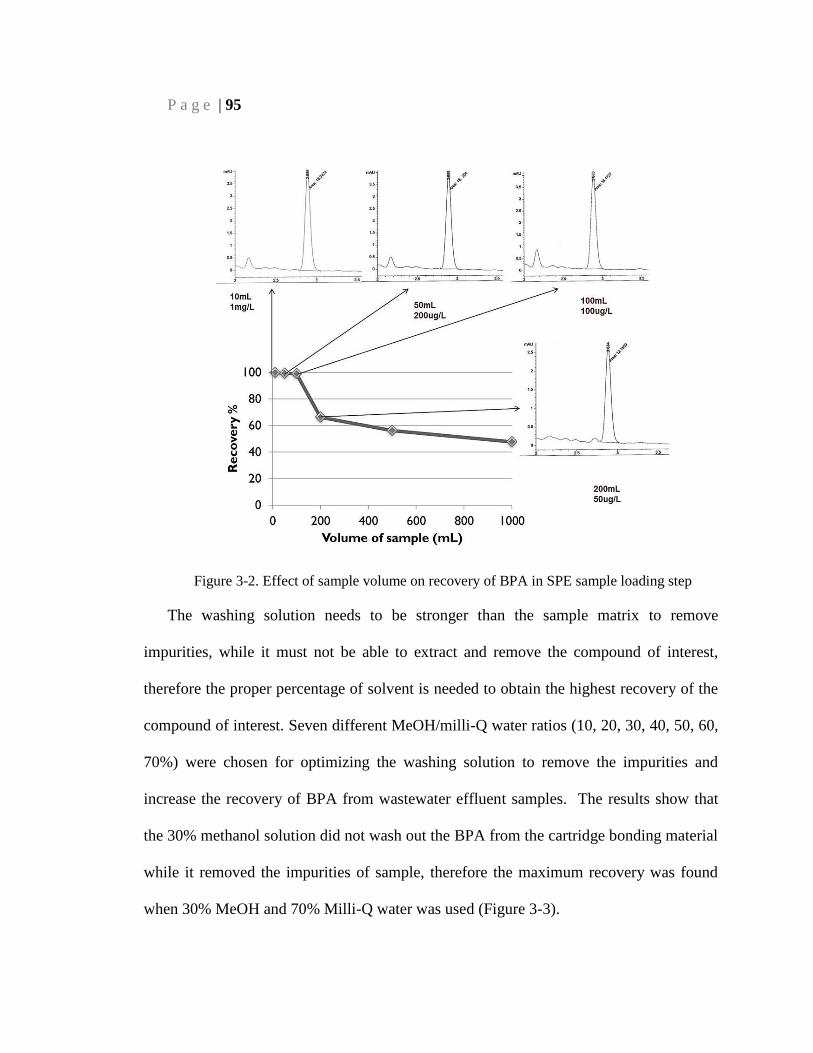
P a g e | 95
Figure 3-2. Effect of sample volume on recovery of BPA in SPE sample loading step
The washing solution needs to be stronger than the sample matrix to remove
impurities, while it must not be able to extract and remove the compound of interest,
therefore the proper percentage of solvent is needed to obtain the highest recovery of the
compound of interest. Seven different MeOH/milli-Q water ratios (10, 20, 30, 40, 50, 60,
70%) were chosen for optimizing the washing solution to remove the impurities and
increase the recovery of BPA from wastewater effluent samples. The results show that
the 30% methanol solution did not wash out the BPA from the cartridge bonding material
while it removed the impurities of sample, therefore the maximum recovery was found
when 30% MeOH and 70% Milli-Q water was used (Figure 3-3).

P a g e | 96
Figure 3-3. Effect of volume of MeOH in solvent solution on recovery of BPA in washing step
Analytes can be eluted using an organic solvent such as methanol, tetrahydrofuran,
isopropanol, acetonitrile, acetone or ethyl acetate. In this study, there common water
miscible organic solvents, MeOH, ACN and acetone were used in the SPE elution step,
and the recoveries of BPA using these solvents were studied. The recovery of BPA was
compared based on the result of HPLC analysis (Figure 3-4). MeOH and ACN were both
found suitable for elution based on their strong polarity characteristics; however, MeOH
was chosen due to its lower cost.
Figure 3-4. Effect of solvent selection on recovery of BPA in SPE elution step
0
20
40
60
80
100
0 10 20 30 40 50 60 70 80
Re
co
ve
ry %
volume of methanol %
0
20
40
60
80
100
Methanol Acetonitrile Acetone
Reco
very
%
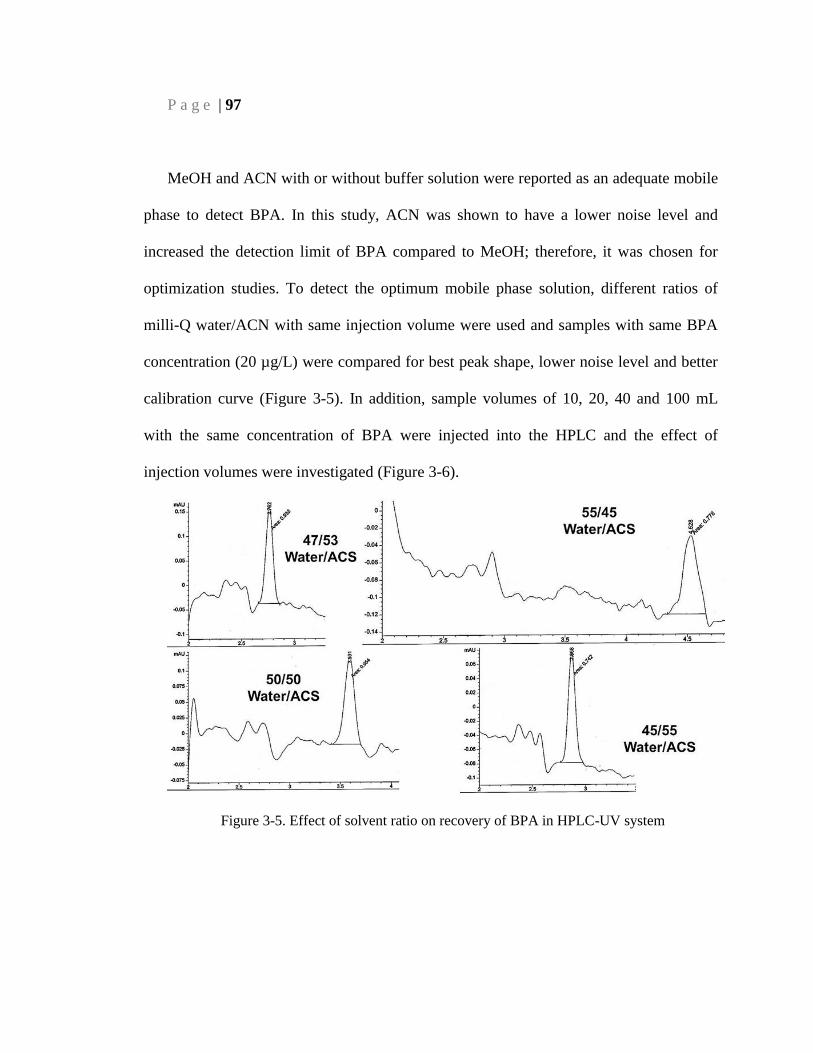
P a g e | 97
MeOH and ACN with or without buffer solution were reported as an adequate mobile
phase to detect BPA. In this study, ACN was shown to have a lower noise level and
increased the detection limit of BPA compared to MeOH; therefore, it was chosen for
optimization studies. To detect the optimum mobile phase solution, different ratios of
milli-Q water/ACN with same injection volume were used and samples with same BPA
concentration (20 µg/L) were compared for best peak shape, lower noise level and better
calibration curve (Figure 3-5). In addition, sample volumes of 10, 20, 40 and 100 mL
with the same concentration of BPA were injected into the HPLC and the effect of
injection volumes were investigated (Figure 3-6).
Figure 3-5. Effect of solvent ratio on recovery of BPA in HPLC-UV system

P a g e | 98
Figure 3-6. Effect of injection volume on recovery of BPA in HPLC-UV system
Table 3-1, summarizes the SPE and HPLC-UV optimized condition, which was found
as a part of this work to detect BPA in environmentally relevant concentration in liquid
samples. To study the efficiency of optimized SPE method for liquid samples, three
replicate wastewater effluent samples, spiked at two trace level concentrations of 100
ng/L and 1 µg/L, were cleaned-up and analyzed based on the described method.
Recovery rates were determined to be 93 ± 4.8 and 102 ± 3.3% for samples with 100
ng/L and 1 µg/L BPA concentrations, respectively.
The same extraction method was applied to extracted solid samples prior to HPLC
analysis for more clean-up and pre-concentration purposes with slightly modified steps.
The vacuum pressure sample loading step was replaced by the gravity pressure loading to

P a g e | 99
increase the retention time. In addition, to eliminate the sludge matrix effect and the
solvent front peak effect on the BPA response peak, the mobile phase solvent of HPLC
was replaced with less ACN content solvent (45%ACN/55%Milli-Q water) to decrease
the polarity of solution and increase the elution time of BPA. These changes were shown
in parenthesis in Table 3-1.
Table 3-1 SPE and analytical condition for liquid chromatography-ultraviolet analysis of BPA
SPE Conditions HPLC Conditions
Conditioning : 5 mL twice MeOH and
5 mL twice milli-Q water
Column: ZORBAX Eclipse Plus C18 ,
4.6X150 mm, 5 µm
Loading: 100 mL at 10 mL/min Injection Volume: 10 µL
Washing: 5 mL twice MeOH/Water
(30/70)
Mobile Phase: 55%ACN/45%Milli-Q water
(45%ACN/55%Milli-Q water for sludge
samples)
Dry with vacuum Flowrate: 1mL/min
Elution: 3 mL MeOH three times UV detection: 230 nm
Dry with nitrogen gas Elution time: 2.88 min (4.21 min for sludge
samples)
Dissolved in 1 mL MeOH Limit of Detection: 100 ng/L
3.3.2 Results of method comparison for extraction of BPA in sludge samples
The result of recovery study for BPA is presented in Table 3-2. Recoveries were
evaluated by analyzing three replicates and then applying the following equation:
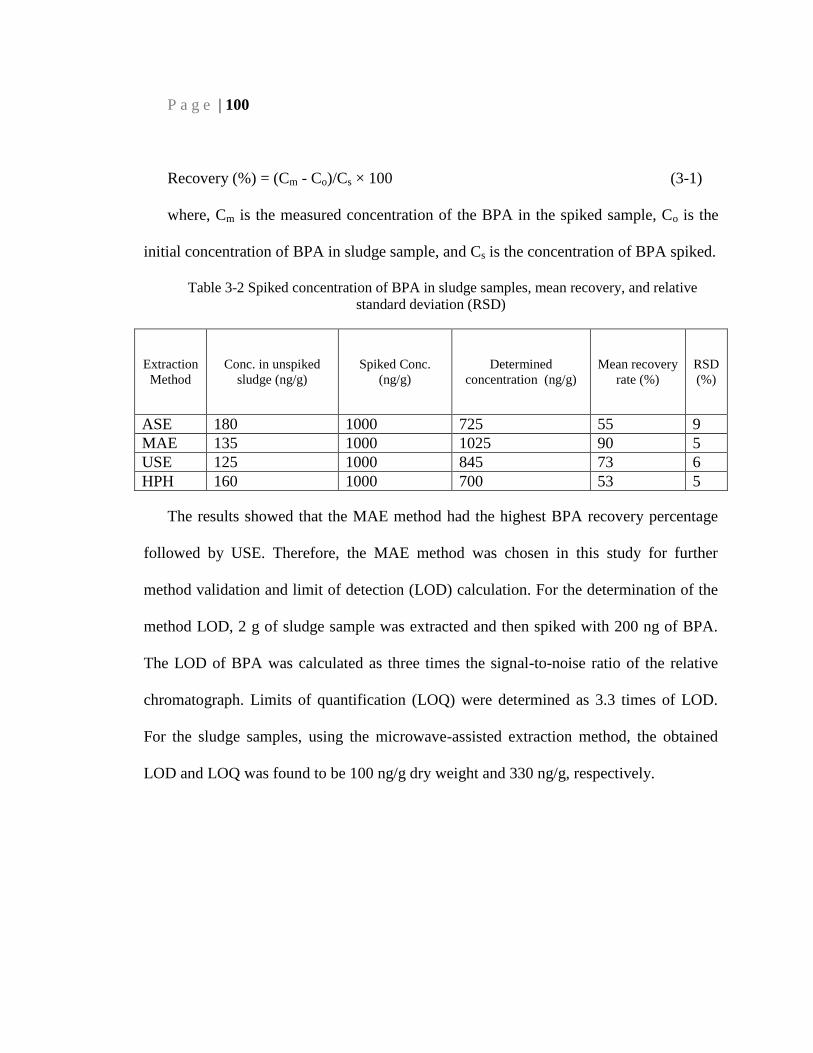
P a g e | 100
Recovery (%) = (Cm - Co)/Cs × 100 (3-1)
where, Cm is the measured concentration of the BPA in the spiked sample, Co is the
initial concentration of BPA in sludge sample, and Cs is the concentration of BPA spiked.
Table 3-2 Spiked concentration of BPA in sludge samples, mean recovery, and relative
standard deviation (RSD)
Extraction
Method
Conc. in unspiked
sludge (ng/g)
Spiked Conc.
(ng/g)
Determined
concentration (ng/g)
Mean recovery
rate (%)
RSD
(%)
ASE 180 1000 725 55 9
MAE 135 1000 1025 90 5
USE 125 1000 845 73 6
HPH 160 1000 700 53 5
The results showed that the MAE method had the highest BPA recovery percentage
followed by USE. Therefore, the MAE method was chosen in this study for further
method validation and limit of detection (LOD) calculation. For the determination of the
method LOD, 2 g of sludge sample was extracted and then spiked with 200 ng of BPA.
The LOD of BPA was calculated as three times the signal-to-noise ratio of the relative
chromatograph. Limits of quantification (LOQ) were determined as 3.3 times of LOD.
For the sludge samples, using the microwave-assisted extraction method, the obtained
LOD and LOQ was found to be 100 ng/g dry weight and 330 ng/g, respectively.

P a g e | 101
3.3.3 Validation of the method
In order to evaluate the trueness of the method, mass balance experiments were
conducted and concentrations of BPA in both liquid and solid phases were determined
based on the analytical procedure presented in this study (Figure 3-7).
Figure 3-7. Schismatic diagram of analytical procedure for analysis of BPA in liquid and
solid phases
The mass balance study was carried out with 100 mL of MLSS spiked samples. Three
100 mL aliquots of MLSS samples were collected from three porous pot reactors with
varied solid retention time (5, 10, and 15 days) and mean biomass concentration of 3145,

P a g e | 102
2763, and 1733 mg volatile suspended solids (VSS)/L, respectively. Samples were
homogenized, and deactivated using sodium azide solution (0.2% w/w). Deactivated
samples were mixed on the orbital shaker for 2 h at 200 rpm, and spiked with BPA
standard solution to the total concentration of 10 µg/L. Samples were then mixed for 12 h
to accumulate BPA in the biomass and subsequently were centrifuged for 30 min at
10000 rpm. The sludge cakes were carefully removed from the centrifuged tube and dried
at 60ºC for almost 12 h until constant weight was reached. The similar MLSS samples
were collected and VSS concentrations were measured for calculating biomass
concentration. The dried biomass was placed into microwave vessels and 5 g of sodium
sulfate anhydrous was added and mixed to form a free floating powder. Later 20 mL of
acetone/hexane (1:1, v/v) solvent solution was imported to each vessel which was then
put in the microwave for BPA extraction. The extraction procedure was carried out based
on the MAE method described previously. After microwave extraction, the samples were
evaporated with a gentle stream of nitrogen, re-dissolved into 10 mL of MeOH, and were
cleaned-up and pre-concentrated using the optimized SPE method. For liquid samples,
the supernatant of centrifuged MLSS was filtered and pH of samples was adjusted to 2
for further treatment by SPE cartridges. After the SPE process, all liquid and solid
samples were evaporated to dryness, re-dissolved in 1 mL of 45%ACN/55% Mili-Q
water, and filtered through 0.22 µm Milipore syringe filters before analyzing with HPLC.
A set of un-spiked samples was collected for determination of background BPA level
P a g e | 103
from each reactor and all recoveries were adjusted based on those results. Blank samples
using distilled water were prepared to evaluate any BPA loss during the mass balance
study for both liquid and solid samples. The results of blank sample analysis showed a
mean recovery of 106 ± 2 % for all blank samples. Precision was assessed by analyzing
repeatability and reproducibility of three replicates (n = 3) of MLSS samples from three
different reactors (k = 3). All samples were analyzed three times using HPLC-UV.
Precision and mean recovery data of the extraction and analytical procedure for MLSS
samples are given in Table 3-3. The results demonstrate satisfactory precision of the
analytical procedure for MLSS samples. RSDs were less than 8% for BPA in all samples,
indicating good precision of the developed analytical methods for both liquid and solid
samples. The recoveries ranged between 80-92% for all measured samples with an
average recovery of 86%. The results from the validation experiments were compared for
any significant differences using one-way analysis of variance (ANOVA) and post-
hoc analysis (Tukey) (IBM SPSS for Windows, 2010). Statistical analysis of the results
had shown that there is no significant difference between the recoveries of samples taken
from the same reactor, also from reactors with highest and lowest biomass concentration
(sludge retention times (SRTs) of 15 and 5 days); however, the recovery of samples from
a reactor with SRT of 10 days was slightly higher than the other two reactors (Table 3-4).
This was in agreement with Yi and Harper (2007) and could be due to a lower BPA

P a g e | 104
sorption partition coefficient in sludge samples at SRT of 10 days and higher recovery
level in liquid samples opposed to solid samples.
Table 3-3 Precision and mean recovery data of the extraction and analytical procedure to detect
BPA in solid and liquid samples
Spiked Level
(µg/L)
Precision RSD (%)
n=3, k=3
Recovery
(%)
Standard
deviation
10 7.2 86 4.3
Table 3-4 Result of one-way ANOVA and Tukey analysis for BPA recoveries from three porous
pot reactors (Multiple Comparisons)
(I)
Reactor.Number
(J)
Reactor.Number
Mean
Difference (I-J) Std. Error Sig.
95% Confidence
Interval
Lower
Bound
Upper
Bound
1 2 -0.06* 0.01 0.0 -0.1 -0.03
3 0.01 0.01 0.72 -0.02 0.04
2 1 0.06* 0.01 0.0 0.03 0.1
3 0.07* 0.01 0.0 0.04 0.11
3 1 -0.01 0.01 0.72 -0.04 0.02
2 -0.07* 0.01 0.0 -0.11 -0.04
* The mean difference is significant at the 0.05 level.
3.4 Conclusion
The combination of SPE and HPLC–UV analyses permitted a sensitive, reliable, and
rapid determination of low level BPA concentration in wastewater and sludge samples.
SPE parameters and HPLC conditions were optimized concerning sample pH, volume,
washing, elution solvents, HPLC injection volume and mobile phase. Four solid

P a g e | 105
extraction techniques were compared in this study for trace determination of BPA in
sludge samples and the results showed that the recovery of BPA in spiked samples ranged
from 60 to 90% for ASE, HPH, USE, and MAE extraction methods. The MAE was
proven to have the highest recovery and low solvent consumption. The optimized SPE
condition for LC-18 cartridges was also reported in this work and demonstrated high
recoveries for BPA detection in liquid samples. To validate the extraction and HPLC-UV
analysis of BPA at trace level concentration, a mass balance study was performed and the
results showed good recovery of BPA in all mass balance samples (average of 86%).
RSDs were found to be less than 8% for BPA in all samples, indicating the good
precision of the developed analytical methods for both liquid and solid samples. The
LOD for liquid and solid samples were found to be 100 ng/L and 100 ng/g, respectively.
Low-cost, fast, simple sample preparation, simplicity of HPLC-UV detection, as well as
good repeatability and reproducibility make this method a useful tool for the routine
analysis of BPA in wastewater and sludge samples.
3.5 Modification of Analytical Method for TCS and EE2
The sample preparation and SPE extraction procedure was modified to extract the
TCS and EE2 more efficiently with previously described method. Three modifications
were applied to sample preparation where oven dry process for sludge samples and pH
adjustment for liquid samples were eliminated, respectively to improve the recovery of
TCS. The SPE extraction procedure was also modified for microwaved extracted samples

P a g e | 106
by further diluting the 10 mL extracted MCs in MeOH into 100 mL of 10% MeOH/90%
MilliQ water solution prior to the loading step. After SPE process all liquid and solid
samples were evaporated to dryness, re-dissolved in 1 mL of 45% ACN/55% MilliQ
water, and filtered through 0.22 µm Milipore syringe filter before analyzing with high
pressure liquid chromatography (HPLC).
Determination of selected MCs was also modified to detect TCS, EE2 and BPA
simultaneously. ACN/water (45:55, v/v) as mobile phase was used as a binary gradient
with a flow rate of 1 mL min-1
at room temperature and a pressure of about 65 bars. Ten
µL of sample were injected and were eluted out of the column within 25 min. For
measurement, an elution program starts with 45%/55% ACN/water for 10 min, increased
to 55%/45% ACN/water from 10 min until 25 min, and increased to 100% ACN from 25
to 30 min. Table 3-5, summarizes the SPE and HPLC-UV optimized condition, which
was found to detect selected MCs in environmentally relevant concentration. Based on
the presented determination method, satisfactory precision with relative standard
deviations (RSDs) less than 10% for selected MCs was found. Recoveries of the method
for wastewater and sewage sludge were determined by analysing fortified samples of
each type of wastewater and sludge spiked in triplicate to 1 µg/L and 0.5 µg/g dry weight
(d.w.), respectively. The recoveries of BPA, TCS and EE2 in liquid samples were found
to be 106 ± 2, 95 ± 6 and 88 ± 5%, respectively. Also satisfactory recoveries were
obtained in solid samples (>75%), except for TCS, where recoveries of 55 ± 6% were
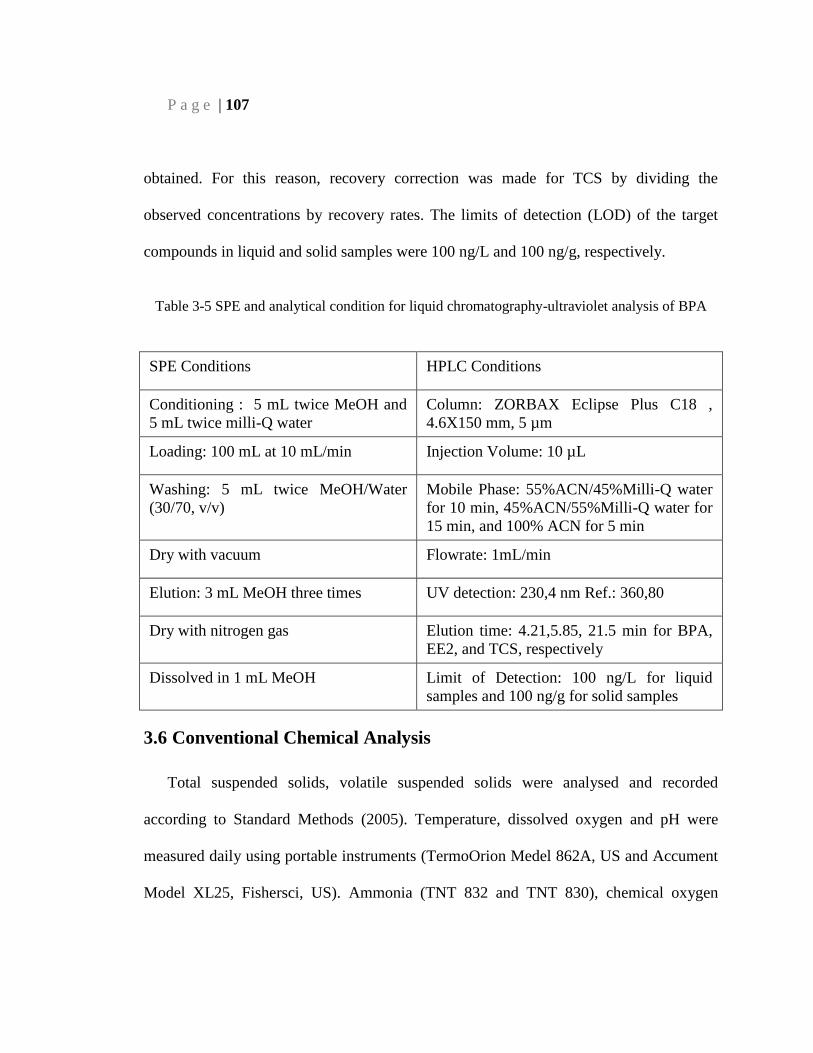
P a g e | 107
obtained. For this reason, recovery correction was made for TCS by dividing the
observed concentrations by recovery rates. The limits of detection (LOD) of the target
compounds in liquid and solid samples were 100 ng/L and 100 ng/g, respectively.
Table 3-5 SPE and analytical condition for liquid chromatography-ultraviolet analysis of BPA
SPE Conditions HPLC Conditions
Conditioning : 5 mL twice MeOH and
5 mL twice milli-Q water
Column: ZORBAX Eclipse Plus C18 ,
4.6X150 mm, 5 µm
Loading: 100 mL at 10 mL/min Injection Volume: 10 µL
Washing: 5 mL twice MeOH/Water
(30/70, v/v)
Mobile Phase: 55%ACN/45%Milli-Q water
for 10 min, 45%ACN/55%Milli-Q water for
15 min, and 100% ACN for 5 min
Dry with vacuum Flowrate: 1mL/min
Elution: 3 mL MeOH three times UV detection: 230,4 nm Ref.: 360,80
Dry with nitrogen gas Elution time: 4.21,5.85, 21.5 min for BPA,
EE2, and TCS, respectively
Dissolved in 1 mL MeOH Limit of Detection: 100 ng/L for liquid
samples and 100 ng/g for solid samples
3.6 Conventional Chemical Analysis
Total suspended solids, volatile suspended solids were analysed and recorded
according to Standard Methods (2005). Temperature, dissolved oxygen and pH were
measured daily using portable instruments (TermoOrion Medel 862A, US and Accument
Model XL25, Fishersci, US). Ammonia (TNT 832 and TNT 830), chemical oxygen

P a g e | 108
demand (TNT 821 and TNT 822), total phosphorus (TNT 843), total nitrogen, total
Kjeldahl nitrogen and nitrate (TNT 880) concentrations were measured using HACH
TNT vials and HACH DR 4000 UV-VIS Spectrophotometer. Total organic carbon (TOC)
was analysed by an Apollo 9000 TOC Analyzer (Teledyne Tekmar, USA).
3.7 References
Agüera, A.; Fernández-Alba, A. R.; Piedra, L.; Mézcua, M.; Gómez, M. J. 2003
Evaluation of triclosan and biphenylol in marine sediments and urban wastewaters
by pressurized liquid extraction and solid phase extraction followed by gas
chromatography mass spectrometry and liquid chromatography mass
spectrometry. Analytica Chimica Acta, 480, 193-205.
Alexander, H. C.; Dill, D. C.; Smith, L. W.; Guiney, P. D.; Dorn, P. 1988 Bisphenol a:
Acute aquatic toxicity. Environmental Toxicology and Chemistry, 7, 19-26.
Alexander, M. 1985 Biodegradation of organic chemicals. Environmental Science &
Technology, 19, 106-111.
Baugros, J.-B.; Giroud, B.; Dessalces, G.; Grenier-Loustalot, M.-F.; Cren-Olivé, C. 2008
Multiresidue analytical methods for the ultra-trace quantification of 33 priority
substances present in the list of REACH in real water samples. Analytica Chimica
Acta, 607, 191-203.
Benijts, T.; Dams, R.; Lambert, W.; De Leenheer, A. 2004 Countering matrix effects in
environmental liquid chromatography–electrospray ionization tandem mass
spectrometry water analysis for endocrine disrupting chemicals. Journal of
Chromatography A, 1029, 153-159.
Berg, U. T.; Nyholm, N. 1996 Biodegradability simulation studies in semicontinuous
activated sludge reactors with low (μg/L range) and standard (ppm range)
chemical concentrations. Chemosphere, 33, 711-735.
Carabias-Martínez, R.; Rodríguez-Gonzalo, E.; Revilla-Ruiz, P. 2004 Determination of
weakly acidic endocrine-disrupting compounds by liquid chromatography–mass
spectrometry with post-column base addition. Journal of Chromatography A,
1056, 131-138.
Chang, C.-M.; Chou, C.-C.; Lee, M.-R. 2005 Determining leaching of bisphenol A from
plastic containers by solid-phase microextraction and gas chromatography–mass
spectrometry. Analytica Chimica Acta, 539, 41-47.

P a g e | 109
Clara, M.; Strenn, B.; Saracevic, E.; Kreuzinger, N. 2004 Adsorption of bisphenol-A,
17β-estradiole and 17α-ethinylestradiole to sewage sludge. Chemosphere, 56,
843-851.
Cousins, I. T.; Staples, C. A.; Kleĉka, G. M.; Mackay, D. 2002 A Multimedia
Assessment of the Environmental Fate of Bisphenol A. Human and Ecological
Risk Assessment: An International Journal, 8, 1107-1135.
Diagne, R. G.; Foster, G. D.; Khan, S. U. 2002 Comparison of Soxhlet and Microwave-
Assisted Extractions for the Determination of Fenitrothion Residues in Beans.
Journal of Agricultural and Food Chemistry, 50, 3204-3207.
Ferrer, E.; Santoni, E.; Vittori, S.; Font, G.; Mañes, J.; Sagratini, G. 2011 Simultaneous
determination of bisphenol A, octylphenol, and nonylphenol by pressurised liquid
extraction and liquid chromatography–tandem mass spectrometry in powdered
milk and infant formulas. Food Chemistry, 126, 360-367.
Fujimoto, T.; Kubo, K.; Aou, S. 2006 Prenatal exposure to bisphenol A impairs sexual
differentiation of exploratory behavior and increases depression-like behavior in
rats. Brain Res, 1068, 49-55.
Gang, S.; Gang, Y.; Zhenxiao, C.; Zulin, Z. 2005 Development of an analytical method to
determine phenolic endocrine disrupting chemicals in sewage and sludge by
GC/MS. Chinese Science Bulletin, 50, 2681-2687.
Gatidou, G.; Thomaidis, N. S.; Stasinakis, A. S.; Lekkas, T. D. 2007 Simultaneous
determination of the endocrine disrupting compounds nonylphenol, nonylphenol
ethoxylates, triclosan and bisphenol A in wastewater and sewage sludge by gas
chromatography–mass spectrometry. Journal of Chromatography A, 1138, 32-41.
Gaulke, L. S.; Strand, S. E.; Kalhorn, T. F.; Stensel, H. D. 2008 17α-ethinylestradiol
Transformation via Abiotic Nitration in the Presence of Ammonia Oxidizing
Bacteria. Environmental Science & Technology, 42, 7622-7627.
González-Casado, A.; Navas, N.; del Olmo, M.; Vílchez, J. L. 1998 Determination of
Bisphenol A in Water by Micro Liquid—Liquid Extraction Followed by
Silylation and Gas Chromatography—Mass Spectrometry Analysis. Journal of
Chromatographic Science, 36, 565-570.
Guellil, A.; Block, J. C.; Urbain, V. 1998 Adaptation of the microbial adhesion to
hydrocarbon test (MATH) for measuring activated sludge hydrophobicity. Water
Science and Technology, 37, 359-362.
Hadjmohammadi, M.; Saeidi, I. 2010 Determination of bisphenol A in Iranian packaged
milk by solid-phase extraction and HPLC. Monatshefte für Chemie / Chemical
Monthly, 141, 501-506.
Hammarling, L.; Gustavsson, H.; Svensson, K.; Oskarsson, A. 2000 Migration of
bisphenol-A diglycidyl ether (BADGE) and its reaction products in canned foods.
Food Additives and Contaminants, 17, 937-943.
P a g e | 110
Helaleh, M. I. H.; Fujii, S.; Korenaga, T. 2001 Column silylation method for determining
endocrine disruptors from environmental water samples by solid phase micro-
extraction. Talanta, 54, 1039-1047.
Hennion, M.-C. 2000 Chapter 1 Sample handling strategies for the analysis of organic
compounds in environmental water samples, in: BarcelÓ, D. (Ed.), Techniques
and Instrumentation in Analytical Chemistry. Elsevier, pp. 3-71.
Hernando, M. D.; Mezcua, M.; Gómez, M. J.; Malato, O.; Agüera, A.; Fernández-Alba,
A. R. 2004 Comparative study of analytical methods involving gas
chromatography–mass spectrometry after derivatization and gas chromatography–
tandem mass spectrometry for the determination of selected endocrine disrupting
compounds in wastewaters. Journal of Chromatography A, 1047, 129-135.
Huang, M.; Jiang, G.; Cai, Y. 2005 Electrochemical preparation of composite polyaniline
coating and its application in the determination of bisphenol A, 4-n-nonylphenol,
4-tert-octylphenol using direct solid phase microextraction coupled with high
performance liquid chromatography. Journal of Separation Science, 28, 2218-
2224.
Jeannot, R.; Sabik, H.; Sauvard, E.; Dagnac, T.; Dohrendorf, K. 2002 Determination of
endocrine-disrupting compounds in environmental samples using gas and liquid
chromatography with mass spectrometry. Journal of Chromatography A, 974,
143-159.
Krishnan, A. V.; Stathis, P.; Permuth, S. F.; Tokes, L.; Feldman, D. 1993 Bisphenol-A:
an estrogenic substance is released from polycarbonate flasks during autoclaving.
Endocrinology, 132, 2279-86.
Kuch, H. M.; Ballschmiter, K. 2001 Determination of endocrine-disrupting phenolic
compounds and estrogens in surface and drinking water by HRGC-(NCI)-MS in
the picogram per liter range. Environmental Science and Technology, 35, 3201-
3206.
Laganà, A.; Bacaloni, A.; De Leva, I.; Faberi, A.; Fago, G.; Marino, A. 2004 Analytical
methodologies for determining the occurrence of endocrine disrupting chemicals
in sewage treatment plants and natural waters. Analytica Chimica Acta, 501, 79-
88.
Le Blanc, A.; Albrecht, C.; Bonn, T.; Fechner, P.; Proll, G.; Pröll, F.; Carlquist, M.;
Gauglitz, G. 2009 A novel analytical tool for quantification of estrogenicity in
river water based on fluorescence labelled estrogen receptor α. Analytical and
Bioanalytical Chemistry, 395, 1769-1776.
Lee, H.-B.; Peart, T. E.; Svoboda, M. L. 2005 Determination of endocrine-disrupting
phenols, acidic pharmaceuticals, and personal-care products in sewage by solid-
phase extraction and gas chromatography–mass spectrometry. Journal of
Chromatography A, 1094, 122-129.

P a g e | 111
Lee, H. B.; Peart, T. E. 2000a Bisphenol a contamination in Canadian municipal and
industrial wastewater and sludge samples. Water Quality Research Journal of
Canada, 35, 283-298.
Lee, H. B.; Peart, T. E. 2000b Determination of bisphenol A in sewage effluent and
sludge by solid-phase and supercritical fluid extraction and gas
chromatography/mass spectrometry. Journal of AOAC International, 83, 290-297.
Liu, R.; Zhou, J. L.; Wilding, A. 2004 Microwave-assisted extraction followed by gas
chromatography–mass spectrometry for the determination of endocrine disrupting
chemicals in river sediments. Journal of Chromatography A, 1038, 19-26.
Meesters, R. J. W.; Schröder, H. F. 2002 Simultaneous determination of 4-nonylphenol
and bisphenol A in sewage sludge. Analytical Chemistry, 74, 3566-3574.
Mohapatra, D. P.; Brar, S. K.; Tyagi, R. D.; Surampalli, R. Y. 2010 Physico-chemical
pre-treatment and biotransformation of wastewater and wastewater Sludge – Fate
of bisphenol A. Chemosphere, 78, 923-941.
Mohapatra, D. P.; Brar, S. K.; Tyagi, R. D.; Surampalli, R. Y. 2011 Occurrence of
bisphenol A in wastewater and wastewater sludge of CUQ treatment plant.
Journal of Xenobiotics, 1.
Motoyama, A.; Suzuki, A.; Shirota, O.; Namba, R. 1999 Direct determination of
bisphenol a and nonylphenol in river water by column-switching semi-
microcolumn liquid chromatography/electrospray mass spectrometry. Rapid
Communications in Mass Spectrometry, 13, 2204-2208.
Naassner, M.; Mergler, M.; Wolf, K.; Schuphan, I. 2002 Determination of the
xenoestrogens 4-nonylphenol and bisphenol A by high-performance liquid
chromatography and fluorescence detection after derivatisation with dansyl
chloride. Journal of Chromatography A, 945, 133-138.
Pedersen, S. N.; Lindholst, C. 1999 Quantification of the xenoestrogens 4-tert.-
octylphenol and bisphenol A in water and in fish tissue based on microwave
assisted extraction, solid-phase extraction and liquid chromatography–mass
spectrometry. Journal of Chromatography A, 864, 17-24.
Petrovic; Mira; Barcel; Dami. 2001 Determination of Phenolic Xenoestrogens in
Environmental Samples by Liquid Chromatography with Mass Spectrometric
Detection. Journal of AOAC International, 84, 1074-1085.
Petrovic, M.; Eljarrat, E.; López de Alda, M. J.; Barceló, D. 2002 Recent advances in the
mass spectrometric analysis related to endocrine disrupting compounds in aquatic
environmental samples. Journal of Chromatography A, 974, 23-51.
Prasanth, G. K.; Divya, L. M.; Sadasivan, C. 2010 Bisphenol-A can bind to human
glucocorticoid receptor as an agonist: an in silico study. Journal of applied
toxicology : JAT, 30, 769-74.

P a g e | 112
Pryor, S. W.; Hay, A. G.; Walker, L. P. 2002 Nonylphenol in Anaerobically Digested
Sewage Sludge from New York State. Environmental Science & Technology, 36,
3678-3682.
Rubin, B. S.; Soto, A. M. 2009 Bisphenol A: Perinatal exposure and body weight.
Molecular and cellular endocrinology, 304, 55-62.
Sajiki, J. 2001 Decomposition of bisphenol-A (BPA) by radical oxygen. Environment
International, 27, 315-320.
Seyhi, B.; Drogui, P.; Buelna, G.; Blais, J. F. 2011 Modeling of sorption of bisphenol A
in sludge obtained from a membrane bioreactor process. Chemical Engineering
Journal, 172, 61-67.
Standard methods for the examination of water and wastewater : 21st edition
Washington, DC: American Public Health Association, 2005.
Urase, T.; Kikuta, T. 2005 Separate estimation of adsorption and degradation of
pharmaceutical substances and estrogens in the activated sludge process. Water
Research, 39, 1289-1300.
Varelis, P.; Balafas, D. 2000 Preparation of 4,4 -(1-[2H6]methylethylidene)bis-[2,3,5,6-
2H4]phenol and its application to the measurement of bisphenol A in beverages
by stable isotope dilution mass spectrometry. Journal of Chromatography A, 883,
163-170.
Xu, K.; Harper Jr, W. F.; Zhao, D. 2008 17α-Ethinylestradiol sorption to activated sludge
biomass: Thermodynamic properties and reaction mechanisms. Water Research,
42, 3146-3152.
Yi, T.; Harper Jr, W. F. 2007 The effect of biomass characteristics on the partitioning and
sorption hysteresis of -ethinylestradiol. Water Research, 41, 1543-1553.
Zhao, J.; Li, Y.; Zhang, C.; Zeng, Q.; Zhou, Q. 2008 Sorption and degradation of
bisphenol A by aerobic activated sludge. Journal of Hazardous Materials, 155,
305-311.
P a g e | 113
Chapter 4: Sorption-desorption and biosorption of MCs to
AS
Summary1:
To better understand the fate of microconstituents (MCs) in an activated sludge (AS)
system, sorption, biosorption, and desorption studies were investigated at µg/L range for
17α-ethinylestradiol (EE2), bisphenol-A (BPA), and triclosan (TCS). Batch experiments
with activated and deactivated sludge originating from continuous flow porous-pot
reactors operating at solids retention times (SRTs) of 5, 10, and 15 days were conducted
in order to investigate the sorption kinetics and distinguish physicochemical sorption and
biosorption. The effect of SRT and the biomass concentration on sorption kinetics was
also studied. Selected MCs showed high sorption affinity to the non-active biomass
during the first 30 min of the experiment, which was gradually reduced until equilibrium
was reached. Desorption results showed two distinct stages, a very rapid desorption
within 20 min followed by a slow desorption stage. Biosorption study indicated that the
soluble concentrations of target compounds decreased rapidly for selected MCs similar to
the sorption study; however, the soluble and solid phase concentrations continued to
decrease slowly during the length of the experiment which indicates the possible
biodegradation of these compounds in both phases. Finally, mathematical models were
1 This chapter has been published as:
Banihashemi B, Droste RL. Sorption-desorption and biosorption of bisphenol A, triclosan, and
17alpha-ethinylestradiol to sewage sludge. Sci Total Environ 2014; 487: 813-21.

P a g e | 114
applied to describe the sorption mechanism and Freundlich sorption isotherms with
values of 1/n close to 1 were found to best fit the results which demonstrate that all tested
concentrations result on the linear part of the Freundlich isotherm. Calculation of the
Freundlich constant, KF and distribution coefficient, Kd exhibited greater tendency of
EE2 and TCS for sorption, compared to BPA. The results of this study indicated that the
SRT had a clear effect on the sorption kinetics where the highest sorption rate constant
was achieved for a SRT of 10 days for all three target substances. This could be due to
change of the morphology of the biomass from reactors operating at different SRTs.

P a g e | 115
4.1 Introduction:
The occurrence and fate of toxic, biopersistent MCs in water sources and their
removal in wastewater treatment plants (WWTPs) as major point sources are a growing
concern since some of these substances remain at detectable levels in WWTP effluents
which have been implicated as a major source to surface waters (Anderson, 2005). The
environment in a WWTP biotreatment process, which is the most common form of
wastewater treatment, is significantly different from the natural environment. The
environment in a biotreatment reactor is rich in organics with a high concentration of
suspended solids (SS) which includes a significant concentration of enriched microbes.
Some MCs can be utilized as primary substrates but others are utilized as secondary
substrates in conjunction with a primary substrate, i.e., co-metabolism. The partitioning
of MCs between solid and liquid phases is also significant due to the large concentration
of biomass and associated solids. Furthermore, stripping of volatile compounds is
enhanced due to the intense aeration required in AS processes and the favourable
environment for stripping in other processes such as a trickling filter. Accumulation of
MCs on solids wasted from a biotreatment operation or losses of them through
volatilization are not real treatments but nonetheless they are significant phenomena that
affect the fate of MCs in biotreatment or throughout a WWTP.
Sorption processes to sludge are of special interest because the excess sludge
extraction represents an important removal pathway and sorption is often the first stage in

P a g e | 116
biological degradation. The present article focuses on the sorption-desorption and
biosorption of BPA, EE2 and TCS to AS.
EE2 is a synthetic hormone that has attracted considerable attention in the literature
due to its contribution to endocrine disrupting activity in WWTP effluent (Jeffries et al.,
2010; Vajda et al., 2008). EE2 could be discharged to sewer from human sources in either
gluconorides or sulphates conjugated forms (Koh et al., 2008); however the conjugate
steroids could later be transformed into free (unconjugated) forms by bacterial
populations present in WWTP that are capable of producing-glucuronidase and
arylsulfatase enzymes (Gomes et al., 2009). EE2 adsorption onto AS particles in
municipal WWTP might be an important removal pathway in WWTP due to its nonpolar
behaviour and hydrophobic properties (Andersen et al., 2005; Cirja et al., 2007; Zhou et
al., 2010). WWTPs influent concentrations of EE2 range from below detection to 70 ng/L
(Atkinson et al., 2012; Clara et al., 2005b; Vethaak et al., 2005). Biodegradation has been
reported as the most substantial estrogen removal method in AS wastewater treatment
(Muller et al., 2008), however, studies showed that presence of EE2 in WWTP effluent at
concentration levels of 6 ng/L might cause estrogenic effects on fathead minnow
populations (Kidd et al., 2007; Parrott and Blunt, 2005).
TCS (2,4,40-trichloro-20-hydroxydiphenyl ether; Irgasan) is a broad spectrum
antibacterial agent which can be found in many personal care products such as hand
disinfecting soaps, medical skin creams, dental products, deodorants, toothpastes (Dann
P a g e | 117
and Hontela, 2011). The use of personal care products containing TCS and the disposal of
these products caused TCS contamination in wastewater, streams, seawater, sediments,
fish, blood, urine and human milk (Allmyr et al., 2006; Kinney et al., 2008; Queckenberg
et al., 2010). TCS can hinder both gram negative and gram positive bacteria by inhibiting
the NADH-dependent enoyl-[acyl-carrier protein] reductase, a key enzyme responsible
for fatty acid synthesis (Sivaraman et al., 2004). It was found that TCS could also be
harmful to AS bacteria (Neumegen et al., 2005). An aid to the development of cross-
resistance to antibiotics (Drury et al., 2013) and the formation of chlorodioxins and other
toxic metabolites during TCS photodegradation are two of many concerns about the
widespread contamination of TCS in the environment (Aranami and Readman, 2007;
Braoudaki and Hilton, 2004; Buth et al., 2009; Dann and Hontela, 2011). Furthermore,
studies even suggested that TCS is potentially a weak androgen and exerts both
estrogenic and androgenic effects on human breast cancer cells (Gee et al., 2008). The
TCS concentrations in WWTP influent and effluent were studied by many researchers
and ranged from 0.01-16 µg/L in influent and 0.01-2.7 µg/L in effluent, suggesting
removal efficiencies of 58–97% for trickling filter plants and 95–98% for activated
sludge plants (Bester, 2003; Lishman et al., 2006; Nakada et al., 2010; Thomas and
Foster, 2005). The high octanol-water partition coefficient of TCS log Kow 4.5-4.8
(Lopez-Avila and Hites, 1980; Ying et al., 2007), could lead to 30-50% TCS removal due

P a g e | 118
to sorption onto biosolids in WWTPs (Bester, 2003; Chalew and Halden, 2009; Heidler
and Halden, 2007; Singer et al., 2002).
BPA is a building compound for the manufacturing of plastics, epoxy resins, and
polycarbonate resins. BPA is an endocrine disrupter (Fujimoto et al., 2006; vom Saal and
Myers, 2008) and might be as effective as estradiol in triggering some receptor responses
(Stahlhut et al., 2009). BPA might also act as an androgen receptor antagonist (Urbatzka
et al., 2007). Kd values for BPA are reported in various studies in the literature and
ranged from 0.07 L/g TSS up to 1 L/g TSS (Clara et al., 2004). The Henry’s law constant
for BPA is 1 × 10¹⁰
atm.m3/mol (Staples et al., 1998b) and volatility of BPA can thereby
be considered negligible in WWTPs. Lee et al. (2004) studied the BPA concentrations in
Canadian WWTPs and observed BPA in all 30 sewage samples with concentration
ranging from 0.16 to 28.1 µg/L (median 0.75 µg/L) in the influents and from 0.01 to 17.3
µg/L (median 0.13 µg/L) in the effluent. The observed influent-to-effluent reduction in
the five municipal wastewater treatment plants in Canada showed 70-76% for BPA
indicating that it is not completely eliminated during wastewater treatment (Fernandez et
al., 2007; Mohapatra et al., 2011). BPA was also found in municipal sewage sludge, in
the range of 0.104–0.312 µg/g in Canada (Mohapatra et al., 2011), 1.86–0.02 µg/g in
Greek (Samaras et al., 2013; Stasinakis et al., 2008), and 0.4 µg/g in Spain (Vega-
Morales et al., 2010).

P a g e | 119
A majority of published models for the environmental fate of MCs assume that
equilibrium is reached instantaneously between sorbed and dissolved MCs. Some studies
proposed a general model with sorption-desorption dynamic processes (Cowan et al.,
1993; Lai et al., 2000; Lindblom et al., 2009) where different stages have been suggested
in this process: the first stage or rapid mixing, the second stage which is decrease in
sorption due to gradual exhaustion of binding site and desorption of MCs into the
aqueous phase as a last stage.
Many studies dealing with emerging contaminates focus only on adsorption and
biosorption of MCs to active and non-active AS by measuring the MCs concentration in
the liquid phase (Clara et al., 2004; Feng et al., 2010; Seyhi et al., 2011), only in the last
few years researchers started to study the change of MCs concentration in the solid phase
at very low concentrations (Nie et al., 2009; Stevens-Garmon et al., 2011; Zhao et al.,
2008). Furthermore, although the solid concentration in AS systems, as an active binding
site to MCs, showed evident effect on sorption isotherm in the literature (Barret et al.,
2010b; Zhao et al., 2008), however in these studies solid concentrations in batch reactors
were mostly prepared by diluting the MLSS to desired concentrations and the effect of
biomass characteristics such as morphology of the biomass, the floc size, shape and
density of AS at different SRTs were mainly ignored. Therefore in this study the
sorption-desorption and biosorption of BPA, TCS, and EE2 onto active AS or inactivated
sludge obtained from lab-scale porous-pot AS reactors were investigated in parallel by
P a g e | 120
measuring the concentration of MCs in both liquid and solid phases in order to
distinguish physicochemical sorption-desorption and biosorption processes.
4.2 Material and Methods:
4.2.1 Chemical and reagents
Methanol (MeOH), hexane, acetonitrile (ACN), dichloromethane, and acetone used
for cleaning and extraction purposes, were purchased from VWR International, LLC
(Canada) and were all of HPLC analytical grade. EE2, BPA, and TCS (HPLC grade,
>98%) were purchased from Sigma-Aldrich, Canada. Table 4-1, shows the physico-
chemical properties of selected MCs in this study. Stock solutions of BPA, TCS, and EE2
were prepared in MilliQ water/ACN (55/45, v/v) at 1000 mg/L and kept at 4◦C. The
working solutions were prepared daily by diluting the stock solution and were used for
calibration and spiking experiments. MilliQ water was prepared in the laboratory using a
MilliQ/ Millipore system with Super-C carbon, Ion-Ex, and Orgonex-Q cartridges.
Supelclean LC-18 (3 mL, 500 mg) cartridges used for extraction and clean-up samples
were supplied by Sigma-Aldrich (Oakville, ON, Canada). The Zorbax Eclipse plus C18
chromatography column (4.6 mm× 150 mm, 5 µm) was purchased from
Chromatographic specialties Inc. (ON, Canada). All other chemical used in this study
were supplied by Fisher Scientific (ON, Canada) and were of the highest purity
commercially available.

P a g e | 121
Table 4-1 Physico-chemical characteristics of selected MCs
Compounds MW Molecular
formula
Solubility
(mg/L)
H
(atm.m3.mol
-1)
pKa log Kow
BPA 228.29 C15H16O2 120 1.0×10⁻¹¹
9.86-10 3.18-3.7a
EE2 296.41 C20H24O2 4.8-11.3 7.9×10⁻¹²
10.5-10.7 3.6-4.15b
TCS 289.54 C12H7Cl3O2 10 1.5×10⁻⁷
7.9 4.5-4.8c
a (Borrirukwisitsak et al., 2012; Robinson et al., 2009)
b (Robinson et al., 2009)
c (Lopez-Avila and Hites, 1980; Ying et al., 2007)
4.2.2 Activated sludge, synthetic wastewater and inactivation treatment
The thickened waste AS (TWAS) inoculum was obtained from the Robert O. Pickard
Environmental Center (ROPEC) wastewater treatment facility in Ottawa. The TWAS was
diluted to reach the total SS (TSS) and volatile SS (VSS) concentrations of 3100 and
2300 mg/L, respectively. Then, the diluted TWAS was incubated in three continuous
flow 3 L porous pot reactors (Figure 4-1), fed with synthetic wastewater without any
added MCs with typical hydraulic retention time (HRT) of 6 hours found in AS systems.
These bioreactors are approved by United States Environmental Protection Agency
(USEPA) for simulation test of AS system (EPA 712-C-08-004, October 2008). The SRT
of each reactor was decreased gradually to reach the SRT of 5, 10, and 15 d by removing
adequate mixed liquor VSS (MLVSS) daily from each reactor. The chemical oxygen
demand (COD) and MLVSS in these reactors were then monitored to reach a stabilized
condition. The synthetic wastewater (Table 4-2) is composed of distilled water,
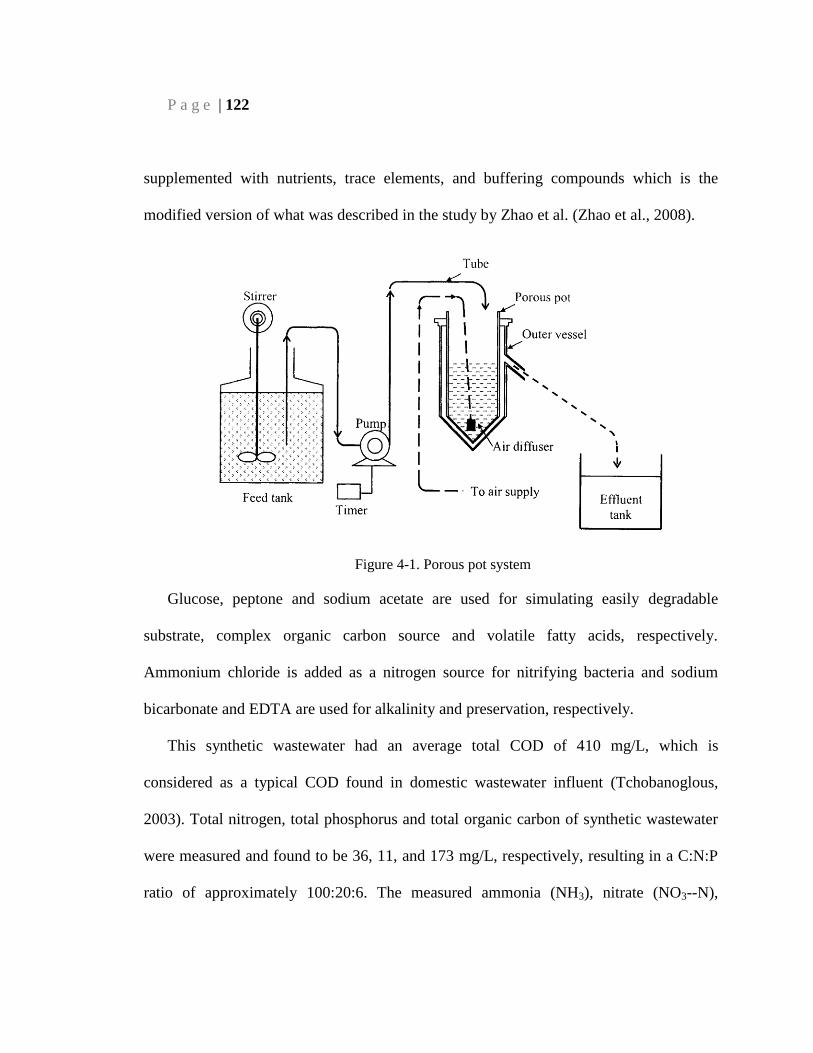
P a g e | 122
supplemented with nutrients, trace elements, and buffering compounds which is the
modified version of what was described in the study by Zhao et al. (Zhao et al., 2008).
Figure 4-1. Porous pot system
Glucose, peptone and sodium acetate are used for simulating easily degradable
substrate, complex organic carbon source and volatile fatty acids, respectively.
Ammonium chloride is added as a nitrogen source for nitrifying bacteria and sodium
bicarbonate and EDTA are used for alkalinity and preservation, respectively.
This synthetic wastewater had an average total COD of 410 mg/L, which is
considered as a typical COD found in domestic wastewater influent (Tchobanoglous,
2003). Total nitrogen, total phosphorus and total organic carbon of synthetic wastewater
were measured and found to be 36, 11, and 173 mg/L, respectively, resulting in a C:N:P
ratio of approximately 100:20:6. The measured ammonia (NH3), nitrate (NO3--N),
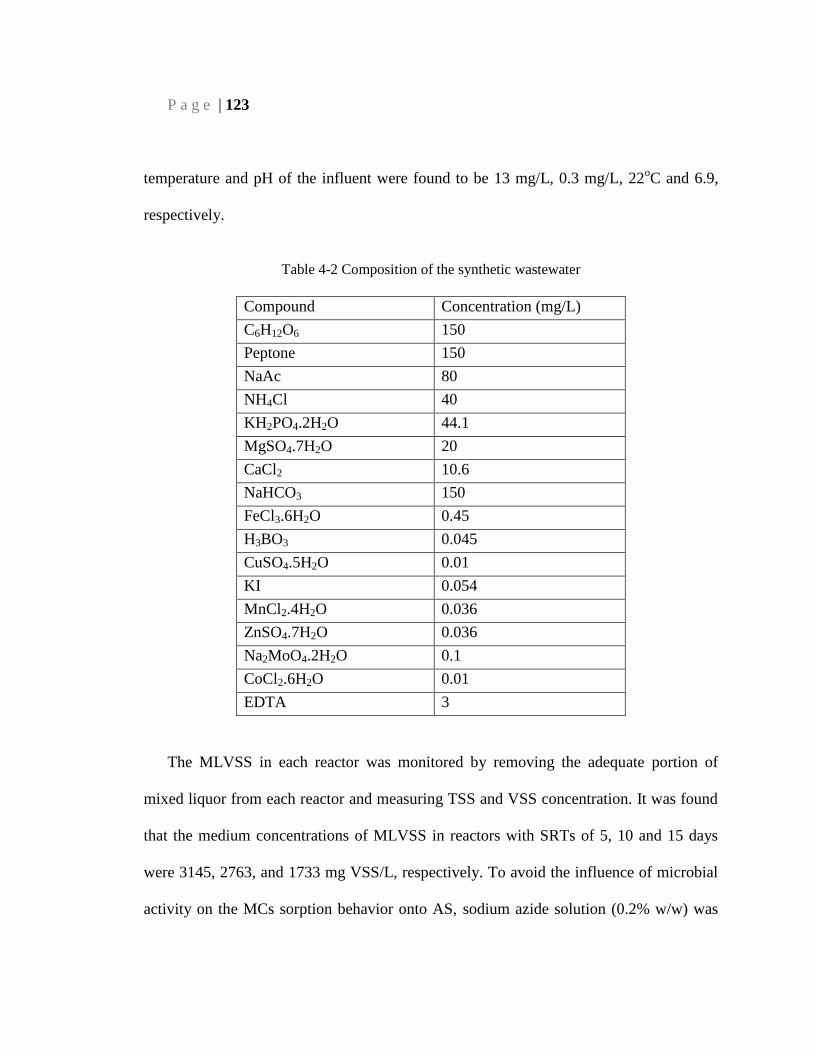
P a g e | 123
temperature and pH of the influent were found to be 13 mg/L, 0.3 mg/L, 22oC and 6.9,
respectively.
Table 4-2 Composition of the synthetic wastewater
Compound Concentration (mg/L)
C6H12O6 150
Peptone 150
NaAc 80
NH4Cl 40
KH2PO4.2H2O 44.1
MgSO4.7H2O 20
CaCl2 10.6
NaHCO3 150
FeCl3.6H2O 0.45
H3BO3 0.045
CuSO4.5H2O 0.01
KI 0.054
MnCl2.4H2O 0.036
ZnSO4.7H2O 0.036
Na2MoO4.2H2O 0.1
CoCl2.6H2O 0.01
EDTA 3
The MLVSS in each reactor was monitored by removing the adequate portion of
mixed liquor from each reactor and measuring TSS and VSS concentration. It was found
that the medium concentrations of MLVSS in reactors with SRTs of 5, 10 and 15 days
were 3145, 2763, and 1733 mg VSS/L, respectively. To avoid the influence of microbial
activity on the MCs sorption behavior onto AS, sodium azide solution (0.2% w/w) was
P a g e | 124
used to prevent biodegradation by deactivating cytochrome oxidase. This concentration
has been shown to inhibit the biodegradation process without causing any cell lysis, and
also it does not cause change to sludge hydrophobicity (Guellil et al., 1998; Xu et al.,
2008; Yi and Harper, 2007).
4.2.3 Sorption experiments with activated and inactivated sludge
Sorption batch experiments were performed to investigate MCs sorption to inactive
AS obtained from 3 porous pot reactors. Two batch reactors from each porous pot reactor
(2 L Erlenmeyer flasks) were operated for the sorption equilibrium study. Batch reactors
were filled with inactive AS obtained from porous pot reactors with SRTs of 5, 10, and
15 days, respectively and half of the batch reactors were spiked with selected MCs to the
final concentration of 10 µg/L, whereas the other half were not spiked to determine the
background concentration of selected MCs in obtained inactive AS. One control reactor
was also filled with distilled water and same MCs concentration to quantify any potential
abiotic losses. The batch reactors were wrapped in aluminum foil to prevent possible
photodegradation and put on a shaker at 125 rpm for 24 h. Duplicate homogenized
samples (100 mL) were taken at increasing time intervals at 0.25, 0.5, 1, 2, 4, 6, 10, 18,
and 24 h for the determination of dissolved and particulate MCs and calculation of
equilibrium time. To determine sorption isotherms six 1 L Erlenmeyer flasks (two flasks
for inactive AS taken from each porous-pot reactor) were filled with inactive AS and
were exposed to the selected MCs at concentrations of 5, 10, 20, 50, 100 and 200 µg/L.
P a g e | 125
Batch reactors were put on a shaker, while samples were taken at equilibrium and MCs
concentration were measured in the dissolved and solid phases. The same procedures
were followed for the biosorption study with active and active AS and the results of two
studies were compared. The mixed liquor SS (MLSS) and SRT effects were also
examined using same concentration range of each target compound and MLSS
concentrations of 1430, 2750, and 3540 mg/L from each reactor.
4.2.4 Desorption experiments
Desorption kinetic studies were also conducted by placing settled and washed MC
saturated inactive AS at 10 µg/L in a batch reactor with synthetic wastewater which
contains no MCs and measuring the concentration change in the liquid and solids phases
over time. Mass balances were made for all sorption and desorption studies to ensure the
integrity of the experiments.
Two batch reactors from each porous pot reactors were filled with inactive AS and
half were spiked with selected MCs to the final concentration of 10 µg/L. The batch
reactors were put on a shaker at 125 rpm to reach the sorption equilibrium time and MCs
saturated inactive AS were centrifuged at 2000 rpm for 10 min and washed with DI
water. The settled and washed MC saturated inactive AS was then added to 1 L
Erlenmeyer flasks and were filled with synthetic wastewater containing no MCs. The
batch reactors were put on a shaker at 125 rpm for 24 h and the homogenized samples
(100 mL) were taken at increasing time intervals. To determine desorption isotherms, six
P a g e | 126
1 L Erlenmeyer flasks were filled with MC saturated inactive AS at concentration of 5-
200 µg/L and centrifuged at 2000 rpm for 10 min, The synthetic wastewater with no MCs
was added to each Erlenmeyer flask and shaken for 12 h in the rotary shaker to re-
equilibrate the system. Samples were taken at equilibrium time and the concentrations in
the liquid phase over the range of 5-200 µg/L MC’s concentrations were measured.
4.2.5 Sample preparation and analytical methods
Sample preparation and clean-up were performed for MC samples in both liquid and
solid phases. One hundred mL of MLVSS samples were collected from batch reactors
and centrifuged at 10000 rpm for 30 min, the supernatant liquid was then filtered through
a pre-ashed glass fiber filter (GF/C, pore size 0.45 µm), acidified with HCL solution to a
pH of 2 and stored at 4ºC until further SPE treatment. For solid samples, sludge cake was
carefully removed from the centrifuged tube and dried at 60ºC for almost 12 h until a
constant weight was reached. Five g of sodium sulfate anhydrous were added to the dried
biomass and mixed to form a free floating powder before adding to microwave vessels.
The microwave-assisted extraction procedure was carried out with a Mars 5® (MW
Accelerated Reaction System; CEM Corporation) MW oven based on the method
described in a previously published study (Banihashemi and Droste, 2013). After the
microwave extraction, the samples were evaporated with a gentle stream of nitrogen, re-
dissolved into 10 mL of MeOH, and were cleaned up and pre-concentrated using SPE. To
cleanup and pre-concentrate the liquid samples, SPE method using commercial SPE
P a g e | 127
cartridge (Supelclean LC-18) fitted on a vacuum apparatus (CHROMABOND, Fishersci,
ON, Canada) were used to isolate MCs from prepared samples. The SPE extraction
procedure was also a modified protocol published previously by the authors
(Banihashemi and Droste, 2013). After SPE process all liquid and solid samples were
evaporated to dryness, re-dissolved in 1 mL of 45% ACN/55% MilliQ water, and filtered
through 0.22 µm Milipore syringe filter before analyzing with high pressure liquid
chromatography (HPLC).
Determination of selected MCs was performed according to the procedures described
by Banihashemi and Droste (2013) with some modification. The concentrations of target
MCs were measured using a HPLC (Hewlett-Packard, HP 1100) equipped with
ZORBAX Eclipse Plus C18 (4.6×150 mm, 5 µm) analytical column. The system
consisted of the degasser (G1322A), a Quaternary pump (G1311A), an ALS auto sampler
(G1313A), a Colcomp column oven (G1314A) and Multi Wavelength UV-VIS detector
(G1314A). ACN/water (45:55, v/v) as mobile phase was used as a binary gradient with a
flow rate of 1 mL min-1
at room temperature and a pressure of about 65 bars. Ten µL of
sample were injected and were eluted out of the column within 25 min. For measurement,
an elution program starts with 45%/55% ACN/water for 10 min, increased to 55%/45%
ACN/water from 10 min until 25 min, and increased to 100% ACN from 25 to 30 min.
Table 4-3, summarizes the SPE and HPLC-UV optimized condition, which was found to
detect selected MCs in environmentally relevant concentration. Based on the presented
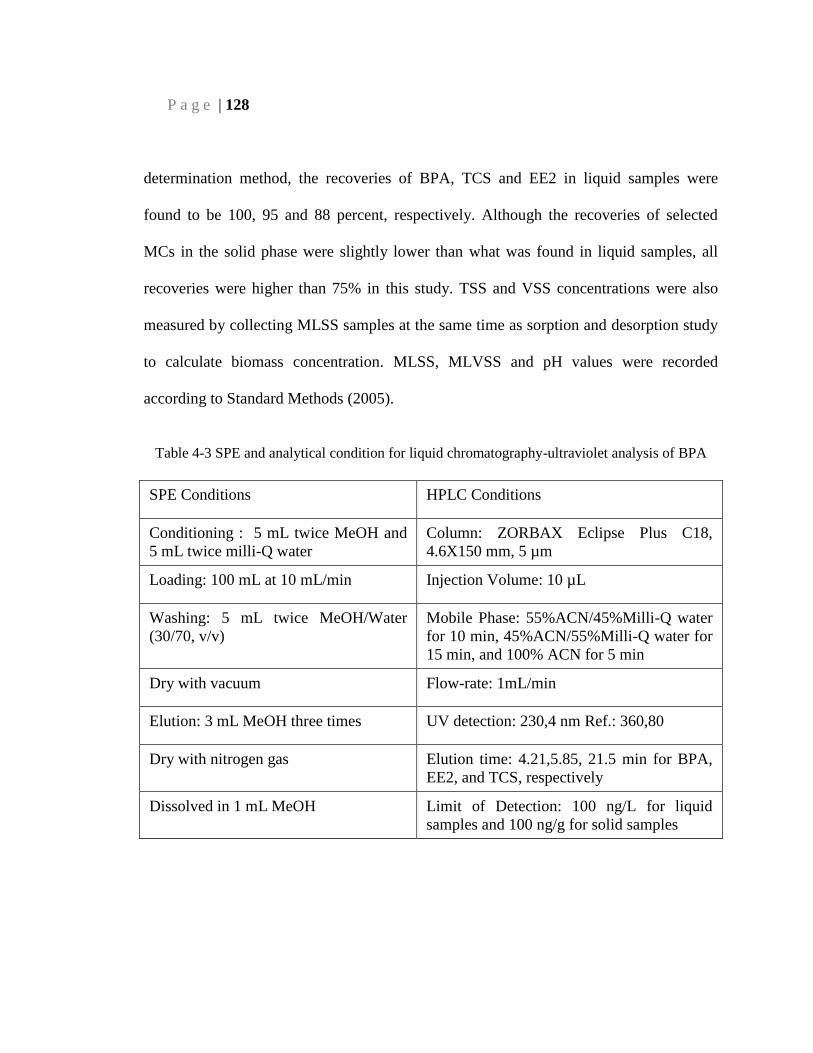
P a g e | 128
determination method, the recoveries of BPA, TCS and EE2 in liquid samples were
found to be 100, 95 and 88 percent, respectively. Although the recoveries of selected
MCs in the solid phase were slightly lower than what was found in liquid samples, all
recoveries were higher than 75% in this study. TSS and VSS concentrations were also
measured by collecting MLSS samples at the same time as sorption and desorption study
to calculate biomass concentration. MLSS, MLVSS and pH values were recorded
according to Standard Methods (2005).
Table 4-3 SPE and analytical condition for liquid chromatography-ultraviolet analysis of BPA
SPE Conditions HPLC Conditions
Conditioning : 5 mL twice MeOH and
5 mL twice milli-Q water
Column: ZORBAX Eclipse Plus C18,
4.6X150 mm, 5 µm
Loading: 100 mL at 10 mL/min Injection Volume: 10 µL
Washing: 5 mL twice MeOH/Water
(30/70, v/v)
Mobile Phase: 55%ACN/45%Milli-Q water
for 10 min, 45%ACN/55%Milli-Q water for
15 min, and 100% ACN for 5 min
Dry with vacuum Flow-rate: 1mL/min
Elution: 3 mL MeOH three times UV detection: 230,4 nm Ref.: 360,80
Dry with nitrogen gas Elution time: 4.21,5.85, 21.5 min for BPA,
EE2, and TCS, respectively
Dissolved in 1 mL MeOH Limit of Detection: 100 ng/L for liquid
samples and 100 ng/g for solid samples
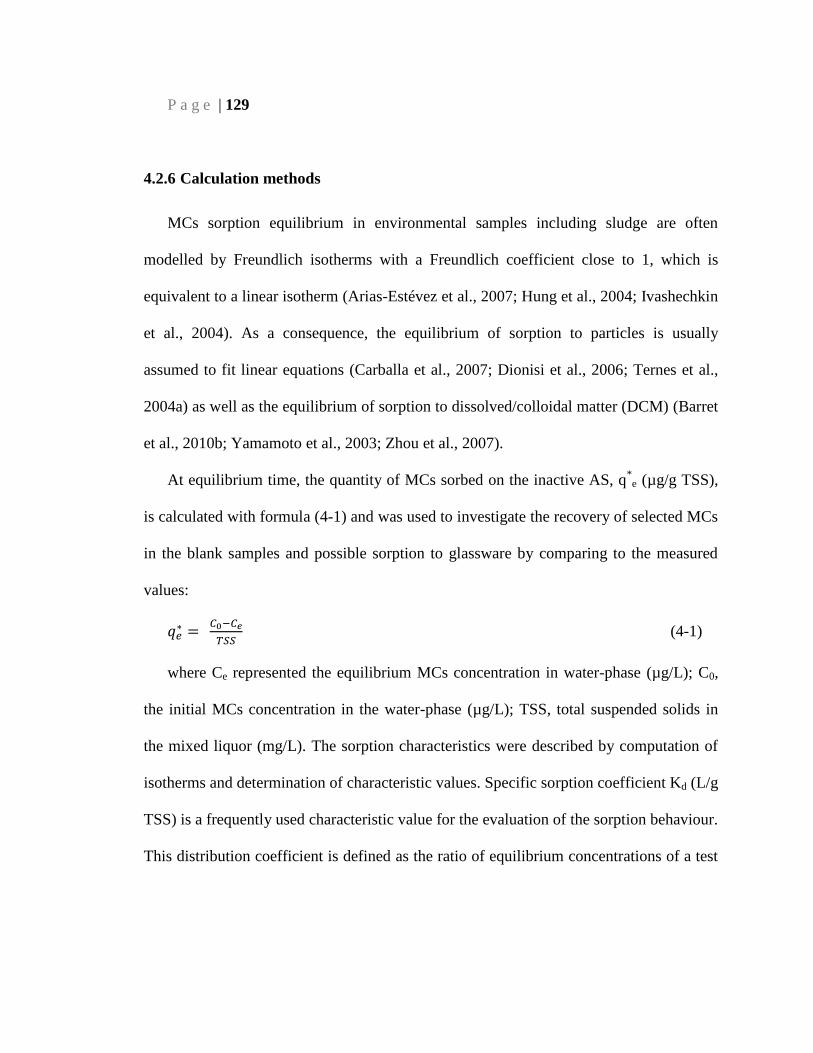
P a g e | 129
4.2.6 Calculation methods
MCs sorption equilibrium in environmental samples including sludge are often
modelled by Freundlich isotherms with a Freundlich coefficient close to 1, which is
equivalent to a linear isotherm (Arias-Estévez et al., 2007; Hung et al., 2004; Ivashechkin
et al., 2004). As a consequence, the equilibrium of sorption to particles is usually
assumed to fit linear equations (Carballa et al., 2007; Dionisi et al., 2006; Ternes et al.,
2004a) as well as the equilibrium of sorption to dissolved/colloidal matter (DCM) (Barret
et al., 2010b; Yamamoto et al., 2003; Zhou et al., 2007).
At equilibrium time, the quantity of MCs sorbed on the inactive AS, q*e (µg/g TSS),
is calculated with formula (4-1) and was used to investigate the recovery of selected MCs
in the blank samples and possible sorption to glassware by comparing to the measured
values:
(4-1)
where Ce represented the equilibrium MCs concentration in water-phase (µg/L); C0,
the initial MCs concentration in the water-phase (µg/L); TSS, total suspended solids in
the mixed liquor (mg/L). The sorption characteristics were described by computation of
isotherms and determination of characteristic values. Specific sorption coefficient Kd (L/g
TSS) is a frequently used characteristic value for the evaluation of the sorption behaviour.
This distribution coefficient is defined as the ratio of equilibrium concentrations of a test
P a g e | 130
substance in a two phase system consisting of an adsorbent and an aqueous phase and can
be calculated with formula (4-2):
(4-2)
In this study the equilibrium sorption isotherms of MCs on the biomass using Linear,
Freundlich and Langmuir models were studied. These isotherms describe measured MCs
concentration in solid phase (qe) as a function of the equilibrium sorbate concentration in
the bulk solution (Ce). The Freundlich isotherm is described by Eq. (4-3).
(4-3)
Reorganization of Eq. (4-3), leads to the linearized form of the Freundlich isotherm
[Eq. (4-4)]:
(4-4)
where Kf (µg(1-1/n)
L1/n
/g) is the Freundlich isotherm constant related to the sorption
capacity and n shows the intensity of sorption. The Freundlich equation assumes that
there are multiple types of sorption sites acting in parallel; therefore, different sorption
free energy can be exhibited from each site. Huang and Sedlak (2001) also showed that
the Freundlich equation is valid for heterogeneous sorption on a surface of sludge
containing several sites.
Additionally, the sorption isotherm according to Langmuir was determined (Eq. 4-5):
(4-5)
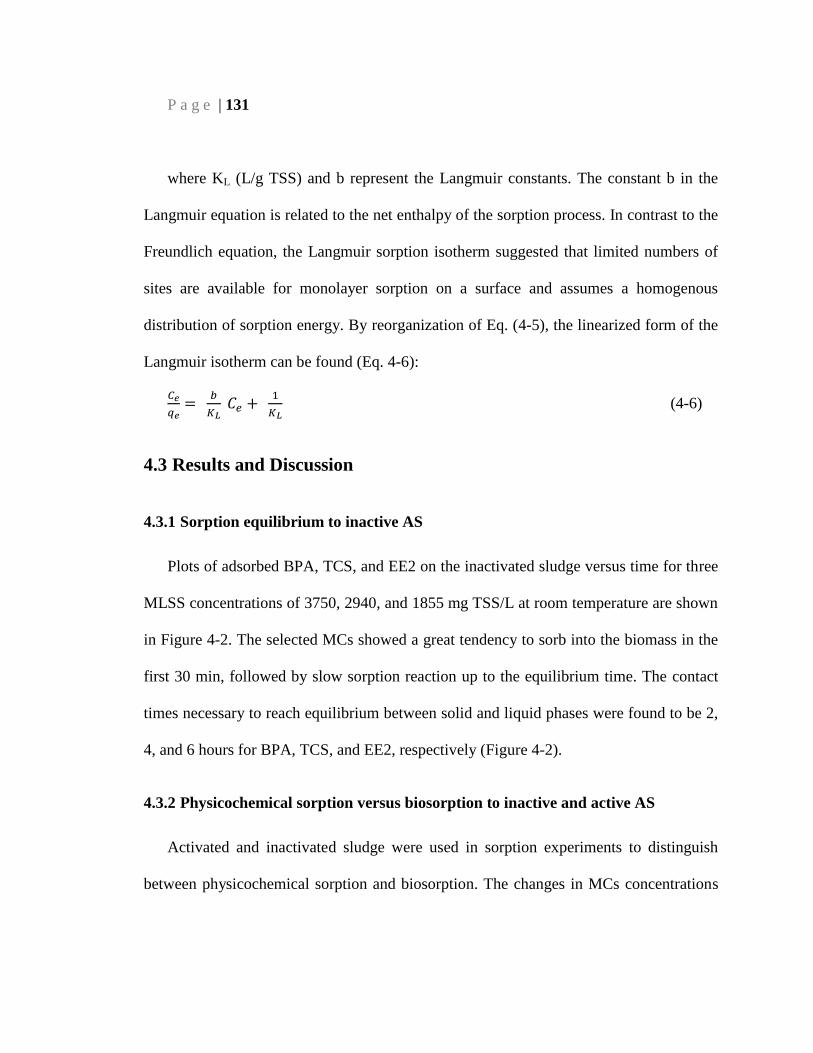
P a g e | 131
where KL (L/g TSS) and b represent the Langmuir constants. The constant b in the
Langmuir equation is related to the net enthalpy of the sorption process. In contrast to the
Freundlich equation, the Langmuir sorption isotherm suggested that limited numbers of
sites are available for monolayer sorption on a surface and assumes a homogenous
distribution of sorption energy. By reorganization of Eq. (4-5), the linearized form of the
Langmuir isotherm can be found (Eq. 4-6):
(4-6)
4.3 Results and Discussion
4.3.1 Sorption equilibrium to inactive AS
Plots of adsorbed BPA, TCS, and EE2 on the inactivated sludge versus time for three
MLSS concentrations of 3750, 2940, and 1855 mg TSS/L at room temperature are shown
in Figure 4-2. The selected MCs showed a great tendency to sorb into the biomass in the
first 30 min, followed by slow sorption reaction up to the equilibrium time. The contact
times necessary to reach equilibrium between solid and liquid phases were found to be 2,
4, and 6 hours for BPA, TCS, and EE2, respectively (Figure 4-2).
4.3.2 Physicochemical sorption versus biosorption to inactive and active AS
Activated and inactivated sludge were used in sorption experiments to distinguish
between physicochemical sorption and biosorption. The changes in MCs concentrations
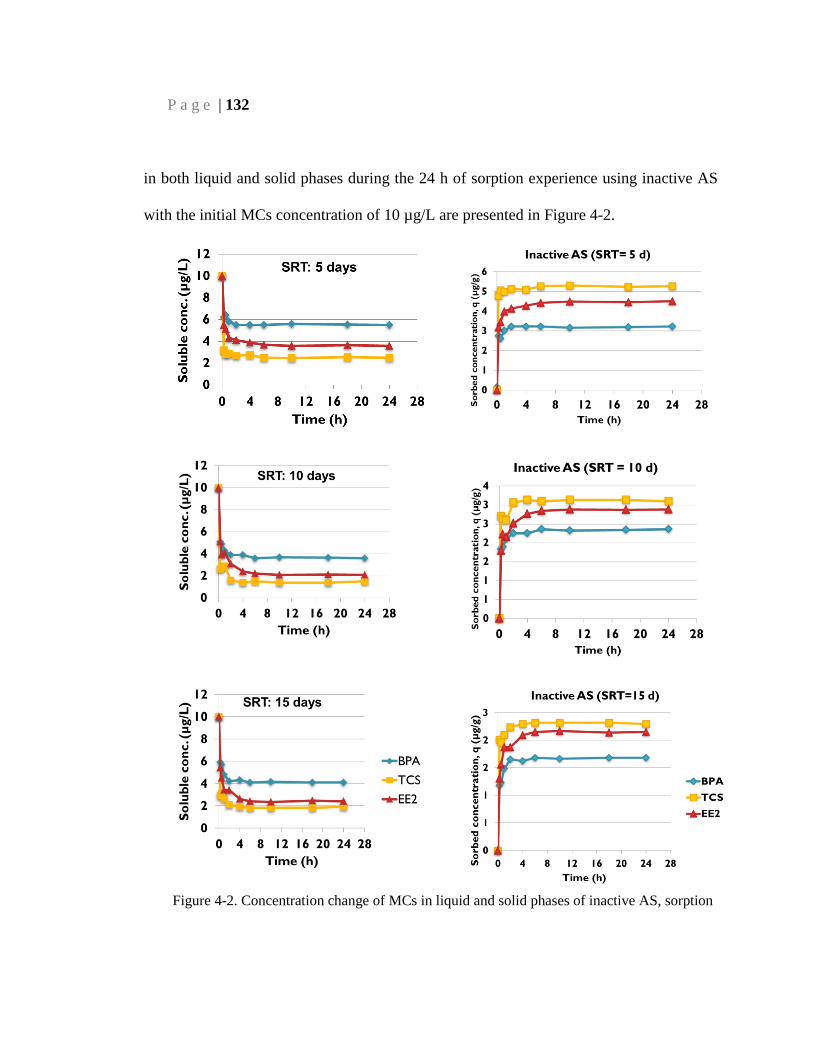
P a g e | 132
in both liquid and solid phases during the 24 h of sorption experience using inactive AS
with the initial MCs concentration of 10 µg/L are presented in Figure 4-2.
Figure 4-2. Concentration change of MCs in liquid and solid phases of inactive AS, sorption

P a g e | 133
The result of this study suggested that equilibrium is reached between sorbed and
dissolved MCs in all samples within a few hours. It was found that the sorption to the
inactive AS consist of two stages, a rapid sorption to the biomass followed by a slight
decrease in dissolved concentration until it reached equilibrium which is in agreement
with the result reported in the literature for BPA sorption to sludge at relatively higher
initial concentration (Seyhi et al., 2011).
At equilibrium, TCS showed greater tendency to sorb into the biomass followed by
EE2 and BPA. These results could be explained by the higher octanol-water partition
coefficient of TCS (log Kow = 4-4.8), compared to BPA (log Kow = 3.1-3.7), and EE2 (log
Kow = 3.6-4.6). The MCs concentrations in liquid and solid phases were used to close the
mass balance and investigate any abiotic losses during this study and less than 5% loss to
the glassware was found during these experiments. The result of biosorption study with
active AS (Figure 4-3) showed a similar result to inactive AS; however, the MCs
concentration in the liquid phase continued to decrease after the equilibrium time found
in the previous study. Similar results are reported in the literature dealing with higher
concentration of these compounds (Chen et al., 2008; Clara et al., 2004; Feng et al., 2010;
Seyhi et al., 2011) which would suggest physico-chemical sorption of selected MCs onto
the sludge in the first 30 min of the experiment (rapid decrease stage) and biosorption or
biodegradation of these compounds onto or by active AS (slow decrease).
P a g e | 134
To investigate the possible biodegradability of sorbed MCs by AS, changes to the
solid phase concentration of selected MCs were investigated in biosorption study with
active AS (Figure 4-3).
Figure 4-3. Concentration change of MCs in liquid and solid phases of active AS, biosorption
P a g e | 135
It was found that the concentrations of sorbed MCs, except for TCS decreased even
after the equilibrium time was reached due to possible degradation of sorbed MCs which
is in agreement with the BPA sorption study on the sludge from the membrane bioreactor
(Seyhi et al., 2011).
The different behaviour of sorbed TCS could be explained by inhibition effect of this
compound on AS. Many researchers dealing with MCs assume that the degradation only
happens in the liquid phase (Lindblom et al., 2009; Plosz et al., 2010; Pomiès et al.,
2013). Although there are some studied that suggests dissolved and sorbed MCs could be
biodegraded with separate or same rates (Byrns, 2001; Cowan et al., 1993; Lee et al.,
1998; Urase and Kikuta, 2005); but these authors considered biodegradation of the sorbed
MCs based only on successful calibration of a mathematical model, or indirect
experimental observations, and these assumptions are poorly justified experimentally;
therefore, more studies need to be done to closely investigate the possible biodegradation
or biotransformation of sorbed MCs into AS by carefully monitoring the 14
C –radio-
labeled MCs and their radioactivity within the biomass, 14
C-CO2, and the substrate
(Haudin et al., 2013; Jr et al., 1989; Sørensen et al., 2006).
The results of sorption and biosorption studies using different biomass obtained from
reactors with SRTs of 5, 10, and 15 days were used to investigate the effect of SRTs on
sorption characteristics of selected MCs (Figures 4-2 and 4-3). In the sorption study with
inactive AS (Figure 4-2), the biomass that was obtained from the reactor with lowest SRT

P a g e | 136
(5 d) had the lowest sorption potential, where 45 75, and 64% of BPA, TCS, and EE2
were removed from the liquid phase at equilibrium state, respectively. On the other hand
the inactive AS obtained from reactors with higher SRTs, showed higher sorption
potential, where 59, 82 and 76% of BPA, TCS, and EE2 for AS with SRT of 15 d and 64,
84, and 79% of BPA, TCS, and EE2 for AS with SRT of 10 d were removed from the
liquid phase at equilibrium state, respectively. Although the higher SRT indicates more
biomass concentration in the reactor and possibly more available sorption sites for MCs,
these findings suggested that not only the biomass concentration is an important factor in
sorption process, but also the biomass characteristics such as morphology of the biomass
and the floc size, shape and density could play an important role in MCs sorption into the
AS.
By comparing the change of MCs concentration in the liquid phase with the active
biomass and different SRTs (Figure 4-3), it was observed that SRT had a clear effect on
the possible biodegradation of sorbed MCs due to the density and the diversity of the
biomass in higher SRT systems.
4.3.3 Sorption and desorption kinetics of MCs onto inactive AS
The sorption and desorption isotherms are illustrated in Figures 4-2 and 4-4.
Desorption results showed two distinct stages, a very rapid desorption within 20 min
followed by a slow desorption stage for all three compounds. It was observed that among
the selected MCs, BPA had the highest desorption potential and 20-30% of sorbed BPA

P a g e | 137
was dissolved back into newly introduced wastewater within 4 h depending on type and
age of the biomass used. The desorption potentials for TCS and EE2 were similar for all
biomass samples for which 10-15% of sorbed EE2 and TCS were dissolved back into
newly introduced wastewater within 2 h.
Figure 4-4. Concentration change of MCs in liquid phase of inactive AS, spiked at 10 µg/L,
desorption study
The sorption data were subjected to regression analysis using linear, Freundlich and
Langmuir models (Table 4-4). The results indicated that both linear and Freundlich
models fitted well with the experimental data with the correlation coefficients (R2)
greater than 0.98. In the Freundlich models the Freundlich exponent 1/n was close to 1
ranging from 0.867-1.031 for all three compounds. Low correlation coefficients for
Langmuir model for selected MCs indicated that the assumption of homogenous
P a g e | 138
distribution of sorption energy in the model was not valid; therefore, no site limitation for
monolayer sorption on a surface could be assumed.
Two semi-empirical expressions for partition coefficient (Kd) as a function of
octanol–water partition coefficient (Kow) were also used to calculate Kd (Table 4-5), It
was found that the estimation of Kd value using Kow for MCs with the correlation of
Mattermuller et al. (1980) was within 0.2 log units for Kd prediction. It must be cautioned
that there is a significant influence of matrix characteristics and the experimental
conditions imposed on Kd. Different coefficient and n values were also reported for
selected MCs in the literature (Barret et al., 2010a; Chen et al., 2008; Clara et al., 2004)
indicating the need of experimental determination of Kd for each obtained biomass.
By comparing the results presented in Table 4-4, it was found that the SRT plays an
important role in sorption kinetic determination; however, the biomass from the reactor
with SRT of 10 d, showed the highest Kd values (L/g TSS) of 0.48, 2.26, and 1.37 for
BPA, TCS, and EE2, respectively. This was in agreement with Yi and Harper (2007) and
Hyland et al. (2012) and could be due to different morphology and biomass characteristic
at SRT of 10 days.

P a g e | 139
Table 4-4 Summery of sorption kinetic coefficients evaluated by different kinetic models
BPA
SRT (d) Freundlich model Linear model Langmuir model
Kf (µg
(1-1/n)L
1/n/g) 1/n R
2 Kd (L/g) R
2 KL (L/g) R
2
15 0.435 0.918 0.989 0.351 0.987 0.663 0.086
10 0.48 1.025 0.984 0.477 0.980 0.504 0.001
5 0.468 0.867 0.997 0.319 0.991 0.515 0.345
TCS
SRT (d) Freundlich model Linear model Langmuir model
Kf (µg
(1-1/n)L
1/n/g) 1/n R
2 Kd (L/g) R
2 KL(L/g) R
2
15 1.035 1.1 0.995 1.591 0.990 1.082 0.703
10 2.092 1.027 0.998 2.266 0.998 2.119 0.259
5 2.019 1.005 0.995 2.018 0.993 2.033 0.003
EE2
SRT (d) Freundlich model Linear model Langmuir model
Kf (µg
(1-1/n)L
1/n/g) 1/n R
2 Kd (L/g) R
2 KL(L/g) R
2
15 0.802 1.031 0.995 0.901 0.990 0.829 0.065
10 1.389 0.98 0.997 1.368 0.993 1.332 0.00
5 1.386 0.975 0.995 1.161 0.994 1.357 0.248
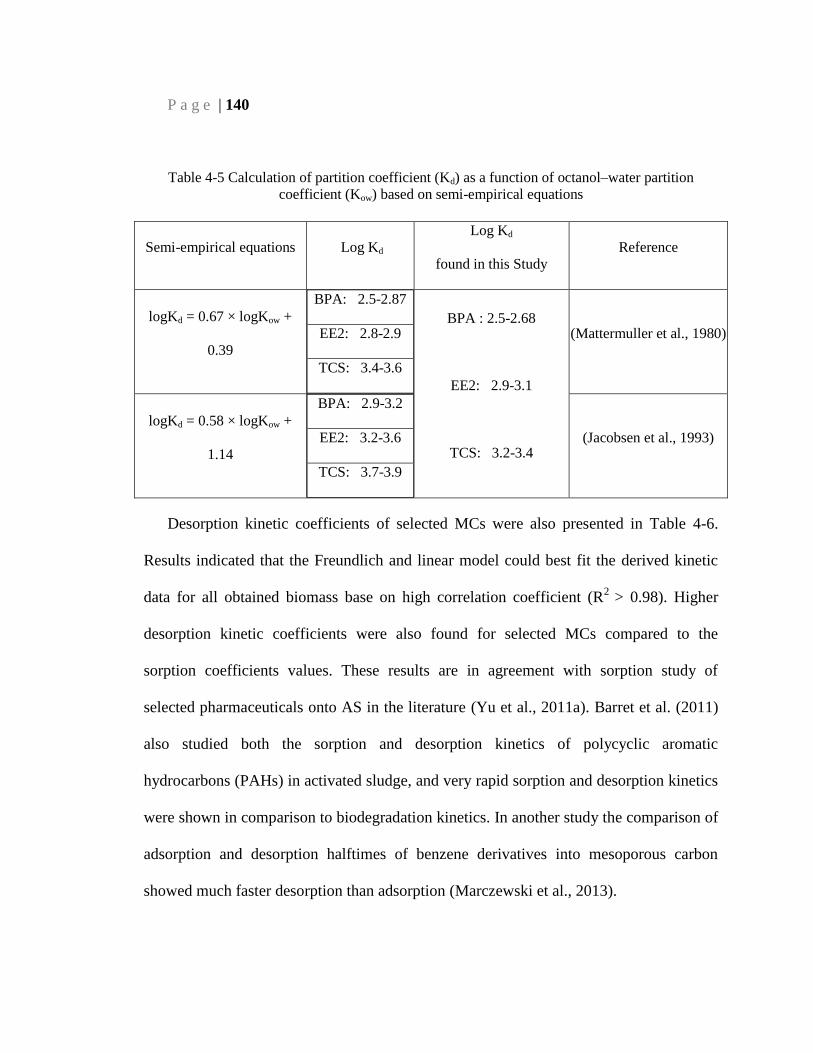
P a g e | 140
Table 4-5 Calculation of partition coefficient (Kd) as a function of octanol–water partition
coefficient (Kow) based on semi-empirical equations
Semi-empirical equations Log Kd
Log Kd
found in this Study
Reference
logKd = 0.67 × logKow +
0.39
BPA: 2.5-2.87
EE2: 2.8-2.9
TCS: 3.4-3.6
BPA : 2.5-2.68
EE2: 2.9-3.1
TCS: 3.2-3.4
(Mattermuller et al., 1980)
logKd = 0.58 × logKow +
1.14
BPA: 2.9-3.2
EE2: 3.2-3.6
TCS: 3.7-3.9
(Jacobsen et al., 1993)
Desorption kinetic coefficients of selected MCs were also presented in Table 4-6.
Results indicated that the Freundlich and linear model could best fit the derived kinetic
data for all obtained biomass base on high correlation coefficient (R2
> 0.98). Higher
desorption kinetic coefficients were also found for selected MCs compared to the
sorption coefficients values. These results are in agreement with sorption study of
selected pharmaceuticals onto AS in the literature (Yu et al., 2011a). Barret et al. (2011)
also studied both the sorption and desorption kinetics of polycyclic aromatic
hydrocarbons (PAHs) in activated sludge, and very rapid sorption and desorption kinetics
were shown in comparison to biodegradation kinetics. In another study the comparison of
adsorption and desorption halftimes of benzene derivatives into mesoporous carbon
showed much faster desorption than adsorption (Marczewski et al., 2013).

P a g e | 141
Table 4-6 Summery of desorption kinetic coefficients evaluated by different kinetic models
BPA
SRT (days) Freundlich model Linear model
Kf (µg
(1-1/n)L
1/n/g) 1/n R
2 Kd (L/g) R
2
15 0.705 0.891 0.989 0.596 0.989
10 1.182 0.978 0.998 1.083 0.980
5 0.789 1.024 0.998 0.552 0.992
TCS
SRT (days) Freundlich model Linear model
Kf (µg
(1-1/n)L
1/n/g) 1/n R
2 Kd (L/g) R
2
15 3.251 0.985 0.993 3.183 0.990
10 4.102 1.121 0.998 3.963 0.984
5 2.333 0.984 0.9915 2.288 0.988
EE2
SRT (days) Freundlich model Linear model
Kf (µg
(1-1/n)L
1/n/g) 1/n R
2 Kd (L/g) R
2
15 2.219 1.011 0.993 2.188 0.989
10 3.983 1.028 0.986 3.756 0.992
5 1.443 0.894 0.985 1.164 0.981
The results of desorption study using different biomass obtained from reactors with
SRTs of 5, 10, and 15 days were used to investigate the effect of SRTs on sorption
characteristics of selected MCs (Figures 4 and Table 6). It was found that the biomass
obtained from reactor with SRT of 10 days had the highest desorption kinetic coefficient
P a g e | 142
for all three selected MCs, however, unlike the sorption study, the desorption was faster
for EE2 and TCS at SRT of 15 d compared to SRT of 5 d.
4.4 Conclusions
The results of sorption equilibrium study, suggested that equilibrium was reached
within a few hours between sorbed and dissolved MCs. Mathematical models were also
applied to describe the sorption mechanism and Freundlich sorption isotherms with
values of 1/n close to 1 were found to best fit the results which demonstrate that all tested
concentrations result on the linear part of the Freundlich isotherm. Calculation of
Freundlich constant, KF and distribution coefficient, Kd exhibited the greater tendency of
EE2 and TCS for sorption, compared to BPA. The results of this study indicated that the
SRT had a clear effect on the sorption kinetics where the highest sorption constant was
achieved for a SRT of 10 d for all three target substances. This could be due to change of
the morphology of the biomass from reactors operating at different SRTs. By comparing
the results of sorption and biosorption studies, two stages were found for MCs sorption to
AS: physic-chemical sorption stage and biosorption or biodegradation. It was also
observed that the biodegradation can also occur when MCs are sorbed to the biomass
with TCS as an exception due to its inhibition effect. Therefore, the possible
biodegradation of sorbed MCs can be incorporated into the existing biodegradation
models to improve MCs fate models. Furthermore, the results presented in this study
indicate that the sorption and desorption kinetics of selected MCs are very rapid.
P a g e | 143
Therefore, desorption kinetics cannot limit BPA, EE2, and TCS biodegradation in
biological treatment systems and the equilibrium state assumption is valid to represent
sorption phenomena.
4.5 References
Standard methods for the examination of water and wastewater : 21st edition
Washington, DC: American Public Health Association, 2005.
Allmyr M, Adolfsson-Erici M, McLachlan MS, Sandborgh-Englund G. Triclosan in
plasma and milk from Swedish nursing mothers and their exposure via personal
care products. Sci Total Environ 2006; 372: 87-93.
Andersen HR, Hansen M, Kjolholt J, Stuer-Lauridsen F, Ternes T, Halling-Sorensen B.
Assessment of the importance of sorption for steroid estrogens removal during
activated sludge treatment. Chemosphere 2005; 61: 139-46.
Anderson PD. Endocrine disrupting compounds and implications for wastewater
treatment, 2005.
Aranami K, Readman JW. Photolytic degradation of triclosan in freshwater and seawater.
Chemosphere 2007; 66: 1052-6.
Arias-Estévez M, Fernández-Gándara D, García-Falcón MS, García-Río L, Mejuto JC,
Simal-Gándara J. Sorption of PAHs to Colloid Dispersions of Humic Substances
in Water. Bulletin of Environmental Contamination and Toxicology 2007; 79:
251-254.
Atkinson SK, Marlatt VL, Kimpe LE, Lean DR, Trudeau VL, Blais JM. The occurrence
of steroidal estrogens in south-eastern Ontario wastewater treatment plants. Sci
Total Environ 2012; 430: 119-25.
Banihashemi B, Droste RL. Trace level determination of bisphenol-A in wastewater and
sewage sludge by high-performance liquid chromatography and UV detection.
Water Quality Research Journal of Canada 2013; 48: 133-144.
Barret M, Carrere H, Latrille E, Wisniewski C, Patureau D. Micropollutant and sludge
characterization for modeling sorption equilibria. Environ Sci Technol 2010a; 44:
1100-6.
Barret M, Carrere H, Patau M, Patureau D. Kinetics and reversibility of micropollutant
sorption in sludge. J Environ Monit 2011; 13: 2770-4.
Barret M, Patureau D, Latrille E, Carrere H. A three-compartment model for
micropollutants sorption in sludge: methodological approach and insights. Water
Res 2010b; 44: 616-24.
P a g e | 144
Bester K. Triclosan in a sewage treatment process—balances and monitoring data. Water
Research 2003; 37: 3891-3896.
Borrirukwisitsak S, Keenan HE, Gauchotte-Lindsay C. Effects of salinity, pH and
temperature on the octanol-water partition coefficient of bisphenol A.
International Journal of Environmental Science and Development 2012; 3(5):
460-464.
Braoudaki M, Hilton AC. Low level of cross-resistance between triclosan and antibiotics
inEscherichia coliK-12 andE. coliO55 compared toE. coliO157. FEMS
Microbiology Letters 2004; 235: 305-309.
Buth JM, Grandbois M, Vikesland PJ, McNeill K, Arnold WA. Aquatic photochemistry
of chlorinated triclosan derivatives: potential source of polychlorodibenzo-p-
dioxins. Environ Toxicol Chem 2009; 28: 2555-63.
Byrns G. The fate of xenobiotic organic compounds in wastewater treatment plants.
Water Res 2001; 35: 2523-33.
Carballa M, Omil F, Lema JM. Calculation methods to perform mass balances of
micropollutants in sewage treatment plants. application to pharmaceutical and
personal care products (PPCPs). Environ Sci Technol 2007; 41: 884-90.
Chalew TE, Halden RU. Environmental Exposure of Aquatic and Terrestrial Biota to
Triclosan and Triclocarban. J Am Water Works Assoc 2009; 45: 4-13.
Chen JH, Huang X, Lee DJ. Bisphenol A removal by a membrane bioreactor. Process
Biochemistry 2008; 43: 451-456.
Cirja M, Zuehlke S, Ivashechkin P, Hollender J, Schaffer A, Corvini PF. Behavior of two
differently radiolabelled 17alpha-ethinylestradiols continuously applied to a
laboratory-scale membrane bioreactor with adapted industrial activated sludge.
Water Res 2007; 41: 4403-12.
Clara M, Strenn B, Gans O, Martinez E, Kreuzinger N, Kroiss H. Removal of selected
pharmaceuticals, fragrances and endocrine disrupting compounds in a membrane
bioreactor and conventional wastewater treatment plants. Water Res 2005; 39:
4797-807.
Clara M, Strenn B, Saracevic E, Kreuzinger N. Adsorption of bisphenol-A, 17 beta-
estradiole and 17 alpha-ethinylestradiole to sewage sludge. Chemosphere 2004;
56: 843-51.
Cowan CE, Larson RJ, Feijtel TCJ, Rapaport RA. An improved model for predicting the
fate of consumer product chemicals in wastewater treatment plants. Water
Research 1993; 27: 561-573.
Dann AB, Hontela A. Triclosan: environmental exposure, toxicity and mechanisms of
action. J Appl Toxicol 2011; 31: 285-311.
Dionisi D, Bertin L, Bornoroni L, Capodicasa S, Papini MP, Fava F. Removal of organic
xenobiotics in activated sludges under aerobic conditions and anaerobic digestion
P a g e | 145
of the adsorbed species. Journal of Chemical Technology and Biotechnology
2006; 81: 1496-1505.
Drury B, Scott J, Rosi-Marshall EJ, Kelly JJ. Triclosan exposure increases triclosan
resistance and influences taxonomic composition of benthic bacterial
communities. Environ Sci Technol 2013; 47: 8923-30.
Feng Y, Zhang Z, Gao P, Su H, Yu Y, Ren N. Adsorption behavior of EE2 (17 alpha-
ethinylestradiol) onto the inactivated sewage sludge: kinetics, thermodynamics
and influence factors. J Hazard Mater 2010; 175: 970-6.
Fernandez MP, Ikonomou MG, Buchanan I. An assessment of estrogenic organic
contaminants in Canadian wastewaters. Sci Total Environ 2007; 373: 250-69.
Fujimoto T, Kubo K, Aou S. Prenatal exposure to bisphenol A impairs sexual
differentiation of exploratory behavior and increases depression-like behavior in
rats. Brain Res 2006; 1068: 49-55.
Gee RH, Charles A, Taylor N, Darbre PD. Oestrogenic and androgenic activity of
triclosan in breast cancer cells. J Appl Toxicol 2008; 28: 78-91.
Gomes RL, Scrimshaw MD, Lester JN. Fate of conjugated natural and synthetic steroid
estrogens in crude sewage and activated sludge batch studies. Environ Sci
Technol 2009; 43: 3612-8.
Guellil A, Block JC, Urbain V. Adaptation of the microbial adhesion to hydrocarbon test
(MATH) for measuring activated sludge hydrophobicity. Water Science and
Technology 1998; 37: 359-362.
Haudin CS, Zhang Y, Dumeny V, Lashermes G, Bergheaud V, Barriuso E, et al. Fate of
(14)C-organic pollutant residues in composted sludge after application to soil.
Chemosphere 2013; 92: 1280-5.
Heidler J, Halden RU. Mass balance assessment of triclosan removal during conventional
sewage treatment. Chemosphere 2007; 66: 362-9.
Huang CH, Sedlak DL. Analysis of estrogenic hormones in municipal wastewater
effluent and surface water using enzyme-linked immunosorbent assay and gas
chromatography/tandem mass spectrometry. Environmental Toxicology and
Chemistry 2001; 20: 133-139.
Hung NV, Tateda M, Ike M, Fujita M, Tsunoi S, Tanaka M. Sorption of biodegradation
end products of nonylphenol polyethoxylates onto activated sludge. Journal of
Environmental Sciences 2004; 16: 564-569.
Hyland KC, Dickenson ER, Drewes JE, Higgins CP. Sorption of ionized and neutral
emerging trace organic compounds onto activated sludge from different
wastewater treatment configurations. Water Res 2012; 46: 1958-68.
Ivashechkin P, Corvini PF, Dohmann M. Behaviour of endocrine disrupting chemicals
during the treatment of municipal sewage sludge. Water Sci Technol 2004; 50:
133-40.

P a g e | 146
Jacobsen BN, Nyholm N, Pedersen BM, Poulsen O, Ostfeldt P. Removal of Organic
Micropollutants in Laboratory Activated-Sludge Reactors under Various
Operating-Conditions - Sorption. Water Research 1993; 27: 1505-1510.
Jeffries KM, Jackson LJ, Ikonomou MG, Habibi HR. Presence of natural and
anthropogenic organic contaminants and potential fish health impacts along two
river gradients in Alberta, Canada. Environ Toxicol Chem 2010; 29: 2379-87.
Jr GES, Turakhia MH, Lu C-J. Initiation of Micropollutant Biodegradation in Virgin
GAC Columns. Journal (American Water Works Association) 1989; 81: 168-176.
Kidd KA, Blanchfield PJ, Mills KH, Palace VP, Evans RE, Lazorchak JM, et al. Collapse
of a fish population after exposure to a synthetic estrogen. Proc Natl Acad Sci U S
A 2007; 104: 8897-901.
Kinney CA, Furlong ET, Kolpin DW, Burkhardt MR, Zaugg SD, Werner SL, et al.
Bioaccumulation of pharmaceuticals and other anthropogenic waste indicators in
earthworms from agricultural soil amended with biosolid or swine manure.
Environ Sci Technol 2008; 42: 1863-70.
Koh YK, Chiu TY, Boobis A, Cartmell E, Scrimshaw MD, Lester JN. Treatment and
removal strategies for estrogens from wastewater. Environ Technol 2008; 29:
245-67.
Lai KM, Johnson KL, Scrimshaw MD, Lester JN. Binding of waterborne steroid
estrogens to solid phases in river and estuarine systems. Environmental Science &
Technology 2000; 34: 3890-3894.
Lee HB, Peart TE, Chan J, Gris G. Occurrence of endocrine-disrupting chemicals in
sewage and sludge samples in Toronto, Canada. Water Quality Research Journal
of Canada 2004; 39: 57-63.
Lee KC, Rittmann BE, Shi JC, McAvoy D. Advanced steady-state model for the fate of
hydrophobic and volatile compounds in activated sludge. Water Environment
Research 1998; 70: 1118-1131.
Lindblom E, Press-Kristensen K, Vanrolleghem PA, Mikkelsen PS, Henze M. Dynamic
experiments with high bisphenol-A concentrations modelled with an ASM model
extended to include a separate XOC degrading microorganism. Water Res 2009;
43: 3169-76.
Lishman L, Smyth SA, Sarafin K, Kleywegt S, Toito J, Peart T, et al. Occurrence and
reductions of pharmaceuticals and personal care products and estrogens by
municipal wastewater treatment plants in Ontario, Canada. Sci Total Environ
2006; 367: 544-58.
Lopez-Avila V, Hites RA. Organic compounds in an industrial wastewater. Their
transport into sediments. Environmental Science & Technology 1980; 14: 1382-
1390.
P a g e | 147
Marczewski AW, Derylo-Marczewska A, Slota A. Adsorption and desorption kinetics of
benzene derivatives on mesoporous carbons. Adsorption-Journal of the
International Adsorption Society 2013; 19: 391-406.
Mattermuller C, Gujer W, Giger W, Stumm W. Non-Biological Elimination Mechanisms
in a Biological Sewage-Treatment Plant. Progress in Water Technology 1980; 12:
299-314.
Mohapatra DP, Brar SK, Tyagi RD, Surampalli RY. Occurrence of bisphenol A in
wastewater and wastewater sludge of CUQ treatment plant. Journal of
Xenobiotics 2011; 1.
Muller M, Rabenoelina F, Balaguer P, Patureau D, Lemenach K, Budzinski H, et al.
Chemical and biological analysis of endocrine-disrupting hormones and
estrogenic activity in an advanced sewage treatment plant. Environ Toxicol Chem
2008; 27: 1649-58.
Nakada N, Yasojima M, Okayasu Y, Komori K, Suzuki Y. Mass balance analysis of
triclosan, diethyltoluamide, crotamiton and carbamazepine in sewage treatment
plants. Water Sci Technol 2010; 61: 1739-47.
Neumegen RA, Fernandez-Alba AR, Chisti Y. Toxicities of triclosan, phenol, and copper
sulfate in activated sludge. Environ Toxicol 2005; 20: 160-4.
Nie Y, Qiang Z, Zhang H, Adams C. Determination of endocrine-disrupting chemicals in
the liquid and solid phases of activated sludge by solid phase extraction and gas
chromatography-mass spectrometry. J Chromatogr A 2009; 1216: 7071-80.
Parrott JL, Blunt BR. Life-cycle exposure of fathead minnows (Pimephales promelas) to
an ethinylestradiol concentration below 1 ng/L reduces egg fertilization success
and demasculinizes males. Environ Toxicol 2005; 20: 131-41.
Plosz BG, Leknes H, Thomas KV. Impacts of competitive inhibition, parent compound
formation and partitioning behavior on the removal of antibiotics in municipal
wastewater treatment. Environ Sci Technol 2010; 44: 734-42.
Pomiès M, Choubert JM, Wisniewski C, Coquery M. Modelling of micropollutant
removal in biological wastewater treatments: a review. Sci Total Environ 2013;
443: 733-48.
Queckenberg C, Meins J, Wachall B, Doroshyenko O, Tomalik-Scharte D, Bastian B, et
al. Absorption, pharmacokinetics, and safety of triclosan after dermal
administration. Antimicrob Agents Chemother 2010; 54: 570-2.
Robinson BJ, Hui JP, Soo EC, Hellou J. Estrogenic compounds in seawater and sediment
from Halifax Harbour, Nova Scotia, Canada. Environ Toxicol Chem 2009; 28:
18-25.
Samaras VG, Stasinakis AS, Mamais D, Thomaidis NS, Lekkas TD. Fate of selected
pharmaceuticals and synthetic endocrine disrupting compounds during
wastewater treatment and sludge anaerobic digestion. J Hazard Mater 2013; 244-
245: 259-67.
P a g e | 148
Seyhi B, Drogui P, Buelna G, Blais JF. Modeling of sorption of bisphenol A in sludge
obtained from a membrane bioreactor process. Chemical Engineering Journal
2011; 172: 61-67.
Singer H, Müller S, Tixier C, Pillonel L. Triclosan: Occurrence and Fate of a Widely
Used Biocide in the Aquatic Environment: Field Measurements in Wastewater
Treatment Plants, Surface Waters, and Lake Sediments. Environmental Science &
Technology 2002; 36: 4998-5004.
Sivaraman S, Sullivan TJ, Johnson F, Novichenok P, Cui G, Simmerling C, et al.
Inhibition of the bacterial enoyl reductase FabI by triclosan: a structure-reactivity
analysis of FabI inhibition by triclosan analogues. J Med Chem 2004; 47: 509-18.
Sørensen SR, Schultz A, Jacobsen OS, Aamand J. Sorption, desorption and
mineralisation of the herbicides glyphosate and MCPA in samples from two
Danish soil and subsurface profiles. Environ Pollut 2006; 141: 184-94.
Stahlhut RW, Welshons WV, Swan SH. Bisphenol A Data in NHANES Suggest Longer
than Expected Half-Life, Substantial Nonfood Exposure, or Both. Environmental
health perspectives 2009; 117: 784-789.
Staples CA, Dorn PB, Klecka GM, O'Block ST, Harris LR. A review of the
environmental fate, effects, and exposures of bisphenol A. Chemosphere 1998;
36: 2149-73.
Stasinakis AS, Gatidou G, Mamais D, Thomaidis NS, Lekkas TD. Occurrence and fate of
endocrine disrupters in Greek sewage treatment plants. Water Res 2008; 42:
1796-804.
Stevens-Garmon J, Drewes JE, Khan SJ, McDonald JA, Dickenson ER. Sorption of
emerging trace organic compounds onto wastewater sludge solids. Water Res
2011; 45: 3417-26.
Tchobanoglous G, Burton, F. L., Stensel, D. H. Wastewater engineering: treatment and
reuse. New York: McGraw-Hill, 2003.
Ternes TA, Herrmann N, Bonerz M, Knacker T, Siegrist H, Joss A. A rapid method to
measure the solid-water distribution coefficient (Kd) for pharmaceuticals and
musk fragrances in sewage sludge. Water Res 2004; 38: 4075-84.
Thomas PM, Foster GD. Tracking acidic pharmaceuticals, caffeine, and triclosan through
the wastewater treatment process. Environmental Toxicology and Chemistry
2005; 24: 25-30.
Urase T, Kikuta T. Separate estimation of adsorption and degradation of pharmaceutical
substances and estrogens in the activated sludge process. Water Res 2005; 39:
1289-300.
Urbatzka R, van Cauwenberge A, Maggioni S, Vigano L, Mandich A, Benfenati E, et al.
Androgenic and antiandrogenic activities in water and sediment samples from the
river Lambro, Italy, detected by yeast androgen screen and chemical analyses.
Chemosphere 2007; 67: 1080-7.
P a g e | 149
Vajda AM, Barber LB, Gray JL, Lopez EM, Woodling JD, Norris DO. Reproductive
disruption in fish downstream from an estrogenic wastewater effluent. Environ
Sci Technol 2008; 42: 3407-14.
Vega-Morales T, Sosa-Ferrera Z, Santana-Rodriguez JJ. Determination of alkylphenol
polyethoxylates, bisphenol-A, 17alpha-ethynylestradiol and 17beta-estradiol and
its metabolites in sewage samples by SPE and LC/MS/MS. J Hazard Mater 2010;
183: 701-11.
Vethaak AD, Lahr J, Schrap SM, Belfroid AC, Rijs GB, Gerritsen A, et al. An integrated
assessment of estrogenic contamination and biological effects in the aquatic
environment of The Netherlands. Chemosphere 2005; 59: 511-24.
vom Saal FS, Myers JP. Bisphenol A and risk of metabolic disorders. JAMA 2008; 300:
1353-5.
Xu K, Harper WF, Jr., Zhao D. 17alpha-Ethinylestradiol sorption to activated sludge
biomass: thermodynamic properties and reaction mechanisms. Water Res 2008;
42: 3146-52.
Yamamoto H, Liljestrand HM, Shimizu Y, Morita M. Effects of physical-chemical
characteristics on the sorption of selected endocrine disruptors by dissolved
organic matter surrogates. Environ Sci Technol 2003; 37: 2646-57.
Yi T, Harper WF, Jr. The effect of biomass characteristics on the partitioning and
sorption hysteresis of 17alpha-ethinylestradiol. Water Res 2007; 41: 1543-53.
Ying GG, Yu XY, Kookana RS. Biological degradation of triclocarban and triclosan in a
soil under aerobic and anaerobic conditions and comparison with environmental
fate modelling. Environ Pollut 2007; 150: 300-5.
Yu TH, Lin AY, Panchangam SC, Hong PK, Yang PY, Lin CF. Biodegradation and bio-
sorption of antibiotics and non-steroidal anti-inflammatory drugs using
immobilized cell process. Chemosphere 2011; 84: 1216-22.
Zhao J, Li Y, Zhang C, Zeng Q, Zhou Q. Sorption and degradation of bisphenol A by
aerobic activated sludge. J Hazard Mater 2008; 155: 305-11.
Zhou H, Huang X, Wang X, Zhi X, Yang C, Wen X, et al. Behaviour of selected
endocrine-disrupting chemicals in three sewage treatment plants of Beijing,
China. Environmental Monitoring and Assessment 2010; 161: 107-21.
Zhou JL, Liu R, Wilding A, Hibberd A. Sorption of selected endocrine disrupting
chemicals to different aquatic colloids. Environ Sci Technol 2007; 41: 206-13.

P a g e | 150
Chapter 5: Fate of MCs In Simulated AS Bioreactors
Summary1:
To understand the fate of microconstituents (MCs) in an activated sludge (AS)
system, nine lab-scale continuous flow porous-pot bioreactors operating at various solids
retention times (SRTs) and hydraulic retention times (HRTs) were studied. In this
research biodegradation and sorption were investigated at the µg/L range for 17α-
ethinylestradiol (EE2), bisphenol-A (BPA), and triclosan (TCS). The effects of SRT,
HRT and the biomass concentration on sorption and removal of MCs were also studied.
The selected MCs showed high sorption affinity to the non-active biomass with greater
tendency of EE2 and TCS for sorption, compared to BPA. Mathematical models were
applied to describe the sorption mechanism and Freundlich sorption isotherms with
values of 1/n close to 1 and pseudo-second-order model were found to best fit the results.
The results of this study indicated that the SRT had a clear effect on the sorption kinetics
where the highest sorption constant was achieved for a SRT of 10 days for all three target
substances. The operation of continuous-flow AS systems in the presence of 20 µg/L of
MCs indicated that 90-98, 63-91 and 97-98% of BPA, EE2 and TCS, respectively, can be
removed during the AS process in systems operating at SRT of 5–15 d and HRT of 4-10
h. Determination of MCs in the dissolved and particulate phase and calculation of their
mass flux showed that biotransformation was the principal removal mechanism of
1 This chapter has been submitted for publications to the Journal of Hazardous Material

P a g e | 151
selected MCs. Statistical analysis revealed that both SRT and HRT had a significant
effect on the fate of MCs where highest biotransformation removal rate was found for
TCS and BPA in reactors operating at higher SRTs whereas the lower rate of 58% was
found for EE2 in the reactor operating at SRT of 5 d and HRT of 4 h. The MCs removal
rate in the presence of nitrification inhibitor illustrated the role of heterotrophs versus
autotrophs in fate of MCs. It was found that heterotrophs were most likely responsible for
the degradation of selected MCs.
P a g e | 152
5.1 Introduction:
The occurrence and fate of microconstituents (MCs) in lakes, rivers, drinking water
and their removal in wastewater treatment plants (WWTPs) as major point sources are a
growing concern since some of these substances remain at detectable levels in WWTP
effluents, and discharge into the rivers (Anderson, 2005; Ashton et al., 2004). Because of
this growing interest, scientists have studied the environmental fate and toxicology
properties of MCs (Melcer and Klecka, 2011; Radjenovic et al., 2009; Samaras et al.,
2013) and although no legal limits have been established yet, regulatory authorities
around the world have conducted monitoring programs and risk assessments of different
MCs for future guidelines of concentration limits of MCs in water bodies or in discharged
WWTPs effluent (Advanced Industrial Science and Technology, 2007; Environment
Canada and Health Canada, 2011; European Commission, 2010; Roig, 2010).
Conventional wastewater treatment systems, such as activated sludge (AS) are not
designed to remove MCs at very low concentration. In addition, advanced treatment
methods, such as membrane bioreactor (Lee et al., 2008), advanced oxidation (Plahuta et
al., 2014), ozonation or use of granulated activated carbon (Margot et al., 2013), are
being explored. However; these treatment options are often expensive to install and
operate and might only be feasible for larger WWTPs. Therefore, information on how
various MCs are removed from current facilities need to be studied and opportunities to
optimize and enhance their treatment need to be explored which requires understanding of
P a g e | 153
the effect of operational condition, environmental parameters and compound specific
properties on the fate of MCs in treatment processes.
Findings from multiple studies have demonstrated that sorption onto suspended solids
(SS), biodegradation/biotransformation, chemical transformation (such as
photodegradation), and volatilization are the primary removal mechanisms for MCs in
wastewater treatment processes (Jelic et al., 2011; Verlicchi et al., 2012). Joss et al.
(2006) showed that a significant amount of a compound will be stripped in a bioreactor
with fine bubble aeration if Henry’s constant (H) > 0.003 (atm·m3/mol). Therefore, it can
be concluded that stripping process during wastewater treatment is in general not relevant
for the removal of those MCs that have low Henry’s constant. Depending on pH,
photolysis of MCs could be a significant removal mechanism, especially above pH 8
(Tixier et al., 2002). Because the pH range in WWTPs is usually in the range of 6.5-8,
losses due to photolysis are expected to be negligible. Thus, sorption and
biotransformation are considered as two primary removal pathways of MCs in most
studies. Biodegradation of MCs is usually more difficult than biodegradation of natural
microbial substrates due to the different molecular structure of MCs (Chong et al., 2008).
Some MCs can be utilized as primary substrates but others are utilized as secondary
substrates in conjunction with a primary substrate, i.e., co-metabolism. The partitioning
of MCs between solid and liquid phases is also significant due to the large concentration
of biomass and associated solids.
P a g e | 154
Several synthetic organic compounds that have been classified as MCs are commonly
detected in municipal and industrial wastewater and their occurrence has been well
documented around the world. Among these, 17α-ethinylestradiol (EE2), Bisphenol A
(BPA) and Triclosan (TCS) present significant research interest due to their extensive use
and their physico-chemical and toxicological properties (Melcer and Klecka, 2011).
Concentration levels of these MCs range between a few ng/L to some µg/L in wastewater
(Atkinson et al., 2012; Fernandez et al., 2007; Lee et al., 2004; Mohapatra et al., 2011;
Nakada et al., 2010; Stasinakis et al., 2008), surface water (Bennie, 2008; Klecka et al.,
2009; Stasinakis et al., 2012), groundwater (Lapworth et al., 2012; Latorre et al., 2003)
and drinking water (Heberer, 2002b; Vulliet et al., 2011), while concentrations up to µg/g
have been detected in sewage sludge and soil samples (Martin et al., 2012; Mohapatra et
al., 2011).
BPA is a building compound for the manufacturing of plastics, epoxy resins, and
polycarbonate resins. BPA is an endocrine disrupter (Fujimoto et al., 2006; vom Saal and
Myers, 2008) and might be as effective as estradiol in triggering some receptor responses
(Stahlhut et al., 2009). BPA might also act as an androgen receptor antagonist (Urbatzka
et al., 2007). The observed influent-to-effluent reduction in five municipal WWTPs in
Canada was 70-76% for BPA indicating that it is not completely eliminated during
wastewater treatment (Fernandez et al., 2007; Mohapatra et al., 2011). Stasinakis et al.
(2008) conducted one of the few studies that allows for a mass balance analysis of the

P a g e | 155
mechanisms responsible for BPA removal during wastewater treatment. Ballesteros-
Gomez et al. (2007) measured BPA in four WWTPs in Spain and reported a BPA
concentration of 0.96 to 1.6 mg/L in the influent and 0.26 to 0.36 mg/L in the effluent,
whereas the overall BPA removal efficiencies were reported to be greater than 75%. BPA
was also found in municipal sewage sludge, in the range of 0.104–0.312 µg/g in Canada
(Mohapatra et al., 2011), 1.86–0.02 µg/g in Greek (Samaras et al., 2013; Stasinakis et al.,
2008), and 0.4 µg/g in Spain (Vega-Morales et al., 2010).
EE2 is a synthetic hormone that has attracted considerable attention in the literature
due to its contribution to endocrine disrupting activity in WWTP effluent which might
cause estrogenic effects on fathead minnow populations (Hamid and Eskicioglu, 2012;
Jeffries et al., 2010; Kidd et al., 2007; Vajda et al., 2008). Biodegradation has been
reported as the most substantial estrogen removal method in AS wastewater treatment
(Muller et al., 2008); however, EE2 adsorption onto AS particles in municipal WWTP
might also be an important removal pathway in a WWTP due to its nonpolar behaviour
and hydrophobic properties (Andersen et al., 2005; Cirja et al., 2007; Zhou et al., 2010).
TCS (2,4,40-trichloro-20-hydroxydiphenyl ether; Irgasan) is a broad spectrum
antibacterial agent which can be found in many personal care products such as hand
disinfecting soaps, medical skin creams, dental products, deodorants, toothpastes (Dann
and Hontela, 2011). An aid to the development of cross-resistance to antibiotics (Drury et
al., 2013) and the potential estrogenic and androgenic effects on human breast cancer

P a g e | 156
cells (Gee et al., 2008) and fish bile (Rostkowski et al., 2011) are some indicative
examples of endocrine disrupting activity of this compound. Removal efficiencies of 58–
97% for trickling filter plants and 95–98% for AS plants were reported in the literature,
mostly due to biodegradation and sorption onto biosolids (Bester, 2003; Chalew and
Halden, 2009; Lishman et al., 2006; Nakada et al., 2010; Thomas and Foster, 2005).
Nakada et al. (2010) investigated the behaviour of the TCS at two WWTPs and
conducted one of the few mass balance studies on fate of TCS. In their study TCS was
dominantly detected in the particulate phase especially in the early stage of treatment (up
to 83%) and was efficiently removed (over 90%) in WWTPs.
Once a MC is released into wastewater, it will be introduced to the different
environmental media in the AS system (e.g., water, biomass, solids) due to its physico-
chemical properties, such as volatility, solubility, lipophilicity, acidity, and sorption
potential. Moreover, depending on its resistance to biologically or abiotically degradation
processes, it can remain in WWTPs and discharge to the environment through the
effluent. Studies showed that the compounds with octanol-water partition coefficient, log
Kow <2.5 have high bioavailability and their sorption to AS is not expected to contribute
significantly to the removal of the pollutant via excess sludge withdrawal. For chemicals
having log Kow between 2.5 and 4, moderate sorption is expected and finally, organic
compounds with log Kow higher than 4, show high sorption potential (Ter Laak et al.,
2005). Joss et al. (2006) showed that compounds can only sorb significantly onto primary
P a g e | 157
and secondary sludges if they have sorption coefficient (Kd) values higher than 500 L/kg.
They identified three groups of compounds based on their pseudo-first-order degradation
constants Km and showed that: a) compounds with Km <0.1 L/g SS.d are not removed to a
significant extent (<20%), b) compounds with Km >10 L/g SS.d are transformed by
>90%, and c) compounds with Km between 0.1-10 L/g SS.d have moderate removal.
Carballa et al. (2007) also found that in sludge treatment process, sorption can be
neglected if the Kd value is less than l L/kg.
(Suárez et al., 2008a) showed that based on partition coefficient between solid and
liquid phase values and biodegradability of MCs, their removal in WWTPs can be
predicted. They suggested that the effect of hydraulic retention time (HRT) and sludge
retention time (SRT) on MCs removal could be different when the compound has low,
moderate, or high Kd or Kow and biodegradation constant values. Table 5-1, shows the
physico-chemical properties of selected MCs in this study as well as the possible effect of
HRT and SRT on removal of these compounds in an AS system.
Although the presence of these MCs during wastewater treatment has been studied by
a plethora of reports, significant differences on their concentration levels and removal
rates as well as contradictory results on their fate have been reported (Deblonde et al.,
2011; Stasinakis et al., 2010). On the other hand, it should be mentioned that the majority
of environmental surveys previously undertaken have mainly been focused on dissolved
P a g e | 158
concentrations of these compounds in wastewater at environmentally relevant
concentrations (Feng et al., 2010; Radjenovic et al., 2009; Seyhi et al., 2011).
Table 5-1 Physico-chemical characteristics of selected MCs
MCs Sw H Km log Kow Affecting
factor
Effect on
removal
BPA 120 1.0×10⁻¹¹
5-113d 3.18-3.7
a SRT, SS +
EE2 4.8-11.3 7.9×10⁻¹²
5-18.9e 3.6-4.15
b SRT, SS +
TCS 10 1.5×10⁻⁷
30-288d 4.5-4.8
c None ++
MW: molecular weight (g/mol); Sw: solubility in water (mg/L); H: Henry coefficient
(atm·m3/mol); Kow: octanol-water partition coefficient; Km: pseudo-second-order degradation
constant (L/gSS.day);
a (Borrirukwisitsak et al., 2012; Robinson et al., 2009)
b (Robinson et al., 2009),
c (Lopez-Avila and Hites, 1980; Ying et al., 2007)
d (Stasinakis et al., 2010),
e (Ziels et al., 2014)
Only in the last few years have researchers started to study the MCs concentration in
the solid phase at very low concentrations (Nie et al., 2009; Stasinakis et al., 2010;
Stevens-Garmon et al., 2011; Zhao et al., 2008). In addition, there are limited data for the
role of SRT and HRT in removal of targeted MCs (Stasinakis et al., 2010). (Kirk et al.,
2002) reported high removal efficiency of EE2 when HRT increased from 2-5 to 13 h at
UK WWTPs. In contrast, (Servos et al., 2005) found no statistical correlation (R2<0.53)
between HRT or SRT and hormone or estrogenicity removal for nine conventional
secondary plants and three tertiary plants in Canada. (Gros et al., 2007) studied the
removal efficiency of different groups of MCs in 6 WWTPs with AS systems of different
P a g e | 159
HRTs in Spain and found that the plants with the highest HRTs (25-33 h) have the
highest removal efficiency, while plants with an HRT of 8 h had no or poor removal of
most of the selected compounds.
There are also limited and debatable information on the role of autotrophs on MCs
biodegradation in AS systems operating at different SRTs (Larcher and Yargeau, 2013;
Zhou and Oleszkiewicz, 2010). Nitrifier-enriched AS was used in batch degradation of
BPA to investigate the effect of ammonia oxidizing bacteria, AOB (Kim et al., 2007). It
was observed that BPA concentration was decreased with the oxidation of ammonium to
nitrate by nitrifying sludge. However, in presence of nitrification inhibitors, allylthiourea
(ATU), BPA reduction decreased significantly. Gaulke et al. (2008) suggested that EE2
at high concentration (mg/L) is co-metabolically degraded by AOB but EE2 removal at
low concentration found in municipal conventional AS systems is not due to co-
metabolic degradation by AOB, or to abiotic nitration, but most likely due to
heterotrophic bacteria. This result was also verified by other authors (Racz et al., 2012;
Zhou and Oleszkiewicz, 2010). In contrast, Khunjar et al. (2011) studied the role of AOB
versus heterotrophic bacteria during biotransformation of EE2 and showed that AOB
activity was an important contributor towards EE2 biodegradation and the metabolites
formed by AOBs during EE2 biodegradation can be mineralized by heterotrophic
cultures.
P a g e | 160
Laboratory-scale investigations are useful because they offer the opportunity of
evaluating different operating conditions in simulated secondary wastewater treatment
systems in a controlled environment. Therefore, to evaluate the contradictory results that
have been reported on the fate of selected MCs, the sorption and biotransformation of
BPA, TCS, and EE2 in lab-scale porous-pot AS reactors were investigated in parallel by
measuring the concentration of MCs in both liquid and solid phases and the effect of
three HRTs, three SRTs and nitrification on fate of these compounds were evaluated.
Statistical analyses were also performed to investigate the interaction effect of HRT and
SRT on removal of the selected MCs in simulated AS systems.
5.2 Material and Methods:
5.2.1 Experimental overview
Three laboratory-scale porous-pot bioreactors were set up to simulate AS systems
operating at different SRTs. These bioreactors were originally seeded with the AS
obtained from City of Ottawa wastewater treatment facility and fed with synthetic
wastewater and environmentally relevant concentration of selected MCs. The MCs
concentrations in liquid and solid phases were monitored to investigate the fate of these
compounds in simulated AS, as well as the effect of SRTs on their removal. The same
procedures were repeated for three different HRTs to explore the effect of HRTs on
removal of MCs. With a low vapour pressure and a Henry’s law constant ranging from
P a g e | 161
1.5 × 10⁷
to 7.9× 10¹²
atm.m3/mol for the selected MCs (Table 5-1), removal of these
compounds by volatilization can be considered negligible. By adjusting the pH to 7 in the
AS reactors and conducting the test in the dark, losses due photolysis can also be
considered negligible. Thus, only sorption and biodegradation were studied during the
experiment. The sorption batch tests were conducted to retrieve kinetic and equilibrium
data. Finally nitrification inhibitors, ATU were added to reactors to study the role of
nitrifiers versus heterotrophs during biotransformation of MCs. Another objective of this
study was to examine if there is any relationship between the fate of MCs and operational
conditions in AS by statistical methods. The experimental hypotheses was that increasing
SRT and HRT would enhance the removal of selected MCs in AS system and this could
be predicted by using the physico-chemical and biodegradation properties of these
compounds. The second hypothesis was that nitrification contributes an important role
towards MCs biodegradation. These hypotheses were examined using ANOVA statistical
analysis. In addition, since this is a simulation test, it is assumed that results from this
study could be extrapolated to predict elimination in full-scale treatment plants, provided
that critical parameters such as temperature, SRT, HRT, pH and initial test substance
concentrations are in the same range as in the full scale AS system.
5.2.2 Activated sludge, synthetic wastewater and Porous-Pot Bioreactor
The thickened waste AS (TWAS) inoculum was obtained from the Robert O. Pickard
Environmental Center (ROPEC) wastewater treatment facility in Ottawa ON. The TWAS
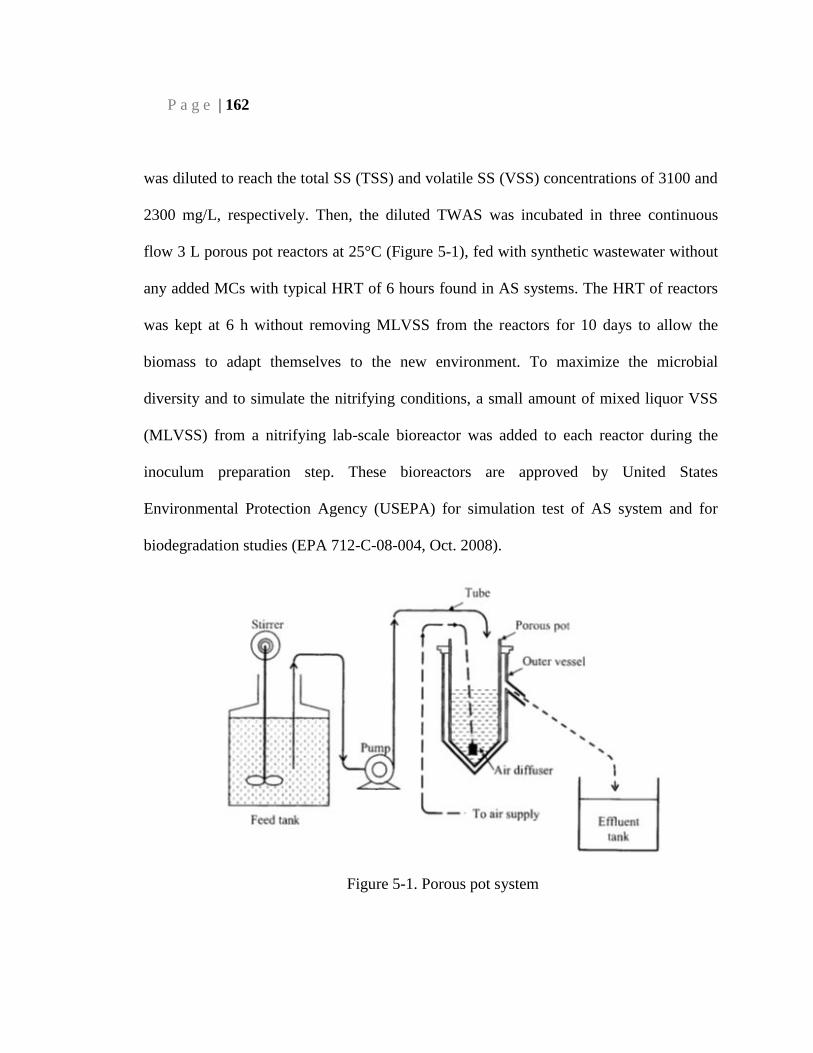
P a g e | 162
was diluted to reach the total SS (TSS) and volatile SS (VSS) concentrations of 3100 and
2300 mg/L, respectively. Then, the diluted TWAS was incubated in three continuous
flow 3 L porous pot reactors at 25°C (Figure 5-1), fed with synthetic wastewater without
any added MCs with typical HRT of 6 hours found in AS systems. The HRT of reactors
was kept at 6 h without removing MLVSS from the reactors for 10 days to allow the
biomass to adapt themselves to the new environment. To maximize the microbial
diversity and to simulate the nitrifying conditions, a small amount of mixed liquor VSS
(MLVSS) from a nitrifying lab-scale bioreactor was added to each reactor during the
inoculum preparation step. These bioreactors are approved by United States
Environmental Protection Agency (USEPA) for simulation test of AS system and for
biodegradation studies (EPA 712-C-08-004, Oct. 2008).
Figure 5-1. Porous pot system

P a g e | 163
The porous pot system (Figure 5-2 and 5-3) consists of an inner, porous cylinder with
a conical bottom held in a slightly larger vessel of the same shape, but made of an
impervious plastic material. The material for the porous vessel is porous polyethylene of
maximum pore size of 90 μm and 2 mm thickness. Separation of the sludge from the
treated organic medium is effected by differential passage through the porous wall. No
settlement occurs and hence there is no sludge return.
Figure 5-2. Porous pot aeration vessel details
Figure 5-3. Experimental AS system

P a g e | 164
The porous pots are allowed to attain steady state at an MLVSS level commensurate
with the other key control parameters.
The SRT of each reactor was decreased gradually to reach the SRT of 5, 10, and 15 d
by daily withdrawal of a predetermined volume (Eq. 5-1) of MLVSS from the reactors.
The daily MLVSS volume to be removed was found to be 200, 300, and 600 mL.
(5-1)
where Xv is VSS concentration (mg/L), V is volume of reactor (L), Qw is the volume of
mixed liquor to be removed each day (L/d), Q is influent flow rate (L/d), XVe is
VSS concentration in the effluent (mg/L), and X is SRT.
To account for the liquid portion of MLVSS that was removed, the same volume was
replaced with effluent supernatant; therefore, the amount of soluble substrate remains
unchanged during the biomass wastage. Since the reactors behave as completely mixed
reactors this replacement serves to simply maintain the MLVSS of the systems without
diluting the reactors (Figure 5-4).
Figure 5-4. Schematic of the simulated AS system
P a g e | 165
The chemical oxygen demand (COD) and MLVSS in these reactors were monitored
three times a week to reach a stabilized condition. After reaching the steady state
condition and before MCs were added, the reactors were kept at HRT of 6 h and designed
SRTs for 6 months for biomass acclimatization to the feed (Phase A) and to conduct the
sorption study and eliminating the existing MCs already sorbed to the incubated biomass.
Up to the end of Phase A, target compounds concentration was reduced to values lower
than methods’ limits of detection (LODs).
The synthetic wastewater (Table 5-2) was composed of distilled water, supplemented
with nutrients, trace elements, and buffering compounds which is the modified version of
what was described in the study by Zhao et al. (Zhao et al., 2008). Glucose, peptone and
sodium acetate were used for simulating easily degradable substrate, complex organic
carbon source and volatile fatty acid, respectively. Ammonium chloride is added as a
nitrogen source for nitrifying bacteria and sodium bicarbonate and
ethylenediaminetetraacetic acid (EDTA) are used for alkalinity and preservation,
respectively.
Three stock solutions (1 L) were prepared to separate the carbon source, the nutrients,
and the minerals in order to prevent any biodegradation. They were stored in the
refrigerator at < 4°C for ten days. Each day 100 mL of each stock solution was added to
the influent glass tank (30 L) and mixed with deionized water using mechanical mixer to
meet the desired concentration of COD, nitrogen and phosphorus in the feed. The
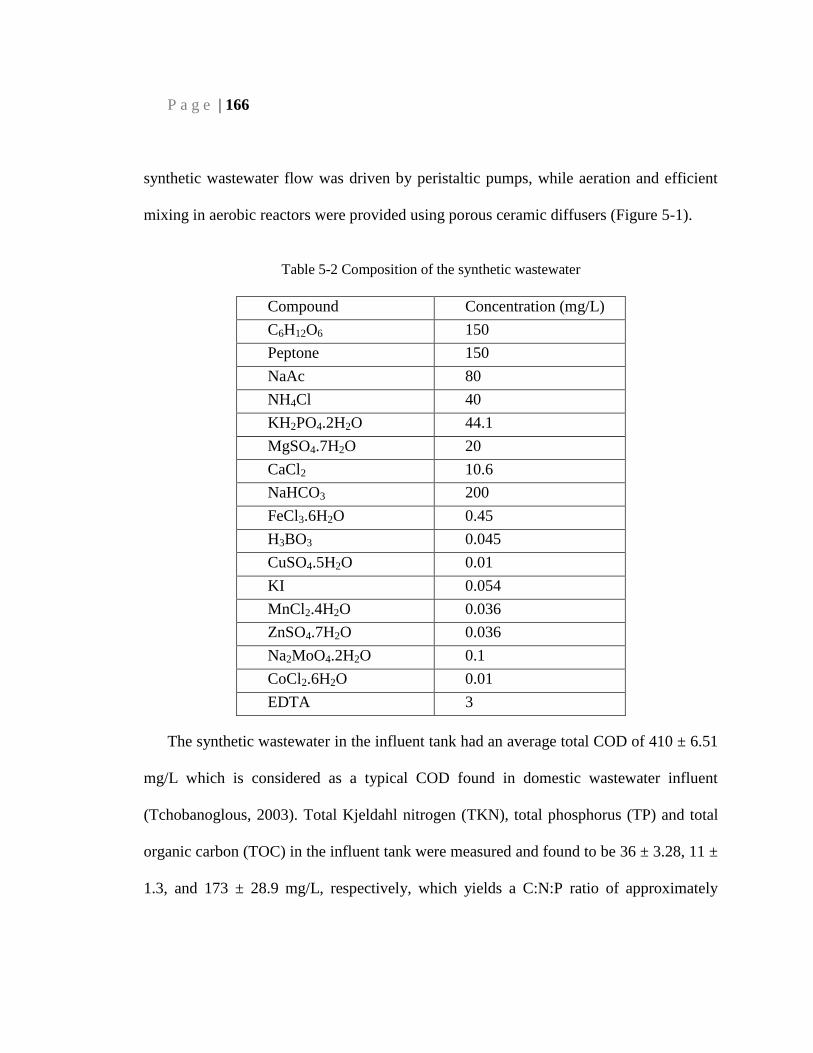
P a g e | 166
synthetic wastewater flow was driven by peristaltic pumps, while aeration and efficient
mixing in aerobic reactors were provided using porous ceramic diffusers (Figure 5-1).
Table 5-2 Composition of the synthetic wastewater
Compound Concentration (mg/L)
C6H12O6 150
Peptone 150
NaAc 80
NH4Cl 40
KH2PO4.2H2O 44.1
MgSO4.7H2O 20
CaCl2 10.6
NaHCO3 200
FeCl3.6H2O 0.45
H3BO3 0.045
CuSO4.5H2O 0.01
KI 0.054
MnCl2.4H2O 0.036
ZnSO4.7H2O 0.036
Na2MoO4.2H2O 0.1
CoCl2.6H2O 0.01
EDTA 3
The synthetic wastewater in the influent tank had an average total COD of 410 ± 6.51
mg/L which is considered as a typical COD found in domestic wastewater influent
(Tchobanoglous, 2003). Total Kjeldahl nitrogen (TKN), total phosphorus (TP) and total
organic carbon (TOC) in the influent tank were measured and found to be 36 ± 3.28, 11 ±
1.3, and 173 ± 28.9 mg/L, respectively, which yields a C:N:P ratio of approximately

P a g e | 167
100:20:6. The measured ammonia (NH3), nitrate (NO3-N), temperature and pH of the
influent were found to be 12.9 ± 2.26 mg/L, 0.06 ± 0.01 mg/L, 22 ± 1.1oC and 6.9 ± 0.33,
respectively.
5.2.3 Batch sorption experiments
Sorption batch experiments were performed to investigate MCs sorption to inactive
AS obtained from 3 porous pot reactors operating at SRTs of 5, 10, and 15 d and HRT of
6 h. Two batch reactors from each porous pot reactor (2 L Erlenmeyer flasks) were
conducted for the sorption equilibrium study. To avoid the influence of microbial activity
on the MCs sorption behavior onto AS, sodium azide solution (0.2% w/w) was used to
prevent biodegradation by paralyzing cytochrome oxidase. This concentration has been
shown to inhibit the biodegradation process without causing any cell lysis, and also it
does not cause change to sludge hydrophobicity (Guellil et al., 1998; Xu et al., 2008; Yi
and Harper, 2007). The mixed liquor SS (MLSS) and SRT effects were also examined
using same concentration range of each target compound and MLSS concentrations of
1430, 2750, and 3540 mg/L from each reactor. To determine sorption isotherms six 1 L
Erlenmeyer flasks (two flasks for inactive AS taken from each porous-pot reactor) were
filled with inactive AS and were exposed to the selected MCs at concentrations of 5, 10,
20, 50, 100 and 200 µg/L. Adsorption kinetic can be helpful to understand the
mechanisms of the sorption process and to control the efficiency of the process; therefore,

P a g e | 168
the sorption rates were also evaluated and the kinetic data were modeled using intra-
particle diffusion model, pseudo-first-order and pseudo-second-order equations.
Detailed description of the methods applied in the sorption tests is published
previously by the authors (Banihashemi and Droste, 2014).
5.2.4 Continuous-flow experiments
The standard approach to biological treatment studies, commonly evaluates system
performance at three SRTs and three HRTs for each sludge age, with identical feed
concentration; therefore, after biomass acclimatization to the feed (Phase A), three HRTs
of 4, 6 and 10 h combined with three SRTs of 5, 10 and 15 d were examined (Phases B,
C, and D). Table 5-3 shows the experimental operational conditions.
Table 5-3: Experimental operational conditions
Condition Unit Experimental Phases
Phase B Phase C Phase D
HRT Hours 6 6 6 10 10 10 4 4 4
SRT Days 5 10 15 5 10 15 5 10 15
To avoid biodegradation or any abiotic losses of the selected MCs before it is
introduced into the test system, which might occur if the MC and sewage are premixed,
the MCs solution and the sewage were dosed into the porous pot separately using amber
glass and MasterFlex C-FLEX tubing for MC solution. The total flow rate into the reactor
(sewage + MCs solution) was calculated based on Eq. (5-2).
( )
( ) ( ) (5-2)
P a g e | 169
The concentration of MCs solution to be dosed into a reactor was calculated based on
the total flow, the desired concentration of MCs in the influent sewage (Cinf = 20 µg/L)
and the pump convenient dosing rate of 0.83 mL/min (Eq. 5-3)
( ) ( ) ( )
( ) (5-3)
In order to establish that the units have reached steady state, are operating properly
and acclimated to the selected MCs (stabilization period), test compounds in the effluent
and overall performance of the units were regularly monitored at the early period of each
phase. The stabilization periods for phase B, C and D were 47, 60 and 65 d, respectively.
A porous pot is considered to be at steady state if over a seven day period of operation at
a set SRT; the coefficient of variation (standard deviation/mean) of the COD and MCs of
its effluents is less than 20 % (EPA 712-C-08-004, Oct. 2008). When the reactors have
achieved steady state, nine samples were taken in the period of two weeks and the overall
performance of the reactor and the concentration of MCs in liquid and solid phases
(triplicate) were measured. During the experiments, all systems were maintained at 25°C
by automatic thermostat, dissolved oxygen (DO) in aerobic reactors was kept above 4.0
mg/L and pH was ranged to 7.2 ± 0.3. All reactors and tubes were covered with
aluminum foil or tape to prevent any loss due to photodegradation (Figure 5-3).
One aerated control porous pot reactor was also monitored to check for any abiotic
losses during the degradation study at each stage, where MCs and distilled water were
added separately to the reactor without any sludge or synthetic wastewater. Only sorption

P a g e | 170
onto membrane fibers could have a limited contribution, but the available surface is
negligible compared to biomass. Bouju et al. (2011) added a pulse of radiolabelled
diclofenac to a MBR and found only 0.03 % of the applied radioactivity in the membrane
after 300 h. The result of control unit at each stage was used to measure any losses due to
sorption to plastic influent tank, membrane and tubes and the sorption and
biodegradation/biotransformation removal calculation were adjusted accordingly.
5.2.5 Chemical and analytical method
Methanol (MeOH), hexane, acetonitrile (ACN), dichloromethane, and acetone used
for cleaning and extraction purposes, were purchased from VWR International, LLC
(Canada) and were all of high-performance liquid chromatography (HPLC) analytical
grade. EE2, BPA, and TCS (HPLC grade, >98%) were purchased from Sigma-Aldrich,
Canada. Stock solutions of BPA, TCS, and EE2 were prepared in MilliQ water/ACN
(55/45, v/v) at 1000 mg/L and kept at 4◦C for maximum of 60 d. The working solutions
were prepared daily by diluting the stock solution and were used for calibration and
spiking experiments. MilliQ water was prepared in the laboratory using a MilliQ/
Millipore system with Super-C carbon, Ion-Ex, and Orgonex-Q cartridges. Supelclean
LC-18 (3 mL, 500 mg) cartridges used for extraction and clean-up samples were supplied
by Sigma-Aldrich (Oakville, ON, Canada). The Zorbax Eclipse plus C18
chromatography column (4.6 mm× 150 mm, 5 µm) was purchased from
Chromatographic specialties Inc. (ON, Canada). All other chemical used in this study

P a g e | 171
were supplied by Fisher Scientific (ON, Canada) and were of the highest purity
commercially available.
To control the operation of continuous-flow AS systems, analyses of influent and
effluent COD (dissolved and total), NH4–N, TN, TKN, nitrate (NO3-N), VSS in the
effluents, MLSS, MLVSS and mixed liquor total COD were regularly performed,
according to Standard Methods (2005). Temperature, DO and pH values were also
measured daily using portable instruments.
For the investigation of the fate of selected MCs in AS process, sample preparation
and clean-up were performed using commercial SPE cartridge (Supelclean LC-18) and
microwave-assisted extraction, Mars 5® (MW Accelerated Reaction System; CEM
Corporation) for MC samples in both liquid and solid phases based on the method
described in a previously published studies (Banihashemi and Droste, 2013; Banihashemi
and Droste, 2014). Determination of selected MCs was performed using a HPLC
(Hewlett-Packard, HP 1100) coupled with ultraviolet (UV) detection according to the
procedures described by Banihashemi and Droste (2014). In brief, these analytical
methods presented satisfactory precision with relative standard deviations (RSDs) less
than 10% for selected MCs. Recoveries of the method for wastewater and sewage sludge
were determined by analysing fortified samples of each type of wastewater and sludge
spiked in triplicate to 1 µg/L and 0.5 µg/g dry weight (d.w.), respectively. The recoveries
of BPA, TCS and EE2 in liquid samples were found to be 106 ± 2, 95 ± 6 and 88 ± 5%,
P a g e | 172
respectively. Also satisfactory recoveries were obtained in solid samples (>75%), except
for TCS, where recoveries of 55 ± 6 % were obtained. For this reason, recovery
correction was made for TCS by dividing the observed concentrations by recovery rates.
The limits of detection (LOD) of the target compounds in liquid and solid samples were
100 ng/L and 100 ng/g, respectively.
5.2.6 Calculation methods
The sorption characteristics were described by computation of isotherms and
determination of characteristic values. Adsorption isotherms allow presenting the
variation of sorption with respect to the concentration of sorbate in the bulk solution at
constant temperature. Specific coefficient Kd (L/g TSS) is a frequently used characteristic
value for the evaluation of the sorption behaviour. This distribution coefficient is defined
as the ratio of equilibrium concentrations of a test substance in a two phase system
consisting of an adsorbent and an aqueous phase and can be calculated with Eq. (5-4):
(5-4)
In this study the equilibrium sorption isotherms of MCs on the biomass using linear
and Freundlich isotherm models were studied. Detailed calculation method and models
were discussed in a previously published paper by authors (Banihashemi and Droste,
2014).
P a g e | 173
The kinetic models parameters were estimated by regression analysis method using
excel software. The pseudo-first-order chemical sorption is described by Eq. (5-5)
(Lagergren, 1898; Qiu et al., 2009)
( ) (5-5)
where k1 is the equilibrium rate constant of pseudo-first-order (L h−1
), qe (µg g−1
) the
amount of MCs sorbed at equilibrium qt (µg g−1
) is the amount of MCs sorbed at any
time. This model is based on the assumption that the rate is proportional to the number of
free sites. By Integrating Eq. (5-5) with boundary conditions qt = 0 at t = 0 and qt = qt at t
= t gives Eq. (5-6) as follows:
( ) (5-6)
The values of k1 and qe are obtained from the slope and intercept of the plot of ln (qe
−qt) versus t, respectively. For the rate constant of pseudo-second-order chemical
sorption, Eq. (7) has been also applied (Ho and McKay, 1999)
( )
(5-7)
where k2 (g/µg.h) is the equilibrium rate constant of pseudo-second-order, qe (µg/g) is
the amount of MCs sorbed at equilibrium, qt is the amount of MCs sorbed at time t
(µg/g). After integration and rearrangement using boundary conditions (qt = 0 at t = 0 and
qt = qt at t = t) Eq. (5-7) becomes:
(5-8)

P a g e | 174
The values of k2 and qe are obtained from the slope and intercept of the plot of 1/qt
versus t, respectively.
The intra-particle diffusion model describes adsorption processes, where the rate of
adsorption depends on the speed at which adsorbate diffuses towards adsorbent (i.e., the
process is diffusion-controlled), which is presented by Eq. (5-9).
(5-9)
where, k3 is the rate constant of the intra-particle transport (µg/g.h) and c is the
intercept (Weber and Chakravo.Rk, 1974). The intra-particle diffusion model values are
obtained from the slope and intercept of the plot of qt versus t1/2
.
Based on the concentrations in influent, effluent, and biosolids, the total removal rate,
removal rate by sorption and removal rate by biotransformation/biodegradation were
calculated in percentages for all selected MCs. Total removal rate was calculated by the
following equation (5-10):
(5-10)
where Cinf is the influent liquid phase concentration, μg/L; Ceff is the effluent liquid
phase concentration of MC from the reactor, μg/L.
Accumulation of MCs on solids wasted from an AS system is not a real treatment but
nonetheless it is a significant phenomenon that affects the fate of MCs in biotreatment or
throughout an AS process. Therefore, at the steady state and equilibrium state condition
the sorption to the daily wasted sludge was calculated by Eq. (5-11):

P a g e | 175
(5-11)
where CBiosolids is the MCs concentration in the solid phase, µg/g; MLTSS, g/L; Qwasted is
the volume of sludge wasted per day, L/d; Qinf is the influent flow-rate, L/d.
Target MCs are considered thermodynamically stable and relatively non-volatile,
while photodegradation was prohibited by experimental condition used, therefore by
writing the mass balance around the reactors, the amount of MCs biotransformed /
biodegraded in simulated AS was calculated by the following Eq. (5-12):
( ) ( ) ( ) (5-12)
where Mb is the mass of biotransformed MCs (µg/day) and Qin and Qeff are the
influent and effluent flow-rate (L/d).
5.2.7 Statistical analysis
Statistical data analyses were conducted to determine if the data collected for removal
of targeted MCs were statistically different in selected operational conditions. Three null
hypotheses were stated for statistical testing; no statistically difference exists between the
removal rates of selected MCs in reactors operating at different SRTs and HRTs and no
significant interaction, no statistically difference between the removal rates of selected
MCs in reactors operating at different SRTs but at the same HRT, and finally no
statistically difference between the removal rates of selected MCs in reactors with or
without AOB inhibition at HRT of four hours. The percentage removal data for each

P a g e | 176
operational condition were tested for normality using the Anderson-Darling test before
evaluating the null hypotheses. One-way and two-ways analysis of variance (ANOVA)
were used to evaluate these null hypotheses at the 5% significance level (P-value = 0.05).
In those cases where the null hypotheses was rejected, multiple comparison tests, Tukey,
were performed to test the two tailed null hypotheses of all possible combinations of
sample means obtained in the test and determine which are significantly different from
which others. In these cases the P-values (significant) showed how significantly different
the factors in each group were and statistically significant difference were defined as
those with P-values less than or equal to 0.05.
5.3 Results and Discussion
5.3.1 Sorption to inactive AS
Plots of adsorbed BPA, TCS, and EE2 on the inactivated sludge versus time for three
MLSS concentrations of 3750, 2940, and 1855 mg TSS/L at room temperature are shown
in Figure 5-5. The selected MCs showed a great tendency to sorb into the biomass in the
first 30 min, followed by slow sorption reaction up to the equilibrium time which is in
agreement with the result reported in the literature for BPA sorption to sludge at
relatively higher initial concentration (Seyhi et al., 2011).. The contact times necessary to
reach equilibrium between solid and liquid phases were found to be 2, 4, and 6 hours for
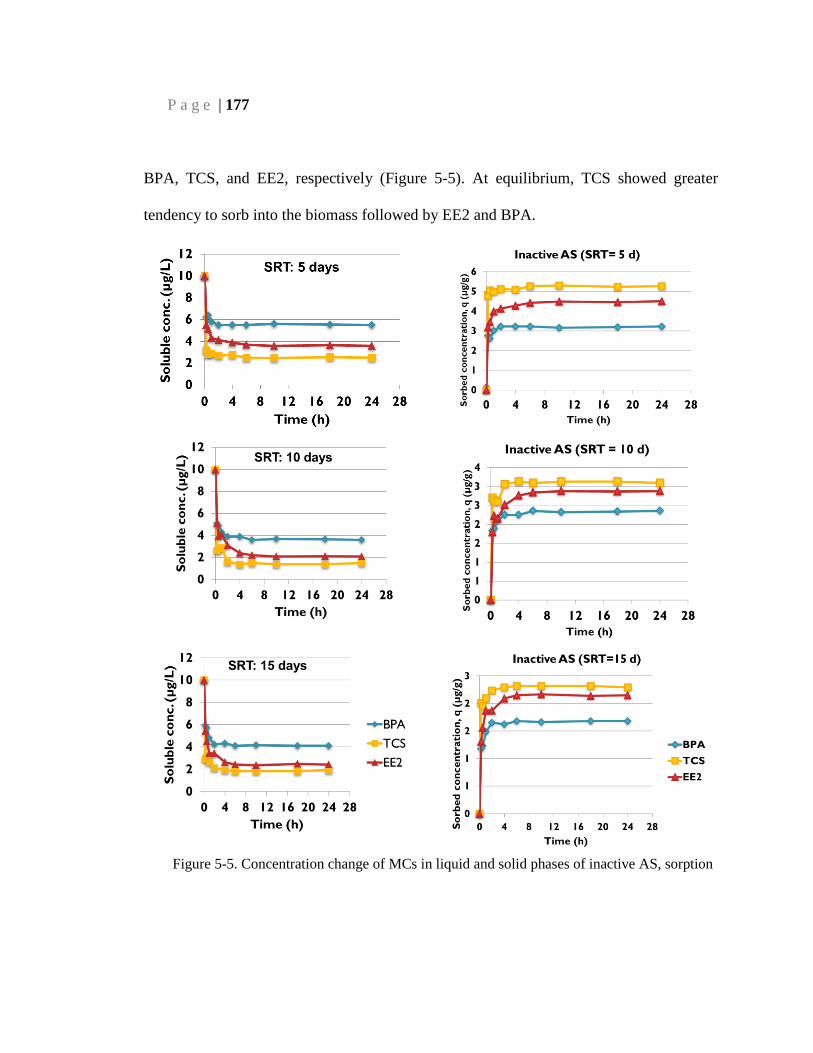
P a g e | 177
BPA, TCS, and EE2, respectively (Figure 5-5). At equilibrium, TCS showed greater
tendency to sorb into the biomass followed by EE2 and BPA.
Figure 5-5. Concentration change of MCs in liquid and solid phases of inactive AS, sorption
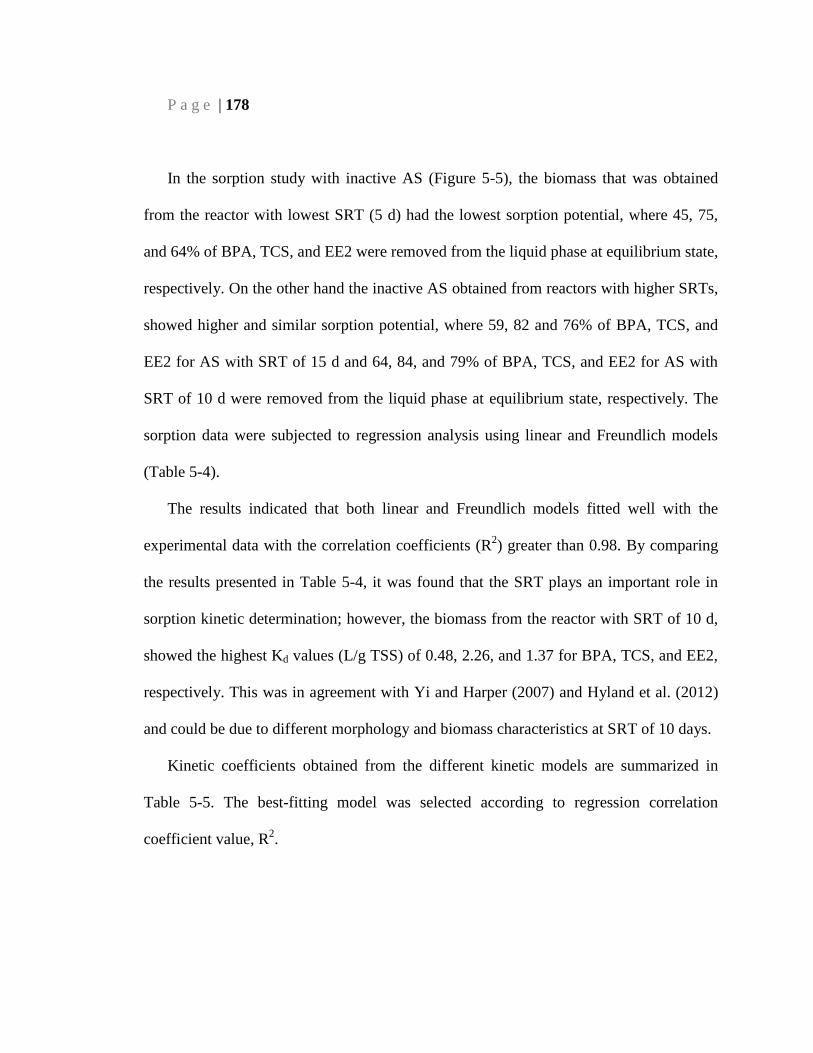
P a g e | 178
In the sorption study with inactive AS (Figure 5-5), the biomass that was obtained
from the reactor with lowest SRT (5 d) had the lowest sorption potential, where 45, 75,
and 64% of BPA, TCS, and EE2 were removed from the liquid phase at equilibrium state,
respectively. On the other hand the inactive AS obtained from reactors with higher SRTs,
showed higher and similar sorption potential, where 59, 82 and 76% of BPA, TCS, and
EE2 for AS with SRT of 15 d and 64, 84, and 79% of BPA, TCS, and EE2 for AS with
SRT of 10 d were removed from the liquid phase at equilibrium state, respectively. The
sorption data were subjected to regression analysis using linear and Freundlich models
(Table 5-4).
The results indicated that both linear and Freundlich models fitted well with the
experimental data with the correlation coefficients (R2) greater than 0.98. By comparing
the results presented in Table 5-4, it was found that the SRT plays an important role in
sorption kinetic determination; however, the biomass from the reactor with SRT of 10 d,
showed the highest Kd values (L/g TSS) of 0.48, 2.26, and 1.37 for BPA, TCS, and EE2,
respectively. This was in agreement with Yi and Harper (2007) and Hyland et al. (2012)
and could be due to different morphology and biomass characteristics at SRT of 10 days.
Kinetic coefficients obtained from the different kinetic models are summarized in
Table 5-5. The best-fitting model was selected according to regression correlation
coefficient value, R2.
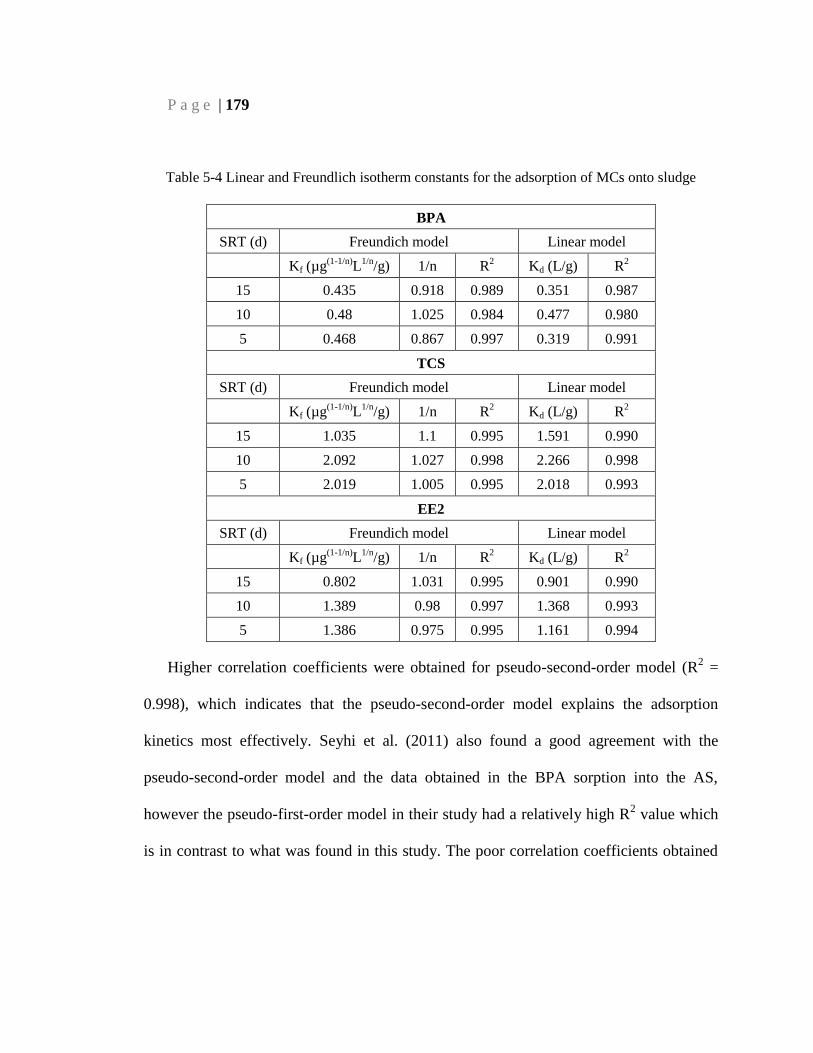
P a g e | 179
Table 5-4 Linear and Freundlich isotherm constants for the adsorption of MCs onto sludge
BPA
SRT (d) Freundich model Linear model
Kf (µg
(1-1/n)L
1/n/g) 1/n R
2 Kd (L/g) R
2
15 0.435 0.918 0.989 0.351 0.987
10 0.48 1.025 0.984 0.477 0.980
5 0.468 0.867 0.997 0.319 0.991
TCS
SRT (d) Freundich model Linear model
Kf (µg
(1-1/n)L
1/n/g) 1/n R
2 Kd (L/g) R
2
15 1.035 1.1 0.995 1.591 0.990
10 2.092 1.027 0.998 2.266 0.998
5 2.019 1.005 0.995 2.018 0.993
EE2
SRT (d) Freundich model Linear model
Kf (µg
(1-1/n)L
1/n/g) 1/n R
2 Kd (L/g) R
2
15 0.802 1.031 0.995 0.901 0.990
10 1.389 0.98 0.997 1.368 0.993
5 1.386 0.975 0.995 1.161 0.994
Higher correlation coefficients were obtained for pseudo-second-order model (R2 =
0.998), which indicates that the pseudo-second-order model explains the adsorption
kinetics most effectively. Seyhi et al. (2011) also found a good agreement with the
pseudo-second-order model and the data obtained in the BPA sorption into the AS,
however the pseudo-first-order model in their study had a relatively high R2 value which
is in contrast to what was found in this study. The poor correlation coefficients obtained
P a g e | 180
for the pseudo-first-order model could be explained by the assumption of this model that
the rate is proportional to the number of free sites on the sludge.
Table 5-5 Summery of sorption kinetic coefficients evaluated by different kinetic models
BPA
SRT (days) Pseudo-first-order Pseudo-Second-order Intra-particle diffusion
k1 (L/h) R2 k2 (g/µg.h) R
2 k3 (µg/g.h) R
2
15 0.1 0.190 0.311 0.999 0.106 0.704
10 0.146 0.640 0.422 0.998 0.108 0.650
5 0.165 0.690 0.589 0.997 0.098 0.435
TRI
SRT (days) Pseudo-first-order Pseudo-Second-order Intra-particle diffusion
k1 (L/h) R2 k2 (g/µg.h) R
2 k3 (µg/g.h) R
2
15 0.001 0.450 0.189 0.999 0.071 0.599
10 0.124 0.310 0.320 0.998 0.111 0.540
5 0.11 0.380 0.433 0.999 0.084 0.620
EE2
SRT (days) Pseudo-first-order Pseudo-Second-order Intra-particle diffusion
k1 (L/h) R2 k2 (g/µg.h) R
2 k3 (µg/g.h) R
2
15 0.186 0.800 0.221 0.998 0.153 0.611
10 0.189 0.740 0.344 0.995 0.211 0.682
5 0.145 0.490 0.462 0.997 0.250 0.650
P a g e | 181
5.3.2 Continuous-flow experiments
Operation of activated sludge systems
Performance of reactors was evaluated by measuring the removal of total COD
(tCOD), soluble COD (sCOD), TN, TKN, NH4-N, NO3-N, TSS and VSS from simulated
AS reactors. Significant removal of tCOD (average COD removal > 95%) and SS
clarification (average VSSeff < 3 mg/ L) was achieved in all AS systems operating at HRT
of 6 h and various SRTs, during acclimatization period (Phase A). MLVSS concentration
increased with increase of SRT, reaching values of 1666, 2518, and 3566 mg/L for
reactors operating at SRT of 5, 10 and 15 d, respectively. Almost complete nitrification
was observed in phase A, with mean removal rates of more than 95% and 85% for
ammonia and TKN, respectively, in all three reactors. This result indicates that the
preferable environment and sufficient AOB are present in all reactors to perform
nitrification even in the reactor operating at lower SRT.
COD removal and nitrification were also monitored following the addition of MCs
and a small deterioration of AS systems performance was noticed in the presence of the
selected MCs (Figure 5-6); however; no significant variations of the MLVSS were
observed prior and after spiking reactors with MCs.
It was observed that the COD removal in all three reactors was increased gradually as
biomass was acclimated to the MCs indicating gradual biomass acclimatization to MCs
and system’s recovery. However; even after acclimation period, the COD removal was
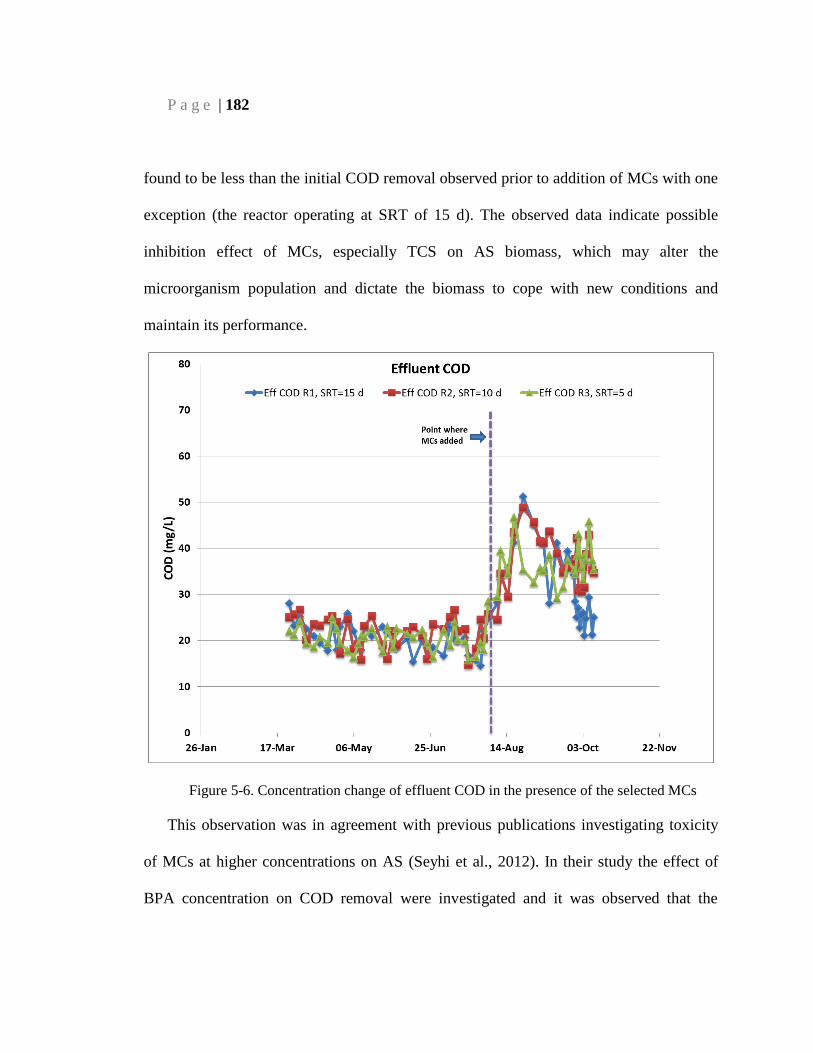
P a g e | 182
found to be less than the initial COD removal observed prior to addition of MCs with one
exception (the reactor operating at SRT of 15 d). The observed data indicate possible
inhibition effect of MCs, especially TCS on AS biomass, which may alter the
microorganism population and dictate the biomass to cope with new conditions and
maintain its performance.
Figure 5-6. Concentration change of effluent COD in the presence of the selected MCs
This observation was in agreement with previous publications investigating toxicity
of MCs at higher concentrations on AS (Seyhi et al., 2012). In their study the effect of
BPA concentration on COD removal were investigated and it was observed that the
P a g e | 183
higher concentration of BPA (5 mg/L) decreased the performance of the AS system,
however for lower BPA concentration (0-1 mg/L) the COD removal was decreased after
introducing BPA followed by a gradual increase as biomass acclimated to the BPA. It
was found that TCS could also be harmful to AS bacteria at concentration more than 1.82
mg/L (Neumegen et al., 2005) and to nitrifying bacteria at concentration as low as 500
µg/L (Stasinakis et al., 2007). Pasquini et al. (2013) also reported that TCS altered the
bacterial growth at concentrations measured in wastewater by investigating the toxicity of
TCS on E. coli and comparing EPS production in reactors with and without MCs
addition. In contrast, other studies reported no deterioration of AS systems performance
in the presence of TCS at low µg/L concentration (Federle et al., 2002; Stasinakis et al.,
2010). Performance of simulated AS systems was also evaluated in this study. The data
obtained at steady state from the nine experimental runs are summarized in Table 6.
Higher removal efficiency was observed for COD and ammonia in the reactor operating
at SRT of 15 d and lowest removal rate was found in the reactor operating at HRT of 4 h
and SRT of 5 d.

P a g e | 184
Table 5-6 Comparison of biological performance of experimental runs
Runs Phase B Phase C Phase D
1 2 3 4 5 6 7 8 9 Parameter Unit
Q L/d 11.22 ± 0.6
12.52 ± 0.8
11.5 ± 1.0
7.2 ± 0.8
7.15 ± 0.4
7.13 ± 0.2
18.6 ± 0.5
17.85 ± 1.1
18.23 ± 0.4
HRT h 6 6 6 10 10 10 4 4 4
SRT d 5 10 15 5 10 15 5 10 15
MLTSS mg/L 1677 ± 137
2935 ± 133
4005 ± 171
1188 ± 129
1805 ± 119
2498 ± 142
2774 ± 287
4440 ± 152
5965 ± 229
MLVSS mg/L 1563 ± 130
2685 ± 121
3601 ± 149
1112 ± 127
1681 ± 136
2302 ± 138
2571 ± 261
4085 ± 158
5335 ± 205
tCODreactor mg/L 1976 ± 275
3556 ± 240
4962 ± 419
1398 ± 164
2093 ± 247
2920 ± 158
3322 ± 300
5347 ± 256
7007 ± 481
sCODreactor mg/L 41.2 ± 2.4
38.2 ± 3.6
33.3 ± 4.1
36.8 ± 2.8
27.4 ± 2.1
28.8 ± 3.3
52.2 ± 1.9
46.3 ± 3.4
28.1 ± 4.8
COD eff mg/L 37.7 ± 3.4
35.6 ± 4
25.9 ± 3.5
34.8 ± 3.3
24.3 ± 1.7
23.5 ± 2.4
46.1 ± 6.7
40 ± 6.9
24.8 ± 5.6
VSS eff mg/L 2.8 ± 1.3
2.7 ± 1
3 ± 1.1
2.8 ± 1 3.2 ± 0.7
3.1 ± 1.5
2.8 ± 1 3.2 ± 0.7
3.1 ± 1.5
TN-N eff mg/L 36.7 ± 1.1
36.8 ± 3.1
35.6 ± 2.5
35.8 ± 2.9
35.4 ± 1.5
36.3 ± 2.1
36.4 ± 0.57
36.5 ± 1.36
36.3 ± 0.33
TKN-N eff mg/L 5.2 ± 0.8
4.6 ± 0.3
5.4 ± 0.4
7.6 ± 1.59
6.4 ± 0.29
3.16 ± 1.8
6.38 ± 0.86
7.37 ± 0.6
2.94 ± 0.5
NH4-N eff mg/L 0.64 ± 0.1
0.43 ± 0.1
0.01 ± 0.01
3.27 ± 0.84
0.62 ± 0.31
0.14 ± 0.08
0.17 ± 0.13
0.83 ± 0.55
0.28 ± 0.16
NO3-N eff mg/L 30.6 ± 3
31.7 ± 4.4
29.4 ± 3.3
29.8 ± 2.26
30.56 ± 2.6
33.18 ± 1.89
30.04 ± 0.91
29.15 ± 1.69
33.46 ± 0.63
pH reactor N/A 7.21 ± 0.3
6.92 ± 0.4
7.02 ± 0.2
7.52 ± 0.44
6.88 ± 0.21
6.9 ± 0.3
7.33 ± 0.2
7.14 ± 0.15
7.29 ± 0.31
Tempreactor °C 25 ± 0.3
25 ± 0.7
25 ± 0.6
25 ± 0.4
25 ± 0.1
25 ± 0.6
25 ± 0.2
25 ± 0.5
25 ± 0.8
The concentrations are given as the mean values (n = 27) ± the standard deviation, measured in the period of two weeks
Fate of selected MCs in simulated activated sludge process
The concentrations of MCs in the effluent of the control reactor were monitored prior
to introducing MCs into AS reactors. The results showed no abiotic losses for BPA and
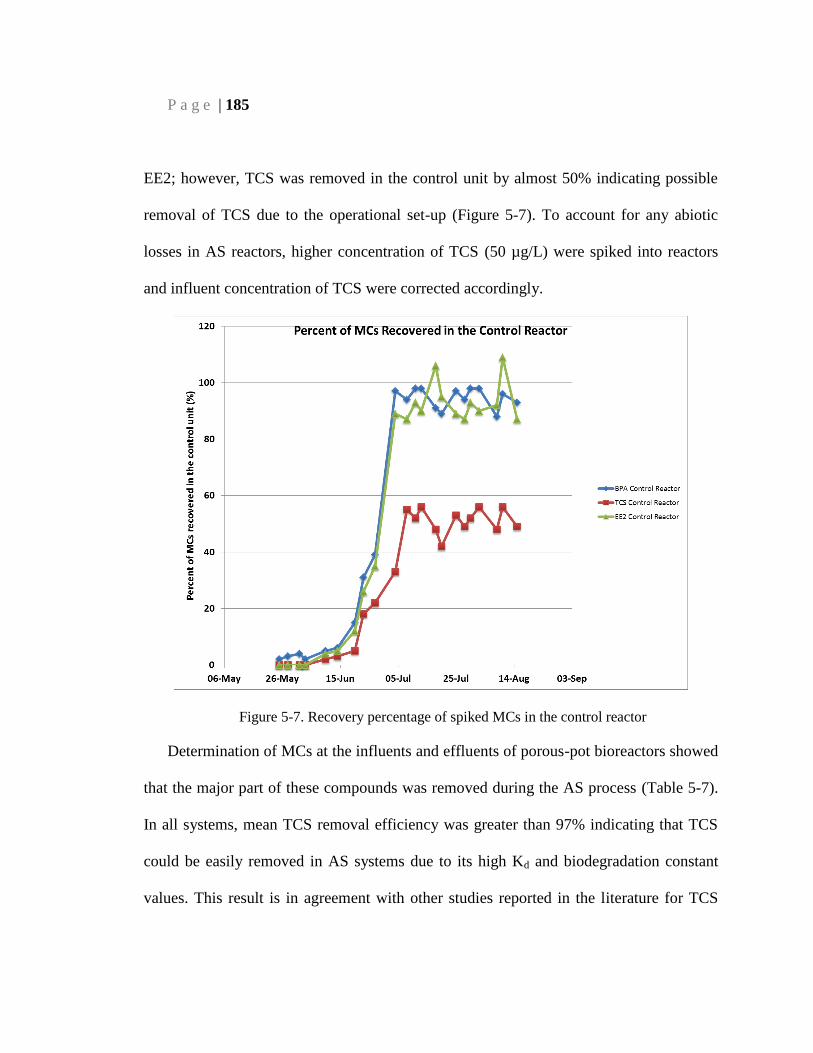
P a g e | 185
EE2; however, TCS was removed in the control unit by almost 50% indicating possible
removal of TCS due to the operational set-up (Figure 5-7). To account for any abiotic
losses in AS reactors, higher concentration of TCS (50 µg/L) were spiked into reactors
and influent concentration of TCS were corrected accordingly.
Figure 5-7. Recovery percentage of spiked MCs in the control reactor
Determination of MCs at the influents and effluents of porous-pot bioreactors showed
that the major part of these compounds was removed during the AS process (Table 5-7).
In all systems, mean TCS removal efficiency was greater than 97% indicating that TCS
could be easily removed in AS systems due to its high Kd and biodegradation constant
values. This result is in agreement with other studies reported in the literature for TCS
P a g e | 186
removal in lab-scale AS (Stasinakis et al., 2010) and full-scale AS (Heidler and Halden,
2007; Lozano et al., 2013; Pasquini et al., 2014). The overall removal efficiency of BPA
ranged between 90 and 98%, where the highest removal rate was observed in reactor
operating at SRT of 15 d and HRT of 10 h and the lowest removal rate were found at
HRT of 4 h and SRTs of 5 and 10 d (Table 5-7). In previous studies investigating the
BPA removal in AS systems removal rates fell in the range of 70-98% (Fernandez et al.,
2007; Mohapatra et al., 2011; Seyhi et al., 2012; Zhao et al., 2008).
In this study a wide range of EE2 removal rate was observed in reactors operating at
different HRTs and SRTs. The removal rate for EE2 were in range of 63% at SRT of 5 d
and HRT of 4 h to as high as 91% in reactor operating at SRT of 15 d and HRT of 10 h
(Table 5-7). EE2 removal rates in WWTPs have been investigated in the literature and
fell in the range of 34 to 98% (Cicek et al., 2007; Clouzot et al., 2008; Larcher and
Yargeau, 2013; Miège et al., 2009). Furthermore, lab-scale studies reported contradictory
results regarding the biological degradation of EE2 by conventional AS systems, varying
from complete removal (Hashimoto and Murakami, 2009) to none at all (Weber et al.,
2005).
To investigate the fate of the selected MCs in AS system, the mass balance analysis
was performed for each compound and total MCs mass fluxes were determined using
Eqs. (5-11 and 5-12). The result of mass balance analysis (Figures 5-8, 5-9, and 5-10)
showed high biodegradation or biotransformation potential of selected MCs.
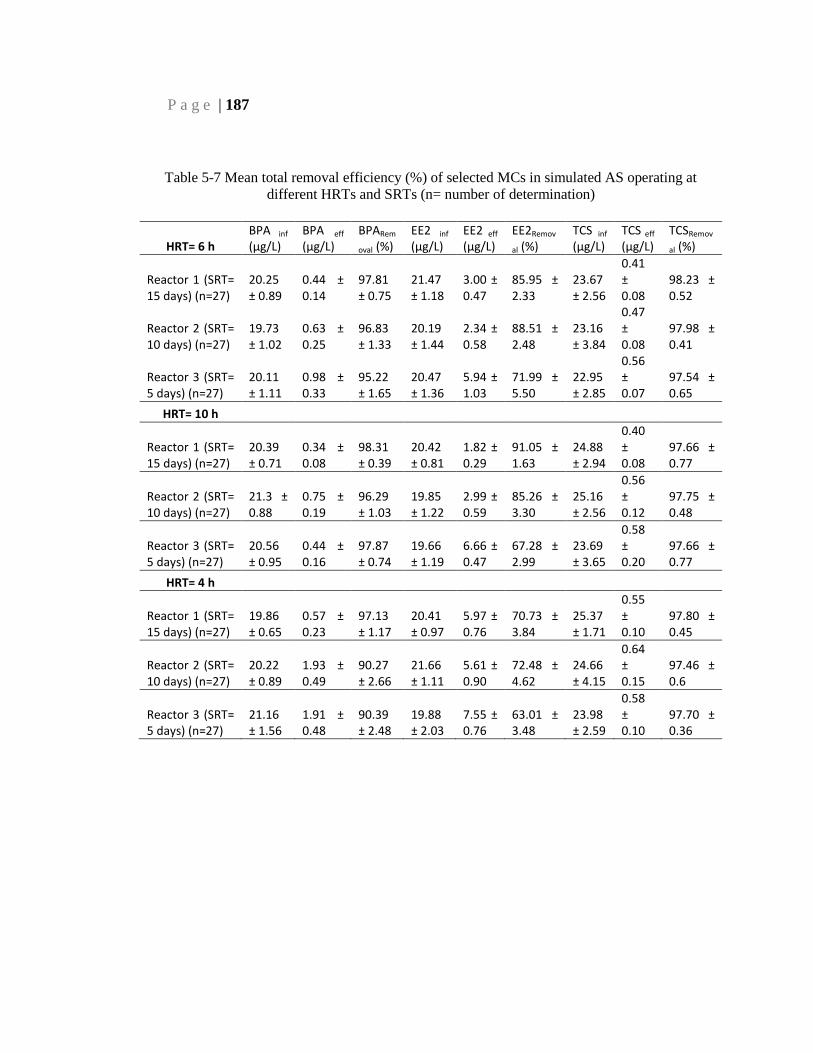
P a g e | 187
Table 5-7 Mean total removal efficiency (%) of selected MCs in simulated AS operating at
different HRTs and SRTs (n= number of determination)
HRT= 6 h BPA inf (µg/L)
BPA eff (µg/L)
BPARem
oval (%) EE2 inf (µg/L)
EE2 eff (µg/L)
EE2Remov
al (%) TCS inf (µg/L)
TCS eff (µg/L)
TCSRemov
al (%)
Reactor 1 (SRT= 15 days) (n=27)
20.25 ± 0.89
0.44 ± 0.14
97.81 ± 0.75
21.47 ± 1.18
3.00 ± 0.47
85.95 ± 2.33
23.67 ± 2.56
0.41 ± 0.08
98.23 ± 0.52
Reactor 2 (SRT= 10 days) (n=27)
19.73 ± 1.02
0.63 ± 0.25
96.83 ± 1.33
20.19 ± 1.44
2.34 ± 0.58
88.51 ± 2.48
23.16 ± 3.84
0.47 ± 0.08
97.98 ± 0.41
Reactor 3 (SRT= 5 days) (n=27)
20.11 ± 1.11
0.98 ± 0.33
95.22 ± 1.65
20.47 ± 1.36
5.94 ± 1.03
71.99 ± 5.50
22.95 ± 2.85
0.56 ± 0.07
97.54 ± 0.65
HRT= 10 h
Reactor 1 (SRT= 15 days) (n=27)
20.39 ± 0.71
0.34 ± 0.08
98.31 ± 0.39
20.42 ± 0.81
1.82 ± 0.29
91.05 ± 1.63
24.88 ± 2.94
0.40 ± 0.08
97.66 ± 0.77
Reactor 2 (SRT= 10 days) (n=27)
21.3 ± 0.88
0.75 ± 0.19
96.29 ± 1.03
19.85 ± 1.22
2.99 ± 0.59
85.26 ± 3.30
25.16 ± 2.56
0.56 ± 0.12
97.75 ± 0.48
Reactor 3 (SRT= 5 days) (n=27)
20.56 ± 0.95
0.44 ± 0.16
97.87 ± 0.74
19.66 ± 1.19
6.66 ± 0.47
67.28 ± 2.99
23.69 ± 3.65
0.58 ± 0.20
97.66 ± 0.77
HRT= 4 h
Reactor 1 (SRT= 15 days) (n=27)
19.86 ± 0.65
0.57 ± 0.23
97.13 ± 1.17
20.41 ± 0.97
5.97 ± 0.76
70.73 ± 3.84
25.37 ± 1.71
0.55 ± 0.10
97.80 ± 0.45
Reactor 2 (SRT= 10 days) (n=27)
20.22 ± 0.89
1.93 ± 0.49
90.27 ± 2.66
21.66 ± 1.11
5.61 ± 0.90
72.48 ± 4.62
24.66 ± 4.15
0.64 ± 0.15
97.46 ± 0.6
Reactor 3 (SRT= 5 days) (n=27)
21.16 ± 1.56
1.91 ± 0.48
90.39 ± 2.48
19.88 ± 2.03
7.55 ± 0.76
63.01 ± 3.48
23.98 ± 2.59
0.58 ± 0.10
97.70 ± 0.36

P a g e | 188
Figure 5-8. Mass balances (%) of the target MCs in continuous-flow AS systems operating at
HRT of 6 h. Standard deviations are presented in parenthesis
Figure 5-9. Mass balances (%) of the MCs in continuous-flow AS systems operating at
HRT=10 h
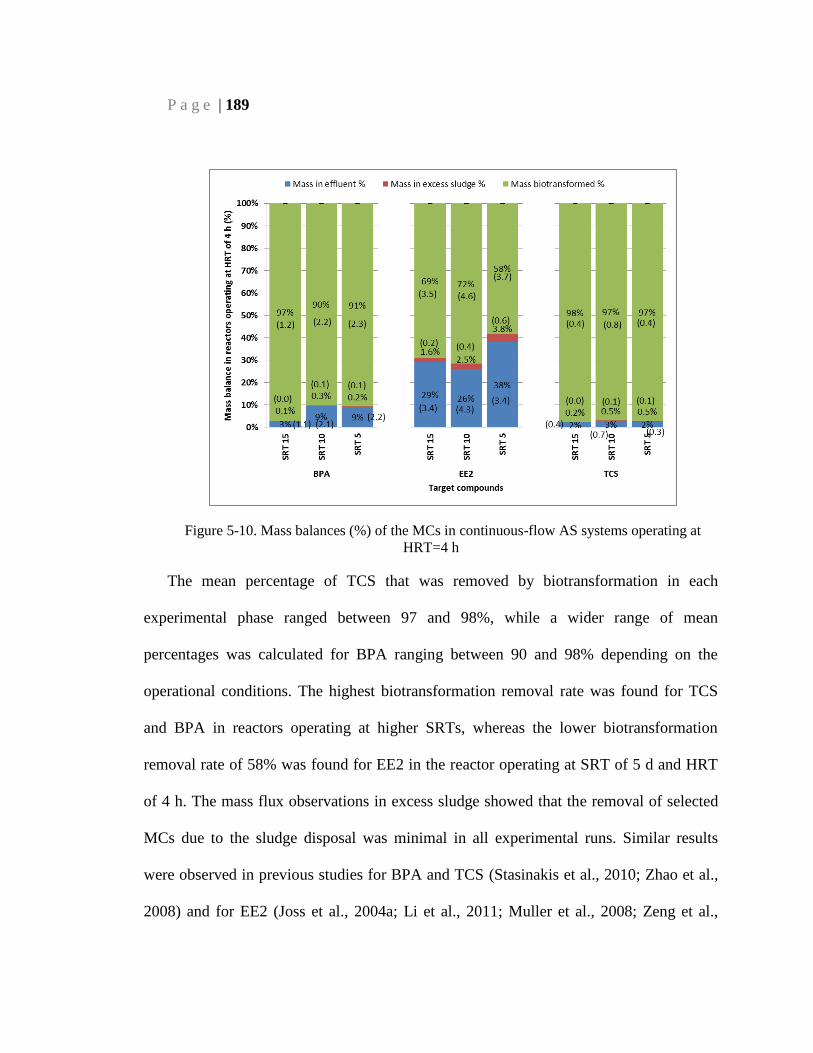
P a g e | 189
Figure 5-10. Mass balances (%) of the MCs in continuous-flow AS systems operating at
HRT=4 h
The mean percentage of TCS that was removed by biotransformation in each
experimental phase ranged between 97 and 98%, while a wider range of mean
percentages was calculated for BPA ranging between 90 and 98% depending on the
operational conditions. The highest biotransformation removal rate was found for TCS
and BPA in reactors operating at higher SRTs, whereas the lower biotransformation
removal rate of 58% was found for EE2 in the reactor operating at SRT of 5 d and HRT
of 4 h. The mass flux observations in excess sludge showed that the removal of selected
MCs due to the sludge disposal was minimal in all experimental runs. Similar results
were observed in previous studies for BPA and TCS (Stasinakis et al., 2010; Zhao et al.,
2008) and for EE2 (Joss et al., 2004a; Li et al., 2011; Muller et al., 2008; Zeng et al.,

P a g e | 190
2013). In contrast, some researchers found higher removal of TCS in full-scale AS
systems due to sorption on the SS (Heidler and Halden, 2007; Nakada et al., 2010). Other
researchers also suggested that the sorption of EE2 and TCS onto AS particles might also
be an important removal pathway in WWTP due to its nonpolar behaviour and
hydrophobic properties (Zhou et al., 2010). However, by comparing the results of lab-
scale and full-scale AS with and without primary clarification, the higher sorption
removal in full scale AS could be due to the sorption of selected MCs in primary
clarifiers (Heidler and Halden, 2007; Stasinakis et al., 2007) and the high volume of
excess sludge in full-scale AS systems.
Statistical evaluation of the data reported in Table 5-7, using two-way ANOVA,
showed that there were significant statistical differences at a 95% confidence level for
mean MCs removal efficiency at different SRT and HRT values. Because there are two
different explanatory variables (HRT and SRT) the effects on the outcome of a change in
one variable may depend on the specific value of the other variable (interaction model).
The result of interaction model (Table 5-8) showed the existence of the interaction
between two explanatory variables (P-value of HRT×SRT < 0.05) indicating that some
changes in both HRT and SRT must have an effect on the outcome.
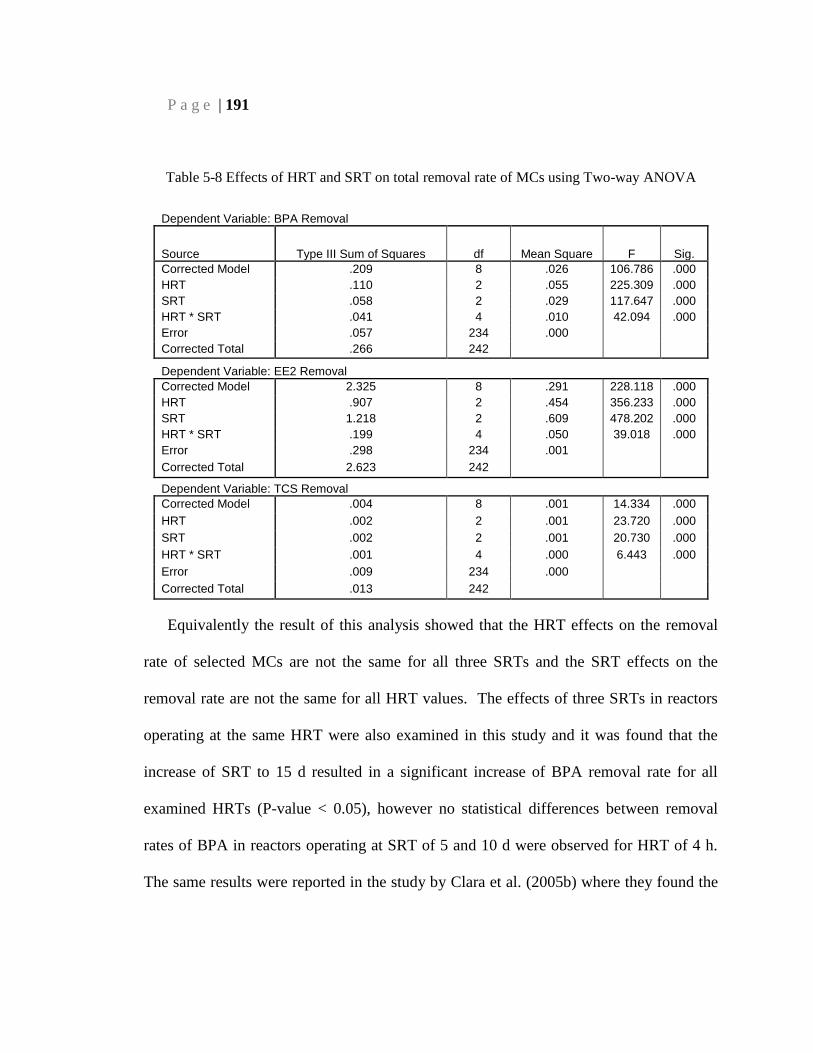
P a g e | 191
Table 5-8 Effects of HRT and SRT on total removal rate of MCs using Two-way ANOVA
Dependent Variable: BPA Removal
Source Type III Sum of Squares df Mean Square F Sig.
Corrected Model .209 8 .026 106.786 .000
HRT .110 2 .055 225.309 .000
SRT .058 2 .029 117.647 .000
HRT * SRT .041 4 .010 42.094 .000
Error .057 234 .000
Corrected Total .266 242
Dependent Variable: EE2 Removal
Corrected Model 2.325 8 .291 228.118 .000
HRT .907 2 .454 356.233 .000
SRT 1.218 2 .609 478.202 .000
HRT * SRT .199 4 .050 39.018 .000
Error .298 234 .001
Corrected Total 2.623 242
Dependent Variable: TCS Removal
Corrected Model .004 8 .001 14.334 .000
HRT .002 2 .001 23.720 .000
SRT .002 2 .001 20.730 .000
HRT * SRT .001 4 .000 6.443 .000
Error .009 234 .000
Corrected Total .013 242
Equivalently the result of this analysis showed that the HRT effects on the removal
rate of selected MCs are not the same for all three SRTs and the SRT effects on the
removal rate are not the same for all HRT values. The effects of three SRTs in reactors
operating at the same HRT were also examined in this study and it was found that the
increase of SRT to 15 d resulted in a significant increase of BPA removal rate for all
examined HRTs (P-value < 0.05), however no statistical differences between removal
rates of BPA in reactors operating at SRT of 5 and 10 d were observed for HRT of 4 h.
The same results were reported in the study by Clara et al. (2005b) where they found the
P a g e | 192
critical SRT of 10 days is required for removal of BPA. Regarding TCS, increase of SRT
to 15 d resulted to a slight but significant increase of TCS removal (P-value <0.05)
compared to that obtained at SRT of 10 and 5 d, respectively, which is in agreement with
other lab-scale study on the fate of TCS in AS system (Stasinakis et al., 2010). The
results also showed a significant increase of EE2 removal rate when SRT increased from
5 to 15 d; however, for reactors operating at HRT of 4 h, no statistical differences were
observed for removal rate in reactors operating at SRT of 10 and 15 d. Koh et al. (2009)
also found similar results and suggested higher EE2 biodegradation (>70%) at SRTs of
10-20 d and more than 80% biodegradation when SRT increased to over 20 d. Other
studies also support the influence of the SRT on removal of EE2 and found that EE2
removal efficiencies varied from 60 to 80% within an SRT range of 5 to 12 days, and
from 25 to 70% within an SRT range of 20 to 42 days (Kreuzinger et al., 2004; Ziels et
al., 2014).
Moreover, the statistical analysis for the effect of HRT on removal efficiency of the
selected MCs, showed high removal efficiency of MCs when HRT increased from 4 to 10
h for all experimental runs. However, increasing the HRT from 6 to 10 h did not improve
the EE2 removal efficiency significantly and it even decreases the removal efficiency of
TCS. These results are in agreement with previous studied that showed high removal
efficiency of MCs at higher HRT values (Gros et al., 2007; Kirk et al., 2002). Gros et al.
P a g e | 193
(2010) and García-Galán et al. (2011) also reported better removal efficiency for MCs
with a half-life lower than the operational HRT.
In terms of MCc sorption to the AS, the result of mass balance analysis indicated that
the highest sorption achieved at reactor operating at the lowest SRT of 5 d and HRT of 4
h.
The one-way ANOVA multi comparison analysis on the removal efficiency of all
experimental runs showed that the highest BPA removal efficiency achieved at reactor
with HRTs of 4, 6, and 10 h and SRT of 15 d, the highest EE2 removal efficiency
achieved at reactor with HRT of 4 h, SRT of 15 d and HRT of 6 h and SRT of 10 d, while
highest TCS removal occurred in reactor operating at HRT of 6 h, SRT of 10 and 15 d
and HRT of 10 h and SRT of 15 d. By comparing the physico-chemical properties of
selected MCs and possible factors affecting their fate in AS system with aforementioned
results, it was found that the fate of selected MCs could not be predicted solely by
considering their physico-chemical properties and treatment operational conditions and
sludge type would play an important role in the fate of these compounds.
MCs removal by heterotrophs vs. nitrifiers
So far, it has been found that higher SRT values promote the establishment of a more
diverse microbial population, as well as enrichment of slower growing microorganisms
that could have a greater capacity for removing MCs (Verlicchi et al., 2012). However
the fluctuating removal efficiencies found with increasing the SRT and the controversial
P a g e | 194
conclusions on the role of autotrophs on MCs biodegradation in AS systems (Larcher and
Yargeau, 2013; Zhou and Oleszkiewicz, 2010) illustrate the importance of
microorganism determination responsible for biotransformation of selected MCs.
To investigate the roles of both heterotrophs and nitrifiers in MCs biotransformation,
nitrification inhibitors (ATU) was added at concentration of 10 mg/L to simulated AS
system operating at HRT of 4 h and various SRT (end of phase D). After adding ATU,
the NH4-N, NO3-N, TKN, TN and COD concentrations were monitored to evaluate the
effectiveness of nitrification inhibition. The ammonia concentration was increased
significantly in the effluent of AS systems and reached the steady concentration of 37.17
± 3.01 in four days, where TKN and TN concentrations were 38.53 ± 2.56 and 38.97 ±
2.68 mg/L, respectively. COD concentrations after and prior to presence of ATU were
also monitored to determine whether ATU had an inhibitory effect on heterotrophic
biomass. No deterioration of effluent COD was found when inhibitor was added,
indicating that ATU only selectively inhibited nitrifiers, whereas heterotrophic biomass
were still active in the reactor (data not shown).
The result of total removal efficiency of MCs with and without the nitrification
inhibitor are shown in Figure 5-11 and Table 5-9, from which it could be seen that EE2
removal efficiencies increased after ATU addition in all three reactors operating at
different SRTs. Lower BPA removal rate was also observed in the absence of ammonia
inhibitor in reactors operating at SRTs of 5 and 10 d; however, removal efficiency of

P a g e | 195
BPA was lower in the presence of ATU. No significant differences were found for
removal of TCS in reactors operating at SRTs of 5 and 15 d.
In both nitrification-inhibited and uninhibited AS systems, nearly all the TCS was
transformed meaning that heterotrophs were most likely responsible for the degradation
of TCS, which agrees with the study by Lee do et al. (2012). Significantly different EE2
removals (P-value < 0.05) were found in this study which could support the hypothesis
that the majority of the EE2 removals were apparent where only heterotrophs were active.
Figure 5-11. Total removal of selected MCs with and without ATU inhibitor in continuous-
flow AS systems operating at different SRTs

P a g e | 196
Table 5-9 The effect of nitrification inhibition on total removal rate of MCs using two-way
ANOVA (the inhibition factor was presented as 01 and 00 for presence and absence of ATU)
EE2.HRT4.Removal
HRT4SRT.Inhibition N
Subset for alpha = 0.05
1 2 3 4
5.00 27
63.00%
15.00 27
70.74%
10.00 27
72.49%
5.01 9 77.12%
15.01 9 79.98%
10.01 9 85.89%
Sig. 1.000 .827 .356 1.000
TCS.HRT4.Removal
10.00 27
97.46%
15.01 9 97.58% 97.58%
5.00 27
97.70% 97.70% 97.70%
15.00 27
97.81% 97.81% 97.81%
10.01 9 98.03% 98.03%
5.01 9 98.21%
Sig. .434 .165 .081
BPA.HRT4.Removal
15.01 9 88.29%
10.00 27
90.27%
5.00 27
90.40%
10.01 9 95.40%
5.01 9 95.95%
15.00 27
97.13%
Sig. .106 .275
Other studies also supports the observations in this study and showed that
heterotrophic bacteria in the AS process have a variety of mono- and di-oxygenase
P a g e | 197
enzymes that can significantly contribute to MCs transformation. (Gaulke et al., 2008;
Racz et al., 2012; Yi and Harper, 2007; Zhou and Oleszkiewicz, 2010; Ziels et al., 2014).
The higher removal efficiency of BPA in the absence of ATU at SRT of 15 d suggests
that AOB might play a role in BPA removal. However further studies using DNA
sequencing technique are preferred to identify of microorganisms prior and after ATU
addition.
5.4 Conclusions
The results of sorption equilibrium study, suggested that that equilibrium was reached
within a few hours between sorbed and dissolved MCs. The analysis of MCs sorption
mechanism revealed that Freundlich sorption isotherms with values of 1/n close to 1 and
pseudo-second-order model best fit the results. Calculation of Freundlich constant, KF
and Kd exhibited the greater tendency of EE2 and TCS for sorption, compared to BPA.
The results of this study indicated that the SRT had a clear effect on the sorption kinetics
where the highest sorption constant was achieved for a SRT of 10 d for all three target
substances. The operation of continuous-flow AS systems in the presence of 20 µg/L of
MCs indicated that 90-98, 63-91 and 97-98% of BPA, EE2 and TCS, respectively, can be
removed during the AS process in systems operating at SRT of 5–15 d and HRT of 4-10
h. Determination of MCs in the dissolved and particulate phase and calculation of their
mass flux showed that biotransformation was the principal removal mechanism of
selected MCs. Statistical analysis revealed that both SRT and HRT had a significant
P a g e | 198
effect on the fate of MCs where highest biotransformation removal rate was found for
TCS and BPA in reactors operating at higher SRTs whereas the lowest rate of 58% was
found for EE2 in the reactor operating at SRT of 5 d and HRT of 4 h. In both
nitrification-inhibited and uninhibited AS systems, nearly all the TCS was transformed
meaning that heterotrophs were most likely responsible for the degradation of TCS. The
majority of the EE2 removals were apparent where only heterotrophs were active. The
higher removal efficiency of BPA in the absence of ATU at SRT of 15 d suggests that
AOB might play a role in BPA removal; however, it was found that heterotrophs were
most likely responsible for the degradation of selected MCs.
By comparing the physico-chemical properties of selected MCs and possible factors
affecting their fate in AS system with aforementioned results, it was found that the fate of
selected MCs could not be predicted solely by considering their physico-chemical
properties. Treatment operational conditions and sludge type would play an important
role in the fate of these compounds. In terms of MCc sorption to the AS, the result of
mass balance analysis indicated that the highest sorption achieved at reactor operating at
lowest SRT of 5 d and HRT of 4 h.
5.5 References
Standard methods for the examination of water and wastewater : 21st edition
Washington, DC: American Public Health Association, 2005.
AIST (Advanced Industrial Science and Technology). AIST Risk Assessment Document
Series No. 4 Bisphenol A. Research Center for Chemical Risk Management,

P a g e | 199
Advanced Industrial Science and Technology Tsukuba West: Tsukuba, Ibaraki,
Japan, 2007.
Andersen HR, Hansen M, Kjolholt J, Stuer-Lauridsen F, Ternes T, Halling-Sorensen B.
Assessment of the importance of sorption for steroid estrogens removal during
activated sludge treatment. Chemosphere 2005; 61: 139-46.
Anderson PD. Endocrine disrupting compounds and implications for wastewater
treatment, 2005.
Ashton D, Hilton M, Thomas KV. Investigating the environmental transport of human
pharmaceuticals to streams in the United Kingdom. Sci Total Environ 2004; 333:
167-84.
Atkinson SK, Marlatt VL, Kimpe LE, Lean DR, Trudeau VL, Blais JM. The occurrence
of steroidal estrogens in south-eastern Ontario wastewater treatment plants. Sci
Total Environ 2012; 430: 119-25.
Ballesteros-Gomez A, Ruiz FJ, Rubio S, Perez-Bendito D. Determination of bisphenols
A and F and their diglycidyl ethers in wastewater and river water by coacervative
extraction and liquid chromatography-fluorimetry. Anal Chim Acta 2007; 603:
51-9.
Banihashemi B, Droste RL. Trace level determination of bisphenol-A in wastewater and
sewage sludge by high-performance liquid chromatography and UV detection.
Water Quality Research Journal of Canada 2013; 48: 133-144.
Banihashemi B, Droste RL. Sorption-desorption and biosorption of bisphenol A,
triclosan, and 17alpha-ethinylestradiol to sewage sludge. Sci Total Environ 2014;
487: 813-21.
Bennie DT, Struger, J.S. Pharmaceuticals and personal care products (PPCP) in Canadian
urban waters: Research and policy directions. Environment Canada, 2008.
Bester K. Triclosan in a sewage treatment process—balances and monitoring data. Water
Research 2003; 37: 3891-3896.
Borrirukwisitsak S, Keenan HE, Gauchotte-Lindsay C. Effects of salinity, pH and
temperature on the octanol-water partition coefficient of bisphenol A.
International Journal of Environmental Science and Development 2012; 3(5):
460-464.
Bouju H, Hommes G, Wintgens T, Malpei F, Corvini PF. The fate of 14C-radiolabelled
diclofenac and 4'-hydroxydiclofenac in membrane bioreactor treatment of
wastewater. Water Sci Technol 2011; 63: 2878-85.
Carballa M, Omil F, Lema JM. Calculation methods to perform mass balances of
micropollutants in sewage treatment plants. application to pharmaceutical and
personal care products (PPCPs). Environ Sci Technol 2007; 41: 884-90.
Chalew TE, Halden RU. Environmental Exposure of Aquatic and Terrestrial Biota to
Triclosan and Triclocarban. J Am Water Works Assoc 2009; 45: 4-13.
P a g e | 200
Cicek N, Londry K, Oleszkiewicz JA, Wong D, Lee Y. Removal of selected natural and
synthetic estrogenic compounds in a Canadian full-scale municipal wastewater
treatment plant. Water Environ Res 2007; 79: 795-800.
Cirja M, Zuehlke S, Ivashechkin P, Hollender J, Schaffer A, Corvini PF. Behavior of two
differently radiolabelled 17alpha-ethinylestradiols continuously applied to a
laboratory-scale membrane bioreactor with adapted industrial activated sludge.
Water Res 2007; 41: 4403-12.
Clara M, Strenn B, Gans O, Martinez E, Kreuzinger N, Kroiss H. Removal of selected
pharmaceuticals, fragrances and endocrine disrupting compounds in a membrane
bioreactor and conventional wastewater treatment plants. Water Res 2005; 39:
4797-807.
Clouzot L, Marrot B, Doumenq P, Roche N. 17α-Ethinylestradiol: An endocrine disrupter
of great concern. Analytical methods and removal processes applied to water
purification. A review. Environmental Progress 2008; 27: 383-396.
Dann AB, Hontela A. Triclosan: environmental exposure, toxicity and mechanisms of
action. J Appl Toxicol 2011; 31: 285-311.
Deblonde T, Cossu-Leguille C, Hartemann P. Emerging pollutants in wastewater: a
review of the literature. Int J Hyg Environ Health 2011; 214: 442-8.
Drury B, Scott J, Rosi-Marshall EJ, Kelly JJ. Triclosan exposure increases triclosan
resistance and influences taxonomic composition of benthic bacterial
communities. Environ Sci Technol 2013; 47: 8923-30.
EC (European Commission). European Union Complete Risk Assessment including 2003
Risk Assessment Report and 2008 Addendum: 4,4 -Isopropylidenediphenol
(Bisphenol-A): CAS No: 80-05-7, EINECS No: 201-245-8, Complete risk
assessment in one document. 2010. http://esis.jrc.ec.europa.eu/.
Environment Canada and Health Canada. Screening Assessment for the Challenge:
Phenol, 4,4 -(1-methylethylidene)bis- (Bisphenol A) Chemical Abstracts Service
Registry Number 80-05-7 (April 2011).
2008www.ec.gc.ca/substances/ese/eng/challenge/batch2/batch2_80-05-7.cfm
Federle TW, Kaiser SK, Nuck BA. Fate and effects of triclosan in activated sludge.
Environ Toxicol Chem 2002; 21: 1330-7.
Feng Y, Zhang Z, Gao P, Su H, Yu Y, Ren N. Adsorption behavior of EE2 (17 alpha-
ethinylestradiol) onto the inactivated sewage sludge: kinetics, thermodynamics
and influence factors. J Hazard Mater 2010; 175: 970-6.
Fernandez MP, Ikonomou MG, Buchanan I. An assessment of estrogenic organic
contaminants in Canadian wastewaters. Sci Total Environ 2007; 373: 250-69.
Fujimoto T, Kubo K, Aou S. Prenatal exposure to bisphenol A impairs sexual
differentiation of exploratory behavior and increases depression-like behavior in
rats. Brain Res 2006; 1068: 49-55.
P a g e | 201
García-Galán MJ, Díaz-Cruz MS, Barceló D. Occurrence of sulfonamide residues along
the Ebro river basin. Removal in wastewater treatment plants and environmental
impact assessment. Environment International 2011; 37: 462-473.
Gaulke LS, Strand SE, Kalhorn TF, Stensel HD. 17α-ethinylestradiol Transformation via
Abiotic Nitration in the Presence of Ammonia Oxidizing Bacteria. Environmental
Science & Technology 2008; 42: 7622-7627.
Gee RH, Charles A, Taylor N, Darbre PD. Oestrogenic and androgenic activity of
triclosan in breast cancer cells. J Appl Toxicol 2008; 28: 78-91.
Gros M, Petrović M, Barceló D. Wastewater treatment plants as a pathway for aquatic
contamination by pharmaceuticals in the Ebro river basin (Northeast Spain).
Environmental Toxicology and Chemistry 2007; 26: 1553-1562.
Gros M, Petrović M, Ginebreda A, Barceló D. Removal of pharmaceuticals during
wastewater treatment and environmental risk assessment using hazard indexes.
Environment International 2010; 36: 15-26.
Guellil A, Block JC, Urbain V. Adaptation of the microbial adhesion to hydrocarbon test
(MATH) for measuring activated sludge hydrophobicity. Water Science and
Technology 1998; 37: 359-362.
Hamid H, Eskicioglu C. Fate of estrogenic hormones in wastewater and sludge treatment:
A review of properties and analytical detection techniques in sludge matrix. Water
Research 2012; 46: 5813-5833.
Hashimoto T, Murakami T. Removal and degradation characteristics of natural and
synthetic estrogens by activated sludge in batch experiments. Water Res 2009; 43:
573-82.
Heberer T. Tracking persistent pharmaceutical residues from municipal sewage to
drinking water. Journal of Hydrology 2002; 266: 175-189.
Heidler J, Halden RU. Mass balance assessment of triclosan removal during conventional
sewage treatment. Chemosphere 2007; 66: 362-9.
Ho YS, McKay G. Pseudo-second order model for sorption processes. Process
Biochemistry 1999; 34: 451-465.
Hyland KC, Dickenson ER, Drewes JE, Higgins CP. Sorption of ionized and neutral
emerging trace organic compounds onto activated sludge from different
wastewater treatment configurations. Water Res 2012; 46: 1958-68.
Jeffries KM, Jackson LJ, Ikonomou MG, Habibi HR. Presence of natural and
anthropogenic organic contaminants and potential fish health impacts along two
river gradients in Alberta, Canada. Environ Toxicol Chem 2010; 29: 2379-87.
Jelic A, Gros M, Ginebreda A, Cespedes-Sanchez R, Ventura F, Petrovic M, et al.
Occurrence, partition and removal of pharmaceuticals in sewage water and sludge
during wastewater treatment. Water Res 2011; 45: 1165-76.
Joss A, Andersen H, Ternes T, Richle PR, Siegrist H. Removal of Estrogens in Municipal
Wastewater Treatment under Aerobic and Anaerobic Conditions: Consequences
P a g e | 202
for Plant Optimization. Environmental Science & Technology 2004; 38: 3047-
3055.
Joss A, Zabczynski S, Gobel A, Hoffmann B, Loffler D, McArdell CS, et al. Biological
degradation of pharmaceuticals in municipal wastewater treatment: proposing a
classification scheme. Water Res 2006; 40: 1686-96.
Kidd KA, Blanchfield PJ, Mills KH, Palace VP, Evans RE, Lazorchak JM, et al. Collapse
of a fish population after exposure to a synthetic estrogen. Proc Natl Acad Sci U S
A 2007; 104: 8897-901.
Kirk LA, Tyler CR, Lye CM, Sumpter JP. Changes in estrogenic and androgenic
activities at different stages of treatment in wastewater treatment works.
Environmental Toxicology and Chemistry 2002; 21: 972-979.
Klecka GM, Staples CA, Clark KE, Van der Hoeven N, Thomas DE, Hentges SG.
Exposure analysis of bisphenol A in surface water systems in North America and
Europe. Environ Sci Technol 2009; 43: 6145-50.
Koh YK, Chiu TY, Boobis AR, Scrimshaw MD, Bagnall JP, Soares A, et al. Influence of
operating parameters on the biodegradation of steroid estrogens and
nonylphenolic compounds during biological wastewater treatment processes.
Environ Sci Technol 2009; 43: 6646-54.
Kreuzinger N, Clara M, Strenn B, Kroiss H. Relevance of the sludge retention time
(SRT) as design criteria for wastewater treatment plants for the removal of
endocrine disruptors and pharmaceuticals from wastewater. Water Science and
Technology 2004; 50: 149-156.
Lagergren S. About the theory of so-called adsorption of soluble substance. Kung Sven.
Veten. Hand. 1898; 24: 1-39.
Lapworth DJ, Baran N, Stuart ME, Ward RS. Emerging organic contaminants in
groundwater: A review of sources, fate and occurrence. Environ Pollut 2012; 163:
287-303.
Larcher S, Yargeau V. Biodegradation of 17alpha-ethinylestradiol by heterotrophic
bacteria. Environ Pollut 2013; 173: 17-22.
Latorre A, Lacorte S, Barcelo D. Presence of nonylphenol, octyphenol and bisphenol a in
two aquifers close to agricultural, industrial and urban areas. Chromatographia
2003; 57: 111-116.
Lee do G, Zhao F, Rezenom YH, Russell DH, Chu KH. Biodegradation of triclosan by a
wastewater microorganism. Water Res 2012; 46: 4226-34.
Lee HB, Peart TE, Chan J, Gris G. Occurrence of endocrine-disrupting chemicals in
sewage and sludge samples in Toronto, Canada. Water Quality Research Journal
of Canada 2004; 39: 57-63.
Lee J, Lee BC, Ra JS, Cho J, Kim IS, Chang NI, et al. Comparison of the removal
efficiency of endocrine disrupting compounds in pilot scale sewage treatment
processes. Chemosphere 2008; 71: 1582-92.
P a g e | 203
Li YM, Zeng QL, Yang SJ. Removal and fate of estrogens in an anaerobic-anoxic-oxic
activated sludge system. Water Sci Technol 2011; 63: 51-6.
Lishman L, Smyth SA, Sarafin K, Kleywegt S, Toito J, Peart T, et al. Occurrence and
reductions of pharmaceuticals and personal care products and estrogens by
municipal wastewater treatment plants in Ontario, Canada. Sci Total Environ
2006; 367: 544-58.
Lopez-Avila V, Hites RA. Organic compounds in an industrial wastewater. Their
transport into sediments. Environmental Science & Technology 1980; 14: 1382-
1390.
Lozano N, Rice CP, Ramirez M, Torrents A. Fate of Triclocarban, Triclosan and
Methyltriclosan during wastewater and biosolids treatment processes. Water Res
2013; 47: 4519-27.
Margot J, Kienle C, Magnet A, Weil M, Rossi L, de Alencastro LF, et al. Treatment of
micropollutants in municipal wastewater: ozone or powdered activated carbon?
Sci Total Environ 2013; 461-462: 480-98.
Martin J, Camacho-Munoz D, Santos JL, Aparicio I, Alonso E. Occurrence of
pharmaceutical compounds in wastewater and sludge from wastewater treatment
plants: removal and ecotoxicological impact of wastewater discharges and sludge
disposal. J Hazard Mater 2012; 239-240: 40-7.
Melcer H, Klecka G. Treatment of wastewaters containing bisphenol A: state of the
science review. Water Environ Res 2011; 83: 650-66.
Miège C, Choubert JM, Ribeiro L, Eusèbe M, Coquery M. Fate of pharmaceuticals and
personal care products in wastewater treatment plants - Conception of a database
and first results. Environmental Pollution 2009; 157: 1721-1726.
Mohapatra DP, Brar SK, Tyagi RD, Surampalli RY. Occurrence of bisphenol A in
wastewater and wastewater sludge of CUQ treatment plant. Journal of
Xenobiotics 2011; 1.
Muller M, Rabenoelina F, Balaguer P, Patureau D, Lemenach K, Budzinski H, et al.
Chemical and biological analysis of endocrine-disrupting hormones and
estrogenic activity in an advanced sewage treatment plant. Environ Toxicol Chem
2008; 27: 1649-58.
Nakada N, Yasojima M, Okayasu Y, Komori K, Suzuki Y. Mass balance analysis of
triclosan, diethyltoluamide, crotamiton and carbamazepine in sewage treatment
plants. Water Sci Technol 2010; 61: 1739-47.
Neumegen RA, Fernandez-Alba AR, Chisti Y. Toxicities of triclosan, phenol, and copper
sulfate in activated sludge. Environ Toxicol 2005; 20: 160-4.
Nie Y, Qiang Z, Zhang H, Adams C. Determination of endocrine-disrupting chemicals in
the liquid and solid phases of activated sludge by solid phase extraction and gas
chromatography-mass spectrometry. J Chromatogr A 2009; 1216: 7071-80.
P a g e | 204
Pasquini L, Merlin C, Hassenboehler L, Munoz JF, Pons MN, Gorner T. Impact of
certain household micropollutants on bacterial behavior. Toxicity tests/study of
extracellular polymeric substances in sludge. Sci Total Environ 2013; 463-464:
355-65.
Pasquini L, Munoz JF, Pons MN, Yvon J, Dauchy X, France X, et al. Occurrence of eight
household micropollutants in urban wastewater and their fate in a wastewater
treatment plant. Statistical evaluation. Sci Total Environ 2014; 481: 459-68.
Plahuta M, Tišler T, Toman M. J, Pintar A. Efficiency of advanced oxidation processes in
lowering bisphenol A toxicity and oestrogenic activity in aqueous samples.
Archives of Industrial Hygiene and Toxicology. 65, 2014, pp. 77.
Qiu H, Lv L, Pan BC, Zhang QJ, Zhang WM, Zhang QX. Critical review in adsorption
kinetic models. Journal of Zhejiang University-Science A 2009; 10: 716-724.
Racz L, Muller JG, Goel RK. Fate of selected estrogens in two laboratory scale
sequencing batch reactors fed with different organic carbon sources under varying
solids retention times. Bioresour Technol 2012; 110: 35-42.
Radjenovic J, Petrovic M, Barcelo D. Fate and distribution of pharmaceuticals in
wastewater and sewage sludge of the conventional activated sludge (CAS) and
advanced membrane bioreactor (MBR) treatment. Water Res 2009; 43: 831-41.
Robinson BJ, Hui JP, Soo EC, Hellou J. Estrogenic compounds in seawater and sediment
from Halifax Harbour, Nova Scotia, Canada. Environ Toxicol Chem 2009; 28:
18-25.
Roig B. Pharmaceuticals in the environment. Current knowledge and need assessment to
reduce presence and impact: IWA Publishing, 2010.
Rostkowski P, Horwood J, Shears JA, Lange A, Oladapo FO, Besselink HT, et al.
Bioassay-directed identification of novel antiandrogenic compounds in bile of fish
exposed to wastewater effluents. Environ Sci Technol 2011; 45: 10660-7.
Samaras VG, Stasinakis AS, Mamais D, Thomaidis NS, Lekkas TD. Fate of selected
pharmaceuticals and synthetic endocrine disrupting compounds during
wastewater treatment and sludge anaerobic digestion. J Hazard Mater 2013; 244-
245: 259-67.
Seyhi B, Drogui P, Buelna G, Blais JF. Modeling of sorption of bisphenol A in sludge
obtained from a membrane bioreactor process. Chemical Engineering Journal
2011; 172: 61-67.
Seyhi B, Drogui P, Buelna G, Blais JF. Removal of bisphenol-A from spiked synthetic
effluents using an immersed membrane activated sludge process. Separation and
Purification Technology 2012; 87: 101-109.
Stahlhut RW, Welshons WV, Swan SH. Bisphenol A Data in NHANES Suggest Longer
than Expected Half-Life, Substantial Nonfood Exposure, or Both. Environmental
health perspectives 2009; 117: 784-789.

P a g e | 205
Stasinakis AS, Gatidou G, Mamais D, Thomaidis NS, Lekkas TD. Occurrence and fate of
endocrine disrupters in Greek sewage treatment plants. Water Res 2008; 42:
1796-804.
Stasinakis AS, Kordoutis CI, Tsiouma VC, Gatidou G, Thomaidis NS. Removal of
selected endocrine disrupters in activated sludge systems: effect of sludge
retention time on their sorption and biodegradation. Bioresour Technol 2010; 101:
2090-5.
Stasinakis AS, Mermigka S, Samaras VG, Farmaki E, Thomaidis NS. Occurrence of
endocrine disrupters and selected pharmaceuticals in Aisonas River (Greece) and
environmental risk assessment using hazard indexes. Environ Sci Pollut Res Int
2012; 19: 1574-83.
Stasinakis AS, Petalas AV, Mamais D, Thomaidis NS, Gatidou G, Lekkas TD.
Investigation of triclosan fate and toxicity in continuous-flow activated sludge
systems. Chemosphere 2007; 68: 375-381.
Stevens-Garmon J, Drewes JE, Khan SJ, McDonald JA, Dickenson ER. Sorption of
emerging trace organic compounds onto wastewater sludge solids. Water Res
2011; 45: 3417-26.
Tchobanoglous G, Burton, F. L., Stensel, D. H. Wastewater engineering: treatment and
reuse. New York: McGraw-Hill, 2003.
Thomas PM, Foster GD. Tracking acidic pharmaceuticals, caffeine, and triclosan through
the wastewater treatment process. Environmental Toxicology and Chemistry
2005; 24: 25-30.
Urbatzka R, van Cauwenberge A, Maggioni S, Vigano L, Mandich A, Benfenati E, et al.
Androgenic and antiandrogenic activities in water and sediment samples from the
river Lambro, Italy, detected by yeast androgen screen and chemical analyses.
Chemosphere 2007; 67: 1080-7.
Vajda AM, Barber LB, Gray JL, Lopez EM, Woodling JD, Norris DO. Reproductive
disruption in fish downstream from an estrogenic wastewater effluent. Environ
Sci Technol 2008; 42: 3407-14.
Vega-Morales T, Sosa-Ferrera Z, Santana-Rodriguez JJ. Determination of alkylphenol
polyethoxylates, bisphenol-A, 17alpha-ethynylestradiol and 17beta-estradiol and
its metabolites in sewage samples by SPE and LC/MS/MS. J Hazard Mater 2010;
183: 701-11.
Verlicchi P, Al Aukidy M, Zambello E. Occurrence of pharmaceutical compounds in
urban wastewater: removal, mass load and environmental risk after a secondary
treatment--a review. Sci Total Environ 2012; 429: 123-55.
vom Saal FS, Myers JP. Bisphenol A and risk of metabolic disorders. JAMA 2008; 300:
1353-5.
P a g e | 206
Vulliet E, Cren-Olive C, Grenier-Loustalot MF. Occurrence of pharmaceuticals and
hormones in drinking water treated from surface waters. Environmental
Chemistry Letters 2011; 9: 103-114.
Weber S, Leuschner P, Kampfer P, Dott W, Hollender J. Degradation of estradiol and
ethinyl estradiol by activated sludge and by a defined mixed culture. Applied
Microbiology and Biotechnology 2005; 67: 106-12.
Weber TW, Chakravo.Rk. Pore and Solid Diffusion Models for Fixed-Bed Adsorbers.
AIChE Journal 1974; 20: 228-238.
Xu K, Harper WF, Jr., Zhao D. 17alpha-Ethinylestradiol sorption to activated sludge
biomass: thermodynamic properties and reaction mechanisms. Water Res 2008;
42: 3146-52.
Yi T, Harper WF, Jr. The effect of biomass characteristics on the partitioning and
sorption hysteresis of 17alpha-ethinylestradiol. Water Res 2007; 41: 1543-53.
Ying GG, Yu XY, Kookana RS. Biological degradation of triclocarban and triclosan in a
soil under aerobic and anaerobic conditions and comparison with environmental
fate modelling. Environ Pollut 2007; 150: 300-5.
Zeng QL, Li YM, Yang SJ. Sludge Retention Time as a Suitable Operational Parameter
to Remove Both Estrogen and Nutrients in an Anaerobic-Anoxic-Aerobic
Activated Sludge System. Environmental engineering science 2013; 30: 161-169.
Zhao J, Li Y, Zhang C, Zeng Q, Zhou Q. Sorption and degradation of bisphenol A by
aerobic activated sludge. J Hazard Mater 2008; 155: 305-11.
Zhou H, Huang X, Wang X, Zhi X, Yang C, Wen X, et al. Behaviour of selected
endocrine-disrupting chemicals in three sewage treatment plants of Beijing,
China. Environmental Monitoring and Assessment 2010; 161: 107-21.
Zhou X, Oleszkiewicz JA. Biodegradation of oestrogens in nitrifying activated sludge.
Environ Technol 2010; 31: 1263-9.
Ziels RM, Lust MJ, Gough HL, Strand SE, Stensel HD. Influence of Bioselector
Processes on 17alpha-Ethinylestradiol Biodegradation in Activated Sludge
Wastewater Treatment Systems. Environ Sci Technol 2014.

P a g e | 207
Chapter 6: General Fate Model for MCs under Typical
Sewage Treatment Conditions
Summary1:
Mathematical models developed for removal of microconstituents (MCs) in
biological wastewater treatment have not incorporated developments in International
Water Association (IWA) models. In this paper many kinetic models that can be used to
describe transformation of MCs (volatilization and photodegradation were considered
negligible) in an activated sludge (AS) process were evaluated and advantages and
disadvantages of different models were outlined. Nine lab-scale continuous flow porous-
pot bioreactors operating at various solids retention times (SRTs) and hydraulic retention
times (HRTs) were conducted to simulate AS systems and to evaluate the biodegradation
kinetic models for the fate of 17α-ethinylestradiol (EE2), bisphenol-A (BPA), and
triclosan (TCS) at the µg/L range. Mathematical models were applied to describe the
degradation mechanism of selected MCs and pseudo second-order model were found to
best fit the results when active MCs degraders (XC) were used. It is found that
biodegradation studies should incorporate XC and not mixed liquor suspended solids
concentration (MLSS) in their kinetic formulations.
1 This chapter has been prepared to submit for publication to the Water Research Journal
P a g e | 208
6.1 Introduction:
The mathematical models developed for design and operation of biological
wastewater treatment such as those from the International Water Association (IWA) were
only developed to describe removal of chemical oxygen demand (COD), nitrogen and
phosphorus and not concerned with specific chemical compounds. Consequently
commercial modeling software for MCs removal in secondary wastewater treatment
plants (WWTPs) have been developed, but the models used in these packages for
microconstituents (MCs) with different physico-chemical properties and biodegradability
have not incorporated developments in IWA models which present numerous possibilities
that have not been evaluated (Banihashemi and Droste, 2011).
Although the presence of MCs during wastewater treatment has been studied by a
plethora of reports, significant differences on their concentration levels and removal rates
as well as contradictory results on their fate have been reported (Deblonde et al., 2011;
Stasinakis et al., 2010). Most studies do not report sufficient information to evaluate the
possible fate models for MCs removal and incorporate findings from other researchers;
furthermore, assumptions are often not experimentally verified. Consequently, only
limited normalization is possible to relate models or rate coefficients to experimental
data. On the other hand, the majority of environmental surveys previously undertaken
have mainly been focused on dissolved concentrations of these compounds in wastewater
at environmentally relevant concentrations (Feng et al., 2010; Radjenovic et al., 2009;
P a g e | 209
Seyhi et al., 2011). Only in the last few years have researchers begun to study the MCs
concentration in the solid phase at very low concentrations (Nie et al., 2009; Stasinakis et
al., 2010; Stevens-Garmon et al., 2011; Zhao et al., 2008) which is necessary for mass
balance analysis. Banihashemi and Droste (2011) reviewed different literature models
describing MCs removal in activated sludge (AS) system and stated that an explanation
for the validity of proposed models is often lacking and future developments are
necessary to improve modeling of MCs removal in WWTP.
Volatile agents were largely ignored in MCs fate models because they are mostly
transferred to the atmosphere in an AS process. Because the pH range in WWTPs is
usually in the range of 6.5-8, losses due to photolysis are expected to be negligible.
Therefore, sorption and biotransformation are considered as the two primary removal
pathways of MCs in this study.
A major task of this research was to evaluate the kinetic models that have been used
or can be used to describe the transformation of selected MCs, namely 17α-
ethinylestradiol (EE2), bisphenol-A (BPA), and triclosan (TCS) in a biotreatment
process, particularly an AS process.
A majority of published models for the environmental fate of MCs assume that
equilibrium is reached instantaneously between sorbed and dissolved MCs. Some studies
proposed a general model with sorption-desorption dynamic processes (Cowan et al.,
1993; Lai et al., 2000; Lindblom et al., 2009) where different stages have been suggested
P a g e | 210
in this process. MCs sorption equilibria in environmental samples including sludge are
often modelled by Freundlich isotherms with a Freundlich coefficient close to 1, which is
equivalent to a linear isotherm (Banihashemi and Droste, 2014; Stasinakis et al., 2010; Yi
et al., 2011; Zhao et al., 2008). As a consequence, the equilibrium of sorption to particles
is usually assumed to fit linear equations (Carballa et al., 2007; Feng et al., 2010) as well
as the equilibrium of sorption to dissolved/colloidal matter (DCM) (Barret et al., 2010b;
Zhou et al., 2007).
In a previous published study on sorption of BPA, TCS, and EE2 to AS sludge by
authors, it was found that the contact times necessary to reach equilibrium between solid
and liquid phases was 2, 4, and 6 hours for BPA, TCS, and EE2, respectively
(Banihashemi and Droste, 2014). In their study, linear and Freundlich models fitted well
with the experimental data with the correlation coefficients (r2) greater than 0.98 and it
was found that the SRT plays an important role in sorption kinetic determination.
Furthermore, they concluded that desorption kinetics cannot limit BPA, EE2, and TCS
biodegradation in biological treatment systems and the equilibrium state assumption is
valid to represent sorption phenomena.
Biodegradation of MCs varies with respect to compounds properties, type of
biological system designed to remove MCs and operating condition of that system.
Biodegradation occurs in the aeration basin in AS systems and is governed by
degradation kinetics where microbial biomass is a key parameter. There are many
P a g e | 211
different model formulations that have been found to fit biodegradation data for MCs in
an AS treatment plant, e.g., zero-order, first-order, pseudo-first-order or mixed second-
order kinetics or various types of growth-based Monod or Haldane model formulations.
A number of different approaches for modeling biological MC degradation in WWTPs
found in the literature are presented in Banihashemi and Droste (2011) and are shown in
Table 6-1. Possible biological rate and growth rate formulations are also presented in
Table 6-2. The simplest zero- and first-order models assume that, for a given hydraulic
retention time (HRT) a fixed fraction of the MCs in the influent is removed
independently of other water quality variables. In a zero-order reaction model, the
removal rate is independent of the influent concentration while in the first-order case it is
not. More commonly used models are first-order or pseudo second-order formulations
dependent only on the liquid phase concentration of chemical or apparent first-order
formulation where degradation occurs in both the soluble and sorbed phases
(Banihashemi and Droste, 2011; Pomiès et al., 2013). However, it has been found that the
amount of chemical available for biodegradation must be equal to the total amount of
chemical in the reactor not just the dissolved fraction (Cowan et al., 1993).
The pseudo-first order expressions takes into account mixed liquor suspended solids
(MLSS) and thus distinguishes between, e.g., an AS reactor (high MLSS) and an aerated
lagoon (low MLSS). On the other hand, using these models would lead to a linear
increase in the removal rate with the suspended solids (SS) concentration independent of
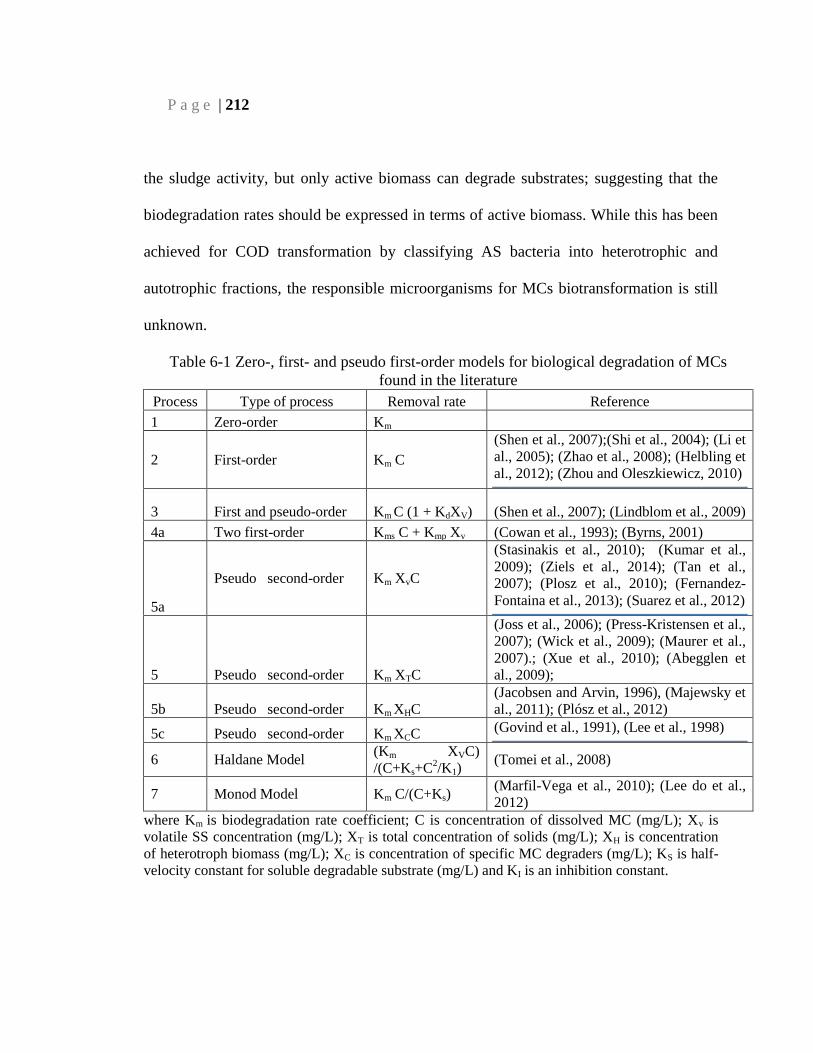
P a g e | 212
the sludge activity, but only active biomass can degrade substrates; suggesting that the
biodegradation rates should be expressed in terms of active biomass. While this has been
achieved for COD transformation by classifying AS bacteria into heterotrophic and
autotrophic fractions, the responsible microorganisms for MCs biotransformation is still
unknown.
Table 6-1 Zero-, first- and pseudo first-order models for biological degradation of MCs
found in the literature
Process Type of process Removal rate Reference
1 Zero-order Km
2 First-order Km C
(Shen et al., 2007);(Shi et al., 2004); (Li et
al., 2005); (Zhao et al., 2008); (Helbling et
al., 2012); (Zhou and Oleszkiewicz, 2010)
3 First and pseudo-order Km C (1 + KdXV) (Shen et al., 2007); (Lindblom et al., 2009)
4a Two first-order Kms C + Kmp Xv (Cowan et al., 1993); (Byrns, 2001)
5a
Pseudo second-order Km XvC
(Stasinakis et al., 2010); (Kumar et al.,
2009); (Ziels et al., 2014); (Tan et al.,
2007); (Plosz et al., 2010); (Fernandez-
Fontaina et al., 2013); (Suarez et al., 2012)
5 Pseudo second-order Km XTC
(Joss et al., 2006); (Press-Kristensen et al.,
2007); (Wick et al., 2009); (Maurer et al.,
2007).; (Xue et al., 2010); (Abegglen et
al., 2009);
5b Pseudo second-order Km XHC
(Jacobsen and Arvin, 1996), (Majewsky et
al., 2011); (Plósz et al., 2012)
5c Pseudo second-order Km XCC (Govind et al., 1991), (Lee et al., 1998)
6 Haldane Model (Km XVC)
/(C+Ks+C2/K1)
(Tomei et al., 2008)
7 Monod Model Km C/(C+Ks) (Marfil-Vega et al., 2010); (Lee do et al.,
2012)
where Km is biodegradation rate coefficient; C is concentration of dissolved MC (mg/L); Xv is
volatile SS concentration (mg/L); XT is total concentration of solids (mg/L); XH is concentration
of heterotroph biomass (mg/L); XC is concentration of specific MC degraders (mg/L); KS is half-
velocity constant for soluble degradable substrate (mg/L) and KI is an inhibition constant.

P a g e | 213
Table 6-2 Possible rate formulations for biological degradation of MCs
No. Model (r)
1 Km Zero-order model, decay is independent of concentrations of biomass and the
chemical
2 Km C First-order degradation independent of biomass concentration and only applies
to dissolved chemical
3a Km C(1 + KdXV) First-order but chemical decays in both the soluble and solid phases
3b Km C(1 + KdXH) First-order but chemical decays in both the soluble and solid phases; (XI + XS)
is not subject to microbial attack
3c Km C(1 + KdXC) First-order but chemical decays in both the soluble and solid phases
4a KmsC + KmpKdXVC First-order decay in both liquid and solid phases but different rate coefficients
4b KmsC + KmpKdXHC First-order decay in both liquid and solid phases but different rate coefficients;
(XI + XS) is not subject to microbial attack
5a
KmXVC Mixed second-order with degradation only in the soluble phase
5b KmXHC Mixed second-order with degradation by active heterotrophs only in the soluble
phase
5c KmXCC Mixed second-order with degradation by active MCs degraders only in the
soluble phase
6a KmXVC(1 + KdXV) Mixed second-order with degradation in both the soluble and solid phases
6b KmXHC(1 + KdXV) Mixed second-order with degradation by active heterotrophs in both the soluble
and solid phases
6c KmXCC(1 + KdXV) Mixed second-order with degradation by active MCs degraders in both the
soluble and solid phases
7a KmsXVC+
KmpXVKdXVC
Mixed second-order with degradation in both the soluble and solid phases with
different rate coefficients in each phase.
7b KmsXHC
+KmpXHKdXVC
Mixed second-order with degradation in both the soluble and solid phases with
different rate coefficients for active heterotrophs in each phase
7c KmsXCC
+KmpXCKdXVC
Mixed second-order with degradation in both the soluble and solid phases with
different rate coefficients foe active MCs degraders in each phase
8 KmXHC(1 + KdXH) Chemical sorbed to inert particulates; (XI + XS) is not subject to microbial
attack
9 KmsXHC+
KmpXH2KdC
Chemical sorbed to inert particulates (XI + XS) is not subject to microbial
attack. Degradation in both the soluble and solid phases with different rate
coefficients in each phase.
10
Monod rate formulation independent of biomass. Only applied to the soluble
phase.
11a
Monod rate formulation dependent on VSS biomass. Only applied to the soluble
phase.
11b
Monod rate formulation dependent on active heterotroph biomass. Only applied
to the soluble phase
11c
Monod rate formulation dependent on active MCs degraders. Only applied to
the soluble phase

P a g e | 214
Furthermore some studies suggested that the slow growing specific bacteria and
diversified enzymes would enhance the biodegradation of MCs in WWTPs that operate
above the critical SRT of 10 days (Clara et al., 2005a). It was believed that the critical
SRT is correlated to the nitrification process in AS. However; debatable information on
the role of autotrophs on MCs biodegradation in AS systems operating at different SRTs
has been reported (Larcher and Yargeau, 2013; Zhou and Oleszkiewicz, 2010).
A spectrum of three different MCs was chosen (Table 6-3) due to their extensive use
and their physico-chemical and toxicological properties. Concentration levels of these
MCs range between a few ng/L to some µg/L in wastewater (Atkinson et al., 2012;
Fernandez et al., 2007; Lee et al., 2004; Mohapatra et al., 2011; Nakada et al., 2010;
Stasinakis et al., 2008), surface water (Bennie, 2008; Klecka et al., 2009; Stasinakis et al.,
2012), groundwater (Lapworth et al., 2012; Latorre et al., 2003) and drinking water
(Heberer, 2002b; Vulliet et al., 2011), while concentrations up to µg/g have been detected
in sewage sludge and soil samples (Martin et al., 2012; Mohapatra et al., 2011). The
study presented here focuses on evaluation of biodegradation kinetic models presented in
Table 6-2 for selected MCs as well as estimating the concentration of specific MC
degraders (XC) based on model validation which consists in comparing the simulated
biodegradation result with a set of experimental data.

P a g e | 215
Table 6-3 Physico-chemical characteristics of selected MCs
MCs CAS No MW Molecular
formula Sw H Km log Kow
BPA 80-05-7 228.29 C15H16O2 120 1.0×10⁻¹¹
5-113d 3.18-3.7
a
EE2 57-63-6 296.41 C20H24O2 4.8-11.3 7.9×10⁻¹²
2.5-
18.9e
3.6-4.15b
TCS 3380-34-5 289.54 C12H7Cl3O2 10 1.5×10⁻⁷
30-288f 4.5-4.8
c
MW: molecular weight (g/mol); Sw: solubility in water (mg/L); H: Henry coefficient
(atm·m3/mol); Kow: octanol-water partition coefficient; Km: pseudo-second-order degradation
constant (L/gSS.day);
a (Borrirukwisitsak et al., 2012; Robinson et al., 2009)
b (Robinson et al., 2009)
c (Lopez-Avila and Hites, 1980; Ying et al., 2007)
d (Stasinakis et al., 2010; Urase and Kikuta, 2005; Zhao et al., 2008)
e (Urase and Kikuta, 2005; Ziels et al., 2014)
f (Stasinakis et al., 2010)
6.2 Methods
6.2.1 Bioreactors
Three laboratory-scale porous-pot bioreactors were set up to simulate AS systems
operating at different SRTs. These bioreactors were originally seeded with the AS
obtained from City of Ottawa wastewater treatment facility and fed with synthetic
wastewater for an acclimation period of six months. After biomass acclimatization to the
feed (Phase A), environmentally relevant concentration of selected MCs were added to
reactors and three HRTs of 4, 6 and 10 h combined with three SRTs of 5, 10 and 15 d
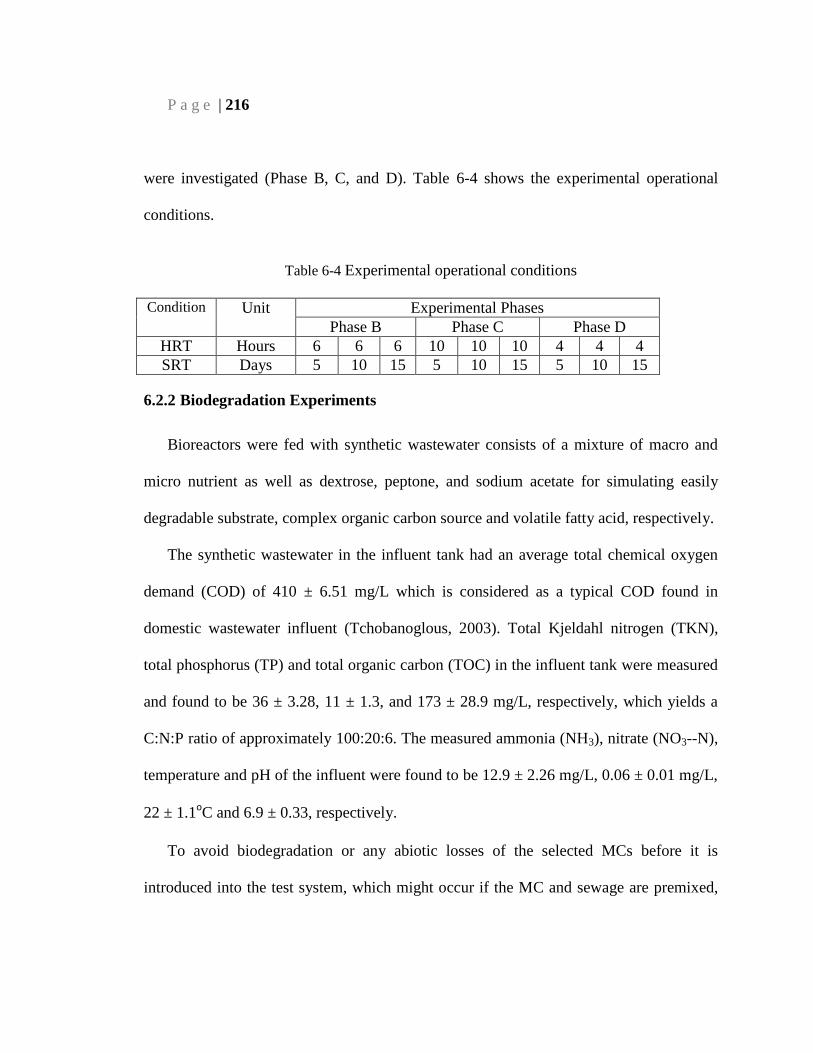
P a g e | 216
were investigated (Phase B, C, and D). Table 6-4 shows the experimental operational
conditions.
Table 6-4 Experimental operational conditions
Condition Unit Experimental Phases
Phase B Phase C Phase D
HRT Hours 6 6 6 10 10 10 4 4 4
SRT Days 5 10 15 5 10 15 5 10 15
6.2.2 Biodegradation Experiments
Bioreactors were fed with synthetic wastewater consists of a mixture of macro and
micro nutrient as well as dextrose, peptone, and sodium acetate for simulating easily
degradable substrate, complex organic carbon source and volatile fatty acid, respectively.
The synthetic wastewater in the influent tank had an average total chemical oxygen
demand (COD) of 410 ± 6.51 mg/L which is considered as a typical COD found in
domestic wastewater influent (Tchobanoglous, 2003). Total Kjeldahl nitrogen (TKN),
total phosphorus (TP) and total organic carbon (TOC) in the influent tank were measured
and found to be 36 ± 3.28, 11 ± 1.3, and 173 ± 28.9 mg/L, respectively, which yields a
C:N:P ratio of approximately 100:20:6. The measured ammonia (NH3), nitrate (NO3--N),
temperature and pH of the influent were found to be 12.9 ± 2.26 mg/L, 0.06 ± 0.01 mg/L,
22 ± 1.1oC and 6.9 ± 0.33, respectively.
To avoid biodegradation or any abiotic losses of the selected MCs before it is
introduced into the test system, which might occur if the MC and sewage are premixed,
P a g e | 217
BPA, EE2 and TCS (purchased from Sigma-Aldrich, Canada) and the sewage were dosed
into the porous pot separately using amber glass and MasterFlex C-FLEX tubing
resulting in an initial concentration of 20 µg/L for selected MCs. In order to establish that
the units have reached the steady state, are operating properly and acclimated to the
selected MCs (stabilization period), test compounds in the effluent and overall
performance of the units were regularly monitored at the early period of each phase.
When the reactors achieved the steady state condition, nine samples were taken over a
period of two weeks and the overall performance of the reactor and the concentration of
MCs in liquid and solid phases (triplicate) were measured (n=27). During the
experiments, all systems were maintained at 25°C by automatic thermostat, dissolved
oxygen (DO) in aerobic reactors was kept above 4.0 mg/L and mean pH was 7.2 ± 0.3.
All reactors and tubes were covered with aluminum foil or tape to prevent any loss due to
photodegradation
6.2.3 Estimation of Active Heterotrophic Biomass
The mixed liquor aliquots were decanted from reactors at beginning of each phase
and the active fraction of the mixed liquor was determined in 35-day aerobic digestion
batch tests by monitoring VSS according to detailed experimental and mathematical
method developed in the literature (Ramdani et al., 2010; Ramdani et al., 2012). The
following equations were used for the determinations of the active fraction of biomass.
The concentration of sludge VSS at a given time of digestion is given by Eq. (6-1).
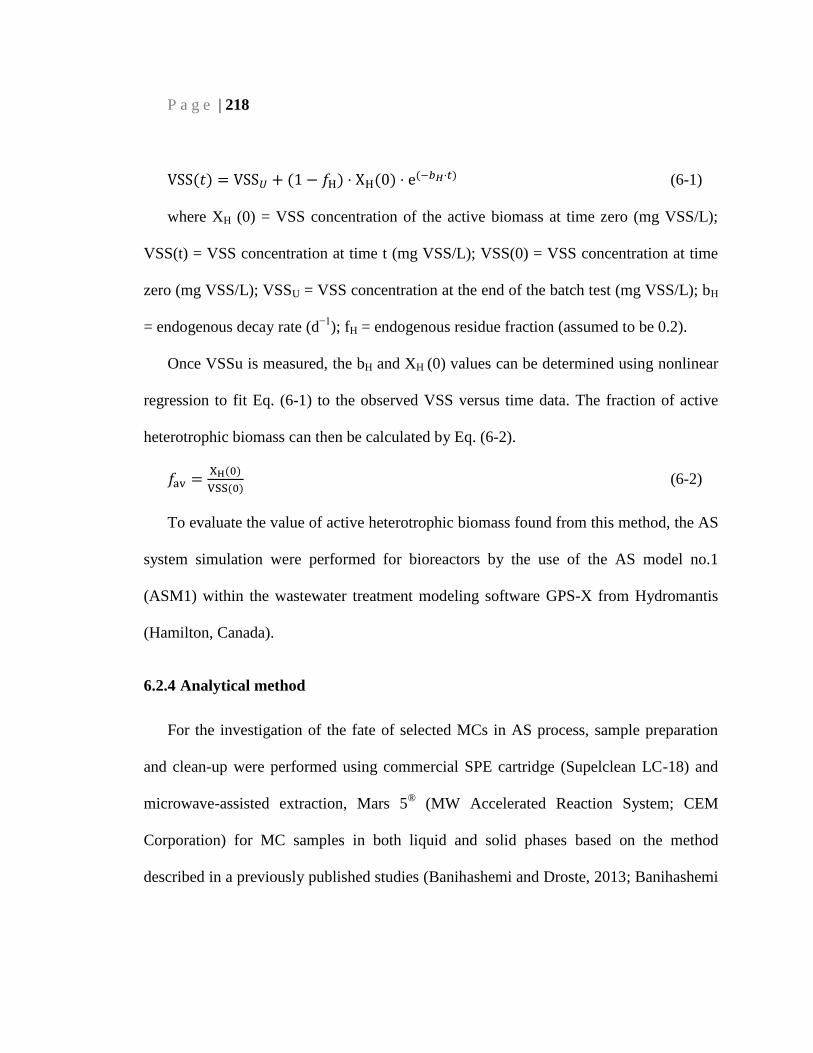
P a g e | 218
( ) ( ) ( ) ( ) (6-1)
where XH (0) = VSS concentration of the active biomass at time zero (mg VSS/L);
VSS(t) = VSS concentration at time t (mg VSS/L); VSS(0) = VSS concentration at time
zero (mg VSS/L); VSSU = VSS concentration at the end of the batch test (mg VSS/L); bH
= endogenous decay rate (d−1
); fH = endogenous residue fraction (assumed to be 0.2).
Once VSSu is measured, the bH and XH (0) values can be determined using nonlinear
regression to fit Eq. (6-1) to the observed VSS versus time data. The fraction of active
heterotrophic biomass can then be calculated by Eq. (6-2).
( )
( ) (6-2)
To evaluate the value of active heterotrophic biomass found from this method, the AS
system simulation were performed for bioreactors by the use of the AS model no.1
(ASM1) within the wastewater treatment modeling software GPS-X from Hydromantis
(Hamilton, Canada).
6.2.4 Analytical method
For the investigation of the fate of selected MCs in AS process, sample preparation
and clean-up were performed using commercial SPE cartridge (Supelclean LC-18) and
microwave-assisted extraction, Mars 5® (MW Accelerated Reaction System; CEM
Corporation) for MC samples in both liquid and solid phases based on the method
described in a previously published studies (Banihashemi and Droste, 2013; Banihashemi
P a g e | 219
and Droste, 2014). Determination of selected MCs was performed using a HPLC
(Hewlett-Packard, HP 1100) coupled with ultraviolet (UV) detection according to the
procedures described by Banihashemi and Droste (2014). The recoveries of BPA, TCS
and EE2 in liquid samples were found to be 106 ± 2, 95 ± 6 and 88 ± 5%, respectively.
Also satisfactory recoveries were obtained in solid samples (>75%), except for TCS,
where recoveries of 55 ± 6% were obtained. For this reason, recovery correction was
made for TCS by dividing the observed concentrations by recovery rates. The limits of
detection (LOD) of the target compounds in liquid and solid samples were 100 ng/L and
100 ng/g, respectively.
6.2.5 Calculation methods
Based on the concentrations in influent, effluent, and biosolids, the total removal rate,
removal rate by sorption and removal rate by biotransformation/biodegradation were
calculated in percentages for all selected MCs. Total removal rate was calculated by Eq.
(6-3):
(6-3)
where Cinf is the influent liquid phase concentration, μg/L; Ceff is the effluent liquid
phase concentration of MC from the reactor, μg/L.
Accumulation of MCs on solids wasted from an AS system is not a real treatment but
nonetheless it is a significant phenomenon that affects the fate of MCs in biotreatment or
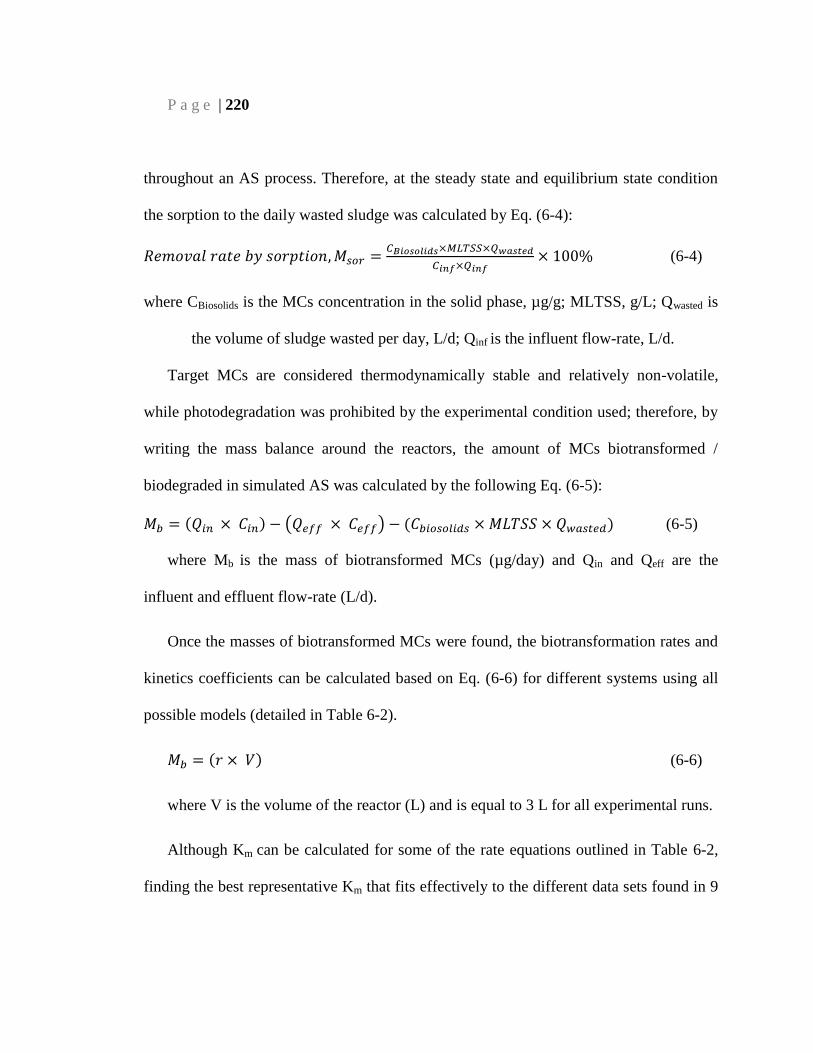
P a g e | 220
throughout an AS process. Therefore, at the steady state and equilibrium state condition
the sorption to the daily wasted sludge was calculated by Eq. (6-4):
(6-4)
where CBiosolids is the MCs concentration in the solid phase, µg/g; MLTSS, g/L; Qwasted is
the volume of sludge wasted per day, L/d; Qinf is the influent flow-rate, L/d.
Target MCs are considered thermodynamically stable and relatively non-volatile,
while photodegradation was prohibited by the experimental condition used; therefore, by
writing the mass balance around the reactors, the amount of MCs biotransformed /
biodegraded in simulated AS was calculated by the following Eq. (6-5):
( ) ( ) ( ) (6-5)
where Mb is the mass of biotransformed MCs (µg/day) and Qin and Qeff are the
influent and effluent flow-rate (L/d).
Once the masses of biotransformed MCs were found, the biotransformation rates and
kinetics coefficients can be calculated based on Eq. (6-6) for different systems using all
possible models (detailed in Table 6-2).
( ) (6-6)
where V is the volume of the reactor (L) and is equal to 3 L for all experimental runs.
Although Km can be calculated for some of the rate equations outlined in Table 6-2,
finding the best representative Km that fits effectively to the different data sets found in 9
P a g e | 221
experimental runs would require a parameter estimation technique. In addition,
parameters in non-linear models such as Monod (Km, Kc) and unknown parameters of
Kms, Kmp and Xc, which were not measured experimentally can be found using parameter
estimation.
6.2.6 Model parameter estimation and model validation
The biological degradation rate constants (Km, Kms, Kmp) as well as the concentration
of active MC degraders (Xc) were estimated from fitting the analytical solution of Eq. (6-
6) to the measured data (n=9) by minimizing the sum of the squares of the weighted
derivatives χ2 (Eq. 6-7) between measurements and the calculated model results of Mb.
AQUASIM and Excel software were used in this study for parameter estimation and
model comparison.
∑ ( ( )
)
(6-7)
where is the standard deviation of data and yi (P) is a function of P = (P1, P2, …,
Pm) which are model parameters.
In order to estimate parameters, all variables including constant (model parameters),
real data (measured data) and state variables (Mb) are defined in AQUASIM. The
minimization of the sum of chi squares is done with the constraints P i,min≤ Pi ≤ P i,max.
These two bounds are chosen based on the minimum and maximum value of model
parameters calculated from analytical solution of Eq. (6-6) and engineering judgment. To

P a g e | 222
better estimate the concentration of Xc, another constraint was added to the program
where Xc ≤ XH.
6.3 Results and Discussion
6.3.1 MCs biodegradation results
Performance of simulated AS systems was evaluated in this study. The data obtained
at steady state from the nine experimental runs as well as concentration of XH are
summarized in Table 6-5. Significant removal of tCOD (average COD removal > 95%)
and SS clarification (average VSSeff < 3 mg/ L) was achieved in all AS systems operating
at various HRTs and SRTs. However, higher removal efficiency was observed for COD
and ammonia in the reactor operating at SRT of 15 d and the lowest removal rate was
found in the reactor operating at HRT of 4 h and SRT of 5 d. It was found that the mixed
liquor volatile suspended solids (MLVSS) concentrations increased with increase of SRT,
also higher values were found for rectors operating at higher HRTs.
To investigate the fate of the selected MCs in the AS system, the mass balance
analysis was performed for each compound and total MCs mass fluxes were determined
using Eqs. (6-4 and 6-5). The result of mass balance analysis (Table 6-6) showed high
biodegradation or biotransformation potential of selected MCs.
The highest biotransformation removal rate was found for TCS and BPA in reactors
operating at higher SRTs, whereas the lower biotransformation removal rate of 58% was
found for EE2 in the reactor operating at SRT of 5 d and HRT of 4 h.

P a g e | 223
Table 6-5 Comparison of biological performance of experimental runs
Runs Phase B Phase C Phase D
1 2 3 4 5 6 7 8 9 Parameter Unit
Q L/d 11.22 ± 0.6
12.52 ± 0.8
11.5 ± 1.0
7.2 ± 0.8
7.15 ± 0.4
7.13 ± 0.2
18.6 ± 0.5
17.85 ± 1.1
18.23 ± 0.4
HRT h 6 6 6 10 10 10 4 4 4
SRT d 5 10 15 5 10 15 5 10 15
MLTSS mg/
L 1677 ± 137
2935 ± 133
4005 ± 171
1188 ± 129
1805 ± 119
2498 ± 142
2774 ± 287
4440 ± 152
5965 ± 229
MLVSS mg/
L 1563 ± 130
2685 ± 121
3601 ± 149
1112 ± 127
1681 ± 136
2302 ± 138
2571 ± 261
4085 ± 158
5335 ± 205
XH mg/
L 1030 1502 1765 745 958 1151 1670 2290 2560
XH/MLVSS - 0.66 0.56 0.49 0.67 0.57 0.5 0.65 0.56 0.48
tCODreactor mg/
L 1976 ± 275
3556 ± 240
4962 ± 419
1398 ± 164
2093 ± 247
2920 ± 158
3322 ± 300
5347 ± 256
7007 ± 481
sCODreactor mg/
L 41.2 ± 2.4
38.2 ± 3.6
33.3 ± 4.1
36.8 ± 2.8
27.4 ± 2.1
28.8 ± 3.3
52.2 ± 1.9
46.3 ± 3.4
28.1 ± 4.8
COD eff mg/
L 37.7 ± 3.4
35.6 ± 4
25.9 ± 3.5
34.8 ± 3.3
24.3 ± 1.7
23.5 ± 2.4
46.1 ± 6.7
40 ± 6.9
24.8 ± 5.6
VSS eff mg/
L 2.8 ± 1.3
2.7 ± 1
3 ± 1.1
2.8 ± 1 3.2 ± 0.7
3.1 ± 1.5
2.8 ± 1 3.2 ± 0.7
3.1 ± 1.5
TN-N eff mg/
L 36.7 ± 1.1
36.8 ± 3.1
35.6 ± 2.5
35.8 ± 2.9
35.4 ± 1.5
36.3 ± 2.1
36.4 ± 0.57
36.5 ± 1.36
36.3 ± 0.33
TKN-N eff mg/
L 5.2 ± 0.8
4.6 ± 0.3
5.4 ± 0.4
7.6 ± 1.59
6.4 ± 0.29
3.16 ± 1.8
6.38 ± 0.86
7.37 ± 0.6
2.94 ± 0.5
NH4-N eff mg/
L 0.64 ± 0.1
0.43 ± 0.1
0.01 ± 0.01
3.27 ± 0.84
0.62 ± 0.31
0.14 ± 0.08
0.17 ± 0.13
0.83 ± 0.55
0.28 ± 0.16
NO3-N eff mg/
L 30.6 ± 3
31.7 ± 4.4
29.4 ± 3.3
29.8 ± 2.26
30.56 ± 2.6
33.18 ± 1.89
30.04 ± 0.91
29.15 ± 1.69
33.46 ± 0.63
pH reactor - 7.21 ± 0.3
6.92 ± 0.4
7.02 ± 0.2
7.52 ± 0.44
6.88 ± 0.21
6.9 ± 0.3
7.33 ± 0.2
7.14 ± 0.15
7.29 ± 0.31
Tempreactor °C 25 ± 0.3
25 ± 0.7
25 ± 0.6
25 ± 0.4
25 ± 0.1
25 ± 0.6
25 ± 0.2
25 ± 0.5
25 ± 0.8
The concenrations are given as the mean values (n = 27) ± the standard deviation, measured in the period of two weeks
The mass flux observations in excess sludge showed that the removal of selected
MCs due to the sludge disposal was minimal in all experimental runs. Similar results
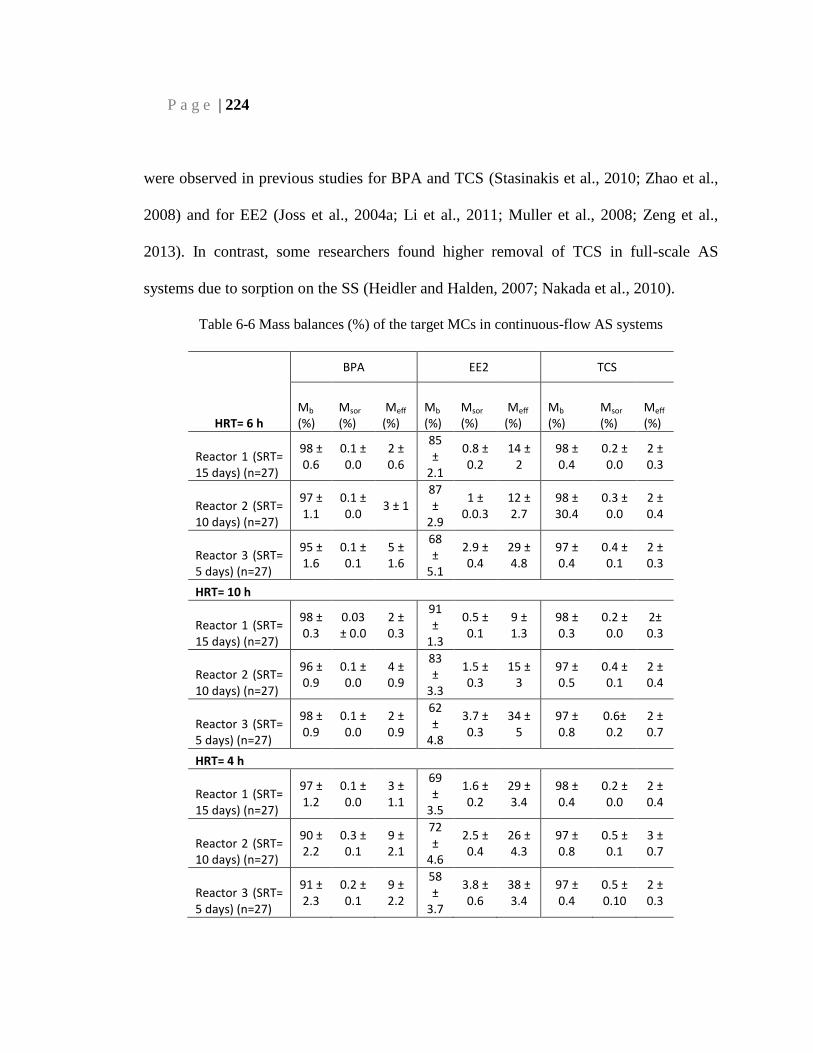
P a g e | 224
were observed in previous studies for BPA and TCS (Stasinakis et al., 2010; Zhao et al.,
2008) and for EE2 (Joss et al., 2004a; Li et al., 2011; Muller et al., 2008; Zeng et al.,
2013). In contrast, some researchers found higher removal of TCS in full-scale AS
systems due to sorption on the SS (Heidler and Halden, 2007; Nakada et al., 2010).
Table 6-6 Mass balances (%) of the target MCs in continuous-flow AS systems
BPA EE2 TCS
HRT= 6 h Mb (%)
Msor
(%) Meff
(%) Mb (%)
Msor (%)
Meff
(%) Mb (%)
Msor (%)
Meff
(%)
Reactor 1 (SRT= 15 days) (n=27)
98 ± 0.6
0.1 ± 0.0
2 ± 0.6
85 ±
2.1
0.8 ± 0.2
14 ± 2
98 ± 0.4
0.2 ± 0.0
2 ± 0.3
Reactor 2 (SRT= 10 days) (n=27)
97 ± 1.1
0.1 ± 0.0
3 ± 1 87 ±
2.9
1 ± 0.0.3
12 ± 2.7
98 ± 30.4
0.3 ± 0.0
2 ± 0.4
Reactor 3 (SRT= 5 days) (n=27)
95 ± 1.6
0.1 ± 0.1
5 ± 1.6
68 ±
5.1
2.9 ± 0.4
29 ± 4.8
97 ± 0.4
0.4 ± 0.1
2 ± 0.3
HRT= 10 h
Reactor 1 (SRT= 15 days) (n=27)
98 ± 0.3
0.03 ± 0.0
2 ± 0.3
91 ±
1.3
0.5 ± 0.1
9 ± 1.3
98 ± 0.3
0.2 ± 0.0
2± 0.3
Reactor 2 (SRT= 10 days) (n=27)
96 ± 0.9
0.1 ± 0.0
4 ± 0.9
83 ±
3.3
1.5 ± 0.3
15 ± 3
97 ± 0.5
0.4 ± 0.1
2 ± 0.4
Reactor 3 (SRT= 5 days) (n=27)
98 ± 0.9
0.1 ± 0.0
2 ± 0.9
62 ±
4.8
3.7 ± 0.3
34 ± 5
97 ± 0.8
0.6± 0.2
2 ± 0.7
HRT= 4 h
Reactor 1 (SRT= 15 days) (n=27)
97 ± 1.2
0.1 ± 0.0
3 ± 1.1
69 ±
3.5
1.6 ± 0.2
29 ± 3.4
98 ± 0.4
0.2 ± 0.0
2 ± 0.4
Reactor 2 (SRT= 10 days) (n=27)
90 ± 2.2
0.3 ± 0.1
9 ± 2.1
72 ±
4.6
2.5 ± 0.4
26 ± 4.3
97 ± 0.8
0.5 ± 0.1
3 ± 0.7
Reactor 3 (SRT= 5 days) (n=27)
91 ± 2.3
0.2 ± 0.1
9 ± 2.2
58 ±
3.7
3.8 ± 0.6
38 ± 3.4
97 ± 0.4
0.5 ± 0.10
2 ± 0.3

P a g e | 225
The mass of MCs biotransformed from bioreactors were normalized for one gram of
MLVSS in the reactor (Figure 6-1) and it was found that biomass in reactors operating at
different SRTs and HRTs had different performances with regards to MCs degradation
and the SRT did not exhibit a straightforward trend for removal of an MC. This result is
in agreement with other studies in the literature (Majewsky et al., 2011; Stasinakis et al.,
2010) and could be explained by the fact that only a fraction of SS can be considered as
active biomass. Moreover, not all the active biomass can degrade MCs in AS systems, so
it is reasonable to assume specific microorganisms are responsible for degradation of
MCs.
Figure 6-1. Effect of operational conditions on biomass degradation performance normalized to
VSS

P a g e | 226
6.3.2 Parameter estimation results
Table 6-7 shows the estimated parameters (Km, Kc, Kms, Kmp) for each experimental
run. The amount of Xc for reactors operating at different SRTs and HRTs were also
calculated by optimizing the analytical solution to Eq. 6-6 and minimizing the sum of χ2
in parameter estimation procedures.
Table 6-7 Estimation of biodegradation kinetics for each model and the sum of chi squares
Model
No.
Estimated Parameters
BPA EE2 TCS
Km Kms Kmp Kc Σ χ2 Km Kms Kmp Kc Σ χ
2 Km Kms Kmp Kc Σ χ
2
1 79.6 42.4 62.0 45.7 97.2 37.0
2 72.3 14.5 11.5 18.6 184.6 7.4
3a 31.4 18.6 2.9 11.4 25.6 3.8
3b 48.0 12.9 4.4 16.4 46.8 2.4
3c 61.1 10.1 7.6 7.8 57.0 1.8
4a 72.3 0.0 14.5 3.8 2.6 11.3 79.7 17.8 2.7
4b 35.2 74.2 12.3 2.7 5.5 16.3 50.0 46.1 2.5
5a 21.6 19.2 3.8 14.5 61.4 4.0
5b 50.4 10.8 7.2 18.5 126.3 2.7
5c 121.7 0.0 21.1 0.0 172.9 0.0
6a 7.9 28.0 0.7 23.7 6.1 14.0
6b 22.3 12.4 1.5 21.3 14.5 7.7
6c 51.7 4.4 4.3 6.1 19.3 6.2
7a 40.2 0.0 67.1 3.8 0.0 14.5 61.4 0.0 4.0
7b 42.5 6.7 10.5 5.9 0.4 18.2 114.9 1.6 2.6
7c 121.7 0.0 0.0 21.0 0.0 0.0 172.8 0.0 0.0
8 32.7 9.5 2.5 22.7 26.9 5.8
9 17.6 59.5 9.2 7.2 0.0 18.5 126.3 0.0 2.7
10 136.8 0.5 5.3 71.9 0.6 8.6 200.0 1147 72.0
11a 38.4 0.3 4.6 20.9 0.0 4.4 179.8 2.4 4.0
11b 53.6 0.3 5.0 41.5 0.3 5.9 65.9 0.3 4.8
11c 130.0 0.5 11.6 71.9 0.5 15.5 179.8 0.5 0.4
P a g e | 227
The concentrations of Xc in reactors operating at different HRT and SRT were
compared to the concentration of active biomass found experimentally in this study
(Table 6-8).
The result of XC estimation showed that SRT plays an important role in formation of
the biomass capable of degrading selected MCs. It is also observed that the MCs
degraders are naturally present in the AS system even at low SRTs; however, the
concentration of Xc is much lower at SRT of 5 d compared to SRT of 15 d. The simplest
explanation is growth of slow growing biomass and diversified enzymes which might not
be present as much in reactors operating at lower SRTs.
Similar results were reported in the literature that links higher SRTs to growth of
specific MCs degraders (Lindblom et al., 2009; Majewsky et al., 2011; Melcer and
Klecka, 2011). In contrast, Helbling et al. (2012) reviewed the MCs biotransformation
kinetic and microbial communities in different WWTPs and indicated that neither
biomass concentrations nor sludge age alone can explain the variability in
biotransformation of a diverse set of MCs in WWTPs. However in those reviewed studies
biomass concentrations were mostly estimated by VSS concentration and XC were not
identified.
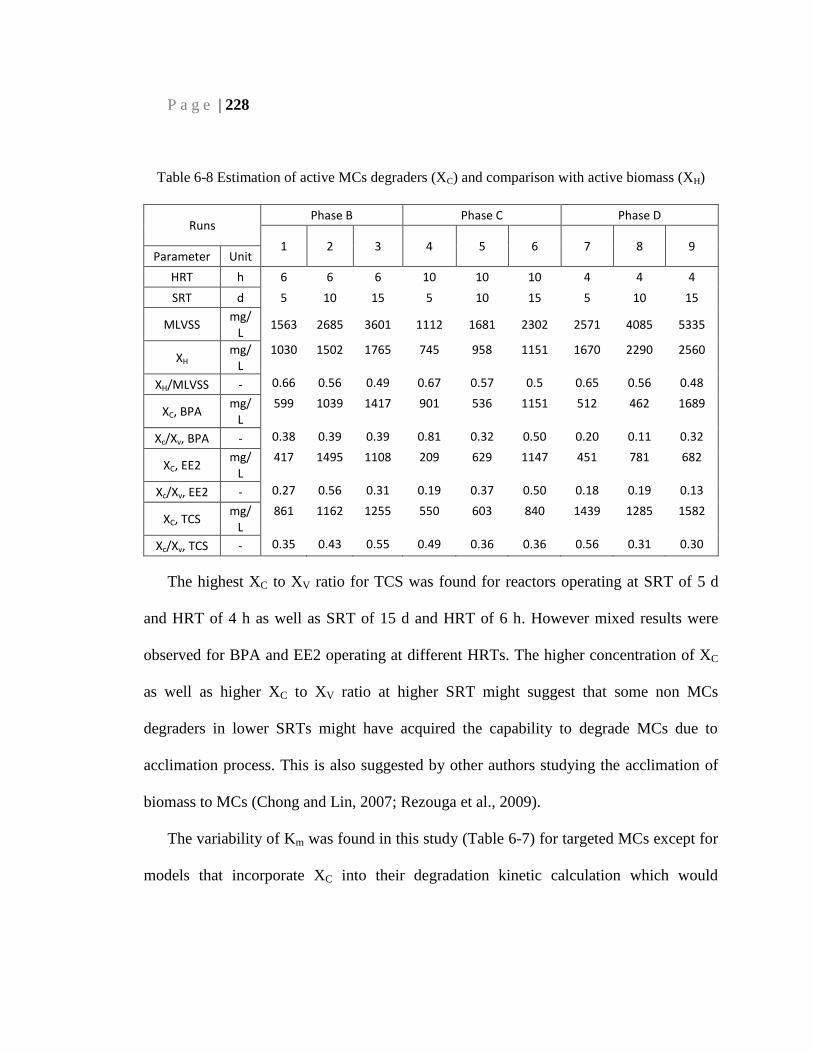
P a g e | 228
Table 6-8 Estimation of active MCs degraders (XC) and comparison with active biomass (XH)
Runs Phase B Phase C Phase D
1 2 3 4 5 6 7 8 9 Parameter Unit
HRT h 6 6 6 10 10 10 4 4 4
SRT d 5 10 15 5 10 15 5 10 15
MLVSS mg/
L 1563 2685 3601 1112 1681 2302 2571 4085 5335
XH mg/
L 1030 1502 1765 745 958 1151 1670 2290 2560
XH/MLVSS - 0.66 0.56 0.49 0.67 0.57 0.5 0.65 0.56 0.48
XC, BPA mg/
L 599 1039 1417 901 536 1151 512 462 1689
Xc/Xv, BPA - 0.38 0.39 0.39 0.81 0.32 0.50 0.20 0.11 0.32
XC, EE2 mg/
L 417 1495 1108 209 629 1147 451 781 682
Xc/Xv, EE2 - 0.27 0.56 0.31 0.19 0.37 0.50 0.18 0.19 0.13
XC, TCS mg/
L 861 1162 1255 550 603 840 1439 1285 1582
Xc/Xv, TCS - 0.35 0.43 0.55 0.49 0.36 0.36 0.56 0.31 0.30
The highest XC to XV ratio for TCS was found for reactors operating at SRT of 5 d
and HRT of 4 h as well as SRT of 15 d and HRT of 6 h. However mixed results were
observed for BPA and EE2 operating at different HRTs. The higher concentration of XC
as well as higher XC to XV ratio at higher SRT might suggest that some non MCs
degraders in lower SRTs might have acquired the capability to degrade MCs due to
acclimation process. This is also suggested by other authors studying the acclimation of
biomass to MCs (Chong and Lin, 2007; Rezouga et al., 2009).
The variability of Km was found in this study (Table 6-7) for targeted MCs except for
models that incorporate XC into their degradation kinetic calculation which would

P a g e | 229
suggest that even though the operational conditions such as SRT and HRT can play an
important role in MCs degradation in AS systems, but the use of traditional parameters
such as VSS, TSS and more advanced parameter (e.g., XH) could not explain how
different AS communities can have very different MCs biotransformation capabilities
even in terms of specific biotransformation reaction at the individual MC level. These
variations in Km values were also found by other studies in the literature and authors were
mostly unable to explain the reason behind their findings except linking it to the type and
characteristic of the biomass in different AS systems (Helbling et al., 2012; Majewsky et
al., 2011; Stasinakis et al., 2010; Ziels et al., 2014). However, by evaluating their models
it was found that they have mostly used first-order and pseudo second-order kinetic
models with respect to VSS in their models and did not incorporate XC which in this
study has been found to be an important parameter to estimate the fate of MCs in AS
systems. It should be noted that the concentration of XC was estimated mathematically in
this study and further experimental studies are needed to better understand the role of
specific microorganism in degradation of MCs in AS systems by using fluorescent in
situ hybridization (FISH) with group-specific rRNA-targeted probes as described in the
literature (Thayanukul et al., 2010; Zang et al., 2008).
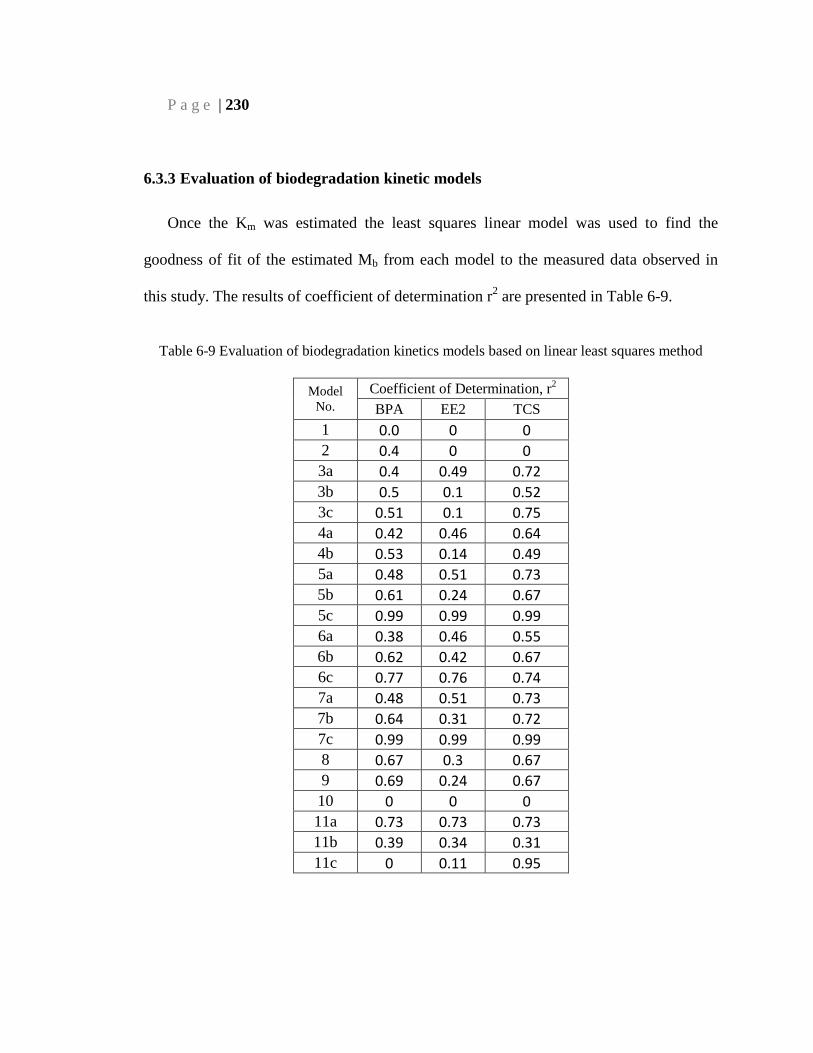
P a g e | 230
6.3.3 Evaluation of biodegradation kinetic models
Once the Km was estimated the least squares linear model was used to find the
goodness of fit of the estimated Mb from each model to the measured data observed in
this study. The results of coefficient of determination r2 are presented in Table 6-9.
Table 6-9 Evaluation of biodegradation kinetics models based on linear least squares method
Model
No.
Coefficient of Determination, r2
BPA EE2 TCS
1 0.0 0 0
2 0.4 0 0
3a 0.4 0.49 0.72
3b 0.5 0.1 0.52
3c 0.51 0.1 0.75
4a 0.42 0.46 0.64
4b 0.53 0.14 0.49
5a 0.48 0.51 0.73
5b 0.61 0.24 0.67
5c 0.99 0.99 0.99
6a 0.38 0.46 0.55
6b 0.62 0.42 0.67
6c 0.77 0.76 0.74
7a 0.48 0.51 0.73
7b 0.64 0.31 0.72
7c 0.99 0.99 0.99
8 0.67 0.3 0.67
9 0.69 0.24 0.67
10 0 0 0
11a 0.73 0.73 0.73
11b 0.39 0.34 0.31
11c 0 0.11 0.95
P a g e | 231
The evaluation of biodegradation kinetic models showed that pseudo second-order
model with degradation by active MCs degraders only in the soluble phase (model 5c)
and soluble and solid phases (7c) fit the experimental data efficiently. However, the
estimated value of Kmp in model 7c (close to zero) results in the same model as in 5c
(Table 6-9). To investigate the possible degradation of sorbed MCs by model 7c, more
constraints were applied into the estimation process and it was found that a value of Kmp
less than 10 would still result in a very good coefficients of determination for BPA but
not for TCS and EE2 (data not shown). Model 11a also showed a good agreement with
the experimental results (r2= 73%), however the Kc values found in this model for
selected MCs were very small (0-2.4 µg/L). Other model that showed promising
application was model 6c, which assumes degradation in both solid and liquid phases
with the same kinetic rate. By comparing models 5a, b with 6a, b, it was found that
assuming possible degradation in both solid and liquid phases would not necessarily
increase the goodness of fit in those models.
6.4 Conclusions
The operation of continuous-flow AS systems in the presence of 20 µg/L of MCs
indicated that 90-98, 63-91 and 97-98% of BPA, EE2 and TCS, respectively, can be
removed during the AS process in systems operating at SRT of 5–15 d and HRT of 4-10
h. Determination of MCs in the dissolved and particulate phase and calculation of their
mass flux showed that biotransformation was the principal removal mechanism of
P a g e | 232
selected MCs. Evaluation of various biodegradation kinetic models showed poor
agreement between measured data and modeled values except for the pseudo-second-
order model with degradation by active MCs degraders only in soluble phase. The result
of this study could be seen in the context, where the active MCs degraders are proposed
to reduce the variability of Km in AS systems operating at different operational
conditions. This study also explains why other researchers using Xv, XT, and XH in their
models (Majewsky et al., 2011; Stasinakis et al., 2010; Ziels et al., 2014) found different
biodegradation kinetics for the same compound in various AS systems.
6.5 References
Abegglen C, Joss A, McArdell CS, Fink G, Schlusener MP, Ternes TA, et al. The fate of
selected micropollutants in a single-house MBR. Water Res 2009; 43: 2036-46.
Atkinson SK, Marlatt VL, Kimpe LE, Lean DR, Trudeau VL, Blais JM. The occurrence
of steroidal estrogens in south-eastern Ontario wastewater treatment plants. Sci
Total Environ 2012; 430: 119-25.
Banihashemi B, Droste RL. Evaluation of Biodegradation Kinetics Models for
Microconstituents Under Typical Sewage Treatment Conditions. Water
Environment Federation 2011: 5049-5061.
Banihashemi B, Droste RL. Trace level determination of bisphenol-A in wastewater and
sewage sludge by high-performance liquid chromatography and UV detection.
Water Quality Research Journal of Canada 2013; 48: 133-144.
Banihashemi B, Droste RL. Sorption-desorption and biosorption of bisphenol A,
triclosan, and 17alpha-ethinylestradiol to sewage sludge. Sci Total Environ 2014;
487: 813-21.
Barret M, Patureau D, Latrille E, Carrere H. A three-compartment model for
micropollutants sorption in sludge: methodological approach and insights. Water
Res 2010; 44: 616-24.
Bennie DT, Struger, J.S. Pharmaceuticals and personal care products (PPCP) in Canadian
urban waters: Research and policy directions. Environment Canada, 2008.

P a g e | 233
Borrirukwisitsak S, Keenan HE, Gauchotte-Lindsay C. Effects of salinity, pH and
temperature on the octanol-water partition coefficient of bisphenol A.
International Journal of Environmental Science and Development 2012; 3(5):
460-464.
Byrns G. The fate of xenobiotic organic compounds in wastewater treatment plants.
Water Res 2001; 35: 2523-33.
Carballa M, Omil F, Lema JM. Calculation methods to perform mass balances of
micropollutants in sewage treatment plants. application to pharmaceutical and
personal care products (PPCPs). Environ Sci Technol 2007; 41: 884-90.
Chong NM, Lin TY. Measurement of the degradation capacity of activated sludge for a
xenobiotic organic. Bioresour Technol 2007; 98: 1124-7.
Clara M, Kreuzinger N, Strenn B, Gans O, Kroiss H. The solids retention time-a suitable
design parameter to evaluate the capacity of wastewater treatment plants to
remove micropollutants. Water Res 2005; 39: 97-106.
Cowan CE, Larson RJ, Feijtel TCJ, Rapaport RA. An improved model for predicting the
fate of consumer product chemicals in wastewater treatment plants. Water
Research 1993; 27: 561-573.
Deblonde T, Cossu-Leguille C, Hartemann P. Emerging pollutants in wastewater: a
review of the literature. Int J Hyg Environ Health 2011; 214: 442-8.
Feng Y, Zhang Z, Gao P, Su H, Yu Y, Ren N. Adsorption behavior of EE2 (17 alpha-
ethinylestradiol) onto the inactivated sewage sludge: kinetics, thermodynamics
and influence factors. J Hazard Mater 2010; 175: 970-6.
Fernandez-Fontaina E, Pinho I, Carballa M, Omil F, Lema JM. Biodegradation kinetic
constants and sorption coefficients of micropollutants in membrane bioreactors.
Biodegradation 2013; 24: 165-77.
Fernandez MP, Ikonomou MG, Buchanan I. An assessment of estrogenic organic
contaminants in Canadian wastewaters. Sci Total Environ 2007; 373: 250-69.
Govind R, Lai L, Dobbs R. Integrated model for predicting the fate of organics in
wastewater treatment plants. Environmental Progress 1991; 10: 13-23.
Heberer T. Tracking persistent pharmaceutical residues from municipal sewage to
drinking water. Journal of Hydrology 2002; 266: 175-189.
Heidler J, Halden RU. Mass balance assessment of triclosan removal during conventional
sewage treatment. Chemosphere 2007; 66: 362-9.
Helbling DE, Johnson DR, Honti M, Fenner K. Micropollutant biotransformation kinetics
associate with WWTP process parameters and microbial community
characteristics. Environ Sci Technol 2012; 46: 10579-88.
Jacobsen BN, Arvin E. Biodegradation kinetics and fate modelling of pentachlorophenol
in bioaugmented activated sludge reactors. Water Research 1996; 30: 1184-1194.
Joss A, Andersen H, Ternes T, Richle PR, Siegrist H. Removal of Estrogens in Municipal
Wastewater Treatment under Aerobic and Anaerobic Conditions: Consequences
P a g e | 234
for Plant Optimization. Environmental Science & Technology 2004; 38: 3047-
3055.
Joss A, Zabczynski S, Gobel A, Hoffmann B, Loffler D, McArdell CS, et al. Biological
degradation of pharmaceuticals in municipal wastewater treatment: proposing a
classification scheme. Water Res 2006; 40: 1686-96.
Klecka GM, Staples CA, Clark KE, Van der Hoeven N, Thomas DE, Hentges SG.
Exposure analysis of bisphenol A in surface water systems in North America and
Europe. Environ Sci Technol 2009; 43: 6145-50.
Kumar AK, Mohan SV, Sarma PN. Sorptive removal of endocrine-disruptive compound
(estriol, E3) from aqueous phase by batch and column studies: kinetic and
mechanistic evaluation. J Hazard Mater 2009; 164: 820-8.
Lai KM, Johnson KL, Scrimshaw MD, Lester JN. Binding of waterborne steroid
estrogens to solid phases in river and estuarine systems. Environmental Science &
Technology 2000; 34: 3890-3894.
Lapworth DJ, Baran N, Stuart ME, Ward RS. Emerging organic contaminants in
groundwater: A review of sources, fate and occurrence. Environ Pollut 2012; 163:
287-303.
Larcher S, Yargeau V. Biodegradation of 17alpha-ethinylestradiol by heterotrophic
bacteria. Environ Pollut 2013; 173: 17-22.
Latorre A, Lacorte S, Barcelo D. Presence of nonylphenol, octyphenol and bisphenol a in
two aquifers close to agricultural, industrial and urban areas. Chromatographia
2003; 57: 111-116.
Lee do G, Zhao F, Rezenom YH, Russell DH, Chu KH. Biodegradation of triclosan by a
wastewater microorganism. Water Res 2012; 46: 4226-34.
Lee HB, Peart TE, Chan J, Gris G. Occurrence of endocrine-disrupting chemicals in
sewage and sludge samples in Toronto, Canada. Water Quality Research Journal
of Canada 2004; 39: 57-63.
Lee KC, Rittmann BE, Shi JC, McAvoy D. Advanced steady-state model for the fate of
hydrophobic and volatile compounds in activated sludge. Water Environment
Research 1998; 70: 1118-1131.
Li F, Yuasa A, Obara A, Mathews AP. Aerobic batch degradation of 17-beta estradiol
(E2) by activated sludge: effects of spiking E2 concentrations, MLVSS and
temperatures. Water Res 2005; 39: 2065-75.
Li YM, Zeng QL, Yang SJ. Removal and fate of estrogens in an anaerobic-anoxic-oxic
activated sludge system. Water Sci Technol 2011; 63: 51-6.
Lindblom E, Press-Kristensen K, Vanrolleghem PA, Mikkelsen PS, Henze M. Dynamic
experiments with high bisphenol-A concentrations modelled with an ASM model
extended to include a separate XOC degrading microorganism. Water Res 2009;
43: 3169-76.
P a g e | 235
Lopez-Avila V, Hites RA. Organic compounds in an industrial wastewater. Their
transport into sediments. Environmental Science & Technology 1980; 14: 1382-
1390.
Majewsky M, Galle T, Yargeau V, Fischer K. Active heterotrophic biomass and sludge
retention time (SRT) as determining factors for biodegradation kinetics of
pharmaceuticals in activated sludge. Bioresour Technol 2011; 102: 7415-21.
Marfil-Vega R, Suidan MT, Mills MA. Abiotic transformation of estrogens in synthetic
municipal wastewater: an alternative for treatment? Environ Pollut 2010; 158:
3372-7.
Martin J, Camacho-Munoz D, Santos JL, Aparicio I, Alonso E. Occurrence of
pharmaceutical compounds in wastewater and sludge from wastewater treatment
plants: removal and ecotoxicological impact of wastewater discharges and sludge
disposal. J Hazard Mater 2012; 239-240: 40-7.
Maurer M, Escher BI, Richle P, Schaffner C, Alder AC. Elimination of beta-blockers in
sewage treatment plants. Water Res 2007; 41: 1614-22.
Melcer H, Klecka G. Treatment of wastewaters containing bisphenol A: state of the
science review. Water Environ Res 2011; 83: 650-66.
Mohapatra DP, Brar SK, Tyagi RD, Surampalli RY. Occurrence of bisphenol A in
wastewater and wastewater sludge of CUQ treatment plant. Journal of
Xenobiotics 2011; 1.
Muller M, Rabenoelina F, Balaguer P, Patureau D, Lemenach K, Budzinski H, et al.
Chemical and biological analysis of endocrine-disrupting hormones and
estrogenic activity in an advanced sewage treatment plant. Environ Toxicol Chem
2008; 27: 1649-58.
Nakada N, Yasojima M, Okayasu Y, Komori K, Suzuki Y. Mass balance analysis of
triclosan, diethyltoluamide, crotamiton and carbamazepine in sewage treatment
plants. Water Sci Technol 2010; 61: 1739-47.
Nie Y, Qiang Z, Zhang H, Adams C. Determination of endocrine-disrupting chemicals in
the liquid and solid phases of activated sludge by solid phase extraction and gas
chromatography-mass spectrometry. J Chromatogr A 2009; 1216: 7071-80.
Plósz BG, Langford KH, Thomas KV. An activated sludge modeling framework for
xenobiotic trace chemicals (ASM-X): Assessment of diclofenac and
carbamazepine. Biotechnology and Bioengineering 2012; 109: 2757-2769.
Plosz BG, Leknes H, Thomas KV. Impacts of competitive inhibition, parent compound
formation and partitioning behavior on the removal of antibiotics in municipal
wastewater treatment. Environ Sci Technol 2010; 44: 734-42.
Pomiès M, Choubert JM, Wisniewski C, Coquery M. Modelling of micropollutant
removal in biological wastewater treatments: a review. Sci Total Environ 2013;
443: 733-48.

P a g e | 236
Press-Kristensen K, Lindblom E, Henze M. Modelling as a tool when interpreting
biodegradation of micro pollutants in activated sludge systems. Water Science
and Technology 2007; 56: 11-16.
Radjenovic J, Petrovic M, Barcelo D. Fate and distribution of pharmaceuticals in
wastewater and sewage sludge of the conventional activated sludge (CAS) and
advanced membrane bioreactor (MBR) treatment. Water Res 2009; 43: 831-41.
Ramdani A, Dold P, Deleris S, Lamarre D, Gadbois A, Comeau Y. Biodegradation of the
endogenous residue of activated sludge. Water Res 2010; 44: 2179-88.
Ramdani A, Dold P, Gadbois A, Deleris S, Houweling D, Comeau Y. Characterization of
the heterotrophic biomass and the endogenous residue of activated sludge. Water
Res 2012; 46: 653-68.
Rezouga F, Hamdi M, Sperandio M. Variability of kinetic parameters due to biomass
acclimation: case of para-nitrophenol biodegradation. Bioresour Technol 2009;
100: 5021-9.
Robinson BJ, Hui JP, Soo EC, Hellou J. Estrogenic compounds in seawater and sediment
from Halifax Harbour, Nova Scotia, Canada. Environ Toxicol Chem 2009; 28:
18-25.
Seyhi B, Drogui P, Buelna G, Blais JF. Modeling of sorption of bisphenol A in sludge
obtained from a membrane bioreactor process. Chemical Engineering Journal
2011; 172: 61-67.
Shen G, Huang J, Yu G. Measurement of the free concentrations of alkyl phenols and
bisphenol A to determine their biodegradation kinetics by activated sludge.
Chinese Science Bulletin 2007; 52: 2766-2770.
Shi J, Fujisawa S, Nakai S, Hosomi M. Biodegradation of natural and synthetic estrogens
by nitrifying activated sludge and ammonia-oxidizing bacterium Nitrosomonas
europaea. Water Res 2004; 38: 2322-9.
Stasinakis AS, Gatidou G, Mamais D, Thomaidis NS, Lekkas TD. Occurrence and fate of
endocrine disrupters in Greek sewage treatment plants. Water Res 2008; 42:
1796-804.
Stasinakis AS, Kordoutis CI, Tsiouma VC, Gatidou G, Thomaidis NS. Removal of
selected endocrine disrupters in activated sludge systems: effect of sludge
retention time on their sorption and biodegradation. Bioresour Technol 2010; 101:
2090-5.
Stasinakis AS, Mermigka S, Samaras VG, Farmaki E, Thomaidis NS. Occurrence of
endocrine disrupters and selected pharmaceuticals in Aisonas River (Greece) and
environmental risk assessment using hazard indexes. Environ Sci Pollut Res Int
2012; 19: 1574-83.
Stevens-Garmon J, Drewes JE, Khan SJ, McDonald JA, Dickenson ER. Sorption of
emerging trace organic compounds onto wastewater sludge solids. Water Res
2011; 45: 3417-26.

P a g e | 237
Suarez S, Reif R, Lema JM, Omil F. Mass balance of pharmaceutical and personal care
products in a pilot-scale single-sludge system: influence of T, SRT and
recirculation ratio. Chemosphere 2012; 89: 164-71.
Tan BL, Hawker DW, Muller JF, Leusch FD, Tremblay LA, Chapman HF. Modelling of
the fate of selected endocrine disruptors in a municipal wastewater treatment plant
in South East Queensland, Australia. Chemosphere 2007; 69: 644-54.
Tchobanoglous G, Burton, F. L., Stensel, D. H. Wastewater engineering: treatment and
reuse. New York: McGraw-Hill, 2003.
Thayanukul P, Zang K, Janhom T, Kurisu F, Kasuga I, Furumai H. Concentration-
dependent response of estrone-degrading bacterial community in activated sludge
analyzed by microautoradiography-fluorescence in situ hybridization. Water Res
2010; 44: 4878-87.
Tomei MC, Annesini MC, Rita S, Daugulis AJ. Biodegradation of 4-nitrophenol in a
two-phase sequencing batch reactor: concept demonstration, kinetics and
modelling. Applied Microbiology and Biotechnology 2008; 80: 1105-12.
Urase T, Kikuta T. Separate estimation of adsorption and degradation of pharmaceutical
substances and estrogens in the activated sludge process. Water Res 2005; 39:
1289-300.
Vulliet E, Cren-Olive C, Grenier-Loustalot MF. Occurrence of pharmaceuticals and
hormones in drinking water treated from surface waters. Environmental
Chemistry Letters 2011; 9: 103-114.
Wick A, Fink G, Joss A, Siegrist H, Ternes TA. Fate of beta blockers and psycho-active
drugs in conventional wastewater treatment. Water Res 2009; 43: 1060-74.
Xue W, Wu C, Xiao K, Huang X, Zhou H, Tsuno H, et al. Elimination and fate of
selected micro-organic pollutants in a full-scale anaerobic/anoxic/aerobic process
combined with membrane bioreactor for municipal wastewater reclamation.
Water Res 2010; 44: 5999-6010.
Yi T, Mackintosh S, Aga DS, Harper WF, Jr. Exploring 17alpha-ethinylestradiol
removal, mineralization, and bioincorporation in engineered bioreactors. Water
Res 2011; 45: 1369-77.
Ying GG, Yu XY, Kookana RS. Biological degradation of triclocarban and triclosan in a
soil under aerobic and anaerobic conditions and comparison with environmental
fate modelling. Environ Pollut 2007; 150: 300-5.
Zang K, Kurisu F, Kasuga I, Furumai H, Yagi O. Analysis of the phylogenetic diversity
of estrone-degrading bacteria in activated sewage sludge using
microautoradiography-fluorescence in situ hybridization. Syst Appl Microbiol
2008; 31: 206-14.
Zeng QL, Li YM, Yang SJ. Sludge Retention Time as a Suitable Operational Parameter
to Remove Both Estrogen and Nutrients in an Anaerobic-Anoxic-Aerobic
Activated Sludge System. Environmental engineering science 2013; 30: 161-169.
P a g e | 238
Zhao J, Li Y, Zhang C, Zeng Q, Zhou Q. Sorption and degradation of bisphenol A by
aerobic activated sludge. J Hazard Mater 2008; 155: 305-11.
Zhou JL, Liu R, Wilding A, Hibberd A. Sorption of selected endocrine disrupting
chemicals to different aquatic colloids. Environ Sci Technol 2007; 41: 206-13.
Zhou X, Oleszkiewicz JA. Biodegradation of oestrogens in nitrifying activated sludge.
Environ Technol 2010; 31: 1263-9.
Ziels RM, Lust MJ, Gough HL, Strand SE, Stensel HD. Influence of Bioselector
Processes on 17alpha-Ethinylestradiol Biodegradation in Activated Sludge
Wastewater Treatment Systems. Environ Sci Technol 2014.
P a g e | 239
Chapter 7: Discussions and Conclusions
The operation of simulated continuous-flow AS systems in the presence of 20 µg/L of
selected MCs showed that these compounds were mostly eliminated during the AS
process. 90-98, 63-91 and 97-98% of BPA, EE2 and TCS, respectively were removed in
systems operating at SRT of 5–15 d and HRT of 4-10 h. The results of sorption
equilibrium study, showed that equilibrium was reached within a few hours between
sorbed and dissolved MCs. Sorption and biosorption studies with inactivated and active
biomass were compared and two stages were distinguished for MCs sorption to AS: a
rapid physico-chemical sorption stage followed by biosorption (possibly by
biodegradation in both solid and liquid phases). However, more studies need to be done
to closely investigate the possible biodegradation or biotransformation of sorbed MCs
into AS by carefully monitoring the 14
C-radiolabeled MCs and their radioactivity within
the biomass, 14
C-CO2, and the substrate.
Freundlich sorption isotherms with values of 1/n close to 1 were found to best fit the
results of sorption batch studies, demonstrating that all tested concentrations result on the
linear part of the Freundlich isotherm. The results of distribution coefficient, Kd of
selected MCs showed the greater tendency of EE2 and TCS for sorption, compared to
P a g e | 240
BPA. The higher desorption kinetic coefficients compared to sorption kinetic coefficients
were found for all three selected MCs. However, rapid sorption and desorption kinetics of
selected MCs suggested that sorption-desorption kinetics cannot limit BPA, EE2, and
TCS biodegradation in biological treatment systems and the equilibrium state assumption
is valid to represent sorption phenomena.
Calculation of mass fluxes and determination of MCs in the dissolved and particulate
phases illustrated that biotransformation was the principal removal mechanism of
selected MCs. Statistical analysis revealed that both SRT and HRT had a significant
effect on the fate of MCs where the highest sorption constant was achieved for a SRT of
10 d for targeted MCs which might be explained by the change of the morphology of the
biomass from reactors operating at different SRTs. Nevertheless, further research needs
to be carried to investigate the microbial morphology of MCs acclimated biomass
originated from reactors operating at various SRTs. Higher biotransformation removal
rate was also found for TCS and BPA in reactors operating at higher SRTs and HRTs,
whereas the lowest rate was found for EE2 in the reactor operating at SRT of 5 d and
HRT of 4 h. In addition, the removal of selected MCs in nitrification-inhibited and
uninhibited AS systems, suggested that AOB might play a role in the fate of the targeted
MCs; however, heterotrophs were most likely responsible for the degradation of selected
MCs.
P a g e | 241
To evaluate the fate models for selected MCs in AS system, various biodegradation
kinetic models were applied to the data collected in biodegradation and sorption studies
and it was found that only pseudo second-order model with degradation by active MCs
degraders could present the data efficiently. This study illustrated why other researchers
using Xv, XT, and XH in their models found different biodegradation kinetics for the same
compound in various AS systems. Therefore, the contribution of this thesis could be seen
in the context, where the active MCs degraders are proposed to reduce the variability of
Km in AS systems operating at different operational conditions.
It should be noted that the concentration of XC was estimated mathematically in this
study and further experimental studies are needed to better understand the role of specific
microorganism in degradation of MCs in AS systems by using fluorescent in situ
hybridization (FISH) with group-specific rRNA-targeted probes or any other appropriate
methods.
Furthermore, studies with broader selection of MCs in full-scale AS systems
operating at various SRTs and HRTs are needed to evaluate the applicability of proposed
model, where dynamic variations are incorporated into the analysis.

P a g e | 242
Appendices
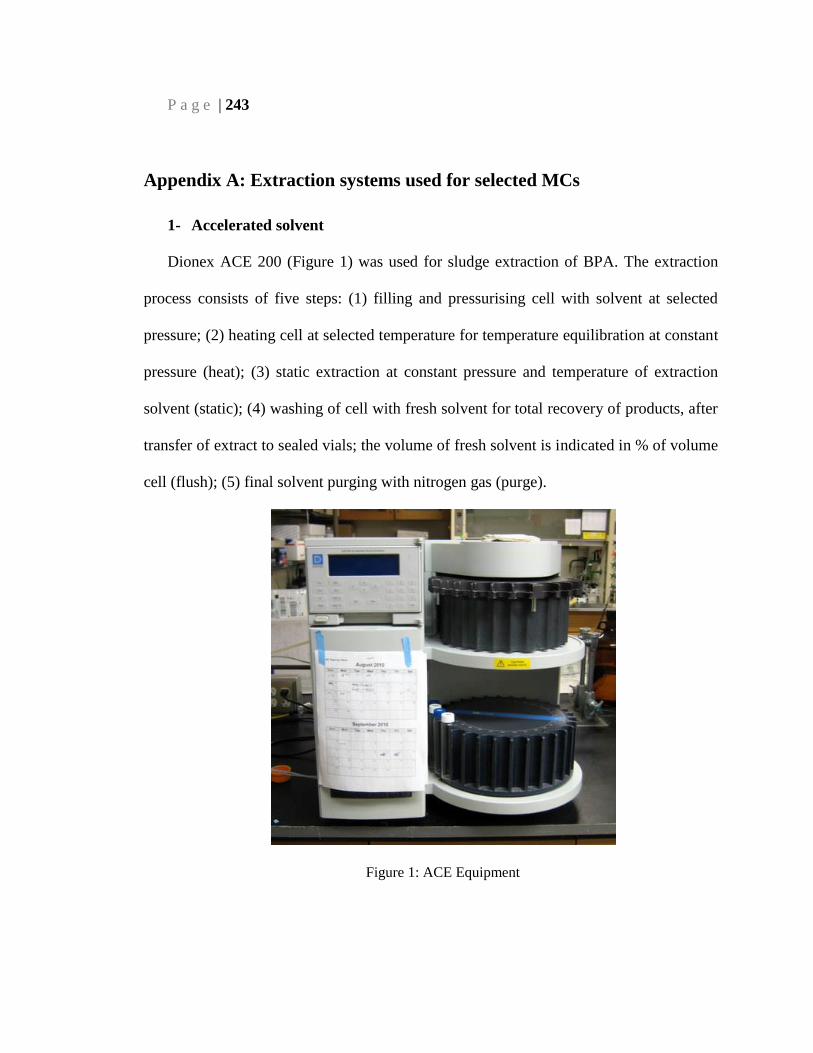
P a g e | 243
Appendix A: Extraction systems used for selected MCs
1- Accelerated solvent
Dionex ACE 200 (Figure 1) was used for sludge extraction of BPA. The extraction
process consists of five steps: (1) filling and pressurising cell with solvent at selected
pressure; (2) heating cell at selected temperature for temperature equilibration at constant
pressure (heat); (3) static extraction at constant pressure and temperature of extraction
solvent (static); (4) washing of cell with fresh solvent for total recovery of products, after
transfer of extract to sealed vials; the volume of fresh solvent is indicated in % of volume
cell (flush); (5) final solvent purging with nitrogen gas (purge).
Figure 1: ACE Equipment

P a g e | 244
2- Ultrasound extraction system
For extraction of BPA from sludge, a sonifier system (Branson model S-450D) was
used (Figure 2). This device consists of a power supply, a converter, a mechanical probe
or horn and a tip. The converter changes standard electrical power to high frequency
mechanical energy, which is then applied to the horn, where it is further amplified by the
tip and penetrated to the waste sample. Frequency of the sonifier is 20 KHz.
Figure 2: US Equipment
3- Microwave-assisted extraction procedure
MW extraction were carried out with a Mars 5® (MW Accelerated Reaction System;
CEM Corporation) MW oven (Figure 3). Mars 5®
has a frequency of 2450 MHz and can
deliver 1200 W±15% of MW energy at full power with complete MW penetration of the
sample vessels. With its temperature and pressure sensors it is possible to monitor and

P a g e | 245
control operating conditions up to 250ºC and 3.5 MPa. This system allowed up to 14
extraction vessels to be irradiated simultaneously. This extraction method uses MW
energy to produce elevated temperature and pressure conditions (i.e., 100 - 115⁰C and 50
- 175 psi) in a closed vessel.
The main components of the Mars 5® MW oven as shown in Figure 4 are:
Magnetron: Generates the MWs.
Wave guide: Directs the waves to MW cavity
Mode stirrer: Distributes the incoming energy
Cavity: Where the mode stirrer distributes the incoming energy
Heat dissipater: Safely dissipates the reflected energy to protect the magnetron
Isolator: Directs the lost energy to heat dissipater
Vessel: holds sample
Figure 3: Mars 5® Microwave apparatus

P a g e | 246
Figure 4: Mars 5® Vessel (HP-500)
4- High Pressure Homogenizer extraction
High pressure homogenizing extraction were carried out with the EmulsiFlex-C3
homogenizer which is powered by an electric motor, homogenizing valve, pressurize tank
(adjustable between 500 and 30000 psi or 35 and 2000 bar) and temperature control
system by heat exchanger (Figure 5).
Figure 5: EmulsiFlex-C3 homogenizer
HHeeaatt DDiissssiippaattoorr
MMaaggnneettrroonn
IIssoollaattoorr WWaavveegguuiiddee
RReefflleecctteedd
MMiiccrroowwaavvee
VVeesssseell
MMiiccrroowwaavvee
CCaavviittyy
MMiiccrroowwaavveess
MMiiccrroowwaavveess
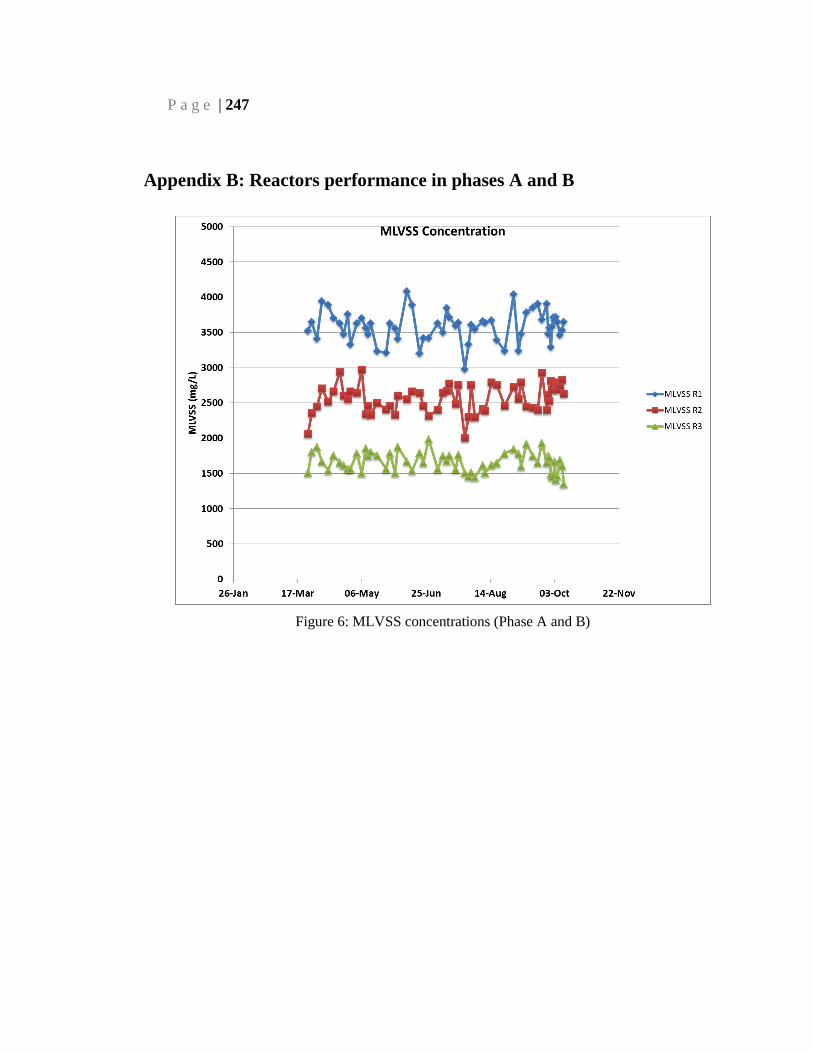
P a g e | 247
Appendix B: Reactors performance in phases A and B
Figure 6: MLVSS concentrations (Phase A and B)
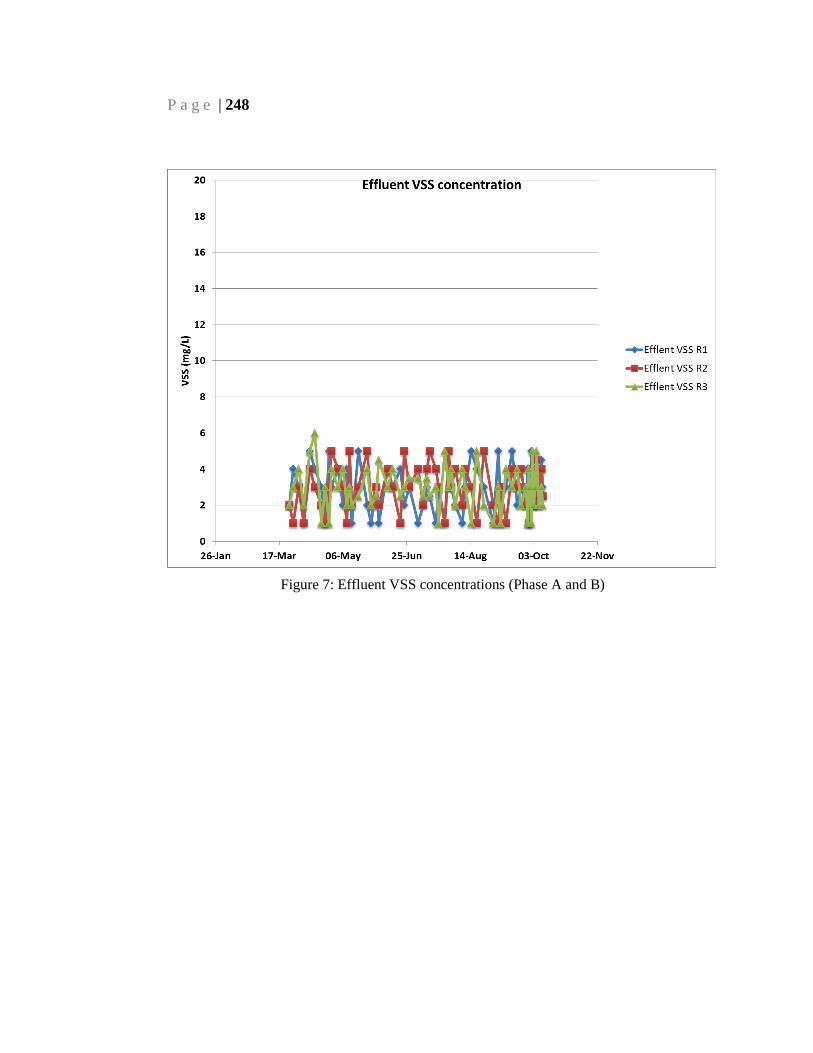
P a g e | 248
Figure 7: Effluent VSS concentrations (Phase A and B)
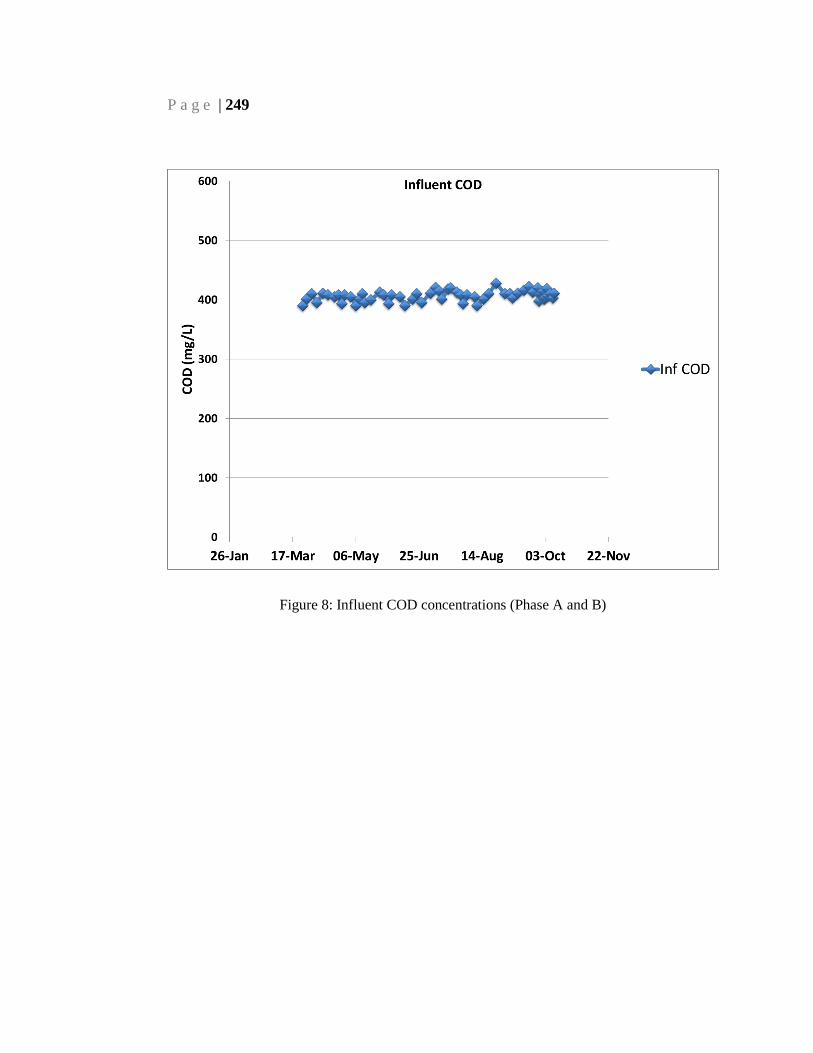
P a g e | 249
Figure 8: Influent COD concentrations (Phase A and B)