general fund (current expense)
TRANSCRIPT

I .,
CITY OF WOODINVILLE, WA
REPORT TO THE CITY COUNCIL 17301 133rd Avenue NE, Woodinville, WA 98072 WWW.CI.WOODINVILLE;WA.US
To: Honorable City Council I Date: 09/20//2016 By: Blaine Fritts, Finance Director '\Z.1f-' rf)
Subject: Public Hearing on Revenue Sources ~ FINANCIAL ACTION SUMMARY V ./
Expenditure Reauired Amount Budaeted/Aooroved Additional Amount Reauired
ISSUE: Shall the City Council open the Public Hearing to consider revenue sources for the current year and anticipated revenues for the upcoming budget?
RECOMMENDATION: To open the Public Hearing and continue it to October 18, 2016.
POLICY DECISION: RCW 35A.33.135 requires a public hearing about revenues for the current year and on revenues to be considered for the upcoming budget. This Public Hearing will discuss all sources of revenue, including property taxes, which will be adopted in the biennial budget. This hearing is required prior to adopting a property tax ordinance. No action is requested at this time. The City is conducting this hearing to comply with requirements of State Law.
BACKGROUND/DISCUSSION: For the public hearing, Council will receive updated projections for current year revenues, including sales taxes and property taxes. Revenues projected for the upcoming 2017/2018 budget will be discussed when the budget is presented to the City Council at the end of October or first part of November. The funds and sources that will be discussed are shown below:
Fund
General Fund Street Development Services Park & Rec. Special Revenue Admission Tax Traffic Impact Fees Park Impact Fees Hotel/Motel REET 1 & 2 Utility Tax Surface Water Management Capital Improvement Projects
Revenue Source
Various sources State shared Permit fees, service charges Field rentals Admission tax (5%) Impact fees Impact fees Transient rental tax Real estate excise taxes Utility tax Assessments Grants
General Fund (Current Expense) The General Fund (GF) receives revenue from a variety of sources: taxes, charges for service, intergovernmental, licenses and permits, fines and forfeitures, and miscellaneous (interest income, lease revenue, etc.). Revenue from sales taxes and property taxes represent the largest source of revenue for the GF. Combined, these two sources are about 82% of all GF revenue.
l

Sales Tax Sales tax is expected to provide $11.4 million over the 2017/2018 biennium, which is about 3% more than is expected for the 2015/2016 biennium. This forecast assumes an increase in overall sales taxing activities, including an increase in sales tax for construction of 3%. Revenues from construction sales tax, estimated to total $1 .3 million, are dedicated to capital improvement project (CIP) activity and will not be an available resource for operating activity. The slight decline in 2017 is based on expected reduction of construction sales tax revenue as development activity moves into another phase.
The graph below shows sales tax revenue since incorporation and the forecast through 2018.
Sales Tax Revenue 1994 - 2015 Actual; 2016 - 2018 Forecast
$8,000,000
$7,000,000
$6,000,000
$5,000,000
$4,000,000
$3,000,000
$2,000,000
$1,000,000
$0
9~ ~
9~ \,Oj
Property Tax The second largest source of GF revenue is property taxes. Property taxes for the 2017/2018 biennium are forecasted to be $6.05 million. The City received $0.98 per thousand dollars of assessed valuation in 2016, whereas the levy rate for all jurisdictions is $11.24 per thousand. Exclusive of new construction, the last increase in property taxes was a 1% increase in 2015. Prior to that, the last increase was in 2006.
2

l ! .1
I :I :1
;j
I ~1 i
d ·J .! ·J
$3,500,000
$3,000,000
$2,500,000
$2,000,000
$1,500,000
$1,000,000
$500,000
$0
--
tj" en en .-t
~
U") \0 en en en en .-t .-t
__,,,,
" 00 en en en en en en en .-t .-t .-t
Property Tax Revenue - I -1994 2015 Actual 2016 2018 Forecast
---~
I I I I I
0 .-t N t'I") tj" U") \0 " 00 en 0 0 0 0 0 0 0 0 0 0 0 .-t 0 0 0 0 0 0 0 0 0 0 0 N N N N N N N N N N N
--
I I I I I I I
.-t N t'I") tj" U") \0 " 00
.-t .-t .-t .-t .-t .-t .-t .-t 0 0 0 0 0 0 0 0 N N N N N N N N
The City Manager's recommended budget will likely include a 1 % or $31,000 increase in property taxes in 2017 and in 2018. Any additional revenue projected is attributed to new construction.
Licenses and Permits The City anticipates it will receive $377,000 from Cable TV franchise fees for the 2017/2018 biennium. The Business License Program, authorized by the City Council in 2015, is expected to bring in $151,000. Animal license revenue for the biennium is anticipated to be $60,000.
Charges for Service Charges for services are forecasted at $562,000, with most of the revenue coming from administrative charges for Surface Water Management services. The remaining revenue is $60,000 from sales of passports and fingerprinting services and $80,000 from the Northshore School District for its share of the School Resource Officer provided by the City.
Miscellaneous Income This revenue is comprised of interest income, donations, rents received from the Public Works Facility tenants (cell tower and office space), and PEG fees. Interest income is largely a function of investment rates and available cash reserves. Interest revenue is forecasted at $130,000 for the 2017/2018 biennium, PEG fees are forecasted at $26,000, and rental income should provide $273,000.
Intergovernmental Revenue This revenue is comprised mainly of state shared revenues. Projected revenue for the next biennium is $418,000, which is a steep decline from the current biennium projection of $1.4 million. Given the magnitude of the funding issues that Washington State is facing, due in part to the McCleary Decision and a possible mandate to fund Hep-C treatment, there is a real risk of a significant loss of Streamline Sales Tax (SST) and liquor revenues. This forecast reflects the loss of SST and liquor revenue by mid-2017. This Ultra-conservative approach would insulate the City from any drastic action taken by the State in this matter.
3
l

Fines The main source of fine revenue comes from traffic infraction penalties. The remainder is made up of miscellaneous fines. The total revenue estimated for the next biennium is $129,000.
Street Fund Street Fund revenue is distributed by the State on a per capita basis in the form of motor vehicle excise tax, and is projected to be approximately $503,000 over the next two-year period. At this point, it is not anticipated that the legislature will reduce the funding of these revenues.
Development Services Fund (DS) OS is estimated to generate about $2.1 million in permit revenue and charges for service (plan checks, zoning, and subdivision and land use fees) in the 2017/2018 biennium. Revenue in the current biennium is expected to be $2.2 million. OS will receive some General Fund support, and it is considered a part of the operating budget of the City.
Development Services Fees and Permits 1998 - 2015 Actual; 2016 - 2018 Forecast
$1,400,000
$1,200,000
$1,000,000
$800,000
$600,000
$400,000
$200,000
$0
'?>Cc, ,{'5
!:)<)
"'cs
Admission Tax Fund Admission tax is a 5% tax on the costs of admission to events that are held outside the Tourist Overlay Zone. The movie theatre provides the City with the largest share of admission tax. By ordinance, this revenue is restricted to park maintenance and CIP. The City has received $349,000 so far this biennium (through August 2016) and the forecast is $456,000 for the next biennium.
4

Admission Tax 1999-2015 Actual; 2016 - 2018 Forecast
$300,000 ~---------------------------------,
$250,000 +------ ~ ---rt-r-.--- - --- ----------- --lC~:rl---,
- • - - ~ $200,000 --+-I ,____..,___. f-- - >---- f-- ,__ _ _ _ ____ _,-1---1.,.._ ______ -....-----.:=---ocH - - - ~ ~ . :,, -~ ~ )I ;• •
II ;•, :1
~ ' : $100,000 -- - f-- - - ~ - - - - - >--- - >---- - - >-- >-- a >-- c,/ - :• • :1 $50,000 ~ - >-- - ,_ - >-- - >-- - - - f-- - - - f-- .__.,:-, ~ --,.__ .• ·..., •. ,__. . :•
$0 -+-'---'---.-,~ -, ~,c-'--'-,~-,~-,~..-'-,'--,1~ - ,~-, ~-r-'-, ~r-'---', '--T,~ - ,~ -, ~T"-'-,'--T-'-=·1- ,~'-'--T-~~ .........
Park Impact Fees The forecast is for $1 .2 million in revenue over the next biennium. The City anticipates approximately 372 housing units will be built during the 2017/2018 biennium. For each housing unit the City receives $3,175.
$1,200,000
$1,000,000
$800,000
$600,000
$400,000
$200,000
$0
Park Impact Fees 2004 - 2015 Actual; 2016 - 2018 Forecast
~-------------------------------------------------
t-------------- ···--------------·
----------------------
--,LL,----, = --, ~ ~ ~ ~ & ~ ~ ;: {:: ~ ;:- ~ <o I\.
R R R R R R R R R R R R ~ ~ '\i '\i
5
l

Traffic Impact Fees The forecast, $1.0 million for the next biennium, is based upon projected building activity and new trip generation. It assumes sustained progress of four commercial projects as well as substantial buildout of the 156-unit DR Horton Vinterria Subdivision.
Traffic Impact Fees 2005 - 2015 Actual; 2016 - 2018 Forecast
$1,000,000 ~-------------- ---------
$800,000 +------------------ ------ -----1(:1(:f-
$400,000 -+--------;, :1----------- --------- -------fT .l
$200,000 +-------r ~ --~
Lodging Taxes Lodging tax revenue comes from a 1 % tax on overnight room rentals and should generate approximately $191,000 in the upcoming biennium. These revenues are restricted to promotion of tourism activities by statute.
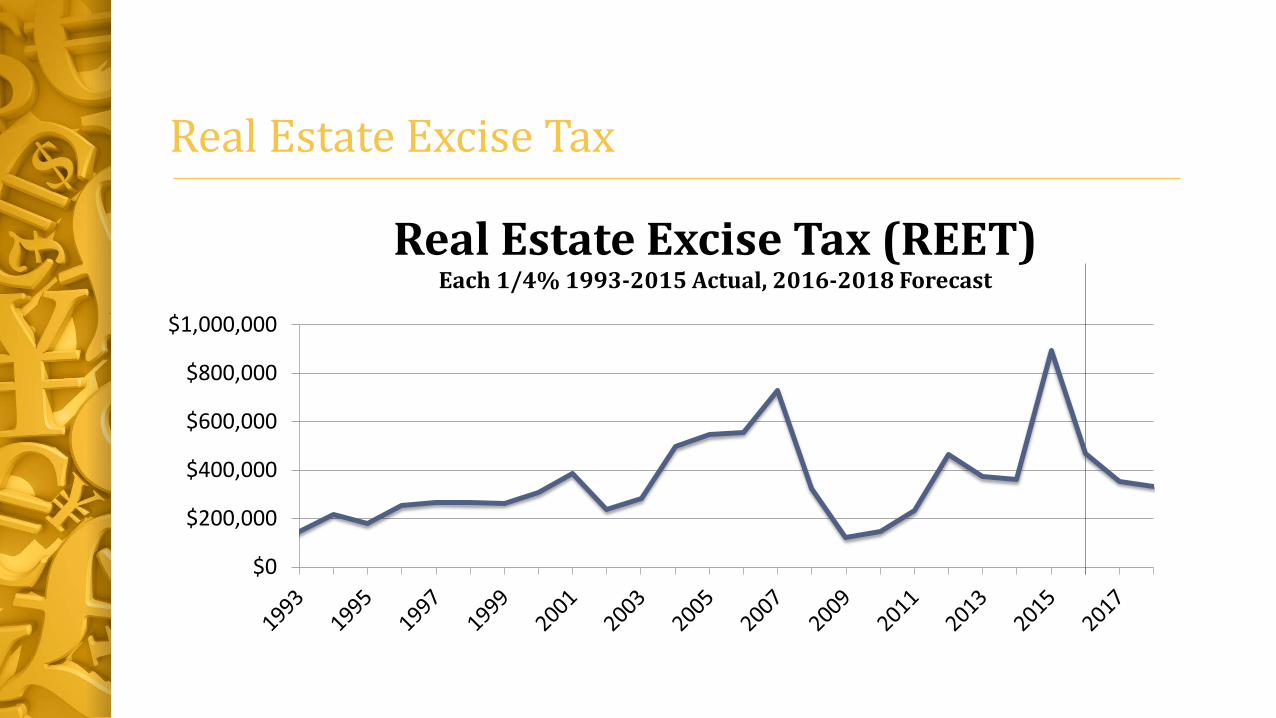
Real Estate Excise Tax Woodinville has two Real Estate Excise Tax (REET) funds, and each collects X% (one quarter of one percent) of the sale price for real property sold in Woodinville. As shown graphically, REET revenue increased from 2002 through 2007, but fell sharply in 2008 and 2009. Emphasizing its sensitivity to the market and economic conditions, it is anticipated that each X% will generate about $688,000 over the biennium.
6

I
$1,000,000
$800,000
$600,000
$400,000
$200,000
$0
Real Estate Excise Tax (REET) Each 1/4% 1993-2015 Actual, 2016-2018 Forecast
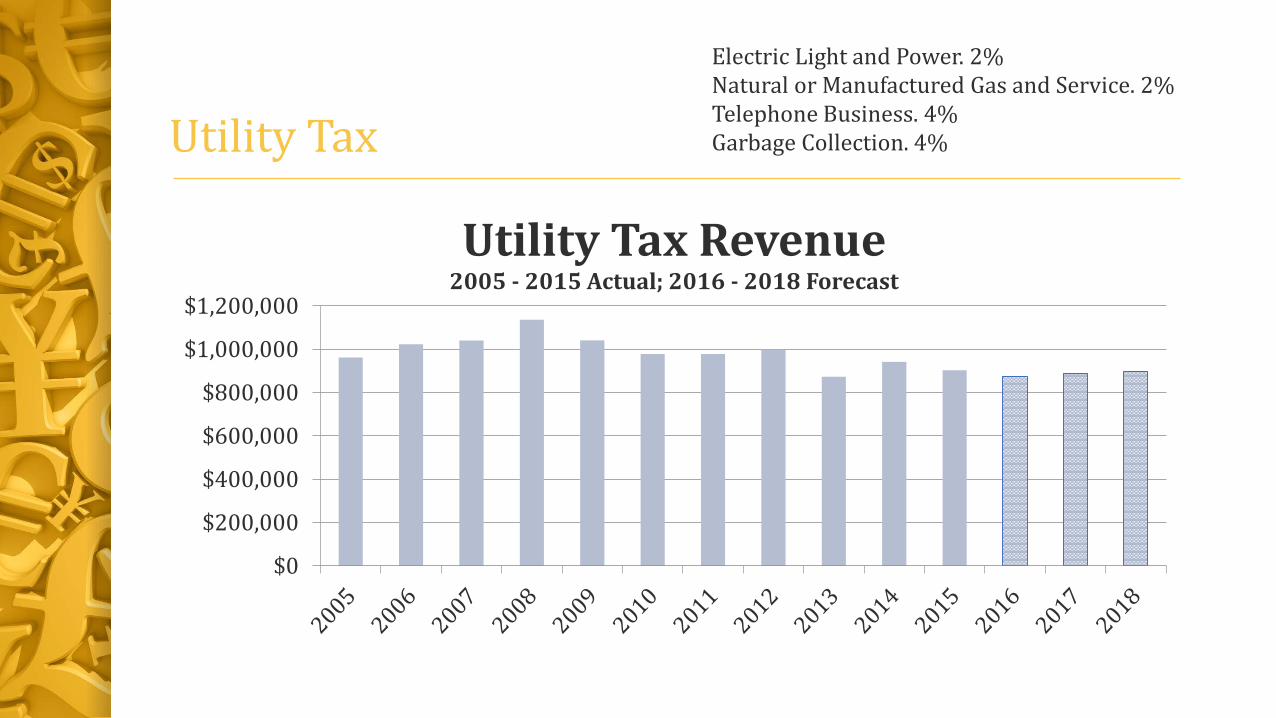
Utility Tax City ordinance allows for 75% of utility tax to be used for operating activities with the remaining 25% allocated to street capital projects. It is estimated that utility taxes will provide about $1.8 million in the next biennium.
Utility Tax Revenue 2005 - 2015 Actual; 2016 - 2018 Forecast
$1,200,000 -- -------------·-·-·-----------------------------·
$1,000,000 -----·-··
$800,000 ··
$600,000
$400,000
$200,000
$0
Surface Water Management Fund {SWM) The SWM Fund, the City's only enterprise fund, receives revenue from assessments billed twice annually, collected by King County, and remitted to the City on a monthly basis. Anticipated revenue is $2.4 million for the 2017/2018 biennium, absent any rate increase. The City's only SWM fee change was a 2.5% increase that took effect in January 2006. Surface Water fees should be reevaluated to ensure that the cost of service, including system replacement is covered by the fees.
Percent Im ervious Surface home
7

2) Very Light 3) Light 4) Moderate 5) Moderate Heavy 6) Heavy 7) Very Heavy
$1,400,000
$1,200,000
$1,000,000
$800,000
$600,000
$400,000
$200,000
$0
~10% $87. 15/parcel
More than 10%, ~ 20% $203.36/acre
More than 20%, ~ 45% $421 .25/acre
More than 45%, ~ 65% $813 .44/acre
More than 65%, ~ 85% $1,031.31/acre More than 85%, ~ 100% $1 ,350.89/acre
SWM Revenue 1999-2015 Actual; 2016 - 2018 Forecast
Grant Revenues Grant revenue for C.I.P. projects is forecasted at $7.7 million for the next biennium. The projects expected to be funded (in part) by grants are:
1. Sammamish River Bridge Replacement - $5.2 million 2. NE 171st Street Urban Parkway lmprovements/133rd Roundabout- $2.5 million
Summary • General Fund revenue will be flat with the growth in sales & property tax revenues
counterbalanced with the possible loss of state shared revenues. • Revenue from building activity and real estate excise taxes will remain strong. • The property tax revenue projections include a 1 % council manic increase for both 2017
and 2018. The last increase was in 2015. There are no other increases to other tax rates or assessments at this time.
RECOMMENDED MOTIONS:
1. I MOVE TO OPEN THE PUBLIC HEARING ON REVENUE SOURCES FOR THE 2017/2018 BIENNIAL BUDGET.
2. I MOVE TO OPEN THE PUBLIC TESTIMONY PORTION OF THE PUBLIC HEARING.
(RECEIVE STAFF REPORT AND THEN PUBLIC COMMENTS ... )
8

I MOVE TO CONTINUE THE PUBLIC HEARING ON REVENUE SOURCES FOR THE 2017/2018 BIENNIAL BUDGET TO OCTOBER 18, 2016 IN THE WOODINVILLE CITY HALL COUNCIL CHAMBERS AT 7 PM OR AS SOON THEREAFTER AS MAY BE HEARD.
9


Revenue SourcesPublic Hearing on the 2017/2018 Biennial Forecast

Economic News
• Economists are forecasting growth, albeit, slow growth, for the foreseeable future.
• City sales tax revenues continue to be strong.
• The US economy is averaging 170K monthly employment adds*. As of June, the unemployment rate is 4.9%.
• Productivity growth has been trending down since the mid-2000s. The five year rolling average is 0.5%*.
• House prices were up 10.7%* in April (yoy) countywide due to low inventory and strong demand.
• City permit values for 2016 are up from the same time in the prior year.
*Source: July 2016 King County Economic and Revenue Forecast.
Unrestricted Revenue Sources
• General Fund (GF)• Sales Taxes• Property Tax• Utility Tax (75%)• Gambling Tax• Intergovernmental• Charges for Services• Fines & Forfeitures• Miscellaneous

Sales Tax: 1993 – 2015 actual2016-2018 Forecast
$0
$1,000,000
$2,000,000
$3,000,000
$4,000,000
$5,000,000
$6,000,000
$7,000,000
$8,000,000

Sales Tax: 2012 – 2015 actual2016-2018 Forecast
$0
$1,000,000
$2,000,000
$3,000,000
$4,000,000
$5,000,000
$6,000,000
$7,000,000
ConstructionSales TaxAll Other SalesTax

Sales Tax Revenue by Type(Sept 2015 through August 2016)
Retail Trade, $2,055,682 , 36%
Construction, $1,024,699 , 18%
Accommodation & Food Services, $773,177 , 13%
Wholesale Trade, $469,249 , 8%Manufacturing,
$402,878 , 7%Information/Communication,
$251,599 , 4%
Other Services (except Public Administration),
$174,256 , 3%
Admin & Support of Waste Mgmt & Remedial Svcs,
$173,144 , 3%
Real Estate & Rental & Leasing, $165,430 , 3%
Professional, Scientific, & Technical Svcs,
$103,537 , 2%
11 Remaining Economic Sectors, $153,602 , 3%
Total revenue for the period.$5,747,253

Economic SectorTotal
(in 1000's)Share of
TotalRetail Trade $2,056 36%Construction $1,025 18%Accommodation & Food Services $773 13%Wholesale Trade $469 8%Manufacturing $403 7%Information/Communication $252 4%Other Services (except Public Administration) $174 3%Admin & Support of Waste Mgmt & Remedial Svcs $173 3%Real Estate & Rental & Leasing $165 3%Professional, Scientific, & Technical Svcs $104 2%Finance $60 1%Arts, Entertainment, & Recreation $33 1%Public Administration $28 0%Educational Services $11 0%Health Care & Social Assistance $7 0%Agriculture, Forestry, Fishing & Hunting $5 0%Management of Companies & Enterprises $5 0%Transportation & Warehousing $3 0%Utilities $1 0%Miscellaneous $ 0%Mining $ 0%
$5,747 100%
Sales Tax Revenue by Type(Sept 2015 through August 2016)

Retail TradeIn 1000’s
Retail Trade $2,056 100%Building Material and Garden Equipment and Supplies Dealers
Building Material and Supplies Dealers $176 9%Lawn and Garden Equipment and Supplies Stores $126 6%
Food and Beverage StoresBeer, Wine, and Liquor Stores $53 3%Grocery Stores & Specialty Food Stores $143 7%
General Merchandise StoresDepartment Stores $426 21%Other General Merchandise Stores $19 1%
Motor Vehicle and Parts DealersAutomobile Dealers $8 0%Automotive Parts, Accessories, and Tire Stores $70 3%Other Motor Vehicle Dealers $84 4%
Clothing and Clothing Accessories Stores $218 11%Electronics and Appliance Stores $93 5%Furniture and Home Furnishings Stores $99 5%Gasoline Stations $37 2%Nonstore Retailers $125 6%Sporting Goods, Hobby, Musical Instrument, and Bo $87 4%Health and Personal Care Stores $64 3%Miscellaneous Store Retailers $228 11%

Other Top Economic Sectors (in 1000’s)
Accommodation & Food Services $773 100%Restaurants and Other Eating Places $566 73%All Other Food Services and Accommodations $207 27%
Manufacturing $403 100%Beverage and Tobacco Product Manufacturing (Wine, Bre $263 65%All Other Manufacturing $140 35%
Wholesale Trade $469 100%Merchant Wholesalers, Durable Goods $237 51%Merchant Wholesalers, Nondurable Goods
Beer, Wine, and Distilled Alcoholic Beverage Merchant $171 37%All Other Nondurable Goods $60 13%
Wholesale Electronic Markets and Agents and Brokers $1 0%

Property Taxes
$3,091,316
$3,220,000
$0
$500,000
$1,000,000
$1,500,000
$2,000,000
$2,500,000
$3,000,000
$3,500,000
Property Tax Revenue1994 - 2015 Actual, 2016 - 2018 Forecast

Operating Revenues
Sales Tax revenue increased every month in 2016 over the same month in the prior year.
• Retail trade improved 8.1% on average, compared to the prior year.
• Restaurants and lodging are the second highest sources of sales tax (excluding sale tax from construction) and are up 9.3%, compared to the prior year.
• Construction activity improved by 20% over the prior year. It is expected to remain strong in 2017 and 2018.
• State shared revenues are a concern given the budget issues the State is currently facing. Revenues at risk are SST mitigation funds and liquor revenues.

Restricted Revenues
• REET (Real Estate Excise Tax)
• Gas Tax
• Admission Tax
• Utility Tax
• Park Impact Fees
• Traffic Impact Fees
• Surface Water Management (SWM) Fees
• Lodging Tax
Utility Tax
$0
$200,000
$400,000
$600,000
$800,000
$1,000,000
$1,200,000
Utility Tax Revenue2005 - 2015 Actual; 2016 - 2018 Forecast
Electric Light and Power. 2% Natural or Manufactured Gas and Service. 2%Telephone Business. 4%Garbage Collection. 4%
Real Estate Excise Tax
$0
$200,000
$400,000
$600,000
$800,000
$1,000,000
Real Estate Excise Tax (REET)Each 1/4% 1993-2015 Actual, 2016-2018 Forecast

Impact Fees
$0
$200,000
$400,000
$600,000
$800,000
$1,000,000
$1,200,000
Traffic & Park Impact Fees2004 - 2015 Actual; 2016 - 2018 Forecast
Park Impact Fee
Traffic Impact Fees

Admission Tax
$0
$50,000
$100,000
$150,000
$200,000
$250,000
$300,000
Admission Tax1999-2015 Actual; 2016 - 2018 Forecast

Surface Water Management (SWM)
$0$200,000$400,000$600,000$800,000
$1,000,000$1,200,000$1,400,000
SWM Revenue1999-2015 Actual; 2016 - 2018 Forecast

Restricted Revenues
• SST Mitigation funds are dedicated to CIP.
• REET is forecasted to have moderate/strong returns.
• Utility Tax is flat.
• Impact Fees are forecasted for $1.6 million by the end of the biennium. This is revenue originally anticipated in 2015/2016.

What is next?
• Manager’s recommended budget by the first meeting in November.• Property Tax Ordinance• Annual Fee Resolution • Budget Ordinance• Salaries and Benefits Ordinance

Questions?