general plastics last-a-foam® fr-3700
TRANSCRIPT
I-
GENERAL PLASTICS
LAST-A-FOAM® FR-3700FOR
CRASH & FIRE PROTECTIONOF
NUCLEAR MATERIAL
SHIPPING CONTAINERS
GENERAL PLASTICS MANUFACTURING COMPANY4910 BURLINGTON WAY/ P 0 BOX 9097 TACOMA, WA 98409
(253) 473-5000, Fax 253-473-5104, E-MAIL engineering @ generalplastics.com
GENERAL PLASTICS MANUFACTURING COMPANY P.O. BOX 9097, TACOMA WA 98409 (253) 473-5000
TABLE OF CONTENTS
INTRODUCTION
* Preface
* A COMPARISON OF REQUIREMENTS AND TEST METHODOLOGIES OF A VARIETY OF IMPACTABSORBING MATERIALS: Reprint of paper presented to PATRAM, Sept. 2001
* RIGID POLYURETHANE FOAM FOR IMPACT AND THERMAL PROTECTION: Reprint of paper presentedto PATRAM, DEC. 1995
* MACHINE DESIGN Article Reprint
FIRE PROTECTION
* LAST-A-FOAMe FR-3700 INTUMESCENT CHAR AND FIRE RESISTANCE: The results of a study of theeffectiveness of the Intumescing char fire retardant system of low density LAST-A-FOAM FR-3700.
* LAST-A-FOAMS FR-3700 IN FIRE PROTECTION APPLICATIONS: A discussion of the Intumescing char andablative manner in which Last-A-Foam FR-3700 provides fire protection.
* FIRE RESISTANCE PERFORMANCE: A report of the effect of combining FR-3700 with Fiberfrax HSA Systemsceramic fiber insolation and of density selection on fire performance.
* THERMAL DECOMPOSITION OF LAST-A-FOAMS FR-3700: Thermogravimetric analysis (TGA), char formationtemperature and auto ignition temperature
IMPACT
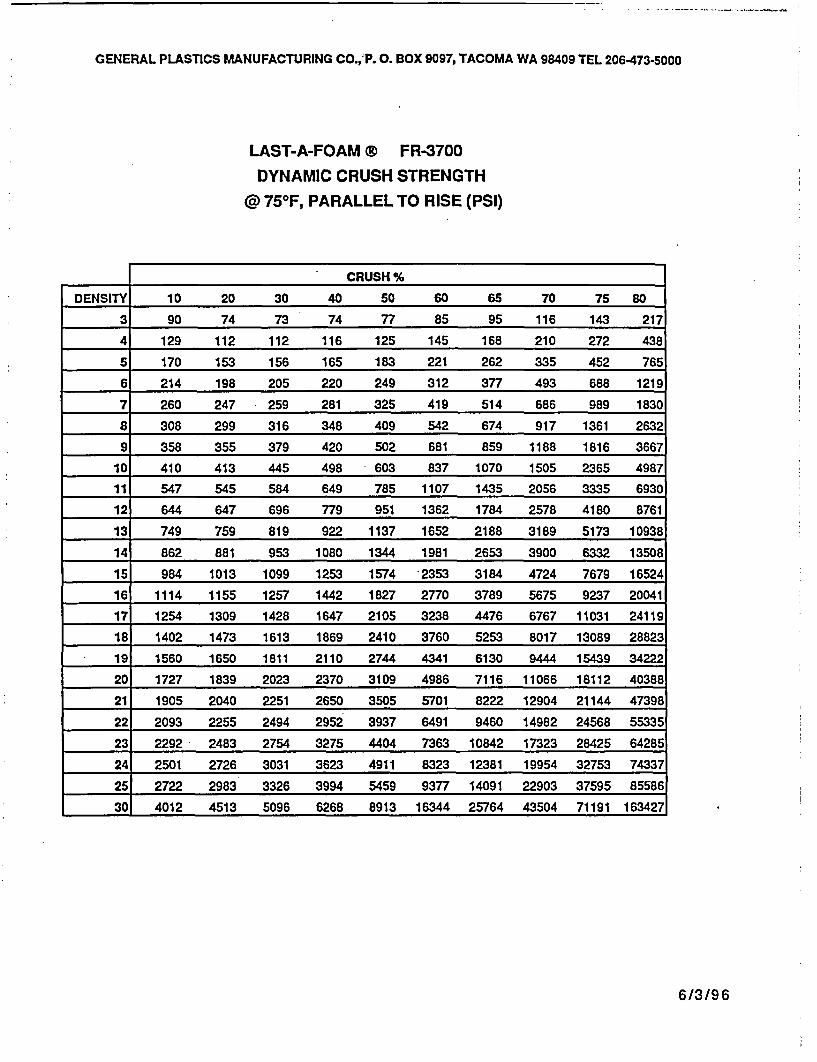
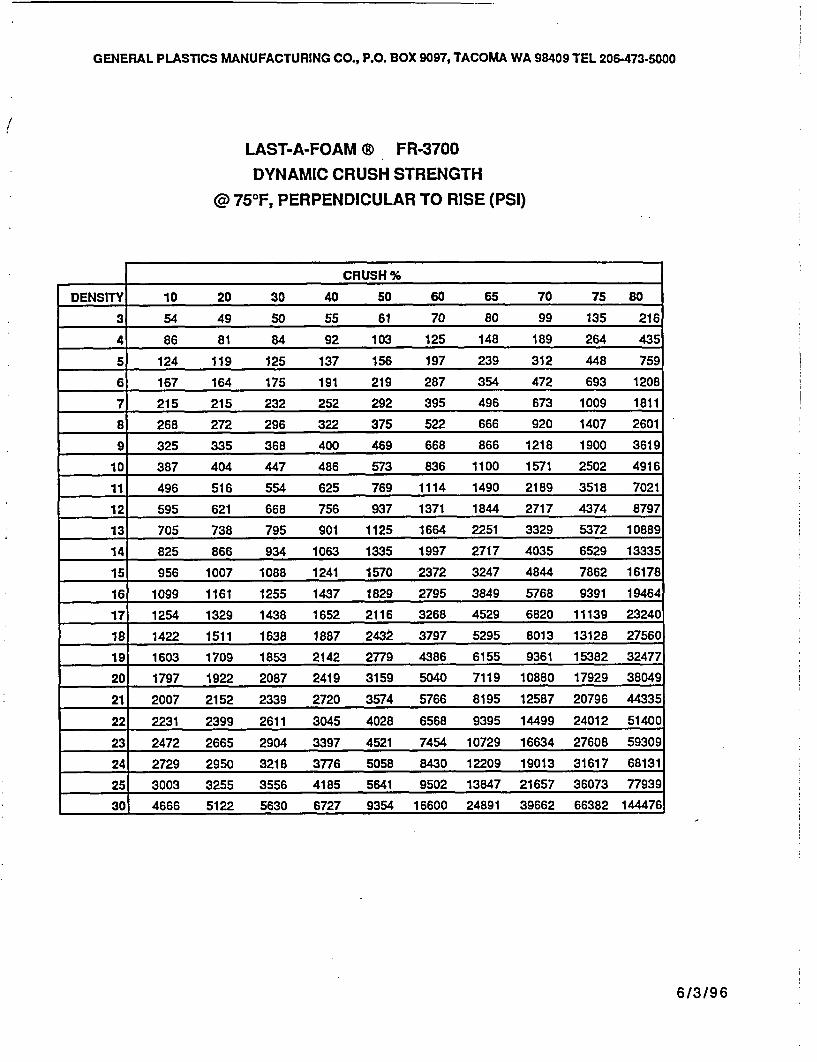
* LAST-A-FOAM" FR-3700 DYNAMIC CRUSH STRENGTH; Parallel and Perpendicular to Rise: A two page datasheet.
* LAST-A-FOAMS FR-3700 DYNAMIC IMPACT APPLICATIONS: A guide to choosing an appropriate density ofFR-3700 for impact protection.
* LAST-A-FOAMS FR-3700 IMPACT CONFIGURATION EFFECTS: A study of the difference between punch,confined and unconfined impact stresses using FR-3700.
CRUSH STRENGTH
* LAST-A-FOAMS FR-3700 CRUSH STRENGTH DATA: Universal test machine test results at varioustemperatures and densities from 10% to 80% strain. (Revised 919/92)
PHYSICAL PROPERTIES
* PRODUCT DATA, LAST-A-FOAMO FR-3700: Various physical properties including shear, tensile, thermal andelectrical.
* LONG TERM LIFE PERFORMANCE OF LAST-A-FOAMO FR-3700: Fire and strength results after 20 years.
* LAST-A-FOAM' FR-3700 THERMAL-CONDUCTIVITY VS. DENSITY: A one page Chart.
* RADIATION EFFECT ON LAST-A-FOAMO FR-3700: A test report.
MATERIAL SAFETY DATA SHEETS
INITIAL ISSUE 4191, REPRINTED 5/91, 11/91, 9/92, 12/93, 6/95,2/97, 6/97, 3198,2/99, 3/01, 10/03*(new or revised)
INTRODUCTION
GENERAL PLASTICS TOLL FREE FROMGENERL PLATICSSeattle-Renton AreaMANUFACTURING COMPANY (206) 623-27954910 BURLINGTON WAY/P.O. BOX 9097 http://wwwgeneralp1astics.comTACOMA, WASHINGTON 98409 FAX (253) 473-5104(253) 473-5000 FX(5)4350
BRIEF HISTORY & BACKGROUND OF
GENERAL PLASTICS MANUFACTURING COMPANY
General Plastics Manufacturing Company has been in business since December 1, 1941.During this time we have had a steady growth in various aspects of the plastics manufacturingfield. We have maintained a close relationship with the aerospace, defense, nuclear andindustrial fields during all of our existence. As a consequence, we have built up a highlycompetent operation capable of producing high quality materials demanded by these variouscustomers. A very extensive quality control program is carried out through all of our operationsand is approved by many aerospace firms as well as the U. S. Department of Defense.
A conservative business expansion philosophy has pervaded our operation. We havefinanced all of our expansion programs froni retained earnings. This has permitted an operationwith low overhead and growth only as it could be carefully managed.
In 1981 we built and moved into our current 100,000 square foot manufacturing facility andcompleted a 35,000 square foot addition in 1985.
We have remained financially strong and healthy throughout the various economicrecessions because we have proven to be capable of identifying new markets and developingnew products for these markets.
General Plastics specializes in fulfilling requirements for high performance, high densityrigid and flexible polyurethane foams for many engineered aerospace and industrial applications.Continuing research and development programs have resulted in numerous unique and versatileLAST-A-FOAMO) materials.
General Plastics also produces various formed and fabricated acrylic and polycarbonatewindows and lenses and other thermoplastic parts and cash pads.
The products resulting from these efforts have earned General Plastics a nation widereputation for outstanding performance. We have received several awards of recognition fromcustomers for our outstanding contributions as a supplier of high quality products, which wedeliver timely and at competitive prices.
MANUFACTURERS AND MOLDERS OF LAST-A-FOAMO HIGH DENSITY RIGID AND FLEXIBLE POLYURETHANE FOAMSAND FABRICATORS OF PLASTIC SHEETS FOR AIRCRAFT, INDUSTRIAL, CONSTRUCTION, MARINE, NUCLEAR, SHIPPING AND MODELING
GENERAL PLASTICS MANUFACTURING COMPANY P.O. BOX 9097, TACOMA WA 98409 (206) 473-5000
PREFACE
The following is a compilation of papers and test reports used by General Plastics whenrecommending LAST-A-FOAM® FR-3700 to designers of nuclear material transportation packages forcrash and/or fire applications. These materials were assembled into one document for convenience,though most applications will not require knowledge of all aspects of FR-3700 capabilities.
The designer of Impact limiters and fire protection overpacks is invited to use these documentsas necessary when considering LAST-A-FOAM® FR-3700 in a crash and/or fire protection application.General Plastics is happy to offer design assistance ranging from telephone advice to testing of scalemodels.
General Plastics has the Quality Assurance system and test facilities necessary to provide allrequired test data and certifications for application In nuclear material shipping containers. GeneralPlastics is qualified to NQA-1 as well as Mil-1-45208.
LAST-A-FOAM% FR-3700 has been used successfully in many protective packages whichhave passed all requirements of 1 OCFR71.73 (hypothetical transport-accident conditions). While we atGeneral Plastics believe that the past performance of FR-3700 makes it an ideal candidate material forfuture applications it must be noted that each application Is different. Therefor, each application shouldbe thoroughly tested since package configuration, drop attitude, heat source, scale factors, and otherassembly components can have significant effect.
PROPRIETARY DATA
THE INFORMATION CONTAINED HEREIN IS THE PROPERTY OF GENERAL PLASTICSMANUFACTURING COMPANY, P. O. BOX 9097, TACOMA, WASHINGTON 98409. THIS
INFORMATION IS SECRET AND PROPRIETARY AND SHALL NOT BE DISCUSSED IN ANYFORM TO ANYONE NOT DIRECTLY RESPONSIBLE FOR PERFORMANCE OF THE RELATEDACTIVITIES, NOR SHALL IT BE USED BY ANYONE TO PERFORM SIMILAR TYPES OF WORK.ALL THOSE WHO ARE GRANTED ACCESS TO THIS INFORMATION WILL BE RESPONSIBLE
FOR ITS' NON-DISCLOSURE, AND WILL BE LIABLE FOR ANY LOSSES INCURRED BYGENERAL PLASTICS MANUFACTURING COMPANY RESULTING FROM ANY UNAUTHORIZED
USE.
WARRANTY
General Plastics warrants that the products it delivers to the buyer will, at the time of delivery, be freefrom defects in material and workmanship. If the products delivered by General Plastics do not conformto this warranty It will correct the non-conformity by repair or replacement at its option. The warranty ofGeneral Plastics is limited to the above expressed warranty and GENERAL PLASTICS MAKES NOOTHER WARRANTY, EXPRESSED OR IMPLIED, INCLUDING BUT NOT LIMITED TO ANY WARRANTYOR MERCHANTABILITY OR FITNESS FOR A PARTICULAR PURPOSE.

A Comparison of Requirements and Test Methodologies for a Variety ofImpact Absorbing Materials
Presented to PATRAM 2001, Chicago Ill, Sept. 2001Floyd P. Henry, General Plastics Mfg. Co.Robert A. Johnson, Packaging Technology, Inc.Peter Shih, Transnuclear, Inc.Theodore Hile, General Plastics Mfg. Co.
ABSTRACT:This paper describes generally accepted performance requirements and associated testmethodologies for various materials currently used as impact absorbing media in nuclear-materialtransport container overpacks and/or impact limiters. Materials examined include foams(primarily polyurethane foam), woods, honeycombs and steel. Also presented are results from aninvestigation into the potential for an alternative, generic method for qualification and acceptanceof impact absorbing materials.
Examples of generally accepted material performance and test requirements for several impact-absorbing materials will be presented, and compared. Materials surveyed are typical of those usedin current, state-of-the-art overpack and impact limiter designs. Data on energy absorbingcharacteristics of different materials will be presented, and the relative merits and shortcomings ofeach will be discussed. Surveyed impact-absorbing materials will also be compared with respectto cost, availability and ability to withstand hypothetical thermal (i.e., fire) events.
After considering characteristics of the various materials, a material- independent measure of theirefficiency in impact energy absorption will be developed. This measure is based on considerationsof maximum stress, maximum strain, rebound, total energy consumed and other relevantparameters when the energy-absorbing material is dynamically crushed.
The paper will conclude with a comparison of the predicted response of a defined representativetransportation package to free-drop conditions. Performance of impact-limiting devices utilizingpreviously described, available energy-absorbing materials will be evaluated and compared.
IntroductionSeveral years ago I was hiking on Mt. Ranier. I had just crossed a rock field where I had stowedmy ice axe and gloves in my pack when I came to a nice smooth snow field. I noticed that thesnow field was fairly steep and also there was a tree line about 150 yards down slope. However Iwas relieved to be getting to smoother hiking and stepped right out. The first step was just fineand then my world changed. My foot slipped, twisting me around and depositing me on my back.I found myself hurtling toward the tree line head first on my back accelerating rapidly. At thatpoint I realized that Abraham Maslow had it all wrong. My most basic need wasn't my nextbreath, in fact, I don't think I was breathing at all. The only thing on my mind was deceleration!Or at the least, some way to LIMIT an IMPACT with a tree trunk.
As luck would have it, I managed to flip over and dig into the snow with my feet, knees, elbowsand fingers and come to a safe albeit bloody stop.
The moral of this story is that stopping a rapidly moving object can be.a life or death matter. Alltoo often, the question of how to stop safely is given little attention until late in the design phase ofmany projects. For that matter, how often does a guy showing off his new car point out the brakes.Fortunately for me I had practiced arresting a fall. While I had always practiced with an ice axe, at
I
least I had discussed what to do if I lost the axe. I am still alive today only because my coach and Ianticipated the possibility of an accidental fall.
Most of the time coming to a safe stop is routine. We all experience it hundreds of times each daywhether we are in a car stopping for a red light, descending in an elevator, or just walking fromone place to another. Sometimes we can't rely of the normal methods of stopping a moving object.The risk of harming ourselves, others or the environment is such that special measures must beadded. We are familiar with many examples from automobile bumpers and air bags to safety netsunder trapeze artists at the circus. An impact limiter for a nuclear material shipping container is anexample of a special measure that we all hope will never have to be used.
The primary requirement of an impact limiter is that it be a passive system that can always becounted on to work in an instant. This means that sacrifices must be made, trading off the idealform of deceleration for a robust system that cannot be defeated by the failure of a power supply orsome other mechanism.
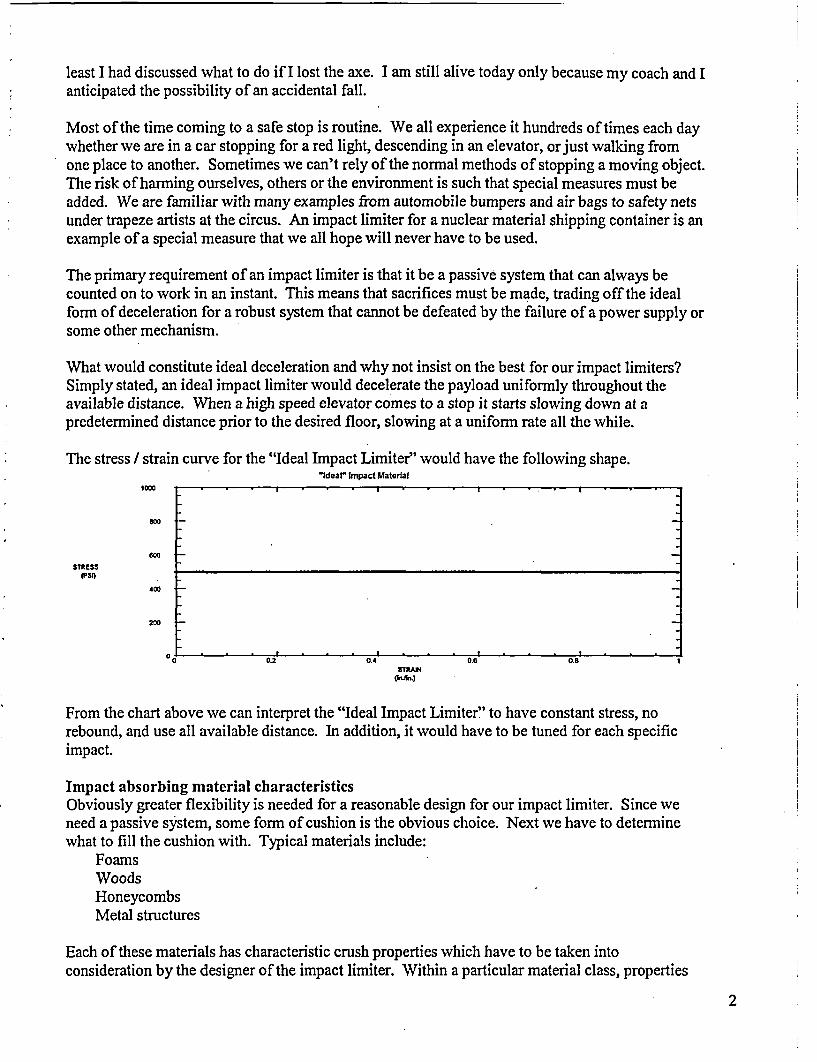
What would constitute ideal deceleration and why not insist on the best for our impact limiters?Simply stated, an ideal impact limiter would decelerate the payload uniformly throughout theavailable distance. When a high speed elevator comes to a stop it starts slowing down at apredetermined distance prior to the desired floor, slowing at a uniform rate all the while.
The stress / strain curve for the "Ideal Impact Limiter" would have the following shape.Ndear Impact Material
1000
boo_.
3TRESS(PSI)
400
200
00 0.2 0.4 0.8 0.8 1STRAN4
From the chart above we can interpret the "Ideal Impact Limiter" to have constant stress, norebound, and use all available distance. In addition, it would have to be tuned for each specificimpact.
Impact absorbing material characteristicsObviously greater flexibility is needed for a reasonable design for our impact limiter. Since weneed a passive system, some form of cushion is the obvious choice. Next we have to determinewhat to fill the cushion with. Typical materials include:
FoamsWoodsHoneycombsMetal structures
Each of these materials has characteristic crush properties which have to be taken intoconsideration by the designer of the impact limiter. Within a particular material class, properties
2

can vary from lot to lot as well. Most of the scientific literature and material properties tablesdefine the compressive strength of a particular material as the point at which plastic failure begins.For the case of an impact limiter the most desirable condition is a very short elastic range andplastic deformation throughout most of the material thickness. Plastic deformation absorbs energyby breaking material fiber bonds and converting kinetic energy of a moving object to heat. Byminimizing elastic deformation rebound is kept at a minimum.
Among foam materials the most common is closed cell rigid polyurethane. Phenolic foams havebeen used in the past but have fallen out of favor due to problems with water absorption due to theopen cell characteristic of the foam (florist foam is phenolic). Among woods, balsa and redwoodare the most typical choice of nuclear package designers. Other woods and wood products havebeen used including maple, oak, and cellulose fiber board. Honeycombs can be manufacturedfrom a variety of materials and are used for impact absorbing applications in fields other thannuclear packages. A survey of currently licensed packages found aluminum and stainless steelhoneycombs. Metal structures (other than the above honeycombs) have been used with examplesincluding a large hollow steel torus and a series of seamless steel tubes. Combinations of theabove materials can be effective with examples including a foam filled stainless steel torus andfoam filled honeycombs. On one occasion the author observed a deformed impact limiter at abridge abutment. Upon closer inspection the impact limiter was found to consist of a series ofpolyethylene or polypropylene containers full of polyurethane filled paper honeycomb.
The choice of impact absorbing material can hinge on a variety of factors including; cost,performance, availability, fire protection and familiarity.
Note: Many package Safety Analysis Reports (SARs) were used in the research for this paper aswell as actual crush tests of balsa, redwood, honeycomb and foam. Since the only informationdesired was that pertaining to the impact limiters, requests were limited to specific sections.Considerable variation were observed among different test reports involving arguably the samematerial (particularly balsa). No inference should be drawn as to the effectiveness of any impactlimiter in service, regardless of the material used. The performance of an impact limiter depend onthe design and construction of the entire structure and not solely on the specific properties of onematerial. Furthermore, the performance of all of these devices were proven by large scale tests.
The following examples illustrate the Crush strength curves typical of the materials reviewed inthis paper.
BALSA
0 0.2 0.4 0.6 08 12000 ...
SAR Plo1-A
8.4 pd confined
~*.* ... ~ 4pcf
(S I: 1000 . , ,
3

In the above plot two parallel to grain examples were taken from SAR plots. The remaining plotswere the result of crush tests using an MTS Alliance model R/F-150 universal test machine. Balsaspecimens were obtained from hobby shop materials. The tested specimens exhibited a muchgreater initial peak relative to the SAR plots. This may have been a result of the specimen size (1inch cubes). The lower SAR plot specimen was a 2 inch diameter by 2 inch tall cylinder. Nodimensional data was found for the upper SAR plot. Discontinuities observed in the tested plotcoincided with observed splitting of the sample while it was being crushed (test specimen splittingwould account for markedly lower stress values at higher strains.). One specimen was tested byconfining the wood in a square steel tube, the test results show generally increasing stress withincreasing strain following the initial peak stress. The upper SAR plot is believed to be the resultof averaging stress at various strains.
REDWOOD
0 02 0.4 0.6 0.8
20000 /X s
/
15~00 _ /,
STRESS SAR Plt-A
1PS )000 Of SAR Pblt-
rpe - - -A)
10000
Peprcil rns(SA.R.
0 02 0.4 0. 0e8 1STRAIN
The above plot of redwood was developed along the same lines as the balsa analysis. The testspecimens of the redwood were obtained from a piece of retired lawn furniture. The wood was ingood condition indicating that it had been under cover and did not show signs of sun and raindamage. Two observations are worthy of note. The effect of confining the test specimen is greaterwith redwood than with balsa. Secondly, the anisotropic character of woods is obvious from bothplots. Directions provided for the installation of woods in impact limiters are very specific as tothe grain orientation.
RIGID POLYURETHANE FOAM10000
ParatlIoeI Rie_
5000 - - ~ Penpesdd Io Rise
251bJAt.t.
STRESS(PSI)
4000 _ = > ~ /11~t.
-. - - IlllbJcuj.ft.
0 0.1 02 0.3 0.4 0.5 0' 6 0.7 0.5STRMt
Both rigid and flexible polyurethane foam have been used for impact limiters in nuclear shippingcontainers for over a quarter century. The public is often surprised to find that a rigid material isthe choice for protection from the largest impacts. All of us are familiar with flexible polyurethanefoam. We routinely sit or lounge on it in the form of seat cushions and pillows. As a result, thereis a tendency to regard flexible foams as superior cushions. However, all flexible foams arenothing more than variously damped springs . Using small amounts flexible foam serves well for
4
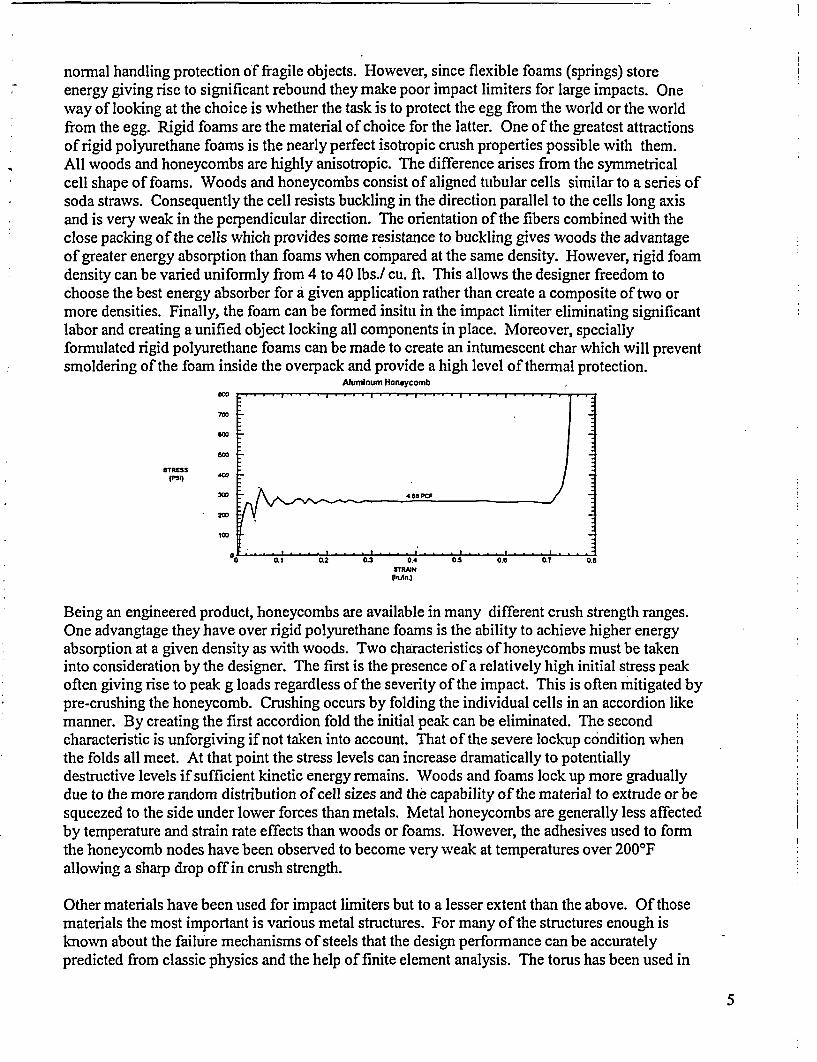
normal handling protection of fragile objects. However, since flexible foams (springs) storeenergy giving rise to significant rebound they make poor impact limiters for large impacts. Oneway of looking at the choice is whether the task is to protect the egg from the world or the worldfrom the egg. Rigid foams are the material of choice for the latter. One of the greatest attractionsof rigid polyurethane foams is the nearly perfect isotropic crush properties possible with them.All woods and honeycombs are highly anisotropic. The difference arises from the symmetricalcell shape of foams. Woods and honeycombs consist of aligned tubular cells similar to a series ofsoda straws. Consequently the cell resists buckling in the direction parallel to the cells long axisand is very weak in the perpendicular direction. The orientation of the fibers combined with theclose packing of the cells which provides some resistance to buckling gives woods the advantageof greater energy absorption than foams when compared at the same density. However, rigid foamdensity can be varied uniformly from 4 to 40 lbs./ cu. ft. This allows the designer freedom tochoose the best energy absorber for a given application rather than create a composite of two ormore densities. Finally, the foam can be formed insitu in the impact limiter eliminating significantlabor and creating a unified object locking all components in place. Moreover, speciallyformulated rigid polyurethane foams can be made to create an intumescent char which will preventsmoldering of the foam inside the overpack and provide a high level of thermal protection.
Aluminum Honeycomb
IPSQ 4X _
200
100
0 0.1 0.2 0.3 0.4 0.5 0.5 0.7 0.8
STRXN4Vn.An)
Being an engineered product, honeycombs are available in many different crush strength ranges.One advangtage they have over rigid polyurethane foams is the ability to achieve higher energyabsorption at a given density as with woods. Two characteristics of honeycombs must be takeninto consideration by the designer. The first is the presence of a relatively high initial stress peakoften giving rise to peak g loads regardless of the severity of the impact. This is often mitigated bypre-crushing the honeycomb. Crushing occurs by folding the individual cells in an accordion likemanner. By creating the first accordion fold the initial peak can be eliminated. The secondcharacteristic is unforgiving if not taken into account. That of the severe lockup condition whenthe folds all meet. At that point the stress levels can increase dramatically to potentiallydestructive levels if sufficient kinetic energy remains. Woods and foams lock up more graduallydue to the more random distribution of cell sizes and the capability of the material to extrude or besqueezed to the side under lower forces than metals. Metal honeycombs are generally less affectedby temperature and strain rate effects than woods or foams. However, the adhesives used to formthe honeycomb nodes have been observed to become very weak at temperatures over 2000 Fallowing a sharp drop off in crush strength.
Other materials have been used for impact limiters but to a lesser extent than the above. Of thosematerials the most important is various metal structures. For many of the structures enough isknown about the failure mechanisms of steels that the design performance can be accuratelypredicted from classic physics and the help of finite element analysis. The torus has been used in
5
at least two different large impact limiters, one of which was also filled with rigid polyurethanefoam. Another interesting application employed by one of this papers authors was a series of steeltubes. The structure ultimately imitated that of a macro celled honeycomb. In order to ensure thatcrushing occurred as desired the tubes were crimped in order to force buckling in a three lobeform.The following is a summary of the differences between the various common impact limitingmaterials:
* Woods and honeycombs exhibit an initial force spike.* Woods may require confinement when crushing parallel to the grain for accurate results.* Woods and honeycombs are very anisotropic (honeycombs are typically not measured
perpendicular to the tube orientation.)* Woods and Honeycombs are capable of absorbing more energy at a given density than
foams.* Polyurethane foam is nearly perfectly isotropic.* Honeycombs crush in a stepwise manner, the tubes fold up like an accordion.* Honeycombs are the most efficient energy absorbers with a characteristic flat (although
bumpy) curve until crush is complete (lockup)..* Honeycombs lock up with a very sharp increase in force.* Woods and Polyurethane foam approach lockup much more gradually than honeycombs.* Polyurethane foam can provide superior thermal protection by developing an intumescing
char.
Along with the differences in energy absorbing capability the designer must also contend with avariety of other factors when choosing an impact absorbing material including; cost, availability,temperature extremes, fire resistance, long term life, not to mention prejudices for or against acertain type of material. For many impact limiters fire resistance is not a factor. In the case ofoverpacks such as the TRUPACT I the impact absorbing material must also provide protectionfrom the engulfing fire or be combined with other materials which provide such protection. At onetime it was thought that redwood was inherently fire resistant in metal containers (one of the SARsincludes the following statement "The outer assembly is made of select, kiln dried redwood to takeadvantage of redwood's high specific energy and fire resistant characteristics."). This statement istrue only if oxygen can be excluded or limited to low levels in the package. If the package ispunctured in such a way as to allow hot gasses to escape while also admitting air the wood cansmolder and bum inside the package. Perhaps the fact that redwood trees are so long lived hasgiven rise to the myth of fire resistance. There is some validity to the fire resistance of the livingtrees but this is believed to be a property of the bark and the fact that redwoods grow in costalareas that are surrounded by fog and mist most nights and mornings.
Quality Assurance requirementsFrom reviewing numerous SARs two trends appear to have developed over the years. Verificationof he compressive strength performance of engineered materials (honeycombs and foams) isaccomplished by testing the material and meeting tolerance bands placed about the nominal crushstrength curve and density for a given product. In one case the SAR states, "The manufacturer ofthe honeycomb has guaranteed the crush strength to be within ± 12.5% of the nominal value overthe temperature range of-20'F to 2000F." Another SAR states "The crush strength of the materialis 750 psi ± 10%. The manufacturer's force-displacement plots for honeycomb samples arepresented...." For rigid polyurethane foams similar requirements are found in two of thereferenced SARs including this, ". .. the average parallel-to-rise compressive stress for a foamedcomponent shall be the nominal compressive stress ± 15% at strains of 10%, 40% and 70%." And
6
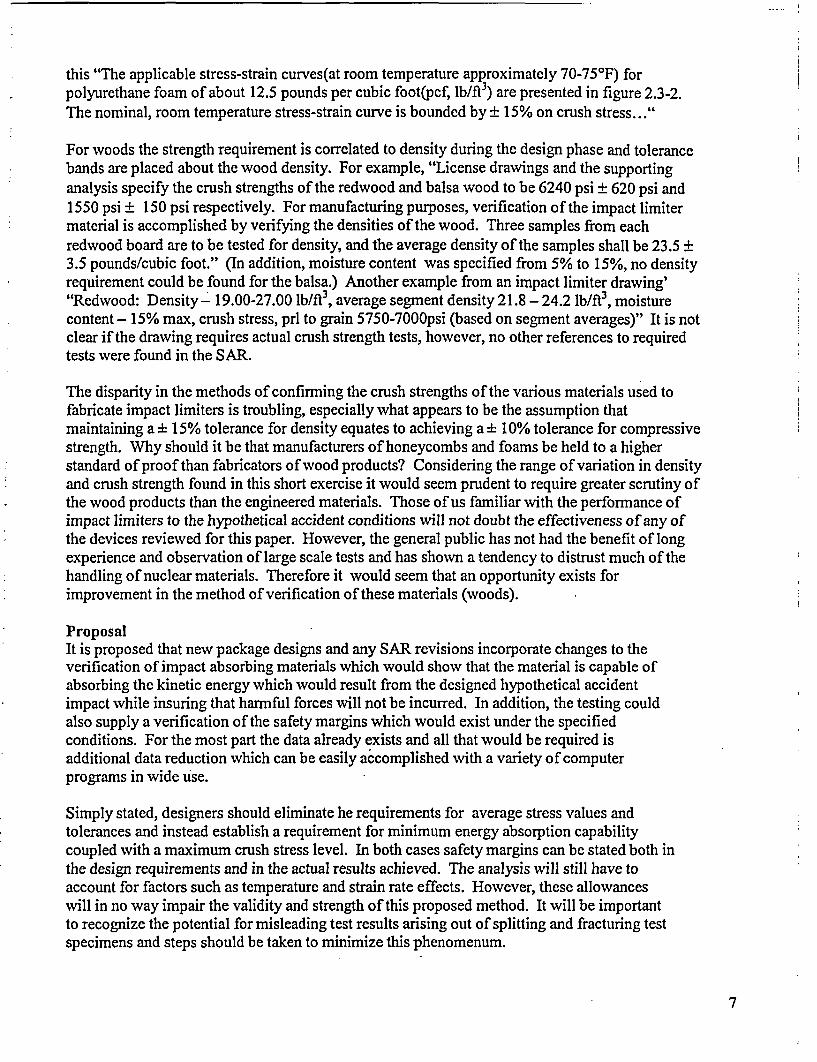
this "The applicable stress-strain curves(at room temperature approximately 70-750 F) forpolyurethane foam of about 12.5 pounds per cubic foot(pcf, lb/ft3) are presented in figure 2.3-2.The nominal, room temperature stress-strain curve is bounded by ± 15% on crush stress..."
For woods the strength requirement is correlated to density during the design phase and tolerancebands are placed about the wood density. For example, "License drawings and the supportinganalysis specify the crush strengths of the redwood and balsa wood to be 6240 psi ± 620 psi and1550 psi ± 150 psi respectively. For manufacturing purposes, verification of the impact limitermaterial is accomplished by verifying the densities of the wood. Three samples from eachredwood board are to be tested for density, and the average density of the samples shall be 23.5 ±3.5 pounds/cubic foot." (In addition, moisture content was specified from 5% to 15%, no densityrequirement could be found for the balsa.) Another example from an impact limiter drawing'"Redwood: Density- 19.00-27.00 lb/ft3 , average segment density 21.8 - 24.2 lb/ft3 , moisturecontent - 15% max, crush stress, prl to grain 5750-7000psi (based on segment averages)" It is notclear if the drawing requires actual crush strength tests, however, no other references to requiredtests were found in the SAR.
The disparity in the methods of confirming the crush strengths of the various materials used tofabricate impact limiters is troubling, especially what appears to be the assumption thatmaintaining a + 15% tolerance for density equates to achieving a ± 10% tolerance for compressivestrength. Why should it be that manufacturers of honeycombs and foams be held to a higherstandard of proof than fabricators of wood products? Considering the range of variation in densityand crush strength found in this short exercise it would seem prudent to require greater scrutiny ofthe wood products than the engineered materials. Those of us familiar with the performance ofimpact limiters to the hypothetical accident conditions will not doubt the effectiveness of any ofthe devices reviewed for this paper. However, the general public has not had the benefit of longexperience and observation of large scale tests and has shown a tendency to distrust much of thehandling of nuclear materials. Therefore it would seem that an opportunity exists forimprovement in the method of verification of these materials (woods).
ProposalIt is proposed that new package designs and any SAR revisions incorporate changes to theverification of impact absorbing materials which would show that the material is capable ofabsorbing the kinetic energy which would result from the designed hypothetical accidentimpact while insuring that harmful forces will not be incurred. In addition, the testing couldalso supply a verification of the safety margins which would exist under the specifiedconditions. For the most part the data already exists and all that would be required isadditional data reduction which can be easily accomplished with a variety of computerprograms in wide use.
Simply stated, designers should eliminate he requirements for average stress values andtolerances and instead establish a requirement for minimum energy absorption capabilitycoupled with a maximum crush stress level. In both cases safety margins can be stated both inthe design requirements and in the actual results achieved. The analysis will still have toaccount for factors such as temperature and strain rate effects. However, these allowanceswill in no way impair the validity and strength of this proposed method. It will be importantto recognize the potential for misleading test results arising out of splitting and fracturing testspecimens and steps should be taken to minimize this phenomenum.
7
The area under the curve of any crush test specimen represents the energy absorbed by thespecimen during the test. This area is a partially dimensioned value which when multipliedby the volume of impact absorbing material which would be crushed under hypotheticalaccident conditions will provide the impact absorbing capability of that portion of the limiter.A simple example will be presented to illustrate.
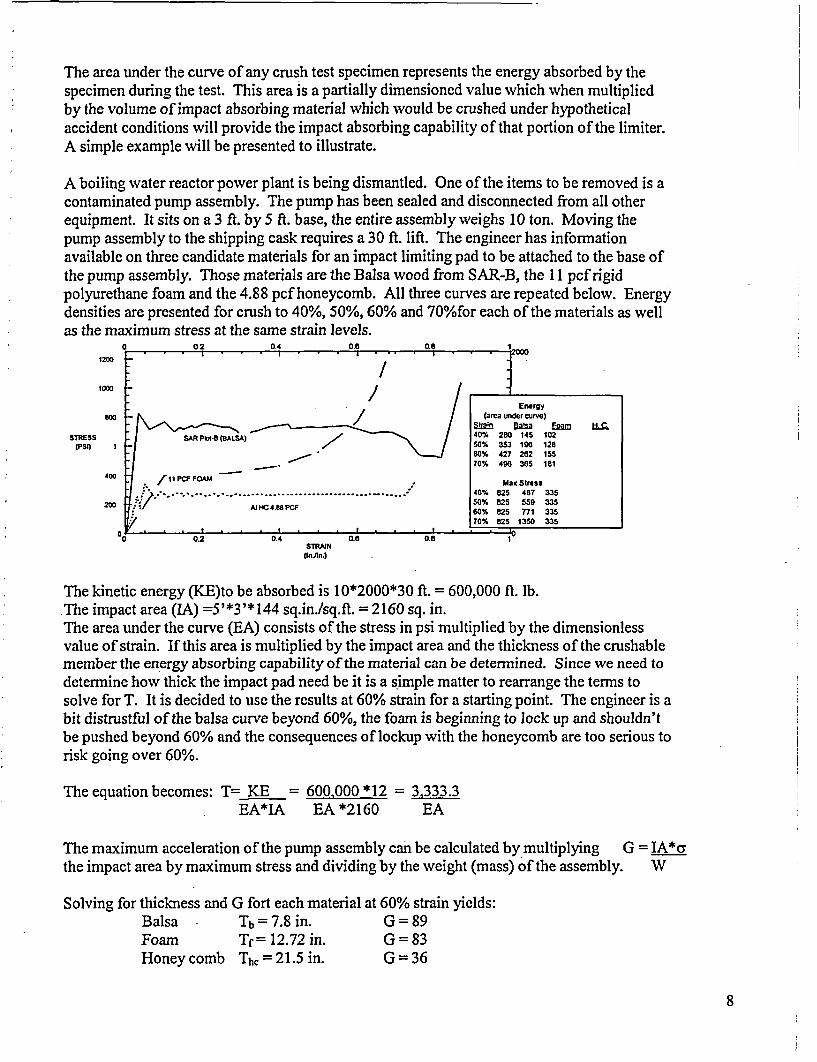
A boiling water reactor power plant is being dismantled. One of the items to be removed is acontaminated pump assembly. The pump has been sealed and disconnected from all otherequipment. It sits on a 3 ft. by 5 ft. base, the entire assembly weighs 10 ton. Moving thepump assembly to the shipping cask requires a 30 ft. lift. The engineer has informationavailable on three candidate materials for an impact limiting pad to be attached to the base ofthe pump assembly. Those materials are the Balsa wood from SAR-B, the 11 pcf rigidpolyurethane foam and the 4.88 pcf honeycomb. All three curves are repeated below. Energydensities are presented for crush to 40%, 50%, 60% and 70%for each of the materials as wellas the maximum stress at the same strain levels.
0 02 0.4 0.8 0.8 1
1200
1000 /
EnergyQOO / /(2rea under curve)
-Strain bas Em HQ
STRESS SAR PkA-B (BALSA) y 40% 280 145 102(Psi) 50% 353 196 128
9 -J 60% 427 262 155
_ 6 .70# 496 385 18t
:400 IIttPCF FOAM Max Stress
..... . ....... I 40% 825/4.7 33 485
200 ht1. "'1 - 1- .... AI'H C-4-88 PCF ...... 0 825 559 3*35: . 60% 825 771 335
70% 825 1350 35
0.2 0.4 0.8 0.8 1STRAiNUnJln.)
The kinetic energy (KE)to be absorbed is 10*2000*30 ft. = 600,000 ft. lb.The impact area (IA) =5'*3'* 144 sq.in./sq.ft. = 2160 sq. in.The area under the curve (EA) consists of the stress in psi multiplied by the dimensionlessvalue of strain. If this area is multiplied by the impact area and the thickness of the crushablemember the energy absorbing capability of the material can be determined. Since we need todetermine how thick the impact pad need be it is a simple matter to rearrange the terms tosolve for T. It is decided to use the results at 60% strain for a starting point. The engineer is abit distrustful of the balsa curve beyond 60%, the foam is beginning to lock up and shouldn'tbe pushed beyond 60% and the consequences of lockup with the honeycomb are too serious torisk going over 60%.
The equation becomes: T= KE = 600,000*12 = 3,333-3EA*IA EA *2160 EA
The maximum acceleration of the pump assembly can be calculated by multiplying G = IA*crthe impact area by maximum stress and dividing by the weight (mass) of the assembly. W
Solving for thickness and G fort each material at 60% strain yields:Balsa Tb = 7.8 in. G=89Foam Tf= 12.72 in. G=83Honey comb ThC = 21.5 in. G=36
8
Now the engineer has the basis for a sound decision weighing the importance of severalfactors including; cost, available space, fragility of the payload, availability of material, etc.Of course, it should come as no surprise that the lowest G comes with the thickest cushion(ultimately, only distance can mitigate impact). If the engineer would substitute the foamenergy area at 40% strain he would find that the task could be accomplished with a 23 in.thick pad with maximum G of 50 and very likely at a considerable cost savings.
Acknowledgments:Thanks to: the NRC Public Documents Room and especially Donna McCulloch for locatingthe many SARs researched for this paper; Wayne McMurtry for background information onredwood by telephone; Charles Williamson V. P. Quality Assurance, General Plastics forestablishing a first rate testing laboratory and allowing his staff to assist the author; and notleast, Robert Sevasin for cheerfully testing numerous wood specimens.
References:The following Safety Analysis Reports were researched in preparation for this paper (listed byDocket No.)
1) 71-03612) 71-91503) 71-92004) 71-92025) 71-92186) 71-9226
* 7) 71-92288) 71-92359) 71-926110) 71-9293
Other references:A) Jimpact Limiter Tests of Four Commonly Used Materials and Establishment of an
Impact Limiter Data Base W. M Mcmurtry, G. F. Hohnstreiter, Sandia NationalLaboratoriesm PATRAM 95
B) CSB Impact Absorber Analysis Report ED-037, P. W. Noss, June 1999, PACTECDocument E D-037, REV. 0
C) TSB 122 Design Data for the Preliminary Selection of Honeycomb EnergyAbsorption SystemsHexel Corp. 10/91
D) General Plastics Test Report #S-008 10-01 for ALCORE Inc., Aug. 10, 2000E) General Plastics LAST-A-FOAMFR-3 700 for Crash and Fire Protection of
Nuclear Material Shipping Containers, F. P. Henry, General Plastics Mfg. Co.1 1 th printing
9
Reprinted from MACHINE DESIGN February 7. 1991. I
SCANNING THE FIELD FOR IDEAS
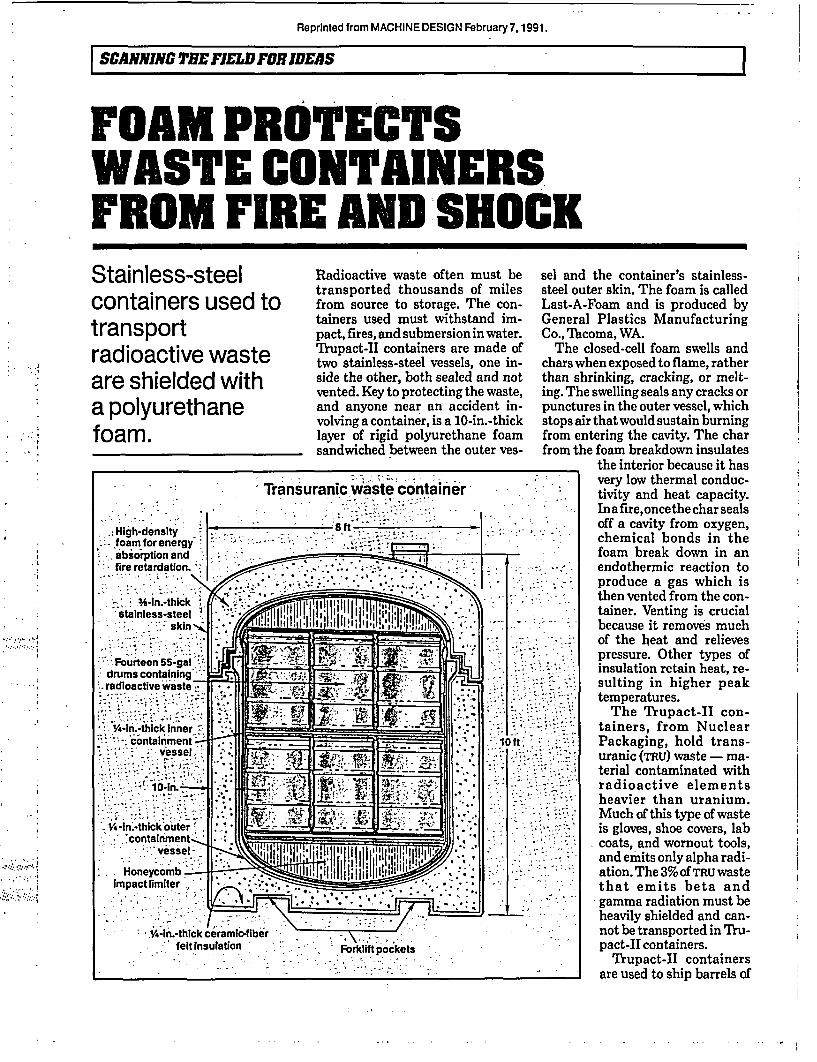
FOAM PROTECTSWASTE CONTAINERSFROM FIRE AND SHOCKStainless-steelcontainers used totransportradioactive wasteare shielded witha polyurethanefoam.
.1I
. ...III
Radioactive waste often must betransported thousands of milesfrom source to storage. The con-tainers used must withstand im-pact, fires, and submersion in water.¶ftupact-II containers are made oftwo stainless-steel vessels, one in-side the other, both sealed and notvented. Key to protecting the waste,and anyone near an accident in-volving a container, is a 10-in.-thicklayer of rigid polyurethane foamsandwiched between the outer ves-
sel ansteel cLast-)GenerCo.,T
Thechars,than E
ing. T]punctstops Ifrom ifrom I
. I
- ; Transuranic waste container
High-density | . .f:- foamforenergy
absorption andfire retardation.
i 3iIn.-thick ':: \.........................._.stainless-steel
:-.Fourteen 55-gal E at -....drums containing':radioactie w' aste
containment 10It
Y.-i -thick outer* containment
. 'Honeycomb MR.'.' .=, . ..Impact limiter
Y4-.-thick ceramicfiberfelt Insulation Forklift pockets
id the container's stainless-outer skin. The foam is calledA-Foam and is produced byral Plastics Manufacturingacoma, WA.e closed-cell foam swells andwhen exposed to flame, rathershrinking, cracking, or melt-he swelling seals any cracks orures in the outer vessel, whichair that would sustain burningentering the cavity. The char,he foam breakdown insulates
the interior because it hasvery low thermal conduc-tivity and heat capacity.Inafire,oncethechar sealsoff a cavity from oxygen,chemical bonds in thefoam break down in anendothermic reaction toproduce a gas which isthen vented from the con-tainer. Venting is crucialbecause it removes muchof the heat and relievespressure. Other types ofinsulation retain heat, re-sulting in higher peaktemperatures.
The Trupact-II con-tainers, from NuclearPackaging, hold trans-uranic (TRu) waste - ma-terial contaminated withradioactive elementsheavier than uranium.Much of this type of wasteis gloves, shoe covers, labcoats, and wornout tools,and emits only alpha radi-ation. The 3% of TRu wastethat emits beta andgamma radiation must beheavily shielded and can-not be transported in Tru-pact-II containers.
Trupact-II containersare used to ship barrels of
-- l
GENERAL PLASTICS MANUFACTURING CO., 4910 BURLINGTON WAY, TACOMA WA 98409, (206) 473-5000
Presented to the I I th International Conference on the Packaging and Transportation of RadioactiveMaterials (PATRAM'95), December 1995
RIGID POLYURETHANE FOAM FORIMPACT AND THERMAL PROTECTION
F. P. Henry & C. L WilliamsonGeneral Plastics Manufacturing Co., Tacoma, WA
Tel. 206-473-5000 Fax 206-473-5104
INTRODUCTION
Polyurethane foam has been used as a protective medium in nuclear materialtransportation containers for over 30 years. Other materials used in containers are woods,cork, cellulose fiber, honeycomb, metal fabrications, and other foam types. These othermaterials have one or more inherent drawbacks including: cost, availability, difficulty offabrication, uniaxial protection, and poor thermal resistance. The use of polyurethanefoams can free the container designer from many of these constraints since thepolyurethane foam can be engineered to meet a wide range of impact situations and toprovide significant thermal protection. System costs of polyurethane foam are verycompetitive, especially with in situ (pour-in-place) foam application. The particularfoam we will refer to is LAST-A-FOAM FR-3700/FR-6700 rigid polyurethane foam.
IMPACT PROTECTION
To accommodate the wide variety of impact energies to be absorbed the designer mustfirst define the requirements. Of primary importance is the determination of themaximum allowable stress the payload can withstand. Other factors which must beconsidered are ambient temperatures, radiation exposure, thermal load, handling,moisture exposure, weight constraints, package size, cost, and safety factor.
Protection is achieved by dissipating the kinetic energy available just prior to impact in away that minimizes the forces which could destroy the package and release the payload tothe environment. Since the mass of the payload is often fairly constant we can simplifythe analysis by focusing on deceleration.
Most people think of soft, squishy, flexible things when they think of foam. Whendealing with low energy levels that is exactly what is required, a nice soft cushion to keepthings from breaking. However, for high energies the soft cushions are useless or worse.They can bottom out and rebound.
1 of 8
GENERAL PLASTICS MANUFACTURING CO., 4910 BURLINGTON WAY, TACOMA WA 98409, (206) 473-5000
It is important to keep in mind that ONLY DISTANCE CAN MITIGATE IMPACT. The firstdetermination must be how much deceleration distance is necessary to reduce forces tosafe levels. A theoretically perfect cushion material would decelerate a payloaduniformly through 100% of its thickness. Typical cushion materials have efficiencies ofone quarter to one half of the perfect cushion. This means that actual deceleration will betwo to four times theoretical.
If the deceleration distance is adequate, the next step is to determine if the energy levelsare within the absorbing range of the foam. If the foam is too weak, little or nodeceleration will occur upon deflection (but a great deal will occur upon bottoming withresulting high stress). If the foam is too strong little deflection and high deceleration willoccur again with resulting high stress. This is where the versatility of polyurethane foambecomes apparent. The designer has a wide range of energy absorbing densities fromwhich to choose.
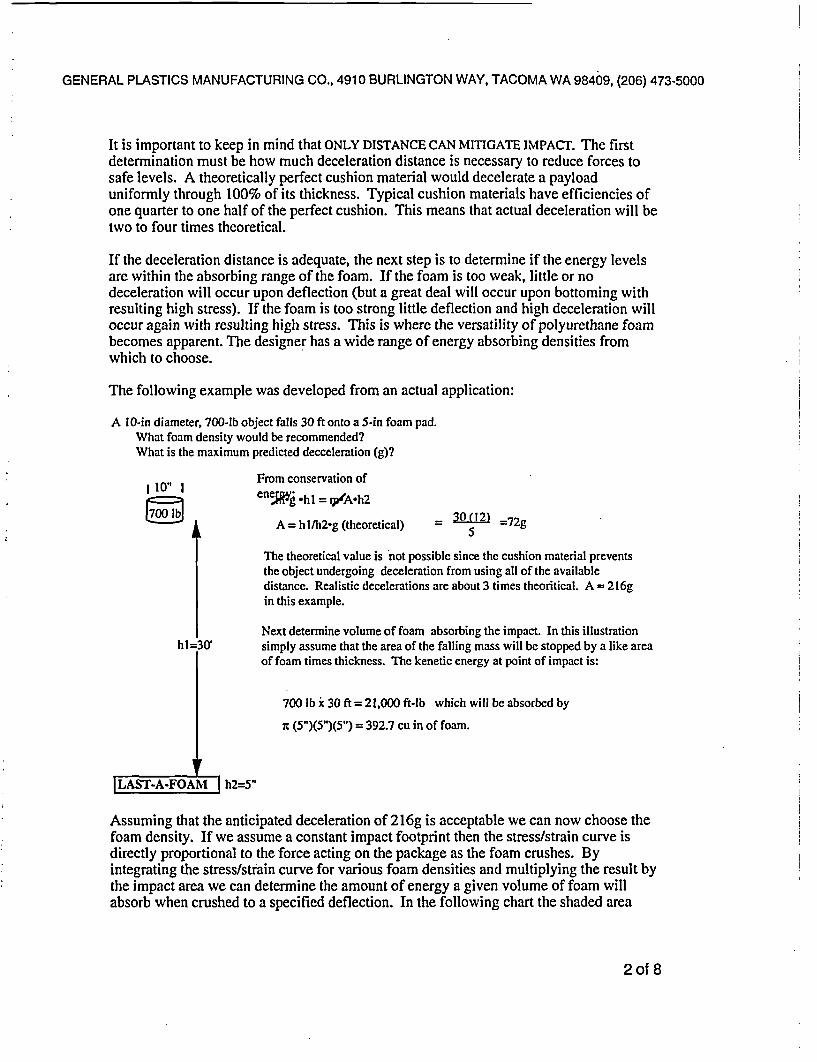
The following example was developed from an actual application:
A 10-in diameter, 700-lb object falls 30 ft onto a 5-in foam pad.What foam density would be recommended?What is the maximum predicted decceleration (g)?
From conservation ofeneyig .hl = t/A-h2
A = h lh2g (theoretical) = 5 ( 72g
The theoretical value is not possible since the cushion material preventsthe object undergoing deceleration from using all of the availabledistance. Realistic decelerations are about 3 times theoritical. A - 216gin this example.
Next determine volume of foam absorbing the impact. In this illustrationhl=30' simply assume that the area of the falling mass will be stopped by a like area
of foam times thickness. The kenetic energy at point of impact is:
700 lb x 30 ft = 21,000 ft-lb which will be absorbed by
nt (5")(5")(5") = 392.7 cu in of foam.
rLAST-A-FOAM I h2=5"
Assuming that the anticipated deceleration of 216g is acceptable we can now choose thefoam density. If we assume a constant impact footprint then the stress/strain curve isdirectly proportional to the force acting on the package as the foam crushes. Byintegrating the stress/strain curve for various foam densities and multiplying the result bythe impact area we can determine the amount of energy a given volume of foam willabsorb when crushed to a specified deflection. In the following chart the shaded area
2of 8
GENERAL PLASTICS MANUFACTURING CO., 4910 BURLINGTON WAY, TACOMA WA 98409, (206) 473-5000
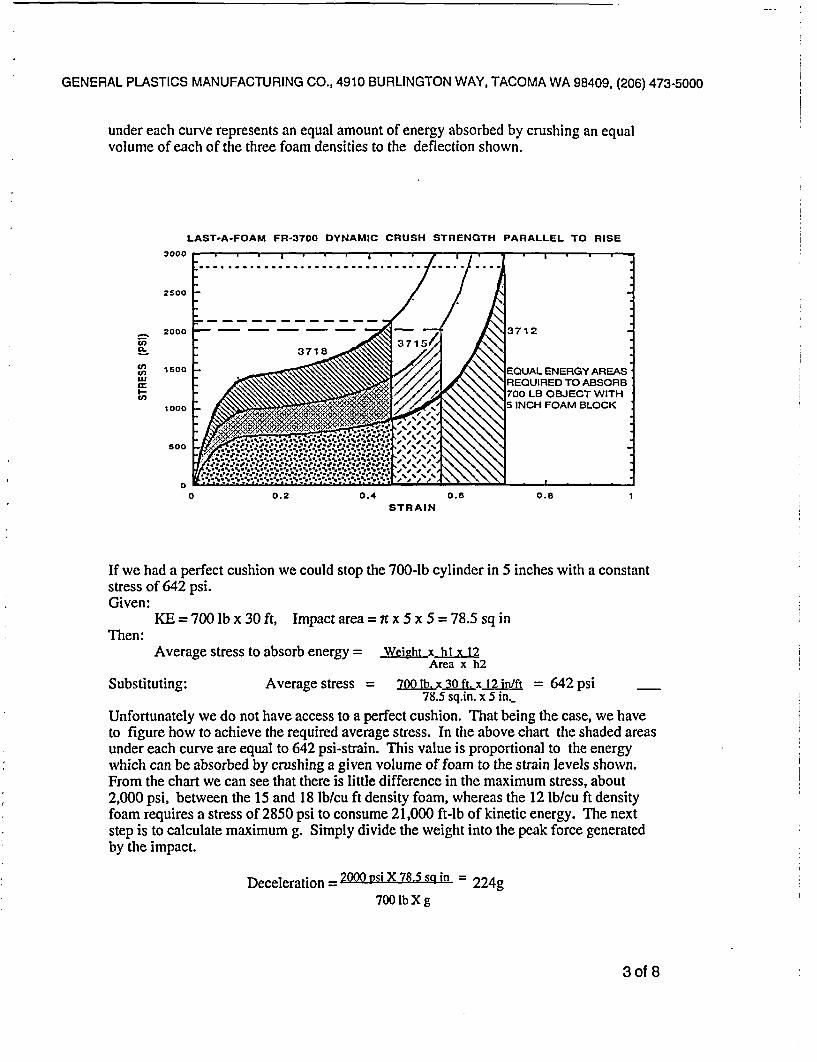
under each curve represents an equal amount of energy absorbed by crushing an equalvolume of each of the three foam densities to the deflection shown.
LAST-A-FOAM FR-3700 DYNAMIC CRUSH STRENGTH PARALLEL TO RISE
aooo
2500
-. - I - * -I. .. .. .. .. .. .. .. .. .. .. .. .. .. .. ...
Vl)z-CO)
CninUj
BI-Cl)
2000
1500
1000
0oo
00 0.2 0.4 0.6 0.8
STRAIN
If we had a perfect cushion we could stop the 700-lb cylinder in 5 inches with a constantstress of 642 psi.Given:
KE = 700 lb x 30 ft, Impact area = 7r x 5 x 5 = 78.5 sq inThen:
Average stress to absorb energy = Weight x hi x 12Area x h2
Substituting: Average stress = 2DQibx 30 ft.x 12 in/ft = 642 psi78.5 sq.in. x 5 in._
Unfortunately we do not have access to a perfect cushion. That being the case, we haveto figure how to achieve the required average stress. In the above chart the shaded areasunder each curve are equal to 642 psi-strain. This value is proportional to the energywhich can be absorbed by crushing a given volume of foam to the strain levels shown.From the chart we can see that there is little difference in the maximum stress, about2,000 psi, between the 15 and 18 lb/cu ft density foam, whereas the 12 lb/cu ft densityfoam requires a stress of 2850 psi to consume 21,000 ft-lb of kinetic energy. The nextstep is to calculate maximum g. Simply divide the weight into the peak force generatedby the impact.
Deceleration = 2000 psi X 78.5 sq in = 224g700 lb X g
3 of 8
I, GENERAL PLASTICS MANUFACTURING CO., 4910 BURLINGTON WAY, TACOMA WA 98409, (206) 473-5000
We find that the rule of thumb of actual g being about three times theoretical isreasonably close in this instance. If this deceleration is too severe and space permits, thecushion thickness can be increased with a consequent reduction of g.
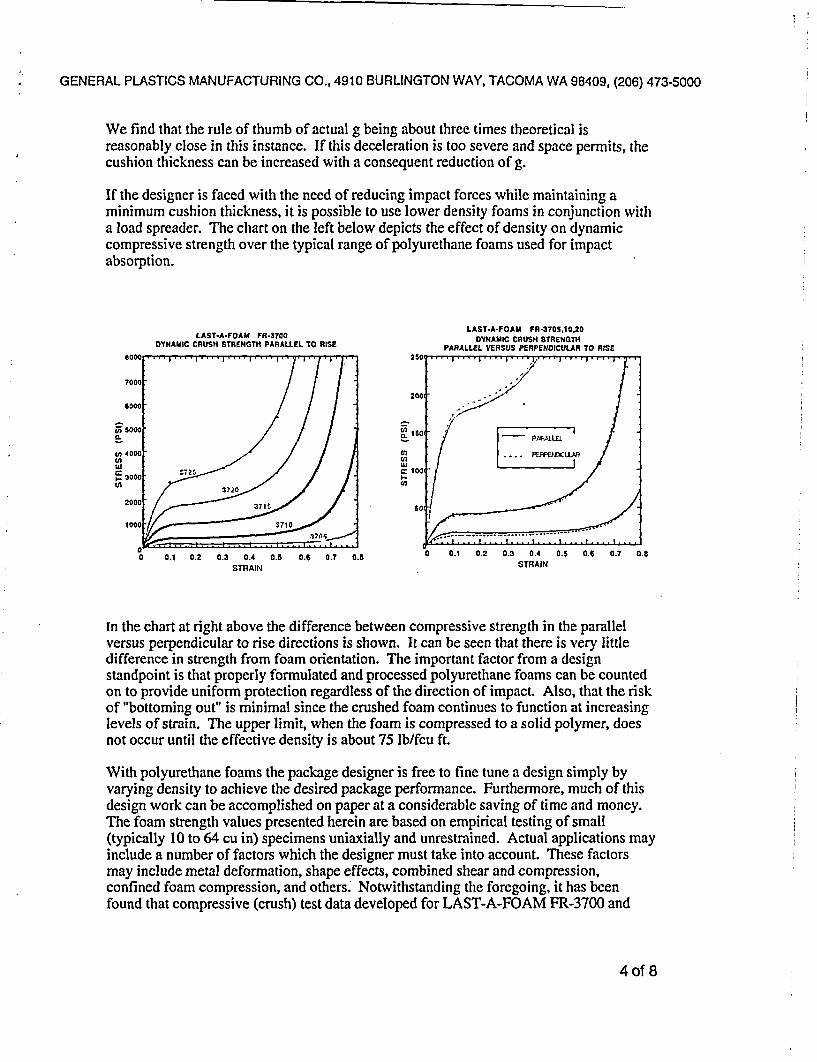
If the designer is faced with the need of reducing impact forces while maintaining aminimum cushion thickness, it is possible to use lower density foams in conjunction witha load spreader. The chart on the left below depicts the effect of density on dynamiccompressive strength over the typical range of polyurethane foams used for impactabsorption.
LAST.A*FOAM FR-3705,10.20LAST-A*FOAM FR-370DYAI US TRNT
DYNAMIC CRUSH STRENGTH PARALLEL TO RISE DYNAMIC CRUSH STRENGTH
800 2/150.
7000
2006000
5 000 Wiso -
STRAIN STAINE
tjn 4000 70
In th hr trgtaoe h ifrnebten comresiv stengthin harlevrsu pepniua triedeconishw.Itoonb enta heei eyltl
2000 371- so
0 0.1 0.2 0.3 0.4 0.5 0.6 0.7 o.s 0 0.1 0.2 0.3 0.4 0.5 0.6 0.7 0.8STRAIN STRAIN
in the chart at right above the difference between compressive strength in the parallelversus perpendicular to rise directions is shown. It can be seen that there is very littledifference in strength from foam orientation. The important factor from a designstandpoint is that properly formulated and processed polyurethane foams can be countedon to provide uniform protection regardless of the direction of impact. Also, that the riskof "bottoming out" is minimal since the crushed foam continues to function at increasinglevels of strain. The upper limit, when the foam is compressed to a solid polymer, doesnot occur until the effective density is about 75 lb/fcu ft.
With polyurethane foams the package designer is free to fine tune a design simply byvarying density to achieve the desired package performance. Furthermore, much of thisdesign work can be accomplished on paper at a considerable saving of time and money.The foam strength values presented herein are based on empirical testing of small(typically 10 to 64 cu in) specimens uniaxially and unrestrained. Actual applications mayinclude a number of factors which the designer must take into account. These factorsmay include metal deformation, shape effects, combined shear and compression,confined foam compression, and others; Notwithstanding the foregoing, it has beenfound that compressive (crush) test data developed for LAST-A-FOAM FR-3700 and
4of 8
GENERAL PLASTICS MANUFACTURING CO., 4910 BURLINGTON WAY, TACOMA WA 98409, (206) 473-5000
presented here (in part) has effectively predicted the impact-absorbing ability ofnumerous LAST-A-FOAM filled containers.
FIRE PROTECTION
Organic materials withstand fires primarily as an ablative medium. Consequently, thefirst design consideration is to ensure enough mass to survive the fire. Proper vesselventing is important not only to prevent the possibility of explosive rupture but also todirect the flow of hot gasses to minimize convective heat transfer to the payload. Oneproblem encountered by most organic materials is the possibility of a smoldering fire.When this happens the thermal load on the payload can be very high and of longduration.
As with designing for impact protection, the first step is to define the requirements of thepackage. To begin with, the maximum allowable payload temperature must beestablished. Is there a difference between acceptable short- and long-term temperatures?What is the effect of the thermal mass of the payload? Is there radioactive decay heat todispose of? Once these (and other) questions are answered the designer can address theexternal thermal threat. Interestingly, the requirements of 10CFR71 (30 minutes at1,4750 F) have often been found to be milder than actual test conditions. Temperaturesrecorded in pool fire tests typically range from 2,000 to 2,200'F. Furnaces set at 1,4751Fprior to the start of testing quickly rise to 2,000+0 F if any flammable gasses are generatedby the thermal decomposition of the protective medium.
The concept of using a hydrocarbon material as a thermal protective medium may seemcounterintuitive. However, test experience has found that some hydrocarbons providesuperior performance when compared to materials which do not thermally degrade. Inthe absence of oxygen, hydrocarbons consume energy as they are being thermallydegraded (endothermically). During the thermal exposure the materials ablate, i.e. theyare dissipated from the surface by the heat. Away from the heat source the materials canremain quite cool, this is especially true with closed cell polyurethane foams since theyare excellent insulators. While the ablation process takes place it is important to vent thebreakdown products out of the container. This can cause considerable excitement amongobservers of qualification tests when they witness flames jetting from the test vessel. Atthis point the vessel designer can calmly assure the observers that the package isperforming as designed. Furthermore, that the venting is good since it shows that heat isbeing removed from the vessel. The jetting flames are of no consequence since they areno hotter than the surrounding fire. The key to ablative thermal protection is to have asufficient amount of material so that original material remains after the thermal threatpasses. It is also important to prevent thermal paths to the payload, and to preventsmoldering fires inside the container.
The mechanism for smoldering combustion comes from the way in which some organicmaterials pyrolize. Most materials shrink as they thermally degrade and char. Theresultant cracks in the protective material allow the burning surfaces to radiate heatbetween the opposing faces. If oxygen is drawn into the container and through the cracknetwork, fire can be sustained. These smoldering fires are serious because of theirproximity to the payload and because of their long duration. A good working solution isto employ a material which continuously generates an expanding (intumescent), highly
5of 8
GENERAL PLASTICS MANUFACTURING CO., 4910 BURLINGTON WAY, TACOMA WA 98409, (206) 473-5000
fire resistant char during pyrolysis. An expanding char can fill cracks caused by impactdamage and extrude through punctures and vent openings in the outer container wall.
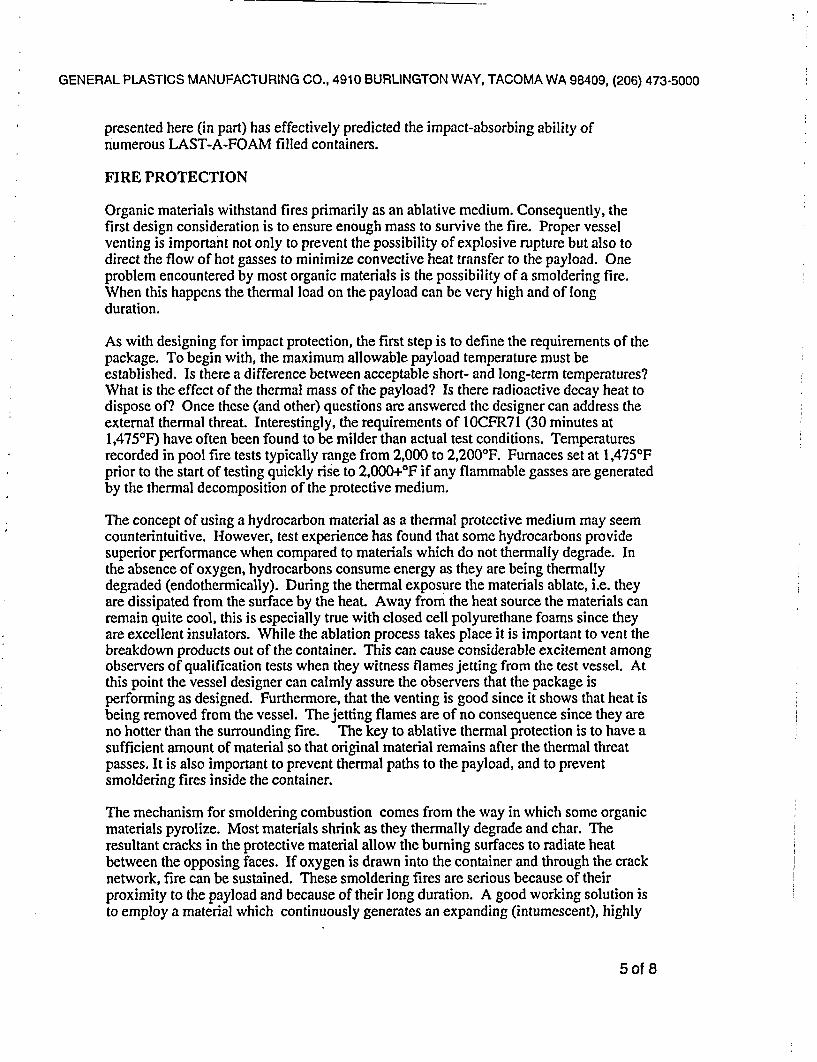
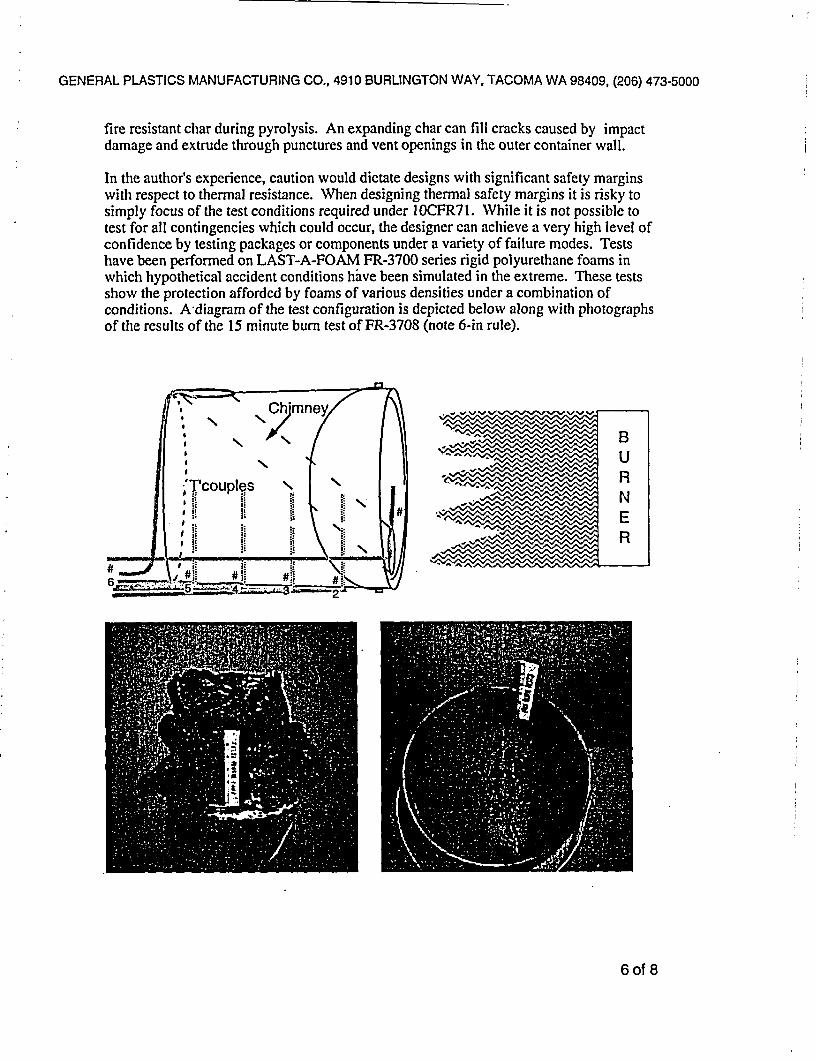
In the author's experience, caution would dictate designs with significant safety marginswith respect to thermal resistance. When designing thermal safety margins it is risky tosimply focus of the test conditions required under IOCFR71. While it is not possible totest for all contingencies which could occur, the designer can achieve a very high level ofconfidence by testing packages or components under a variety of failure modes. Testshave been performed on LAST-A-FOAM FR-3700 series rigid polyurethane foams inwhich hypothetical accident conditions have been simulated in the extreme. These testsshow the protection afforded by foams of various densities under a combination ofconditions. A diagram of the test configuration is depicted below along with photographsof the results of the 15 minute burn test of FR-3708 (note 6-in rule).
6of 8
GENERAL PLASTICS MANUFACTURING CO., 4910 BURLINGTON WAY, TACOMA WA 98409, (206) 473-5000
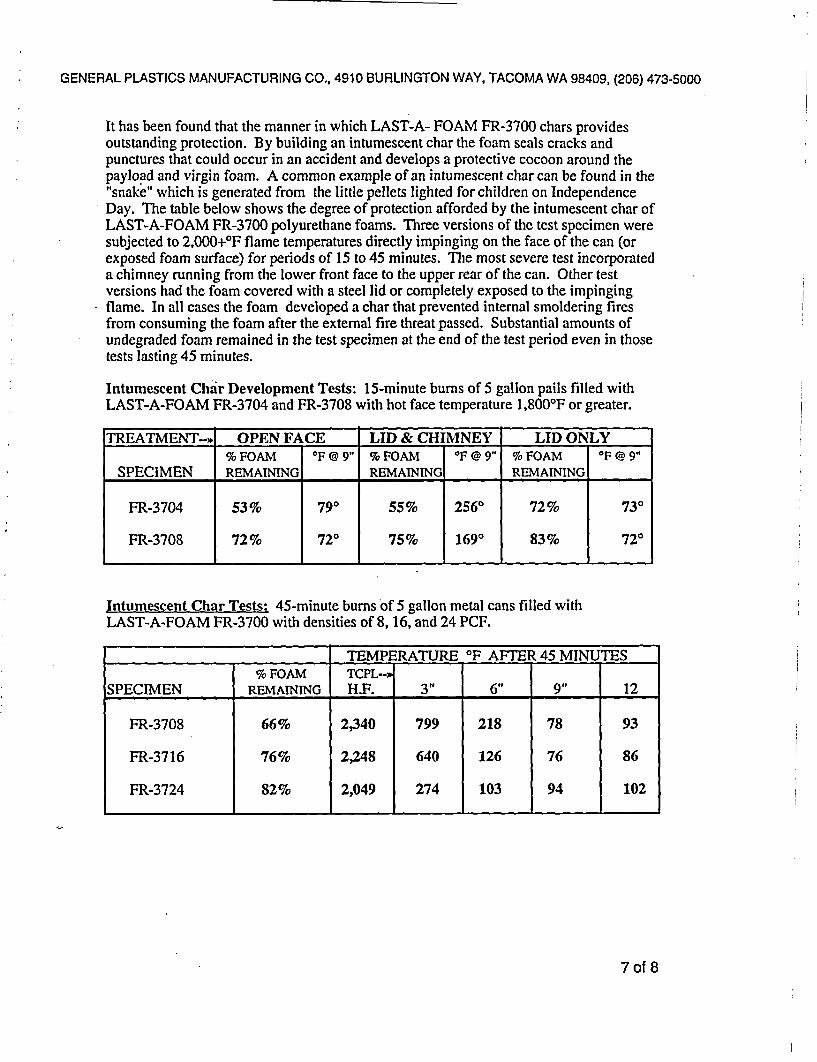
It has been found that the manner in which LAST-A- FOAM FR-3700 chars providesoutstanding protection. By building an intumescent char the foam seals cracks andpunctures that could occur in an accident and develops a protective cocoon around thepayload and virgin foam. A common example of an intumescent char can be found in the"snake" which is generated from the little pellets lighted for children on IndependenceDay. The table below shows the degree of protection afforded by the intumescent char ofLAST-A-FOAM FR-3700 polyurethane foams. Three versions of the test specimen weresubjected to 2,000+°F flame temperatures directly impinging on the face of the can (orexposed foam surface) for periods of 15 to 45 minutes. The most severe test incorporateda chimney running from the lower front face to the upper rear of the can. Other testversions had the foam covered with a steel lid or completely exposed to the impingingflame. In all cases the foam developed a char that prevented internal smoldering firesfrom consuming the foam after the external fire threat passed. Substantial amounts ofundegraded foam remained in the test specimen at the end of the test period even in thosetests lasting 45 minutes.
Intumescent Char Development Tests: 15-minute burns of 5 gallon pails filled withLAST-A-FOAM FR-3704 and FR-3708 with hot face temperature 1,800TF or greater.
TREATMENT-* OPEN FACE LID & CHIMNEY LID ONLY% FOAM OF @ 9" % FOAM OF @ 9" % FOAM 'F @ 9"
SPECIMEN REMAINING REMAINING REMAINING
FR-3704 53% 790 55% 2560 72% 730
FR-3708 72% 720 75% 1690 83% 720
Intumescent Char Tests: 45-minute burns of 5 gallon metal cans filled withLAST-A-FOAM FR-3700 with densities of 8,16, and 24 PCF.
TEMPERATURE OF AFTER 45 MINUTES% FOAM TCPL-
SPECIMEN REMAINING H.F. 3" 6" 9", 12
FR-3708 66% 2,340 799 218 78 93
FR-3716 76% 2,248 640 126 76 86
FR-3724 82% 2,049 274 103 94 102
7 of 8
GENERAL PLASTICS MANUFACTURING CO., 4910 BURLINGTON WAY, TACOMA WA 98409, (206) 473-5000
QUALITY ASSURANCE
This paper is not a do-it-yourself guide to foaming. Not all polyurethane foams are thesame. In addition to the obvious difference between the flexible and rigid versions, thereare many variations. Some variations are obvious to the casual observer, while otherdifferences cannot be detected short of specific physical properties testing. The criticalmission of nuclear shipping containers demands that the foaming work be left to thosemost knowledgeable of the processing and formulation of polyurethane foams. Thisposition may not always fall on receptive ears since there are many foam systems on themarket where the manufacturer will be happy to sell the foam to anyone for any purpose.However we believe the designer/user will find that care in the selection of their foamprovider will pay large dividends in cost, time, quality assurance including the assuranceof passing qualification tests, and, not least, peace of mind.
The fire retardant characteristics of polyurethane foams, including intumescent char, areachieved with special additives. Strength properties are primarily determined by foamdensity. Even if there is a good understanding of the required chemical compositionneeded to achieve all the properties necessary for a high-performance package, theseproperties can be compromised by poor processing techniques.
The package designer/user can obtain the greatest assurance of top quality foam work inhis package by focusing on specifications which require strict adherence to physicalproperties testing. It may also be advisable to specify some process steps such astemperature bounds for in situ foaming, cleanliness and dryness of the cavity to befoamed, inspection hold points during foaming, etc. The least effective method ofassuring quality foaming work is to only specify liquid formulations (or, even worse, toprovide a recipe). When this happens inexperienced fabricators can be lulled intoattempting to foam fill containers with insufficient preparation and poor productionpractices. There are numerous examples of poor foam specifications resulting in highercosts, schedule delays, and failed qualification tests.
SUMMARY:
Properly formulated rigid polyurethane foams can provide both impact and fire protectionin nuclear material transportation containers. Impact protection depends on sufficientcrushing distance and foam density to absorb the impact energy. Fire protection isprimarily accomplished by the ablative effect of converting the foam to char. In order topreclude the possibility of a smoldering internal fire the foam must be capable ofdeveloping an intumescent char.
8 of 8
GENERAL PLASTICS MANUFACTURING CO.,'P. 0. BOX 9097, TACOMA WA 98409 TEL 206-473-5000
LAST-A-FOAM ® FR-3700
DYNAMIC CRUSH STRENGTH
@ 750F, PARALLEL TO RISE (PSI)
CRUSH %
DENSITY 10 20 30 40 50 60 65 70 75 80
3 90 74 73 74 77 85 95 116 143 217
4 129 112 112 116 125 145 168 210 272 438
5 170 153 156 165 183 221 262 335 452 765
6 214 198 205 220 249 312 377 493 688 1219
7 260 247 259 281 325 419 514 686 989 1830
8 308 299 316 348 409 542 674 917 1361 2632
9 358 355 379 420 502 681 859 1188 1816 3667
10 410 413 445 498 603 837 1070 1505 2365 4987
11 547 545 584 649 785 1107 1435 2056 3335 6930
12 644 647 696 779 951 1362 1784 2578 4180 8761
13 749 759 819 922 1137 1652 2188 3189 5173 10938
14 862 881 953 1080 1344 1981 2653 3900 6332 13508
15 984 1013 1099 1253 1574 2353 3184 4724 7679 16524
16 1114 1155 1257 1442 1827 2770 3789 5675 9237 20041
17 1254 1309 1428 1647 2105 3238 4476 6767 11031 24119
18 1402 1473 1613 1869 2410 3760 5253 8017 13089 28823
19 1560 1650 1811 2110 2744 4341 6130 9444 15439 34222
20 1727 1839 2023 2370 3109 4986 7116 11066 18112 40388
21 1905 2040 2251 2650 3505 5701 8222 12904 21144 47398
22 2093 2255 2494 2952 3937 6491 9460 14982 24568 55335
23 2292 2483 2754 3275 4404 7363 10842 17323 28425 64285
24 2501 2726 3031 3623 4911 8323 12381 19954 32753 74337
25 2722 2983 3326 3994 5459 9377 14091 22903 37595 85586
30 4012 4513 5096 6268 8913 16344 25764 43504 71191 163427
6/3/9 6
GENERAL PLASTICS MANUFACTURING CO., P.O. BOX 9097, TACOMA WA 98409 TEL 206-473-5000
LAST-A-FOAM ® FR-3700
DYNAMIC CRUSH STRENGTH
@ 750F, PERPENDICULAR TO RISE (PSI)
CRUSH %
DENSITY 10 20 30 40 50 60 65 70 75 80
3 54 49 50 55 61 70 80 99 135 216
4 86 81 84 92 103 125 148 189 264 435
5 124 119 125 137 156 197 239 312 448 759
6 167 164 175 191 219 287 354 472 693 1208
7 215 215 232 252 292 395 496 673 1009 1811
8 268 272 296 322 375 522 666 920 1407 2601
9 325 335 368 400 469 668 866 1218 1900 3619
10 387 404 447 486 573 836 1100 1571 2502 4916
11 496 516 554 625 769 1114 1490 2189 3518 7021
12 595 621 668 756 937 1371 1844 2717 4374 8797
13 705 738 795 901 1125 1664 2251 3329 5372 10889
14 825 866 934 1063 1335 1997 2717 4035 6529 13335
15 956 1007 1088 1241 1570 *2372 3247 4844 7862 16178
16 1099 1161 1255 1437 1829 2795 3849 5768 9391 19464
17 1254 1329 1438 1652 2116 3268 4529 6820 11139 23240
18 1422 1511 1638 1887 2432 3797 5295 8013 13128 27560
19 1603 1709 1853 2142 2779 4386 6155 9361 15382 32477
20 1797 1922 2087 2419 3159 5040 7119 10880 17929 38049
21 2007 2152 2339 2720 3574 5766 8195 12587 20796 44335
22 2231 2399 2611 3045 4028 6568 9395 14499 24012 51400
23 2472 2665 2904 3397 4521 7454 10729 16634 27608 59309
24 2729 2950 3218 3776 5058 8430 12209 19013 31617 68131
25 3003 3255 3556 4185 5641 9502 13847 21657 36073 77939
30 4666 5122 5630 6727 9354 16600 24891 39662 66382 144476
6/3/96
FIRE
M A F GENERAL PLASTICS TELEX 989134
MANUFACTURING COMPANY FAX (206) 473-5104I 4910 BURLINGTON WAY/P.O. BOX 9097 TOLL FREE FROM
TACOMA, WASHINGTON 98409 Seattle-Renton Area(206) 473-5000 (206) 623-2795
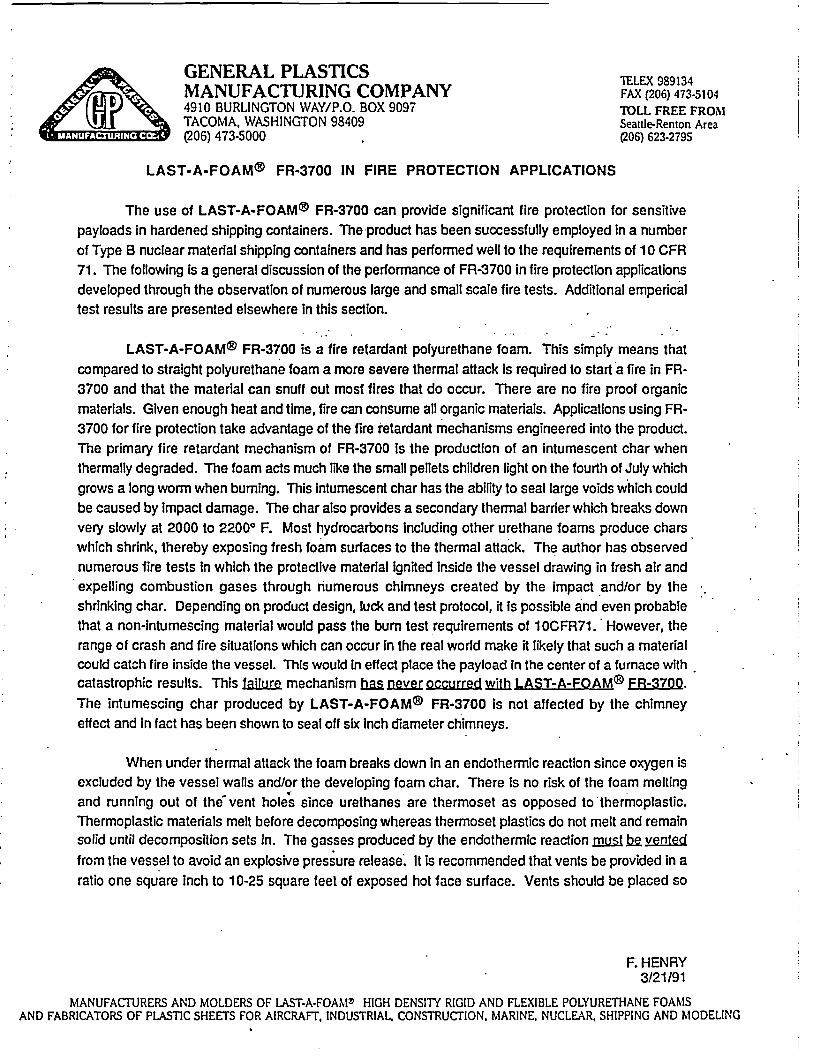
LAST-A-FOAM® FR-3700 IN FIRE PROTECTION APPLICATIONS
The use of LAST-A-FOAMS FR-3700 can provide significant fire protection for sensitivepayloads in hardened shipping containers. The product has been successfully employed in a number
of Type B nuclear material shipping containers and has performed well to the requirements of 10 CFR71. The following is a general discussion of the performance of FR-3700 in fire protection applicationsdeveloped through the observation of numerous large and small scale fire tests. Additional empericaltest results are presented elsewhere in this section.
LAST-A-FOAM® FR-3700 is a fire retardant polyurethane foam. This simply means thatcompared to straight polyurethane foam a more severe thermal attack Is required to start a fire in FR-
3700 and that the material can snuff out most tires that do occur. There are no fire proof organic
materials. Given enough heat and time, fire can consume all organic materials. Applications using FR-3700 for fire protection take advantage of the fire retardant mechanisms engineered into the product.
The primary fire retardant mechanism of FR-3700 Is the production of an Intumescent char whenthermally degraded. The foam acts much like the small pellets children light on the fourth of July which
grows a long worm when burning. This Intumescent char has the ability to seal large voids which could
be caused by impact damage. The char also provides a secondary thermal barrier which breaks down
very slowly at 2000 to 22000 F. Most hydrocarbons Including other urethane foams produce charswhich shrink, thereby exposing fresh foam surfaces to the thermal attack. The author has observed
numerous fire tests in which the protective material Ignited Inside the vessel drawing in fresh air andexpelling combustion gases through numerous chimneys created by the impact and/or by theshrinking char. Depending on product design, luck and test protocol, it Is possible and even probable
that a non-intumescing material would pass the bum test requirements of I OCFR71. However, therange of crash and fire situations which can occur In the real world make it likely that such a materialcould catch fire Inside the vessel. This would in effect place the payload In the center of a furnace withcatastrophic results. This failure mechanism he never occurred with LAST-A-FOAM) FR-3700.
The intumescing char produced by LAST-A-FOAM® FR-3700 is not affected by the chimney
effect and in fact has been shown to seal off six Inch diameter chimneys.
When under thermal attack the foam breaks down in an endothermic reaction since oxygen is
excluded by the vessel walls and/or the developing foam char. There Is no risk of the foam melting
and running out of the vent holes since urethanes are thermoset as opposed to thermoplastic.
Thermoplastic materials melt before decomposing whereas thermoset plastics do not melt and remainsolid until decomposition sets in. The gasses produced by the endothermic reaction must be vented
from the vessel to avoid an explosive pressure release. It is recommended that vents be provided in a
ratio one square Inch to 10-25 square feet of exposed hot face surface. Vents should be placed so
F. HENRY3/21/91
MANUFACTURERS AND MOLDERS OF LAST-A-FOANIT HIGH DENSITY RIGID AND FLEXIBLE POLYURETHANE FOAMSAND FABRICATORS OF PLASTIC SHEETS FOR AIRCRAFT, INDUSTRIAL, CONSTRUCTION. MARINE, NUCLEAR, SHIPPING AND MODELING
GENERAL PLASTICS MANUFACTURING COMPANY P.O. BOX 9097, TACOMA WA 98409 (206) 473-5000
that the breakdown products and gases are channeled away from sensitive areas of the payload suchas seal sections. Venting of the decomposition products removes most of the heat penetrating thevessel. Outside the vessel the gasses ignight and burn along with the fuel. The burning gassescannot add to the heat load on the vessel since the fire Is already engulfing the vessel and the gassesburn at the same temperature as typical fuels.
Many applications using FR-3700 for fire protection also incorporate ceramic fiber insulation aspart of the protective package. Although it Is possible for the FR-3700 to provide all of the fireprotection necessary, the use of ceramic fiber insulation may be advised when there is a possibility ofthe payload slumping or the outside wall sagging. If such were to occur, the space between thepayload and the hot surface would be reduced. In cases such as these the ceramic fiber insulationwould prevent metal to metal contact.
The foregoing is offered as an aid to the designer of protective packages used for shippingnuclear and other sensitive materials. These recommendations are based on observations of manysmall scale tests and lessons learned in the design of protective packages now in existence. Theinformation presented here is only intended as an aid in the Initial design phase. Experience hasshown that performance In fire Is very configuration dependent. General Plastics ManufacturingCompany recommends that all designs be tested In a full scale engulfing fire preferably using diesel orfuel oil.
General Plastics' has the test facilities to perform appropriate product performance tests oneach lot of material used in fire protection applications. Test reports and data will be made available toany customer so desiring. General Plastics' warrants that the products delivered to the buyer will atthat time of delivery meet all mutually agreed performance requirements as evidenced by appropriatequality assurance test and will be free of defects In material and workmanship. If the productsdelivered by General Plastics' do not conform to this warranty it will correct the non-conformity by repairor replacement at its option.
F. HENRY3/21/91
GENERAL PLASTICSMANUFACTURING COMPANY4910 BURLINGTON WAY/P.O. BOX 9097TACOMA, WASHINGTON 98409
. (206) 473-5000
lELEX 989134FAX (206) 473-5104TOLL FREE FROMSeattle-Renton Area(206) 623-2795
May 7,1990
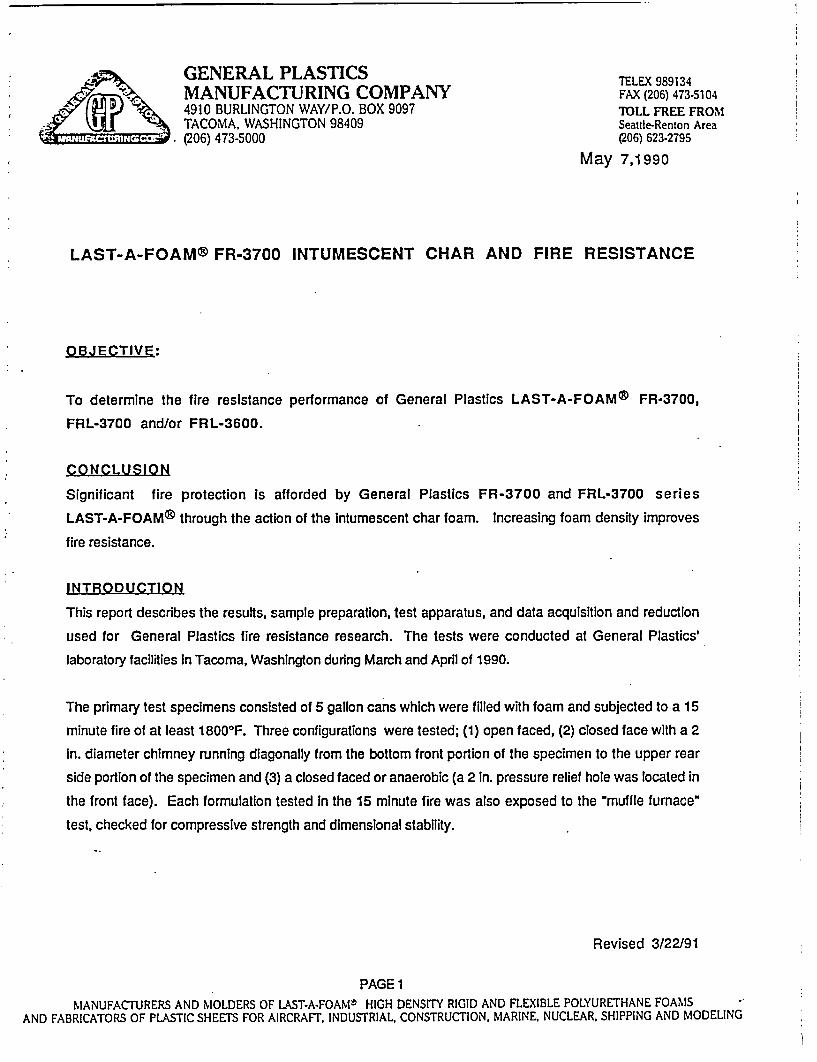
LAST-A-FOAM® FR-3700 INTUMESCENT CHAR AND FIRE RESISTANCE
OBJECTIVE:
To determine the fire resistance performance of General Plastics LAST-A-FOAM%) FR-3700,
FRL-3700 and/or FRL-3600.
CONCLUSION
Significant fire protection is afforded by General Plastics FR-3700 and FRL-3700 series
LAST-A-FOAM% through the action of the Intumescent char foam. Increasing foam density improves
fire resistance.
INTRODUCTION
This report describes the results, sample preparation, test apparatus, and data acquisition and reduction
used for General Plastics fire resistance research. The tests were conducted at General Plastics'
laboratory facilities in Tacoma, Washington during March and April of 1990.
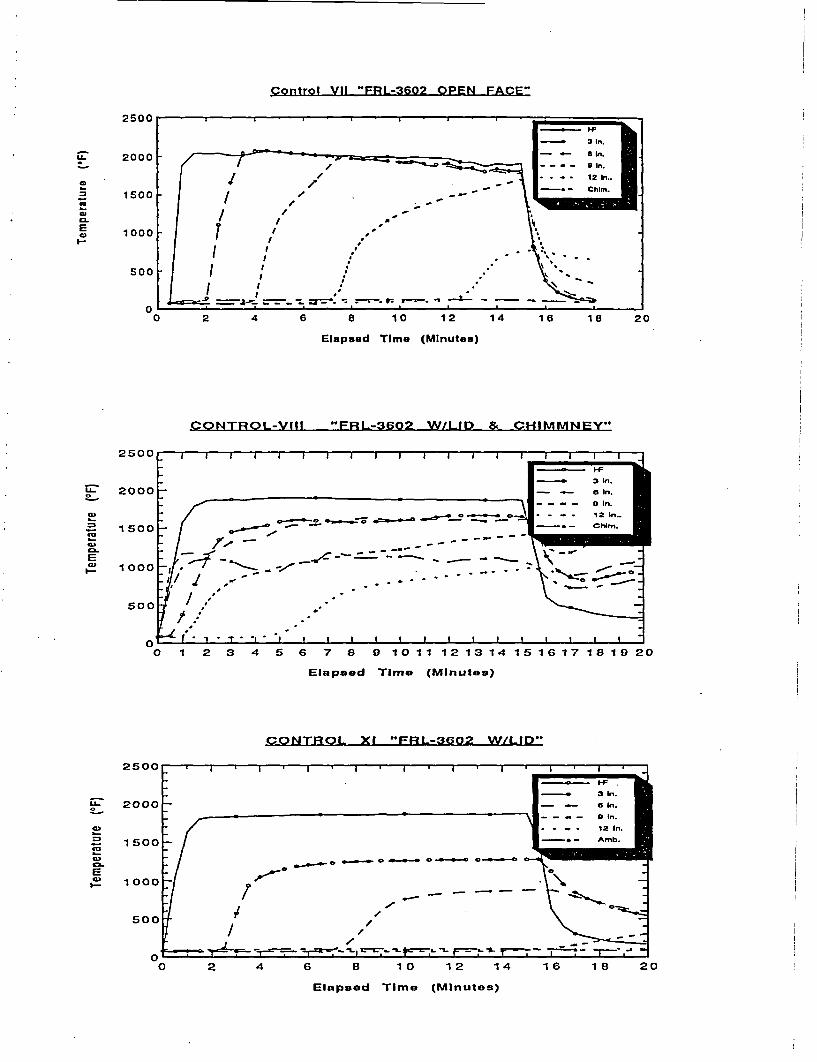
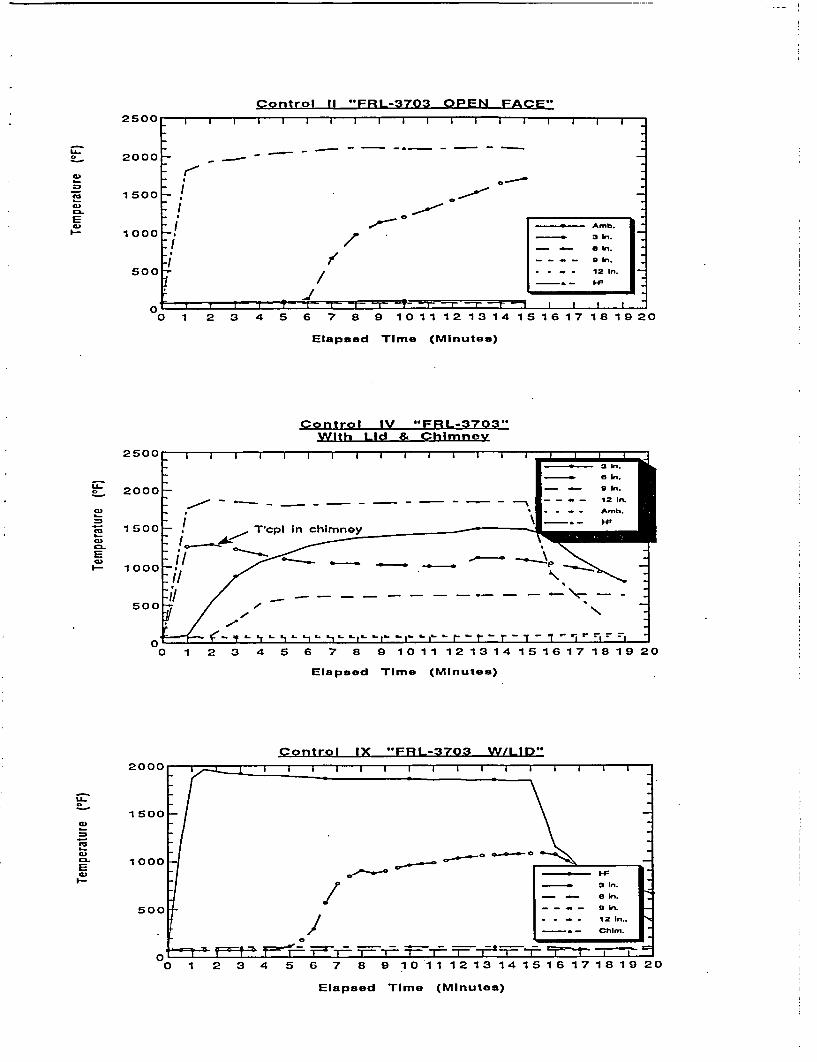
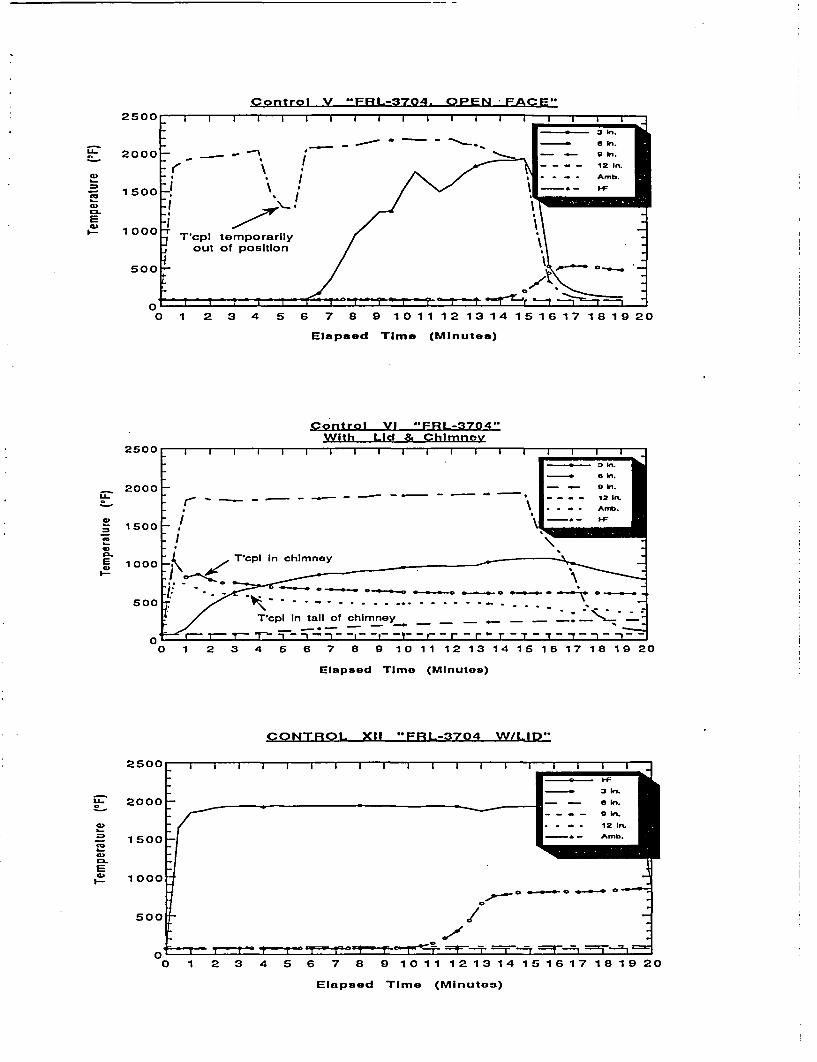
The primary test specimens consisted of 5 gallon cans which were filled with foam and subjected to a 15
minute fire of at least 18000 F. Three configurations were tested; (1) open faced, (2) closed face with a 2
in. diameter chimney running diagonally from the bottom front portion of the specimen to the upper rear
side portion of the specimen and (3) a closed faced or anaerobic (a 2 in. pressure relief hole was located in
the front face). Each formulation tested in the 15 minute fire was also exposed to the 'muffle furnace"
test, checked for compressive strength and dimensional stability.
Revised 3/22/91
PAGE 1
MANUFACTURERS AND M OLDERS OF LAST-A-FOAMt HIGH DENSITY RIGID AND FLEXIBLE POLYURETHANE FOAMSAND FABRICATORS OF PLASTIC SHEETS FOR AIRCRAFT, INDUSTRIAL, CONSTRUCTION, MARINE, NUCLEAR. SHIPPING AND MODELING
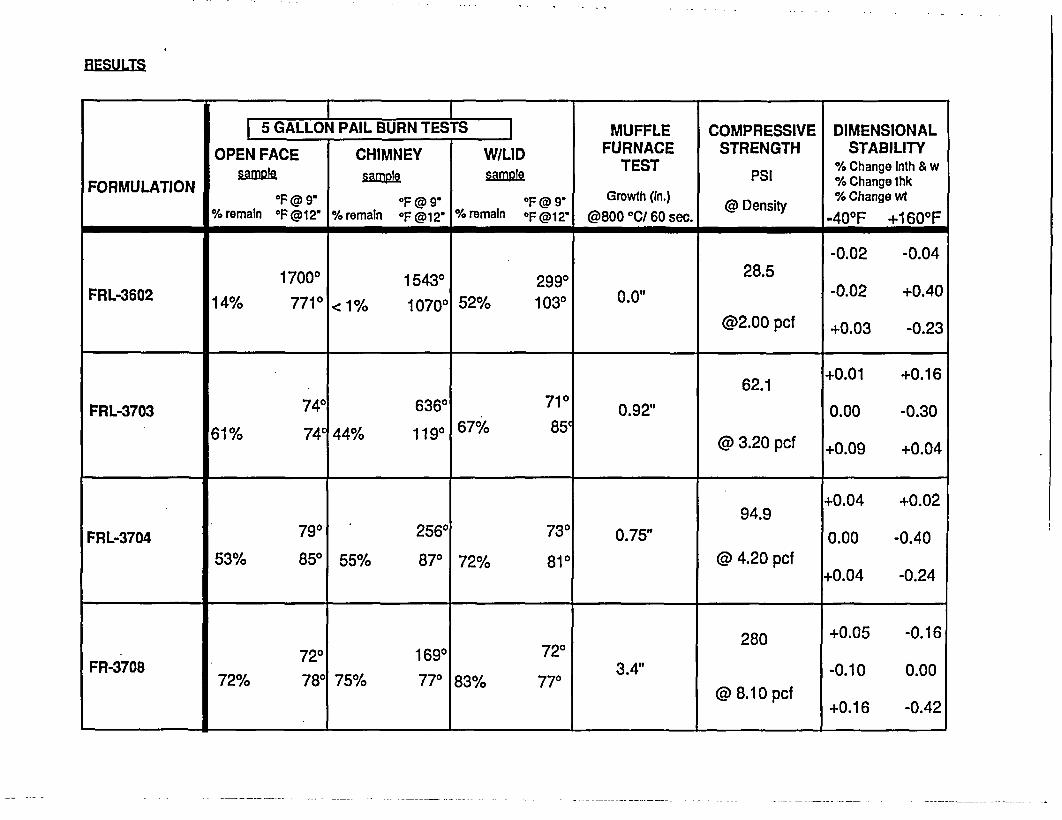
RESULTS
I I5 GALLON PAIL BURN TESTS MUFFLE COMPRESSIVE DIMENSIONAL
OPEN FACE CHIMNEY W/LID FURNACE STRENGTH STABILITYsample sample TEST PSI % Change Inth & w
FORMULATION umn1lqSI% Changethkr F emo OF r 9- ° @ 9 Growth (In.) @ Density % Change wt
%Fremain °F12' %remain *F@12- % remain OF @12" @800 0C/ 60 sec. -40TF +1 60TF
-0.02 -0.04
17000 15430 2990 28.5FRL-3602 14% 7710 <1% 10700 52% 1030 0." -0.02 +0.40
@2.00 pcf +0.03 -0.23
62.1 +0.01 +0.16
FRL-3703 740 6360 710 0.92" 0.00 -0.30
61% 74' 44% 1190 67% 85'@ 3.20 pcf +0.09 +0.04
+0.04 +0.0294.9
FRL-3704 790 256° 73 0.75" 0.00 -0.40
53% 850 55% 870 72% 810 @ 4.20 pcf+0.04 -0.24
72 1690 720 280 +0.05 -0.1672% 780 75% 770 83% 770 @ 8.10 pcf
+0.16 -0.42
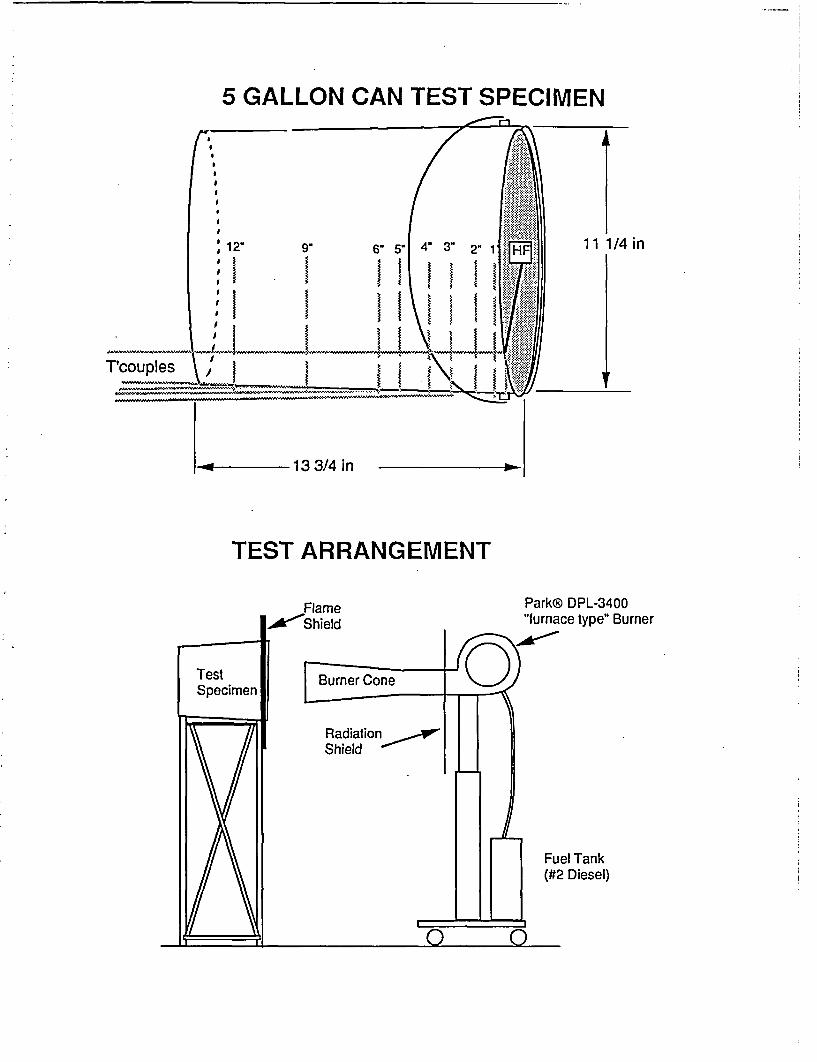
5 GALLON CAN TEST SPECIMEN
of - 13 3/4 in O
TEST ARRANGEMENT
Park® DPL-3400"furnace type" Burner
Fuel Tank(#2 Diesel)
EQUIPMENT:
TEST BURNER:
NOZZLE:
BURNER CONE:
FUEL:
THERMOCOUPLES:
DIGITAL PYROMETER:
TEMPERATURE RECORDER:
LABORATORY BALANCE:
DATA REDUCTION:
MUFFLE FURNACE:
UNIVERSAL TEST MACH:
CAN:
SPECIMEN STAND:
PARK®MODEL DPL-3400 -FAA SPECIAL"
800 SPRAY ANGLE RATED 2.25 GALIHOUR @ 100 PSI
12 INCH PER CFR PART 25 APPENDIX F PARA. d 2 iii
TEXACOS #2 DIESEL
OMEGA ® 0.062" ICONEL® SHEATHED TYPE "K-
OMEGA® MODEL 115-KF WITH NIST TRACEABLE
CALIBRATION AT TIME OF TEST
OMEGA ® MODEL 272-ALM
K-TRON® MODEL #KP-1 WITH N IST TRACEABLE
CALIBRATION (FOR WEIGHING SPECIMENS BEFORE AND
AFTER TESTING)
KALEIDAGRAPH® VERSION 2.0 ON APPLE
MACINTOSH® SE-30 PERSONAL COMPUTER
THERMOLYNE® TYPE 1400 WITH OMEGA MODEL 115KC
CONTROLLER AND DIGITAL TEMPERATURE INDICATOR.
INSTRONS MODELTT-D
PRPC®, 28/26-5-89, DOT-37C-805 gallon paint pail
Designed from one inch angle Iron to hold the 5 gallon sample
cans used In this test. The design was an open framework that
resulted In minimal obstruction of the burner flame around the
PAGE 3
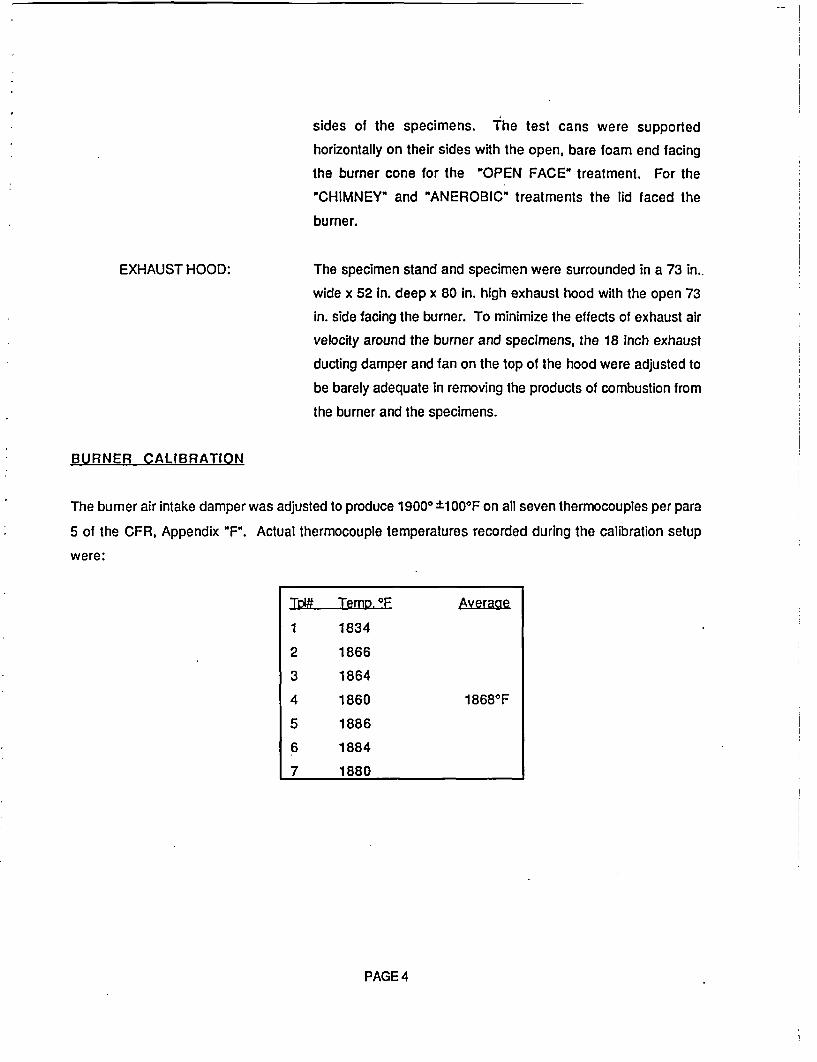
sides of the specimens. The test cans were supported
horizontally on their sides with the open, bare foam end facing
the burner cone for the "OPEN FACE' treatment. For the
"CHIMNEY" and "ANEROBIC" treatments the lid faced the
burner.
EXHAUST HOOD: The specimen stand and specimen were surrounded in a 73 in..
wide x 52 In. deep x 80 in. high exhaust hood with the open 73
In. side facing the burner. To minimize the effects of exhaust airvelocity around the burner and specimens, the 18 inch exhaust
ducting damper and fan on the top of the hood were adjusted to
be barely adequate in removing the products of combustion from
the burner and the specimens.
BURNER CALIBRATION
The burner air intake damper was adjusted to produce 19000 ±1000F on all seven thermocouples per para
5 of the CFR, Appendix "F". Actual thermocouple temperatures recorded during the calibration setup
were:
Tpl# Temp.E Average
1 1834
2 1866
3 1864
4 1860 18680F
5 1886
6 1884
7 1880
PAGE 4
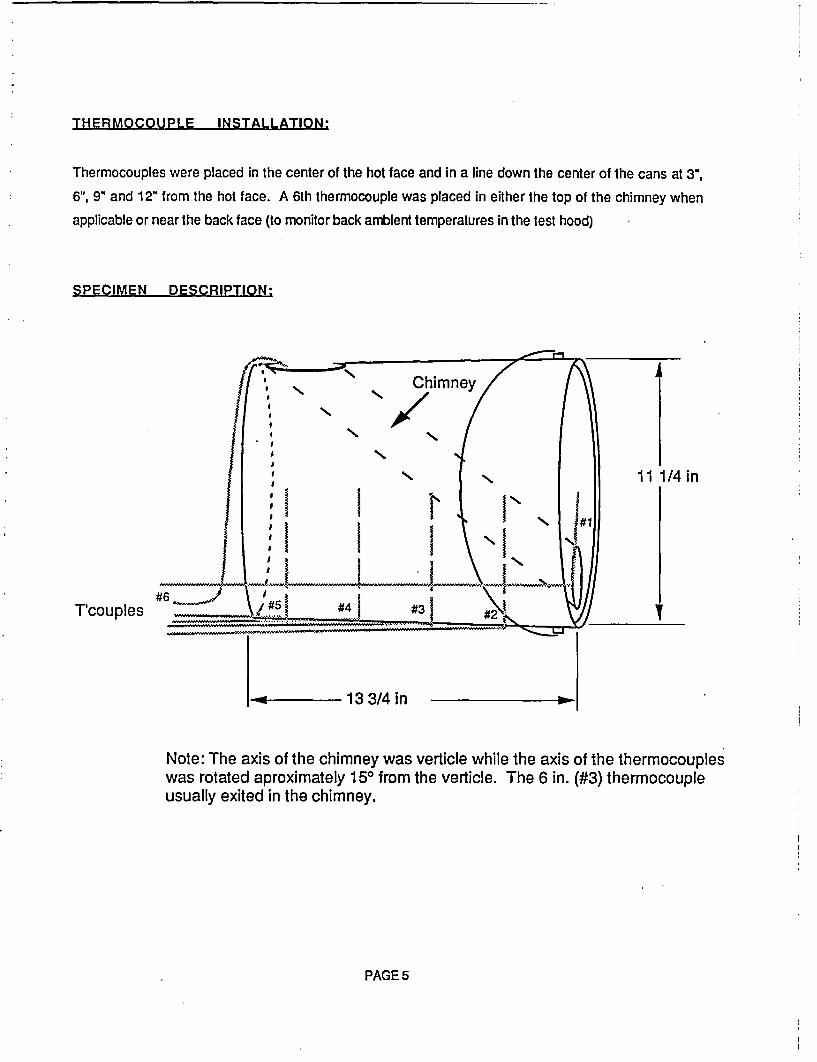
THERMOCOUPLE INSTALLATION:
Thermocouples were placed in the center of the hot face and in a line down the center of the cans at 3",
6", 9" and 12" from the hot face. A 6th thermocouple was placed in either the top of the chimney when
applicable or near the back face (to monitor back ambient temperatures in the test hood)
SPECIMEN DESCRIPTION:
T'couples
0 -13 3/4 in
Note: The axis of the chimney was verticle while the axis of the thermocoupleswas rotated aproximately 150 from the verticle. The 6 in. (#3) thermocoupleusually exited in the chimney.
PAGE 5
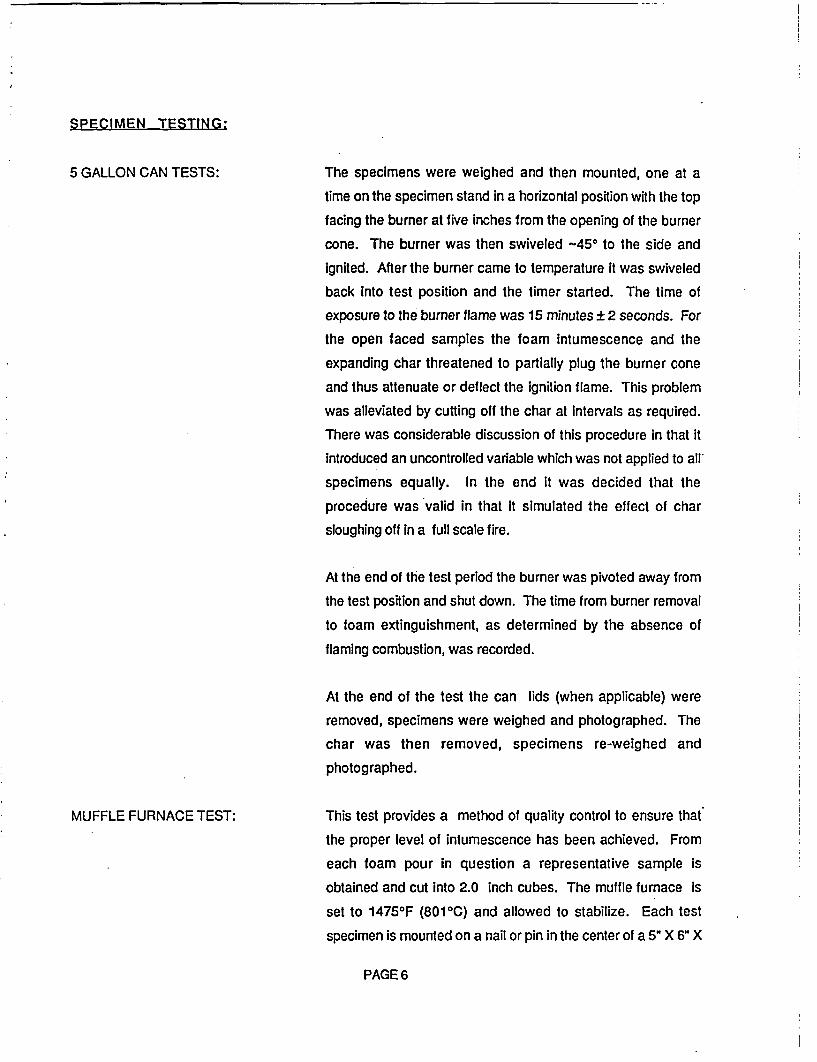
SPECIMEN TESTING:
5 GALLON CAN TESTS: The specimens were weighed and then mounted, one at a
time on the specimen stand in a horizontal position with the top
facing the burner at five Inches from the opening of the burner
cone. The burner was then swiveled -450 to the side and
ignited. After the burner came to temperature it was swiveled
back into test position and the timer started. The time of
exposure to the burner flame was 15 minutes ± 2 seconds. For
the open faced samples the foam intumescence and the
expanding char threatened to partially plug the burner cone
and thus attenuate or deflect the ignition flame. This problem
was alleviated by cutting off the char at intervals as required.
There was considerable discussion of this procedure in that it
introduced an uncontrolled variable which was not applied to all
specimens equally. In the end it was decided that the
procedure was valid in that it simulated the effect of char
sloughing off in a full scale fire.
At the end of the test period the burner was pivoted away from
the test position and shut down. The time from burner removal
to foam extinguishment, as determined by the absence of
flaming combustion, was recorded.
At the end of the test the can lids (when applicable) were
removed, specimens were weighed and photographed. The
char was then removed, specimens re-weighed and
photographed.
MUFFLE FURNACE TEST: This test provides a method of quality control to ensure that
the proper level of intumescence has been achieved. From
each foam pour in question a representative sample Is
obtained and cut into 2.0 inch cubes. The muffle furnace is
set to 14750F (8010C) and allowed to stabilize. Each test
specimen is mounted on a nail or pin in the center of a 5" X 6" X
PAGE 6

1 in. Duraboard® (or other suitable insulator). The specimen in
then inserted into the muffle furnace with the insulator acting
as the furnace door for 60 seconds. After allowing the
specimen to cool it is carefully measured and weighed. In this
report the results were reported for comparative analysis. From
this data QC limits will be established. Included in the data
section but not reported in "Results" are data on a Muffle
Furnace test series wherein samples were elevated on a small
hardware cloth platform. This variation of the test is not as
discriminating as the preferred "Nail Mount" method.
COMPRESSIVE STRENGTH:
DIMENSIONAL STABILITY
ASTM D-1621-79 Specimens were cut from each test
formulation. Sample configuration on all compressive strength
samples were 1.00" thick X 4.00" X 4.00" and compressed
parallel with the direction of foam rise. The stress/strain curves
produced were evaluated and reported at the ultimate point of
the curve.
A dimensional stability sample was cut from each test formulation.
Sample configuration on all dimensional stability samples was
1.00" thick in the direction of foam rise X 4.00" X 4.00". Sample
conditioning was 24 hour equilibration at 73±20F and 50%
relative humidity. After equilibration the samples were then
weighed, measured and placed into their respective test
environments.
Environment #1: 1600±50F and ambient humidity
Environment #2: -400±50F and ambient humidity
Samples in the -400F environment were bagged in plastic to
prevent moisture condensation. At several intervals during the
test period the samples were removed from their test
environments, allowed to recover to room temperature for two
hours. The samples were then measured and weighed. The
resulting dimensional and weight changes were reported as "%
Change".
PAGE 7
COMMENTS:
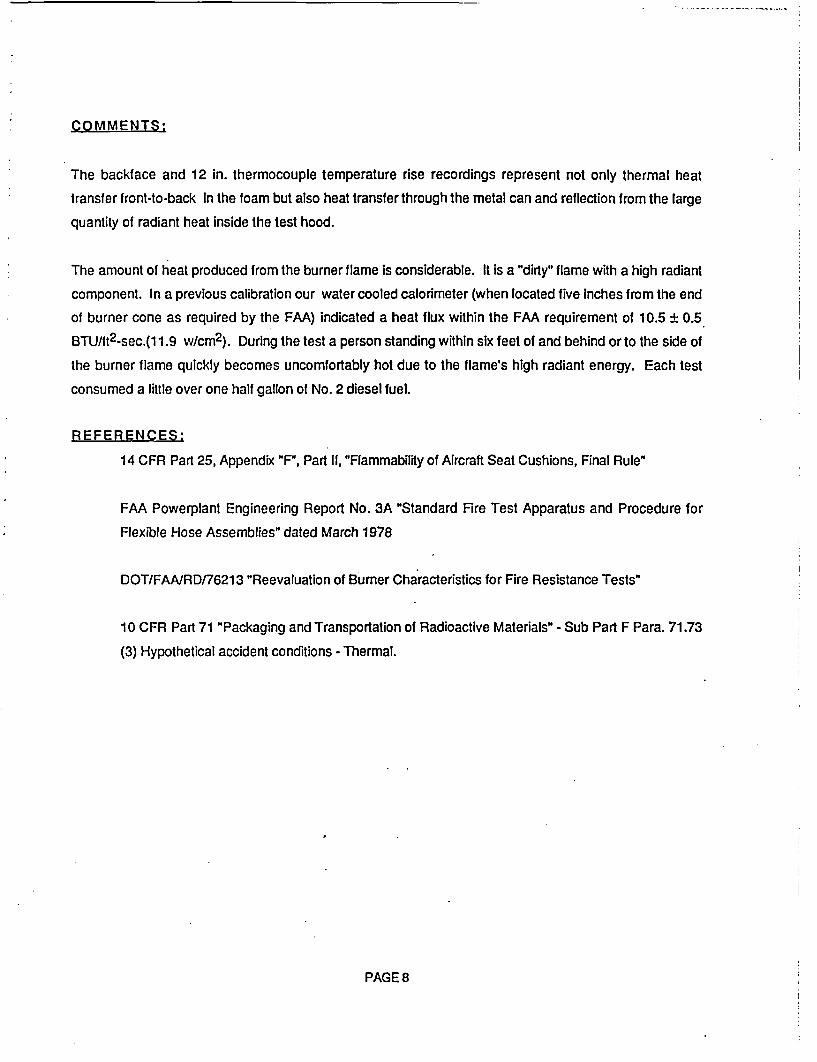
The backface and 12 in. thermocouple temperature rise recordings represent not only thermal heat
transfer front-to-back in the foam but also heat transfer through the metal can and reflection from the large
quantity of radiant heat inside the test hood.
The amount of heat produced from the burner flame is considerable. It is a "dirty" flame with a high radiant
component. In a previous calibration our water cooled calorimeter (when located five inches from the end
of burner cone as required by the FAA) indicated a heat flux within the FAA requirement of 10.5 ± 0.5
BTU/ft2-sec.(11.9 w/cm2 ). During the test a person standing within six feet of and behind or to the side of
the burner flame quickly becomes uncomfortably hot due to the flame's high radiant energy. Each test
consumed a little over one half gallon of No. 2 diesel fuel.
REFERENCES:
14 CFR Part 25, Appendix "F", Part II, "Flammability of Aircraft Seat Cushions, Final Rule"
FAA Powerplant Engineering Report No. 3A "Standard Fire Test Apparatus and Procedure for
Flexible Hose Assemblies" dated March 1978
DOT/FAA/RD/76213 "Reevaluation of Burner Characteristics for Fire Resistance Tests"
10 CFR Part 71 "Packaging and Transportation of Radioactive Materials" -Sub Part F Para. 71.73
(3) Hypothetical accident conditions - Thermal.
PAGE 8
Control Vil -FRL-3602 OPEN FACE-
2500
t
U-
a-E0-
I -
2000
1500
1000
500
00
Elapsed Time (Minutes)
CO r% rNTROLi-V II I '-FRLR-36l09 W/IDl 8 eH4 " MM NM F V
2500
t 2000
.n 1 50 0
2-
EW 1 000
500
Soo
0C
/ get
I I, I
*1
| 3 In
|_ _ 12 In.. |- _ _ In.
-- - - gi
0-_* - 0 _ I _ in__~*- / ,, ,_~~- - I
*1 .I I I I I I I I I I I I I I I _
1 2 3 4 5 6 7 8 9 10 11 12 13 14 15 16 17 18 19 20
Elapsed Time (Minutes)
CONTROL Xi "FRL-3602 W/LID"
M-
C-
EtI-
00 2 4 6 8 1 0 1 2 14 1 6 1 8 20
Elapsed Time (Minutes)
Control 11 "FRL-3703 OPEN FACE-
a,
Ea,EI -
2500 a a i a a a a a
2000 _ _ -
1500 S
-OOO| AAmb.100 , / | In. |
nIn.
500 /- 12 In. -
-. t I
0 1 2 3 4 5 6 7 8 9 10 11 12 13 14 15 16 17 18 19 20
Elapsed Time (Minutes)
Control IV "FRL-3703"With Lid & Chimney
2500
M-
C-
Ea)
20001
1 500
1 000
I I I I I I I I I I I I I I I I I I In .
a In.
9 In._ , _ __ _ _ _ - -g 2In.
- - - - -12- - - 12 I
- ~Amb.T'cpI In chimney
I
I500
00 1 2 3 4 5 6 7 8 9 10 11 12 13 14 15 16 17 18 19 20
Elapsed Time (Minutes)
Control IX *FRL-3703 W/LID--, ^ ~ MI
-
C-
EI.-
1 5001
1 000
- - 3 In.
|_ _ 12 In..
; t _K Chn m.
500
- 1 IU-0 1 2 3 4 5 6 7 8 9 10 11 12 13 14 15 16 17 18 19 20
Elapsed Time (Minutes)
Control V 'FRL-3704. OPEN FACE"25
_ _
,uu. . .- . I I
M-
2!
C3)
EI-
2000
1 500
1 000
-I-I
CI
-1
IT'cpl temporarily
out of position
:N In.I _ -, In.
i- - - _- 12 In.
/ \ / -- Amb.|
I - -
/ \\
f. 0, .
/ /te °_C'. .. . . . . . .
500
n--0 1 2 3 4 5 6 7 8 9 10 1 112 13 14 15 16 17 18 19 20
Elapsed Time (Minutes)
Control V "FRL-3704"With Lid & ChImnev
2500n I - - - - - - -- C7l.
2000
t inn
I I I I I I I I I I I I I I
a I : I n. I| _ In.
a_ _ In.*- - a in.
- - - 12 In.I . . . Amb.E
-l IMl
a-
24D0E
F-
_ ___ _ _ . - ;I
- I
10C
5C' 0oofi g Tlcpl in talln ofinl
0O T- T- -r i- 7n- - l~~2 2 r - r r r - r =-0 1 2 3 4 5 6 7 8 9 10 11 12 13 14 15 16 17 18 19 20
Elapsed TIme (Minutes)
CONTRQL Xll "FRL-3704 W//LID"
U-
a>Eu
Z!
Ei)
I-
0 1 2 3 4 5 6 7 8 9 10 11 12 13 14 15 16 17 18 19 20
Elapsed Time (Minutes)
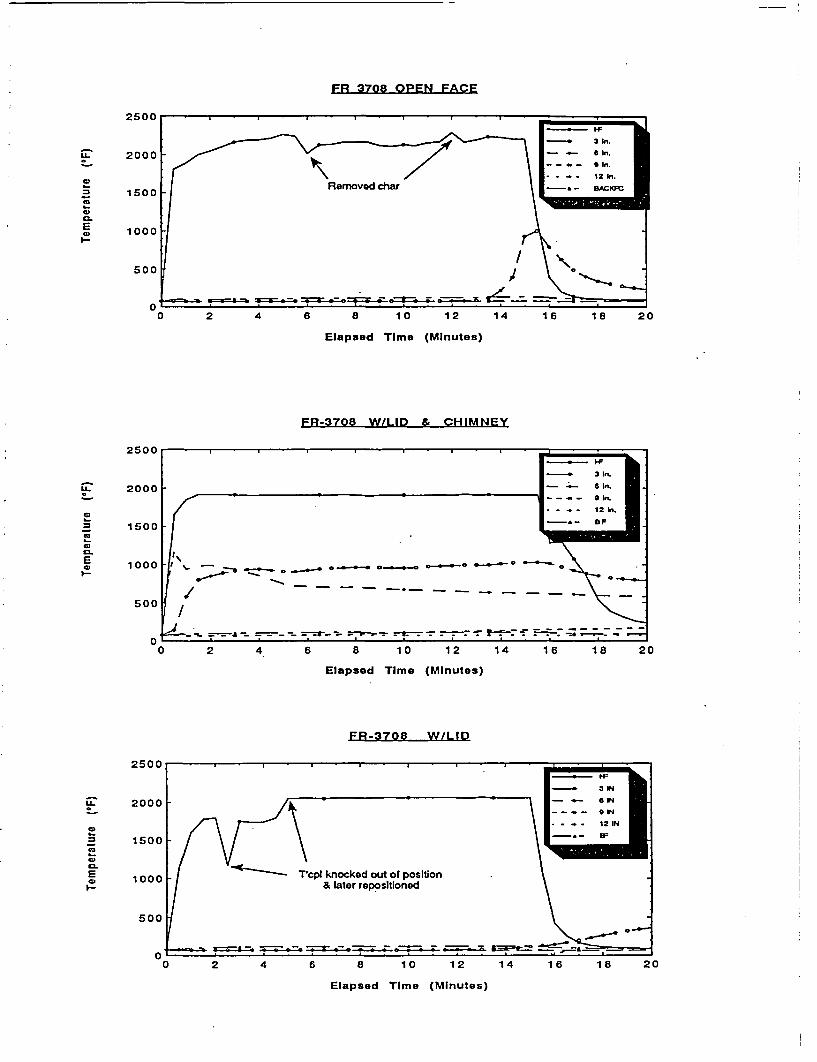
FR 3708 OPEN FACE
cz
I
a.
EC)
8 10 12
Elapsed Time (Minutes)
FR-3708 W/LID & CHIMNEY
IL
C)
C)
am
ECD
I-
2500 -
2000
1500
1000
500 f
Soo
0 -0 2 4 6 8 10 12 14 16 18 20
Elapsed Time (Minutes)
FR-3708 W/LID
Is
a-
EC)
I-
2500 -
2000
1500
1000
500
0 /0 2 4 6 8 10 12 14 16 18 20
Elapsed Time (Minutes)
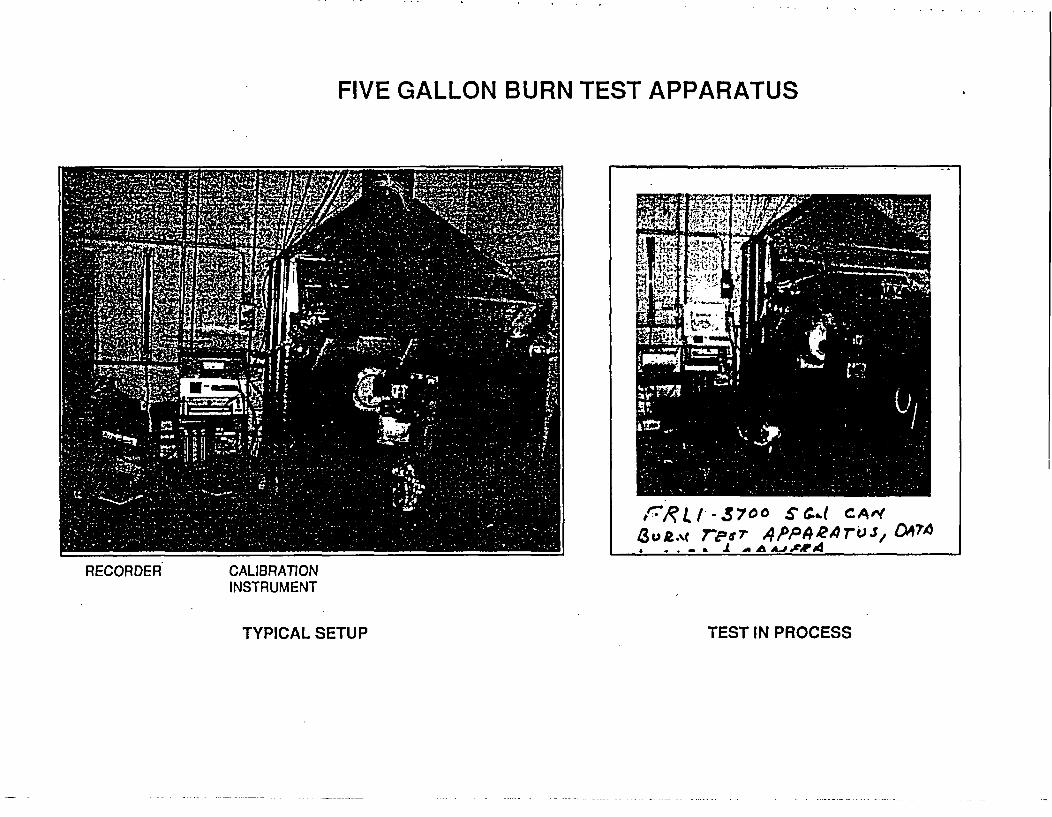
FIVE GALLON BURN TEST APPARATUS
:R/1/-.37010 Sc.-I cAe 4SUP.At razz 4,PpAJNerosaC$a . . _ A I _ A AFLEXr
RECORDER CALIBRATIONINSTRUMENT
TYPICAL SETUP TEST IN PROCESS
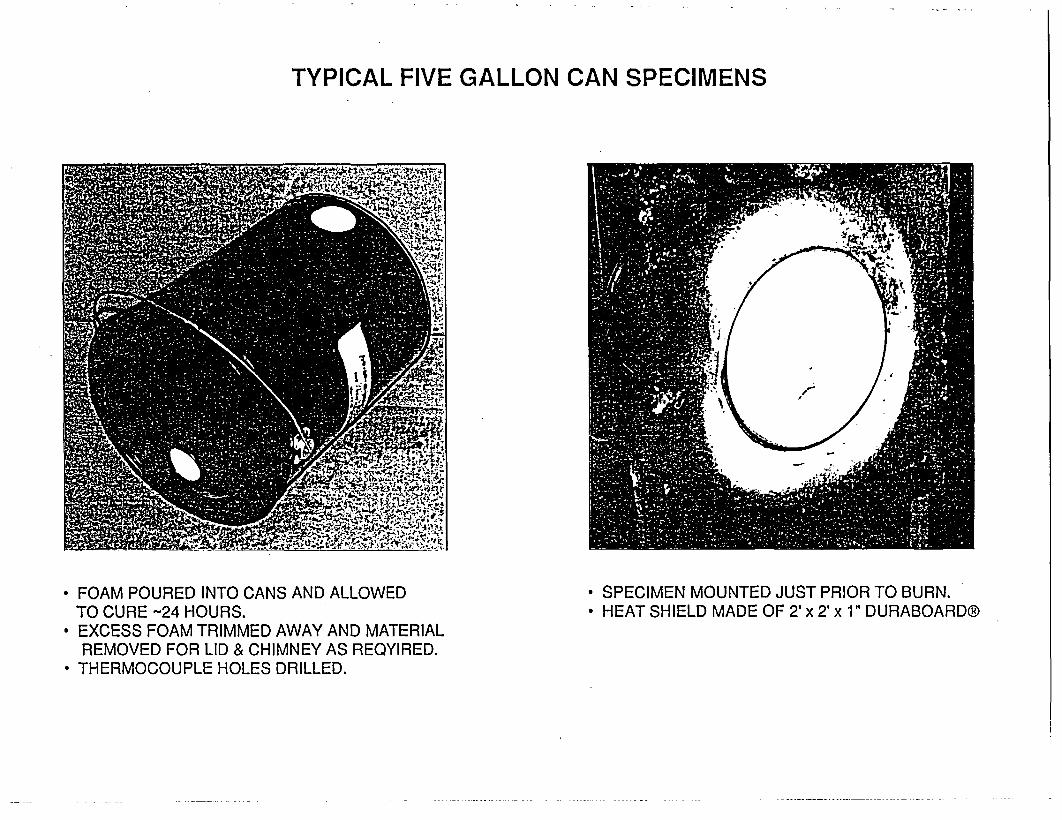
TYPICAL FIVE GALLON CAN SPECIMENS
* FOAM POURED INTO CANS AND ALLOWEDTO CURE -24 HOURS.
* EXCESS FOAM TRIMMED AWAY AND MATERIALREMOVED FOR LID & CHIMNEY AS REQYIRED.
* THERMOCOUPLE HOLES DRILLED.
* SPECIMEN MOUNTED JUST PRIOR TO BURN.* HEAT SHIELD MADE OF 2' x 2' x 1" DURABOARD®
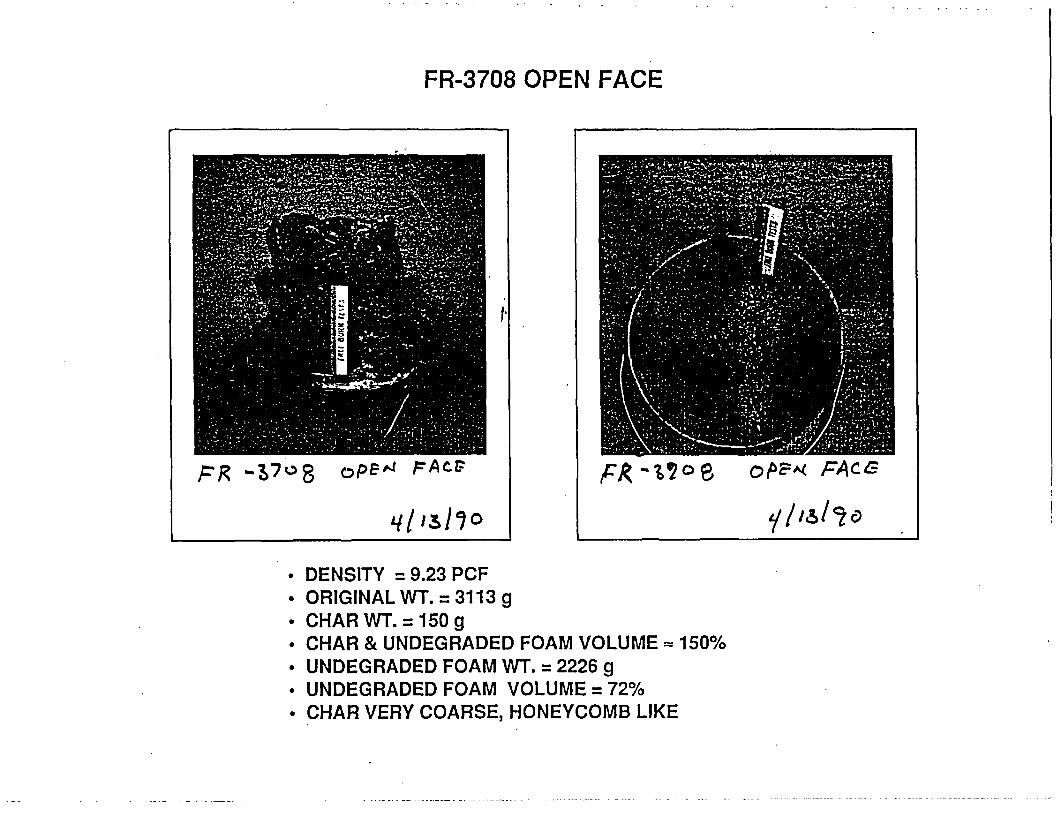
FR-3708 OPEN FACE
* DENSITY = 9.23 PCF* ORIGINAL WT. = 3113 g•CHAR WT.=150g* CHAR & UNDEGRADED FOAM VOLUME 150%
UNDEGRADED FOAM WT. = 2226 g* UNDEGRADED FOAM VOLUME= 72%* CHAR VERY COARSE, HONEYCOMB LIKE
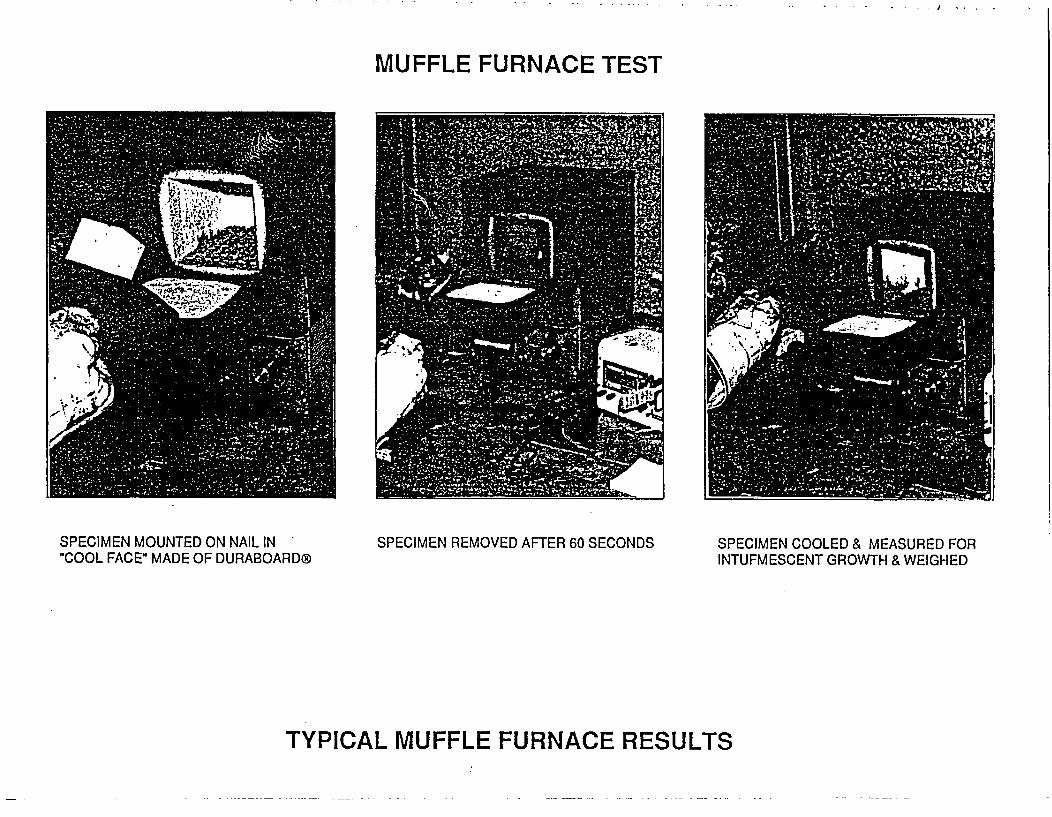
MUFFLE FURNACE TEST
SPECIMEN MOUNTED ON NAIL IN"COOL FACE" MADE OF DURABOARD®
SPECIMEN REMOVED AFTER 60 SECONDS SPECIMEN COOLED & MEASURED FORINTUFMESCENT GROWTH & WEIGHED
TYPICAL MUFFLE FURNACE RESULTS
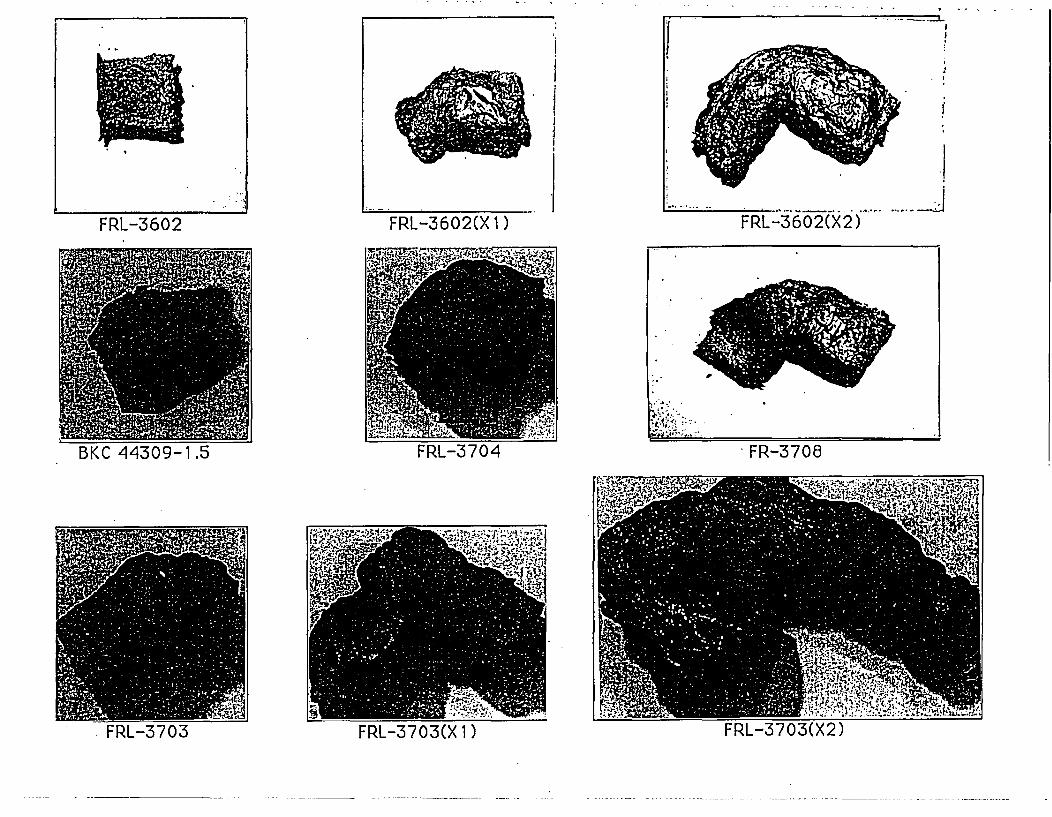
-
--
FRL-3602(X2)
I
FRL-3602 FRL-3602(X 1)
r RL-0 /U 4 I FR-3708
FRL-3703(X 1)
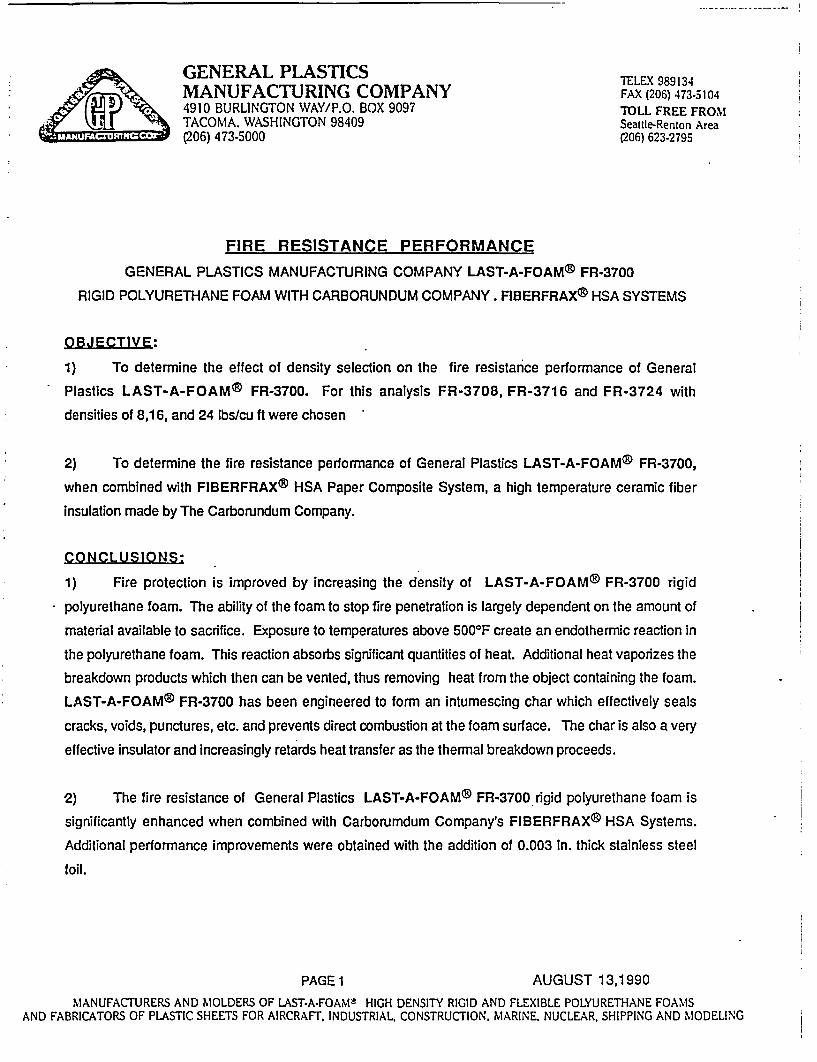
GENERAL PLASTICS TELEX 989134MANUFACTURING COMPANY FAX (206) 473-5104A S 4910 BURLINGTON WAY/P.O. BOX 9097 TOLL FREE FRONITACOMA. WASHINGTON 98409 Seattle-Renton Area(206) 473-5000 (206) 623-2795
FIRE RESISTANCE PERFORMANCEGENERAL PLASTICS MANUFACTURING COMPANY LAST-A-FOAMS FR-3700
RIGID POLYURETHANE FOAM WITH CARBORUNDUM COMPANY. FIBERFRAX® HSA SYSTEMS
OBJECTIVE:
1) To determine the effect of density selection on the fire resistance performance of General
Plastics LAST-A-FOAM% FR-3700. For this analysis FR-3708, FR-3716 and FR-3724 with
densities of 8,16, and 24 ibs/cu ft were chosen
2) To determine the fire resistance performance of General Plastics LAST-A-FOAM% FR-3700,
when combined with FIBERFRAXS HSA Paper Composite System, a high temperature ceramic fiber
insulation made by The Carborundum Company.
CONCLUSIONS:
1) Fire protection is improved by increasing the density of LAST-A-FOAM® FR-3700 rigid
polyurethane foam. The ability of the foam to stop fire penetration is largely dependent on the amount of
material available to sacrifice. Exposure to temperatures above 500OF create an endothermic reaction in
the polyurethane foam. This reaction absorbs significant quantities of heat. Additional heat vaporizes the
breakdown products which then can be vented, thus removing heat from the object containing the foam.
LAST-A-FOAMO FR-3700 has been engineered to form an intumescing char which effectively seals
cracks, voids, punctures, etc. and prevents direct combustion at the foam surface. The char is also a very
effective insulator and increasingly retards heat transfer as the thermal breakdown proceeds.
2) The fire resistance of General Plastics LAST-A-FOAM® FR-3700 rigid polyurethane foam is
significantly enhanced when combined with Carborumdum Company's FIBERFRAX®D HSA Systems.
Additional performance improvements were obtained with the addition of 0.003 In. thick stainless steel
foil.
PAGE 1 AUGUST 13,1990
MANUFACTURERS AND MOLDERS OF LAST-A-FOAMIS HIGH DENSITY RIGID AND FLEXIBLE POLYURETHANE FOAMSAND FABRICATORS OF PLASTIC SHEETS FOR AIRCRAFT. INDUSTRIAL, CONSTRUCTION, MARINE, NUCLEAR, SHIPPING AND MODELING
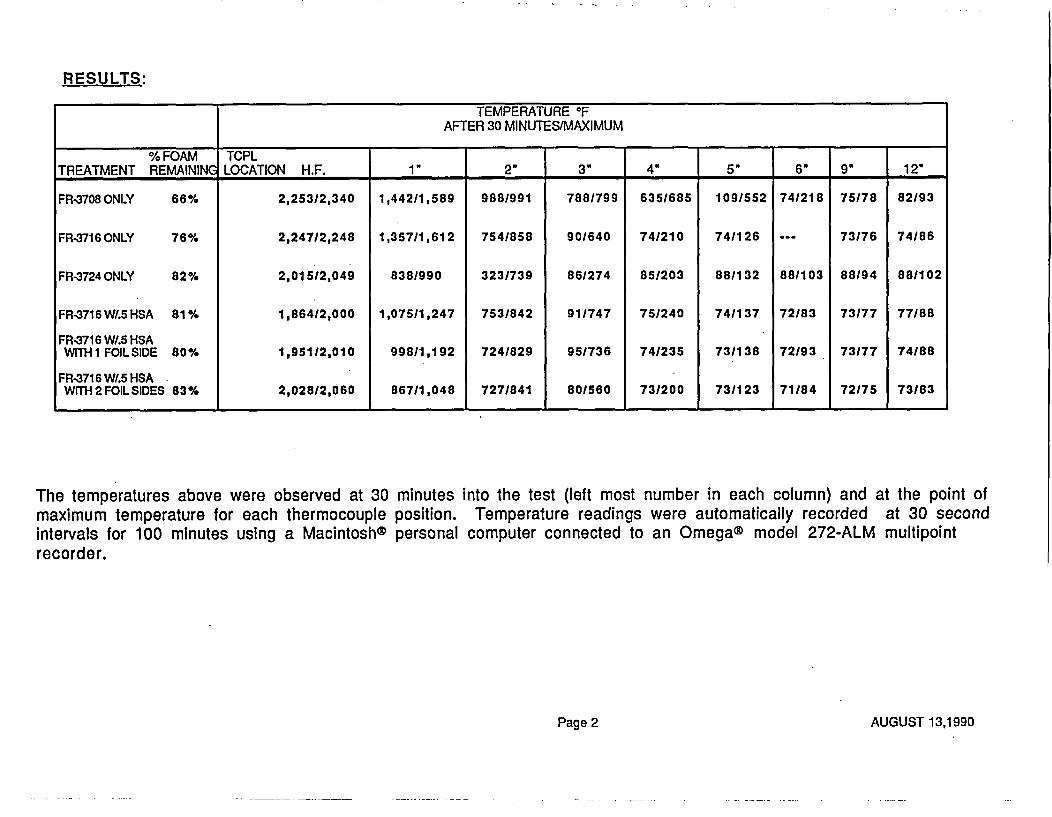
RESULTS:
TEMPERATURE OFAFTER 30 MINUTES/MAXIMUM
% FOAM TCPLTREATMENT REMAININ LOCATION H.F. 1" 2" 3" 4" 5" 6" 9" 12"
FR-3708 ONLY 66% 2,253/2,340 1,442/11589 988/991 788/799 635/685 109/552 74/218 75/78 82/93
FR-3716 ONLY 76% 2,247/2,248 1,357)1,612 754/858 90/640 74/210 74/126 v 73/76 74/86
FR-3724 ONLY 82% 2,015/2,049 838/990 323/739 86/274 85/203 88/132 88/103 88194 88/102
FR-3716W/.5HSA 81% 1,86412,000 1,07511,247 753/842 91/747 75/240 74/137 72/83 73/77 77/88
FR-371 6 W/.5 HSAWVl- I FOILSIDE 80% 1,951/2,010 99811,192 724/829 95/736 74/235 731138 72/93 73/77 74/88
FR-3716W/.5HSAWITII2 FOIL SIDES 83% 2,028/2,060 867/1,048 727/841 80/560 73/200 73/123 71184 72/75 73/83
The temperatures above were observed at 30 minutes into the test (left most number in each column) and at the point ofmaximum temperature for each thermocouple position. Temperature readings were automatically recorded at 30 secondintervals for 100 minutes using a Macintosh® personal computer connected to an Omega® model 272-ALM multipointrecorder.
Page 2 AUGUST 13,1990
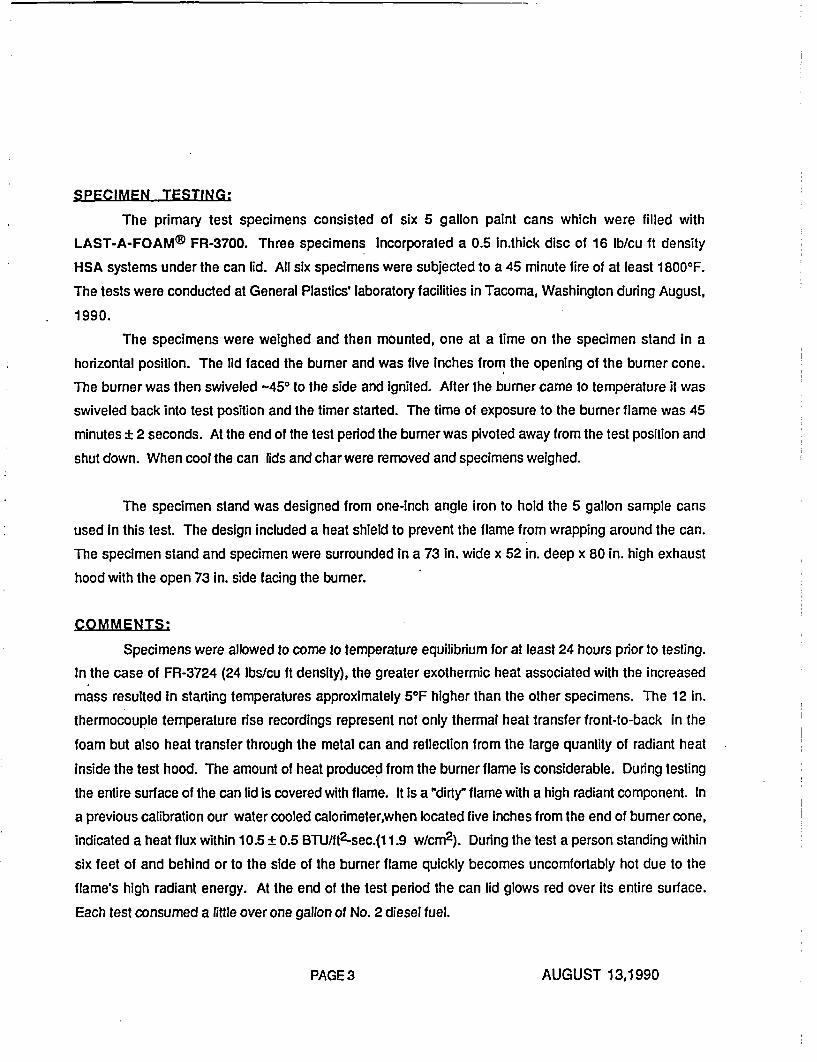
SPECIMEN TESTING:
The primary test specimens consisted of six 5 gallon paint cans which were filled with
LAST-A-FOAM%\ FR-3700. Three specimens Incorporated a 0.5 in.thick disc of 16 lb/cu ft density
HSA systems under the can lid. All six specimens were subjected to a 45 minute fire of at least 18000 F.
The tests were conducted at General Plastics' laboratory facilities in Tacoma, Washington during August,
1990.
The specimens were weighed and then mounted, one at a time on the specimen stand in a
horizontal position. The lid faced the burner and was five inches from the opening of the burner cone.
The burner was then swiveled -450 to the side and ignited. After the burner came to temperature it was
swiveled back into test position and the timer started. The time of exposure to the burner flame was 45
minutes i 2 seconds. At the end of the test period the burner was pivoted away from the test position and
shut down. When cool the can lids and charwere removed and specimens weighed.
The specimen stand was designed from one-inch angle iron to hold the 5 gallon sample cans
used in this test. The design included a heat shield to prevent the flame from wrapping around the can.
The specimen stand and specimen were surrounded In a 73 in. wide x 52 in. deep x 80 in. high exhaust
hood with the open 73 in. side facing the burner.
COMMENTS
Specimens were allowed to come to temperature equilibrium for at least 24 hours prior to testing.
In the case of FR-3724 (24 lbs/cu ft density), the greater exothermic heat associated with the increased
mass resulted in starting temperatures approximately 5F higher than the other specimens. The 12 in.
thermocouple temperature rise recordings represent not only thermal heat transfer front-to-back in the
foam but also heat transfer through the metal can and reflection from the large quantity of radiant heat
inside the test hood. The amount of heat produced from the burner flame is considerable. During testing
the entire surface of the can lid is covered with flame. It is a wdirtyH flame with a high radiant component. In
a previous calibration our water cooled calorimeterwhen located five inches from the end of burner cone,
indicated a heat flux within 10.5 ± 0.5 BTU/ft2-sec.(11.9 w/cm2). During the test a person standing within
six feet of and behind or to the side of the burner flame quickly becomes uncomfortably hot due to the
flame's high radiant energy. At the end of the test period the can lid glows red over its entire surface.
Each test consumed a lttle over one gallon of No. 2 diesel fuel.
PAGE 3 AUGUST 13,1990
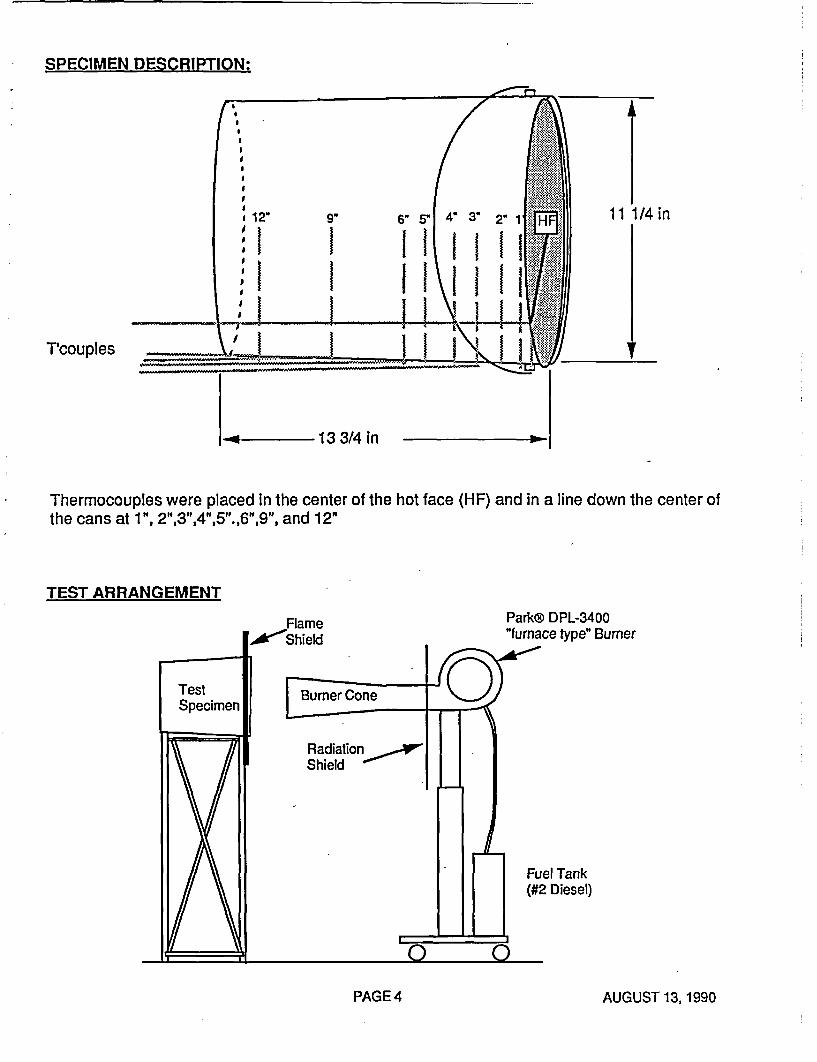
SPECIMEN DESCRIPTION:
, .,
-
I
II.
I}j Ii1 '9
ii I2I
II 1I' oI I _ I
2' 1i
I II I
11 1/4 in
T'couples13 34 iI A
.4 ~13 3/4 in O
Thermocouples were placed in the center of the hot face (HF) and in a line down the center ofthe cans at 1", 2",3",4",5".,6",9", and 12"
TEST ARRANGEMENTPark® DPL-3400"fumace type" Bumer
Fuel Tank(#2 Diesel)
PAGE 4 AUGUST 13,1990
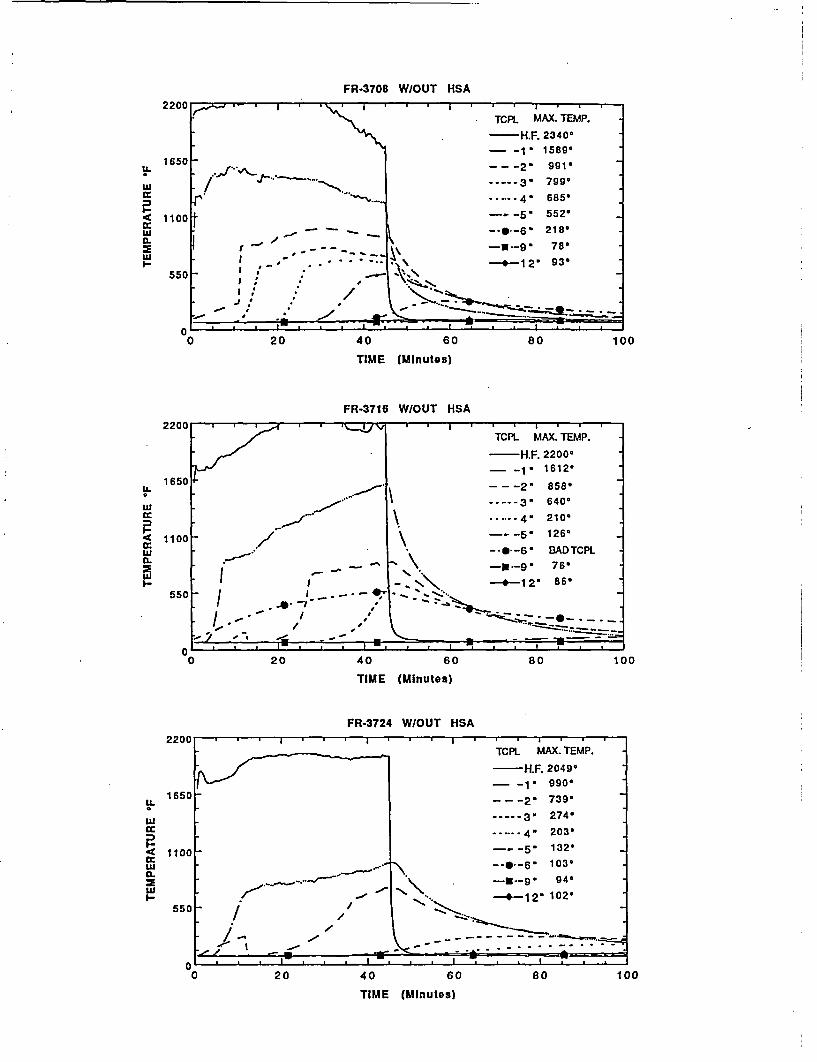
FR-3708 W/OUT HSA
U-
wI-
III
0 20 40 60 80
TIME (Minutes)
100
FR-3716 WIOUT HSA
1 650
a 1100wa-
TIME (Minutes)
FR-3724 WIOUT HSA
1
muc
LU.C-wI-1
0 .' . . . . . . . . . . . . . .0 20 40 60 80
TIME (Minutes)
100
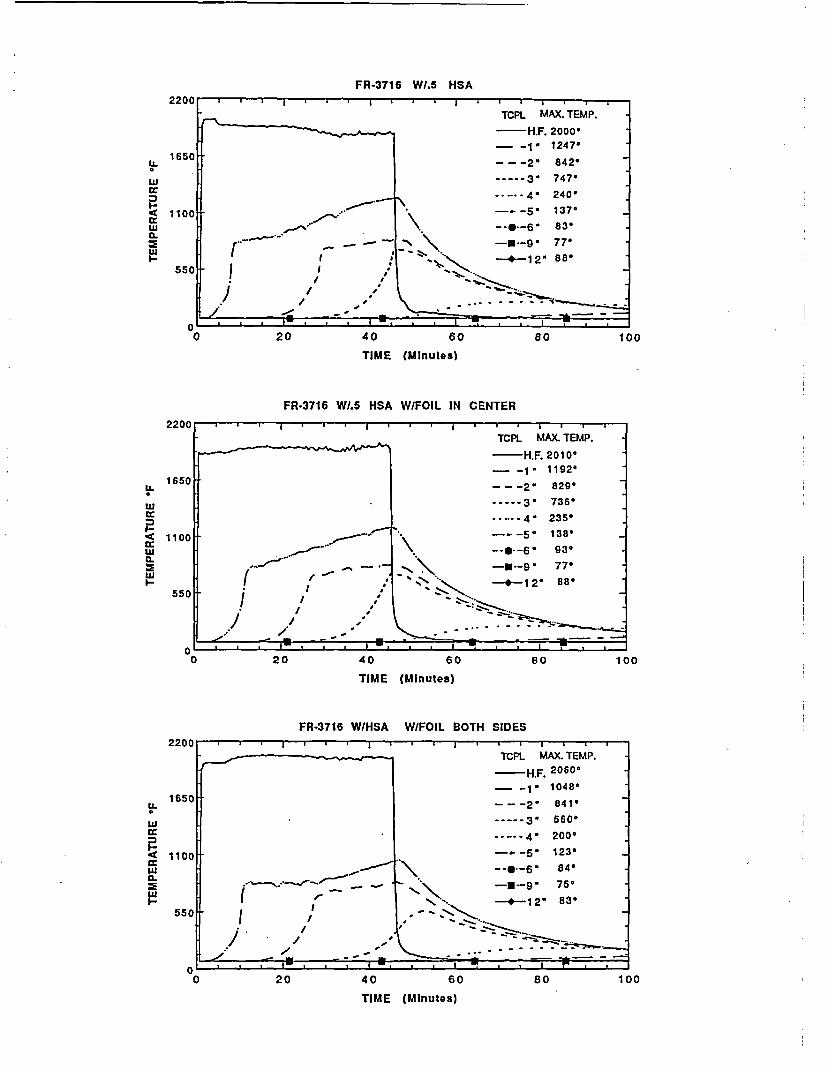
FR-3716 W/.5 HSA2200
1U-
w
1100
100
TIME (Minutes)
FR-3716 WI.5 HSA WIFOIL IN CENTER
U-
i
a-
,I
TIME (MInutes)
FR-3716 W/HSA WIFOIL BOTH SIDES
U-
wIu
40 60
TIME (Minutes)
100
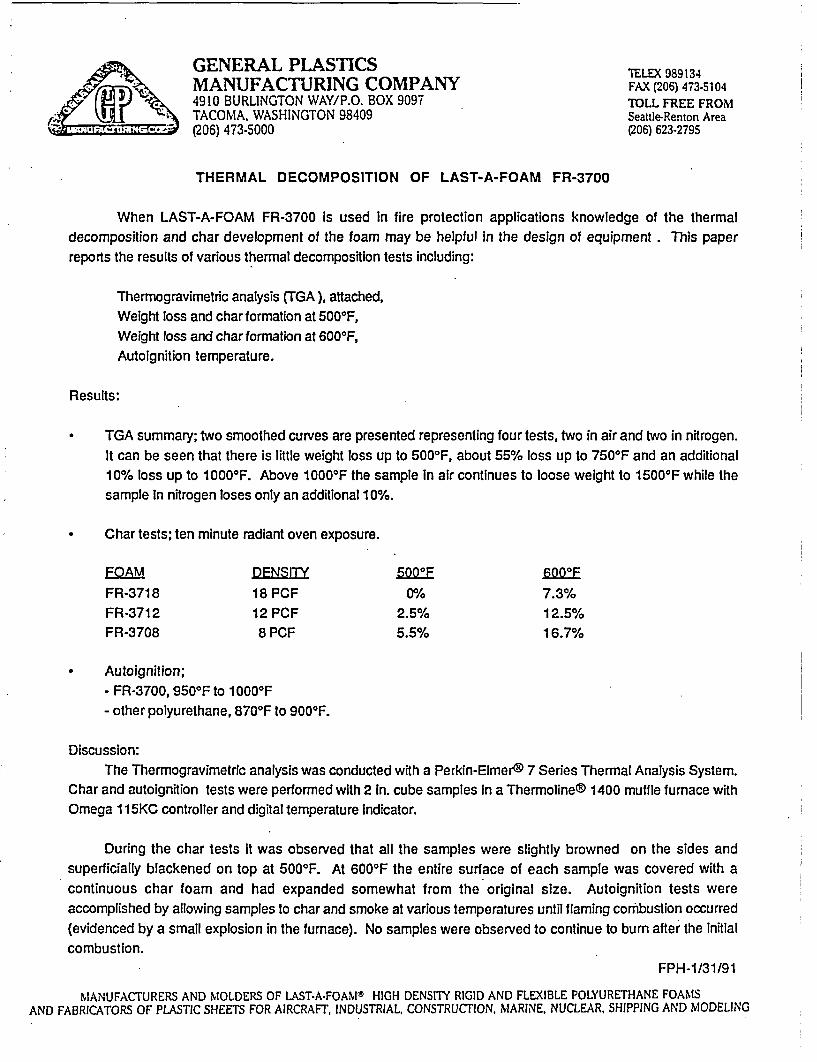
GENERAL PLASTICS TELEX989134MANUFACTURING COMPANY FAX (206)473-51044910 BURLINGTON WAY/P.O. BOX 9097 TOLL FREE FROMTACOMA, WASHINGTON 98409 Seattle-Renton Area(206) 473.5000 (206) 623-2795
THERMAL DECOMPOSITION OF LAST-A-FOAM FR-3700
When LAST-A-FOAM FR-3700 is used in fire protection applications knowledge of the thermaldecomposition and char development of the foam may be helpful in the design of equipment . This paperreports the results of various thermal decomposition tests including:
Thermogravimetric analysis (TGA), attached,Weight loss and char formation at 5000F,Weight loss and char formation at 6000F,Autoignition temperature.
Results:
* TGA summary; two smoothed curves are presented representing four tests, two in air and two in nitrogen.It can be seen that there is little weight loss up to 5000F, about 55% loss up to 7500 F and an additional10% loss up to 1000IF. Above 1000 F the sample in air continues to loose weight to 1500OF while thesample In nitrogen loses only an additional 10%.
* Char tests; ten minute radiant oven exposure.
FOAM DENSITY 500OF 600°F
FR-3718 18 PCF 00/a 7.3%FR-3712 12 PCF 2.5% 12.5%FR-3708 8 PCF 5.5% 16.7%
* Autoignition;- FR-3700, 9500F to 1 000-F- other polyurethane, 8700 F to 9000F.
Discussion:The Thermogravimetric analysis was conducted with a Perkin-Elmer® 7 Series Thermal Analysis System.
Char and autoignition tests were performed with 2 In. cube samples in a Thermoline® 1400 muffle furnace withOmega 115KC controller and digital temperature Indicator.
During the char tests it was observed that all the samples were slightly browned on the sides andsuperficially blackened on top at 5000F. At 6000F the entire surface of each sample was covered with acontinuous char foam and had expanded somewhat from the original size. Autoignition tests wereaccomplished by allowing samples to char and smoke at various temperatures until flaming combustion occurred(evidenced by a small explosion in the furnace). No samples were observed to continue to burn after the initialcombustion.
FPH-1/31/91
MANUFACTURERS AND MOLDERS OF LAST-A-FOAM't HIGH DENSITY RIGID AND FLEXIBLE POLYURETHANE FOAMSAND FABRICATORS OF PLASTIC SHEETS FOR AIRCRAFT, INDUSTRIAL, CONSTRUCTION. MARINE. NUCLEAR, SHIPPING AND MODELING
GENERAL PLASTICS MANUFACTURINC COMPANY, P 0 BOX 9097 TACOMA WA. 98409
LAST-A-FOAM FR-3700 THERMAL ANALYSIS (TGA)1 00
80
0
-a._
60
40
20
00 250 500 750 1 000 1 250 1 500
TEMPERATURE OF FPH 1/31/91
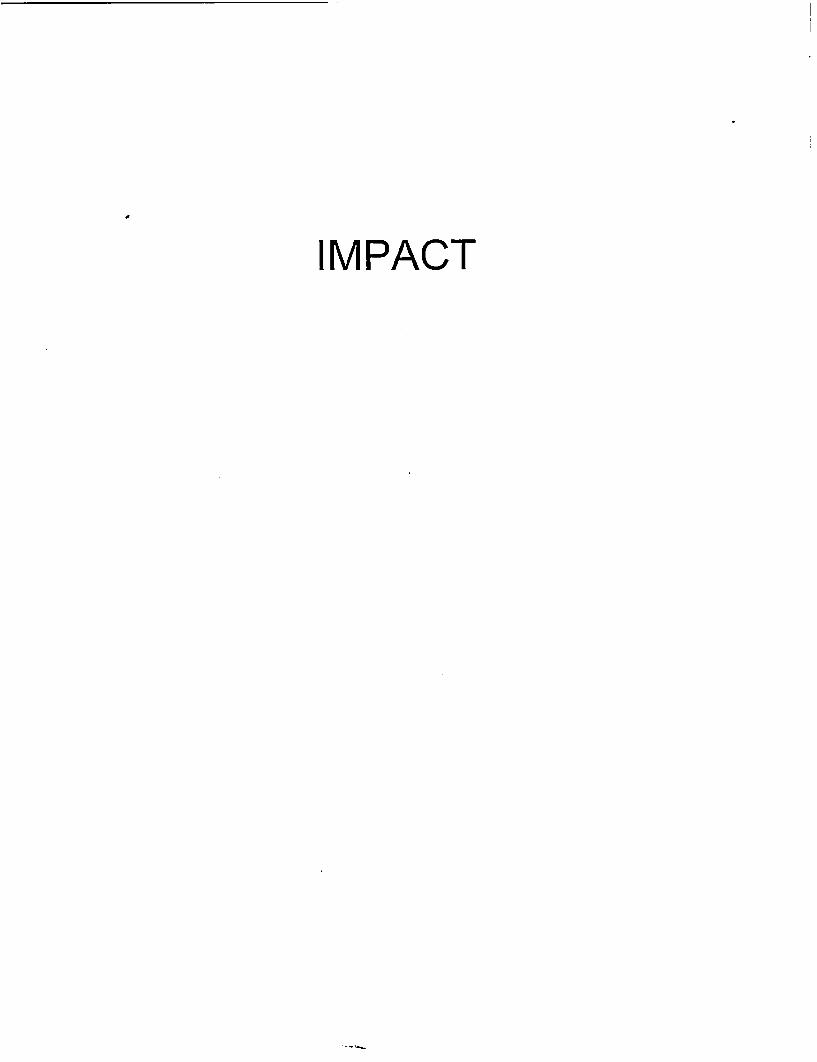
IMPACT
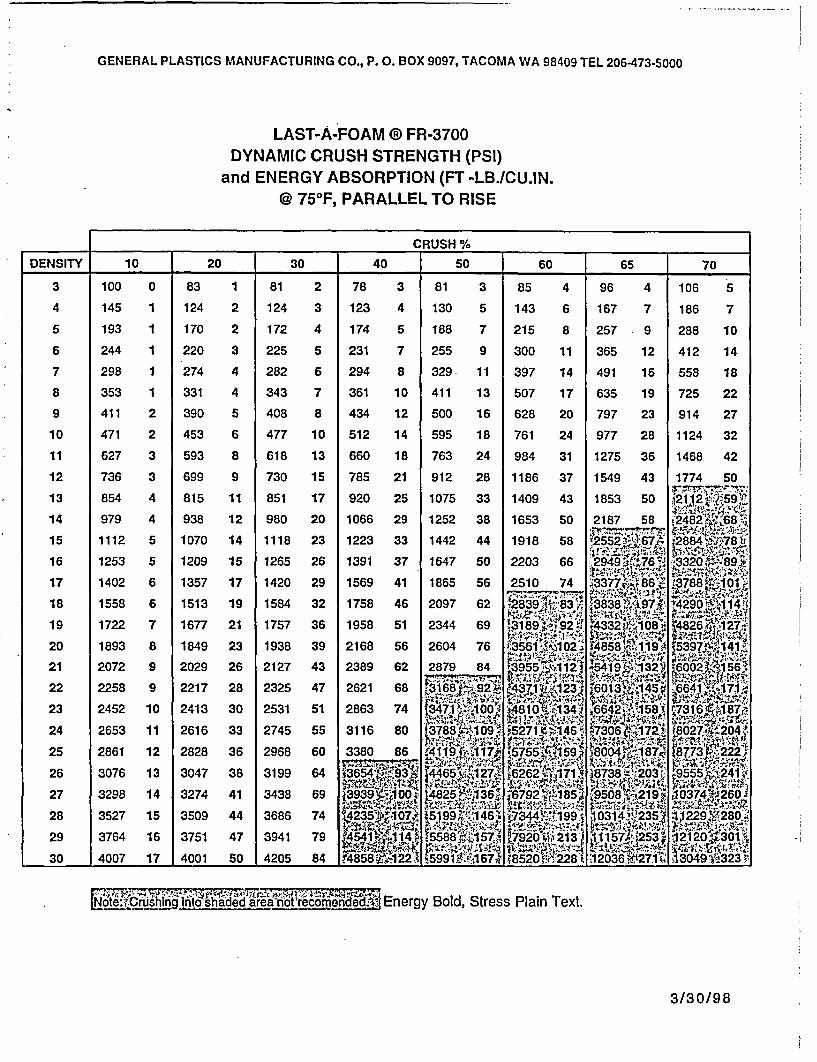
I
GENERAL PLASTICS MANUFACTURING CO., P. O. BOX 9097, TACOMA WA 98409 TEL 206-473-5000
LAST-A-FOAM ® FR-3700DYNAMIC CRUSH STRENGTH (PSI)
and ENERGY ABSORPTION (FT -LB./CU.IN.@ 750 F, PARALLEL TO RISE
CRUSH %
DENSITY 10 20 30 40 50 60 65 70
3 100 0 83 1 81 2 78 3 81 3 85 4 96 4 106 5
4 145 1 124 2 124 3 123 4 130 5 143 6 167 7 186 7
5 193 1 170 2 172 4 174 5 188 7 215 8 257 9 288 10
6 244 1 220 3 225 5 231 7 255 9 300 11 365 12 412 14
7 298 1 274 4 282 6 294 8 329 11 397 14 491 16 558 18
8 353 1 331 4 343 7 361 10 411 13 507 17 635 19 725 22
9 411 2 390 5 408 8 434 12 500 16 628 20 797 23 914 27
10 471 2 453 6 477 10 512 14 595 18 761 24 977 28 1124 32
11 627 3 593 8 618 13 660 18 763 24 984 31 1275 36 1468 42
12 736 3 699 9 730 15 785 21 912 28 1186 37 1549 43 1774 50
13 854 4 815 11 851 17 920 25 1075 33 1409 43 1853 50 W
14 979 4 938 12 980 20 1066 29 1252 38 1653 50 2187 58 '2482 8-
15 1112 5 1070 14 1118 23 1223 33 1442 44 1918 58
16 1253 5 1209 15 1265 26 1391 37 1647 50 2203 66 '2
17 1402 6 1357 17 1420 29 1569 41 1865 56 2510 74 83377s,86jg. s3788 w101
18 1558 6 1513 19 1584 32 1758 46 2097 62 I28 3 8 3 1mp&r t2e90 ^
19 1722 7 1677 21 1757 36 1958 51 2344 69 9 ; ows',2 32
20 1893 8 1849 23 1938 39 2168 56 2604 76 3561g 9102; .8J 119V 5397 141
21 2072 9 2029 26 2127 43 2389 62 2879 84 d3955:1"2 419 1356z
22 2258 9 2217 28 2325 47 2621 68 225.1 A66r7?iv
23 2452 10 2413 30 2531 51 2863 74 471 1 (1Ql ' ' .73
24 2653 11 2616 33 2745 55 3116 80 And88 109 25271 ~ 7 42 60273 04,
25 2861 12 2828 36 2968 60 3380 86 7 5758004s187d t873k222
26 3076 13 3047 38 3199 64 a3654'- 68738 527 3298 14 3274 41 3438 69 *3939f100., i95O89219 60127 398 1 00 -42b,16 6792 1̀85A ~`50 21 i
28 3527 15 3509 44 3686 74 t2229 0V :25J09m.i46t '73499''§ .2 12292J8
29 3764 16 3751 47 3941 79 4-5i1 I 2 12120;301
30 4007 17 4001 50 4205 84 85 1 59.8 1 62 3 323 ¢
to shaded aeirea6nbt1 Energy Bold, Stress Plain Text.
3/30/98
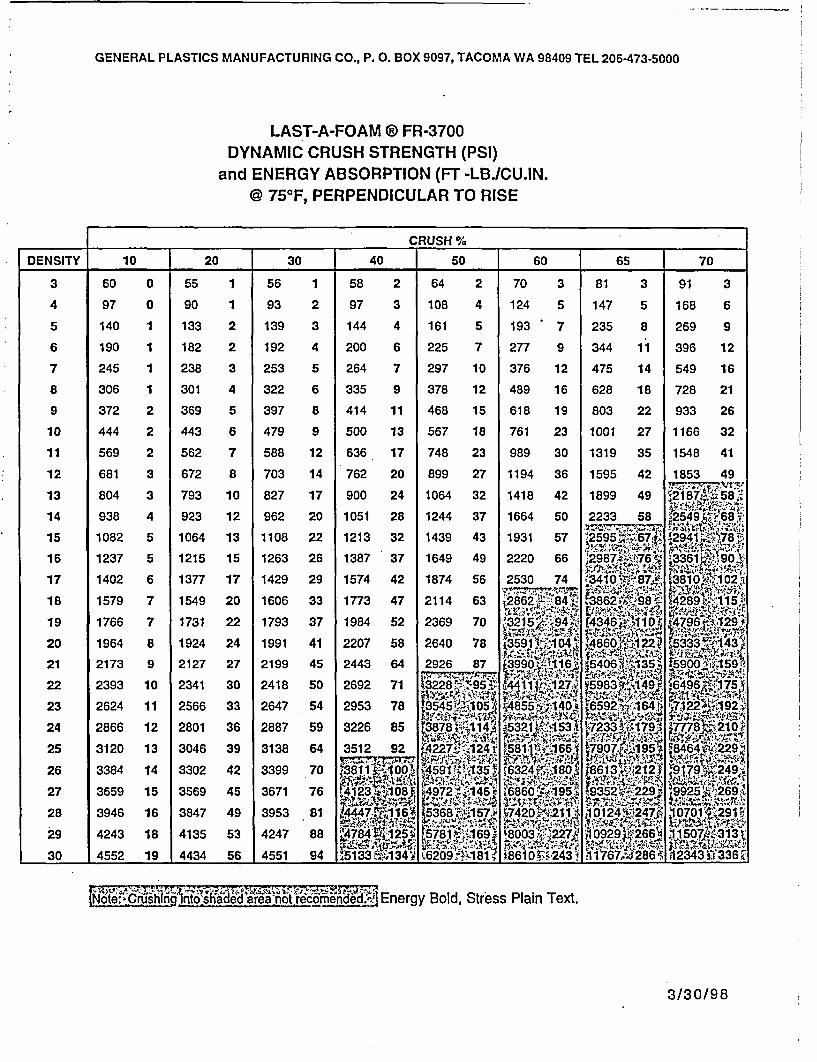
GENERAL PLASTICS MANUFACTURING CO., P. O. BOX 9097, TACOMA WA 98409 TEL 206-473-5000
LAST-A-FOAM ® FR-3700DYNAMIC CRUSH STRENGTH (PSI)
and ENERGY ABSORPTION (FT -LB./CU.IN.@ 750F, PERPENDICULAR TO RISE
CRUSH %
DENSITY 10 20 30 40 50 60 65 70
3 60 0 55 1 56 1 58 2 64 2 70 3 81 3 91 3
4 97 0 90 1 93 2 97 3 108 4 124 5 147 5 168 6
5 140 1 133 2 139 3 144 4 161 5 193 7 235 8 269 9
6 190 1 182 2 192 4 200 6 225 7 277 9 344 11 396 12
7 245 1 238 3 253 5 264 7 297 10 376 12 475 14 549 16
8 306 1 301 4 322 6 335 9 378 12 489 16 628 18 728 21
9 372 2 369 5 397 8 414 11 468 15 618 19 803 22 933 26
10 444 2 443 6 479 9 500 13 567 18 761 23 1001 27 1166 32
11 569 2 562 7 588 12 636 17 748 23 989 30 1319 35 1548 41
12 681 3 672 8 703 14 762 20 899 27 1194 36 1595 42 1853 49
13 804 3 793 10 827 17 900 24 1064 32 1418 42 1899 49 12187i~58i58
14 938 4 923 12 962 20 1051 28 1244 37 1664 50 2233 58 42549 ?68f
15 1082 5 1064 13 1108 22 1213 32 1439 43 1931 57 55,2,6 -29C41WA7-'
16 1237 5 1215 15 1263 26 1387 37 1649 49 2220 66
17 1402 6 1377 17 1429 29 1574 42 1874 56 2530 74 :34iOmB74 38lO 102-i
18 1579 7 1549 20 1606 33 1773 47 2114 63 .,428629 15
19 1766 7 1731 22 1793 37 1984 52 2369 70 (3215 ' 9 43;4r t4Z9.6 129
20 1964 8 1924 24 1991 41 2207 58 2640 78 %359104' '860t1224
21 2173 9 2127 27 2199 45 2443 64 2926 87 9O lj4 { 35 r590021 59
22 2393 10 2341 30 2418 50 2692 71 k3228 rt '95k '44111pA127i 5983 i~ 9,6 7523 2624 11 2566 33 2647 54 2953 78 0 545105 '85 52140
24 2866 12 2801 36 2887 59 3226 85 3B78 * g1l1A 73Q, 32
25 3120 13 3046 39 3138 64 3512 92 t4227.- 124 t5 11E-Ž66 f 90 8
26 3384 14 3302 42 3399 70 811 K
27 3659 15 3569 45 3671 76 74123 W108 972 .146 6860 195; .9352i229 9925F26
28 3946 16 3847 49 3953 81 MAW420 11 01 7 0701-291
29 4243 18 4135 53 4247 88 .4784 .' 125o §,5781 169, '8O03 '227t 66 ti507j313
30 4552 19 4434 56 4551 94 .5133Li1344 i6209 T'-181 T8610 .243!i1767g2864 12343';'336,
IIii
I
j
II
I
i
I
EO rI a dreanot recEnergy Bold, Stress Plain Text.
3/30/98
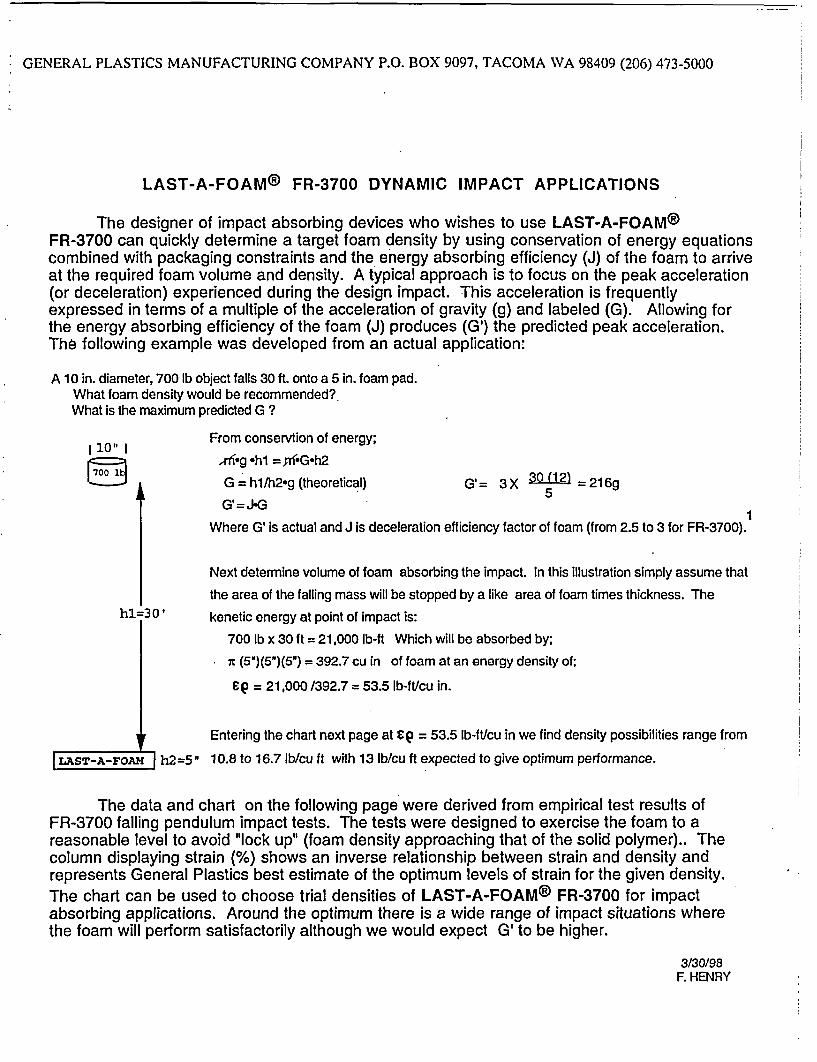
GENERAL PLASTICS MANUFACTURING COMPANY P.O. BOX 9097, TACOMA WA 98409 (206) 473-5000
LAST-A-FOAM® FR-3700 DYNAMIC IMPACT APPLICATIONS
The designer of impact absorbing devices who wishes to use LAST-A-FOAM®FR-3700 can quickly determine a target foam density by using conservation of energy equationscombined with packaging constraints and the energy absorbing efficiency (J) of the foam to arriveat the required foam volume and density. A typical approach is to focus on the peak acceleration(or deceleration) experienced during the design impact. This acceleration is frequentlyexpressed in terms of a multiple of the acceleration of gravity (g) and labeled (G). Allowing forthe energy absorbing efficiency of the foam (J) produces (G') the predicted peak acceleration.The following example was developed from an actual application:
A 10 in. diameter, 700 lb object falls 30 ft. onto a 5 in. foam pad.What foam density would be recommended?.What is the maximum predicted G ?
I 10"1 IFrom conservtion of energy;qrX g *hl = pifG*h2G = hl/h2.g (theoretical) G'= 3X 30(12) 216g
5G'=J-G
Where G' is actual and J is deceleration efficiency factor of foam (from 2.5 to 3 for FR-3700).
Next determine volume of foam absorbing the impact. In this illustration simply assume thatthe area of the falling mass will be stopped by a like area of foam times thickness. The
h1=30' kenetic energy at point of impact is:
700 lb x 30 ft = 21,000 lb-ft Which will be absorbed by;t (5')(5')(5N) = 392.7 cu in of foam at an energy density of;
C Q = 21,000 /392.7 = 53.5 lb-ft/cu in.
Entering the chart next page at E = 53.5 lb-ft/cu in we find density possibilities range from
|LAST-A-FOA h2=5" 10.8 to 16.7 lb/cu ft with 13 lb/cu ft expected to give optimum performance.
The data and chart on the following page were derived from empirical test results ofFR-3700 falling pendulum impact tests. The tests were designed to exercise the foam to areasonable level to avoid "lock up" (foam density approaching that of the solid polymer).. Thecolumn displaying strain (%) shows an inverse relationship between strain and density andrepresents General Plastics best estimate of the optimum levels of strain for the given density.The chart can be used to choose trial densities of LAST-A-FOAM® FR-3700 for impactabsorbing applications. Around the optimum there is a wide range of impact situations wherethe foam will perform satisfactorily although we would expect G' to be higher.
3/30/98F. HENRY
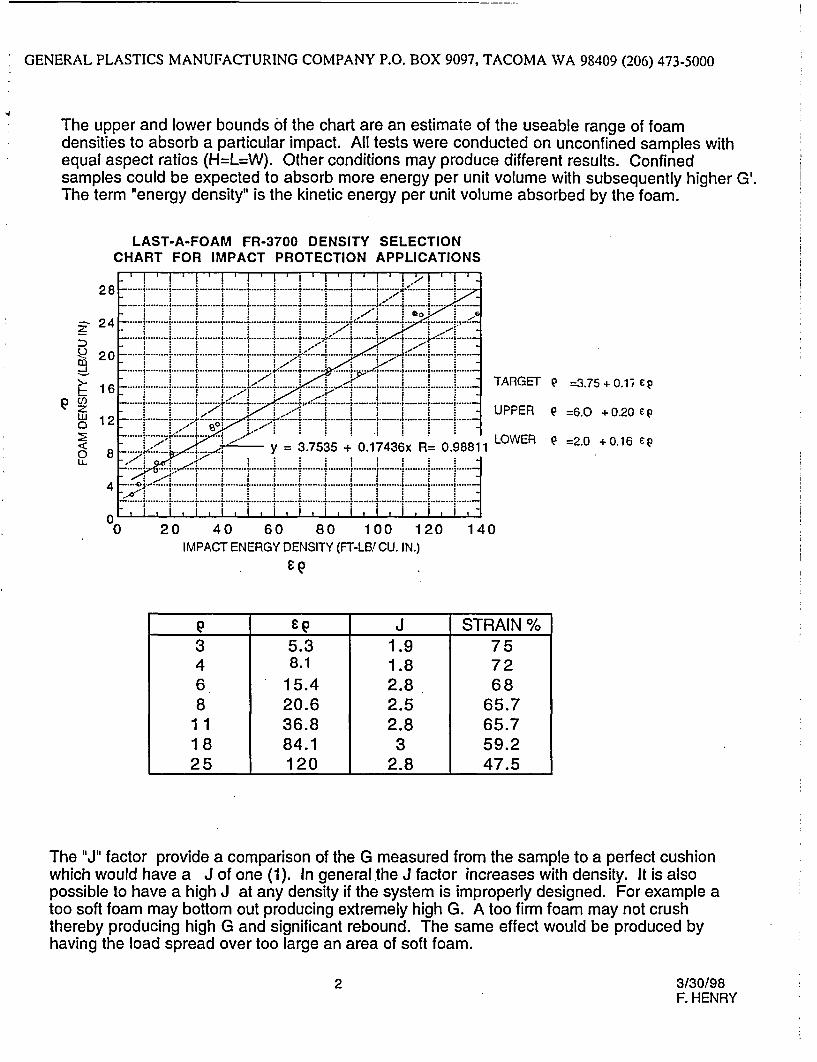
GENERAL PLASTICS MANUFACTURING COMPANY P.O. BOX 9097, TACOMA WA 98409 (206) 473-5000
The upper and lower bounds of the chart are an estimate of the useable range of foamdensities to absorb a particular impact. All tests were conducted on unconfined samples withequal aspect ratios (H=L=W). Other conditions may produce different results. Confinedsamples could be expected to absorb more energy per unit volume with subsequently higher G'.The term "energy density" is the kinetic energy per unit volume absorbed by the foam.
LAST-A-FOAM FR-3700 DENSITY SELECTIONCHART FOR IMPACT PROTECTION APPLICATIONS
282 4 .... ........... .... .... .. ..... . ..... .. ... ... . .. .. ... ....
.......... .......
- . .- ........ TARGET =3.75 .1L i.l6il- :,- . /i:
- * UPPER P =6.0 +0.20 gP12 - ..... . ... . . *--
:E -. 7 = 7.r n 7A2- R- A noIAI LOWER P =2.0 +0.16 eP28
40 60 80 100 120 140IMPACT ENERGY DENSITY (FT-LB! CU. IN.)
SQ
P epJ STRAIN %3 5.3 1.9 754 8.1 1.8 726 15.4 2.8 688 20.6 2.5 65.7
11 36.8 2.8 65.718 84.1 3 59.225 120 2.8 47.5
The "J" factor provide a comparison of the G measured from the sample to a perfect cushionwhich would have a J of one (1). In general the J factor increases with density. It is alsopossible to have a high J at any density if the system is improperly designed. For example atoo soft foam may bottom out producing extremely high G. A too firm foam may not crushthereby producing high G and significant rebound. The same effect would be produced byhaving the load spread over too large an area of soft foam.
2 3/30/98F. HENRY
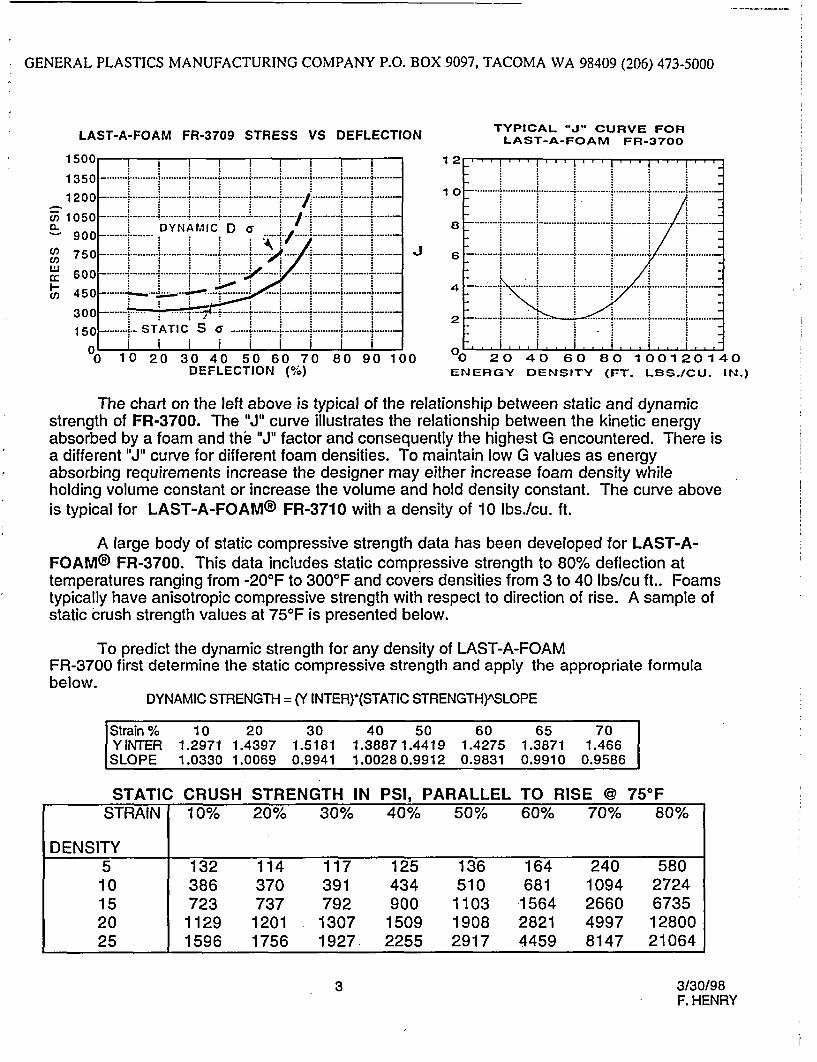
GENERAL PLASTICS MANUFACTURING COMPANY P.O. BOX 9097, TACOMA WA 98409 (206) 473-5000
LAST-A-FOAM FR-3709 STRESS VS DEFLECTION TYPICAL "J" CURVE FORLAST-A-FOAM FR-3700
A.......... . ...or
(-
U,
e-Cl:
1 0
8
- . . .. !' ! !
- lii 1,/_
J 6
4
2
...... ........ ....... 4 ......... ..........
- ..... . .......................... .............
_..........'.............. . ...... .........1 50[.
08, a I10 20 30 40 50 60 70 80 90 100
DEFLECTION (%)'sO 20 40 60 80 100120140ENERGY DENSITY (FT. LBS./CU. IN.)
The chart on the left above is typical of the relationship between static and dynamicstrength of FR-3700. The "J" curve illustrates the relationship between the kinetic energyabsorbed by a foam and the "J" factor and consequently the highest G encountered. There isa different "J" curve for different foam densities. To maintain low G values as energyabsorbing requirements increase the designer may either increase foam density whileholding volume constant or increase the volume and hold density constant. The curve aboveis typical for LAST-A-FOAM® FR-3710 with a density of 10 lbs./cu. ft.
A large body of static compressive strength data has been developed for LAST-A-FOAM® FR-3700. This data includes static compressive strength to 80% deflection attemperatures ranging from -20 0F to 3000F and covers densities from 3 to 40 lbs/cu ft.. Foamstypically have anisotropic compressive strength with respect to direction of rise. A sample ofstatic crush strength values at 751F is presented below.
To predict the dynamic strength for any density of LAST-A-FOAMFR-3700 first determine the static compressive strength and apply the appropriate formulabelow.
DYNAMIC STRENGTH = (Y INTER)*(STATIC STRENGTH)ASLOPE
Strain % 10 20 30 40 50 60 65 70YINTER 1.2971 1.4397 1.5181 1.38871.4419 1.4275 1.3871 1.466SLOPE 1.0330 1.0069 0.9941 1.00280.9912 0.9831 0.9910 0.9586
STATIC CRUSH STRENGTH IN PSI, PARALLEL TO RISE @ 750FSTRAIN 10% 20% 30% 40% 50% 60% 70% 80%
DENSITY5 132 114 117 125 136 164 240 58010 386 370 391 434 510 681 1094 272415 723 737 792 900 1103 1564 2660 673520 1129 1201 1307 1509 1908 2821 4997 1280025 1596 1756 1927. 2255 2917 4459 8147 21064
3 3/30/98F. HENRY
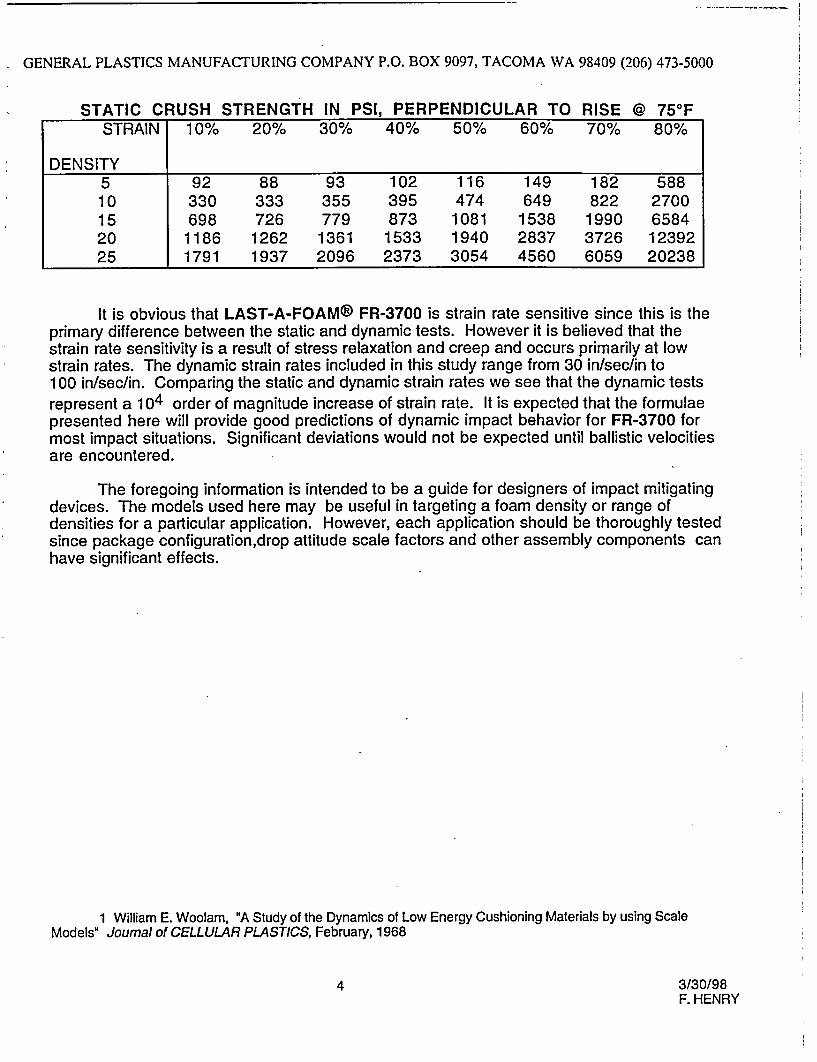
GENERAL PLASTICS MANUFACTURING COMPANY P.O. BOX 9097, TACOMA WA 98409 (206) 473-5000
STATIC CRUSH STRENGTH IN PSI, PERPENDICULAR TO RISE @ 750FSTRAIN 10% 20% 30% 40% 50% 60% 70% 80%
DENSITY5 92 88 93 102 116 149 182 58810 330 333 355 395 474 649 822 270015 698 726 779 873 1081 1538 1990 658420 1186 1262 1361 1533 1940 2837 3726 1239225 1791 1937 2096 2373 3054 4560 6059 20238
It is obvious that LAST-A-FOAM® FR-3700 is strain rate sensitive since this is theprimary difference between the static and dynamic tests. However it is believed that thestrain rate sensitivity is a result of stress relaxation and creep and occurs primarily at lowstrain rates. The dynamic strain rates included in this study range from 30 in/sec/in to100 in/sec/in. Comparing the static and dynamic strain rates we see that the dynamic testsrepresent a 104 order of magnitude increase of strain rate. It is expected that the formulaepresented here will provide good predictions of dynamic impact behavior for FR-3700 formost impact situations. Significant deviations would not be expected until ballistic velocitiesare encountered.
The foregoing information is intended to be a guide for designers of impact mitigatingdevices. The models used here may be useful in targeting a foam density or range ofdensities for a particular application. However, each application should be thoroughly testedsince package configuration,drop attitude scale factors and other assembly components canhave significant effects.
1 William E. Woolam, "A Study of the Dynamics of Low Energy Cushioning Materials by using ScaleModels" Journal of CELLULAR PLASTICS, February, 1968
4 3/30/98F. HENRY
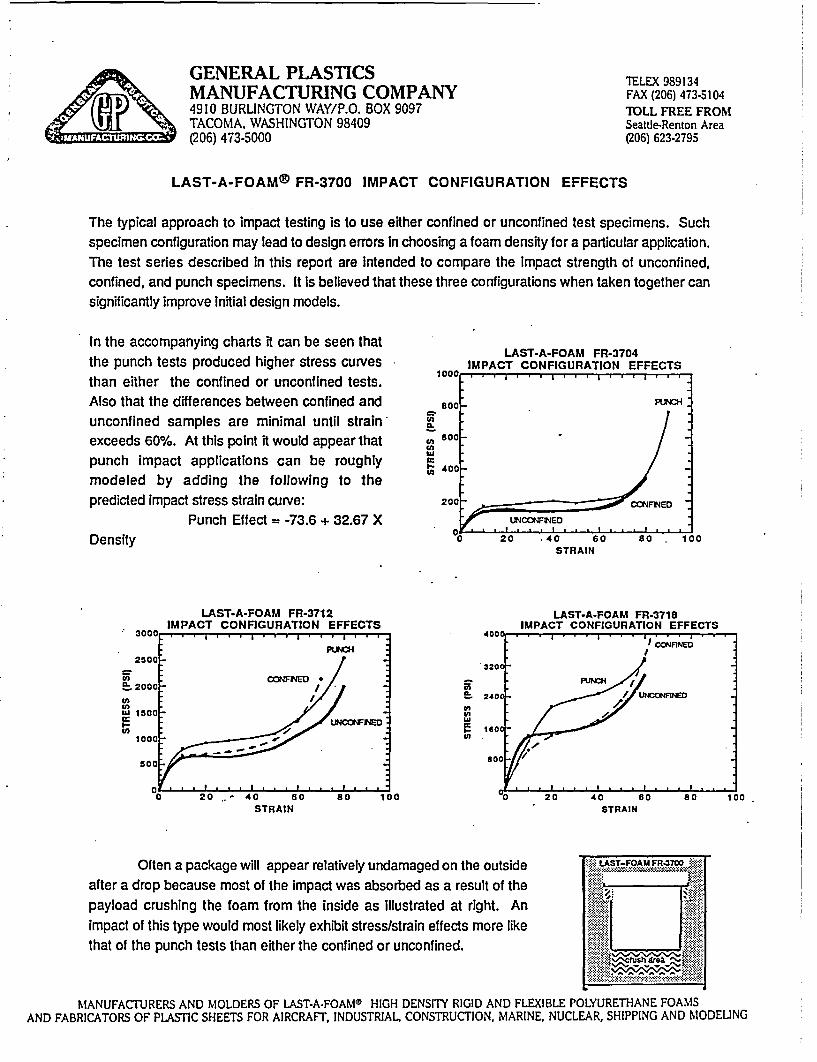
I
I y 1,11 I i 1-1.1 II I-.=,
GENERAL PLASTICSMANUFACTURING COMPANY4910 BURLINGTON WAY/P.O. BOX 9097TACOMA, WASHINGTON 98409(206) 473-5000
TELEX 989134FAX (206) 473-5104TOLL FREE FROMSeattle-Renton Area(206) 623-2795
LAST-A-FOAM® FR-3700 IMPACT CONFIGURATION EFFECTS
The typical approach to impact testing is to use either confined or unconfined test specimens. Suchspecimen configuration may lead to design errors in choosing a foam density for a particular application.The test series described in this report are Intended to compare the impact strength of unconfined,confined, and punch specimens. It is believed that these three configurations when taken together cansignificantly improve Initial design models.
In the accompanying charts it can be seen thatthe punch tests produced higher stress curvesthan either the confined or unconfined tests.Also that the differences between confined andunconfined samples are minimal until strainexceeds 60%. At this point it would appear thatpunch Impact applications can be roughlymodeled by adding the following to thepredicted impact stress strain curve:
Punch Effect = -73.6 + 32.67 XDensity
LAST-A-FOAM FR-3704IMPACT CONFIGURATION EFFECTS
C-Ine.
cIIn
I-to
'o
STRAIN
LAST-A-FOAM FR-3712IMPACT CONFIGURATION EFFECTS
LAST-A.FOAM FR-3718IMPACT CONFIGURATION EFFECTS
InE. 20Cc
W 150CenFE IOIn0I
I-V)
10
STRAIN STRAIN
Often a package will appear relatively undamaged on the outside RI
after a drop because most of the Impact was absorbed as a result of thepayload crushing the foam from the inside as Illustrated at right. Animpact of this type would most likely exhibit stress/strain effects more likethat of the punch tests than either the confined or unconfined.
MANUFACTURERS AND MOLDERS OF LAST-A-FOAM® HIGH DENSITY RIGID AND FLEXIBLE POLYURETHANE FOAMSAND FABRICATORS OF PLASTIC SHEETS FOR AIRCRAFT, INDUSTRIAL CONSTRUCTION, MARINE, NUCLEAR, SHIPPING AND MODELING
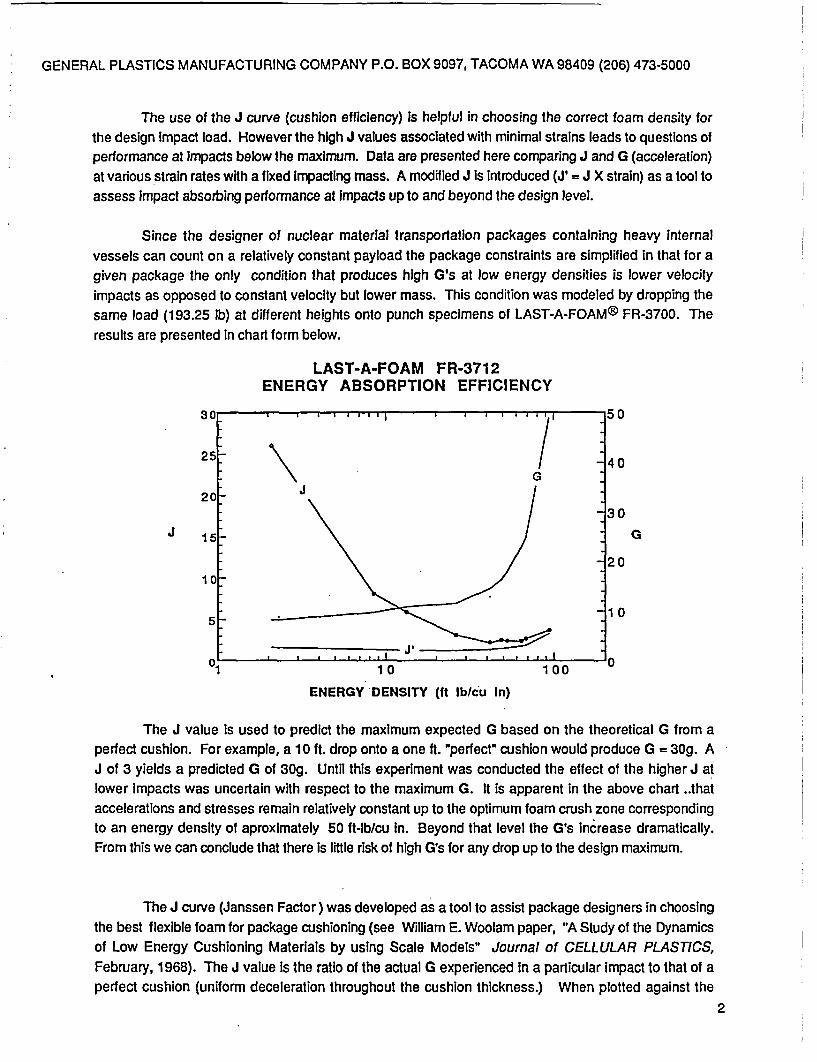
GENERAL PLASTICS MANUFACTURING COMPANY P.O. BOX 9097, TACOMA WA 98409 (206) 473-5000
The use of the J curve (cushion efficiency) is helpful in choosing the correct foam density forthe design Impact load. However the high J values associated with minimal strains leads to questions ofperformance at Impacts below the maximum. Data are presented here comparing J and G (acceleration)at various strain rates with a fixed Impacting mass. A modified J Is introduced (J' = J X strain) as a tool toassess impact absorbing performance at Impacts up to and beyond the design level.
Since the designer of nuclear material transportation packages containing heavy internalvessels can count on a relatively constant payload the package constraints are simplified in that for agiven package the only condition that produces high G's at low energy densities is lower velocityimpacts as opposed to constant velocity but lower mass. This condition was modeled by dropping thesame load (193.25 lb) at different heights onto punch specimens of LAST-A-FOAM® FR-3700. Theresults are presented in chart form below.
LAST-A-FOAM FR-371 2ENERGY ABSORPTION EFFICIENCY
25 / 40G
20C3 0
15- G
20
10
0 10 100
ENERGY DENSITY (ft lb/cu In)
The J value is used to predict the maximum expected G based on the theoretical G from aperfect cushion. For example, a 10 ft. drop onto a one ft. "perfect' cushion would produce G = 30g. AJ of 3 yields a predicted G of 30g. Until this experiment was conducted the effect of the higher J atlower impacts was uncertain with respect to the maximum G. It is apparent in the above chart ..thataccelerations and stresses remain relatively constant up to the optimum foam crush zone correspondingto an energy density of aproximately 50 ft-lb/cu in. Beyond that level the G's increase dramatically.From this we can conclude that there is little risk of high G's for any drop up to the design maximum.
The J curve (Janssen Factor) was developed as a tool to assist package designers in choosingthe best flexible foam for package cushioning (see William E. Woolam paper, "A Study of the Dynamicsof Low Energy Cushioning Materials by using Scale Models" Journal of CELLULAR PLASTICS,February, 1968). The J value Is the ratio of the actual G experienced in a particular impact to that of aperfect cushion (uniform deceleration throughout the cushion thickness.) When plotted against the
2
GENERAL PLASTICS MANUFACTURING COMPANY P.O. BOX 9097, TACOMA WA 98409 (206) 473-5000
energy density of a foam the J forms a U shaped curve. If a package Is to protect both light and heavyobjects from shock then cushion efficiency over a wide range is Important, i.e a flat J curve is desirable.Soft, flexible foams have much flatter J curves than do rigid foams. On the other hand rigid foams tendto exhibit lower J values in the optimum range and have much less rebound. For these reasons rigidfoams are preferred over flexible when protection from a one time catastrophic impact is desired. The J'term introduced here expresses the foam's energy absorbing efficiency through the actual crushdistance. The flat J' curve is indicative of the effectiveness of LAST-A-FOAM FR-3700 as a shockabsorber from low level Impacts up to the design maximum In a properly designed application.
All tests were performed on General Plastic's falling pendulum impact test equipment. Adescription of the test setup and procedures Is appended. Pendulum weight was held constant at193.25 lbs. Test specimens were 1.5"X1.5"XI.5" cubes with the punch tests accomplished bymounting a 1.5" square aluminum block on the front of the pendulum and Impacting 6"X6"X1.5"specimens. Confined specimens were mounted in a 2"X2" tube which was shimmed for a snug fit. Thespecimen and tube was mounted over the 1.5" X1.5" block and held in place with 2" wide masking tape.
3
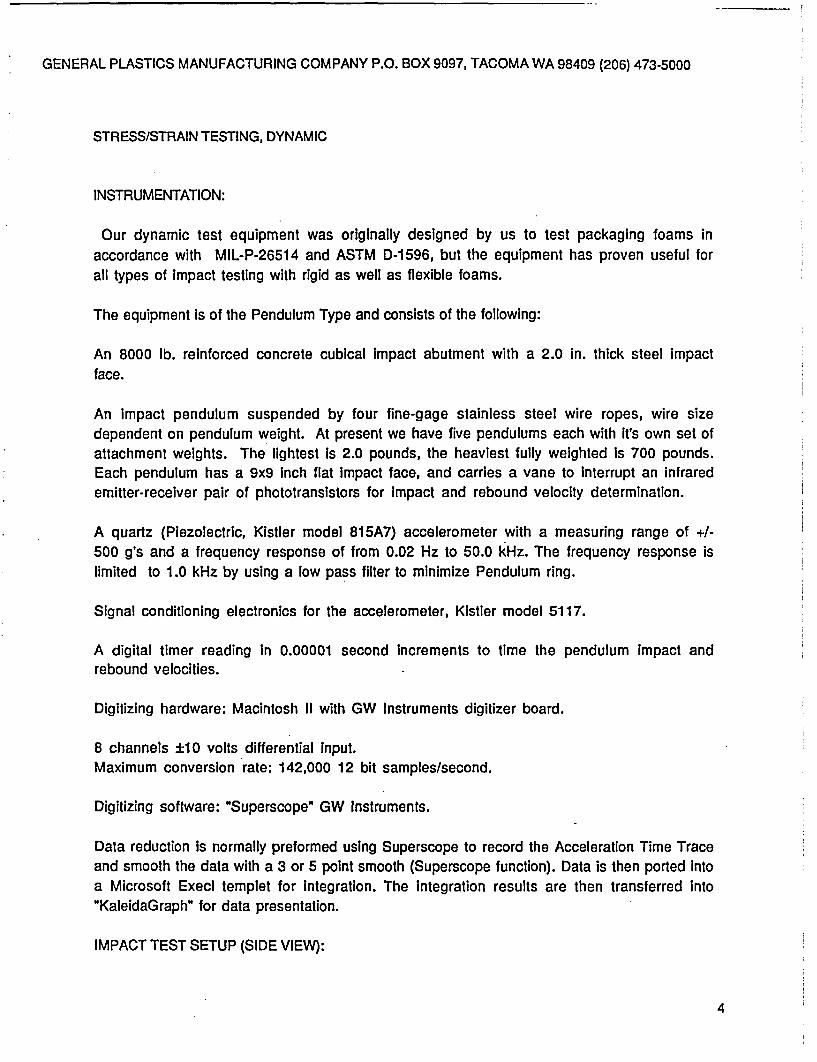
GENERAL PLASTICS MANUFACTURING COMPANY P.O. BOX 9097, TACOMA WA 98409 (206) 473-5000
STRESS/STRAIN TESTING, DYNAMIC
INSTRUMENTATION:
Our dynamic test equipment was originally designed by us to test packaging foams inaccordance with MIL-P-26514 and ASTM D-1596, but the equipment has proven useful forall types of impact testing with rigid as well as flexible foams.
The equipment Is of the Pendulum Type and consists of the following:
An 8000 lb. reinforced concrete cubical Impact abutment with a 2.0 in. thick steel impactface.
An impact pendulum suspended by four fine-gage stainless steel wire ropes, wire sizedependent on pendulum weight. At present we have five pendulums each with it's own set ofattachment weights. The lightest Is 2.0 pounds, the heaviest fully weighted is 700 pounds.Each pendulum has a 9x9 Inch flat Impact face, and carries a vane to interrupt an infraredemitter-receiver pair of phototransistors for impact and rebound velocity determination.
A quartz (Piezolectric, Kistler model 815A7) accelerometer with a measuring range of +1-500 g's and a frequency response of from 0.02 Hz to 50.0 kHz. The frequency response islimited to 1.0 kHz by using a low pass filter to minimize Pendulum ring.
Signal conditioning electronics for the accelerometer, Kistler model 5117.
A digital timer reading in 0.00001 second Increments to time the pendulum impact andrebound velocities.
Digitizing hardware: Macintosh II with GW Instruments digitizer board.
8 channels ±10 volts differential input.Maximum conversion rate: 142,000 12 bit samples/second.
Digitizing software: "Superscope" GW Instruments.
Data reduction is normally preformed using Superscope to record the Acceleration Time Traceand smooth the data with a 3 or 5 point smooth (Superscope function). Data is then ported intoa Microsoft Execl templet for integration. The integration results are then transferred into"KaleidaGraph" for data presentation.
IMPACT TEST SETUP (SIDE VIEW):
4
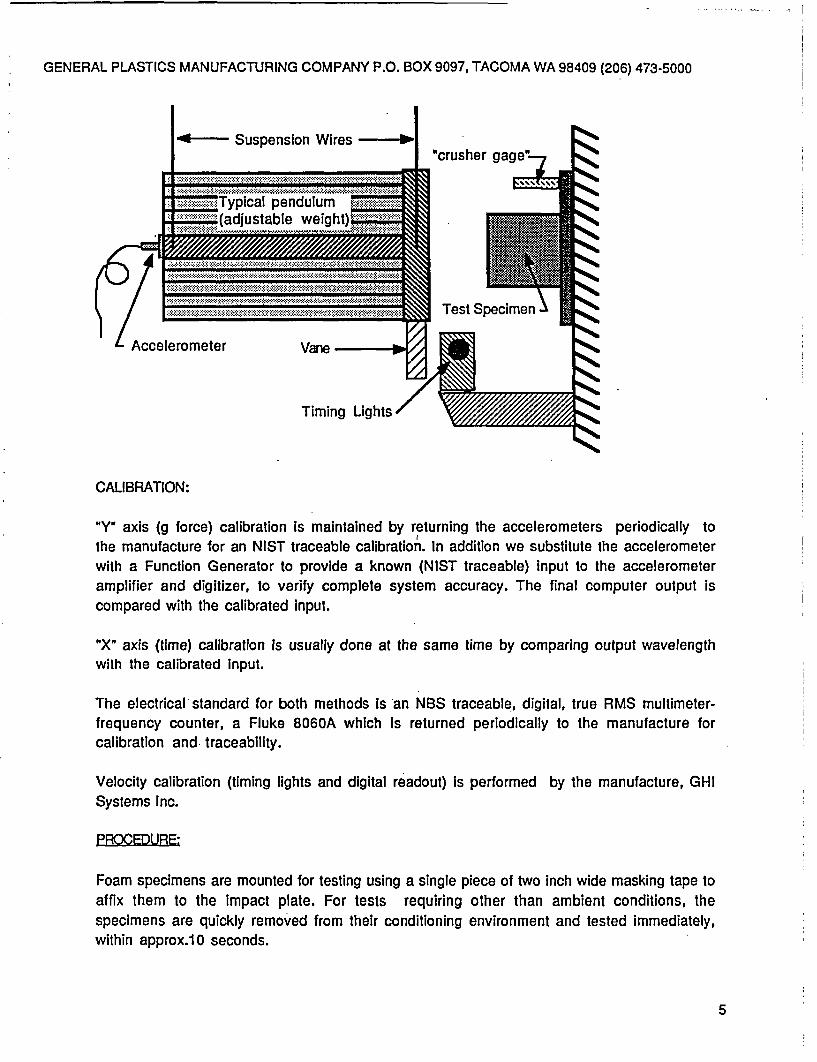
GENERAL PLASTICS MANUFACTURING COMPANY P.O. BOX 9097, TACOMA WA 98409 (206) 473-5000
CALIBRATION:
HYW axis (g force) calibration is maintained by returning the accelerometers periodically tothe manufacture for an NIST traceable calibration. In addition we substitute the accelerometerwith a Function Generator to provide a known (NIST traceable) input to the accelerometeramplifier and digitizer, to verify complete system accuracy. The final computer output iscompared with the calibrated Input.
"X" axis (time) calibration is usually done at the same time by comparing output wavelengthwith the calibrated Input.
The electrical standard for both methods Is an NBS traceable, digital, true RMS multimeter-frequency counter, a Fluke 8060A which Is returned periodically to the manufacture forcalibration and. traceability.
Velocity calibration (timing lights and digital readout) Is performed by the manufacture, GHISystems Inc.
PROCEDURE:
Foam specimens are mounted for testing using a single piece of two inch wide masking tape toaffix them to the Impact plate. For tests requiring other than ambient conditions, thespecimens are quickly removed from their conditioning environment and tested immediately,within approx.10 seconds.
5
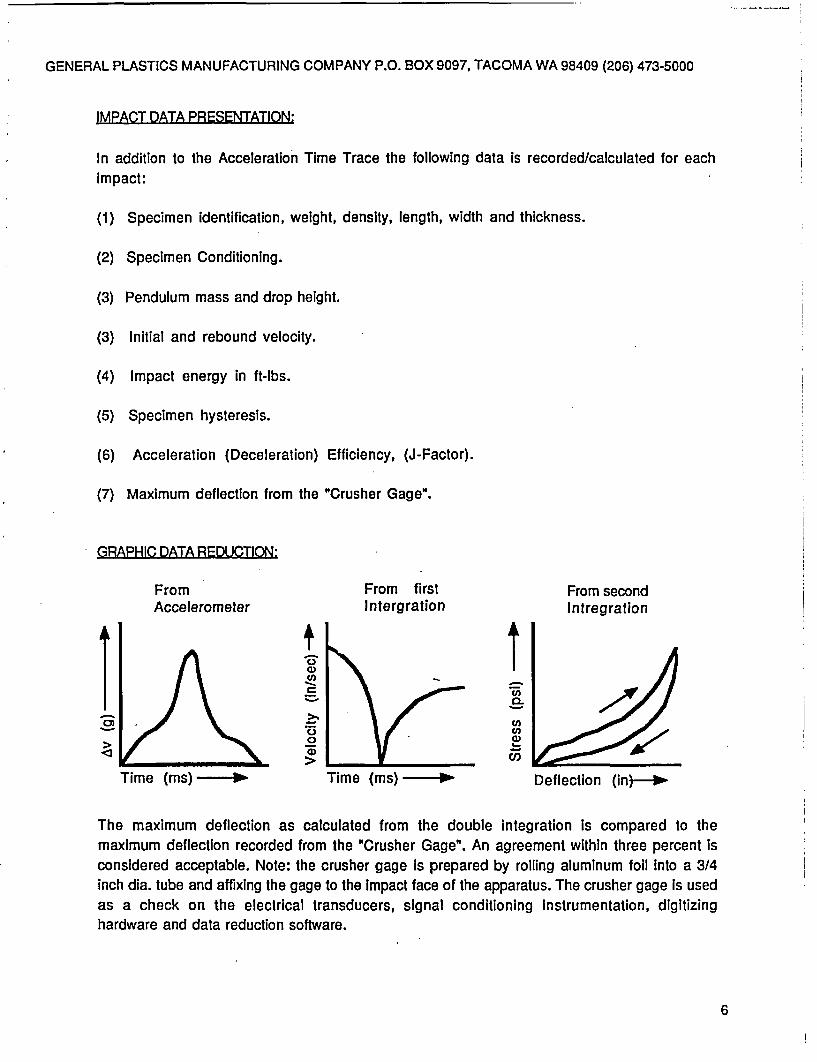
i
i
GENERAL PLASTICS MANUFACTURING COMPANY P.O. BOX 9097, TACOMA WA 98409 (206) 473-5000
IMPACT DATA PRESENTATION:
In addition to the Acceleration Time Trace the following data is recorded/calculated for eachimpact:
(1) Specimen identification, weight, density, length, width and thickness.
(2) Specimen Conditioning.
(3) Pendulum mass and drop height.
(3) Initial and rebound velocity.
(4) Impact energy in ft-lbs.
(5) Specimen hysteresis.
(6) Acceleration (Deceleration) Efficiency, (J-Factor).
(7) Maximum deflection from the "Crusher Gage".
GRAPHIC DATA REDUCTION:
FromAccelerometer
From firstIntergration
From secondIntregration
t I0a)
--
._
(0
0,
._
C-
(0I=co
Time (ms) -o Time (ms) - 4 Deflection (in)-*
The maximum deflection as calculated from the double integration is compared to themaximum deflection recorded from the "Crusher Gage". An agreement within three percent isconsidered acceptable. Note: the crusher gage is prepared by rolling aluminum foil into a 3/4inch dia. tube and affixing the gage to the Impact face of the apparatus. The crusher gage is usedas a check on the electrical transducers, signal conditioning instrumentation, digitizinghardware and data reduction software.
6

CRUSH STRENGTH
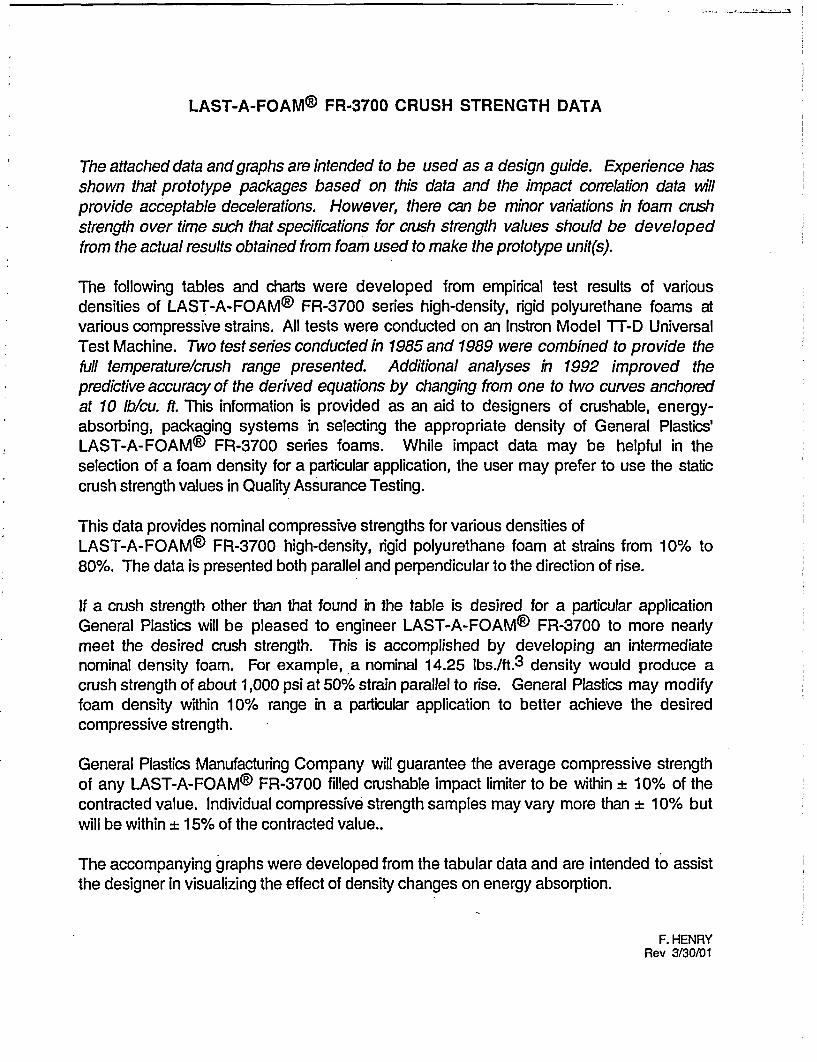
LAST-A-FOAM{ FR-3700 CRUSH STRENGTH DATA
The attached data and graphs are intended to be used as a design guide. Experience hasshown that prototype packages based on this data and the impact correlation data willprovide acceptable decelerations. However, there can be minor variations in foam caishstrength over time such that specifications for cnish strength values should be developedfrom the actual results obtained from foam used to make the prototype unit(s).
The following tables and charts were developed from empirical test results of variousdensities of LAST-A-FOAMO FR-3700 series high-density, rigid polyurethane foams atvarious compressive strains. All tests were conducted on an Instron Model TT-D UniversalTest Machine. Two test series conducted in 1985 and 1989 were combined to provide thefull temperature/crush range presented. Additional analyses in 1992 improved thepredictive accuracy of the derived equations by changing from one to two curves anchoredat 10 lb/cu. ft. This information is provided as an aid to designers of crushable, energy-absorbing, packaging systems in selecting the appropriate density of General Plastics'LAST-A-FOAMO FR-3700 series foams. While impact data may be helpful in theselection of a foam density for a particular application, the user may prefer to use the staticcrush strength values in Quality Assurance Testing.
This data provides nominal compressive strengths for various densities ofLAST-A-FOAM{ FR-3700 high-density, rigid polyurethane foam at strains from 10% to80%. The data is presented both parallel and perpendicular to the direction of rise.
If a crush strength other than that found in the table is desired for a particular applicationGeneral Plastics will be pleased to engineer LAST-A-FOAM©) FR-3700 to more nearlymeet the desired crush strength. This is accomplished by developing an intermediatenominal density foam. For example, a nominal 14.25 lbs./ft.3 density would produce acrush strength of about 1,000 psi at 50% strain parallel to rise. General Plastics may modifyfoam density within 10% range in a particular application to better achieve the desiredcompressive strength.
General Plastics Manufacturing Company will guarantee the average compressive strengthof any LAST-A-FOAM% FR-3700 filled crushable impact limiter to be within ± 10% of thecontracted value. Individual compressive strength samples may vary more than ± 10% butwill be within ± 15% of the contracted value..
The accompanying graphs were developed from the tabular data and are intended to assistthe designer in visualizing the effect of density changes on energy absorption.
F. HENRYRev 3/30/01
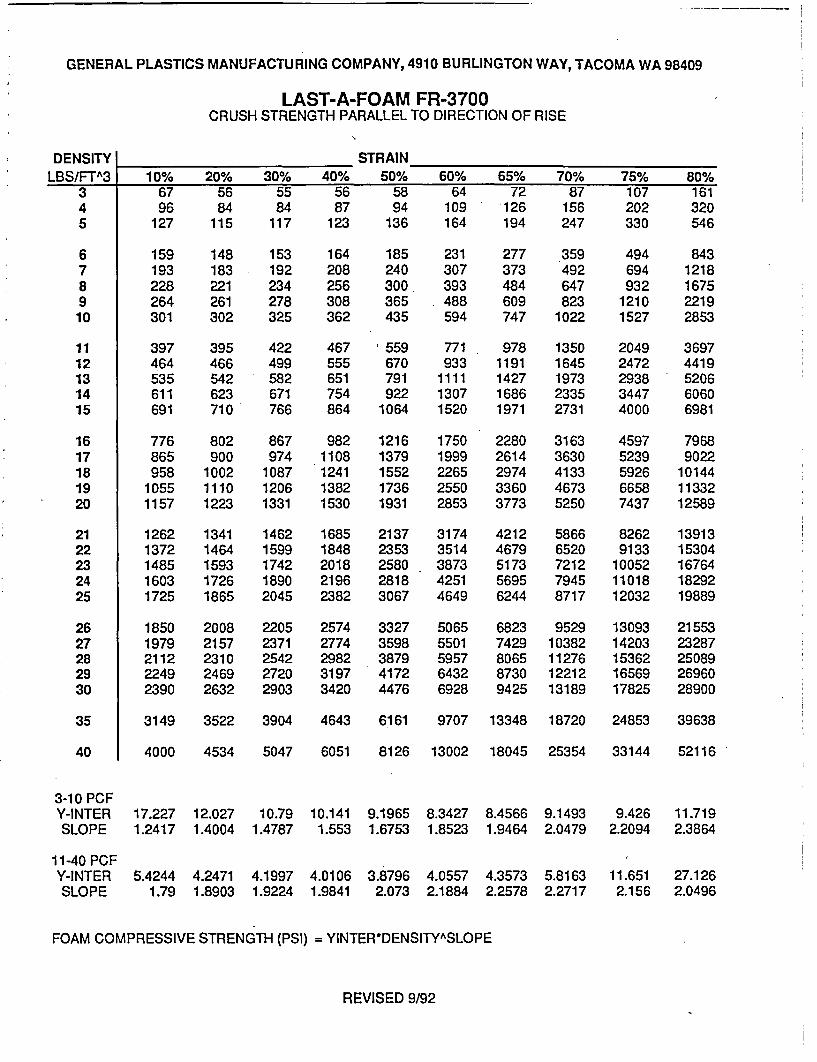
lI
GENERAL PLASTICS MANUFACTURING COMPANY, 4910 BURLINGTON WAY, TACOMA WA 98409
LAST-A-FOAM FR-3700CRUSH STRENGTH PARALLEL TO DIRECTION OF RISE
DENSITYLBS/FTA3
STRAIN_10% 20% 30% 40% 50% 60% 65% 70% 75% 80%
345
6789
10
1112131415
1617181920
2122232425
2627282930
35
6796
127
159193228264301
397464535611691
776865958
10551157
12621372148516031725
18501979211222492390
5684
115
148183221261302
395466542623710
802900
100211101223
13411464159317261865
20082157231024692632
5584
117
153192234278325
422499582671766
867974
108712061331
14621599174218902045
22052371254227202903
5687
123
164208256308362
467555651754864
9821108124113821530
16851848201821962382
25742774298231973420
58 64 7294 109 126
136 164 194
^ _ . ^ .
87156247
185 231 277 359240 307 373 492300. 393 484 647365 .488 609 823435 594 747 1022
v 559670791922
1064
12161379155217361931
21372353258028183067
33273598387941724476
771933
111113071520
17501999226525502853
31743514387342514649
50655501595764326928
978 13501191 16451427 19731686 23351971 2731
22802614297433603773
42124679517356956244
68237429806587309425
31633630413346735250
58666520721279458717
952910382112761221213189
107202330
494694932
12101527
20492472293834474000
45975239592666587437
82629133
100521101812032
1309314203153621656917825
161320546
8431218167522192853
36974419520660606981
79689022
101441133212589
1391315304167641829219889
2155323287250892696028900
3149 3522 3904 4643 6161 9707 13348 18720 24853 39638
40 4000 4534 5047 6051 8126 13002 18045 25354 33144 52116
3-10 PCFY-INTER 17.227 12.027 10.79 10.141 9.1965 8.3427 8.4566 9.1493SLOPE 1.2417 1.4004 1.4787 1.553 1.6753 1.8523 1.9464 2.0479
9.426 11.7192.2094 2.3864
11.651 27.1262.156 2.0496
11-40 PCFY-INTER 5.4244 4.2471 4.1997 4.0106 3.8796 4.0557 4.3573 5.8163SLOPE 1.79 1.8903 1.9224 1.9841 2.073 2.1884 2.2578 2.2717
FOAM COMPRESSIVE STRENGTH (PSI) = YINTER*DENSITYASLOPE
REVISED 9/92
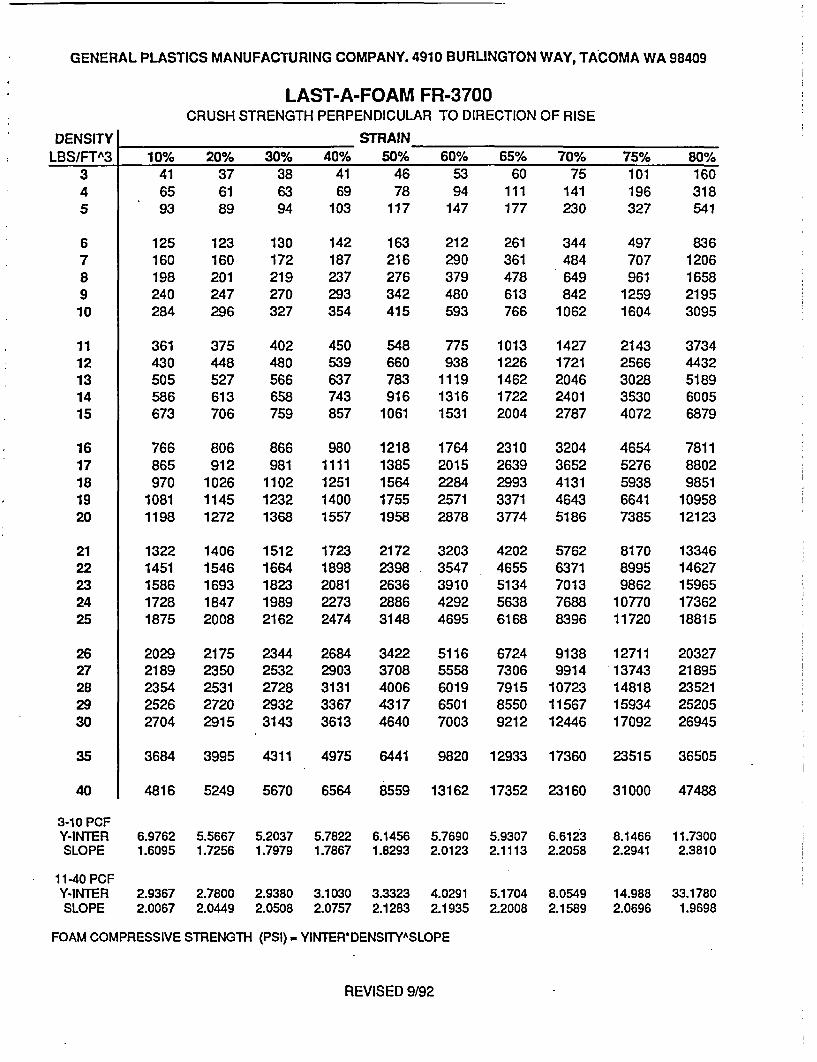
GENERAL PLASTICS MANUFACTURING COMPANY. 4910 BURLINGTON WAY, TACOMA WA 98409
LAST-A-FOAM FR-3700CRUSH STRENGTH PERPENDICULAR TO DIRECTION OF RISE
DENSITYLBSIFTA3
STRAIN_10% 20% 30% 40% 50% 60% 65% 70% 75% 80%
345
416593
376189
386394
4169
103
4678
117
53 60 7594 111 141
147 177 230
101196327
160318541
678910
1112131415
1617181920
2122232425
2627282930
125160198240284
361430505586673
766865970
10811198
13221451158617281875
20292189235425262704
123160201247296
375448527613706
130172219270327
402480566658759
142187237293354
163216276342415
212290379480593
261 344361 484478 649613 842766 1062
450 548 775 1013 1427539 660 938 1226 1721637 783 1119 1462 2046743 916 1316 1722 2401857 1061 1531 2004 2787
806 866 980 1218 1764 2310 3204912 981 1111 1385 2015 2639 3652
1026 1102 1251 1564 2284 2993 41311145 1232 1400 1755 2571 3371 46431272 1368 1557 1958 2878 3774 5186
1406 1512 1723 2172 3203 4202 57621546 1664 1898 2398 3547 4655 63711693 1823 2081 2636 3910 5134 70131847 1989 2273 2886 4292 5638 76882008 2162 2474 3148 4695 6168 8396
2175 2344 2684 3422 5116 6724 91382350 2532 2903 3708 5558 7306 99142531 2728 3131 4006 6019 7915 107232720 2932 3367 4317 6501 8550 115672915 3143 3613 4640 7003 9212 12446
497707961
12591604
21432566302835304072
46545276593866417385
817089959862
1077011720
1271113743148181593417092
8361206165821953095
37344432518960056879
781188029851
1095812123
1334614627159651736218815
2032721895235212520526945
35
40
3-10 PCFY-INTERSLOPE
11-40 PCFY-INTERSLOPE
3684 3995 4311 4975 6441 9820 12933 17360
4816 5249 5670 6564 8559 13162 17352 23160
6.9762 5.5667 5.2037 5.7822 6.1456 5.7690 5.9307 6.61231.6095 1.7256 1.7979 1.7867 1.8293 2.0123 2.1113 2.2058
2.9367 2.7800 2.9380 3.1030 3.3323 4.0291 5.1704 8.05492.0067 2.0449 2.0508 2.0757 2.1283 2.1935 2.2008 2.1589
23515 36505
31000 47488
8.1466 11.73002.2941 2.3810
14.988 33.17802.0696 1.9698
FOAM COMPRESSIVE STRENGTH (PSI) - YINTER*DENSITYASLOPE
REVISED 9/92
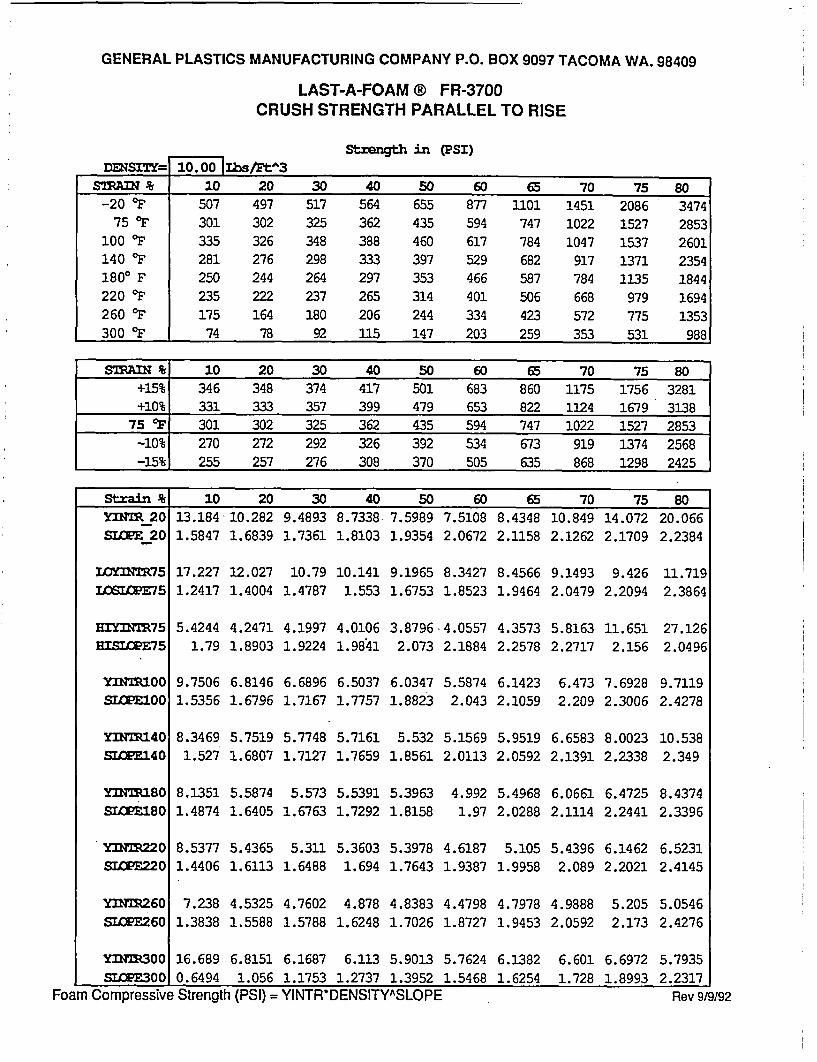
GENERAL PLASTICS MANUFACTURING COMPANY P.O. BOX 9097 TACOMA WA. 98409
LAST-A-FOAM ® FR-3700CRUSH STRENGTH PARALLEL TO RISE
Stxength in (PSI)DumsI1y=I 0o.o0 6IUbs/Ft-3
STRAIN 10 20 30 40 50 60 65 70 75 80-20 OF 507 497 517 564 655 877 1101 1451 2086 3474
75 OF 301 302 325 362 435 594 747 1022 1527 2853100 OF 335 326 348 388 460 617 784 1047 1537 2601140 OF 281 276 298 333 397 529 682 917 1371 23541800 F 250 244 264 297 353 466 587 784 1135 1844220 OF 235 222 237 265 314 401 506 668 979 1694260 OF 175 164 180 206 244 334 423 572 775 1353300 OF 74 78 92 115 147 203 259 353 531 988
STIN 6 10 20 30 40 50 60 65 70 75 80+15% 346 348 374 417 501 683 860 1175 1756 3281+10% 331 333 357 399 479 653 822 1124 1679 3138
75 OF 301 302 325 362 435 594 747 1022 1527 2853-10% 270 272 292 326 392 534 673 919 1374 2568-15% 255 257 276 308 370 505 635 868 1298 2425
Strain% 10 20 30 40 50 60 65 70 75 80Y1. 20 13.184 10.282 9.4893 8.7338 7.5989 7.5108 8.4348 10.849 14.072 20.066SiME 20 1.5847 1.6839 1.7361 1.8103 1.9354 2.0672 2.1158 2.1262 2.1709 2.2384
LOYINTR75 17.227 12.027 10.79 10.141 9.1965 8.3427 8.4566 9.1493 9.426 11.719ICIE:75 1.2417 1.4004 1.4787 1.553 1.6753 1.8523 1.9464 2.0479 2.2094 2.3864
EIYflTR75 5.4244 4.2471 4.1997 4.0106 3.8796 4.0557 4.3573 5.8163 11.651 27.126HISIME75 1.79 1.8903 1.9224 1.9841 2.073 2.1884 2.2578 2.2717 2.156 2.0496
YINi00 9.7506 6.8146 6.6896 6.5037 6.0347 5.5874 6.1423 6.473 7.6928 9.7119SLIfE100 1.5356 1.6796 1.7167 1.7757 1.8823 2.043 2.1059 2.209 2.3006 2.4278
YnM140 8.3469 5.7519 5.7748 5.7161 5.532 5.1569 5.9519 6.6583 8.0023 10.538SIME140 1.527 1.6807 1.7127 1.7659 1.8561 2.0113 2.0592 2.1391 2.2338 2.349
Y=180 8.1351 5.5874 5.573 5.5391 5.3963 4.992 5.4968 6.0661 6.4725 8.4374IE180 1.4874 1.6405 1.6763 1.7292 1.8158 1.97 2.0288 2.1114 2.2441 2.3396
Yf220 8.5377 5.4365 5.311 5.3603 5.3978 4.6187 5.105 5.4396 6.1462 6.5231RIME220 1.4406 1.6113 1.6488 1.694 1.7643 1.9387 1.9958 2.089 2.2021 2.4145
YTM260 7.238 4.5325 4.7602 4.878 4.8383 4.4798 4.7978 4.9888 5.205 5.0546SlPE260 1.3838 1.5588 1.5788 1.6248 1.7026 1.8727 1.9453 2.0592 2.173 2.4276
YnlTM300 16.689 6.8151 6.1687 6.113 5.9013 5.7624 6.1382 6.601 6.6972 5.7935SILE300 0.6494 1.056 1.1753 1.2737 1.3952 1.5468 1.6254 1.728 1.8993 2.2317
Foam Compressive Strength (PSI) = YINTR*DENSITY^SLOPE Rev 919/92
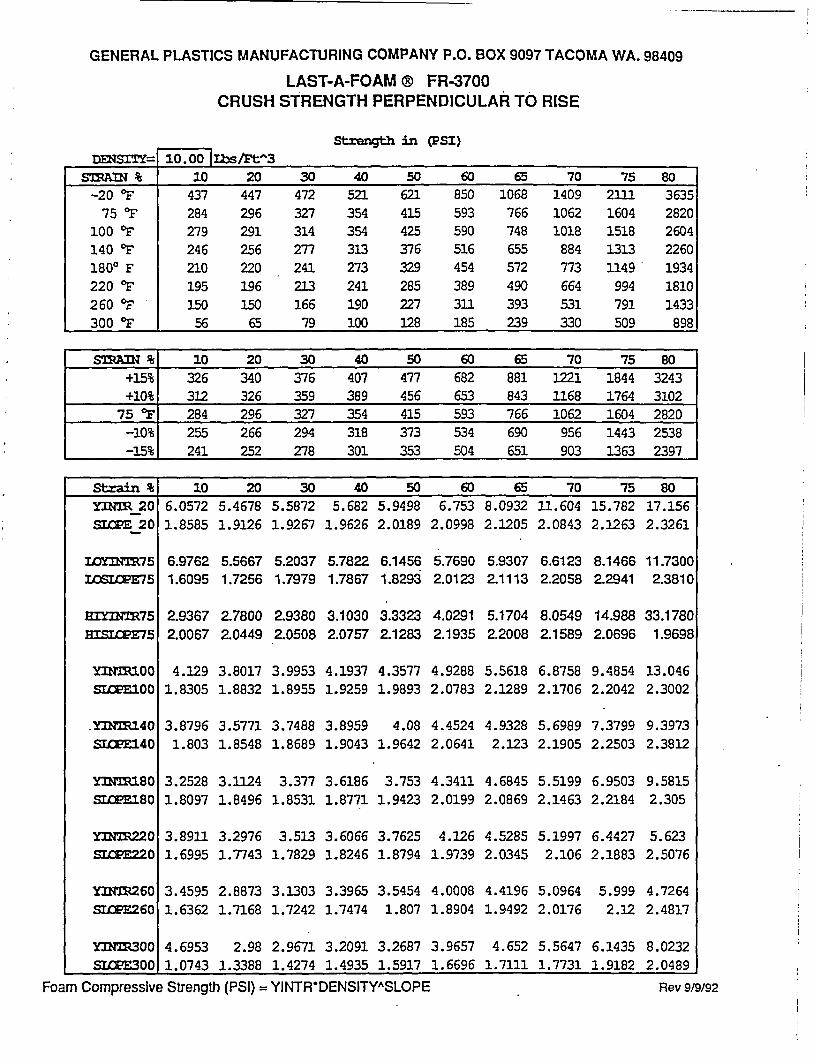
. -
GENERAL PLASTICS MANUFACTURING COMPANY P.O. BOX 9097 TACOMA WA. 98409
LAST-A-FOAM ® FR-3700CRUSH STRENGTH PERPENDICULAR TO RISE
Stzxwxtrh in (PSI)
DENSITY-t 10.00 bs/rt-t3STAIN % 10 20 30 40 50 60 65 70 75 80
-20 0F 437 447 472 521 621 850 1068 1409 2111 363575 OF 284 296 327 354 415 593 766 1062 1604 2820
100 OF 279 291 314 354 425 590 748 1018 1518 2604140 OF 246 256 277 313 376 516 655 884 1313 22601800 F 210 220 241 273 329 454 572 773 1149 1934220 VF 195 196 213 241 285 389 490 664 994 1810260 OF 150 150 166 190 227 311 393 531 791 1433300 OF 56 65 79 100 128 185 239 330 509 898
STR____ 10 20 30 40 50 60 65 70 75 80
+15% 326 340 376 407 477 682 881 1221 1844 3243+10% 312 326 359 389 456 653 843 1168 1764 3102
75 OF 284 296 327 354 415 593 766 1062 1604 2820-10% 255 266 294 318 373 534 690 956 1443 2538-15% 241 252 278 301 353 504 651 903 1363 2397
strain % 10 20 30 40 50 60 65 70 75 80YMM 20 6.0572 5.4678 5.5872 5.682 5.9498 6.753 8.0932 11.604 15.782 17.156SI E_20 1.8585 1.9126 1.9267 1.9626 2.0189 2.0998 2.1205 2.0843 2.1263 2.3261
LOYInT75 6.9762 5.5667 5.2037 5.7822 6.1456 5.7690 5.9307 6.6123 8.1466 11.7300LIME75 1.6095 1.7256 1.7979 1.7867 1.8293 2.0123 2.1113 2.2058 2.2941 2.3810
fN5ZZfR75 2.9367 2.7800 2.9380 3.1030 3.3323 4.0291 5.1704 8.0549 14.988 33.1780BISIEM75 2.0067 2.0449 2.0508 2.0757 2.1283 2.1935 2.2008 2.1589 2.0696 1.9698
YInM100 4.129 3.8017 3.9953 4.1937 4.3577 4.9288 5.5618 6.8758 9.4854 13.046SITE100 1.8305 1.8832 1.8955 1.9259 1.9893 2.0783 2.1289 2.1706 2.2042 2.3002
.YIN'M140 3.8796 3.5771 3.7488 3.8959 4.08 4.4524 4.9328 5.6989 7.3799 9.3973SIEE140 1.803 1.8548 1.8689 1.9043 1.9642 2.0641 2.123 2.1905 2.2503 2.3812
YnTM 180 3.2528 3.1124 3.377 3.6186 3.753 4.3411 4.6845 5.5199 6.9503 9.5815SIfqCE180 1.8097 1.8496 1.8531 1.8771 1.9423 2.0199 2.0869 2.1463 2.2184 2.305
YIn =220 3.8911 3.2976 3.513 3.6066 3.7625 4.126 4.5285 5.1997 6.4427 5.623ST'E220 1.6995 1.7743 1.7829 1.8246 1.8794 1.9739 2.0345 2.106 2.1883 2.5076
Y114=260 3.4595 2.8873 3.1303 3.3965 3.5454 4.0008 4.4196 5.0964 5.999 4.7264SILE260 1.6362 1.7168 1.7242 1.7474 1.807 1.8904 1.9492 2.0176 2.12 2.4817
YnDT300 4.6953 2.98 2.9671 3.2091 3.2687 3.9657 4.652 5.5647 6.1435 8.0232SILCE300 1.0743 1.3388 1.4274 1.4935 1.5917 1.6696 1.7111 1.7731 1.9182 2.0489
Foam Compressive Strength (PSI) = YINTR*DENSITYASLOPE Rev 9/9/92
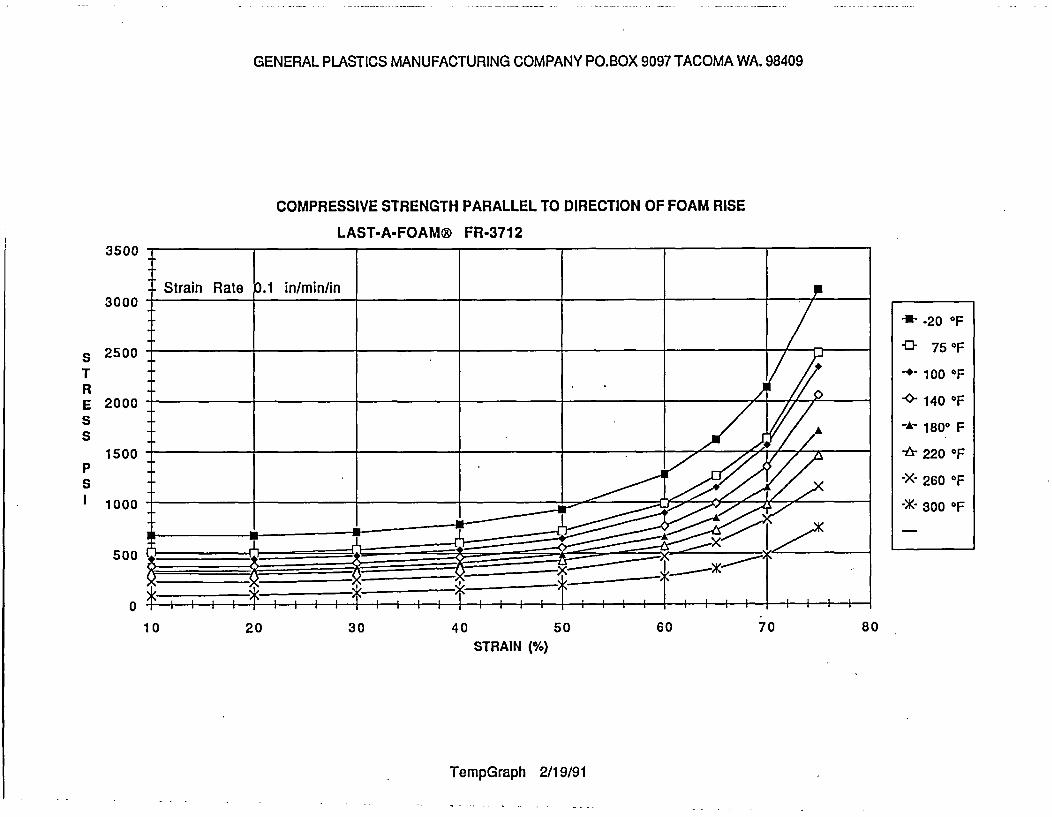
3500
3000
GENERAL PLASTICS MANUFACTURING COMPANY PO.BOX 9097 TACOMA WA. 98409
COMPRESSIVE STRENGTH PARALLEL TO DIRECTION OF FOAM RISE
LAST-A-FOAM® FR-3712
Strain Rate 0.1 in/min/in
STRESS
pS
2500
2000
1500
1000
500
-20 0F
-- 75 0 F
-*- 100 °F
v 140 *F
A 1800 F
6 220 '
-X- 260 '
OF
Of
-XK- 300 0F
0
1 0 20 30 40 50 60 70 80STRAIN (%O)
TempGraph 2/19/91
PHYSICAL PROPERTIES

/(S)\( GENERAL PLASTICSMANUFACTURING COMPANY
LAST-A-FOAM® FR-3700PRODUCT DATA SHEET
LAST-A-FOAM® FR-3700 is a CFC-free, rigid, closed-cell, flame-retardant polyurethane foam available indensities ranging from 3 to 40 pounds per cubic foot. It exhibits a high strength-to-weight ratio due to itscellular structure and cross-linked resin. Also, because of its closed-cell structure, LAST-A-FOAM® FR-3700has great resistance to water absorption, and will not swell, crack, or split on exposure to water. LAST-A-FOAM® is stable, inert, and is resistant to most chemicals and solvents. It is easily worked with common tools,and performs well as a primary or replacement for many materials in a variety of applications. The last twodigits of product numbers describe foam density in pounds per cubic foot.
Some typical uses include:
Honeycomb edge close-out for aircraft interior sandwich panels used in: Overhead storage bins,passenger cabin class dividers, and galleys and lavatories.
*Insulated supports for pipes, walls, footings eComposite tooling core materialeCore material for snow and water skis, surfboards eModels and design prototypes*Vacuum form dies, mold patterns *Insulated structural panels* Core material for boat decking, motor mounts -Hazardous materials transport packaging
LAST-A-FOAMO FR-3700 also meets the requrements of several military specifications, and materialsspecifications of many aircraft and aerospace manufacturers. If your project or application requires
certification, we can supply specification conformance information on request.
LAST-A-FOAM® FR-3700 series foams are available in densities of 3 to 20 pounds per cubic foot in 48" x96" sheets, and in densities from 10 to 40 pounds per cubic foot in 18" x 100" sheets.
FR-3700 SHEET SIZES AND WORKMANSHIP STANDARDS
Special sheet and block sizes gladly quoted on request.
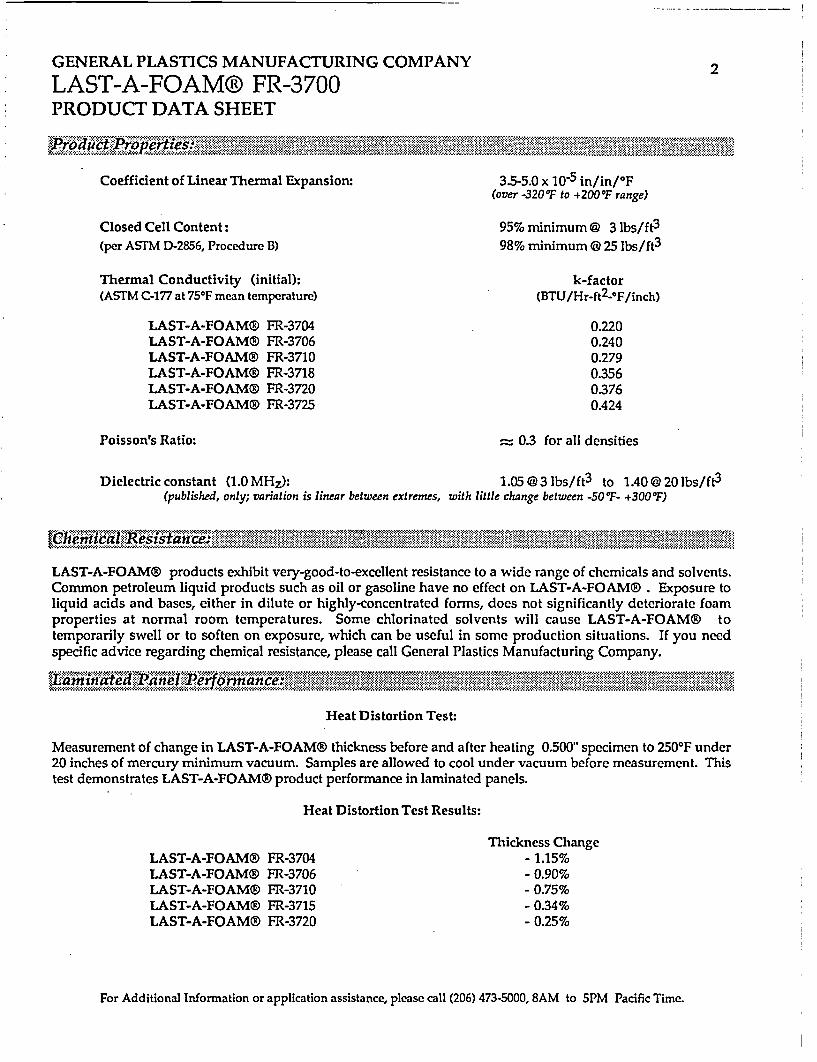
GENERAL PLASTICS MANUFACTURING COMPANY
LAST-A-FOAM® FR-3700PRODUCT DATA SHEET
2
Coefficient of Linear Thermal Expansion.
Closed Cell Content:(per ASTM D-2856, Procedure B)
Thermal Conductivity (initial):(ASTM C-177 at 75°F mean temperature)
3.5-5.0 x 10⁻⁵ in/in/ 0F(over -320TF to +200IF range)
95% minimum © 3 lbs/ft3
98% minimum i 25 Ibs/ft3
k-factor(BTU/Hr-ft2 -°F/inch)
LAST-A-FOAM®LAST-A-FOAM®LAST-A-FOAM®9LAST-A-FOAM®DLAST-A-FOAM®DLAST-A-FOAM®D
FR-3704FR-3706FR-3710FR-3718FR-3720FR-3725
0.2200.2400.2790.3560.3760.424
Poisson's Ratio: = 0.3 for all densities
Dielectric constant (1.0 MHz): 1.05@3 lbs/ft3 to 1.40@20Ibs/ft3(published, only; variation is linear between extremes, with little change between -50 "F- +300 IF)
*....... .k-g g g ..
LAST-A-FOAM® products exhibit very-good-to-excellent resistance to a wide range of chemicals and solvents.Common petroleum liquid products such as oil or gasoline have no effect on LAST-A-FOAM®D . Exposure toliquid acids and bases, either in dilute or highly-concentrated forms, does not significantly deteriorate foamproperties at normal room temperatures. Some chlorinated solvents will cause LAST-A-FOAMO totemporarily swell or to soften on exposure, which can be useful in some production situations. If you needspecific advice regarding chemical resistance, please call General Plastics Manufacturing Company.
Heat Distortion Test:
Measurement of change in LAST-A-FOAM® thickness before and after heating 0.500" specimen to 250'F under20 inches of mercury minimum vacuum. Samples are allowed to cool under vacuum before measurement. Thistest demonstrates LAST-A-FOAM® product performance in laminated panels.
Heat Distortion Test Results:
LAST-A-FOAM®LAST-A-FOAM®LAST-A-FOAM®LAST-A-FOAM®LAST-A-FOAMO
FR-3704FR-3706FR-3710FR-3715FR-3720
Thickness Change- 1.15%- 0.90%- 0.75%- 0.34%- 0.25%
For Additional Information or application assistance, please call (206) 473-5000, 8AM to 5PM Pacific Time.
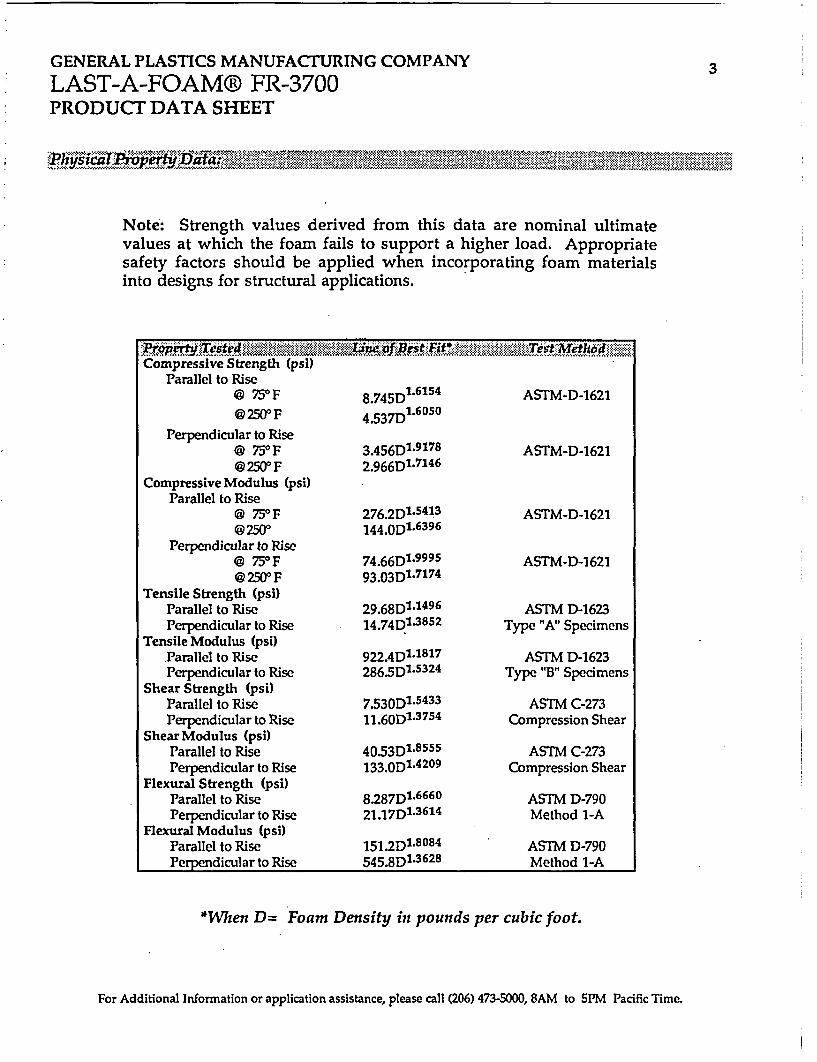
GENERAL PLASTICS MANUFACTURING COMPANY 3
LAST-A-FOAM® FR-3700PRODUCI DATA SHEET
Note: Strength values derived from this data are nominal ultimatevalues at which the foam fails to support a higher load. Appropriatesafety factors should be applied when incorporating foam materialsinto designs for structural applications.
Compressive Strength (psi)Parallel to Rise
0 750F 8.745D1.6154 ASTM-D-1621@250° F 4.537D1.6050
Perpendicular to Rise@ 750F 3A56D1I 9178 ASTM-D-1621@250° F 2.966D1.7146
Compressive Modulus (psi)Parallel to Rise
i 750F 276.2D1 .54 13 ASTM-D-1621@ 2500 144.OD 1.63 96
Perpendicular to Rise0 750 F 74.66D1 -999 5 ASTM-D-1621@ 250° F 93.03D13 717 4
Tensile Strength (psi)Parallel to Rise 29.68D1 .1496 ASTM D-1623Perpendicular to Rise 14.74D1 3 852 Type "A" Specimens
Tensile Modulus (psi)Parallel to Rise 922.4D. 1 817 ASTM D-1623Perpendicular to Rise 286.5D1 5 324 Type "B" Specimens
Shear Strength (psi) 1 .5 4 33
Parallel to Rise 7.530ASTM C273Perpendicular to Rise 11.60D1 .375 4 Compression Shear
ShearModulus (psi)Parallel to Rise 40-53D1-855 5 ASTM C-273Perpendicular to Rise 133.0D1 .42 09 Compression Shear
Flexural Strength (psi)Parallel to Rise 8.287D1 .66 60 ASTM D-790Perpendicular to Rise 21.17D1 .3614 Method 1-A
Flexural Modulus (psi)Parallel to Rise 151.21.8084 ASTM D-790Perpendicular to Rise 545.8D13 36 28 Method 1-A
*When D= Foam Density in pounds per cubic foot.
For Additional Information or application assistance, please call (206) 473-5000, 8AM to SPM Pacific Time.
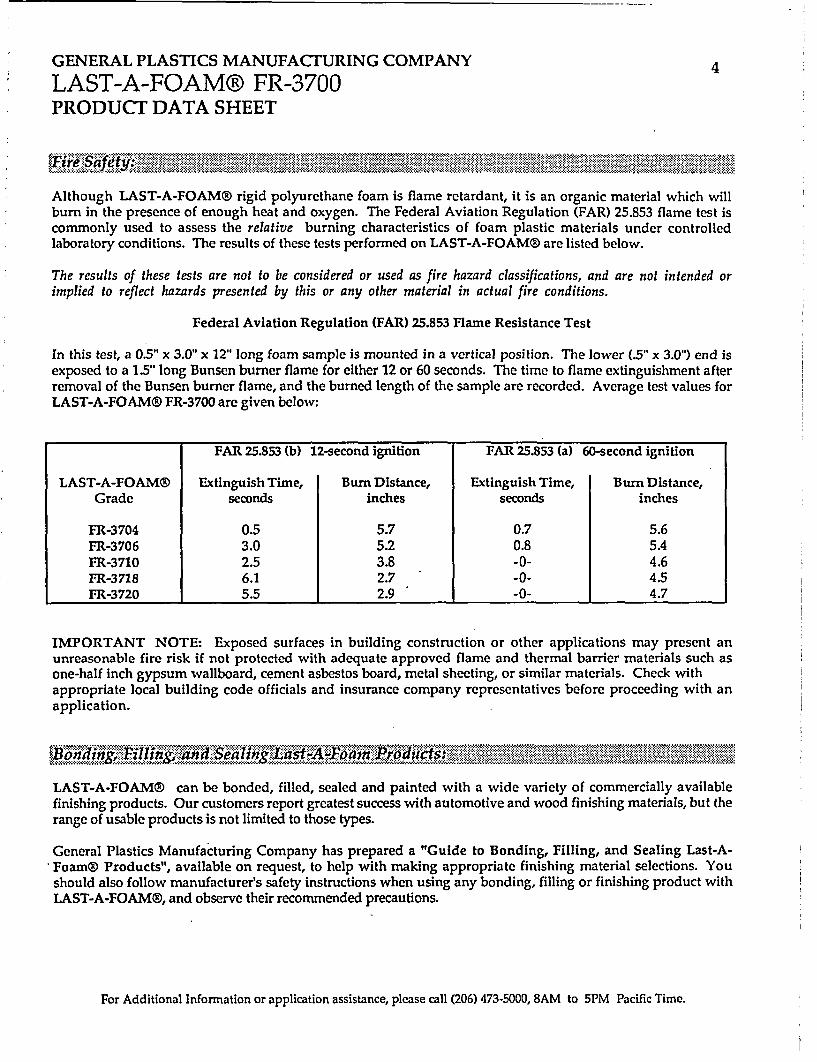
GENERAL PLASTICS MANUFACTURING COMPANY 4
LAST-A-FOAM® FR-3700PRODUCT DATA SHEET
. . _ . '.9.1.
Although LAST-A-FOAM®D rigid polyurethane foam is flame retardant, it is an organic material which willburn in the presence of enough heat and oxygen. The Federal Aviation Regulation (FAR) 25.853 flame test iscommonly used to assess the relative burning characteristics of foam plastic materials under controlledlaboratory conditions. The results of these tests performed on LAST-A-FOAM®) are listed below.
The results of these tests are not to be considered or used as fire hazard classifications, and are not intended orimplied to reflect hazards presented by this or any other material in actual fire conditions.
Federal Aviation Regulation (FAR) 25.853 Flame Resistance Test
In this test, a 0.5" x 3.0" x 12" long foam sample is mounted in a vertical position. The lower (.5" x 3.0") end isexposed to a 1.5" long Bunsen burner flame for either 12 or 60 seconds. The time to flame extinguishment afterremoval of the Bunsen burner flame, and the burned length of the sample are recorded. Average test values forLAST-A-FOAM® FR-3700 are given below:
FAR 25.853 (b) 12-second ignition FAR 25.853 (a) 60-second ignition
LAST-A-FOAM® Extinguish Time, Burn Distance, Extinguish Time, Burn Distance,Grade seconds inches seconds inches
FR-3704 0.5 5.7 0.7 5.6FR-3706 3.0 5.2 0.8 5.4FR-3710 2.5 3.8 -0- 4.6FR-3718 6.1 2.7 -0- 4.5FR-3720 5.5 2.9 -0- 4.7
IMPORTANT NOTE: Exposed surfaces in building construction or other applications may present anunreasonable fire risk if not protected with adequate approved flame and thermal barrier materials such asone-half inch gypsum wallboard, cement asbestos board, metal sheeting, or similar materials. Check withappropriate local building code officials and insurance company representatives before proceeding with anapplication.
LAST-A-FOAM®D can be bonded, filled, sealed and painted with a wide variety of commercially availablefinishing products. Our customers report greatest success with automotive and wood finishing materials, but therange of usable products is not limited to those types.
General Plastics Manufacturing Company has prepared a "Guide to Bonding, Filling, and Sealing Last-A-Foam® Products", available on request, to help with making appropriate finishing material selections. Youshould also follow manufacturer's safety instructions when using any bonding, filling or finishing product withLAST-A-FOAM®, and observe their recommended precautions.
For Additional Information or application assistance, please call (206) 473-5000, 8AM to 5PM Pacific Time.
GENERAL PLASTICS MANUFACTURING COMPANY 5
LAST-A-FOAM® FR-3700PRODUCT DATA SHEET
EndoM Mm m 3 A t * .. *...*.*....
When storing and handling rigid LAST-A-FOAM®, it should be treated as you would any possibly combustibleorganic solid. Storage precautions for wood are fully adequate when used with LAST-A-FOAM®. Scrap andwaste LAST-A-FOAM® materials are inert and can be disposed of as you would ordinary solid waste.
Rigid LAST-A-FOAM® is essentially chemically inert, as the ingredients used to make it react completelyduring the manufacturing process. However, cutting, planing, shaping, routing and sanding Last-A-Foamproduces dust. The inhaling of foam dust, as with any dust, should be avoided. Safety equipment appropriatefor use in avoiding dust inhalation should be used when working with LAST-A-FOAM®.
IMPORTANT NOTICE TO PURCHASER: Test values shown in this document are not to be used for settingspecifications. All statements, technical information, and data are based on testing we believe to be reliable,but the accuracy or completeness thereof is not guaranteed. Users should perform their own tests on their owndesigns incorporating these materials to determine suitability for use in their application.
For further technical assistance. or to place an order. please call:
GENERAL PLASTICS MANUFACTURING COMPANY4910 BURLINGTON WAY/ P.O. BOX 9097
TACOMA, WASHINGTON 98409
Telephone: (206) 473-5000 Facsimile: (206) 473-5104
Toll-Free from Seattle-Renton, WA area: (206) 623-2795
MANUFACTURERS AND MOLDERS OF LAST-A-FOAM HIGH DENSITY RIGID AND FLEXIBLEPOLYURETHANE FOAMS AND FABRICATORS OF PLASTIC SHEETS FOR AIRCRAFT, INDUSTRIAL,
CONSTRUCTION, MARINE, NUCLEAR, SHIPPING AND MODELING INDUSTRIES
For Additional Information or application assistance, please call (206) 473-5000, 8AM to SPM Pacific Time.
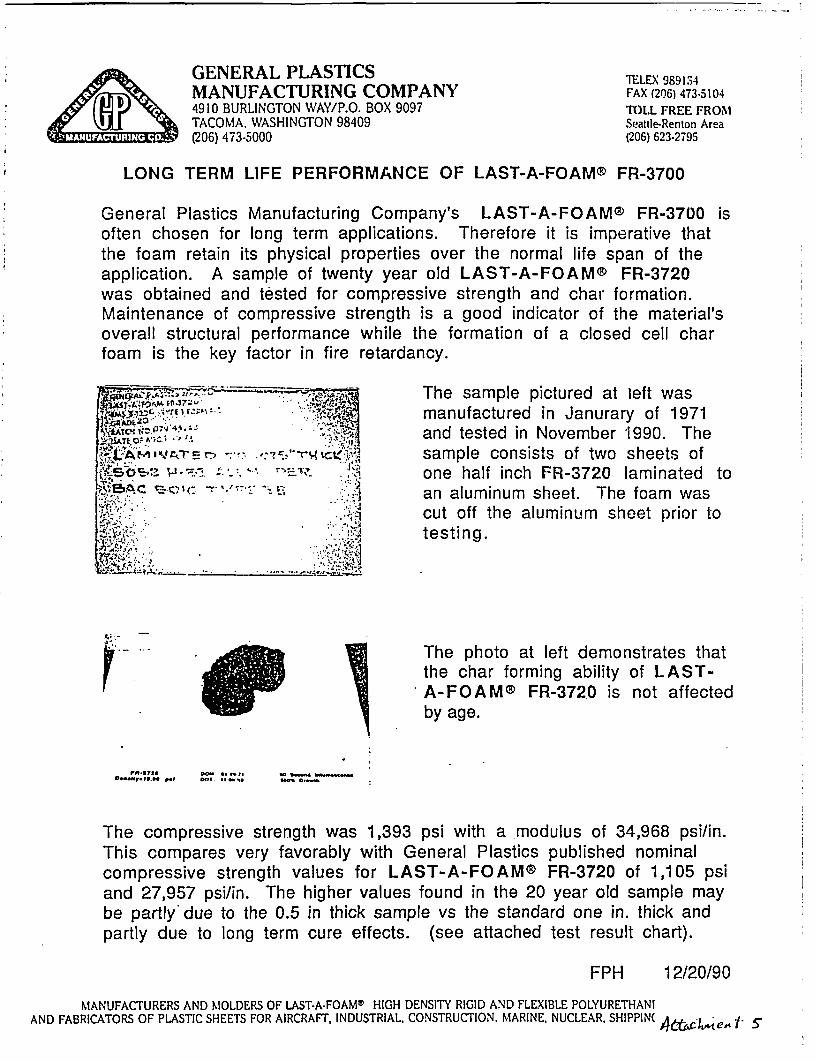
avllh GENERAL PLASTICS TELEX989134
MANUFACTURING COMPANY FAX9206)473.51044910 BURLINGTON WAY/P.O. BOX 9097 TOLL FREE FROMi TACOMA. WASHINGTON 98409 Seattle-Renton Area
Vidwirlilli:A (206) 473-5000 (206) 623-2795
LONG TERM LIFE PERFORMANCE OF LAST-A-FOAM® FR-3700
General Plastics Manufacturing Company's LAST-A-FOAM® FR-3700 isoften chosen for long term applications. Therefore it is imperative thatthe foam retain its physical properties over the normal life span of theapplication. A sample of twenty year old LAST-A-FOAM® FR-3720was obtained and tested for compressive strength and char formation.Maintenance of compressive strength is a good indicator of the material'soverall structural performance while the formation of a closed cell charfoam is the key factor in fire retardancy.
The sample pictured at left was. , ;manufactured in Janurary of 1971
and tested in November 1990. Theq - .,:m.( sample consists of two sheets of
T.? , *: ; ' one half inch FR-3720 laminated tot;.~1: -:.an aluminum sheet. The foam was
- ;cut off the aluminum sheet prior totesting.
UThe photo at left demonstrates thatthe char forming ability of LAST-A-FgAMe FR-3720 is not affected
_b age.
Do, @* a d oet *. Act, te *.t* .
The compressive strength was 1,393 psi with a modulus of 34,968 psi/in.This compares very favorably with General Plastics published nominalcompressive strength values for LAST-A-FOAM® FR-3720 of 1,105 psiand 27,957 psi/in. The higher values found in the 20 year old sample maybe partly due to the 0.5 in thick sample vs the standard one in. thick andpartly due to long term cure effects. (see attached test result chart).
FPH 12/20/90
MANUFACTURERS AND MOLDERS OF LAST-A-FOAMD HIGH DENSITY RIGID AND FLEXIBLE POLYURETHANIAND FABRICATORS OF PLASTIC SHEETS FOR AIRCRAFT. INDUSTRIAL. CONSTRUCTION. MARINE, NUCLEAR, SHIPPIN( ca,4 e i 5
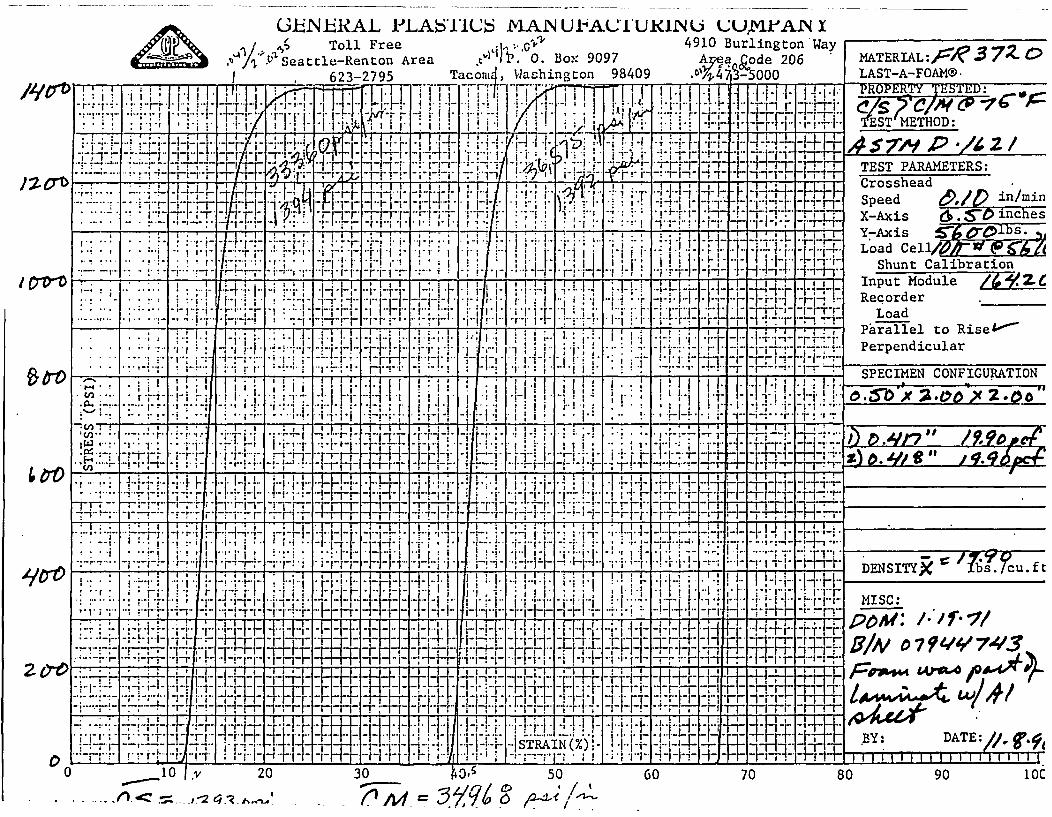
GE~NEiRAL PLA~ST1C6 MAN UiPACTUXINU CUUMI-AIN Xd" Toll Free -PP4910 Burlington Way
.¶1 <iS tt 1en1. Aea0. Box: 9097 fq ad 206I. 623-2795 Taconi4, Washington 98409 .o%)',4 7,IS-50 0
MATERIAL:ox:i'3 7-Z C)LAST-A-FOAMG®.
a .. 4%. - - - - . - . . . I m I .a . . . . I m I. ... . . . . . -- , b - - . - . . ........- I -"21111-1-* - . 'S--
--- - ;- -H ....'I I ; ? J.;-n,I ; ---! .-FI , ;-:I "I "I' I .
1M I1 I-1T-Fr17I I
~:L!:4i.H2 ir
4I III : :I
'A ~Iat.
a-.! I
a *;-. ifT1"-,Z I~ II
-- 'I-*I-i F. I ,-1 -,-I -I.,
-[J�, J.I. I-IT!"Y1E ST' METHOD:
-4. '/ P -1I
71I '- VI a ; . a ri-FI
aH.!I 1rriIm47, j-� I 1-1-�
11 I I iI I- --Ii-P.-I:
-I-H-i-I-1-1-
I I. I -a ..-II. I
*11-,~ 'I! I I..Ib: ..;.; I.
. I - Ii - i,;4;;i -
I iI ,
*011
I ! -., - -I.-, :,..-; -1- r
I ! ! I I I.I.- 4- -I-I I � -. � I �1+a i-r -ta I i. I II I I !I
FTF I '-TH4ThFF- F-Fv
at! T 1T rI a Irirl
ri~r
TEST PARAMETERS:CrossheadSpeedinmnX-Axis inchesY-Axis !5-I60-01Load Ce141yf(
Shunt Calibration
Recorder_____
LoadPiarallel to Rise&-'Perpendicular
. . ; I
I ;. ; ....
; I
I: -! 1.!. . i ..1. ( ? -. I. --,: .: -1 I I. I'
*.~ -- * . a* a
I r raI I I
I.
;. . G.. I -;.-- Ii Ii -!,: V - I
a. a...I I
I.I:I:
.:i
I !: 'I
-- I-
.:1 * !
.. :--
I I
.�--r-:-J-J.-.4-I-I-I-r
-r4. :.4 -
:T-:1-I
� i . I
-C -!-I-
-I - I- -I-, "I- SPECIMEN CONFIGURATION
-. . .. : 4 . ...... . . . -- t . . . . .-. . .-. - .-. , -. - - - --- 2---a-a a.;
.I i 2 IJ2.1 .. I:- I -!-
i iI I *
a 2 I :
! .1 -]i- I :i I.
*1!- .; .2 . I-I/I
.1-1I .i :. II I
*2
-iII*
III
aI!
I.:I.
ii. 11:.
I I*
.I.
I-.
. i-*
21.! 22-a a a.
- I~i- 2,I 1.- .v' -I--
o,5~1i ~.'ox 2 -C o
l (n.. .
;LL . ....;
,ar11-t I 2�i-a-�'t a �2 ���1 -2-E-Tr1a I I a a a � . I a a I,:2:2, I-:... r-
.- T :�-rj --TI-H-
2 . *1I1' 1 I T "-- :..I-a- -H-I -1r
T1-trTj
I : ! 1T-1.1-1.1 . .
- -r,,-!,-I I
I I - .-i i- ; -[.-:I , .-I . II
F1 ' a .. . I 1.
I I;-I-I.-.. J. r:T2 -r
I , I.- I-. I .;
, -- r
, I-r -J-.. V.!..
I I; r
1 -r--T
I -aI.
Frm'-II . �=1 -: I...
I -T --1-I , .
=- -I-
1) P- .,qn j Ill / ?. P40
4 0. -w e ", Z!I-.!g. 6-
. . I . . . . . . . . . . .. . I . . . . . I. . . . . 1 . . .
- IF-!--a. 2 . I
- 1. .. I...1 IIl
-r-, H1-
I a
aVI 7
� J -I-.1 . I . I ...
I 1. :.. : -
-mf-m--. -r,!,-It4- t-4-.-wFI
-I-I-i,-
-I--I .
....- I ,
=1i..,-I
.I j .; I.
. .I'.I
L. L i-'I I-I ,-i.. 1 -I-
.1 1-11.1- 1.41-11.. I I�- --r-1 --1-`- I �-l 4--ii.I , 1 2 1- 1- -- - -- .1 � ,
i I iki - - - ~-, rr~rma 2.r .i d;7rr -2. . .. a. . . . : .. . . . . . . 4-----,-+--,--,,-.--.,.-.,. . : -..... .-. a--
? . . J
-t
, I I:.- 1 a-,
0 I-H-I ! I: 1-! --
, . I
I I i a1 . --
..-- _i-I ..' -4 I
-221,.I I I1. I.*2*A -. a V -~
-I..I .:L +r.2 I ..a a,! a1
_;_I: 1. i-a-
I ..-I- i-1.1
DENSITYX IC ?~, cu. ftas Ia fit 22! I~..I I~-~I
.-I--
I- . I . ! -
I -: Ir..i I I-I
. I I... ;I i:1.I i iI .
-r-r-'r
2222- II41-:-:13(1lI Ii1 . i
....! I I -; .: : I
! 1 :1- . i J . ,
"'P,-11- --
I I a-I . 2: :
--ii ... I. I..I
I. i !--I I ,
-1 L..44-1-r-r
! I..a. I.
I i. . a 324-IA-H-- .-I-
4. a . .. .. -. ... .- -- a 4 . I.4.. i---a4
-a 2 -- + ~ - +--aa -4a aIa I . .. .. . .. .-
!.- . .- ~ 1 -]-- ;--i--.- I-a-
211
I. . I f-
I-I--
+r1-H- -I--F'-t
d- -.-HI 11 I --I- - I. -I
. I -1 I [+1 1, --r- 1-1, -.. I- -1 -: -
.iiiF-.71-JE
.r-I1 Ii.:fl:
.-,-1-I--
-I -
ITfrl4- -1 ~23-
I Ii-�.
7-
A--i+FI-
L1 I T
-r -i-i-
MISC:
pomH: /*4T/1r0/tv 0 7 4'4'74'3
BY: DATE:,//, Cal
a - -,- I - a.- .a ... , It .. . -- . .. .. . .--a-a--2------- I . i IILO,
I .. I ---- --4-
H..TJ ...-ia JTFR F71-1 -r--II II -
I-H-* .. F1
I I27tH-[F-'-4- I I I..1-n II.-. I--1-11 I.I--i 7-i-
* H,-:,[.-I -r-.-.-I-i-r,I-H± -HI'-LIf
-1 i17
-11- I
-i- I
:LII,'rrrFl
i-r1-. ~i E.. .II2II2. -a - -- -- -I . . . . . . . .. . . . . ..4 I 4 . 4-.- - I - - - I I I
a I -- a .-.---I.1-�
-rr..,. .. T
IH.-I; -- -j,- -
I-- I-141.I- I -Ir:,14-11'-f-H
f1..7~
.A [I
i.v: I4I- i.171' ] -Fl i: .a-r.. ..~. ; .--jSTRAIN (%)! -
-I :;4I~ t -I-.'
I 1-4.. J"" + Ii-.1 . ii I2 22 i I 2! II I 2 2 2 I I I I I I I I 2 2 I I I 2 I
I ! - -I J I- 4--. . . . -I I .I. I . I I I.. I ..-.-IL. .I 1 I . J*I - -- I I - * . *~ .I I ... IIII II I I I I
0 l0 lv 20 30 50 60 70 80 90 1 OC
(1 A-1 = 3796 - /
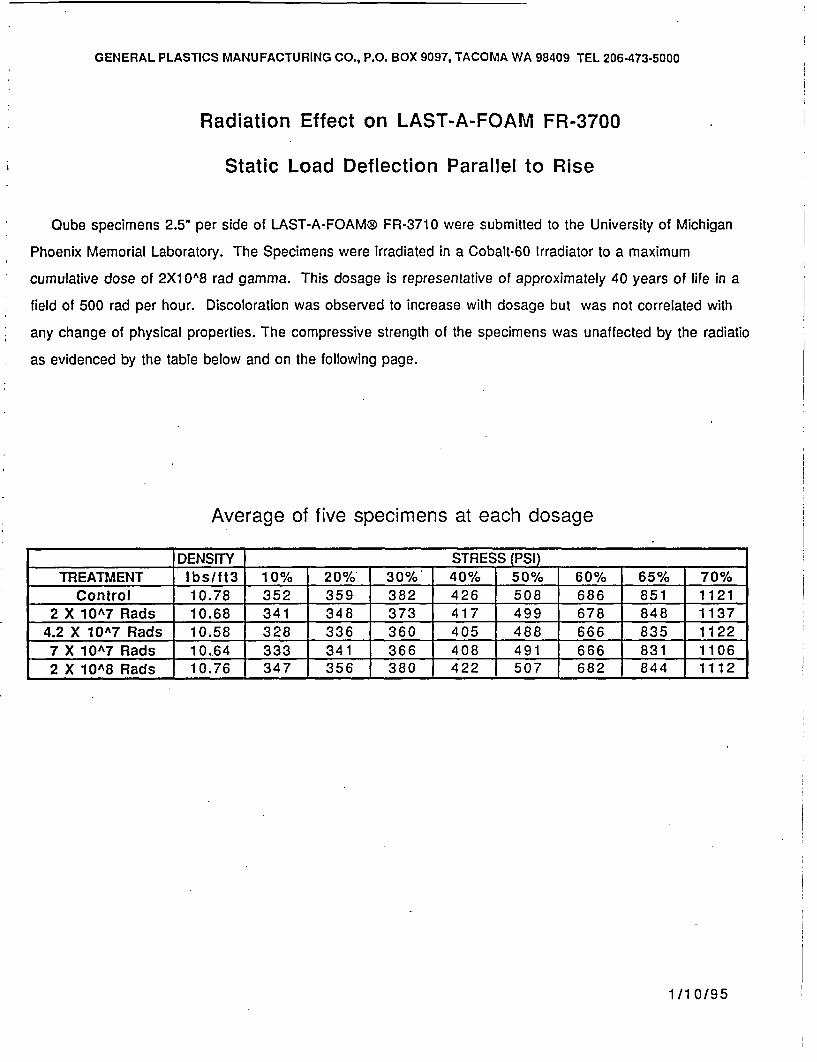
GENERAL PLASTICS MANUFACTURING CO., P.O. BOX 9097, TACOMA WA 98409 TEL 206-473-5000
Radiation Effect on LAST-A-FOAM FR-3700
Static Load Deflection Parallel to Rise
Qube specimens 2.5" per side of LAST-A-FOAM® FR-3710 were submitted to the University of Michigan
Phoenix Memorial Laboratory. The Specimens were irradiated in a Cobalt-60 Irradiator to a maximum
cumulative dose of 2X1 OA8 rad gamma. This dosage is representative of approximately 40 years of life in a
field of 500 rad per hour. Discoloration was observed to increase with dosage but was not correlated with
any change of physical properties. The compressive strength of the specimens was unaffected by the radiatio
as evidenced by the table below and on the following page.
Average of five specimens at each dosage
DENSITY | STRESS(PSI) lTREATMENT lbs/ft3 10% 20%- 30% 40% 50% 60% 65% 70%
Control 10.78 352 359 382 426 508 686 851 11212 X lOA7 Rads 10.68 341 348 373 417 499 678 848 1137
4.2 X 10A7 Rads 10.58 328 336 360 405 488 666 835 11227 X 10A7 Rads 10.64 333 341 366 408 491 666 831 11062 X 10A8 Rads 10.76 347 356 380 422 507 682 844 1112
i
I
I
1/10/95
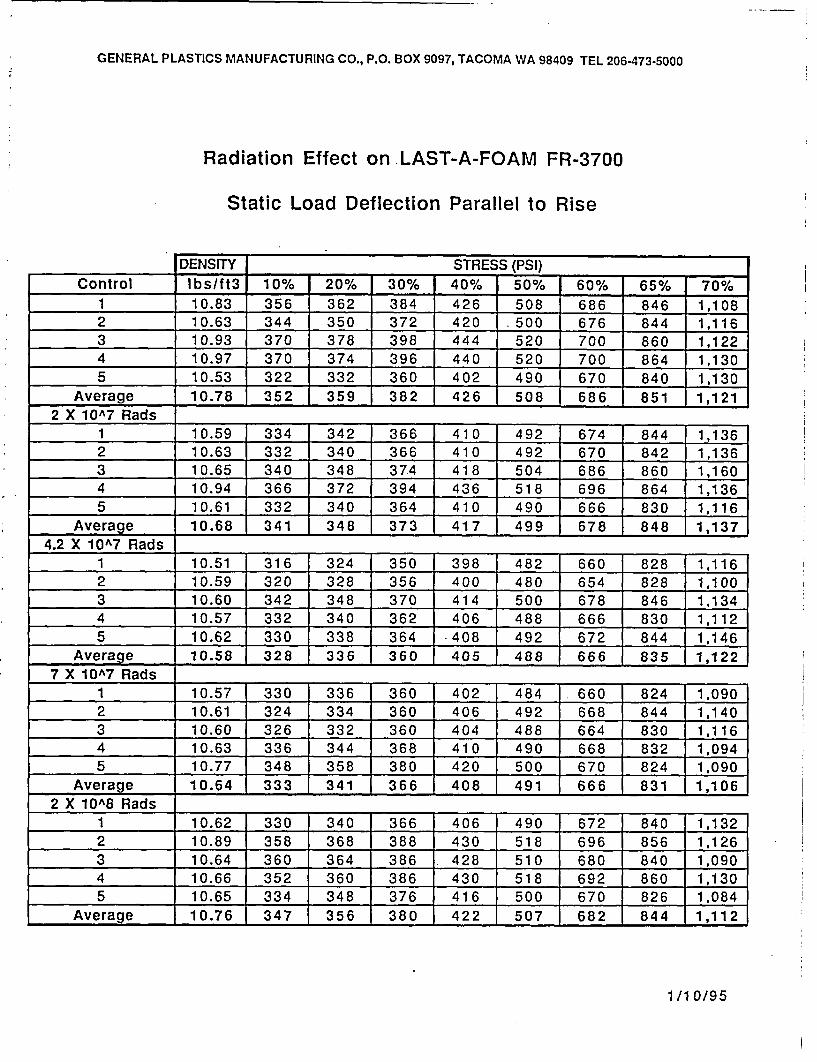
GENERAL PLASTICS MANUFACTURING CO., P.O. BOX 9097, TACOMA WA 98409 TEL 206-473-5000
Radiation Effect on LAST-A-FOAM FR-3700
Static Load Deflection Parallel to Rise
DENSITY I STRESS (PSI)Control lbs/ft3 10% 20% 30% 40% 50% 60% 65% 70%
1 10.83 356 362 384 426 508 686 846 1,1082 10.63 344 350 372 420 500 676 844 1,1163 10.93 370 378 398 444 520 700 860 1,1224 10.97 370 374 396 440 520 700 864 1,1305 10.53 322 332 360 402 490 670 840 1,130
Average 10.78 352 359 382 426 508 686 851 1,1212 X 10A7 Rads
1 10.59 334 342 366 410 492 674 844 1,1362 10.63 332 340 366 410 492 670 842 1,1363 10.65 340 348 374 418 504 686 860 1,1604 10.94 366 372 394 436 518 696 864 1,1365 10.61 332 340 364 410 490 666 830 1,116
Average 10.68 341 348 373 417 499 678 848 1,1374.2 X 10A7 Rads
1 10.51 316 324 350 398 482 660 828 1,1162 10.59 320 328 356 400 480 654 828 1,1003 10.60 342 348 370 414 500 678 846 1,1344 10.57 332 340 362 406 488 666 830 1,1125 10.62 330 338 364 -408 492 672 844 1,146
Average 10.58 328 336 360 405 488 666 835 1,1227 X 10A7 Rads
1 10.57 330 336 360 402 484 660 824 1,0902 10.61 324 334 360 406 492 668 844 1,1403 10.60 326 332 360 404 488 664 830 1,1164 10.63 336 I 344 | 368 410 490 668 | 832 1,0945 10.77 348 358 380 420 500 670 824 1,090
Average 10.64 333 341 366 408 491 666 831 1,1062 X 10^8 Rads
1 10.62 330 340 366 406 490 672 840 1,1322 10.89 358 368 388 430 518 696 856 1,1263 10.64 360 364 386 428 510 680 840 1,0904 10.66 352 I 360 386 430 518 692 860 1,1305 10.65 334 348 | 376 416 500 670 826 1,084
Average 10.76 347 1 356 1 380 422 507 682 844 1,112
iI
iI
Iij
i
1/10/95
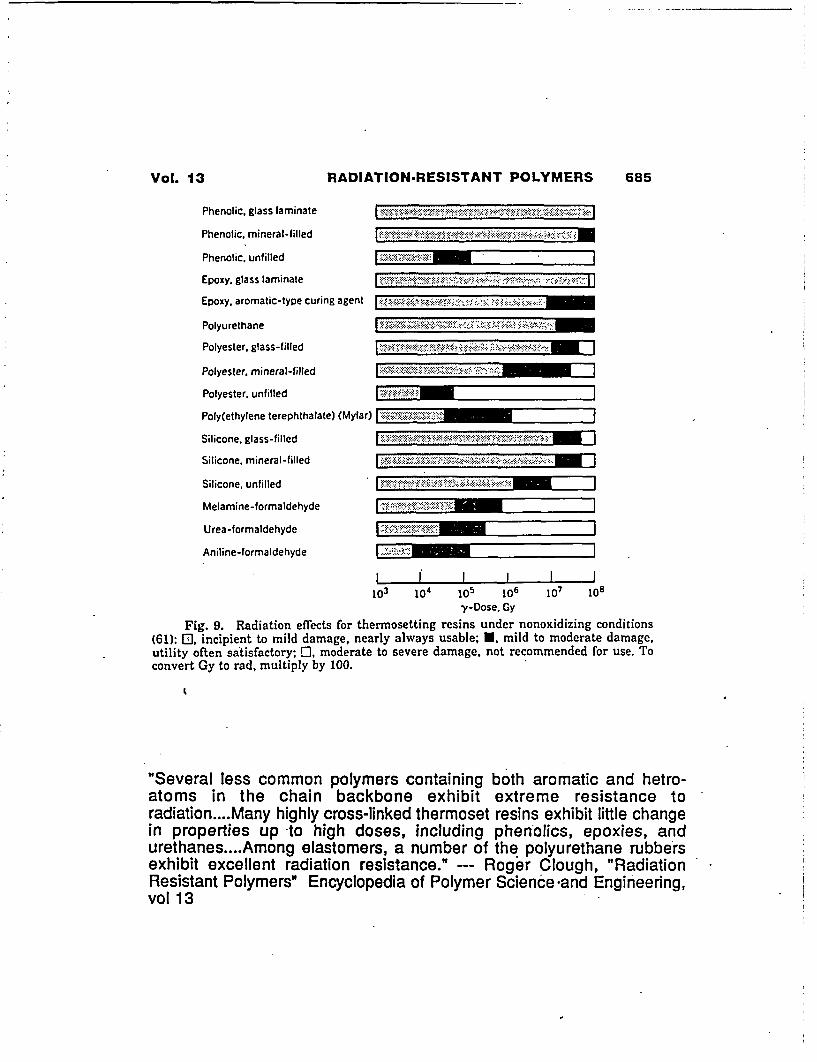
Vol. 1 3 RADIATION-RESISTANT POLYMERS 685
Phenolic, glass laminate
Phenolic, mineral-filled
Phenolic, unfilled
Epoxy, glass laminate
Epoxy, aromatic-type curing agent
.....:. .... ,........... ...... *... ... .. ... 4.*.
Polyurethane .-
Polyester, glass-filled
Polyester, mineral-filled
Polyester, unfilled
Poly(ethylene terephthalate) (Mylar)
Silicone, glass-filled
Silicone, mineral-filled
Silicone, unfilled O.,::=
Melamine-formaldehyde
Urea-formaldehyde
Aniline-formaldehyde _ ____ __
103 104 105 106 107 108
y-Dose. Gy
Fig. 9. Radiation effects for thermosetting resins under nonoxidizing conditions(61): t3, incipient to mild damage, nearly always usable; *, mild to moderate damage,utility often satisfactory; EO, moderate to severe damage, not recommended for use. Toconvert Gy to rad, multiply by 100.
"Several less common polymers containing both aromatic and hetro-atoms in the chain backbone exhibit extreme resistance toradiation....Many highly cross-linked thermoset resins exhibit little changein properties up -to high doses, including phenolics, epoxies, andurethanes....Among elastomers, a number of the polyurethane rubbersexhibit excellent radiation resistance." --- Roger Clough, "RadiationResistant Polymers" Encyclopedia of Polymer Sciencee-and Engineering,vol 13
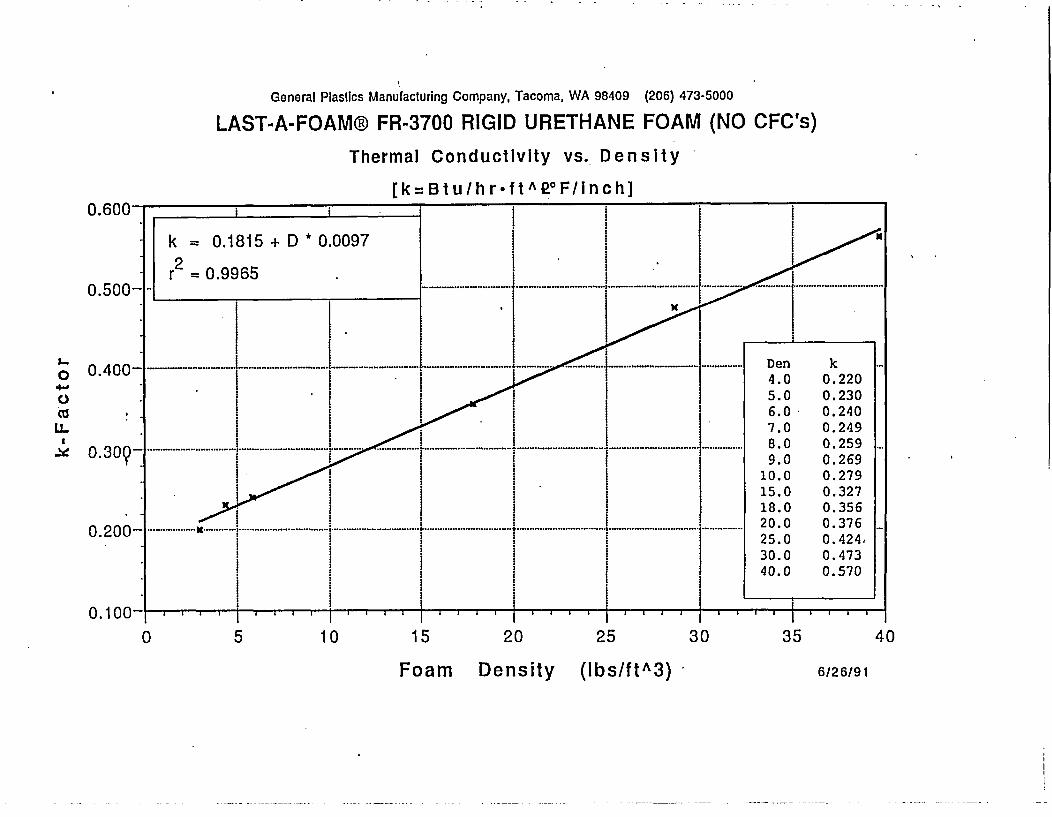
General Plastics Manufacturing Company, Tacoma, WA 98409 (206) 473-5000
LAST-A-FOAM® FR-3700 RIGID URETHANE FOAM (NO CFC's)
Thermal Conductivity vs. Density
[k= B t u / h r ft A F2nF/inch]0.600- _ e i
k = 0.1815 + D *0.00972 , .
r = 0.9965 .iI0.500- .... . ............. .... . . _ .......................................
.4- 4 0.220] } l5.0 0.230
U ,"- '|6.0 0.240LI- 7.0 0.249
0 3 . ....... ........... . . ... .. .. ...... . . .. 8.0250.309-- -- I- ------80.9I9.0 0.269
10.0 0.279, 15.0 0.327
. 18.0 0.3562. 20.0 0.376
25.0 0. 424,1 30.0 0.473
40.0 0.570
0.100- , ,, . , 1* | . 1 , .05 10 15 20 25 30 35 40
Foam Density (Ibs/ftA3) 66/2 6/9 1
GENERAL PLASTICS TE.EX 989i34MANUFACTURITNG COMPANY 'ey ! 26) 473-5104
MANUFA TURIN COMPANI-VTOLL. FIZEr FROMI
49r 0 BU RI.AN(GTO10 W1VAY/P.O. BOX 9C:97 s;atIle-nto'.reaTACONMAM VASIHIINGTOiS 94 (206) 623-2795
E0 YEARS OFd COMNT ''.%ErT (206) 473-5000fto) M'U2ALTY AND SERVICE
MATERIAL SAFE AT;'LAST-A-FOAM®) RIGiD QPOLYQURE , FE,"8i
PRODUCT NAME: LAST-A-FOAM® FR-3700
CHEMICAL FAMILY: Polyether polyurethane.
DESCRIPTION OF INGREDIENTS: The primary chemicals used to product LAST-A-FOAM®FR-3700, rigid polyurethane foams are polyphenylene polymethylene polyisocyanate(polymericisocyanate) and polyoxypropylene glycols (polyether polyols). These materials react toproduce a rigid polyether polyurethane foam. The catalyst system is reactive towards isocyanatesand becomes an integral part of the foam. The resulting foam is very inert chemically. There areno halogen containing flame retardants used and there is no trichloromonofluoromethane (Freon11) used in high density (15 to 40 lbs./ft.3) foams.
HEALTH HAZARD INFORMATION: LAST-A-FOAM® FR-3700 foams are chemicallyinert. Foam dust is generated in many operations and a dust collection system is normally used for asuitable work environment. Studies published by Upjohn in their Technical Bulletin No. 107 shovwno sensitization on skin contact with rigid polyurethane foam dust and the many years of experiencein cutting, planing, shaping, routing, and sanding rigid polyurethane foams at General PlasticsManufacturing Company is in agreement with these studies. The inhalation of foam dust, as with anydust, should be avoided. The studies by Upjohn show no inhalation problems which are peculiar topolyurethane foam dust. Normal protective equipment, such as gloves, eye goggles and masks, whichmechanically filter the dust, may be necessary In operations where large amounts of dust aregenerated.
The possibility exists that individuals who are very sensitive to isocyanates may also besensitive to the reacted foam. Should this be the case, these individuals need to be assigned to anarea which does not have polyurethane foam.
FIRE HAZARD INFORMATION: LAST-A-FOAM® FR-3700 foams are flame resistant.However, like all organic materials, they will burn in the presence of sufficient heat and oxygen.Precautions similar to those for protecting wood products from a fire hazard should be followed.Temperatures above 6000F are required for ignition to occur with a spark. ShouldLAST-A-FOAM® FR-3700 foams become involved In a fire, they will not melt and will form achar on the outside of the foam. Standard extinguishing materials such as water, C0 2, and drychemicals are all effective. In a large scale fire, self-contained breathing units may be necessarydue to lack of oxygen and smoke, as with most fires.
Polyurethane foam dust, like most dusts, can present an explosion risk. However, the dustcollection system -necessary for a suitable work environment is more than adequate to eliminate thisrisk. General Plastics Manufacturing Company has many years of experience in cutting, planing,shaping, routing and sanding LAST-A-FOAM® polyurethane foam made with polymericisocyanateand never have had any fire or explosion hazards or problems as a result of suitable dustcollection.
1991 SMALL BUSINESS SUBCONTRACTOR OF THE YEAR FOR U.S. SMALL BUSINESS AD;1INISTRATION REGION X
MANUFACTURERS AND MOLDERS OF LAST-A-FOAMS HIGH DENSITY RIGID AND FLEXIBLE IOLYURETHANE FOAMSAND FABRICATORS OF PLASTIC SHEETS FOR AIRCRAFT, INDUSTRIAL, CONSTRUCTION, MARINE, NUCLEAR, SHIPPING AND MODELING

3/16/92 prepared by Chem Lab
MATERIAL SAFETY DATA SHEET Eorm ApprovedIBureau Budget No. 4S-PRO338
MANUFACTURER'S NAME AND FSCM (Federal Supply Code for Manufacturers)
GENERAL PLASTICS MANUFACTURING COMPANYEMERGENCY PHONE NO.
1(206) 473-5000ADDRESS (Number, Street, City, State, and ZIP Code)
4910 BURLINGTON WAY, TACOMA, WASHINGTON 98409
z0
P.UuJ
CHEMICAL NAME AND SYNONYMS ITR DE NAME AND SYNONYMS
POLYURETHANE FOAM LAST-A-FOAMs FR-3700*CHEMICAL FAMILY FORMULA
POLYETHER POLYURETHANE* PROPRIETARY.FEDERAL STOCK NUMBER (FSIV) VROStStWtEIGT'iT IJBS TS ndcDEa PAKAGE DIMENSIONS (Inches)
Idensitin ounds/cubic fA-t
FLAMMABILITY n HEALTH n REACTIVITY n SPECIFIC HAZARD °
PAINTS, PRESERVATIVES,AND SOLVENTS %
THRESHOLDLIMIT VALUE
(Units)ALLOYS AND METALLIC COATINGS %0
THRESHOLDLIMIT VALUE
(Units)
zW0W
L)zU)
00
a
-'C
z0
Uw%4
PIGMENTS N/A BASE METAL N/A
CATALYST N/A ALLOYS N/A
VEHICLE N/A METALLIC COATINGS N/A
FILLER METALSN/A PLUS COATING OR CORE FLUX
ADDITIVES N/A OTHERS
OTHERS
HAZARDOUS MIXTURES OF OTHER LlQUIDS. SOLIDS, OR GASES . THRESHOLU*POLYETHER POLYURETHANE NA (Units)
NOTE: Theprimary chemicals used to produce LAST-A-FOAW FR-3700are methyleneJiisocyanate and polymethylene polyDhenylisocyanate (oolymeric i socyanate) reactedqithpolyetherpolyol. These chemicals react completely to producea rigid polyether,olyurethane foam. The resulting polyetherpolyurethanefoamis veryinert chemically.rhereisno trichloromonofluoromethane(freon 11) usedin high density (10 to 40Ib./ft.3) LAST-A-FOAM FR-3700. TSCA inventory: All componentsused to prepare-AST-A-FOAMO FR-3700 arelisted with theEPA-Toxic Substance Control Act.
BOILING POINT (F)N/A SPECIFIC GRAVITY (120=1) . 05 to .60*
_ . VAPOR PRESSURE (mm HA.) PRECENT VOLATILE* N/A BY VOLUME (7) N/A
VAPOEVAPORATION RATE0 VAPOR DENSITY (AIR =1) N/A E V APORATION RE N/A
S OLUBILITY IN WATER Not Soluble . N/A
APPEARANCE AND ODOR
Light brown colored rigid foam, no odor.FLASH POINT (Method used) FLAMMABLE LOWER EXPLOSIVE LIMIT UPPER EXPLOSIVE LIMIT
a>600F, Similar to Cleveland Open Cup LIMITS N/A N/A
WC EXTINGUISHING MEDIA Water, COz, dry chemical, foam. FR-3700 is self extinguishing in burn tests, itw will burn if combustion is forced by other flammable materials.
U. N.CSPECIAL FIRE FIGHTING PROCEDURES
Self-Contained Breathing Units should be used, particularly inside buildings.oZ UNUSUAL FIRE AND EXPLOSION HAZARDS
U X NoneWoW
1
-i
.I
-Ii .4..
DD FORM 1813 S/N 0102-026-1080PLATE NO. 22473 (FRONT)
... ..
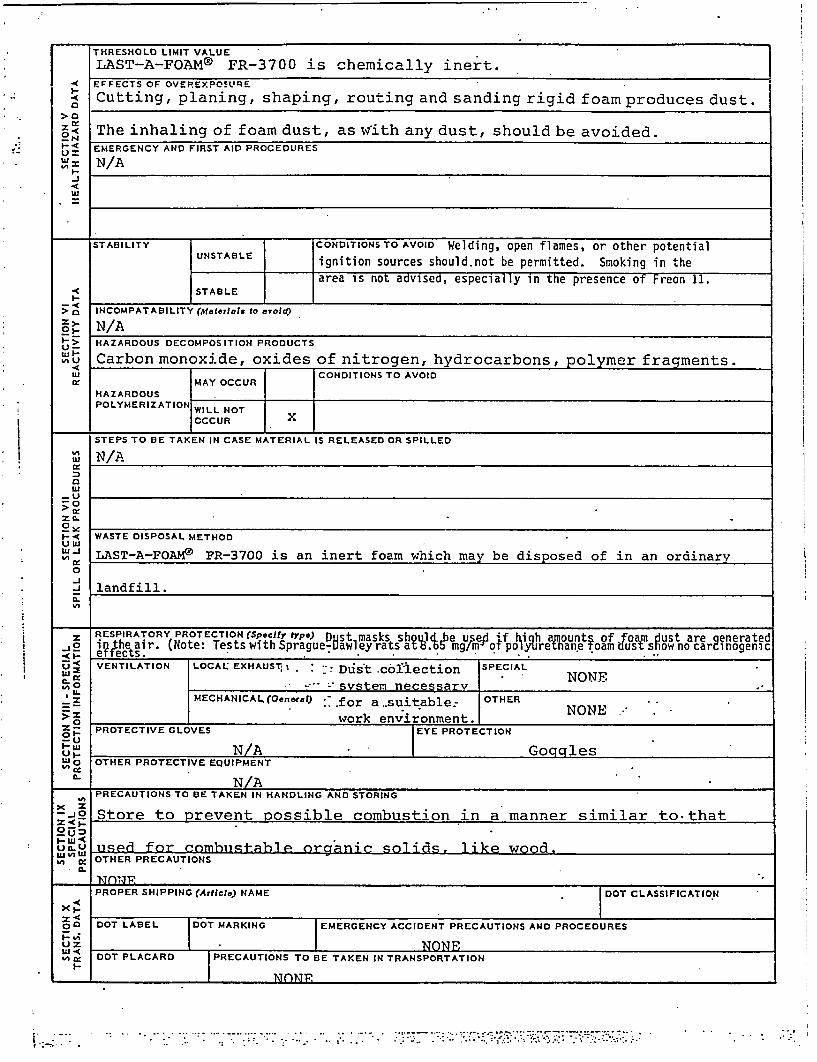
I-0
>0z cc:
ON
U) X
-j
wl
THRESHOLD LIMIT VALUE
LAST-A-FOAM® FR-3700 is chemically inert.EFFECTS OF OVEREXPOSURE
Cutting, planing, shaping, routing and sanding rigid foam produces dust.
The inhaling of foam dust, as with any dust, should be avoided.EMERGENCY AND FIRST AID PROCEDURES
N/A
I;-C>0
I- >U0-V1L
&' U
STABILITY CONDITIONSTO AVOID Welding, open flames, or other potentialUNSTABLE ignition sources should.not be permitted. Smoking in the
area is not advised, especially in the presence of Freon 11.STABLE
INCOMPATABILITY (Mateoials to avoid)
N/AHAZARDOUS DECOMPOSITION PRODUCTS
Carbon monoxide, oxides of nitrogen, hydrocarbons, polymer fragments.
MAY OCCUR l
HAZARDOUS _________
POLYMERIZATION WILL NOT
OCCUR x
CONDITIONS TO AVOID
-, a a aSTEPS TO BE TAKEN IN CASE MATERIAL IS RELEASED OR SPILLED
I N/A
I'
%nw
0vlQ:-o
be~_ -C
oww-j
0-J
-J
0.I-,
WASTE DISPOSAL METHOD
LAST-A-FOAMW FR-3700 is an inert foam which may be disposed of in an ordinary
landfill.
RESPIRATORY PROTECTION (Specify trPe) D st masks sh eue u? fj °e itheair. (Note: Tests withSprague-7awley ratsa II fp am %owono.carenogenici t:VENTILATION LOCAL EXHAUST. : col iection SPECIAL NONE
0o- system necessarv.MECHANICAL(General) .for a..suitable: OTHER
work environment. N- PROTECTIVE GLOVES EYE PROTECTION
i N/A Gogglestul OTHER PROTECTIVE EQUIPMENT
N/APRECAUTIONS TO BE TAKEN IN HANDLING AND STORING
-,o Store to prevent possible combustion in a manner similar to that
anycspd for comhiiF-tahle organic solids, like wood.Ill% IUII OTHER PRECAUTIONS0.
PROPER SHIPPING (Article) NAME DOT CLASSIFICATION
00 DOT LABEL DOT MARKING EMERGENCY ACCIDENT PRECAUTIONS AND PROCEDURES
IX DOT PLACARD PRECAUTIONS TO BE TAKEN IN TRANSPORTATION
NOM
.. . . ..... . ... . . . .: ' .- .- :.