generalized model of real-time deformation measurements
TRANSCRIPT
1436 Technical Gazette 27, 5(2020), 1436-1443
ISSN 1330-3651 (Print), ISSN 1848-6339 (Online) https://doi.org/10.17559/TV-20190222151357 Original scientific paper
Generalized Model of Real-Time Deformation Measurements and its Experimental Verification
Milan VRTUNSKI*, Miro GOVEDARICA, Aleksandar RISTIĆ, Željko BUGARINOVIĆ, Mirko BORISOV
Abstract: Technology development enabled real-time monitoring of terrain and artificial structures through the use of the systems comprised of geodetic and geotechnical sensors. Although the structure and the architecture of those systems can vary, they have many common features: automated measurements which provide monitoring and alarming when tolerances are exceeded, systems robustness involving hot-swapping sensors, its redundancy and error detection. Also, they can be structured and configured to achieve desired functionality and performance. Generalized model of real-time deformation measurements, presented in this paper, involves these common characteristics. The model is presented as a flowchart, and later applied within an experiment carried out in laboratory environment. The established system includes geodetic and geotechnical sensors and measurements are done on a physical model of a landslide. Several functions included in generalized model were implemented in the experiment. Results show that system designed using the proposed model can provide required functionality, accuracy, robustness and configurability. Aim of the paper is to propose a general procedure which, with minor modifications, can be applied as a starting point in designing various systems for monitoring landslides, bridges, high buildings etc., and which overcomes some limitations that can be found in commercial software solutions. Keywords: deformation monitoring; geodetic survey; geotechnical survey; landslides; sensors 1 INTRODUCTION
Monitoring of natural hazards and man-made structures is essential in preventing material damage, environmental degradation and human casualties. Earlier it has been performed in two ways: by geodetic survey with periods of several months between measurements or by using in-situ geotechnical sensors. Systems for real-time monitoring are comprised of sensors, communication devices and one or more computers. Sensors can be geodetic (robotic total stations, GNSS receivers, digital levels), geotechnical (tiltmeters, piezometers, extensometers, accelerometers, strain gauges etc.) and meteorological sensors (thermometers, wind speed sensors, rain gauges…). Some auxiliary sensors are often used as well. Sensors are connected to computers by lines or by wireless communication. Communication devices enable connection of sensors using different standards. Software installed on computers is used to configure and manage the measurements and to alarm if a triggering event occurs [1].
Due to many advantages of these systems they have a wide range of applications. One large group of applications is monitoring of man-made structures. Wong presented their application in monitoring of cable supported bridges [2], Kopáčik et al. described automated measurement systems based mainly on geodetic sensors for monitoring several bridges [3], while Chae et al. showed a wireless sensor network for suspension bridge monitoring [4]. Various geodetic and geotechnical sensors, as shown in [5] can be integrated to monitor dams. ALERT, an automated real-time monitoring system installed on an earth-filled dam is presented in [6]. System for dam deformation monitoring based on robotic total stations, GNSS, water level sensor and video cameras is described in [7]. In [8] two experiments in which tall building and monument are monitored, while an application of a network of wireless sensors to monitor various risks in building induced by natural and artificial hazards is presented in [9]. Design of an integrated system for high-building monitoring based on GNSS sensors, tiltmeters and accelerometers is described
in [10]. Importance of monitoring in tunneling is explained in [11] and systems for real-time monitoring of tunnels are presented in [12] and [13]. Other man-made structures like wind turbines [14] can also be monitored in real time.
Systems for real-time monitoring are also used to monitor natural hazards. These systems are used to monitor volcanos [15, 16], integrated with seismic sensors they are used for earthquake monitoring [17], but the majority of applications is unstable terrain monitoring, such as landslides and other types of slope processes [18, 19].
This paper deals with the real-time monitoring systems. A universal description of these systems is proposed, called generalized model of real-time deformation measurements. Its purpose is to represent a system in a general manner and thus to serve as a root in system design done in top-down fashion. 2 GENERALIZED MODEL OF REAL-TIME DEFORMATION
MEASUREMENTS
Although each system for real-time monitoring is unique, i.e. it is designed for specific case, there are many properties that are common and therefore can be considered general [18]. Also, a sequence of stages in a lifetime of such system forms a procedure which can be considered a generalized model of real-time deformation measurements.
Architecture of real-time monitoring systems consists of four components (Fig. 1): 1. Acquisition - involves sensors that are used to measure deformation and other quantities of interest. This component depends on the object that is being monitored the most, both in terms of types of selected sensors and in their positions. In case of robotic total stations, that are the most used geodetic sensors, the majority of prisms is placed on the structure or in the expected zone of deformation, while the rest of them is in the zone where no deformation is expected. This way not only deformations can be monitored but false alarms and errors in measurements can be detected, sensor failures, as well as the expansion of deformation zone. Although not installed

Milan VRTUNSKI et al.: Generalized Model of Real-Time Deformation Measurements and its Experimental Verification
Tehnički vjesnik 27, 5(2020), 1436-1443 1437
in the vicinity of monitoring location, a network of permanent GNSS stations can be a part of acquisition component. Its role is to provide a stable reference frame for geodetic measurements which increases the level of reliability of obtained results. Geotechnical sensors are placed in the zone of expected deformation, very rarely outside of it. 2. Communication - provides data transfer from sensors to computers in the system. Architecture of this component depends on the types of used sensors, their number and on the terrain topology and relief. Both cable and wireless connections are used, with signals that can be analog or digital. Communication component has to fulfill several requirements: - Connections have to be robust, i.e. protected from
physical damage and without interference - Two-way communication must be provided - Delay has to be minimal - Every interruption of communication has to be
detected. 3. Processing - hardware and software that receive data
from sensors, store, process and visualize them. Depending on the size of the system this component can contain one or more computers, sometimes spatially distributed. There
are computers for monitoring applications, with specialized hardware and software that can be installed in the field in order to minimize the distance to sensors.
4. Distribution - hardware and software that provides data to users. This component often consists of web-based solutions. Hardware includes computers and communication devices used for data transfer over the internet (modems, routers, etc.). In smaller systems, all the software, for both processing and distribution, is installed and run on one computer. In larger systems, computer network is used. Since the system has to provide timely information on critical events, reliability is the most important criteria in network design.
Figure 1 Architecture of a real-time monitoring system
Figure 2 Flowchart of generalized model of real-time deformation measurements

Milan VRTUNSKI et al.: Generalized Model of Real-Time Deformation Measurements and its Experimental Verification
1438 Technical Gazette 27, 5(2020), 1436-1443
The main purpose of real-time monitoring system is to obtain measurements that are done in automated manner and also to meet the criteria in terms of functionality, reliability, accuracy, flexibility and robustness. Considering that, it is very important to perform preparation steps carefully and thus obtain required properties of the system.
Steps in designing and functioning of the systems can be roughly divided into three groups: 1. Planning and designing of architecture components.
These steps are not automated; 2. Establishing of designed architecture, i.e. system
installation; 3. Exploitation of the system, i.e. conducting real-time
measurements, which is done automatically. Planning and designing steps are done based on the
knowledge of the object being monitored and the capabilities and properties of technology. These steps involve the definition of elements of acquisition component (measured values, selection of sensors, locations of sensors, definition of tolerances, measuring intervals, limit values, etc.), communication component (types of communication, protocols, etc.), processing (computers, software, actions triggered by limits and alarms, error checking procedures, data analyses methods) and distribution (user roles and privileges, data storage, remote access capabilities). System installation involves activities such as placing sensors, connecting them, software installation and configuration and system testing. As it was mentioned before, measurements are done automatically, but some activities, such as zero-series measurements and the maintenance are exceptions.
Since the real-time deformation measurements in this paper are considered to be a procedure, a general model is represented in a flowchart with blocks representing mentioned activities (Fig. 2). It has to be mentioned that some activities not strictly related to measurements have to be taken into consideration when designing such systems (e.g. burglary or damage protection). Since this generalized model is oriented to measurements, these activities are not included.
It can be noticed that proposed general model is very simple in describing performed measurements, when no alarm occurs. That is due to the fact that no other actions than measuring are necessary, except for checking whether the interval between two series is passed or not. Also, maintenance interval has to be checked as well, but very often it is done manually, or the software built in instruments offers that functionality, therefore this is not included in this model.
The most diverse part of the model is the description of occurrence of the alarm. Alarm can occur due to various reasons: measured value is above the limit, measurement out of range, prism cannot be found by the total station, no signal from sensor, burglary sensor activated etc. Many scenarios are possible and including the detailed model for each one into general model is not possible. 3 EXPERIMENTAL WORK
An implementation of the generalized model of deformation measurements was done through the experiment conducted in laboratory environment. A
system which included geodetic and geotechnical sensors, as well as software for deformation measurement was designed (Fig. 3). Measurements were done on a physical model that was designed in a way to simulate movements on the slope, such as on landslide, for instance (Fig. 4). Physical model is comprised of a 150 × 125 cm panel with a slope of approximately 22° angle, on which five monitoring prisms were mounted. The lower prisms (prisms 4 and 5) are mounted 25 cm from the lower edge of the panel and 25 cm from side edges, while the upper prisms (1 and 2) are 20 cm from the upper edge and 20 cm from side edges. The middle prism (prism 3) is located 70 cm from the left edge and 55 cm from the upper edge. Prisms were attached to the panel with a sticky tape, so they could be moved between the series of measurements. Tapes with marks at every 5 mm were placed next to the prisms so the movements of the prisms could be determined in both directions with respect to the panel's sides (Fig. 5a). The sixth prism was not placed on the panel but in its vicinity, representing fixed point outside of the zone of expected deformations. This prism was used to detect errors in measurements.
Figure 3 Scheme of implemented real-time deformation monitoring system
Figure 4 Physical model of slope movements (dimensions in centimeters)
Also, a tiltmeter Geokon 6160 was mounted in a
manner which enables measuring the changes in inclination. This is biaxial tiltmeter (measures angle in two orthogonal planes) built in MEMS technology (Micro Electro Mechanical Sensor), capable to measure angles in a range from −15° to +15°, with accuracy of ±2". Similar to prisms, it was mounted so that displacements along and across the panel could be given. One plate was placed on the panel, and the tiltmeter was mounted on a bar tightly going through the hole on the plate which is approximately 75 cm from the left edge and 40 cm from the upper edge (Fig. 5b). Next to the edges of the plate two tapes with marks at every 5 mm were placed to determine the
Milan VRTUNSKI et al.: Generalized Model of Real-Time Deformation Measurements and its Experimental Verification
Tehnički vjesnik 27, 5(2020), 1436-1443 1439
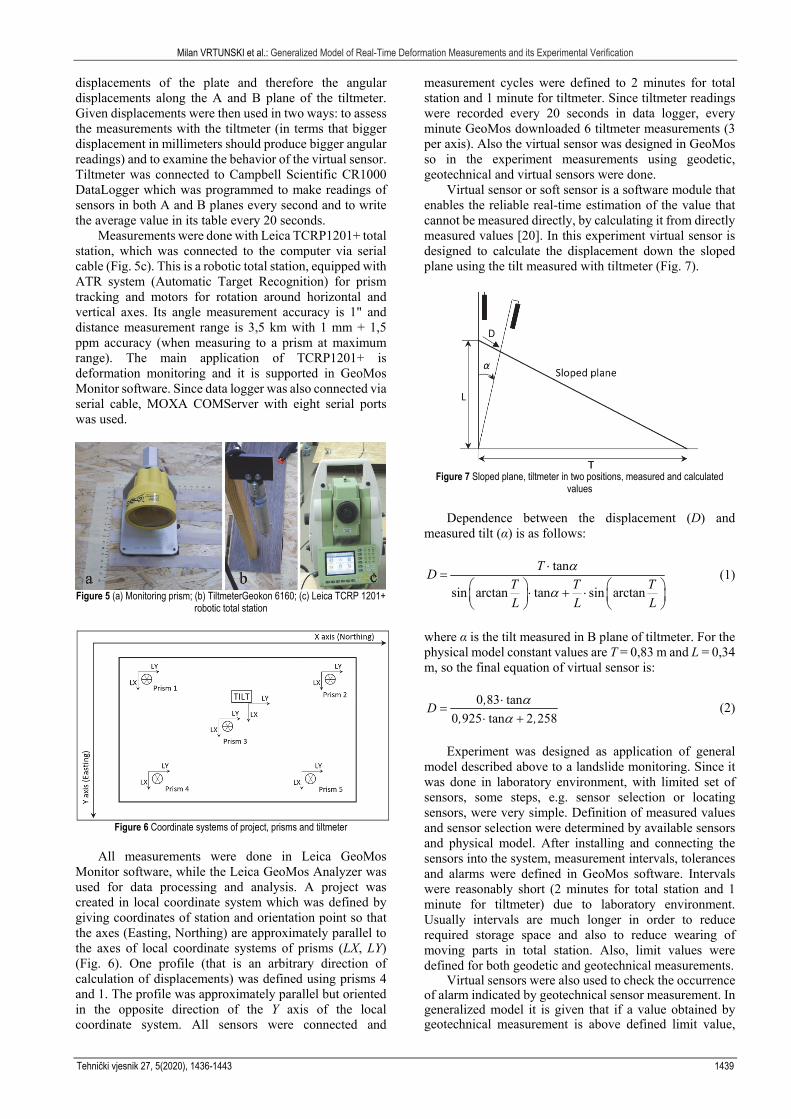
displacements of the plate and therefore the angular displacements along the A and B plane of the tiltmeter. Given displacements were then used in two ways: to assess the measurements with the tiltmeter (in terms that bigger displacement in millimeters should produce bigger angular readings) and to examine the behavior of the virtual sensor. Tiltmeter was connected to Campbell Scientific CR1000 DataLogger which was programmed to make readings of sensors in both A and B planes every second and to write the average value in its table every 20 seconds.
Measurements were done with Leica TCRP1201+ total station, which was connected to the computer via serial cable (Fig. 5c). This is a robotic total station, equipped with ATR system (Automatic Target Recognition) for prism tracking and motors for rotation around horizontal and vertical axes. Its angle measurement accuracy is 1" and distance measurement range is 3,5 km with 1 mm + 1,5 ppm accuracy (when measuring to a prism at maximum range). The main application of TCRP1201+ is deformation monitoring and it is supported in GeoMos Monitor software. Since data logger was also connected via serial cable, MOXA COMServer with eight serial ports was used.
Figure 5 (a) Monitoring prism; (b) TiltmeterGeokon 6160; (c) Leica TCRP 1201+
robotic total station
Figure 6 Coordinate systems of project, prisms and tiltmeter
All measurements were done in Leica GeoMos
Monitor software, while the Leica GeoMos Analyzer was used for data processing and analysis. A project was created in local coordinate system which was defined by giving coordinates of station and orientation point so that the axes (Easting, Northing) are approximately parallel to the axes of local coordinate systems of prisms (LX, LY) (Fig. 6). One profile (that is an arbitrary direction of calculation of displacements) was defined using prisms 4 and 1. The profile was approximately parallel but oriented in the opposite direction of the Y axis of the local coordinate system. All sensors were connected and
measurement cycles were defined to 2 minutes for total station and 1 minute for tiltmeter. Since tiltmeter readings were recorded every 20 seconds in data logger, every minute GeoMos downloaded 6 tiltmeter measurements (3 per axis). Also the virtual sensor was designed in GeoMos so in the experiment measurements using geodetic, geotechnical and virtual sensors were done.
Virtual sensor or soft sensor is a software module that enables the reliable real-time estimation of the value that cannot be measured directly, by calculating it from directly measured values [20]. In this experiment virtual sensor is designed to calculate the displacement down the sloped plane using the tilt measured with tiltmeter (Fig. 7).
Figure 7 Sloped plane, tiltmeter in two positions, measured and calculated
values
Dependence between the displacement (D) and measured tilt (α) is as follows:
tan
sin arctan tan sin arctan
TD
T T T
L L L
(1)
where α is the tilt measured in B plane of tiltmeter. For the physical model constant values are T = 0,83 m and L = 0,34 m, so the final equation of virtual sensor is:
0 83 tan
0 925 tan 2 258
,D
, ,
(2)
Experiment was designed as application of general
model described above to a landslide monitoring. Since it was done in laboratory environment, with limited set of sensors, some steps, e.g. sensor selection or locating sensors, were very simple. Definition of measured values and sensor selection were determined by available sensors and physical model. After installing and connecting the sensors into the system, measurement intervals, tolerances and alarms were defined in GeoMos software. Intervals were reasonably short (2 minutes for total station and 1 minute for tiltmeter) due to laboratory environment. Usually intervals are much longer in order to reduce required storage space and also to reduce wearing of moving parts in total station. Also, limit values were defined for both geodetic and geotechnical measurements.
Virtual sensors were also used to check the occurrence of alarm indicated by geotechnical sensor measurement. In generalized model it is given that if a value obtained by geotechnical measurement is above defined limit value,
Milan VRTUNSKI et al.: Generalized Model of Real-Time Deformation Measurements and its Experimental Verification
1440 Technical Gazette 27, 5(2020), 1436-1443
this alarm state can be checked by conducting a geodetic measurement. In this experiment, if a value measured by tiltmeter is above the limit, next measurement on the prism closest to the tiltmeter (prism 3) is used to check whether it was true alarm state or an error occurred. If the displacement of prism is within very small, given limits, it means that the error occurred. Otherwise, the movement is present and the alarm state indicated by tiltmeter is true. It is done by creating a virtual sensor (GeoT_EC) which returns the value 10 if the displacement of prism 3 is very small and angular value above the limit. In all other cases, virtual sensor returns value 0 meaning that either there is no alarm state (if angular value is below the limit) or the alarm state is true. Value 10 will be above the limit set for this virtual sensor, so the warning message will appear in Messages tab of GeoMos Monitor software.
4 RESULTS
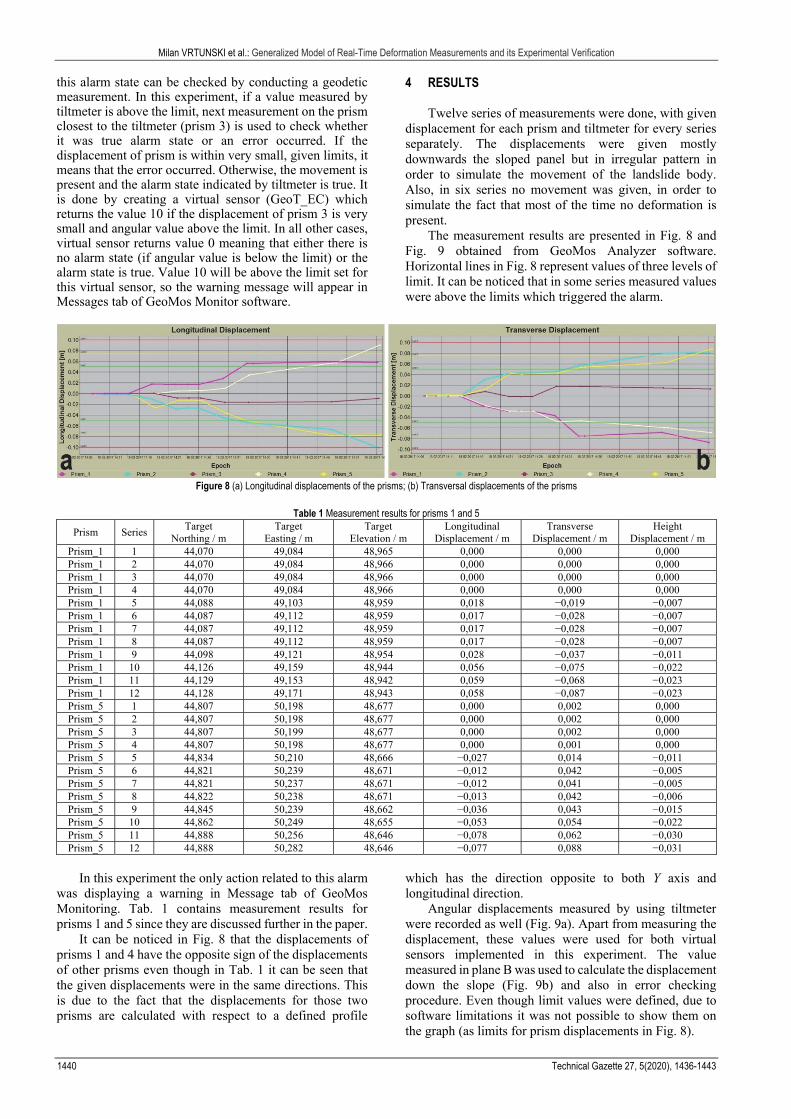
Twelve series of measurements were done, with given displacement for each prism and tiltmeter for every series separately. The displacements were given mostly downwards the sloped panel but in irregular pattern in order to simulate the movement of the landslide body. Also, in six series no movement was given, in order to simulate the fact that most of the time no deformation is present.
The measurement results are presented in Fig. 8 and Fig. 9 obtained from GeoMos Analyzer software. Horizontal lines in Fig. 8 represent values of three levels of limit. It can be noticed that in some series measured values were above the limits which triggered the alarm.
Figure 8 (a) Longitudinal displacements of the prisms; (b) Transversal displacements of the prisms
Table 1 Measurement results for prisms 1 and 5
Prism Series Target
Northing / m Target
Easting / m Target
Elevation / m Longitudinal
Displacement / m Transverse
Displacement / m Height
Displacement / m Prism_1 1 44,070 49,084 48,965 0,000 0,000 0,000 Prism_1 2 44,070 49,084 48,966 0,000 0,000 0,000 Prism_1 3 44,070 49,084 48,966 0,000 0,000 0,000 Prism_1 4 44,070 49,084 48,966 0,000 0,000 0,000 Prism_1 5 44,088 49,103 48,959 0,018 −0,019 −0,007 Prism_1 6 44,087 49,112 48,959 0,017 −0,028 −0,007 Prism_1 7 44,087 49,112 48,959 0,017 −0,028 −0,007 Prism_1 8 44,087 49,112 48,959 0,017 −0,028 −0,007 Prism_1 9 44,098 49,121 48,954 0,028 −0,037 −0,011 Prism_1 10 44,126 49,159 48,944 0,056 −0,075 −0,022 Prism_1 11 44,129 49,153 48,942 0,059 −0,068 −0,023 Prism_1 12 44,128 49,171 48,943 0,058 −0,087 −0,023 Prism_5 1 44,807 50,198 48,677 0,000 0,002 0,000 Prism_5 2 44,807 50,198 48,677 0,000 0,002 0,000 Prism_5 3 44,807 50,199 48,677 0,000 0,002 0,000 Prism_5 4 44,807 50,198 48,677 0,000 0,001 0,000 Prism_5 5 44,834 50,210 48,666 −0,027 0,014 −0,011 Prism_5 6 44,821 50,239 48,671 −0,012 0,042 −0,005 Prism_5 7 44,821 50,237 48,671 −0,012 0,041 −0,005 Prism_5 8 44,822 50,238 48,671 −0,013 0,042 −0,006 Prism_5 9 44,845 50,239 48,662 −0,036 0,043 −0,015 Prism_5 10 44,862 50,249 48,655 −0,053 0,054 −0,022 Prism_5 11 44,888 50,256 48,646 −0,078 0,062 −0,030 Prism_5 12 44,888 50,282 48,646 −0,077 0,088 −0,031
In this experiment the only action related to this alarm
was displaying a warning in Message tab of GeoMos Monitoring. Tab. 1 contains measurement results for prisms 1 and 5 since they are discussed further in the paper.
It can be noticed in Fig. 8 that the displacements of prisms 1 and 4 have the opposite sign of the displacements of other prisms even though in Tab. 1 it can be seen that the given displacements were in the same directions. This is due to the fact that the displacements for those two prisms are calculated with respect to a defined profile
which has the direction opposite to both Y axis and longitudinal direction.
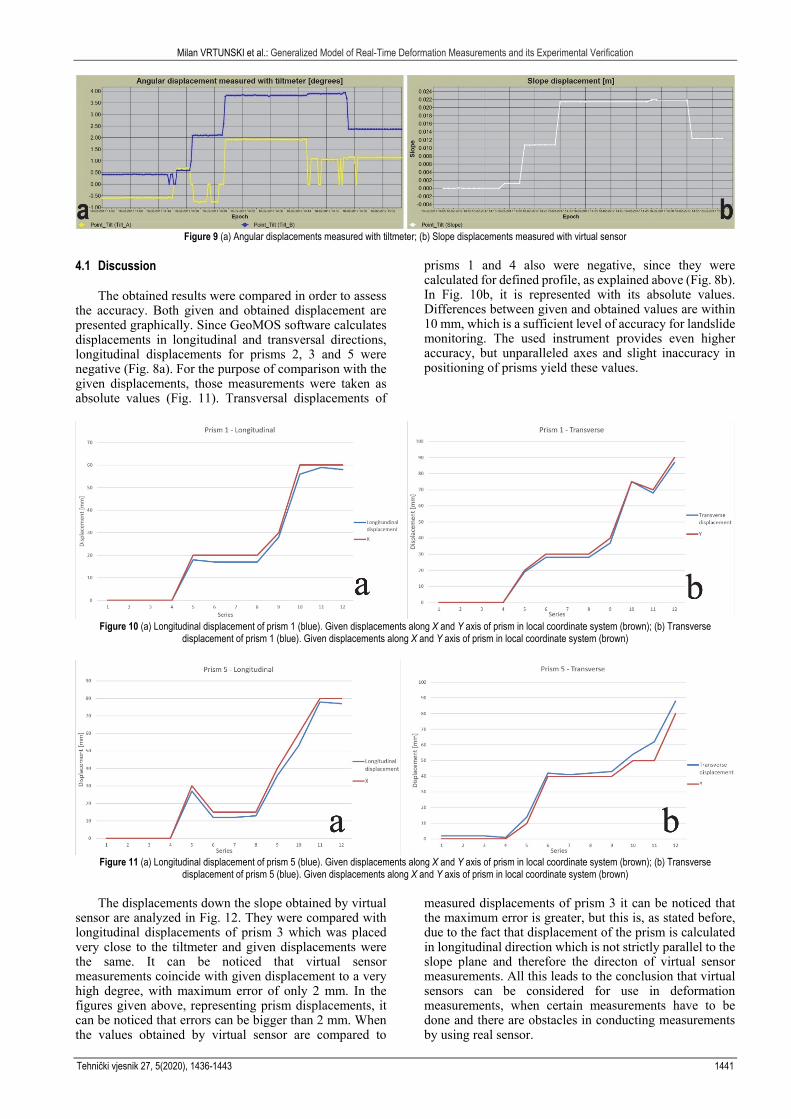
Angular displacements measured by using tiltmeter were recorded as well (Fig. 9a). Apart from measuring the displacement, these values were used for both virtual sensors implemented in this experiment. The value measured in plane B was used to calculate the displacement down the slope (Fig. 9b) and also in error checking procedure. Even though limit values were defined, due to software limitations it was not possible to show them on the graph (as limits for prism displacements in Fig. 8).
Milan VRTUNSKI et al.: Generalized Model of Real-Time Deformation Measurements and its Experimental Verification
Tehnički vjesnik 27, 5(2020), 1436-1443 1441
Figure 9 (a) Angular displacements measured with tiltmeter; (b) Slope displacements measured with virtual sensor
4.1 Discussion
The obtained results were compared in order to assess the accuracy. Both given and obtained displacement are presented graphically. Since GeoMOS software calculates displacements in longitudinal and transversal directions, longitudinal displacements for prisms 2, 3 and 5 were negative (Fig. 8a). For the purpose of comparison with the given displacements, those measurements were taken as absolute values (Fig. 11). Transversal displacements of
prisms 1 and 4 also were negative, since they were calculated for defined profile, as explained above (Fig. 8b). In Fig. 10b, it is represented with its absolute values. Differences between given and obtained values are within 10 mm, which is a sufficient level of accuracy for landslide monitoring. The used instrument provides even higher accuracy, but unparalleled axes and slight inaccuracy in positioning of prisms yield these values.
Figure 10 (a) Longitudinal displacement of prism 1 (blue). Given displacements along X and Y axis of prism in local coordinate system (brown); (b) Transverse
displacement of prism 1 (blue). Given displacements along X and Y axis of prism in local coordinate system (brown)
Figure 11 (a) Longitudinal displacement of prism 5 (blue). Given displacements along X and Y axis of prism in local coordinate system (brown); (b) Transverse
displacement of prism 5 (blue). Given displacements along X and Y axis of prism in local coordinate system (brown)
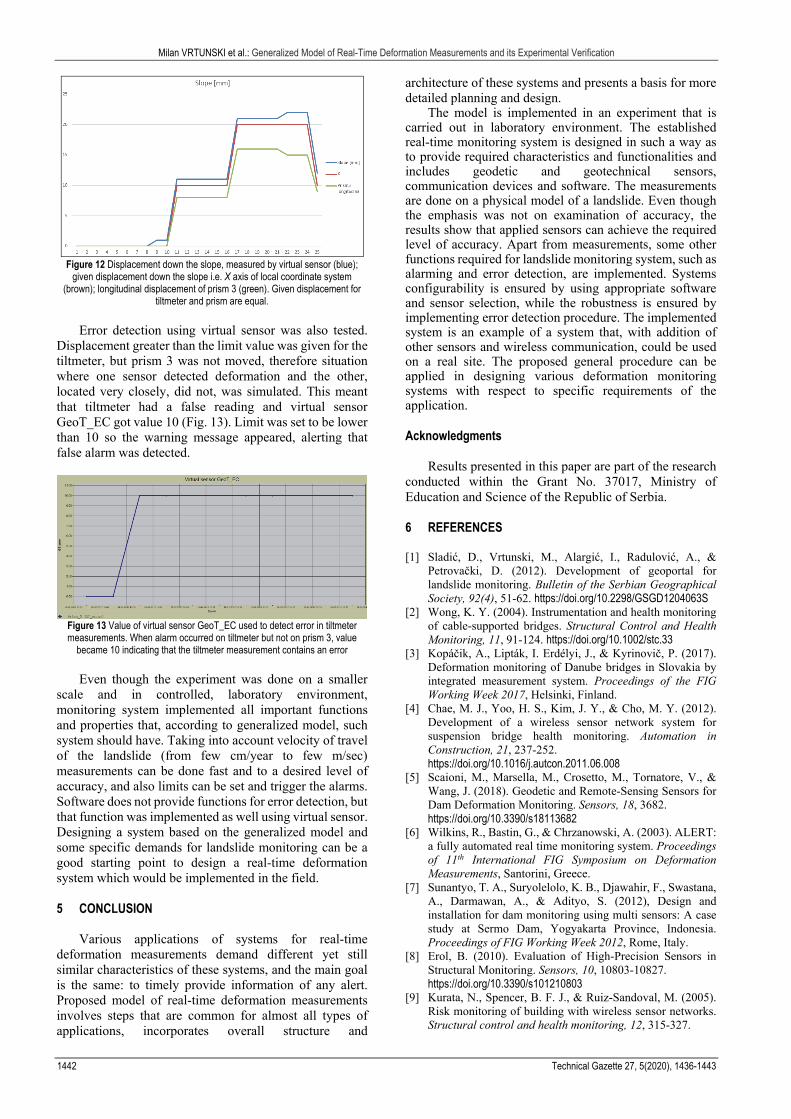
The displacements down the slope obtained by virtual sensor are analyzed in Fig. 12. They were compared with longitudinal displacements of prism 3 which was placed very close to the tiltmeter and given displacements were the same. It can be noticed that virtual sensor measurements coincide with given displacement to a very high degree, with maximum error of only 2 mm. In the figures given above, representing prism displacements, it can be noticed that errors can be bigger than 2 mm. When the values obtained by virtual sensor are compared to
measured displacements of prism 3 it can be noticed that the maximum error is greater, but this is, as stated before, due to the fact that displacement of the prism is calculated in longitudinal direction which is not strictly parallel to the slope plane and therefore the directon of virtual sensor measurements. All this leads to the conclusion that virtual sensors can be considered for use in deformation measurements, when certain measurements have to be done and there are obstacles in conducting measurements by using real sensor.
Milan VRTUNSKI et al.: Generalized Model of Real-Time Deformation Measurements and its Experimental Verification
1442 Technical Gazette 27, 5(2020), 1436-1443
Figure 12 Displacement down the slope, measured by virtual sensor (blue);
given displacement down the slope i.e. X axis of local coordinate system (brown); longitudinal displacement of prism 3 (green). Given displacement for
tiltmeter and prism are equal.
Error detection using virtual sensor was also tested. Displacement greater than the limit value was given for the tiltmeter, but prism 3 was not moved, therefore situation where one sensor detected deformation and the other, located very closely, did not, was simulated. This meant that tiltmeter had a false reading and virtual sensor GeoT_EC got value 10 (Fig. 13). Limit was set to be lower than 10 so the warning message appeared, alerting that false alarm was detected.
Figure 13 Value of virtual sensor GeoT_EC used to detect error in tiltmeter measurements. When alarm occurred on tiltmeter but not on prism 3, value
became 10 indicating that the tiltmeter measurement contains an error
Even though the experiment was done on a smaller scale and in controlled, laboratory environment, monitoring system implemented all important functions and properties that, according to generalized model, such system should have. Taking into account velocity of travel of the landslide (from few cm/year to few m/sec) measurements can be done fast and to a desired level of accuracy, and also limits can be set and trigger the alarms. Software does not provide functions for error detection, but that function was implemented as well using virtual sensor. Designing a system based on the generalized model and some specific demands for landslide monitoring can be a good starting point to design a real-time deformation system which would be implemented in the field.
5 CONCLUSION
Various applications of systems for real-time deformation measurements demand different yet still similar characteristics of these systems, and the main goal is the same: to timely provide information of any alert. Proposed model of real-time deformation measurements involves steps that are common for almost all types of applications, incorporates overall structure and
architecture of these systems and presents a basis for more detailed planning and design.
The model is implemented in an experiment that is carried out in laboratory environment. The established real-time monitoring system is designed in such a way as to provide required characteristics and functionalities and includes geodetic and geotechnical sensors, communication devices and software. The measurements are done on a physical model of a landslide. Even though the emphasis was not on examination of accuracy, the results show that applied sensors can achieve the required level of accuracy. Apart from measurements, some other functions required for landslide monitoring system, such as alarming and error detection, are implemented. Systems configurability is ensured by using appropriate software and sensor selection, while the robustness is ensured by implementing error detection procedure. The implemented system is an example of a system that, with addition of other sensors and wireless communication, could be used on a real site. The proposed general procedure can be applied in designing various deformation monitoring systems with respect to specific requirements of the application.
Acknowledgments
Results presented in this paper are part of the research conducted within the Grant No. 37017, Ministry of Education and Science of the Republic of Serbia.
6 REFERENCES [1] Sladić, D., Vrtunski, M., Alargić, I., Radulović, A., &
Petrovački, D. (2012). Development of geoportal for landslide monitoring. Bulletin of the Serbian Geographical Society, 92(4), 51-62. https://doi.org/10.2298/GSGD1204063S
[2] Wong, K. Y. (2004). Instrumentation and health monitoring of cable-supported bridges. Structural Control and Health Monitoring, 11, 91-124. https://doi.org/10.1002/stc.33
[3] Kopáčik, A., Lipták, I. Erdélyi, J., & Kyrinovič, P. (2017). Deformation monitoring of Danube bridges in Slovakia by integrated measurement system. Proceedings of the FIG Working Week 2017, Helsinki, Finland.
[4] Chae, M. J., Yoo, H. S., Kim, J. Y., & Cho, M. Y. (2012). Development of a wireless sensor network system for suspension bridge health monitoring. Automation in Construction, 21, 237-252. https://doi.org/10.1016/j.autcon.2011.06.008
[5] Scaioni, M., Marsella, M., Crosetto, M., Tornatore, V., & Wang, J. (2018). Geodetic and Remote-Sensing Sensors for Dam Deformation Monitoring. Sensors, 18, 3682. https://doi.org/10.3390/s18113682
[6] Wilkins, R., Bastin, G., & Chrzanowski, A. (2003). ALERT: a fully automated real time monitoring system. Proceedings of 11th International FIG Symposium on Deformation Measurements, Santorini, Greece.
[7] Sunantyo, T. A., Suryolelolo, K. B., Djawahir, F., Swastana, A., Darmawan, A., & Adityo, S. (2012), Design and installation for dam monitoring using multi sensors: A case study at Sermo Dam, Yogyakarta Province, Indonesia. Proceedings of FIG Working Week 2012, Rome, Italy.
[8] Erol, B. (2010). Evaluation of High-Precision Sensors in Structural Monitoring. Sensors, 10, 10803-10827. https://doi.org/10.3390/s101210803
[9] Kurata, N., Spencer, B. F. J., & Ruiz-Sandoval, M. (2005). Risk monitoring of building with wireless sensor networks. Structural control and health monitoring, 12, 315-327.

Milan VRTUNSKI et al.: Generalized Model of Real-Time Deformation Measurements and its Experimental Verification
Tehnički vjesnik 27, 5(2020), 1436-1443 1443
https://doi.org/10.1002/stc.73 [10] Kuckartz, J., Collier, P., & Hutchinson, G. (2011).The
Design of an Integrated Structural Monitoring System for a High-Rise Building Based on Tiltmeters and GNSS. Proceedings of Joint International Symposium on Deformation Monitoring, Hong Kong, China.
[11] Kavvadas, J. M. (2003), Monitoring and Modelling Ground Deformations During Tunneling. Proceedings of 11th International FIG Symposium on Deformation Measurements, Santorini, Greece.
[12] Tse, C. & Luk, J. (2011). Design and implementation of automatic deformation monitoring system for the construction of railway tunnel: a case study in west island line. Proceedings of FIG Joint International Symposium on Deformation Monitoring, Hong Kong, China.
[13] Zhang, C., Ni, Y., Zhou, L., & Wang, C. (2017). A New Railway Tunnel Deformation Monitoring System using FBG Bending Gauges. Proceedings of the 2017 World Congress on Advances in Structural Engineering and Mechanics (ASEM17), Seoul, Korea.
[14] Hesse, C., Heer, R., Horst, S., & Neuner, H. (2006) A concept for monitoring wind energy turbines with geodetic techniques. Proceedings of 3rd IAG/12th FIG Symposium, Baden, Germany.
[15] Puglisi, G., Bonaccorso, A., Mattia, M., Aloisi, M., Bonforte, A., Campisi, O., Cantarero, M., Falzone, G., Puglisi, B., & Rossi, M. (2005). New integrated geodetic monitoring system at Stromboli volcano (Italy). Engineering Geology, 79, 13-31. https://doi.org/10.1016/j.enggeo.2004.10.013
[16] Pingue, F., Troise, C., De Luca, G., Grassi, V., & Scarpa, R. (1998). Geodetic monitoring of Mt. Vesuvius Volcano, Italy, based on EDM and GPS surveys. Journal of Volcanology and Geothermal Research, 82, 151-160. https://doi.org/10.1016/S0377-0273(97)00062-0
[17] Tu, R., Zhang, P., Zhang, R., & Liu, J. (2016). The study of key issues about integration of GNSS and strong-motion records for real-time earthquake monitoring. Advances in Space Research, 58, 304-309. https://doi.org/10.1016/j.asr.2016.04.033
[18] Thuro, K., Singer, J., & Festl, J. (2013) A Geosensor Network Based Monitoring and Early Warning System for Landslides. Landslides Science and Practice, 2, 79-86. https://doi.org/10.1007/978-3-642-31445-2_10
[19] Hou, W., Lu, X., Wu, P., Xue, A., & Li, L. (2017). An Integrated Approach for Monitoring and Information Management of the Guanling Landslide (China). ISPRS International Journal of Geo-Information, 7(6), 79. https://doi.org/10.3390/ijgi6030079
[20] Stanišić, D., Jorgovanović, N., Popov, N., & Čongradac, V. (2015). Soft sensor for real-time cement fineness estimation. ISA Transactions, 55, 250-259. https://doi.org/10.1016/j.isatra.2014.09.019
Contact information: Milan VRTUNSKI, PhD, assistant (Corresponding author) Faculty of Technical Sciences, University of Novi Sad, Trg Dositeja Obradovića 6, 21000 Novi Sad, Serbia E-mail: [email protected] Miro GOVEDARICA, PhD, professor Faculty of Technical Sciences, University of Novi Sad, Trg Dositeja Obradovića 6, 21000 Novi Sad, Serbia E-mail: [email protected] Aleksandar RISTIĆ, PhD, associated professor Faculty of Technical Sciences, University of Novi Sad, Trg Dositeja Obradovića 6, 21000 Novi Sad, Serbia E-mail: [email protected] Željko BUGARINOVIĆ, MSc, assistant Faculty of Technical Sciences, University of Novi Sad, Trg Dositeja Obradovića 6, 21000 Novi Sad, Serbia E-mail: [email protected] Mirko BORISOV, PhD, associated professor Faculty of Technical Sciences, University of Novi Sad, Trg Dositeja Obradovića 6, 21000 Novi Sad, Serbia E-mail: [email protected]