generation performance in sri lanka - pucsl chapter 1 – introduction 1 chapter 2 – energy...
TRANSCRIPT
Prepared By : Public Utilities Commission of Sri Lanka
Generation Performance
in Sri Lanka
2013

Content
Chapter 1 – Introduction 1
Chapter 2 – Energy Generation 2
Chapter 3 – System Peak Demand 5
Chapter 4 – Load Factor 5
Chapter 5 – Plant Factor 7
Chapter 6 – Running Plant Factor 10
Chapter 7 – Generation Cost 11
7.1 - Amount Paid in Excess of Capacity and Energy Charges 12
Chapter 8 – Comparison of Scheduled Dispatch and Actual Dispatch 13
Chapter 9 – Auxiliary Consumption 14
Chapter 10 – Availability Factor 14
Chapter 11 – Reservoir Storages 15
Chapter 12 – Conclusion 17

[Generation Performance in Sri Lanka] 2013
1 | P a g e
1. Introduction
Electricity has become an essential commodity in the modern world. Sri Lanka also has reached the
national electrification level of 94%, which is a substantial improvement in the power sector
compared with electrification level of 70% by end of 2005. During year 2013, maximum recorded
electricity demand in Sri Lanka was 2164.2MW (excluding the contribution of SPP Mini Hydro, Solar
and Biomass) which is a slight higher value compared to the maximum demand of 2146.4MW in year
2012. In order to attain this demand and to satisfy the electricity requirement in Sri Lanka,
altogether 177 Grid connected power plants with installed capacity of 3322MW have been operated
in 2013. Out of these power plants 25 have been owned and operated by Ceylon Electricity Board
including 17 hydro plants, 8 thermal plants and 1 wind power plant. In addition to that, 11 thermal
power plants have been operated by Independent Power Producers (IPPs) and 144 renewable power
plants have been operated by Small Power Producers (SPPs) including mini hydro plants, solar power
plants, wind power plants and biomass power plants. And altogether, 22 renewable power plants
have been commissioned during the year 2013 to strengthen the generation capacity of the country.
The chart below shows the existed installed capacities in MW of each type of power plants by the
end of the year 2013.
This Generation Performance Report contains a summary of information and performance statistics
of the generation units and electricity network in Sri Lanka for the year 2013.
All the index and other calculations in this report have been done based on the data received
through Licensee Information Submission System (LISS) and details obtained from CEB Monthly
Operational Data Reports.
1356
533 300
771
362
Generation Capacity Mix in MW
CEB Hydro
CEB Thermal-Oil
CEB Thermal-Coal
IPP Thermal
Renewable

[Generation Performance in Sri Lanka] 2013
2 | P a g e
2. Energy Generation
All grid connected generation plants sell their power to the only transmission licensee in Sri Lanka to
deliver the power to the end consumers via distribution licensees.
The chart below shows the annual generation figures in 2013 in MWh.
CEB Hydro
CEB Oil CEB Coal IPP Thermal
Renewable Total
Jan 539,017 83,172 150,874 139,288 76,347 988,698
Feb 373,812 93,162 159,516 234,893 52,646 914,029
Mar 351,493 160,338 180,996 309,349 54,181 1,056,357
Apr 371,682 150,551 149,882 270,270 56,263 998,648
May 416,643 136,610 175,208 178,444 117,325 1,024,230
Jun 578,924 41,184 144,854 44,793 156,961 966,716
Jul 680,109 30,639 120,666 20,860 156,283 1,008,557
Aug 668,150 68,450 68,820 107,940 103,834 1,017,194
Sep 624,640 105,790 0 113,920 127,567 971,917
Oct 564,780 138,560 75,080 162,450 97,956 1,038,826
Nov 468,830 118,290 165,260 136,020 95,529 983,929
Dec 370,420 199,690 78,210 259,340 83,391 991,051
Total 6,008,500 1,326,436 1,469,366 1,977,567 1,178,282 11,960,151
Source :LISS
The chart below shows the generation mix in Sri Lanka in year 2013.
50.24%
11.09%
12.29%
16.53%
9.85%
Electricity Generation Mix - 2013
CEB Hydro
CEB Thermal-Oil
CEB Thermal-Coal
IPP Thermal
Renewable

[Generation Performance in Sri Lanka] 2013
3 | P a g e
The chart below shows the generation mix in Sri Lanka for the year 2012.
The chart below shows the monthly variation of generation mix in Sri Lanka during year 2013.
23.10%
17.19%
11.98%
41.57%
6.17%
Electricity Generation Mix - 2012
CEB Hydro
CEB Thermal-Oil
CEB Thermal-Coal
IPP Thermal
Renewable
0
100
200
300
400
500
600
700
Jan Feb Mar Apr May Jun Jul Aug Sep Oct Nov Dec
CEB Hydro
CEB Thermal-Oil
CEB Thermal-Coal
IPP Thermal
Renewable
GWh Monthly Variation of Electricity Generation Mix

[Generation Performance in Sri Lanka] 2013
4 | P a g e
The following chart shows the daily variation of generation mix in Sri Lanka during the year 2013.
Note: Daily generation data of renewable power plants was not available.
Compared to the year 2012, it can be perceived that power generation through NCRE sources has
improved from 6% in 2012 to 10% in 2013 out of the total electricity generation. In the Sri Lankan
power sector, the grid connected installed capacity for electricity generation from NCRE sources as
at the end of 2013 was 262MW including 126 mini hydro plants, 11 wind power plants, 4 solar
power plants and 4 Biomass power plants.
The Chart below shows the energy contribution from each type of NCRE power plants in 2013.
0
5
10
15
20
25
30
35
40
1-Jan 1-Feb 1-Mar 1-Apr 1-May 1-Jun 1-Jul 1-Aug 1-Sep 1-Oct 1-Nov 1-Dec
IPP Thermal
CEB Coal
CEB Thermal-OilCEB Hydro
Daily Variation of Generation Mix GWh
916.2
234.2 26.3
1.5
NCRE Generation Mix in GWh
Mini Hydro
Wind
Biomass
Solar
[Generation Performance in Sri Lanka] 2013
5 | P a g e
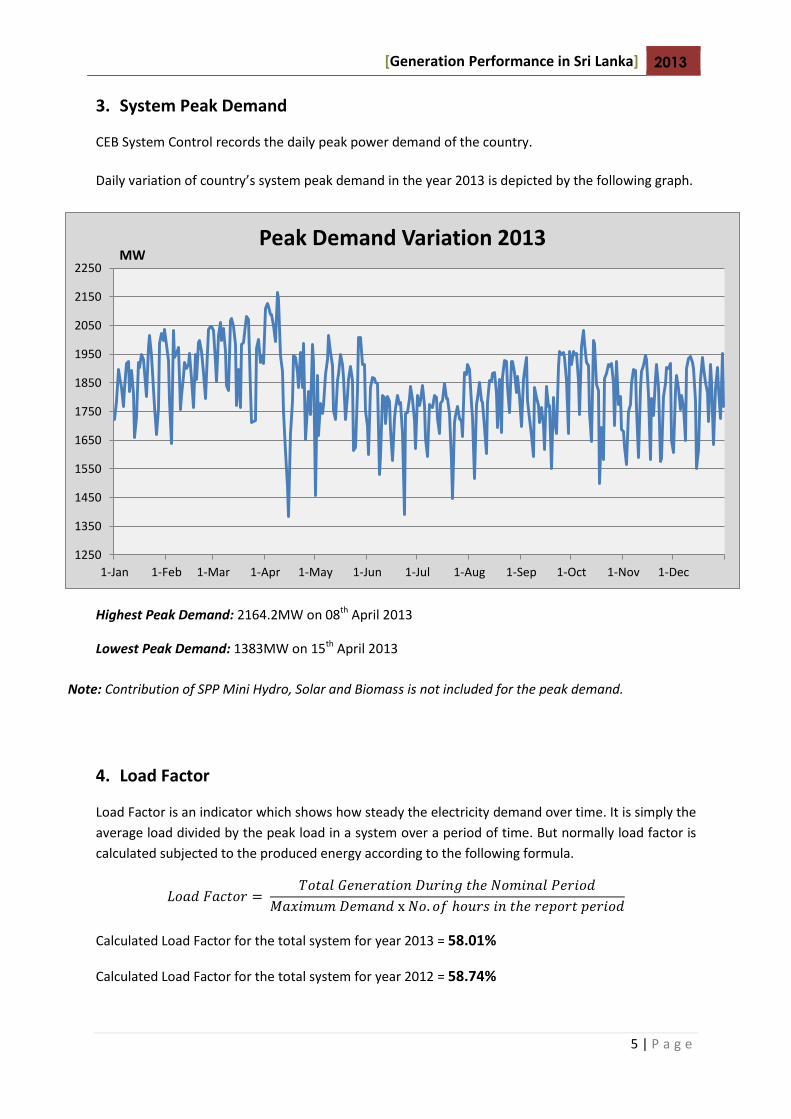
3. System Peak Demand
CEB System Control records the daily peak power demand of the country.
Daily variation of country’s system peak demand in the year 2013 is depicted by the following graph.
Highest Peak Demand: 2164.2MW on 08th April 2013
Lowest Peak Demand: 1383MW on 15th April 2013
4. Load Factor
Load Factor is an indicator which shows how steady the electricity demand over time. It is simply the
average load divided by the peak load in a system over a period of time. But normally load factor is
calculated subjected to the produced energy according to the following formula.
Calculated Load Factor for the total system for year 2013 = 58.01%
Calculated Load Factor for the total system for year 2012 = 58.74%
1250
1350
1450
1550
1650
1750
1850
1950
2050
2150
2250
1-Jan 1-Feb 1-Mar 1-Apr 1-May 1-Jun 1-Jul 1-Aug 1-Sep 1-Oct 1-Nov 1-Dec
Peak Demand Variation 2013 MW
Note: Contribution of SPP Mini Hydro, Solar and Biomass is not included for the peak demand.
[Generation Performance in Sri Lanka] 2013
6 | P a g e
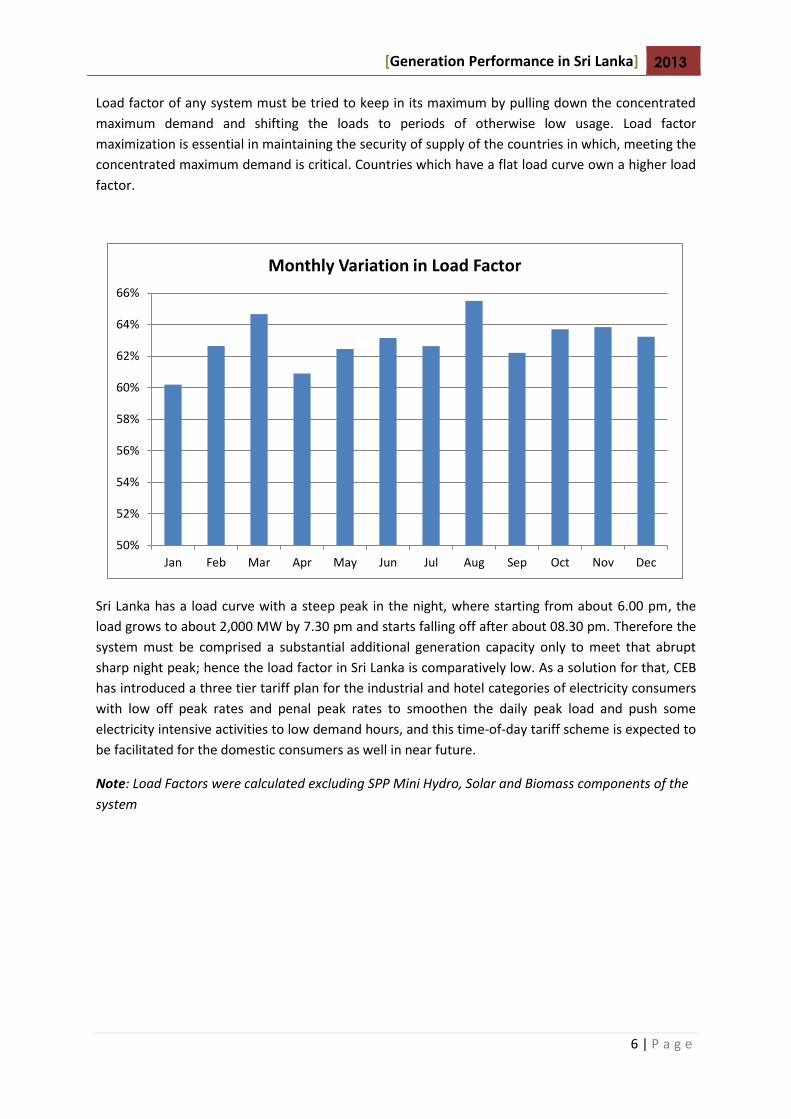
Load factor of any system must be tried to keep in its maximum by pulling down the concentrated
maximum demand and shifting the loads to periods of otherwise low usage. Load factor
maximization is essential in maintaining the security of supply of the countries in which, meeting the
concentrated maximum demand is critical. Countries which have a flat load curve own a higher load
factor.
Sri Lanka has a load curve with a steep peak in the night, where starting from about 6.00 pm, the
load grows to about 2,000 MW by 7.30 pm and starts falling off after about 08.30 pm. Therefore the
system must be comprised a substantial additional generation capacity only to meet that abrupt
sharp night peak; hence the load factor in Sri Lanka is comparatively low. As a solution for that, CEB
has introduced a three tier tariff plan for the industrial and hotel categories of electricity consumers
with low off peak rates and penal peak rates to smoothen the daily peak load and push some
electricity intensive activities to low demand hours, and this time-of-day tariff scheme is expected to
be facilitated for the domestic consumers as well in near future.
Note: Load Factors were calculated excluding SPP Mini Hydro, Solar and Biomass components of the
system
50%
52%
54%
56%
58%
60%
62%
64%
66%
Jan Feb Mar Apr May Jun Jul Aug Sep Oct Nov Dec
Monthly Variation in Load Factor

[Generation Performance in Sri Lanka] 2013
7 | P a g e
5. Plant Factor
The plant factor of a power plant is the ratio of the actual energy output of the power plant over a
period of time to its potential output if it had operated at full nameplate capacity the entire time.
Plant Factors vary greatly depending on the type of power plants and it is calculated according to the
following formula.
Calculated plant factors for all grid connected power plants in Sri Lanka during 2013 are listed below.
CEB Hydro
Old Laxapana 77.46%
New Laxapana 71.70%
Polpitiya 70.80%
Rantambe 68.49%
Victoria 64.53%
Nilambe 63.49%
CEB & IPP Thermal
Plant Factors of thermal power plants are listed below in the order of calculated energy unit cost for
the year 2013.
1 Puttalum Coal 55.91%
2 KPS CCY 42.22%
3 Sapugaskanda 2 61.98%
4 New Chunnakam 59.61%
5 Heladhanavi 53.62%
6 Colombo Power 63.13%
7 Ace Embilipitiya 45.14%
8 Sapugaskanda 1 32.46%
Randenigala 60.09%
Upper Kotmale 43.11%
Inginiyagala 42.33%
Ukuwela 42.26%
Canyon 40.49%
Wimalasurendra 38.50%
Samanala 38.29%
Kukule 37.26%
Udawalawe 35.64%
Kotmale 33.59%
Bowatenna 17.66%
9 Asia Power 35.22%
10 Chunnakum 0.43%
11 West Coast 18.93%
12 AES Kelanitissa 10.66%
13 Northern Power 9.85%
14 GT 7 - Kelanitissa 1.64%
15 Small Gas Turbines 0.14%
16 Asia Power 35.22%
[Generation Performance in Sri Lanka] 2013
8 | P a g e
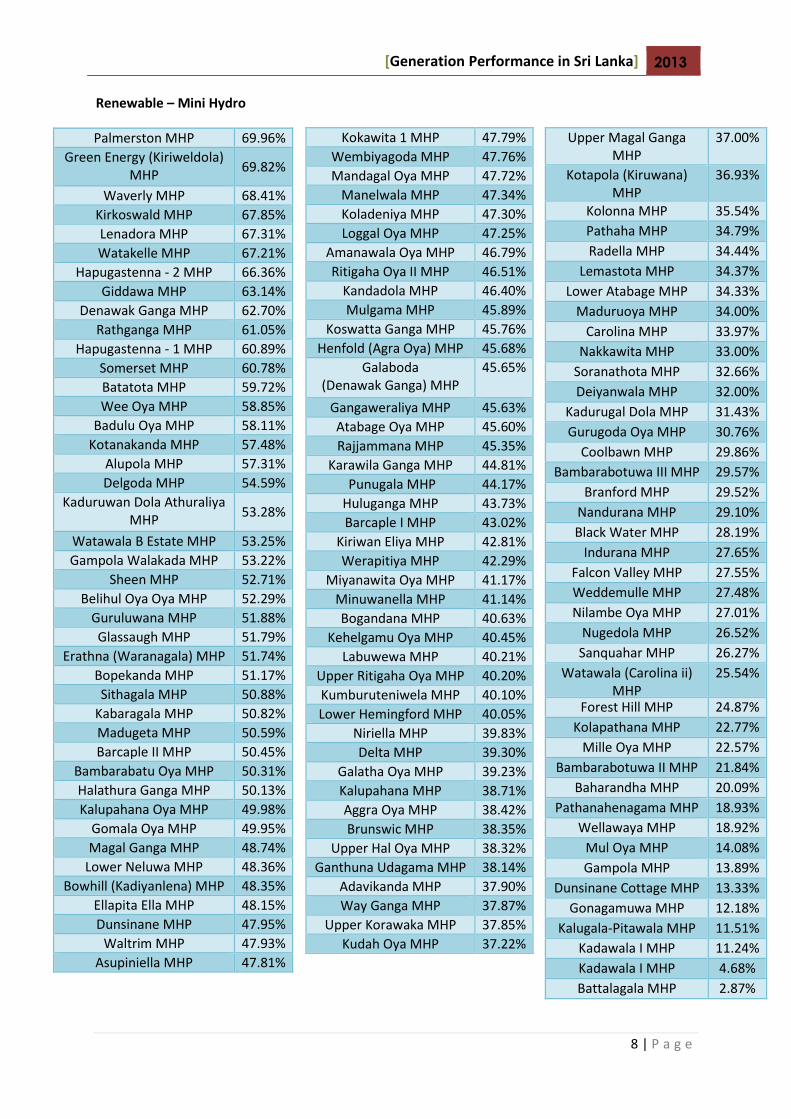
Renewable – Mini Hydro
Palmerston MHP 69.96%
Green Energy (Kiriweldola) MHP
69.82%
Waverly MHP 68.41%
Kirkoswald MHP 67.85%
Lenadora MHP 67.31%
Watakelle MHP 67.21%
Hapugastenna - 2 MHP 66.36%
Giddawa MHP 63.14%
Denawak Ganga MHP 62.70%
Rathganga MHP 61.05%
Hapugastenna - 1 MHP 60.89%
Somerset MHP 60.78%
Batatota MHP 59.72%
Wee Oya MHP 58.85%
Badulu Oya MHP 58.11%
Kotanakanda MHP 57.48%
Alupola MHP 57.31%
Delgoda MHP 54.59%
Kaduruwan Dola Athuraliya MHP
53.28%
Watawala B Estate MHP 53.25%
Gampola Walakada MHP 53.22%
Sheen MHP 52.71%
Belihul Oya Oya MHP 52.29%
Guruluwana MHP 51.88%
Glassaugh MHP 51.79%
Erathna (Waranagala) MHP 51.74%
Bopekanda MHP 51.17%
Sithagala MHP 50.88%
Kabaragala MHP 50.82%
Madugeta MHP 50.59%
Barcaple II MHP 50.45%
Bambarabatu Oya MHP 50.31%
Halathura Ganga MHP 50.13%
Kalupahana Oya MHP 49.98%
Gomala Oya MHP 49.95%
Magal Ganga MHP 48.74%
Lower Neluwa MHP 48.36%
Bowhill (Kadiyanlena) MHP 48.35%
Ellapita Ella MHP 48.15%
Dunsinane MHP 47.95%
Waltrim MHP 47.93%
Asupiniella MHP 47.81%
Kokawita 1 MHP 47.79%
Wembiyagoda MHP 47.76%
Mandagal Oya MHP 47.72%
Manelwala MHP 47.34%
Koladeniya MHP 47.30%
Loggal Oya MHP 47.25%
Amanawala Oya MHP 46.79%
Ritigaha Oya II MHP 46.51%
Kandadola MHP 46.40%
Mulgama MHP 45.89%
Koswatta Ganga MHP 45.76%
Henfold (Agra Oya) MHP 45.68%
Galaboda (Denawak Ganga) MHP
45.65%
Gangaweraliya MHP 45.63%
Atabage Oya MHP 45.60%
Rajjammana MHP 45.35%
Karawila Ganga MHP 44.81%
Punugala MHP 44.17%
Huluganga MHP 43.73%
Barcaple I MHP 43.02%
Kiriwan Eliya MHP 42.81%
Werapitiya MHP 42.29%
Miyanawita Oya MHP 41.17%
Minuwanella MHP 41.14%
Bogandana MHP 40.63%
Kehelgamu Oya MHP 40.45%
Labuwewa MHP 40.21%
Upper Ritigaha Oya MHP 40.20%
Kumburuteniwela MHP 40.10%
Lower Hemingford MHP 40.05%
Niriella MHP 39.83%
Delta MHP 39.30%
Galatha Oya MHP 39.23%
Kalupahana MHP 38.71%
Aggra Oya MHP 38.42%
Brunswic MHP 38.35%
Upper Hal Oya MHP 38.32%
Ganthuna Udagama MHP 38.14%
Adavikanda MHP 37.90%
Way Ganga MHP 37.87%
Upper Korawaka MHP 37.85%
Kudah Oya MHP 37.22%
Upper Magal Ganga MHP
37.00%
Kotapola (Kiruwana) MHP
36.93%
Kolonna MHP 35.54%
Pathaha MHP 34.79%
Radella MHP 34.44%
Lemastota MHP 34.37%
Lower Atabage MHP 34.33%
Maduruoya MHP 34.00%
Carolina MHP 33.97%
Nakkawita MHP 33.00%
Soranathota MHP 32.66%
Deiyanwala MHP 32.00%
Kadurugal Dola MHP 31.43%
Gurugoda Oya MHP 30.76%
Coolbawn MHP 29.86%
Bambarabotuwa III MHP 29.57%
Branford MHP 29.52%
Nandurana MHP 29.10%
Black Water MHP 28.19%
Indurana MHP 27.65%
Falcon Valley MHP 27.55%
Weddemulle MHP 27.48%
Nilambe Oya MHP 27.01%
Nugedola MHP 26.52%
Sanquahar MHP 26.27%
Watawala (Carolina ii) MHP
25.54%
Forest Hill MHP 24.87%
Kolapathana MHP 22.77%
Mille Oya MHP 22.57%
Bambarabotuwa II MHP 21.84%
Baharandha MHP 20.09%
Pathanahenagama MHP 18.93%
Wellawaya MHP 18.92%
Mul Oya MHP 14.08%
Gampola MHP 13.89%
Dunsinane Cottage MHP 13.33%
Gonagamuwa MHP 12.18%
Kalugala-Pitawala MHP 11.51%
Kadawala I MHP 11.24%
Kadawala I MHP 4.68%
Battalagala MHP 2.87%

[Generation Performance in Sri Lanka] 2013
9 | P a g e
Wind
Madurankuliya WPP 51.68%
Nirmalapura WPP 38.71%
Vidatamunai WPP 36.68%
Erumbukkudal WPP 34.97%
Seguwantivu WPP 34.27%
Kalpitiya WPP 33.82%
Biomass Solar
Badalgama BMP 28.86%
Tokyo BMP 25.52%
Kottamurichchana BMP 10.98%
Embilipitiya BMP 2.44%
Note: Gross generation data for IPPs and SPPs were not available for Plant Factor calculation.
Therefore the Net generation data were used to calculate the plant factors of these plants.
Annual Overall Plant Factors for the major types of generation options in 2012 & 2013 are given
below.
Overall plant factors of CEB hydro plants and Renewable plants have been elevated drastically due to
rich rainfall, which has highly impacted towards dropping thermal dispatch.
22.8
45.38
53.64
66.37
26.19
50.6
28.4
55.9
29.3
39.7
0
10
20
30
40
50
60
70
80
90
100
CEB Hydro CEB Thermal-Oil CEB Thermal-Coal IPP Thermal Renewable
Plant Factors
2012
2013
%
Mampuri WPP 32.35%
Uppudaluwa WPP 22.38%
Ambewela WPP 16.74%
Willwind WPP 10.24%
CEB Wind 8.73%
Gonnoruwa I SPP 13.99%
Gonnoruwa II SPP 13.88%
Tirappane SPP 0.42%
[Generation Performance in Sri Lanka] 2013
10 | P a g e
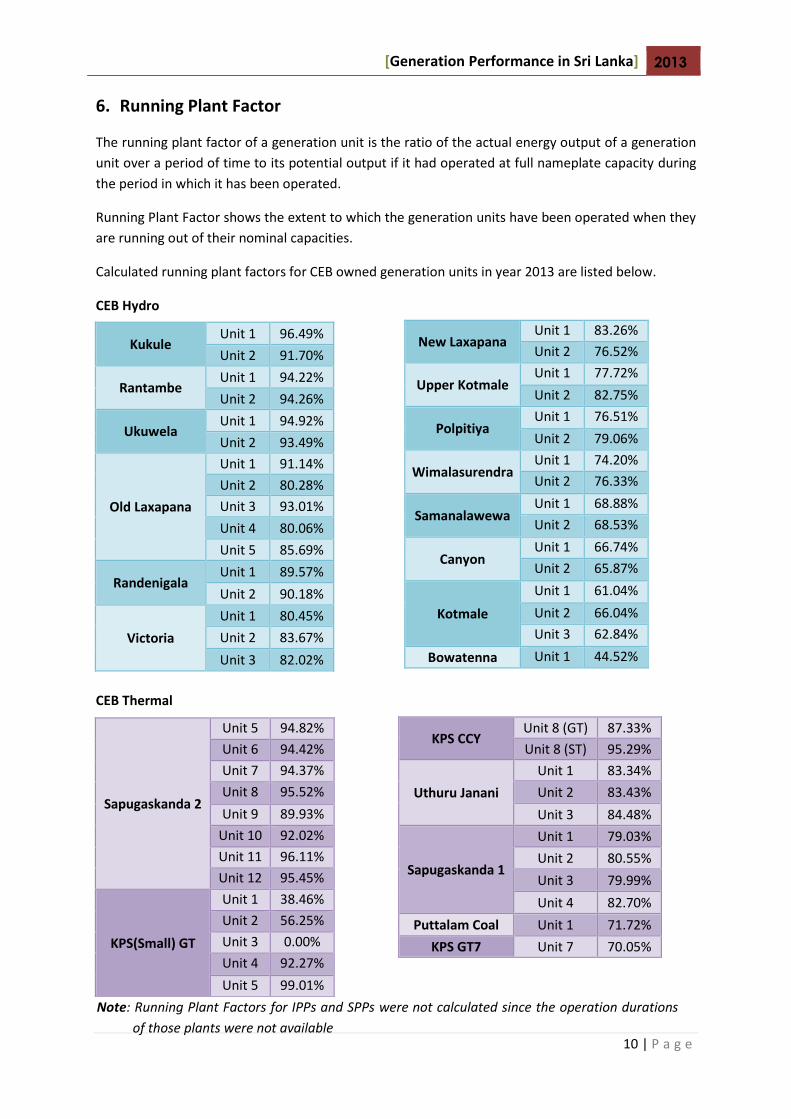
6. Running Plant Factor
The running plant factor of a generation unit is the ratio of the actual energy output of a generation
unit over a period of time to its potential output if it had operated at full nameplate capacity during
the period in which it has been operated.
Running Plant Factor shows the extent to which the generation units have been operated when they
are running out of their nominal capacities.
Calculated running plant factors for CEB owned generation units in year 2013 are listed below.
CEB Hydro
CEB Thermal
Kukule Unit 1 96.49%
Unit 2 91.70%
Rantambe Unit 1 94.22%
Unit 2 94.26%
Ukuwela Unit 1 94.92%
Unit 2 93.49%
Old Laxapana
Unit 1 91.14%
Unit 2 80.28%
Unit 3 93.01%
Unit 4 80.06%
Unit 5 85.69%
Randenigala Unit 1 89.57%
Unit 2 90.18%
Victoria
Unit 1 80.45%
Unit 2 83.67%
Unit 3 82.02%
New Laxapana Unit 1 83.26%
Unit 2 76.52%
Upper Kotmale Unit 1 77.72%
Unit 2 82.75%
Polpitiya Unit 1 76.51%
Unit 2 79.06%
Wimalasurendra Unit 1 74.20%
Unit 2 76.33%
Samanalawewa Unit 1 68.88%
Unit 2 68.53%
Canyon Unit 1 66.74%
Unit 2 65.87%
Kotmale
Unit 1 61.04%
Unit 2 66.04%
Unit 3 62.84%
Bowatenna Unit 1 44.52%
Sapugaskanda 2
Unit 5 94.82%
Unit 6 94.42%
Unit 7 94.37%
Unit 8 95.52%
Unit 9 89.93%
Unit 10 92.02%
Unit 11 96.11%
Unit 12 95.45%
KPS(Small) GT
Unit 1 38.46%
Unit 2 56.25%
Unit 3 0.00%
Unit 4 92.27%
Unit 5 99.01%
KPS CCY Unit 8 (GT) 87.33%
Unit 8 (ST) 95.29%
Uthuru Janani
Unit 1 83.34%
Unit 2 83.43%
Unit 3 84.48%
Sapugaskanda 1
Unit 1 79.03%
Unit 2 80.55%
Unit 3 79.99%
Unit 4 82.70%
Puttalam Coal Unit 1 71.72%
KPS GT7 Unit 7 70.05%
Note: Running Plant Factors for IPPs and SPPs were not calculated since the operation durations
of those plants were not available

[Generation Performance in Sri Lanka] 2013
11 | P a g e
7. Generation Cost
Power Station Annual Generation
(GWh) Total Cost to CEB
(Mn.LKR) Average Unit Cost(Rs/kWh)
Asia Power 157 5,321 33.81
AES Kelanitissa 152 7,097 46.62
Colombo Power 332 8,045 24.25
Heladhanavi 470 11,022 23.47
ACE Embilipitiya 395 9,900 25.04
Westcoast 448 20,855 46.58
Sapugaskanda A 182 5,716 31.41
Sapugaskanda B 391 8,203 20.98
Kelanitissa Small GTs 1 452 445.50
Kelanitissa PS GT 7 17 1,190 71.81
Kelanitissa Combined 610 12,766 20.92
Puttalam Coal 1,469 10,585 7.20
Chunnakum 0.3 10 34.56
Uthura Janani 125 2,657 21.20
Northern Power 23 1,244 53.41
Victoria 1,187 2,100 1.77
Ukuwela 148 663 4.48
Kotmale 591 1,801 3.05
Upper Kotmale 566 1,519 2.68
Randenigala/Rantambe 936 1,608 1.72
Bowatenna 62 539 8.71
Nilambe 17 110 6.57
Old Laxapana/New Laxapana
967 1,105 1.14
Polpitiya 465 572 1.23
Wimalasurendra 169 316 1.87
Canyon 213 661 3.11
Samanalawewa 403 1,479 3.67
Kukule 228 652 2.85
Inginiyagala 37 132 3.55
Udawalawe 19 105 5.61
Renewable 1,178 16,999 14.43
All Hydro 6,009 13,361 2.22 All CEB Thermal 2,796 41,580 14.87
ALL IPP Thermal 1,978 63,483 32.10
All Plants 11,960 135,423 11.32 Source: LISS

[Generation Performance in Sri Lanka] 2013
12 | P a g e
7.1 Amount Paid in Excess of Capacity and Energy Charges
CEB has paid to Independent Power Producers (IPP) in excess of capacity and energy charges
according their Power Purchase Agreements (PPA). The amounts which have been paid in 2013 are
summarized below.
Power Plant Start/Stop Charge
(Mn.LKR) Reimbursement Claim
(Mn.LKR) O & M Charge
(Mn.LKR) Total
(Mn.LKR)
Asia Power 0.00 96.28 96.28
AES - Kelanitissa 263.02 67.56 330.59
Colombo Power - Barge 120.92 91.95 212.87
Heladhanavi 85.69 640.27 725.96
ACE Embilipitiya 87.36 380.04 467.40
Westcoast 712.66 691.34 1404.00
Northern Power 0.00 33.49 63.82 97.30
Total (Mn.LKR) 1269.66 2000.92 63.82 3334.40

[Generation Performance in Sri Lanka] 2013
13 | P a g e
8. Comparison of Scheduled Dispatch and Actual Dispatch
CEB implements a generation dispatches schedule every 6 months prior operation. It contains the
amount of energy to be produced by each power plant for the forthcoming months. Due to
numerous reasons the actual dispatch could be deviated from this schedule. The comparison
between actual and scheduled dispatches for the year 2013 is given below.
Capacity MW
Scheduled GWh
Actual GWh
Variation GWh
Scheduled PF
Actual PF
Puttalam Coal 300 1883.1 1469.4 -413.7 71.66% 55.91%
Sapugaskanda 2 72 481.3 390.9 -90.3 76.31% 61.98%
Heladhanavi 100 737.1 469.7 -267.4 84.14% 53.62%
Sapugaskanda 1 64 388.9 182.0 -206.9 69.37% 32.46%
Colombo Power Barge 60 424.5 331.8 -92.7 80.76% 63.13%
ACE Embilipitiya 100 634.8 395.4 -239.4 72.47% 45.14%
ASIA Power 51 334.0 157.4 -176.6 74.76% 35.22%
Kerawalapitiya 270 1235.8 447.8 -788.0 52.25% 18.93%
AES Kelanitissa 163 442.3 152.2 -290.1 30.98% 10.66%
KPS GT 7 115 17.2 16.6 -0.6 1.71% 1.64%
KPS CCY 165 728.6 610.3 -118.3 50.41% 42.22%
KPS Small GT 85 3.6 1.0 -2.6 0.48% 0.14%
Northern Power 27 117.9 23.3 -94.6 49.85% 9.85%
Chunnakam 8 5.9 0.3 -5.6 8.42% 0.43%
Uthura Janani 24 178.9 125.3 -53.6 85.09% 59.61%
Total Thermal 1604 7613.9 4773.4 -2840.5 54.19% 33.97%
Renewable energy 362 704.7 1178.3 473.6 22.22% 37.16%
CEB Hydro 1356 3879.5 6008.5 2129.0 32.66% 50.58%
Total Generation 3322 12198.0 11960.2 -237.9
[Generation Performance in Sri Lanka] 2013
14 | P a g e
9. Auxiliary Consumption
Auxiliary system facility is a major part of a power generation facility and the auxiliary consumption
of a power plant depends on its configuration, age and related technical parameters. Purpose of an
auxiliary system is to supply power for its own electricity requirements.
Normally 0.5% - 2% of power generated is consumed for the auxiliary system in hydro plants while
the auxiliary consumption in fossil fuel power plants is 7% - 15% since there are different equipment
like feed pumps, cooling water pumps, air fans, coal grinding mills, ash handling equipment etc.
utilized in thermal plants.
Calculated percentages of auxiliary consumption of CEB power plants out of gross generation during
2013 are as follows.
CEB Hydro 0.34%
CEB Thermal Oil 1.56%
CEB Wind 0.52%
Note: Auxiliary power consumption data was available only for CEB power plants and consumptions
for each plant separately were not available.
10. Availability Factor
The evaluation of availability of a power plant is one of the most important tasks at any power
station. To analyze plant availability performance, generation unit outages should be scrutinized to
identify the causes of unplanned or forced energy losses and to reduce the planned energy losses.
Reducing outages increases the number of operating hours, therefore increases the plant availability
factor.
Availability Factor of a generation unit can be calculated using the formula given below.
Total Availability Factor for all CEB generation Units in 2013 = 79.54%
Availability Factor for CEB hydro generation units in 2013 = 82.15%
Availability Factor for CEB thermal generation units in 2013 = 71.28%
Availability Factor for CEB wind generation units in 2013 = 97.75%

[Generation Performance in Sri Lanka] 2013
15 | P a g e
Calculated availability factors for CEB owned generation plants in year 2013 are listed below.
CEB Hydro
CEB Thermal
Uthura Janani 95.26%
KPS CCY 90.43%
Puttalam Coal 81.80%
Sapugaskanda 2 79.52%
KPS GT 7 54.77%
KPS Small GTs 54.65%
Sapugaskanda 1 49.53%
Note: Interruption data is available only for CEB owned power plants
11. Reservoir Storages
Hydro power is one of the major sources of electricity generation in the Sri Lanka and most of the
large scale hydro projects have been developed by CEB. Approximately 41% of the total existed
capacity by the end of 2013 has been covered by 17 CEB hydro stations and have contributed 50%
out of total generation during the year 2013.
The major hydropower schemes already developed are associated with Kelani and Mahaweli river
basins. Laxapana complex comprises five hydro power stations which have been built associated
with the two main tributaries of Kelani River; Kehelgamu Oya and Maskeli Oya. Castlereigh and
Moussakelle are the major storage reservoirs in the Laxapana complex. Mahaweli complex
comprises seven hydro power stations and three major reservoirs; Kotmale, Victoria and
Randenigala. In addition to above mentioned reservoirs Samanalawewa, which is on Walawe River,
is also can be considered as a large reservoir. And all the other small reservoirs which contribute to
power up the run-of-river type plants are considered as ponds.
Therefore having a satisfactory capacity of water in these reservoirs throughout the year is essential
to dispatch the hydro power to a significant amount.
Rantambe 98.43%
Randenigala 98.35%
Nilambe 98.33%
Victoria 96.13%
Samanalawewa 94.48%
Canyon 94.07%
Ukuwela 92.96%
New Laxapana 92.15%
Polpitiya 91.16%
Kotmale 88.49%
Wimalasurendra 84.82%
Bowatenna 84.12%
Old Laxapana 83.56%
Upper Kotmale 79.89%
Udawalawe 60.56%
Kukule 53.73%
Inginiyagala 53.38%

[Generation Performance in Sri Lanka] 2013
16 | P a g e
The major reservoir storage levels prevailed during the years 2013 are depicted below.
0
10
20
30
40
50
60
70
80
90
100Mahaweli
Laxapana
Samanalawewa
Reservoir Storage of Major Reservoirs - 2013
%
Date
Mahaweli Complex: 717.8 GWh Laxapana Complex: 367.8 GWh Samanalawewa: 173.7 GWh
0
100
200
300
400
500
600
700
800
900
1,000
1,100
1,200
1,300
Reservoir Storage Level -2013 GWh

[Generation Performance in Sri Lanka] 2013
17 | P a g e
Note: Only Mahaweli, Laxapana and Samanalawewa Complexes’ reservoirs are considered in total
reservoir storage profile.
12. Conclusion
In the year 2013, the hydro generation contribution has been improved enormously and it has
become a year which had over 50% hydro contribution after a long time, as a result of the ample
rainfall received over the catchment areas all over the year. Nevertheless, Puttalam Coal power
plant has not been able to perform well even in the year 2013, whereas it has failed to deliver
adequate energy as scheduled (shortage of 414GWh), due to frequent plant breakdowns occurred in
2013 having achieved only a 81% of availability throughout the year.
Maximum electricity demand recorded in the year 2013 is 2164.2MW and it is expected to be risen
to 2324MW in 2014 subjected to the peak demand growth rate of 7.4% as specified by the Long
Term Generation Expansion Plan (2013-2032). To achieve this demand a system capacity of 3235MW
(without NCRE component) is available to dispatch during the year 2014. Therefore there will be a
Reserve Margin of 39% when the peak demand of year 2014 is reached, assuming that all the power
plants are readily available to dispatch with their full capacities. But when it comes to the practical
state it is obvious that all the plants will not be available fully at the same time, specially hydro
power plants. Nevertheless, Even though the available dispatchable total capacity is dropped by
650MW the Reserve Margin can be maintained above 10%, which is the minimum allowed Reserve
Margin by the Least-Cost Generation Expansion Planning Code. And it is to be noted that the phase 2
of the Puttalam Coal Power Plant has been commissioned in April 2014 to enhance the generation
capacity of Sri Lankan electricity network.
0
200
400
600
800
1000
1200
14001
-Jan
31
-Jan
2-M
ar
1-A
pr
1-M
ay
31
-May
30
-Ju
n
30
-Ju
l
29
-Au
g
28
-Se
p
28
-Oct
27
-No
v
27
-De
c
2012
2013
Comparison of Reservoir Storage Levels

[Generation Performance in Sri Lanka] 2013
18 | P a g e
Improving the performance of existing power plants is the most cost effective way to increase the
energy producing capabilities of them. Performance indicators are very useful in identifying the
areas where the improvements are needed. Among generation plants’ performance measures plant
factor, availability and auxiliary consumption are critical performance indicators, both in technical
and commercial terms. Nevertheless, generator outages’ details and auxiliary consumption data of
IPPs are not available to assess the availability and percentage of auxiliary consumption of them.
Therefore the availability details and auxiliary consumption data of all private power plants are
intended to be received through LISS in order to measure their performance.
The Report has also described and calculated a number of key performance indicators for total
generation system and individual generation plants operated in Sri Lanka. And it moreover gives a
comparison of the generation statistics between year 2012 and 2013. The indicators for the present
technical performance of the generation system are useful when planning the future developments
and taking the corrective actions if necessary to improve the efficiency of generation.