genetic diversity of plus trees and populations
TRANSCRIPT
1
VYTAUTAS MAGNUS UNIVERSITY
LITHUANIAN RESEARCH CENTRE FOR AGRICULTURE AND FORESTRY
Rita VERBYLAIT
EUROPEAN ASPEN (Populus tremula L.) IN LITHUANIA: GENETIC DIVERSITY OF PLUS TREES AND POPULATIONS
ASSESSED USING MOLECULAR MARKERS
Doctoral dissertation
Area of Biomedical Sciences
Field of Ecology and Environmental Science (03B)
Kaunas, 2015
2
UDK 577.175.1(474.5) Ve-142
The research was carried out at the Lithuanian Research Centre for Agriculture and Forestry in
2006–2015. The right of doctoral studies was granted to Vytautas Magnus University jointly
with Aleksandras Stulginskis University and Lithuanian Research Centre for Agriculture and
Forestry on June 21, 2011, by the decision No. V-1124 of the Minister of Education and Science
of the Republic of Lithuania.
Scientific Supervisors
Prof. habil. dr. Remigijus Ozolin ius – Lithuanian Research Centre for Agriculture and Forestry, Area of Biomedical Sciences, Field of Ecology and Environmental Science (03B), supervised from October of 2006 till March of 2013.
Dr. Virgilijus Baliuckas – Lithuanian Research Centre for Agriculture and Forestry, Area of
Biomedical Sciences, Field of Ecology and Environmental Science (03B), supervised from
March of 2013.
Scientific Consultant
Doc. dr. Sigut Kuusien (Lithuanian Research Centre for Agriculture and Forestry, Area of
Biomedical Sciences, Field of Biology 01B)
ISBN 978-609-467-174-6
3
TABLE OF CONTENTS
INTRODUCTION ....................................................................................................................... 5
1. LITERATURE REVIEW ................................................................................................... 8
1.1. Overview of genus Populus ............................................................................................ 8
1.1.1.Biology, ecology and distribution of European aspen ................................................ 9
1.1.2.Sanitary condition of European aspen stands in Lithuania ....................................... 12
1.1.3.Hybridization of Populus spp. .................................................................................. 13
1.1.4.History of European aspen investigation with emphasis on genetic research .......... 16
1.2. Molecular techniques for tree research ......................................................................... 19
1.2.1.DNA extraction from plant material ......................................................................... 19
1.2.2.Markers used in tree population biology .................................................................. 20
2. MATERIALS AND METHODS ..................................................................................... 26
2.1. Sampling of P. tremula trees for molecular analysis ...................................................... 26
2.2. Assessment of tree and stand characteristics ................................................................... 29
2.3. DNA extraction from plant material................................................................................ 32
2.4. Assessment of genetic diversity of P. tremula plus trees ................................................ 36
2.4.1. RAPD analysis ......................................................................................................... 36
2.4.2. Microsatellite analysis ............................................................................................. 37
2.5. Assessment of incidence of Phellinus tremulae infection in aspen stems ...................... 39
2.6. Identification of possible hybridization between P. tremula and hybrid aspens ............. 40
2.7. Statistical evaluation ........................................................................................................ 41
2.7.1. Assessment of genetic variation .............................................................................. 41
2.7.2. Correlation between occurrence of certain RAPD fragments and presence of DNA
of P. tremulae .................................................................................................................... 46
2.7.3. Analysis of European aspen and hybrid aspen leaf parameters ............................... 47
3. RESULTS AND DISCUSSION ....................................................................................... 48
3.1. General evaluation of investigated P. tremula stands and plus trees .............................. 48
3.2. DNA extraction from P. tremula ..................................................................................... 52
3.3. Genetic diversity of P. tremula plus trees ....................................................................... 55
3.3.1. Nei’s genetic distance between P. tremula plus trees .............................................. 58
3.3.2. Correlation between genetic distances and geographic distribution pattern of P.
tremula plus trees ............................................................................................................... 60
3.4. Population structure of P. tremula in Lithuania .............................................................. 60
3.4.1. Genetic relatedness of P. tremula populations by PCA .......................................... 61
4
3.4.2. Genetic parameters of assessed SSR loci of evaluated P. tremula populations ...... 63
3.4.3. Genetic diversity indices of P. tremula populations ................................................ 64
3.4.4. Nei’s genetic distances between populations of P. tremula .................................... 70
3.4.5. Correlation between genetic distances and geographic distribution pattern of P.
tremula populations ........................................................................................................... 75
3.4.6. P. tremula within- vs. among-population genetic diversity .................................... 75
3.4.7. Clustering of P. tremula populations using Bayesian approach .............................. 77
3.5. Correlation between presence of P. tremulae DNA and certain RAPD fragments......... 81
3.6. Hybridization between European and hybrid aspen ........................................................ 83
CONCLUSIONS ....................................................................................................................... 87
REFFERENCES ....................................................................................................................... 89
LIST OF PUBLICATIONS .................................................................................................... 112
LIST OF ABBREVIATIONS ................................................................................................. 113
ACKNOWLEDGMENTS ...................................................................................................... 115
APPENDIXES ......................................................................................................................... 116

5
INTRODUCTION
The scientific problem. The genus Populus is to date the main model system for genomic,
genetic and physiological research in trees (Luquez et al. 2008). Populus trichocarpa Torr. & A.
Gray was the first tree which genome has been sequenced (Tuskan et al. 2006). This
achievement led to increased number of research projects directed towards deeper understanding
of tree genomes.
The only native poplar species in Lithuania is European aspen (Populus tremula L.). P. tremula
is an ecologically important and widespread species with a broad distribution range growing in
temperate and boreal regions of Eurasia, widely used for hybridization and plantation forestry
(Rytter and Stener, 2005; Wühlisch, 2009). Therefore it is important to acquire knowledge on
distribution, diversity, population genetic structure, gene flow among populations, breeding and
propagation, possible hybridization events under natural conditions, and resistance to pathogens
of this tree species in Lithuania. The present study therefore is aimed to fulfill some of the
above-raised tasks and to provide some useful research tools (methods) for further investigations
of P. tremula in Lithuania.
The main aim of the study was to assess genetic diversity of European aspen plus trees and
populations in Lithuania, and to reveal possibility to identify hybridization between P. tremula
and hybrid aspen using morphological traits of their leaves.
The objectives of the study were:
1. To find the most suitable method for DNA extraction from different European aspen
tissues;
2. To assess genetic diversity of European aspen plus trees in Lithuania;
3. To assess the genetic diversity level and fixation indices among different European
aspen populations;
4. To estimate the association between genetic diversity and geographic distribution of
European aspen populations in Lithuania;
5. To assess the incidence of trunk rot caused by a pathogenic fungus Phellinus tremulae
(Bondartsev) Bondartsev & P.N. Borisov in European aspen plus trees and to test
possible correlation between the presence of trunk rot and tree genetic properties;
6. To investigate possibility to identify the presence of hybridization between P. tremula
and hybrid aspens using morphological leaf trait parameters and flowering phenology.
6
Defended Statements:
1. Genetic differentiation between Lithuanian populations of European aspen correlates with
their geographic pattern;
2. Genetic diversity among local (Lithuanian) European aspen populations is low because of a
high gene migration rate;
3. The relationship between susceptibility of European aspen to trunk rot caused by Phellinus
tremulae and tree genetic properties can be revealed using RAPD analysis;
4. Hybridization between hybrid and European aspens can be revealed by morphological leaf
traits of their progenies at juvenile age.
Scientific novelty and practical importance of the research
In Lithuania, European aspen is regarded as a pioneer tree species of comparably low economic
value, thus its local populations usually are left for self-regeneration. There are three aspen
provenance regions in Lithuania. These regions were distinguished by analyzing an actual
material of forest plot inventory and climatic data, yet research results based on molecular
markers were not available at that time and thus were not considered in delimiting of the
provenance regions. Therefore it is necessary to revise the existing boundaries of those regions
using data acquired from current molecular research of species’ genetic diversity.
Long-term breeding program in Lithuania is being implemented jointly with gene resource
conservation. Therefore, studies of genetic diversity of Lithuanian aspen populations are of the
utmost importance in the breeding program of European aspen. Relatively high susceptibility of
this tree species to trunk rot caused by P. tremulae remains the most serious problem that needs
to be solved before practical breeding implementation gets to a larger scale. Research on
interspecific hybridization is relevant when estimating genetic pollution of native aspen genetic
resources by hybrid aspen.
All above-mentioned research questions have never been thoroughly addressed in Lithuania
before.
Approval of the research work
The main research findings were published in one international publication in the journal
included in the Master Journal List of Institute of Scientific information and two publications –
in peer-reviewed Lithuanian journals (one of them in press). The results of the dissertation were
presented in 5 international conferences.

7
Volume and structure of the work
The dissertation is written in English. It consists of Introduction, Literature Review, Material
and Methods, Results and Discussion, Conclusions, List of References, List of Publications, List
of Abbreviations, Appendixes and Acknowledgements. The dissertation consists of 115 pages,
including 20 tables, 32 figures, 292 references and 2 appendixes.
8
1. LITERATURE REVIEW
1.1. Overview of genus Populus
The genus Populus belongs to family Salicaceae of order Salicales (Wühlisch, 2009). The genus
Populus is taxonomically subdivided into six sections: Turanga, Leucoides, Aigeiros,
Tacamahaca, Abaso and Populus (known synonymously as Leuce). The debates over the
species classification of poplars are still ongoing. A big confusion in the nomenclature of
poplars arises due to the wide distribution of many poplar species across the hemisphere,
frequent introgressive hybridization, long history of cultivation, and ease of vegetative
propagation. Poplar hybrids and cultivated varieties have often been named as species (Zsuffa,
1975). Various authors recognize from 20 up to 80 species in this genus, yet the recently
published taxonomies suggest that the total number of species in the genus range from 29
(Eckenwalder, 1996) to 32 (Dickmann and Kuzovkina, 2008).
The genus Populus is widely distributed throughout the Northern Hemisphere – America,
Europe and Asia, bordering Eastern Africa in the south (Bueno et al. 2003). Poplars are
dioecious, deciduous trees with simple, glabrous leaves, scale-covered buds and flowers
concentrated in hanging catkins. Species are wind pollinated and dispersed, producing vast
amount of seeds inside dry fruits (capsules). Reproduction of poplars occurs naturally via seeds,
root suckers, stump sprouts, and artificial budding, cuttings, layering and grafting. The timber is
light, soft and homogeneous, without well-differentiated heartwood. It is used in many industrial
applications such as raw material for wood pulp, particleboard, plywood, lumber, boxes,
matchsticks, and small woodenware (Farrar, 1995).
Poplars usually play an important role in a primary forest succession, invade and re-colonize
areas disturbed by harvesting, land clearing and fire. Poplars usually are water-demanding trees,
living near water bodies in fertile, moist and even wet soils. Vegetative regeneration after
coppicing is intense. Due to their rapid growth poplars are widely used in short rotation forestry
plantations. Worldwide, poplars are among the most widely used species in breeding activities
after pine, spruce and oak (Kleinschmit, 2000).
The most economically important sections of genus Populus are Populus, Aigeiros and
Tacamahaca (OECD, 2001). Section Populus (syn. Leuce Duby) – aspens, is further subdivided
into two subsections: Albidae (containing white poplars) and Trepidae (containing aspens). P.
tremula belongs to the Trepidae subsection together with P. tremuloides – its sister species from
North America.
9
1.1.1. Biology, ecology and distribution of European aspen
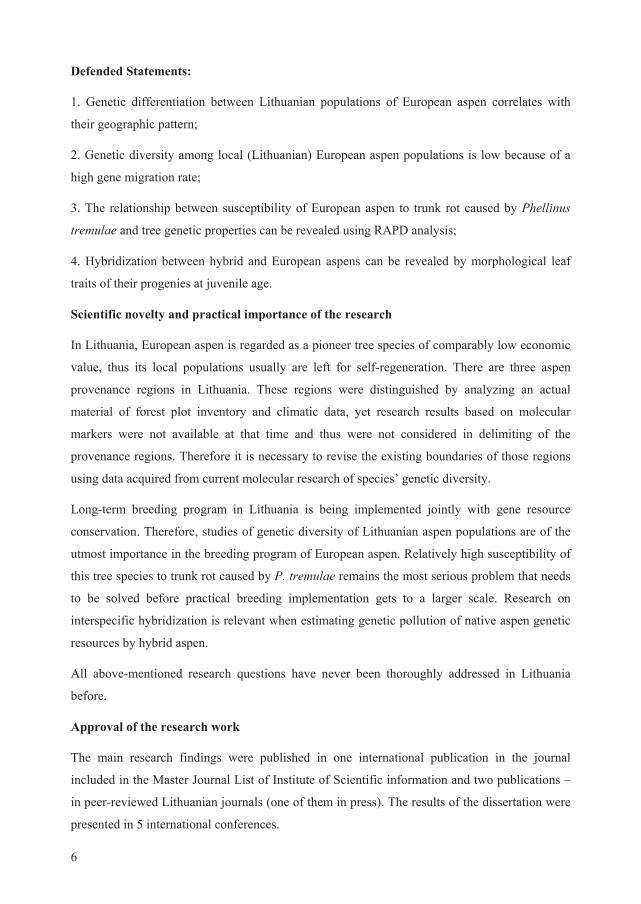
European aspen is widely distributed and considered to be the most widely spread tree species in
the world (Worrell, 1995). In Eurasia, this tree species is common in boreal and temperate forest
ecosystems. Supposedly, P. tremula has colonized Europe after the last glacial period from
several connected refugia near the ice cap (Fussi et al. 2010). In Eurasia, this tree species
currently is confined to Atlantic coast in the west and to the Pacific Ocean in the east, and
restricted in Fennoscandia as the northern limit of its natural range (Figure 1.1). At the southern
range of its distribution, P. tremula reaches high altitudes in mountains (up to 1600–2000 m
above sea level in the Alps, Caucasus and Pyrenees) (Wühlisch, 2009). In Eastern Asia,
European aspen is considered different enough to be classified as separate species P. davidiana
(Dode) Schneider (Wühlisch, 2009).
Fig. 1.1. Distribution map of European aspen (Populus tremula L.). Map: Ozolin ius (2003)
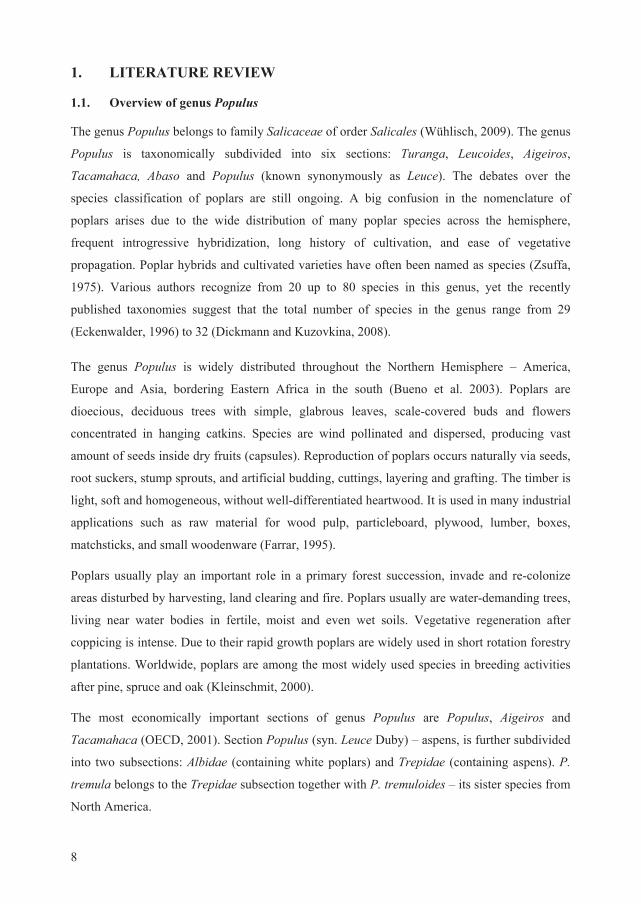
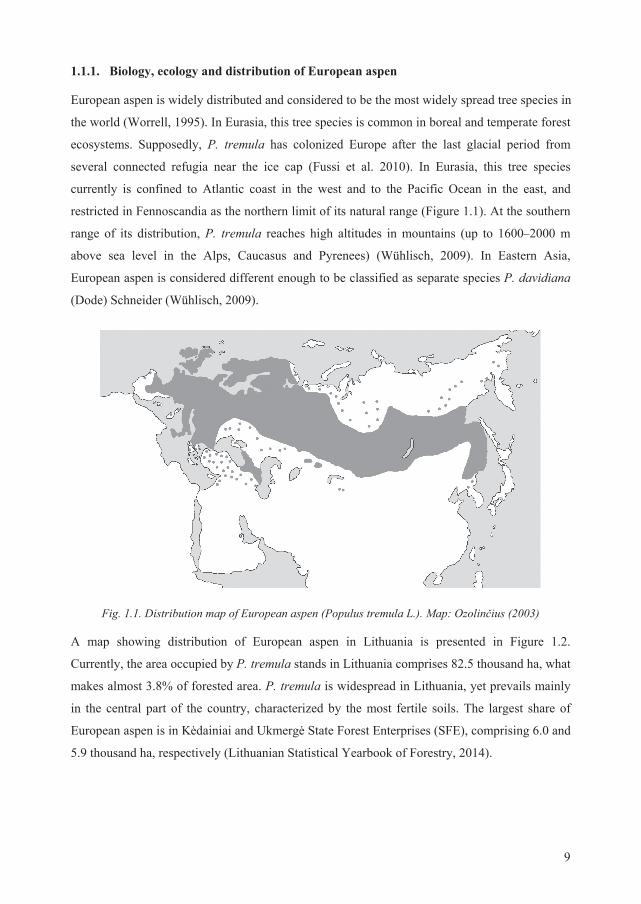
A map showing distribution of European aspen in Lithuania is presented in Figure 1.2.
Currently, the area occupied by P. tremula stands in Lithuania comprises 82.5 thousand ha, what
makes almost 3.8% of forested area. P. tremula is widespread in Lithuania, yet prevails mainly
in the central part of the country, characterized by the most fertile soils. The largest share of
European aspen is in K dainiai and Ukmerg State Forest Enterprises (SFE), comprising 6.0 and
5.9 thousand ha, respectively (Lithuanian Statistical Yearbook of Forestry, 2014).
10
Fig. 1.2. Distribution and abundance of European aspen in Lithuania. Map: Ozolin ius (2003)
European aspen usually occurs in mixed stands with Norway spruce and silver birch, while pure
stands are less common. Although the area of aspen-dominated stands in the country decreased
twofold by the end of the last century, the proportion of aspen in admixture with other tree
species (where aspen is not dominating) remains stable. Species composition in aspen stands
varies little over time. The mean age of aspen-dominated stands in Lithuania is 42 years
(Lithuanian Statistical Yearbook of Forestry, 2014).
Although the economic importance of P. tremula in Europe is limited by generally low
resistance to fungal diseases, its ecological importance as a keystone species in forest
biodiversity as habitat trees remains considerable. Large trees are associated with hundreds of
species of herbivorous and saprophytic invertebrates, fungi and epiphytic lichens (Kouki et al.
2004). Dead trunks of aspen serve as the main habitat to many specific insect and fungal species
(Kouki et al. 2004; Vehmas et al. 2009). P. tremula plays a large role and as a winter forage for
large herbivores (Ozolin ius, 2003), while hollow-bearing aspen trees are also important for
hall-nesting birds (Gjerde et al. 2005).
European aspen is a pronounced pioneer species that colonizes abandoned agricultural lands,
forest clear-cuts or fire-disturbed areas. In favorable growing conditions P. tremula can reach up
to 40 m in height and more than 1 m in diameter. Bark of the young tree is pale silvery-grey to
green, with smooth surface turning to fissured and dark grey with age. Leaves are nearly round,
11
slightly wider than long, 2–8 cm in diameter, with a coarsely toothed margin and flattened 4-8
cm long petiole. Leaves on seedlings and stem sprouts are heart-shaped to nearly triangular,
often much larger than regular leaves, up to 20 cm long; their petiole is also less flattened
(Wühlisch, 2009).
European aspen is a dioecious tree species. Sex determination system is located in a
chromosome 19, although the precise sex determination mechanism remains largely unknown
(Tuskan et al. 2012). Flowers of P. tremula are concentrated in catkins, flowering occurs in
early spring before leaf flushing. Seeds maturate 4–5 weeks after flowering (Latva-Karjanmaa et
al. 2003). Flowering of aspen usually begins at the age of 30–40 years, while single trees in open
areas can start flowering at 20 years, and suckers – even at 10 years of age (Kalela, 1945). P.
tremula produces seed almost every year, but exhibit masting, thus seed production varies every
year considerably (Houle, 1999; Shibata et al. 2002). Seed production is extremely high: one
catkin can hold up to 2000 seeds, and seed yield can attain 400–500 million per hectare
(Johnsson, 1942; Reim, 1929). European aspen seeds are very small and light (weight of 1,000
seeds is just 0.06–0.17 g) (Fystro, 1962). European aspen regenerates by seeds and vegetatively,
although sexual reproduction has been stated to be of minor importance (Worrell, 1995; Latva-
Karjanmaa et al. 2003). However, isoenzyme (Lopez-de-Heredia et al. 2004) and microsatellite
(SSR) studies (Suvanto and Latva-Karjanmaa, 2005) have shown that intra-population genetic
differentiation in this species is relatively high. This suggests the larger proportion of juveniles
is arising from seeds than previously thought (Myking et al. 2011). Vegetative reproduction in
aspen occurs via root suckers, thus forming clones of several ramets. According to high-
resolution molecular data, clone sizes in fact occurred to be smaller than previously recognized
using only morphological characters (Lopez-de-Heredia et al. 2004; Suvanto and Latva-
Karjanmaa, 2005).
The main ecologic delimiting factors of the species’ natural distribution are of the limited
tolerance to prolonged shade and interspecific competition, and susceptibility to fungal diseases
(trunk rot in particular); on the other hand, P. tremula is adaptive to a wide range of
environmental conditions. European aspen is frost-hardy and drought-resistant tree species. It
occurs on a wide range of soil types, although favors fertile and well drained soils (Worrell,
1995). These characteristics reflect wide ecological amplitude, which explains extensive
geographical range of distribution and early post-glacial appearance of the species (Myking et
al. 2011).
European aspen was the first tree species, which various latitudinal populations proved to be
different in critical day length for bud set in summer (Sylvén, 1940). Leaf abscission timing,
12
seasonal height and diameter increment varies in its latitudinal and altitudinal populations (Hall
et al. 2007; Fracheboud et al. 2009). Adaptive genetic variation ascertained for European aspen
is high taken at the population and species level as is characteristic for forest trees (König,
2005). While 60% of phenotypic variation explains the total variation, only 1% of the variation
among populations can be explained by neutral molecular markers (Hall et al. 2007). European
aspen is characterized by extensive gene flow which wipes out spatial genetic structure of P.
tremula populations (Lexer et al. 2005).
1.1.2. Sanitary condition of European aspen stands in Lithuania
Sanitary condition of European aspen is highly dependent on stand age. Age structure of aspen
stands in Lithuania: almost 49% of the aspen stands are mature, 35% of the stands are young
and only 16% could be rated as middle-aged and premature (Lithuanian Statistical Yearbook of
Forestry, 2014). In Lithuanian stands, a large proportion of mature aspen trees are affected by
fungal diseases. According to Lithuanian State Forest Service (personal communication), the
area of aspen stands affected by trunk rot disease was constantly decreasing due to sanitary clear
felling’s during the last decade (6977 ha in 2003, 4290 ha in 2007, 2707 ha in 2011 and 3167 ha
in 2014) (Lithuanian Statistical Yearbook of Forestry, 2014).
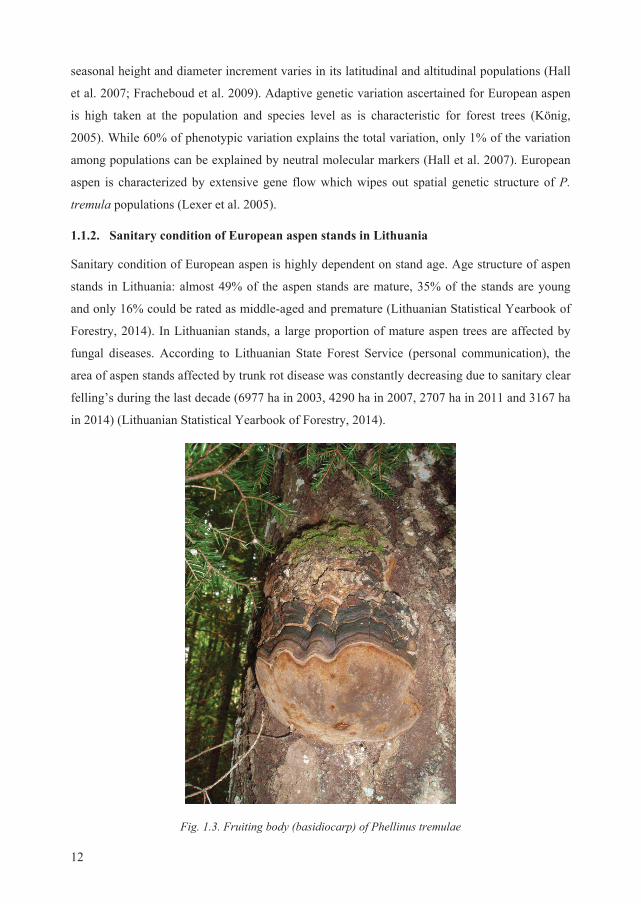
Fig. 1.3. Fruiting body (basidiocarp) of Phellinus tremulae
13
Sanitary conditions of aspen in Lithuania are foremost associated with an aspen trunk rot fungus
Phellinus tremulae (Bondartsev) Bondartsev & P. N. Borisov (Hymenochataceae). P. tremulae
is widely distributed in temperate and boreal Eurasia and North America (Niemelä, 1974) and in
many countries this fungus is considered as the most destructive pathogen of Populus spp.,
which often almost totally destroys the timber of aspen and limits timber crop rotation in
managed forest sites to merely 40–50 years (Manion, 1991). As the typical true heart-rot fungus,
P. tremulae is very host-specific species and in Europe occurs predominantly on living P.
tremula (Niemelä, 1974).
Basidiocarps typically are located in the tree crowns and produce huge quantities of spores with
a highly efficient airborne spread capacity (Sunhede and Vasiliauskas, 2002). The presence of
fruiting bodies (Figure 1.3) of P. tremulae usually implies that the larger part or entire trunk of
the tree has already been transformed to cull status (Allen et al. 1996).
Small twigs are considered to be the primary infection route of P. tremulae for stems of aspen,
although fresh wounds may serve as infection courts for this fungus as well (Holmer et al.
1994). Significant differences in amount and position of decay among aspen clones have been
reported decades ago (Wall, 1971). Thus, as the aspen clones seem to differ in susceptibility to
P. tremulae, investigations of genetic diversity and breeding of this tree species against the trunk
rot pathogen are required as this may result in future aspen stands with increased resistance
(Manion, 1991).
1.1.3. Hybridization of Populus spp.
Hybridization is the process of interbreeding between individuals belonging to different species,
or otherwise genetically divergent yet belonging to the same species. Hybridization is a complex
evolutionary phenomenon resulting in admixed offspring (Abbott et al. 2013). When Mayr
(1942) postulated concept of biological species, hybridization was seen as a rare incidence – i.e.
“good” species did not form hybrids. To date, concepts and definitions of hybridization and
introgression are judged differently. Hybridization is the initial cross (F1) between parental
species, and introgression occurs when hybrids backcross with one of their parental species and
only some of the genetic material is maintained in subsequent generations (Roe et al. 2014).
Fitness of newly formed hybrids depends on varying factors: genetic incompatibilities, epistasis,
and disruption of co-adapted gene complexes, deleterious gene interactions, heterosis,
transgressive segregation, or selective filtering of adaptive gene regions (Dobzhansky, 1970;
Burke and Arnold, 2001; Martinsen et al. 2001; Tiffin et al. 2001; Rieseberg et al. 2003).
14
Hybridization role is recognized in evolutionary species diversification, adaptation and
maintenance of biodiversity (Abbott et al. 2013). Hybridization is an important evolutionary
force with highly variable outcomes and it is observed frequently among plants (Arnold, 1997)
and animals (Mallet, 2005). Interspecific hybrids can be different (sometimes superior) over the
parental species, e.g. be characterized by increased vigor or be sterile and become evolutionary
dead end (Schweitzer et al. 2002; Arnold and Martin 2010; Whitney et al. 2010). Hybridization
can also be responsible for the new genetic variation (Butlin and Ritchie, 2013), together with
selective forces only the introgression of adaptive genes while maintaining distinct species
boundaries can be tolerated (Martinsen et al. 2001). Hybridization sometimes can result the
evolution of hybrid offspring into novel hybrid species (Rieseberg, 1997), erase species
boundaries (Rhymer and Simberloff, 1996; Seehausen, 2006), or occur with invasive exotic
species and “pollute” local populations and species (Schierenbeck and Ellstrand, 2009).
In nature, some plant taxa are known to form hybrid systems, such systems are formed in areas
where different species belonging to such taxa meet and form hybrid zones. Forest trees forming
such hybrid systems belong to genera Quercus (Petit et al. 2003a; Lepais and Gerber, 2011),
Eucalyptus (Field et al. 2011), Picea (Perron and Bousquet, 1997), Pinus (Cullingham et al.
2012) and Populus (Eckenwalder, 1984; Floate, 2004; Hamzeh et al. 2007; Thompson et al.
2010; LeBoldus et al. 2013).
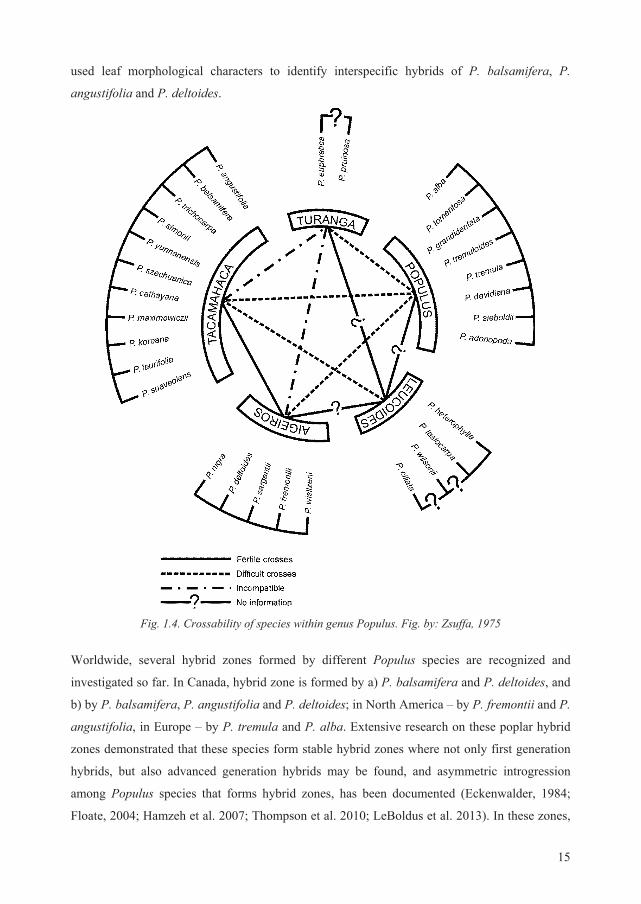
Genus Populus has pronounced interspecific hybridization. Hybrids within sections are
produced easily and often are more vigorous compared to their parental species (e.g. P.
tremuloides x P. tremula (Ilstedt and Gullberg, 1993)). Hybridization between the sections of
genus Populus is variable, e.g. Aigeiros and Tacamahaca do cross easily, while hybridization
Populus – Aigeiros, and Populus – Tacamahaca is a rare event, usually resulting in infertile
seeds or dwarfed seedlings (Zsuffa, 1975) (Figure 1.4). Crosses between sections are sometimes
easier achieved using interspecific hybrids, rather than pure species.
Interspecific hybrids in Populus section were subjected to extensive studies (Eckenwalder,
1984; Keim et al. 1989; Stettler et al. 1996; Dickmann et al. 2001; Floate, 2004; Fossati et al.
2004; Vanden Broeck et al. 2005; Lexer et al. 2005; 2007; 2010; Meirmans et al. 2010).
Identification of hybrid poplars is carried out mostly using molecular markers (Smulders et al.
2001; Meirmans et al. 2007; Talbot et al. 2011; Isabel et al. 2013). These markers are used not
only for identification of first generation hybrids (F1), but also to assess the advanced generation
hybrids and the level of introgression (Stölting et al. 2013). For identification of poplar hybrids,
both molecular and morphological characters are usually used. Floate (2004) has successfully
15
used leaf morphological characters to identify interspecific hybrids of P. balsamifera, P.
angustifolia and P. deltoides.
Fig. 1.4. Crossability of species within genus Populus. Fig. by: Zsuffa, 1975
Worldwide, several hybrid zones formed by different Populus species are recognized and
investigated so far. In Canada, hybrid zone is formed by a) P. balsamifera and P. deltoides, and
b) by P. balsamifera, P. angustifolia and P. deltoides; in North America – by P. fremontii and P.
angustifolia, in Europe – by P. tremula and P. alba. Extensive research on these poplar hybrid
zones demonstrated that these species form stable hybrid zones where not only first generation
hybrids, but also advanced generation hybrids may be found, and asymmetric introgression
among Populus species that forms hybrid zones, has been documented (Eckenwalder, 1984;
Floate, 2004; Hamzeh et al. 2007; Thompson et al. 2010; LeBoldus et al. 2013). In these zones,
16
hybridization rates differed greatly among different locations, where natural Populus
hybridization occurs (Meirmans et al. 2010; Thompson et al. 2010; Talbot et al. 2012).
Hybrid zone in central Europe formed by P. alba and P. tremula was extensively studied by C.
Lexer and his colleagues. Early research findings suggested the occurrence of introgression from
P. tremula to P. alba genome via P. tremula pollen (Lexer et al. 2005). DNA microsatellites
were used to assess admixture of P. tremula and P. alba in their hybrid zone and to map loci that
contribute to reproductive isolation and trait differences (Lexer et al. 2007). Joseph and Lexer
(2008) have developed a series of different markers suitable to investigate reproductive barriers
of P. tremula and P. alba. PCR-RFLP analysis of P. alba and P. tremula maternally inherited
chloroplast markers indicated hybridization events in the past, during postglacial migration.
Phylogeographic structure was found for P. alba, but not for P. tremula, which haplotype
diversity was evenly distributed among investigated populations (Fussi et al. 2010).
Reproductive isolation between P. tremula and P. alba was studied in Italian, Austrian and
Hungarian hybrid zones (Lexer et al. 2010; Lindtke et al. 2012). Many loci displayed greatly
increased between species heterozygosity in recombinant hybrids despite striking genetic
differentiation between the parental genomes. However, microsatellite markers are not the best
choice for introgression research because of their limited genomic coverage. Stölting et al.
(2013) have overcome this problem using SNP polymorphism screened using RAD (restriction
site associated DNA) sequencing. Obtained results showed great variation in genetic divergence.
Autocorrelations of genetic divergence were involved in low divergence blocks, thus suggesting
that allele sharing was caused by recent genetic flow and not by shared ancestral
polymorphisms. Further analysis of seedlings from European Populus hybrid zone indicates
strong post-zygotic selection that eliminated many hybrid seedlings (Lindtke et al. 2014). Post-
matting reproductive barriers in BC1 crosses demonstrated extensive segregation distortions,
favoring P. tremula donor genes over P. alba genes in more than 90% cases (Macaya-Sanz et al.
2011).
1.1.4. History of European aspen investigation with emphasis on genetic research
In Lithuania, investigation of European aspen started in 1931. Rauktys (1935), Mejeris (1936)
and other researchers published papers describing sanitary condition of local aspen stands. In
addition, some statistical data of aspen stands were published (Vil inskas, 1931; Jameikis, 1933;
Lietuvos mišk statistika, 1937). More comprehensive data about European aspen were
published in a monograph by J. Rauktys (1938) where he described morphological, biological
and ecological characteristics of this tree species. Four aspen subspecies were described in the
monograph, yet information on their abundance and distribution in Lithuania was not provided.
17
More extensive research on European aspen in Lithuania started only in the 70’s. At that time
Prof. L. Kairi kštis (Kairi kštis, 1962, 1963) described his research findings about species’
growth and ecological characteristics of P. tremula. Dr. V. Mikalaikevi ius investigated causal
agents of aspen trunk rot in Lithuanian forests, their biology and the extent of damage they
cause (Mikalaikevi ius, 1958a). The author distinguished some aspen forms according to a bark
color, bud flushing phenology, at the same time indicating the resistance of these forms to the
trunk rot (Mikalaikevi ius, 1958 a; b; 1959). During 1966–1968, extensive research on aspen
breeding, flowering and fruiting, hybridization and propagation was carried out by Ramanauskas
(1968). The author performed investigation of morphological aspen forms in Lithuania and
Kaliningrad District. Dr. R. Murkait (1974) reported that in Lithuania the major part of aspen
forest stands are composed of trees originating from coppice. She has distinguished aspen
morphological forms, determined pollen distribution in the tree crowns and possibilities to
disperse aspen by seeds. Research on aspen hybridization in Lithuania has been performed by A.
Malinauskas and A. Pli ra (Pli ra, 1993). It was shown that the most important factor for
hybridization is parental genotypes, rather than combination of different species from the section
Populus. Results of investigation carried out in mature European aspen stands in Lithuania
showed that the most of the species’ variation is explained by productivity and resistance
criteria, and that selection to breeding programs should be carried out using stem volume
increment ratio to crown projection area (Pli ra, 1993).
The investigation of polymorphism of P. tremula as a model tree species was carried out in a
large number of studies. P. tremula, P. tremuloides and their interspecies hybrids were
investigated using isozyme method by Gallo and Geburek (1991). Following discovery of PCR,
the research of aspen polymorphism has increased substantially. By utilizing RAPD method, a
total of 89 aspen genotypes were identified in Spain (Sanchez et al. 2000). Later on, genetic
differentiation of P. tremula was investigated using a microsatellite method (Gomez et al. 2003).
Swedish researchers have assessed polymorphism and haplotype structure of this tree species
using five different genes (Ingvarsson, 2005). Ingvarsson et al. (2008b) has investigated
utilization of SNP method fitochrome B2 locus polymorphisms and their effect on bud flushing
phenology. PCR-RFLP and microsatellite (SSR) methods were employed to reveal genetic
differentiation among Italian P. tremula populations (Salvini et al. 2001). Clonal structure of
European aspen in Finland was investigated using morphological traits and microsatellite
markers (Suvanto and Latva-Karjanmaa, 2005). This study demonstrated that clones of P.
tremula consisted on average of 2.3 ramets, and that most of the clones (70%) originated from a
single ramet. P. Ingvarsson (2008a) studied demographic history of P. tremula using nucleotide
18
polymorphism of 124 genes. The obtained results showed substantial nucleotide polymorphism
and the bottleneck in the demographic history of this species. Fussi et al. (2010) demonstrated
that it had several refugia during the last glacial period near the ice cap using PCR-RFLP
markers. The results suggested immigration scenario for this species. Investigation of SNP
polymorphisms confirmed the divergence between section Leuce and a group combining
sections Aigeiros and Tacamahaca (Fladung and Buschbom, 2009). Research carried out in
Scandinavia showed, that adaptive variation in European aspen stems from the standing genetic
variation within species, rather than from newly arising mutations. Adaptive characteristics were
found to be facilitated by an admixture of eastern and western P. tremula lineages during post-
glacial migration (De Carvalho et al. 2010).
Discovery of markers capable to discriminate among different species, hybrids and clones and
the possibility to fingerprint them brought a general breakthrough in tree population studies.
AFLP markers were used to fingerprint 44 species, clones and cultivars of the genus Populus
(Zhou et al. 2005). This was the first report of germplasm identification in all sections of the
genus. Fossati et al. (2005) has fingerprinted a collection of 66 commercial poplar cultivars
using AFLP and SSR markers. Ten microsatellite loci used by Liesebach et al. (2009) showed
good discriminatory power to distinguish among various clones of the genus Populus, even
among siblings. Schroeder and Fladung (2010) have developed molecular markers suitable for
discriminating among poplar species, hybrids and clones. The main challenge the authors had to
face was collection of pure species samples and validation of hybrid material for primer testing.
However, Schroeder et al. (2012) found chloroplast sequences suitable for barcoding of tree
individuals which made the discrimination easier.
Sequencing of P. trichocarpa genome (Tuskan et al. 2006) has shed more light on Populus
genome thus allowing scientists to carry out theoretical research based on database sequence
data. Using sequence database information, Unneberg et al. (2005) have recognized 70,000
possible expressed sequence tags (EST’s) in P. tremula and P. trichocarpa genomes. EST
sequences in databases were used to identify ancient polyploidy of Populus spp. (Sterck et al.
2005). Using SSR and AFLP markers, Pakull et al. (2009) have constructed a genetic linkage
map for P. tremula and P. tremuloides. This was the first genetic linkage map associating SSR
and AFLP markers to the physical genomes of P. tremula and P. tremuloides with direct link to
P. trichocarpa genomic sequence. Pakull et al. (2015) have developed a genetic marker
determining sex in P. tremula. Sex determination marker was developed using earlier obtained
results on sex-linked SSR markers that were mapped in linkage group 19 in Populus spp.
(Markussen et al. 2007; Pakull et al. 2011).
19
Following sequencing of P. trichocarpa genome, the advance in P. tremula research has also
started. Current research on Populus spp. concentrates on unraveling candidate genes for a
specific trait or genetic variation in genes responsible for a certain trait. In Sweden, a collection
of P. tremula trees representing different populations (SwAsp) was established (Luquez et al.
2008). This collection was created to facilitate genetic, genomic and physiological research of
this tree species. First phenotypic evaluation results of this collection were published by Luquez
et al. (2008). Adaptive population phenological differentiation was investigated among
European aspen stands from different longitudes using microsatellite method (Hall et al. 2007).
Ma et al. (2010) were looking for genetic variation in genes that control photoperiodic pathway
using the SwAsp collection. The authors didn’t recognize any SNPs associated with aspen’s
response to varying light regime across latitudinal gradient, but detected a large covariance in
allelic effects across populations for growth cessation. Onge (2006), however, found very little
variation in investigated genes coding flowering time of the species. The assessed variation
hasn’t been associated to any of the recorded morphological traits. Investigating the same
Swedish aspen collection, Bernhardsson and Ingvarsson (2012) found that genes associated with
inducible defense responses showed strong longitudinal clines identified by SNPs. Strømme et
al. (2014) has demonstrated that elevated temperature and UVB radiation does affect spring and
autumn phenology of P. tremula individuals originating from southern and eastern Finland.
1.2. Molecular techniques for tree research
1.2.1. DNA extraction from plant material
DNA extraction is crucial for any molecular investigation. DNA extraction from
microorganisms, human or animal tissue is already a routine procedure, whilst plants proved to
be an exception of the rule. There are plenty of protocols for DNA extraction from various plant
species and tissues published already (Murray and Thompson, 1980; Dellaporta et al. 1983;
Rogers and Bendich, 1985; Doyle and Doyle, 1987; Wagner et al. 1987; Bousquet et al. 1990;
Devey et al. 1991; 1996; Stewart and Via, 1993; Nelson et al. 1994; Dumolin et al. 1995; Jobes
et al. 1995; Kim et al. 1997; Lin and Kuo 1998; Tibbits et al. 2006). Many of these protocols
recommend DNA extraction from needles, leaves or buds. These tissues are the best source for
DNA from mature trees, although much effort is required to collect this type of samples as
mature trees are usually tall and sample collection requires special equipment and skills. Sample
collection from crowns of mature trees often results in a limited number of available samples
and narrows down the investigation which is critical in population studies. Tibbits et al. (2006)
described a method for DNA extraction using cambium tissue, but the collection of it is
destructive, and affects the tree.
20
Another challenge associated with tree DNA extraction is contamination by other molecular
substances. Trees possess high levels of endogenous tannins, phenolics and polysaccharides, and
contamination of extracted DNA by these cellular components can inhibit subsequent molecular
reactions. Removal of these components is crucial in molecular-based techniques. Some authors
(e.g., Murray and Thompson, 1980; Doyle and Doyle, 1987; Wagner et al. 1987) suggest using
DNA extraction buffers containing CTAB (cetyltrimethylammonium bromide), while others
(e.g., Stewart and Via, 1993; Devey et al. 1996; Kim et al. 1997) introduce PVP-40
(polyvinylpyrrollidone; mol wt. 40.000) based method. Other methods based on sodium dodecyl
sulfate (SDS) (Nelson et al. 1994; Jobes et al. 1995) and guanidine detergent (Lin and Kuo,
1998) are also published, but these protocols are rarely used for DNA extraction from tree
species, mostly because of complicated cleaning procedure that requires separating DNA from
contaminants (Tibbits et al. 2006).
1.2.2. Markers used in tree population biology
Forest trees are among the longest living plants on Earth. Such long lived species depend on
genetic diversity in their populations in order to survive and successfully reproduce in a
changing environment. Traditionally genetic diversity of forest trees is studied using classical
progeny tests and provenance trial approaches. Progeny tests and provenance trials are
established on different sites with different conditions and focus on quantitative economically or
biologically important traits such as volume growth, timber characteristics, survival, and
tolerance to environmental stress and to pathogen/pest resistance (Newton, 2003). Expression of
these traits is affected by environment and majority of them are polygenic. Traditional
quantitative genetic methods are used for assessment of the amount of variation and its
segmentation due to phenotypic, genetic, environment and genotypic × environment (G×E)
interactions (Mitchell-Olds and Rutledge, 1986). Progeny tests and provenance trials are
laborious, expensive and time-consuming and not always capable to reveal an accurate
assessment of genetic variation among and within populations (Wang and Szmidt, 2001). In the
1960s, population biologists employed protein electrophoresis, and more recently many more
molecular techniques to study genetic variation were offered (Lewontin, 1991). Later on,
population biologists employed methods that utilize data obtained by extracting, cutting,
amplifying and detecting DNA (Mitton, 1994).
DNA markers became a routine investigation technique in population biology after the
discovery of polymerase chain reaction (PCR) (Mullis and Faloona, 1987). DNA sequence
information is inherited over generations, therefore today DNA is considered as the most
accurate source of genetic variation (Wang and Szmidt, 2001). DNA sequences are particularly
21
versatile for designing various kinds of genetic markers: markers related to fitness or markers
that are not affected by selection; e.g. markers distributed in non-coding sequences and nearly
free of constrains imposed by natural selection (Parker et al. 1998). Currently PCR is a major
tool in the analysis of DNA and RNA. It enabled many new molecular marker systems to be
designed. Its relatively low cost, high speed, simple standard preparation and demand of micro
amounts of source material made PCR-based markers applicable to any species. PCR based
primers can be anonymous and random or sequence-specific. Arbitrary primers usually display
variation in anonymous regions of the genome, while specific primers show variations among
known genomic sequences (Wang and Szmidt, 2001).
1.2.2.1. RAPD
In comparison to other molecular techniques used in tree research, RAPD (Williams et al. 1990)
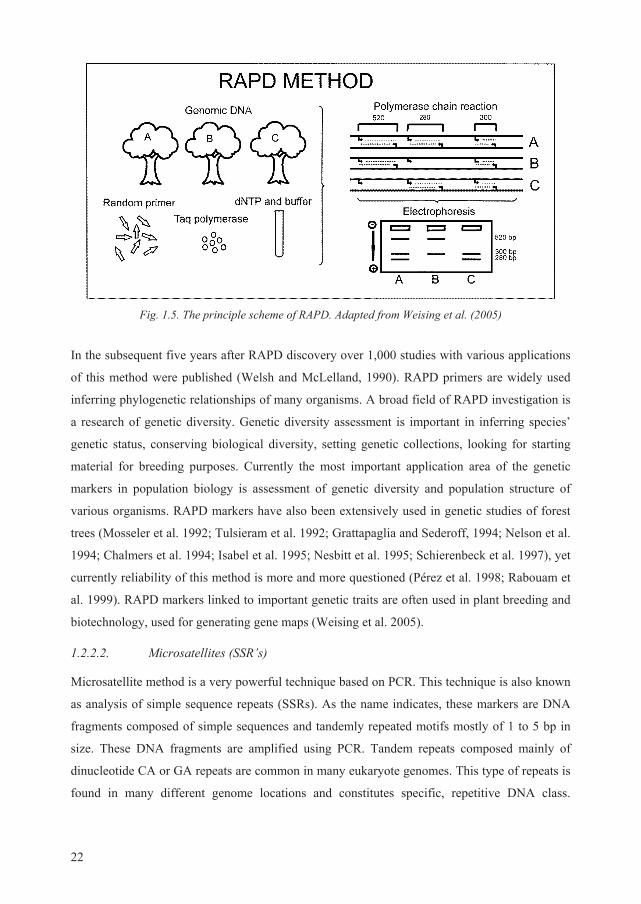
is considered a technically simple method. The basics of the RAPD method are shown in Figure
1.5. Utilizing this method 10-bp-long nucleotide primers are mostly used with a minimum 50%
G+C amount. 10-bp-long PCR primers usually link to the DNA matrix every single million of
base pairs. RAPD fragment is formed when primers link to the DNA matrix in correct
orientation and proximity to each other (yet no more than 4 kb) (Weising et al. 2005). If DNA
sequences flanked by primers differ in number of tandem repeats, the amplified fragments of the
same population will be of different length. However, fragments of the same length can differ in
sequence, thus this method cannot show the difference (Wang and Szmidt, 2001). In some
individuals, primer linkage sequences are mutated; in such case the RAPD fragment might not
form. Amplification products are usually analyzed on agarose gels, staining DNA with ethidium
bromide. Different matrix DNA quality and concentration, primer annealing, elongation and
DNA denaturation times can influence the length and amount of amplified fragments. RAPDs
are dominant Mendelian inheritance markers and usually detect variation in nuclear DNA
(Carlson et al. 1991; Bucci and Menozzi, 1993; Lu et al. 1995). Due to small chloroplast and
mitochondria genome sizes (Sederof et al. 1987) the chance of RAPD fragment to result from
cytoplasmic DNA is low (Kazan et al. 1993; Aagaard et al. 1998). Dominant nature of RAPD
markers is disadvantageous in population biology and genome mapping as homozygotes cannot
be distinguished from heterozygotes (Wang and Szmidt, 2001).
22
Fig. 1.5. The principle scheme of RAPD. Adapted from Weising et al. (2005)
In the subsequent five years after RAPD discovery over 1,000 studies with various applications
of this method were published (Welsh and McLelland, 1990). RAPD primers are widely used
inferring phylogenetic relationships of many organisms. A broad field of RAPD investigation is
a research of genetic diversity. Genetic diversity assessment is important in inferring species’
genetic status, conserving biological diversity, setting genetic collections, looking for starting
material for breeding purposes. Currently the most important application area of the genetic
markers in population biology is assessment of genetic diversity and population structure of
various organisms. RAPD markers have also been extensively used in genetic studies of forest
trees (Mosseler et al. 1992; Tulsieram et al. 1992; Grattapaglia and Sederoff, 1994; Nelson et al.
1994; Chalmers et al. 1994; Isabel et al. 1995; Nesbitt et al. 1995; Schierenbeck et al. 1997), yet
currently reliability of this method is more and more questioned (Pérez et al. 1998; Rabouam et
al. 1999). RAPD markers linked to important genetic traits are often used in plant breeding and
biotechnology, used for generating gene maps (Weising et al. 2005).
1.2.2.2. Microsatellites (SSR’s)
Microsatellite method is a very powerful technique based on PCR. This technique is also known
as analysis of simple sequence repeats (SSRs). As the name indicates, these markers are DNA
fragments composed of simple sequences and tandemly repeated motifs mostly of 1 to 5 bp in
size. These DNA fragments are amplified using PCR. Tandem repeats composed mainly of
dinucleotide CA or GA repeats are common in many eukaryote genomes. This type of repeats is
found in many different genome locations and constitutes specific, repetitive DNA class.
23
Microsatellite repeats commonly are flanked by unique sequences that are found only once in a
genome.
Microsatellite method originally was developed for human genome research (Weber and May,
1989), and later adapted to plants (Morgante and Olivieri, 1993). These markers are useful
because of high polymorphism rate – many different alleles are found in one microsatellite
locus, where each allele has a different number of tandem repeats. Different alleles in a
microsatellite locus are formed due to high mutation rate which arises because of DNA
synthesis “mistakes”. Longer microsatellite loci having more tandem repeats are more
polymorphic (Beckman and Weber, 1992). High polymorphism and co-dominant nature of these
markers makes them highly informative. For example, 8 microsatellite loci with 10 alleles each
may “generate” 83 trillions of possible genotypes. This makes them best markers of choice for
DNA fingerprinting, in forensic, human paternity analysis, and in many more research
applications. In the research of plants these markers are used for determination of mating system
and paternity, as well as for gene flow structure analyses. The microsatellite markers are
extremely useful in tree breeding programs (e.g. for identification of genetically improved seeds
in seed lot).
Microsatellites are detected in all main classes of living organisms so far, and are found more
frequently than it would be predicted solely on base composition (Tautz and Renz, 1984; Epplen
et al. 1993). SSRs are distributed more frequently in non-coding than in protein coding
sequences of the various organisms’ genomes (Wang et al. 1994; Field and Wills, 1996;
Edwards et al. 1998; Metzgar et al. 2000; Wren et al. 2000; Morgante et al. 2002). However,
many tri-nucleotide repeats associated with diseases are found using SSRs in coding sequences
of human genome (Nadir et al. 1996). Different SSR frequencies in coding and non-coding
regions are found because of the selection against frame shift mutations resulting in length
changes in non-triplet repeats in coding regions (Liu et al. 1999; Dokholyan et al. 2000).
Eukaryotic organisms have three times more repeat sequences in protein coding sequences than
prokaryotes. SSR repeat families in prokaryotes and eukaryotes are clustered in non-
homologous proteins. Eukaryotes incorporating more repeats may have an evolutionary
advantage because of faster adaptation to a changing environment (Marcotte et al. 1999).
SSRs are considered evolutionary neutral, but significant part of them is proven to be
functionally significant (Li et al. 2002a); for example, they play a role in chromatin organization
(Cuadrado and Schwarzacher, 1998; Li et al. 2000a; b; c; 2002b; Röder et al. 1998). SSRs are
also significant in DNA organization, as they allow DNA sequence to form simple and complex
loop folding patterns. These patterns can have important regulation function on gene expression
24
(Catasti et al. 1999; Fabregat et al. 2001). Simple sequence multiply mainly constitutes
centromeric and telomeric regions of chromosomes (Centola and Carbon, 1994; Murphy and
Karpen, 1995; Schmidt and Heslop-Harrison, 1996; Brandes et al. 1997; Cambareri et al. 1998;
Areshchenkova and Ganal, 1999). The different organism’s centromeres are composed of SSRs
indicating strong evolutionary link between centromere structure and function (Eichler, 1999).
SSRs are also affecting gene activity and act as transcription elements in promoter regions of
heat-shock protein gene hsp26 in Drosophila (Sandaltzopoulos et al. 1995), in Aspergillus (Punt
et al. 1990), and Phytophthora (Chen and Roxby, 1997). SSRs are acting like transcription
regulatory elements when they are found in introns (Meloni et al. 1998; Gebhardt et al. 1999;
2000). Young et al. (2000b) noticed that triplet SSRs are preferentially located in regulatory
genes related to transcription and signal transduction but are under-represented in genes of
structural proteins. As confirmed in many studies, gene translation is affected by SSRs (Ivanov
et al. 1992; Sandberg and Schalling, 1997; Henaut et al. 1998; Martin-Farmer and Janssen,
1999; Timchenko et al. 1999).
Various SSR functions and effects, their abundance and distribution are associated with their
mutation rates. SSRs mutation rates depend on species, repeat type, loci and alleles, age and sex
(Brock et al. 1999; Hancock, 1999; Ellegren, 2000; Schlötterer, 2000), but in general SSR
mutation rate is very high (10-2–10-6 events per locus per generation) as compared to point
mutations (Li et al. 2002a). SSR mutations predominantly arise as changes in repeat number.
Such high SSR mutation rates can be explained in two ways: a) DNA slippage during DNA
replication (Tachida and Iizuka, 1992) and b) recombination between DNA strands (Harding et
al. 1992).
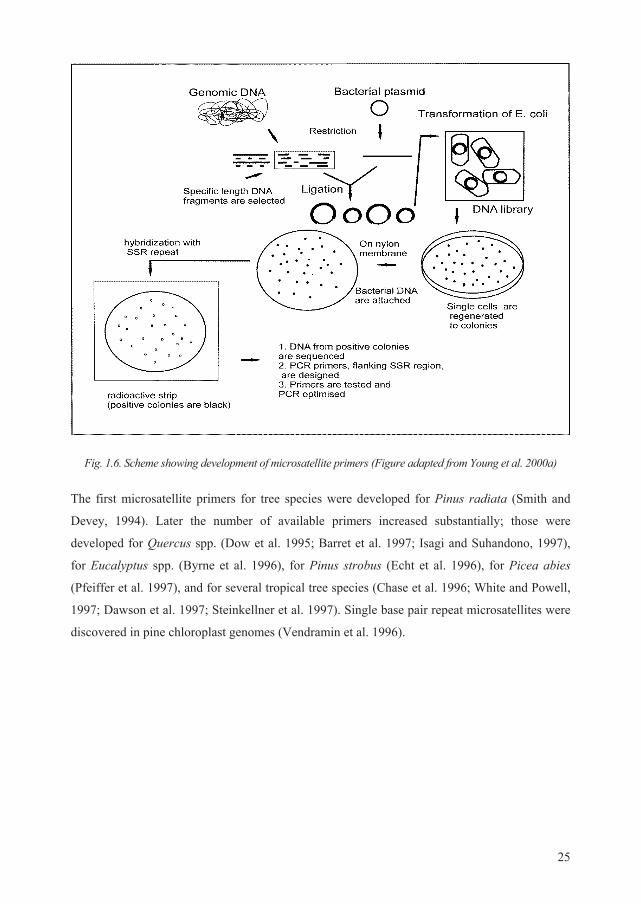
Microsatellite sequences are usually isolated from genomic libraries by screening them with
specific repeat motifs as probes. Clones having a repeat motif are thereafter sequenced. Non
repetitive DNA sequences flanking repetitive motif region are used to design primers for PCR
amplification. Microsatellite markers are multiallelic, widely dispersed across the genome and
relatively easily scored (Morgante and Oliveri, 1993; Devey et al. 1996; Powel et al. 1996;
Barreneche et al. 1998). The microsatellite primer development scheme is presented in Figure
1.6.
25
Fig. 1.6. Scheme showing development of microsatellite primers (Figure adapted from Young et al. 2000a)
The first microsatellite primers for tree species were developed for Pinus radiata (Smith and
Devey, 1994). Later the number of available primers increased substantially; those were
developed for Quercus spp. (Dow et al. 1995; Barret et al. 1997; Isagi and Suhandono, 1997),
for Eucalyptus spp. (Byrne et al. 1996), for Pinus strobus (Echt et al. 1996), for Picea abies
(Pfeiffer et al. 1997), and for several tropical tree species (Chase et al. 1996; White and Powell,
1997; Dawson et al. 1997; Steinkellner et al. 1997). Single base pair repeat microsatellites were
discovered in pine chloroplast genomes (Vendramin et al. 1996).
26
2. MATERIALS AND METHODS
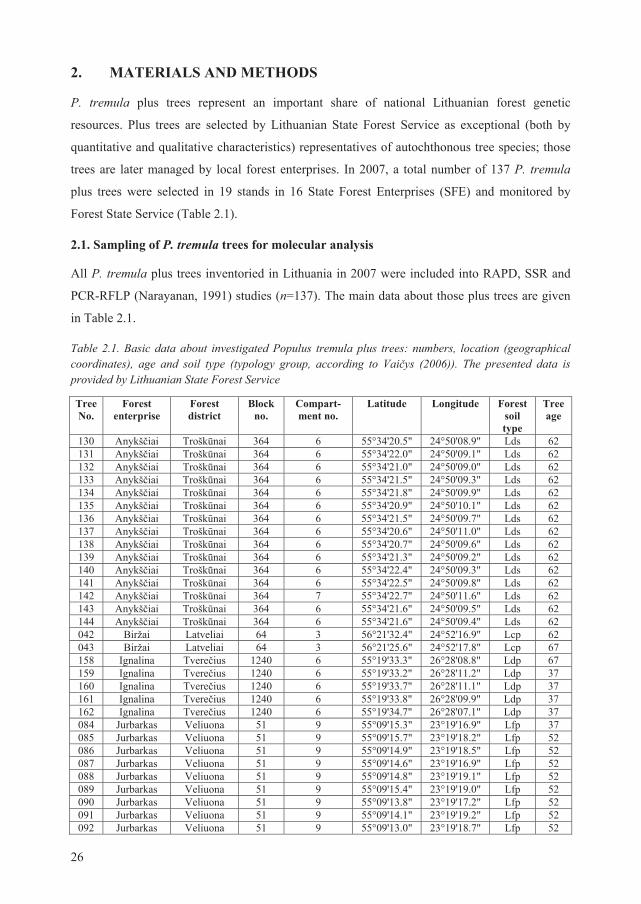
P. tremula plus trees represent an important share of national Lithuanian forest genetic
resources. Plus trees are selected by Lithuanian State Forest Service as exceptional (both by
quantitative and qualitative characteristics) representatives of autochthonous tree species; those
trees are later managed by local forest enterprises. In 2007, a total number of 137 P. tremula
plus trees were selected in 19 stands in 16 State Forest Enterprises (SFE) and monitored by
Forest State Service (Table 2.1).
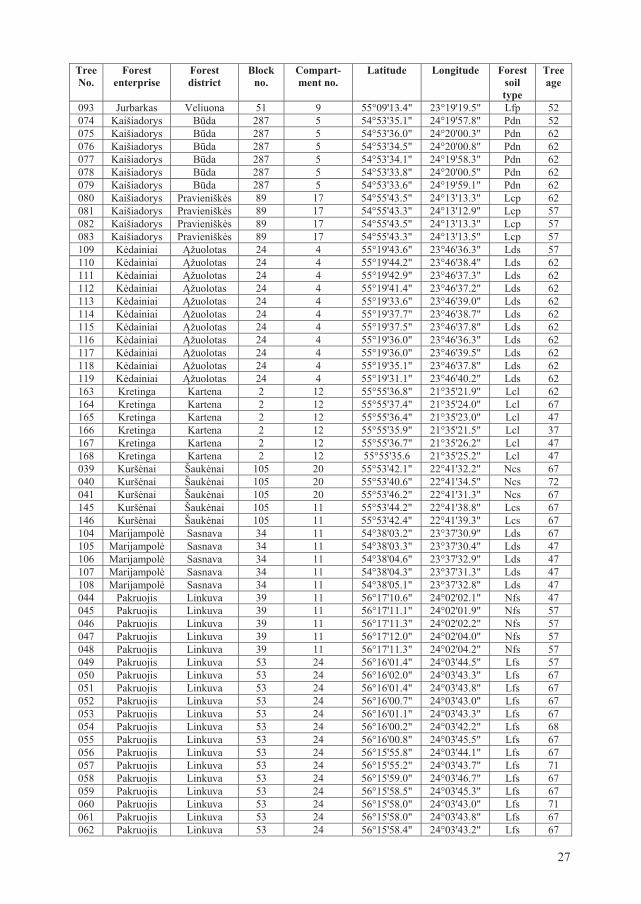
2.1. Sampling of P. tremula trees for molecular analysis
All P. tremula plus trees inventoried in Lithuania in 2007 were included into RAPD, SSR and
PCR-RFLP (Narayanan, 1991) studies (n=137). The main data about those plus trees are given
in Table 2.1.
Table 2.1. Basic data about investigated Populus tremula plus trees: numbers, location (geographical coordinates), age and soil type (typology group, according to Vai ys (2006)). The presented data is provided by Lithuanian State Forest Service
Tree No.
Forest enterprise
Forest district
Block no.
Compart- ment no.
Latitude Longitude Forest soil type
Tree age
130 Anykš iai Trošk nai 364 6 55°34'20.5" 24°50'08.9" Lds 62 131 Anykš iai Trošk nai 364 6 55°34'22.0" 24°50'09.1" Lds 62 132 Anykš iai Trošk nai 364 6 55°34'21.0" 24°50'09.0" Lds 62 133 Anykš iai Trošk nai 364 6 55°34'21.5" 24°50'09.3" Lds 62 134 Anykš iai Trošk nai 364 6 55°34'21.8" 24°50'09.9" Lds 62 135 Anykš iai Trošk nai 364 6 55°34'20.9" 24°50'10.1" Lds 62 136 Anykš iai Trošk nai 364 6 55°34'21.5" 24°50'09.7" Lds 62 137 Anykš iai Trošk nai 364 6 55°34'20.6" 24°50'11.0" Lds 62 138 Anykš iai Trošk nai 364 6 55°34'20.7" 24°50'09.6" Lds 62 139 Anykš iai Trošk nai 364 6 55°34'21.3" 24°50'09.2" Lds 62 140 Anykš iai Trošk nai 364 6 55°34'22.4" 24°50'09.3" Lds 62 141 Anykš iai Trošk nai 364 6 55°34'22.5" 24°50'09.8" Lds 62 142 Anykš iai Trošk nai 364 7 55°34'22.7" 24°50'11.6" Lds 62 143 Anykš iai Trošk nai 364 6 55°34'21.6" 24°50'09.5" Lds 62 144 Anykš iai Trošk nai 364 6 55°34'21.6" 24°50'09.4" Lds 62 042 Biržai Latveliai 64 3 56°21'32.4" 24°52'16.9" Lcp 62 043 Biržai Latveliai 64 3 56°21'25.6" 24°52'17.8" Lcp 67 158 Ignalina Tvere ius 1240 6 55°19'33.3" 26°28'08.8" Ldp 67 159 Ignalina Tvere ius 1240 6 55°19'33.2" 26°28'11.2" Ldp 37 160 Ignalina Tvere ius 1240 6 55°19'33.7" 26°28'11.1" Ldp 37 161 Ignalina Tvere ius 1240 6 55°19'33.8" 26°28'09.9" Ldp 37 162 Ignalina Tvere ius 1240 6 55°19'34.7" 26°28'07.1" Ldp 37 084 Jurbarkas Veliuona 51 9 55°09'15.3" 23°19'16.9" Lfp 37 085 Jurbarkas Veliuona 51 9 55°09'15.7" 23°19'18.2" Lfp 52 086 Jurbarkas Veliuona 51 9 55°09'14.9" 23°19'18.5" Lfp 52 087 Jurbarkas Veliuona 51 9 55°09'14.6" 23°19'16.9" Lfp 52 088 Jurbarkas Veliuona 51 9 55°09'14.8" 23°19'19.1" Lfp 52 089 Jurbarkas Veliuona 51 9 55°09'15.4" 23°19'19.0" Lfp 52 090 Jurbarkas Veliuona 51 9 55°09'13.8" 23°19'17.2" Lfp 52 091 Jurbarkas Veliuona 51 9 55°09'14.1" 23°19'19.2" Lfp 52 092 Jurbarkas Veliuona 51 9 55°09'13.0" 23°19'18.7" Lfp 52
27
Tree No.
Forest enterprise
Forest district
Block no.
Compart-ment no.
Latitude Longitude Forest soil type
Tree age
093 Jurbarkas Veliuona 51 9 55°09'13.4" 23°19'19.5" Lfp 52 074 Kaišiadorys B da 287 5 54°53'35.1" 24°19'57.8" Pdn 52 075 Kaišiadorys B da 287 5 54°53'36.0" 24°20'00.3" Pdn 62 076 Kaišiadorys B da 287 5 54°53'34.5" 24°20'00.8" Pdn 62 077 Kaišiadorys B da 287 5 54°53'34.1" 24°19'58.3" Pdn 62 078 Kaišiadorys B da 287 5 54°53'33.8" 24°20'00.5" Pdn 62 079 Kaišiadorys B da 287 5 54°53'33.6" 24°19'59.1" Pdn 62 080 Kaišiadorys Pravienišk s 89 17 54°55'43.5" 24°13'13.3" Lcp 62 081 Kaišiadorys Pravienišk s 89 17 54°55'43.3" 24°13'12.9" Lcp 57 082 Kaišiadorys Pravienišk s 89 17 54°55'43.5" 24°13'13.3" Lcp 57 083 Kaišiadorys Pravienišk s 89 17 54°55'43.3" 24°13'13.5" Lcp 57 109 K dainiai žuolotas 24 4 55°19'43.6" 23°46'36.3" Lds 57 110 K dainiai žuolotas 24 4 55°19'44.2" 23°46'38.4" Lds 62 111 K dainiai žuolotas 24 4 55°19'42.9" 23°46'37.3" Lds 62 112 K dainiai žuolotas 24 4 55°19'41.4" 23°46'37.2" Lds 62 113 K dainiai žuolotas 24 4 55°19'33.6" 23°46'39.0" Lds 62 114 K dainiai žuolotas 24 4 55°19'37.7" 23°46'38.7" Lds 62 115 K dainiai žuolotas 24 4 55°19'37.5" 23°46'37.8" Lds 62 116 K dainiai žuolotas 24 4 55°19'36.0" 23°46'36.3" Lds 62 117 K dainiai žuolotas 24 4 55°19'36.0" 23°46'39.5" Lds 62 118 K dainiai žuolotas 24 4 55°19'35.1" 23°46'37.8" Lds 62 119 K dainiai žuolotas 24 4 55°19'31.1" 23°46'40.2" Lds 62 163 Kretinga Kartena 2 12 55°55'36.8" 21°35'21.9" Lcl 62 164 Kretinga Kartena 2 12 55°55'37.4" 21°35'24.0" Lcl 67 165 Kretinga Kartena 2 12 55°55'36.4" 21°35'23.0" Lcl 47 166 Kretinga Kartena 2 12 55°55'35.9" 21°35'21.5" Lcl 37 167 Kretinga Kartena 2 12 55°55'36.7" 21°35'26.2" Lcl 47 168 Kretinga Kartena 2 12 55°55'35.6 21°35'25.2" Lcl 47 039 Kurš nai Šauk nai 105 20 55°53'42.1" 22°41'32.2" Ncs 67 040 Kurš nai Šauk nai 105 20 55°53'40.6" 22°41'34.5" Ncs 72 041 Kurš nai Šauk nai 105 20 55°53'46.2" 22°41'31.3" Ncs 67 145 Kurš nai Šauk nai 105 11 55°53'44.2" 22°41'38.8" Lcs 67 146 Kurš nai Šauk nai 105 11 55°53'42.4" 22°41'39.3" Lcs 67 104 Marijampol Sasnava 34 11 54°38'03.2" 23°37'30.9" Lds 67 105 Marijampol Sasnava 34 11 54°38'03.3" 23°37'30.4" Lds 47 106 Marijampol Sasnava 34 11 54°38'04.6" 23°37'32.9" Lds 47 107 Marijampol Sasnava 34 11 54°38'04.3" 23°37'31.3" Lds 47 108 Marijampol Sasnava 34 11 54°38'05.1" 23°37'32.8" Lds 47 044 Pakruojis Linkuva 39 11 56°17'10.6" 24°02'02.1" Nfs 47 045 Pakruojis Linkuva 39 11 56°17'11.1" 24°02'01.9" Nfs 57 046 Pakruojis Linkuva 39 11 56°17'11.3" 24°02'02.2" Nfs 57 047 Pakruojis Linkuva 39 11 56°17'12.0" 24°02'04.0" Nfs 57 048 Pakruojis Linkuva 39 11 56°17'11.3" 24°02'04.2" Nfs 57 049 Pakruojis Linkuva 53 24 56°16'01.4" 24°03'44.5" Lfs 57 050 Pakruojis Linkuva 53 24 56°16'02.0" 24°03'43.3" Lfs 67 051 Pakruojis Linkuva 53 24 56°16'01.4" 24°03'43.8" Lfs 67 052 Pakruojis Linkuva 53 24 56°16'00.7" 24°03'43.0" Lfs 67 053 Pakruojis Linkuva 53 24 56°16'01.1" 24°03'43.3" Lfs 67 054 Pakruojis Linkuva 53 24 56°16'00.2" 24°03'42.2" Lfs 68 055 Pakruojis Linkuva 53 24 56°16'00.8" 24°03'45.5" Lfs 67 056 Pakruojis Linkuva 53 24 56°15'55.8" 24°03'44.1" Lfs 67 057 Pakruojis Linkuva 53 24 56°15'55.2" 24°03'43.7" Lfs 71 058 Pakruojis Linkuva 53 24 56°15'59.0" 24°03'46.7" Lfs 67 059 Pakruojis Linkuva 53 24 56°15'58.5" 24°03'45.3" Lfs 67 060 Pakruojis Linkuva 53 24 56°15'58.0" 24°03'43.0" Lfs 71 061 Pakruojis Linkuva 53 24 56°15'58.0" 24°03'43.8" Lfs 67 062 Pakruojis Linkuva 53 24 56°15'58.4" 24°03'43.2" Lfs 67
28
Tree No.
Forest enterprise
Forest district
Block no.
Compart-ment no.
Latitude Longitude Forest soil type
Tree age
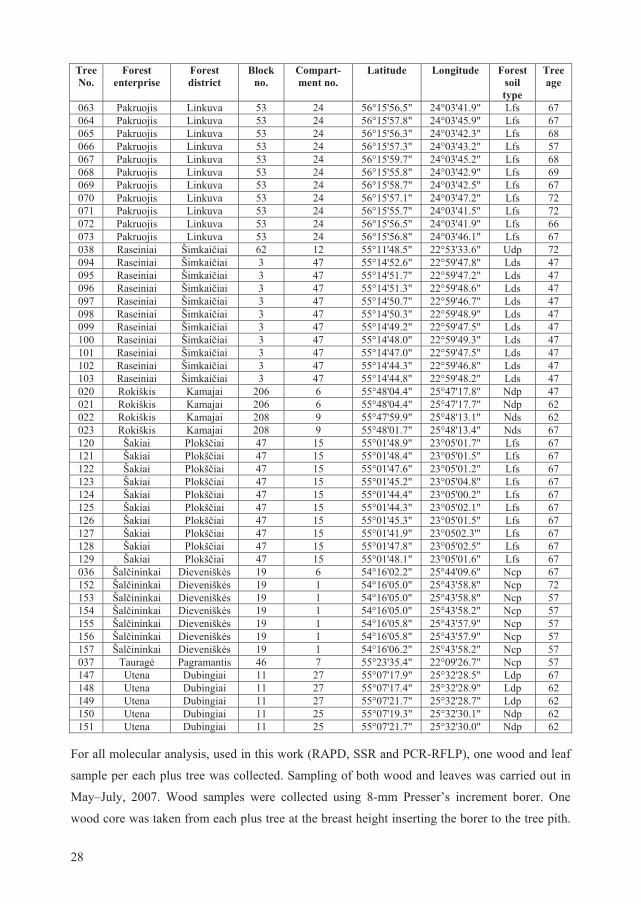
063 Pakruojis Linkuva 53 24 56°15'56.5" 24°03'41.9" Lfs 67 064 Pakruojis Linkuva 53 24 56°15'57.8" 24°03'45.9" Lfs 67 065 Pakruojis Linkuva 53 24 56°15'56.3" 24°03'42.3" Lfs 68 066 Pakruojis Linkuva 53 24 56°15'57.3" 24°03'43.2" Lfs 57 067 Pakruojis Linkuva 53 24 56°15'59.7" 24°03'45.2" Lfs 68 068 Pakruojis Linkuva 53 24 56°15'55.8" 24°03'42.9" Lfs 69 069 Pakruojis Linkuva 53 24 56°15'58.7" 24°03'42.5" Lfs 67 070 Pakruojis Linkuva 53 24 56°15'57.1" 24°03'47.2" Lfs 72 071 Pakruojis Linkuva 53 24 56°15'55.7" 24°03'41.5" Lfs 72 072 Pakruojis Linkuva 53 24 56°15'56.5" 24°03'41.9" Lfs 66 073 Pakruojis Linkuva 53 24 56°15'56.8" 24°03'46.1" Lfs 67 038 Raseiniai Šimkai iai 62 12 55°11'48.5" 22°53'33.6" Udp 72 094 Raseiniai Šimkai iai 3 47 55°14'52.6" 22°59'47.8" Lds 47 095 Raseiniai Šimkai iai 3 47 55°14'51.7" 22°59'47.2" Lds 47 096 Raseiniai Šimkai iai 3 47 55°14'51.3" 22°59'48.6" Lds 47 097 Raseiniai Šimkai iai 3 47 55°14'50.7" 22°59'46.7" Lds 47 098 Raseiniai Šimkai iai 3 47 55°14'50.3" 22°59'48.9" Lds 47 099 Raseiniai Šimkai iai 3 47 55°14'49.2" 22°59'47.5" Lds 47 100 Raseiniai Šimkai iai 3 47 55°14'48.0" 22°59'49.3" Lds 47 101 Raseiniai Šimkai iai 3 47 55°14'47.0" 22°59'47.5" Lds 47 102 Raseiniai Šimkai iai 3 47 55°14'44.3" 22°59'46.8" Lds 47 103 Raseiniai Šimkai iai 3 47 55°14'44.8" 22°59'48.2" Lds 47 020 Rokiškis Kamajai 206 6 55°48'04.4" 25°47'17.8" Ndp 47 021 Rokiškis Kamajai 206 6 55°48'04.4" 25°47'17.7" Ndp 62 022 Rokiškis Kamajai 208 9 55°47'59.9" 25°48'13.1" Nds 62 023 Rokiškis Kamajai 208 9 55°48'01.7" 25°48'13.4" Nds 67 120 Šakiai Plokš iai 47 15 55°01'48.9" 23°05'01.7" Lfs 67 121 Šakiai Plokš iai 47 15 55°01'48.4" 23°05'01.5" Lfs 67 122 Šakiai Plokš iai 47 15 55°01'47.6" 23°05'01.2" Lfs 67 123 Šakiai Plokš iai 47 15 55°01'45.2" 23°05'04.8" Lfs 67 124 Šakiai Plokš iai 47 15 55°01'44.4" 23°05'00.2" Lfs 67 125 Šakiai Plokš iai 47 15 55°01'44.3" 23°05'02.1" Lfs 67 126 Šakiai Plokš iai 47 15 55°01'45.3" 23°05'01.5" Lfs 67 127 Šakiai Plokš iai 47 15 55°01'41.9" 23°0502.3'" Lfs 67 128 Šakiai Plokš iai 47 15 55°01'47.8" 23°05'02.5" Lfs 67 129 Šakiai Plokš iai 47 15 55°01'48.1" 23°05'01.6" Lfs 67 036 Šal ininkai Dievenišk s 19 6 54°16'02.2" 25°44'09.6" Ncp 67 152 Šal ininkai Dievenišk s 19 1 54°16'05.0" 25°43'58.8" Ncp 72 153 Šal ininkai Dievenišk s 19 1 54°16'05.0" 25°43'58.8" Ncp 57 154 Šal ininkai Dievenišk s 19 1 54°16'05.0" 25°43'58.2" Ncp 57 155 Šal ininkai Dievenišk s 19 1 54°16'05.8" 25°43'57.9" Ncp 57 156 Šal ininkai Dievenišk s 19 1 54°16'05.8" 25°43'57.9" Ncp 57 157 Šal ininkai Dievenišk s 19 1 54°16'06.2" 25°43'58.2" Ncp 57 037 Taurag Pagramantis 46 7 55°23'35.4" 22°09'26.7" Ncp 57 147 Utena Dubingiai 11 27 55°07'17.9" 25°32'28.5" Ldp 67 148 Utena Dubingiai 11 27 55°07'17.4" 25°32'28.9" Ldp 62 149 Utena Dubingiai 11 27 55°07'21.7" 25°32'28.7" Ldp 62 150 Utena Dubingiai 11 25 55°07'19.3" 25°32'30.1" Ndp 62 151 Utena Dubingiai 11 25 55°07'21.7" 25°32'30.0" Ndp 62
For all molecular analysis, used in this work (RAPD, SSR and PCR-RFLP), one wood and leaf
sample per each plus tree was collected. Sampling of both wood and leaves was carried out in
May–July, 2007. Wood samples were collected using 8-mm Presser’s increment borer. One
wood core was taken from each plus tree at the breast height inserting the borer to the tree pith.
29
Before each sampling the borer was sterilized with 96% ethanol. Collected wood cores were
placed in sterile plastic containers. Leaf samples for DNA extraction were collected from the
upper part of tree crowns using SherrillTree BigShot® line launcher (SherrillTree Inc.). Only
sound looking, fully developed and mechanically intact leaves were sampled. Fresh leaf samples
were immediately placed into plastic sample bags containing self-indicating silica gel
(approximately 10–15 g of silica gel for 1 g of plant material).
For evaluation of DNA extraction protocols we randomly selected two aspen trees in Dubrava
State Forest Enterprise, Vaišvydava Forest district, 54°51'39.2" N, 24°4' 2305" E. Wood and
leaf samples from these two trees were collected as described above in May of 2007.
For microsatellite analysis (SSR) we sampled 177 P. tremula individuals in addition to
European aspen plus tree samples (n=314) in July–September, 2014 (Table 2.2). Selected trees
originated from the same forest stands as plus trees (Table 2.1). For microsatellite analysis only
leaf samples were collected. Sampling was performed as described above.
Table 2.2. Number of Populus tremula trees sampled for microsatellite analysis
State Forest Enterprise
No. of plus trees (2007)
No. of additionally sampled trees
(2014)a
State Forest Enterprise
No. of plus trees (2007)
No. of additionally sampled trees
(2014)a Anykš iai 15 2 Marijampol 5 12 Biržai 2 16 Pakruojis 30 0 Ignalina 5 14 Raseiniai 11 7 Jurbarkas 10 8 Rokiškis 4 12 Kaišiadorys 10 11 Šakiai 10 10 K dainiai 11 11 Šal ininkai 7 13 Kretinga 6 16 Taurag 1 16 Kurš nai 5 16 Utena 5 13
a Within the State Forest Enterprises the additional trees were sampled in vicinity to the inventoried plus trees (see Table 2.1.)
Wood and leaf samples of additional 7 trees exhibiting clear P. tremulae infection and 2 sound
looking trees were collected in Biržai, Ignalina, Kretinga, Raseiniai, Rokiškis, Šal ininkai,
Taurag and Utena SFE’s in May–July, 2007. These 9 trees have been selected from the same
forest stands as plus trees and were used as reference material in PCR-RFLP study.
2.2. Assessment of tree and stand characteristics
In order to assess and compare quality traits of P. tremula plus trees, 30 additional European
aspen trees (non-plus trees) per each plus trees containing stand (n=19) were subjected for
detailed evaluation in May–July, 2007. In total, 570 such trees were evaluated. These trees were
randomly selected yet always in a close vicinity to the aspen plus trees (Table 2.1.).
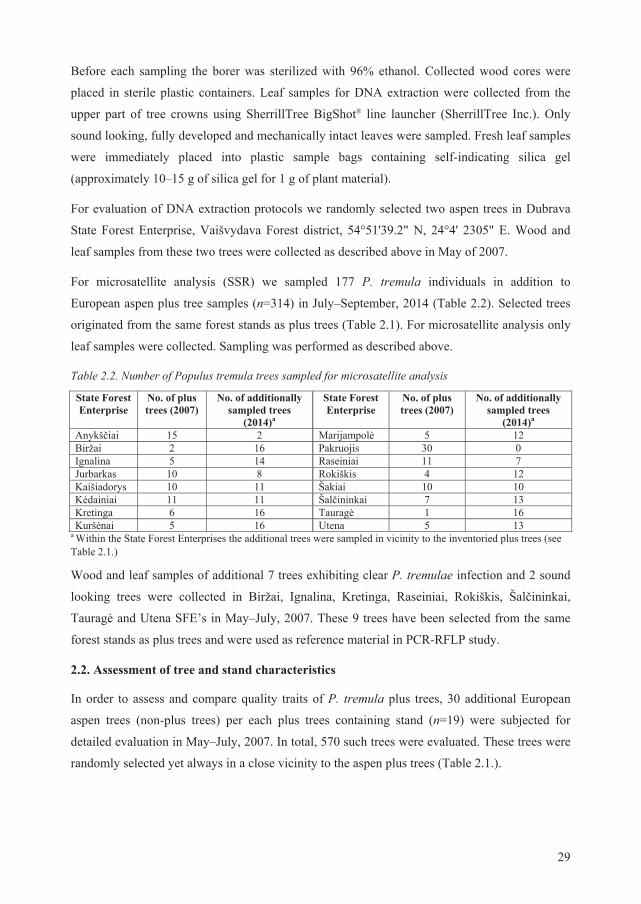
30
Table 2.3. Criteria values for Populus tremula phenotypic evaluation. The scoring system is made according to assessment methodology of forest tree breeding value used by Lithuanian State Forest Service Scale, score Criteria
1 2 3 4 5
Stem form Few bends in less than 1/3 of stem length
One bend in less than 1/3 of stem length
Bend in the lower part of the stem, in more than 1/3 of stem length
Bend in the upper 1/3 part of the stem
Straight
Branch thickness
Thick branches, tubers are present
Medium thick branches
Thin branches – –
Stem presence in crown part
Stem is absent in crown part, crown starts in the lower half of the tree height
Stem is absent in crown part, crown starts in the upper ½ of the tree height
Stem is present only in the lower part of the crown
Stem is present, branching only in the upper part of the crown
Stem is present through the whole crown
Occlusion of branch wounds occurring following branch dieback at the sites of their attachment
Occlusion of wounds is very poor; big wounds are not closed. Stem with nodules.
Occlusion of wounds is poor, big scars are visible on the stem. Stem with nodules.
Occlusion of wounds is intermediate. Wounds of smaller branches are occluded, while occlusion of larger branches is not always successful. Stem is smooth, yet in some places has nodules.
Occlusion of wounds is good; the sites of branch attachment are clearly visible. Stem is smooth.
Occlusion of wounds is very good; it is hard to notice the sites of branch attachment. Stem is smooth.
31
For each tree (plus additionally selected), were assessed: (a) age (based on the latest forest
inventory data), (b) height (assessed using Haglof vertex IV height meter, m), (c) diameter
(measured at breast height using diameter calipers, cm), (d) stem straightness (score values
given in Table 2.3), (e) stem slenderness (assessed in scores, where 5 means lowest slenderness,
and 1 – the most expressed slenderness), (f) height to dry branches (assessed using Haglof
vertex IV, m), (g) height to green branches (assessed using Haglof vertex IV, m), (h) mean
crown diameter (assessed as a mean after measuring in two directions perpendicular to each
other, m), (i) crown form (irregular, umbelliferous, oval, spherical, egg-shaped, narrow
spherical), (j) branch thickness (score values are given in Table 2.3), (k) stem presence in crown
part (score values given in Table 2.3), (l) branch wound occlusion (score values given in Table
2.3), (m) presence of epicormic branches, (n) tree sanitary condition (categories given in Table
2.4).
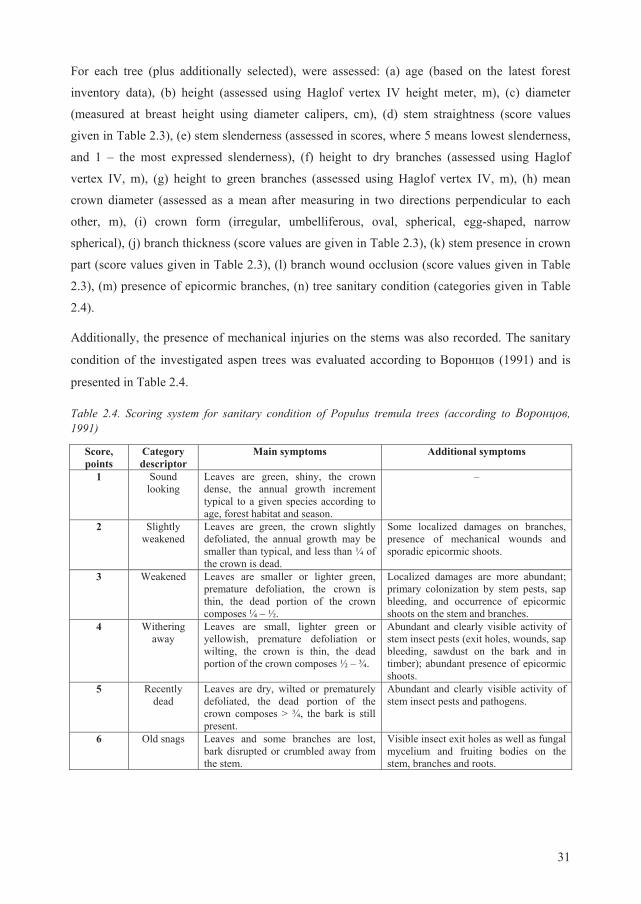
Additionally, the presence of mechanical injuries on the stems was also recorded. The sanitary
condition of the investigated aspen trees was evaluated according to (1991) and is
presented in Table 2.4.
Table 2.4. Scoring system for sanitary condition of Populus tremula trees (according to , 1991)
Score, points
Category descriptor
Main symptoms Additional symptoms
1 Sound looking
Leaves are green, shiny, the crown dense, the annual growth increment typical to a given species according to age, forest habitat and season.
–
2 Slightly weakened
Leaves are green, the crown slightly defoliated, the annual growth may be smaller than typical, and less than ¼ of the crown is dead.
Some localized damages on branches, presence of mechanical wounds and sporadic epicormic shoots.
3 Weakened
Leaves are smaller or lighter green, premature defoliation, the crown is thin, the dead portion of the crown composes ¼ – ½.
Localized damages are more abundant; primary colonization by stem pests, sap bleeding, and occurrence of epicormic shoots on the stem and branches.
4 Withering away
Leaves are small, lighter green or yellowish, premature defoliation or wilting, the crown is thin, the dead portion of the crown composes ½ – ¾.
Abundant and clearly visible activity of stem insect pests (exit holes, wounds, sap bleeding, sawdust on the bark and in timber); abundant presence of epicormic shoots.
5 Recently dead
Leaves are dry, wilted or prematurely defoliated, the dead portion of the crown composes > ¾, the bark is still present.
Abundant and clearly visible activity of stem insect pests and pathogens.
6 Old snags Leaves and some branches are lost, bark disrupted or crumbled away from the stem.
Visible insect exit holes as well as fungal mycelium and fruiting bodies on the stem, branches and roots.
32
2.3. DNA extraction from plant material
As extraction of good quality and clean DNA is a prerequisite for successful genetic studies, one
of our study objectives was to find the best DNA extraction method suitable for wood and leaf
tissue samples of P. tremula. For this task, we have randomly selected wood and leaf samples
from two European aspen trees.
We tested six well known DNA extraction techniques: SDS isolation, protein precipitation,
CTAB isolation, CTAB precipitation, guanidinium isothiocyanate and alkaline isolation (the full
description of these techniques is given by Milligan, 1998), and four commercially available kits
for extraction of plant genomic DNA: DNA isolation reagent for genomic DNA with Plant AC
reagent (AppliChem, Maryland Heights, USA), Nucleospin Plant Mini (Macherey-Nagel,
Düren, Germany), Genomic DNA purification kit (Fermentas, Vilnius, Lithuania) and
innuPREP Plant DNA Kit (Analytik Jena, Jena, Germany).
Before the DNA extraction samples of wood tissue (100 mg) and silica-dried leaf tissue (10 mg)
were ground using a mortar and a pestle in liquid nitrogen. The resulting powder was
immediately used for DNA extraction. The extraction of total DNA was performed in ten
different ways using the following protocols:
1. SDS isolation of total DNA (Edwards et al. 1991; Goodwin and Lee, 1993):
Transfer the ground sample material to tube and add 4 ml extraction buffer (200 mM
Tris pH 7.5, 25 mM EDTA, 250 mM NaCl, 0.5% (w/v) SDS) for each 10 mg of
tissue (e.g. for leaf sample add 400 l).
Vortex the sample for 5 sec.
Centrifuge at 12,000 x g for 1 min to pellet cellular debris.
Transfer 3 ml (300 l) of the supernatant to a new tube. Add 3 ml (300 l) of
isopropanol and incubate at 20–25°C for 2 min.
Centrifuge at 12,000 x g for 5 min.
Dry the DNA pellet at 20–25°C.
Dissolve the DNA in a 100 l TE.
Use 2.5 l of the dissolved DNA for a typical PCR reaction.
The dissolved DNA may be stored at 4°C for over one year.
2. Isolation of total DNA by protein precipitation (Fang et al. 1992; Dellaporta et al. 1983)
Transfer the ground sample material to a tube containing 1.2 ml (600 l) extraction
buffer (100 mM Tris pH 8.0, 50 mM EDTA pH 8.0, 500 mM NaCl, 2% (w/v) SDS,
33
1% (w/v) PVP-360, 0.1% (w/v) -mercaptoethanol (added immediately prior to use
in a fume hood)) and incubate at 65°C for 20 min.
Add one third of the volume potassium acetate. Shake vigorously and incubate on ice
for 5 min. Most proteins and polysaccharides are removed as a complex with the
insoluble potassium dodecyl sulfate precipitate.
Spin at 12,000 x g for 20 min at 4°C.
Pipette the supernatant into a clean micro centrifuge tube. Try to avoid as much of
the particulate material as possible. Add 0.5 vol. of isopropanol. Mix and incubate
the solution for 1 h at 4°C.
Pellet the DNA at 12,000 x g for 15 min at 4°C. Gently pour off the supernatant and
lightly dry the pellets either by inverting the tubes on paper towels for 10 min or as
long as necessary.
Incubate the DNA in 200–500 l TE at 65°C for 30 min to re-suspend it.
Transfer the solution to a micro centrifuge tube and spin for 5 min at 4°C to remove
any insoluble debris.
Transfer the supernatant to another micro centrifuge tube. Add 0.1 vol. sodium
acetate and two-thirds of the volume of cold isopropanol. Mix well, incubate at 4°C
for 1 h, and pellet the DNA for 10 min in a micro centrifuge at 4°C.
Wash the pellet with 200–500 l cold 80% ethanol for 10 min and centrifuge again
for 1 min at 4°C. Dry the pellet for 10 min in a Speed Vac.
Re-dissolve the DNA in TE using small increments (e.g. 10–100 l) depending on
the size of the pellet.
3. CTAB isolation of total DNA (Doyle and Doyle, 1987) with modifications described by
(Murray and Tompson, 1980; Saghai-Maroof et al. 1984; Rogers and Bendich, 1985;
1988; Doyle and Dickson, 1987; Fang et al. 1992; Lodhi et al. 1994; Milligan, 1998)
Heat the extraction buffer (50 mM Tris pH 8.0, 0.7 M NaCl, 10 mM EDTA, 1%
(w/v) CTAB, 0.5% (w/v) -mercaptoethanol (added immediately prior to use in a
fume hood)) to 60°C.
Immediately transfer the ground sample material to tube containing 1 ml (500 l) of
extraction buffer. Mix well.
Incubate at 60°C for 30–120 min with periodic gentle swirling.
Extract once with 1 ml (500 l) of chloroform: isoamyl alcohol. Mix gently but
thoroughly. Spin at 12,000 x g for 30 sec at 20–25°C to separate the phases.
Avoiding the interface, pipette the aqueous (top) phase into new tubes.
34
Add 0.5 vol. of 5 M NaCl. Add cold isopropanol to 40%. Mix gently to precipitate
nucleic acids. If no precipitate is visible, place at -20°C for 20 min or longer.
Spin at 12,000 x g for 1 min at 20–25°C. If no pellet or precipitate is visible, place on
ice for 20 min and spin again. In extreme case, spin for 10 min at 12,000 x g.
Gently pour off as much of the supernatant as possible without losing the nucleic
acid pellet. Add 0.5–1.0 ml of wash buffer (76% (w/v) ethanol, 10 mM ammonium
acetate) and swirl gently to wash the pellet. Let the nucleic acids sit in the wash
buffer for 15–20 min. Generally, nucleic acids will become much whiter (cleaner) at
this step.
Spin at 12,000 x g for 1 min at 20–25°C. If this is not sufficient, spin harder and
longer as before. Pour off wash buffer and allow the pellet to dry briefly (2–4 min)
by inverting the tube on a paper towel. Be careful that the pellet does not slide out.
Re-suspend DNA in re-suspension buffer (10 mM ammonium acetate, 0.25 mM
EDTA pH 8.0) in small increments (e.g. 10–100 l) depending on the size of the
pellet.
4. CTAB precipitation of total DNA (Bellamy and Ralph, 1968; Murray and Tompson,
1980; Rogers and Bendich, 1985; 1988)
Follow steps 1–6 from the protocol 3.
Add 0.1 vol. of 10% CTAB solution and mix.
Perform a second chloroform extraction as in steps 5 and 6 of protocol 3.
Add an equal volume of precipitation buffer (50 mM Tris pH8.0, 10 mM EDTA, 1%
(w/v) CTAB) to reduce the concentration of NaCl to 0.35 M. Mix gently and
incubate at 20–25°C for 30 min. Note that it is important to measure the sample
volume so that the concentration of NaCl is reduced to the proper level.
Recover the precipitated DNA by centrifugation at 12,000 x g at 20–25°C for 10–60
sec.
Re-hydrate the DNA pellet in 200 l re-suspension buffer (10 mM Tris pH 8.0, 1
mM EDTA pH 8.0, 1 mM NaCl).
Add 2 vol. of cold 100% ethanol and mix gently to precipitate the nucleic acids.
Recover the precipitated DNA by centrifugation at 12,000 x g at 4°C for 5–15 min.
Wash the DNA pellet in 200 l cold 80% ethanol and centrifuge at 12,000 x g at 4°C
for 5 min.
Re-suspend the DNA pellet in re-suspension buffer in small increments (e.g. 10–
100 l) depending on the size of the pellet.
35
At this point it may be necessary to purify the DNA further in a cesium chloride
gradient. This is especially true for those tissues that contain tannins or other
secondary compounds, although more than one chloroform extraction or a final
phenol extraction may be sufficient.
5. Guanidinium isothiocyanate isolation of total DNA (Cox, 1968; Bowtel, 1987;
Chomczynski and Sacchi, 1987; Jeanpierre, 1987; Puissant and Houdebine, 1990;
Chomczynski, 1993; Chomczynski and Mackey, 1995)
Transfer the ground sample material to the tube containing 5 ml (500 l) of
extraction buffer (6 M guanidinium isothiocyanate, 100 mM sodium acetate, pH 5.5).
Incubate at 20–25°C for 10 min. A longer incubation over 1 h with mixing may be
necessary.
Centrifuge at 12 000 x g for 10 min at 4°C to pellet the cellular debris.
Precipitate the DNA from the supernatant by adding 10 ml (1 ml) of 100% ethanol at
20–25oC. Mix by inversion and incubate at 20–25°C for 1–3 min The DNA should
become visible as a fibrous or cloudy precipitate.
Collect the DNA by centrifugation at 1000 x g for 1–2 min at 4°C.
Wash the DNA and precipitate twice with 0.5–1.0 ml of 80% ethanol.
Remove the ethanol wash and allow the DNA precipitate to dry for 5–15 min at 20–
25°C.
Dissolve the DNA to a concentration of 0.25 g/ l in TE or 8 mM NaOH; typically
this entails addition of 200 l solvent. The alkaline solvent may dissolve the DNA
faster and more completely.
If necessary, centrifuge the sample at 12,000 x g for 10 min to remove insoluble
material such as polysaccharides.
If NaOH was used to dissolve the DNA, adjust the pH of the solution to a desired pH
by adding Tris-HCl or Hepes (free acid).
6. Alkaline isolation of total DNA (Wang and Cutler 1993)
Transfer the ground sample material to the tube and add 1 ml (100 l) of 0.5 M
NaOH. Mix well.
Transfer 5 l quickly to a new tube containing 495 l storage buffer (100 mM Tris
pH 8.0, 1 mM EDTA pH 8.0). Mix well.
Use 1 l directly in a PCR reaction.
Store the isolated DNA at -20°C.
36
For DNA extraction using DNA isolation reagent for genomic DNA with Plant AC reagent
(AppliChem, Maryland Height, USA), Nucleospin Plant Mini (Macherey-Nagel, Düren,
Germany), Genomic DNA purification kit (Fermentas, Vilnius, Lithuania) and innuPREP Plant
DNA kit (Analytik Jena, Jena, Germany) follow the manufacturer’s protocols.
The concentration of the extracted DNA was measured using Biophotometer (Eppendorf) at 260
nm wave length. The purity of DNA was measured at 260/280 and 260/230 nm wave lengths.
PCR was performed in total 25 l volume, and consisted of 2 l of extracted DNA
(concentration as originally obtained), 13.8 l ddH2O, 2.5 l dNTP mix (2 mM), 2 l MgCl2, 2.5
l PCR buffer (10x), 0.2 l Taq polymerase (5 U/ l) and 1 l of each trnLUAA F (CGA AAT
CGG TAG ACG CTA CG) and trnFGAA (ATT TGA ACT GGT GAC ACG AG) primers (10
M). The chosen primers were originally described in Shaw et al. (2005). Reaction mixture was
covered with mineral oil (10 l). PCR conditions were as follows: initial denaturation step 80°C
for 5 min; denaturation step 94°C for 1 min; primer annealing step 50°C for 1 min; elongation
step 72°C for 2 min; final elongation step 72°C for 5 min. Steps 2 – 4 were repeated 35 times.
2.4. Assessment of genetic diversity of P. tremula plus trees
2.4.1. RAPD analysis
DNA for European aspen plus tree genetic polymorphism analysis was extracted using
Nucleospin Plant Mini Kit (Macherey-Nagel, Düren, Germany). In order to generate RAPD
profiles we used DNA extracted from P. tremula leaf and wood samples simultaneously. For
RAPD analysis we selected 15 most informative primers (Table 2.5) out of the 60 tested
(Appendix 1). We have evaluated primer informativeness using several criteria: (a) overall DNA
amplification quality, (b) amplification of polymorphic fragments, (c) size differences of
polymorphic fragments, and (d) reproducibility of DNA fragments (Pivorien , 2008). PCR
conditions and fragment separation was performed as described in Žvingila et al. (2002). With
each of the 15 selected RAPD primers, PCR amplification was carried out three times using
DNA extracted from leaf and wood samples.
Table 2.5. RAPD primers used in genetic analysis of Populus tremula trees
Primer Primer sequence 5’-3’ Primer Primer sequence 5’-3’ Roth A01 CAGGCCCTTC Roth B12 CCTTGACGCA Roth A03 AGTCAGCCAC Roth B13 TTCCCCCGCT Roth A04 AATCGGGCTG Roth B17 AGGGAACGAG Roth A05 AGGGGTCTTG Roth 17002 CAGGGTCGAA Roth A09 GGGTAACGCC Roth 17005 GAGATCCGCG Roth A19 CAAACGTCGG Roth 17009 TGCAGCACCG Roth B01 GTTTCGCTCC Roth 37001 TCCCTGTGCC Roth B03 CATCCCCCTG
37
PCR results were analyzed using only reproducible DNA bands. DNA fragment of particular
size (locus) was scored as present or absent and marked as 1 or 0 respectively. DNA fragment
sizes were recorded according to molecular ladders MassRuler™ DNA Ladder Mix (Fermentas,
Vilnius, Lithuania) and DNA Ladder 100bp plus (AppliChem, Maryland Heights, USA).
DNA bands of the same molecular weight in 1.5% agarose gel were considered identical. Gel
places with multiple banding patterns were hard to evaluate and were therefore excluded from
further analysis. RAPD fragment was considered polymorphic when its frequency was lower
than 99%.
2.4.2. Microsatellite analysis
The DNA from samples representing additionally sampled trees (Table 2.2) was extracted as
described by Dumolin et al. (1995). Microsatellite analysis was performed using 5 microsatellite
primers: PMGC 2607, GCPM 1532 and GCPM 1608 (information on these SSR primers can be
found at the International Populus Genome Consortium IPGC
(http://www.ornl.gov./sci/ipgc/ssr_resource.htm)), WPMS 14 and WPMS 16 (Tuskan et al.
2004). All five primers have previously been tested for transferability to P. tremula and
heterozygosity by Pakull et al. (2009). For microsatellite analysis we selected SSR primers that
amplify regions in different chromosomes (according to P. tremula female parent (Pakull et al.
2009) and Populus consensus map (Yin et al. 2008)). Primer information is given in Table 2.6,
and their location on physical Populus map is presented in Figure 2.1.
Table 2.6. Primer data used for microsatellite analysis of Populus tremula leaf tissue samples
Primer Primer Sequence Fluorescence label
Annealing temperature
Microsatellite locus position (chromosome no)
PMGC2607a Forward 3’TTAAAGGGTGGTCTGCAAGC5’ PET 47.5°C 8 Reverse 3’CTTCTTGCACCTCGTTTTGAG5’
GCPM1532a Forward 3’ATGCTTTGCTTGCTCTTAAC5’ PET 43°C 16 Reverse3’ACTATTGCTTGTCTTGGCAT5’
GCPM1608a Forward 3’GCTCCTGGTTTTACCACAT5’ VIC 47°C 15 Reverse 3’GAACAGCAGGATCATAGAGC5’
WPMS14b Forward 3’CAGCCGCAGCCACTGAGAAATC5’ NED 56°C 5 Reverse 3’GCCTGCTGAGAAGACTGCCTTGAC5’
WPMS16b Forward 3’CTCGTACTATTTCCGATGATGACC5’ FAM 51°C 7 Reverse 3’AGATTATTAGGTGGGCCAAGGACT5’
a Adapted from the International Populus Genome Consortium IPGC (http://www.ornl.gov./sci/ipgc/ssr_resource.htm) b Adapted from Tuskan et al. (2004)

38
Fig. 2.1. Genetic linkage maps of Populus tremula female parent (Pakull et al. 2009) and Populus consensus map based on a Populus trichocarpa and Populus deltoides background, available on
http://popgenome.ag.utk.edu/cgi-bin/cmap/map_set_info, Yin et al. 2008). Figure adapted from Pakull et al. (2009)
39
Polymerase chain reaction for microsatellite analysis was performed in a total reaction volume
of 15 μl, containing 50 ng of template DNA, 5 pmol of forward fluorescent dye-labeled primer
and 5 pmol of unlabeled reverse primer (Table 2.6.), 0.2 U of Dream Taq DNA Polymerase
(Thermo Fisher Scientific, Vilnius Lithuania), 30 μM of dNTP mix (Thermo Fisher Scientific,
Vilnius Lithuania), 1x DreamTaq buffer (Thermo Fisher Scientific, Vilnius Lithuania). The PCR
was performed on GeneAmp® PCR system 9700 (Applied Biosystems (ABI), Waltham, USA)
under following conditions: 4 min at 94°C, 38 cycles of 94°C for 30 sec, 43–56°C for 45 sec,
72°C for 1 min, final extension of 10 min at 72°C.
All obtained PCR products were mixed together, taking 1 μl of each amplification product. 1 μl
of resulting 5 PCR product’s mix was dissolved in 10 μl of formamide, 0.3 μl of internal
fragment size standard solution (Gene Scan 500 LIZ standard, ABI, Waltham, USA), and
separated using ABI-PRISM® Genetic Analyzer 310 (ABI, Waltham, USA). Data analysis was
carried out using Gene-Mapper software.
2.5. Assessment of incidence of Phellinus tremulae infection in aspen stems
To check for the presence of P. tremulae mycelium in wood samples a PCR-RFLP method was
selected. According to Mallett and Myrholm (1995) and Pollastro et al. (2000) P. tremulae is a
slow growing species on growth media thus it is very likely that other, fast growing fungi may
overgrow it, and in this way false negative results may be obtained. Therefore molecular
detection method was selected.
The presence of P. tremulae in European aspen trees was determined using genomic DNA
extracted from wood samples. For amplification of fungal DNA universal primers ITS1-F
(5‘CTTGGTCATTTAGAGGAAGTAA3’) and ITS4 (5‘TCCTCCGCTTATTGATATGC3’)
were used, which are known to amplify ITS (internal transcribed spacer) region in fungi (White
et al. 1990). PCR conditions were as described by Jasalavich et al. (2000). Amplified DNA
fragments were separated on 3% agarose gel and stained with ethidium bromide. As a reference
(positive control), DNA samples of P. tremulae extracted from a fruiting body were amplified in
the same PCR and loaded on the same gels together with the investigated samples. Fungal DNA
fragments showing the same size as the positive control were cut from the gel, re-amplified with
the same universal ITS1_F and ITS4 primers and without subsequent cleaning steps were used
in the restriction analysis. PCR products were digested with restriction enzymes (Alu I, HaeIII,
TaqI and RsaI) providing identification of samples containing P. tremulae DNA. The restriction
analysis was performed as described by Jasalavich et al. (2000). The identification of other
fungal species obtained from P. tremula wood samples was not performed.
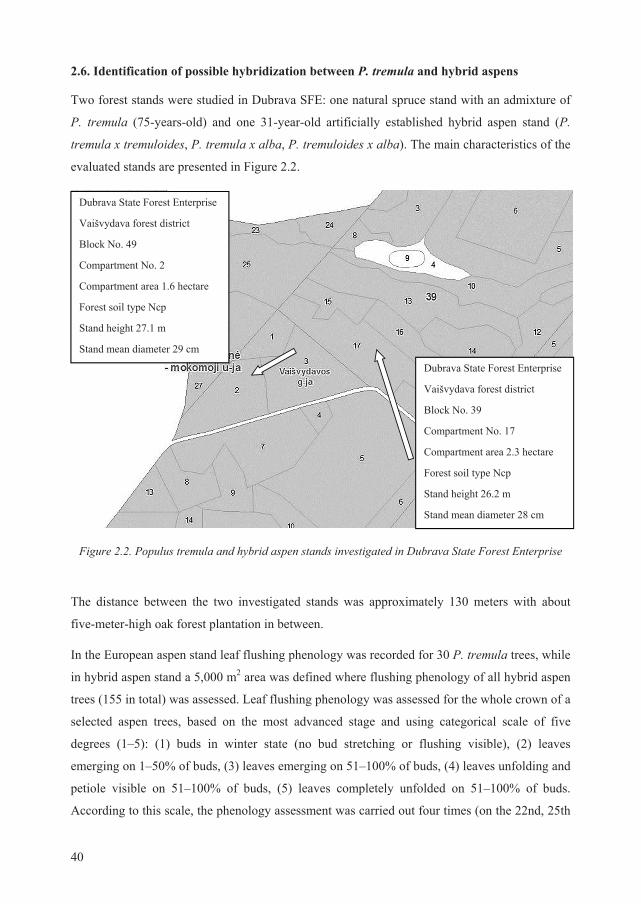
40
2.6. Identification of possible hybridization between P. tremula and hybrid aspens
Two forest stands were studied in Dubrava SFE: one natural spruce stand with an admixture of
P. tremula (75-years-old) and one 31-year-old artificially established hybrid aspen stand (P.
tremula x tremuloides, P. tremula x alba, P. tremuloides x alba). The main characteristics of the
evaluated stands are presented in Figure 2.2.
Figure 2.2. Populus tremula and hybrid aspen stands investigated in Dubrava State Forest Enterprise
The distance between the two investigated stands was approximately 130 meters with about
five-meter-high oak forest plantation in between.
In the European aspen stand leaf flushing phenology was recorded for 30 P. tremula trees, while
in hybrid aspen stand a 5,000 m2 area was defined where flushing phenology of all hybrid aspen
trees (155 in total) was assessed. Leaf flushing phenology was assessed for the whole crown of a
selected aspen trees, based on the most advanced stage and using categorical scale of five
degrees (1–5): (1) buds in winter state (no bud stretching or flushing visible), (2) leaves
emerging on 1–50% of buds, (3) leaves emerging on 51–100% of buds, (4) leaves unfolding and
petiole visible on 51–100% of buds, (5) leaves completely unfolded on 51–100% of buds.
According to this scale, the phenology assessment was carried out four times (on the 22nd, 25th
Dubrava State Forest Enterprise
Vaišvydava forest district
Block No. 49
Compartment No. 2
Compartment area 1.6 hectare
Forest soil type Ncp
Stand height 27.1 m
Stand mean diameter 29 cm
Dubrava State Forest Enterprise
Vaišvydava forest district
Block No. 39
Compartment No. 17
Compartment area 2.3 hectare
Forest soil type Ncp
Stand height 26.2 m
Stand mean diameter 28 cm
41
and 29th of April, and on the 2nd of May, 2014). Subsequently, the four categorical scores were
summarized for each assessed tree, resulting in final flushing score. In relation to the final
flushing score, evaluated trees were grouped into three flowering categories: (a) early, (b)
medium and (c) late flushing. Leaf flushing or bud burst phenology is highly correlated or
synchronized with flowering (Linkosalo, 1999). Further in the text the term ‘flowering’ will be
used instead of ‘leaf flushing’.
Seeds from two P. tremula trees and one hybrid aspen tree per flowering category were sampled
in 2014. Immediately after their collection the seeds were sown and half-sib family seedlings
were raised in a greenhouse during the same year (2014).
Ten leaves from each of 100 randomly selected seedlings in each half-sib family were collected
at the end of the first progeny vegetation season. Leaves were scanned (HP ScanJet scaner) and
measured using WinFolia Pro (S) 2004a computer software. A total of 19 traits were measured
for each leaf (reference to the trait in the text is given in brackets): 1) lamina area, 2) lamina
perimeter (perimeter), 3) vertical length of lamina (v_length), 4) horizontal width of lamina
(h_width), 5) aspect ratio (h_width / v_length), 6) form coefficient (form), 7) blade length, 8)
blade maximum perpendicular width, 9) position of maximal perpendicular width, 10)
perpendicular width at position 50% of blade length (width1), 11) perpendicular width at
position 90% of blade length (width2), 12) lobe angle at position 10% of blade length (angle1),
13) lobe angle at position 25% of blade length (angle2), 14) petiole length, 15) petiole area 16)
number of teeth, 17) average teeth height, 18) average teeth width, 19) envelope area.
2.7. Statistical evaluation
2.7.1. Assessment of genetic variation
RAPD and SSR data analysis was performed using GenAlEx 6.5 computer software (Peakall
and Smouse, 2006; 2012) and main genetic diversity indices were calculated. The number of
polymorphic fragments and their percentage in each investigated population were assessed.
Calculations of allelic frequencies were performed using binary matrix, where the presence of a
fragment (1) means AA or Aa genotypes, and the absence of fragment (0) – aa genotype (Lynch
and Milligan, 1994). Allelic frequency of each RAPD fragment was calculated using a formula:
p = 1 - q (2.1)
here p – the frequency of allele A and q – the frequency of allele a.
42
Allele frequency for codominant (SSR) data for all loci was calculated using a formula:
, (2.2)
here Nxx is the number of homozygotes for allele X (XX), and Nxy is the number of
heterozygotes containing the allele X (Y can be any other allele). N = the number of samples.
Shannon’s information index (I) (Brown and Weir, 1983) for RAPD data was calculated using a
formula:
I = -1(p ln (p) + q ln (q)), (2.3)
here for diploid binary data and assuming Hardy-Weinberg Equilibrium, q = (1 - band
frequency)0.5 and p = 1 - q.
Shannon index (I) for SSR data was calculated using a formula by Brown and Weir (1983):
I = - (pi ln)(pi)), (2.4)
here ln – natural logarithm and pi – frequency of the i-th allele.
For each of the RAPD fragments the number of different alleles (Na), as well as the number of
effective alleles (Ne) was calculated using a formula by Kimura and Crow (1964):
Ne = 1 / (p2 + q2), (2.5)
here p – the frequency of allele A and q – the frequency of allele a. Using obtained results the
mean for each investigated population was calculated.
Number of effective alleles Ne for SSR data was calculated using a formula:
Ne = 1/( pi2) , (2.6)
here pi – frequency of the i-th allele.
Observed heterozygosity (Ho) for codominant data was calculated using a formula:
, (2.7)
here N is a sample size.
Expected heterozygosity (He) for dominant data was calculated using a formula:
He = 2 p q, (2.8)
here p – frequency of allele A and q – frequency of allele a.
43
Later, using the obtained values, unbiased heterozygosity (uHe) for dominant marker data
(RAPD) was calculated using a formula:
uHe = (2N / (2N-1)) He , (2.9)
here N – sample size and He – expected heterozygosity.
For codominant marker (SSR) data expected heterozygosity (He) and later unbiased expected
heterozygosity (uHe) were calculated using the formulas 2.10 and 2.11 respectively:
, (2.10)
here pi is the frequency of the i-th allele for the population.
uHe = (2N / (2N - 1)) He, (2.11)
here N – a sample size and He – expected heterozygosity.
Using expected and observed heterozygosity measures for codominant data a fixation index (F)
was calculated using a formula:
, (2.12)
here He – expected heterozygosity and Ho – observed heterozygosity.
For codominant genetic data at a single locus, the total genetic diversity (heterozygosity) was
divided within and among populations (Hartl and Clark, 1997):
– observed heterozygosity, averaged across subpopulations
– expected heterozygosity, averaged across subpopulations
HT – total expected heterozygosity
, (2.13)
here Ho is observed heterozygosity in a subpopulation i, and k is the total number of tested
subpopulations.
44
, (2.14)
, (2.15)
here He is the expected heterozygosity within a subpopulation s, and pi,s is the frequency of the
i-th allele in a subpopulation s. The summation of the allele frequency squared is over all i-th
alleles to h the max number of alleles.
, (2.16)
here HT is the total expected heterozygosity, and pTi is the frequency of allele i over the total
population. If subpopulation sample sizes are equal then pTI=mean pi, where mean pi is the
frequency of allele i averaged over the subpopulations of equal size.
Using the mean of expected and observed heterozygosity and the total heterozygosity, Wright’s
F statistics (Wright, 1946; 1951; 1965) was calculated using equations:
, (2.17)
here FIS – the inbreeding coefficient within individuals relative to the subpopulation, –
expected heterozygosity averaged across subpopulations and – observed heterozygosity
averaged across subpopulations.
, (2.18)
here FIT –the inbreeding coefficient within individuals relative to the total, HT – total expected
heterozygosity and – observed heterozygosity averaged across subpopulations.
, (2.19)
here FST – the inbreeding coefficient within subpopulations relative to the total, HT – total
expected heterozygosity and – expected heterozygosity averaged across subpopulations.
The deviation of allele frequencies from Hardy-Weinberg’s Equilibrium (HWE) were calculated
using a formula:
45
, (2.20)
here, the sum of i to k genotypes is based on Oi, the observed number of individuals of the i-th
genotype, and Ei, the expected number for the i-th genotype. Ei is calculated as either pi2 for a
homozygous genotype or 2 pq for a heterozygous genotype. Degrees of freedom for the Chi-
Squared test was calculated using a formula DF = [Na(Na-1)]/2, where Na is the number of
alleles at the locus.
Using GenAlEx analysis software the following within-population genetic diversity indices
were calculated:
Nei’s genetic identity (I) (Nei, 1972; 1978):
,
, and , (2.21)
here I is Nei’s genetic identity, and pix and piy are the frequencies of the i-th allele in
populations x and y. For multiple loci, Ixy and Iy are calculated by summing over all loci and
alleles and dividing by the number of loci. These averaged values are then used to calculate I.
Nei’s genetic distance (Nei, 1972; 1978) was calculated using a formula:
, (2.22)
here ln is a natural logarithm and I is Nei’s identity.
Dendrograms were constructed with PAST version 2.17c software (Hammer et al. 2001) using
RAPD and SSR data and UPGMA method (Sneath and Sokal, 1973) (paired group algorithm,
similarity measure – Euclidean distance), also on the basis of Nei’s genetic distance matrices
(Nei, 1978). The significance of clusters was assessed using bootstraps (Suzuki and Shimodaira,
2004). Mantel test between genetic distance matrix and geographic distance matrix was
performed with GenAlEx software (Peakall and Smouse, 2006; 2012) using 9,999 permutations.
PCA (principal component analysis) based on 5 SSR markers was performed with PAST version
2.17c software (Hammer et al. 2001) using two options: within group and among groups.
Broken stick method (Macarthur, 1957) was used to determine how many components are
important. Also, a load of each SSR marker in each of important components was analyzed.
46
Molecular variation in Lithuanian P. tremula populations was assessed by hierarchical AMOVA
(Excoffier et al. 1992; Mengoni and Bazzicalupo, 2002) using GenAlEx v. 6.5 (Peakall and
Smouse, 2006; 2012). To assess genetic distance FST and RST fixation indices were calculated
and total variation was partitioned into among- and within-population effects. The probability P
(rand =data) for the fixation indexes was based on standard permutation across the full data set
with 9,999 permutations.
Bayesian clustering approach was implemented using computer analysis software STRUCTURE
version 2.1 (Pritchard et al. 2000) to estimate the most likely number of clusters (K) into which
the SSR and RAPD multilocus genotypes were assigned with certain likelihoods. The
population priors were not used. A Markov chain with 100,000 and 50,000 iterations for SSR
and RAPD analysis, respectively, following a burn in period of respective 100,000 and 50,000
iterations was used. Each run was replicated 10 times. The most likely number of clusters was
identified by the delta K ( K) criterion. Number of clusters was determined by calculation based
on the second order rate of change of the likelihood ( K) (Evanno et al. 2005).
2.7.2. Correlation between occurrence of certain RAPD fragments and presence of DNA of P. tremulae
For correlation assessment a binary data matrix was used. SAS (SAS 9.4 package, by SAS
Institute Inc., Cary, NC, USA) procedure GENMOD (generalized linear models) with model
options of link function ‘logit’ and the binomial distribution variance function was used for
estimation of locus band presence or absence effect for wood infection with P. tremulae. Only
polymorphic fragments were used for the evaluation of data. In order to check which loci were
the most discriminating the sites or populations, stepwise discriminant analysis was done to
select a subset of the fragments for use in discriminating among the classes. The STEPDISC
SAS procedure was applied to select RAPDs contributing most to the differentiation of
individuals grouped by wood infection with P. tremulae. The least significance level 0.05 was
used for the selection of single RAPD markers. Detrended correspondence analysis performed
with PAST version 2.17c software (Hammer et al. 2001) was applied to detect pattern in wood
infection in the two groups of trees (infected and free of pathogen DNA) by RAPD markers best
discriminating those groups.
47
2.7.3. Analysis of European aspen and hybrid aspen leaf parameters
SAS STEPDISC procedure (slentry=0.05) was used to select leaf traits which could be used in
discriminating European and hybrid aspens. Principal component analysis (PCA) using Pearson
correlation and distance-based biplot was applied for selected leaf traits. The attribution of aspen
individuals to one or another taxa was performed by discriminant procedure in PAST version
2.17c software (Hammer et al. 2001). For analysis of variance PROC MIXED (mixed model
equations) and the REML (restricted maximum likelihood) option in SAS (SAS 9.4 package, by
SAS Institute Inc., Cary, NC, USA) was used. Variance components were calculated for half-sib
families and progeny seedlings using the following model:
ijmijiijm etfy )(
here ijmy is the value of a single observation, is the grand mean, if refers to the random
effect of a family i, )(ijt is the random effect of tree j in family i, and ijme is the random error
term.
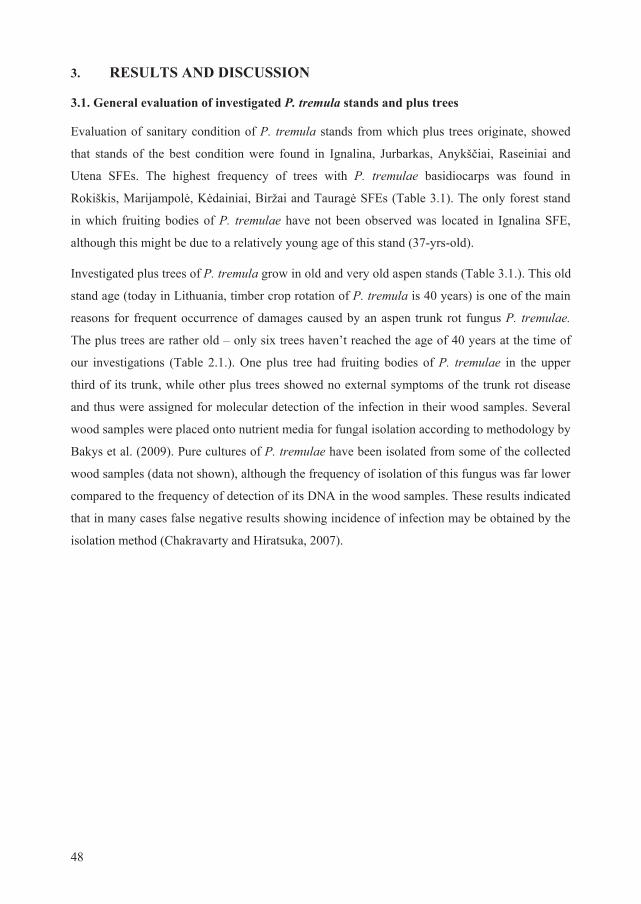
48
3. RESULTS AND DISCUSSION
3.1. General evaluation of investigated P. tremula stands and plus trees
Evaluation of sanitary condition of P. tremula stands from which plus trees originate, showed
that stands of the best condition were found in Ignalina, Jurbarkas, Anykš iai, Raseiniai and
Utena SFEs. The highest frequency of trees with P. tremulae basidiocarps was found in
Rokiškis, Marijampol , K dainiai, Biržai and Taurag SFEs (Table 3.1). The only forest stand
in which fruiting bodies of P. tremulae have not been observed was located in Ignalina SFE,
although this might be due to a relatively young age of this stand (37-yrs-old).
Investigated plus trees of P. tremula grow in old and very old aspen stands (Table 3.1.). This old
stand age (today in Lithuania, timber crop rotation of P. tremula is 40 years) is one of the main
reasons for frequent occurrence of damages caused by an aspen trunk rot fungus P. tremulae.
The plus trees are rather old – only six trees haven’t reached the age of 40 years at the time of
our investigations (Table 2.1.). One plus tree had fruiting bodies of P. tremulae in the upper
third of its trunk, while other plus trees showed no external symptoms of the trunk rot disease
and thus were assigned for molecular detection of the infection in their wood samples. Several
wood samples were placed onto nutrient media for fungal isolation according to methodology by
Bakys et al. (2009). Pure cultures of P. tremulae have been isolated from some of the collected
wood samples (data not shown), although the frequency of isolation of this fungus was far lower
compared to the frequency of detection of its DNA in the wood samples. These results indicated
that in many cases false negative results showing incidence of infection may be obtained by the
isolation method (Chakravarty and Hiratsuka, 2007).
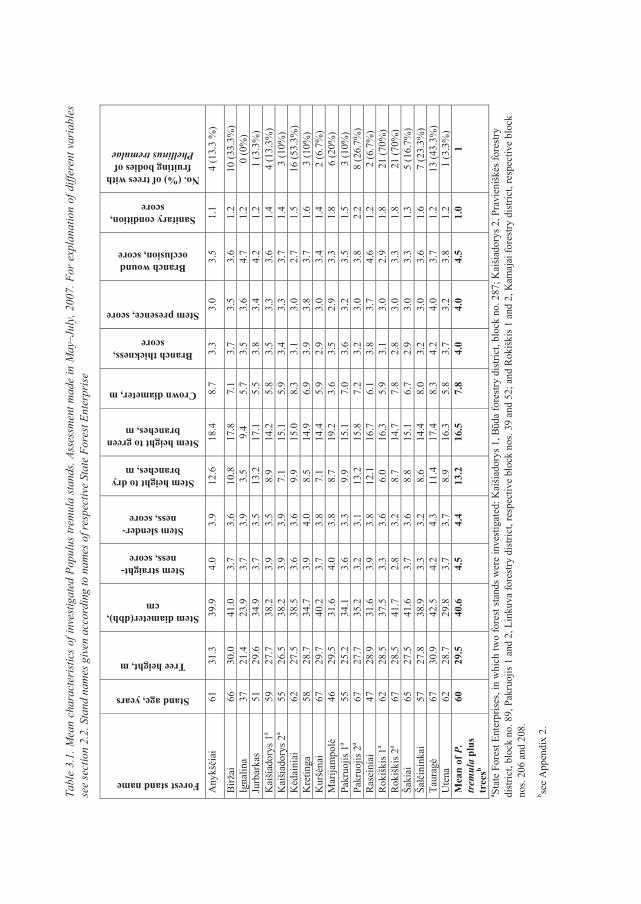
Tabl
e 3.
1. M
ean
char
acte
rist
ics
of in
vest
igat
ed P
opul
us tr
emul
a st
ands
. Ass
essm
ent m
ade
in M
ay–J
uly,
200
7. F
or e
xpla
natio
n of
diff
eren
t var
iabl
es
see
sect
ion
2.2.
Sta
nd n
ames
giv
en a
ccor
ding
to n
ames
of r
espe
ctiv
e St
ate
Fore
st E
nter
pris
e
Forest stand name
Stand age, years
Tree height, m
Stem diameter(dbh), cm
Stem straight- ness, score
Stem slender- ness, score
Stem height to dry branches, m
Stem height to green branches, m
Crown diameter, m
Branch thickness, score
Stem presence, score
Branch wound occlusion, score
Sanitary condition, score
No. (%) of trees with fruiting bodies of
Phellinus tremulae
Any
kšia
i 61
31
.3
39.9
4.
0 3.
9 12
.6
18.4
8.
7 3.
3 3.
0 3.
5 1.
1 4
(13.
3 %
)
Birž
ai
66
30.0
41
.0
3.7
3.6
10.8
17
.8
7.1
3.7
3.5
3.6
1.2
10 (3
3.3%
) Ig
nalin
a 37
21
.4
23.9
3.
7 3.
9 3.
5 9.
4 5.
7 3.
5 3.
6 4.
7 1.
2 0
(0%
) Ju
rbar
kas
51
29.6
34
.9
3.7
3.5
13.2
17
.1
5.5
3.8
3.4
4.2
1.2
1 (3
.3%
) K
aiši
ador
ys 1
a 59
27
.7
38.2
3.
9 3.
5 8.
9 14
.2
5.8
3.5
3.3
3.6
1.4
4 (1
3.3%
) K
aiši
ador
ys 2
a 55
26
.5
38.2
3.
9 3.
9 7.
1 15
.1
5.9
3.4
3.3
3.7
1.4
3 (1
0%)
Kda
inia
i 62
27
.5
38.5
3.
6 3.
6 9.
9 15
.0
8.3
3.1
3.0
2.7
1.5
16 (5
3.3%
) K
retin
ga
58
28.7
34
.7
3.9
4.0
8.5
14.9
6.
9 3.
9 3.
8 3.
7 1.
6 3
(10%
) K
urš
nai
67
29.7
40
.2
3.7
3.8
7.1
14.4
5.
9 2.
9 3.
0 3.
4 1.
4 2
(6.7
%)
Mar
ijam
pol
46
29
.5
31.6
4.
0 3.
8 8.
7 19
.2
3.6
3.5
2.9
3.3
1.8
6 (2
0%)
Pakr
uojis
1a
55
25.2
34
.1
3.6
3.3
9.9
15.1
7.
0 3.
6 3.
2 3.
5 1.
5 3
(10%
) Pa
kruo
jis 2
a 67
27
.7
35.2
3.
2 3.
1 13
.2
15.8
7.
2 3.
2 3.
0 3.
8 2.
2 8
(26.
7%)
Ras
eini
ai
47
28.9
31
.6
3.9
3.8
12.1
16
.7
6.1
3.8
3.7
4.6
1.2
2 (6
.7%
) R
okiš
kis 1
a 62
28
.5
37.5
3.
3 3.
6 6.
0 16
.3
5.9
3.1
3.0
2.9
1.8
21 (7
0%)
Rok
iški
s 2a
67
28.5
41
.7
2.8
3.2
8.7
14.7
7.
8 2.
8 3.
0 3.
3 1.
8 21
(70%
) Ša
kiai
65
27
.5
41.6
3.
7 3.
6 8.
8 15
.1
6.7
2.9
3.0
3.3
1.3
5 (1
6.7%
) Ša
lin
inka
i 57
27
.8
38.9
3.
3 3.
2 8.
6 14
.4
8.0
3.2
3.0
3.6
1.6
7 (2
3.3%
) Ta
urag
67
30
.9
42.5
4.
2 4.
3 11
.4
17.4
8.
3 4.
2 4.
0 3.
7 1.
2 13
(43.
3%)
Ute
na
62
28.7
29
.8
3.7
3.7
8.9
16.3
5.
8 3.
7 3.
2 3.
8 1.
2 1
(3.3
%)
Mea
n of
P.
trem
ula
plus
tr
eesb
60
29.5
40
.6
4.5
4.4
13.2
16
.5
7.8
4.0
4.0
4.5
1.0
1
a Stat
e Fo
rest
Ent
erpr
ises
, in
whi
ch tw
o fo
rest
stan
ds w
ere
inve
stig
ated
: Kai
šiad
orys
1, B
da fo
rest
ry d
istri
ct, b
lock
no.
287
; Kai
šiad
orys
2, P
ravi
eniš
ks f
ores
try
dist
rict,
bloc
k no
. 89,
Pak
ruoj
is 1
and
2, L
inku
va fo
rest
ry d
istri
ct, r
espe
ctiv
e bl
ock
nos.
39 a
nd 5
2; a
nd R
okiš
kis 1
and
2, K
amaj
ai fo
rest
ry d
istri
ct, r
espe
ctiv
e bl
ock
nos.
206
and
208.
b se
e A
ppen
dix
2.
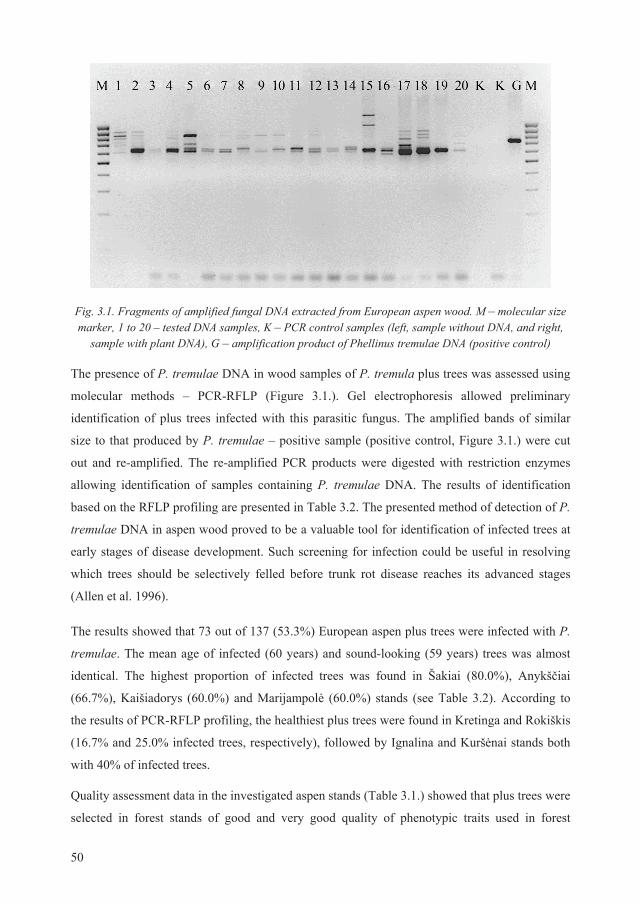
50
Fig. 3.1. Fragments of amplified fungal DNA extracted from European aspen wood. M – molecular size marker, 1 to 20 – tested DNA samples, K – PCR control samples (left, sample without DNA, and right,
sample with plant DNA), G – amplification product of Phellinus tremulae DNA (positive control)
The presence of P. tremulae DNA in wood samples of P. tremula plus trees was assessed using
molecular methods – PCR-RFLP (Figure 3.1.). Gel electrophoresis allowed preliminary
identification of plus trees infected with this parasitic fungus. The amplified bands of similar
size to that produced by P. tremulae – positive sample (positive control, Figure 3.1.) were cut
out and re-amplified. The re-amplified PCR products were digested with restriction enzymes
allowing identification of samples containing P. tremulae DNA. The results of identification
based on the RFLP profiling are presented in Table 3.2. The presented method of detection of P.
tremulae DNA in aspen wood proved to be a valuable tool for identification of infected trees at
early stages of disease development. Such screening for infection could be useful in resolving
which trees should be selectively felled before trunk rot disease reaches its advanced stages
(Allen et al. 1996).
The results showed that 73 out of 137 (53.3%) European aspen plus trees were infected with P.
tremulae. The mean age of infected (60 years) and sound-looking (59 years) trees was almost
identical. The highest proportion of infected trees was found in Šakiai (80.0%), Anykš iai
(66.7%), Kaišiadorys (60.0%) and Marijampol (60.0%) stands (see Table 3.2). According to
the results of PCR-RFLP profiling, the healthiest plus trees were found in Kretinga and Rokiškis
(16.7% and 25.0% infected trees, respectively), followed by Ignalina and Kurš nai stands both
with 40% of infected trees.
Quality assessment data in the investigated aspen stands (Table 3.1.) showed that plus trees were
selected in forest stands of good and very good quality of phenotypic traits used in forest
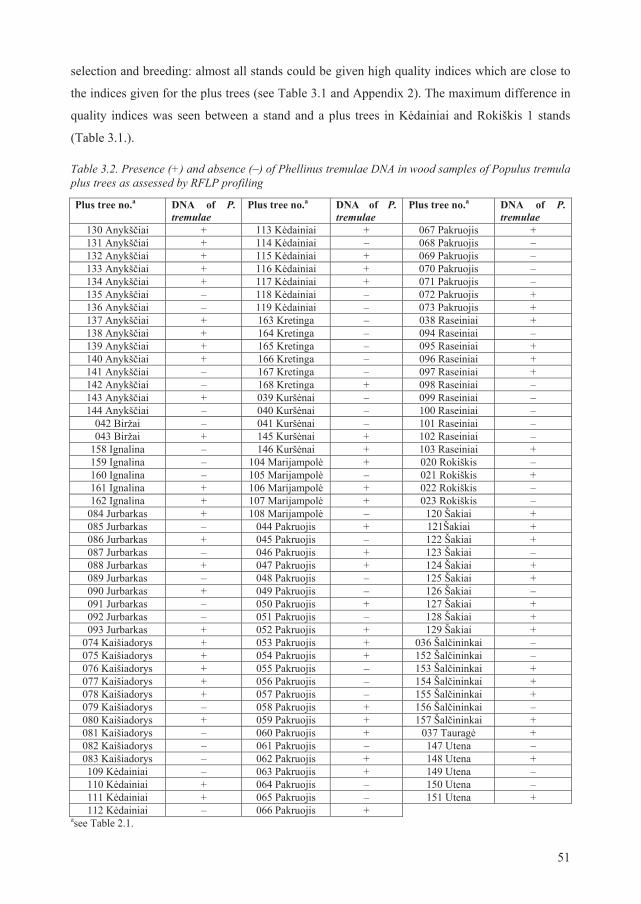
51
selection and breeding: almost all stands could be given high quality indices which are close to
the indices given for the plus trees (see Table 3.1 and Appendix 2). The maximum difference in
quality indices was seen between a stand and a plus trees in K dainiai and Rokiškis 1 stands
(Table 3.1.).
Table 3.2. Presence (+) and absence (–) of Phellinus tremulae DNA in wood samples of Populus tremula plus trees as assessed by RFLP profiling
Plus tree no.a DNA of P.tremulae
Plus tree no.a DNA of P.tremulae
Plus tree no.a DNA of P.tremulae
130 Anykš iai + 113 K dainiai + 067 Pakruojis + 131 Anykš iai + 114 K dainiai – 068 Pakruojis – 132 Anykš iai + 115 K dainiai + 069 Pakruojis – 133 Anykš iai + 116 K dainiai + 070 Pakruojis – 134 Anykš iai + 117 K dainiai + 071 Pakruojis – 135 Anykš iai – 118 K dainiai – 072 Pakruojis + 136 Anykš iai – 119 K dainiai – 073 Pakruojis + 137 Anykš iai + 163 Kretinga – 038 Raseiniai + 138 Anykš iai + 164 Kretinga – 094 Raseiniai – 139 Anykš iai + 165 Kretinga – 095 Raseiniai + 140 Anykš iai + 166 Kretinga – 096 Raseiniai + 141 Anykš iai – 167 Kretinga – 097 Raseiniai + 142 Anykš iai – 168 Kretinga + 098 Raseiniai – 143 Anykš iai + 039 Kurš nai – 099 Raseiniai – 144 Anykš iai – 040 Kurš nai – 100 Raseiniai –
042 Biržai – 041 Kurš nai – 101 Raseiniai – 043 Biržai + 145 Kurš nai + 102 Raseiniai –
158 Ignalina – 146 Kurš nai + 103 Raseiniai + 159 Ignalina – 104 Marijampol + 020 Rokiškis – 160 Ignalina – 105 Marijampol – 021 Rokiškis + 161 Ignalina + 106 Marijampol + 022 Rokiškis – 162 Ignalina + 107 Marijampol + 023 Rokiškis –
084 Jurbarkas + 108 Marijampol – 120 Šakiai + 085 Jurbarkas – 044 Pakruojis + 121Šakiai + 086 Jurbarkas + 045 Pakruojis – 122 Šakiai + 087 Jurbarkas – 046 Pakruojis + 123 Šakiai – 088 Jurbarkas + 047 Pakruojis + 124 Šakiai + 089 Jurbarkas – 048 Pakruojis – 125 Šakiai + 090 Jurbarkas + 049 Pakruojis – 126 Šakiai – 091 Jurbarkas – 050 Pakruojis + 127 Šakiai + 092 Jurbarkas – 051 Pakruojis – 128 Šakiai + 093 Jurbarkas + 052 Pakruojis + 129 Šakiai +
074 Kaišiadorys + 053 Pakruojis + 036 Šal ininkai – 075 Kaišiadorys + 054 Pakruojis + 152 Šal ininkai – 076 Kaišiadorys + 055 Pakruojis – 153 Šal ininkai + 077 Kaišiadorys + 056 Pakruojis – 154 Šal ininkai + 078 Kaišiadorys + 057 Pakruojis – 155 Šal ininkai + 079 Kaišiadorys – 058 Pakruojis + 156 Šal ininkai – 080 Kaišiadorys + 059 Pakruojis + 157 Šal ininkai + 081 Kaišiadorys – 060 Pakruojis + 037 Taurag + 082 Kaišiadorys – 061 Pakruojis – 147 Utena – 083 Kaišiadorys – 062 Pakruojis + 148 Utena + 109 K dainiai – 063 Pakruojis + 149 Utena – 110 K dainiai + 064 Pakruojis – 150 Utena – 111 K dainiai + 065 Pakruojis – 151 Utena + 112 K dainiai – 066 Pakruojis +
asee Table 2.1.
52
3.2. DNA extraction from P. tremula
Many genetic studies of tree species depend on possibilities to take samples. The ease of
sampling is a critical issue in many studies, especially when mature trees are investigated.
Nondestructive sampling from a mature tree generally involves collection of leaves using
firearm or climbing a tree. There is also a possibility to sample cambium tissues and to subject
those for DNA extraction (Tibbits et al. 2006). However, this method is not suitable in certain
cases because of the damage it causes to a tree and for various forensic applications (as it is not
always possible to collect fresh cambium tissue). Forensic investigations in forestry mostly deal
with timber trade control. Timber trade control can be performed by applying chloroplast
sequences using DNA extracted from wood, as described in Deguilloux et al. (2003); however, a
laborious investigation of haplotype variability in multiple geographic locations has to be
assessed prior to analysis of the chloroplast sequences.
Collection of wood samples using a Pressler’s increment borer is a simple, fast and almost
nondestructive method as the inflicted wound is small and causes minimal damage to the tree. In
this case a thin wood core is extracted and could be used for further investigations. The
Pressler’s borer has a supremacy over other types of borers or drills as it doesn’t produce
sawdust, which is the primary cause of cross-contamination among trees (Jasalavich et al. 2000).
Another important issue in any molecular investigation is successful DNA extraction. The
success of DNA extraction is largely dependent on a number of steps involved in the extraction
procedure and the ease and efficiency of DNA purification. Tree tissues often contain large
amounts of polysaccharides and phenolic compounds difficult to separate from DNA (Murray
and Thompson, 1980; Katterman and Shattuck, 1983; Mannerlöf and Tenning, 1997; Ostrowska
et al. 1998). Wood tissue is especially impervious to the DNA extraction; for obtaining high
quality DNA the wood tissues have to be subjected to several cleaning steps (Asif and Cannon,
2005; Rachmayanti et al. 2009).
In our study, ten DNA extraction methods were used to extract DNA from European aspen
wood and leaf samples. The results showing concentration and purity of the extracted DNA
(Table 3.3.) indicated that CTAB precipitation, guanidinium isothiocyanate method and
AppliChem DNA isolation reagent (also based on guanidinium isothiocyanate reagent) were not
suitable for efficient DNA extraction from P. tremula tissues, irrespective of the tissue type
(wood or leaf) used. The simplest (based only on three steps) alkaline isolation technique
produced good results only for wood tissues, but not for leaf tissues (i.e. tree DNA was not
detected). This might be explained by the fact, that leaf contains much more of polyphenolics
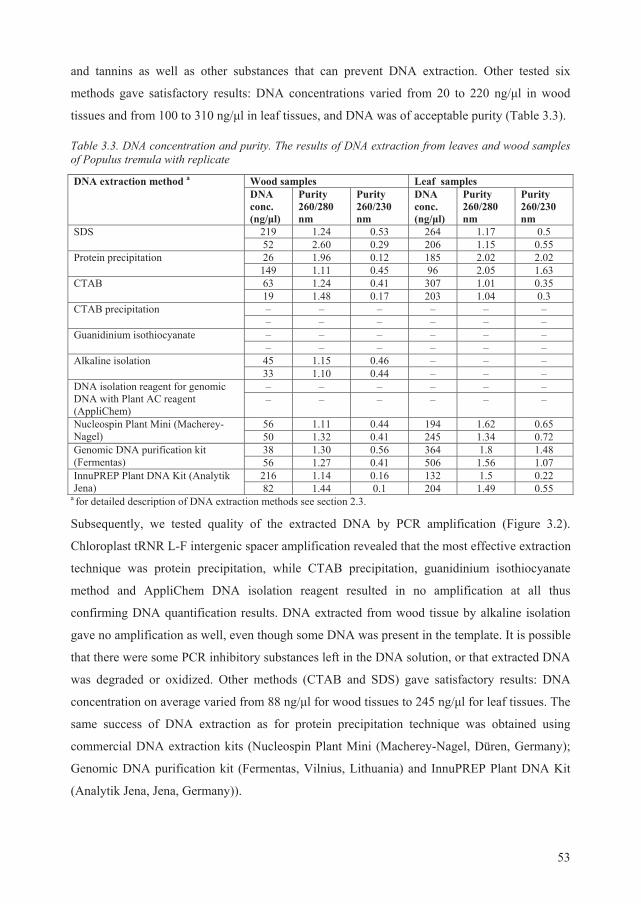
53
and tannins as well as other substances that can prevent DNA extraction. Other tested six
methods gave satisfactory results: DNA concentrations varied from 20 to 220 ng/ l in wood
tissues and from 100 to 310 ng/ l in leaf tissues, and DNA was of acceptable purity (Table 3.3).
Table 3.3. DNA concentration and purity. The results of DNA extraction from leaves and wood samples of Populus tremula with replicate
DNA extraction method a Wood samples Leaf samples DNA conc. (ng/ l)
Purity 260/280 nm
Purity 260/230 nm
DNA conc. (ng/ l)
Purity 260/280 nm
Purity 260/230 nm
SDS
219 1.24 0.53 264 1.17 0.5 52 2.60 0.29 206 1.15 0.55
Protein precipitation
26 1.96 0.12 185 2.02 2.02 149 1.11 0.45 96 2.05 1.63
CTAB
63 1.24 0.41 307 1.01 0.35 19 1.48 0.17 203 1.04 0.3
CTAB precipitation
– – – – – – – – – – – –
Guanidinium isothiocyanate
– – – – – – – – – – – –
Alkaline isolation
45 1.15 0.46 – – – 33 1.10 0.44 – – –
DNA isolation reagent for genomic DNA with Plant AC reagent (AppliChem)
– – – – – – – – – – – –
Nucleospin Plant Mini (Macherey-Nagel)
56 1.11 0.44 194 1.62 0.65 50 1.32 0.41 245 1.34 0.72
Genomic DNA purification kit (Fermentas)
38 1.30 0.56 364 1.8 1.48 56 1.27 0.41 506 1.56 1.07
InnuPREP Plant DNA Kit (Analytik Jena)
216 1.14 0.16 132 1.5 0.22 82 1.44 0.1 204 1.49 0.55
a for detailed description of DNA extraction methods see section 2.3.
Subsequently, we tested quality of the extracted DNA by PCR amplification (Figure 3.2).
Chloroplast tRNR L-F intergenic spacer amplification revealed that the most effective extraction
technique was protein precipitation, while CTAB precipitation, guanidinium isothiocyanate
method and AppliChem DNA isolation reagent resulted in no amplification at all thus
confirming DNA quantification results. DNA extracted from wood tissue by alkaline isolation
gave no amplification as well, even though some DNA was present in the template. It is possible
that there were some PCR inhibitory substances left in the DNA solution, or that extracted DNA
was degraded or oxidized. Other methods (CTAB and SDS) gave satisfactory results: DNA
concentration on average varied from 88 ng/ l for wood tissues to 245 ng/ l for leaf tissues. The
same success of DNA extraction as for protein precipitation technique was obtained using
commercial DNA extraction kits (Nucleospin Plant Mini (Macherey-Nagel, Düren, Germany);
Genomic DNA purification kit (Fermentas, Vilnius, Lithuania) and InnuPREP Plant DNA Kit
(Analytik Jena, Jena, Germany)).
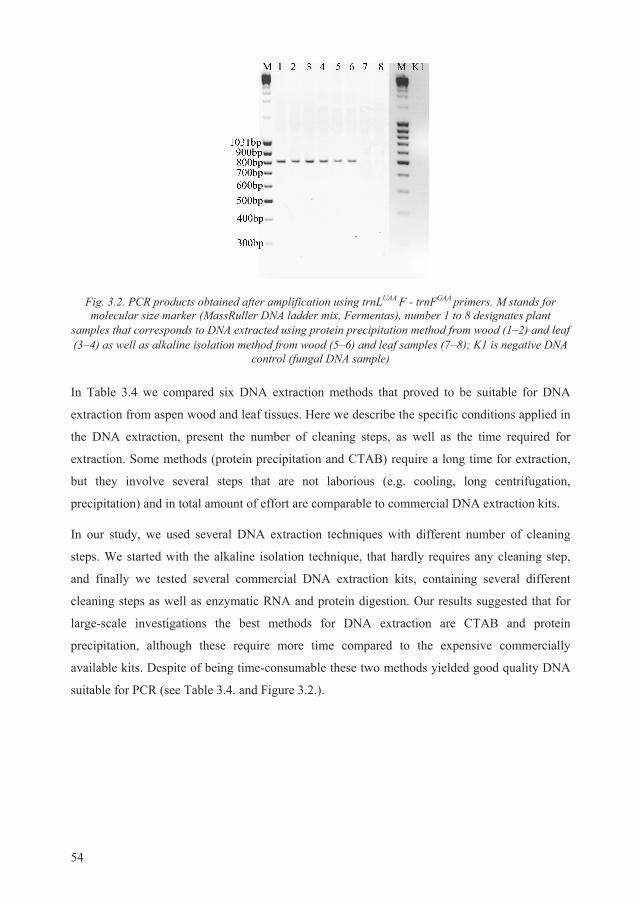
54
Fig. 3.2. PCR products obtained after amplification using trnLUAA F - trnFGAA primers. M stands for molecular size marker (MassRuller DNA ladder mix, Fermentas), number 1 to 8 designates plant
samples that corresponds to DNA extracted using protein precipitation method from wood (1–2) and leaf (3–4) as well as alkaline isolation method from wood (5–6) and leaf samples (7–8); K1 is negative DNA
control (fungal DNA sample)
In Table 3.4 we compared six DNA extraction methods that proved to be suitable for DNA
extraction from aspen wood and leaf tissues. Here we describe the specific conditions applied in
the DNA extraction, present the number of cleaning steps, as well as the time required for
extraction. Some methods (protein precipitation and CTAB) require a long time for extraction,
but they involve several steps that are not laborious (e.g. cooling, long centrifugation,
precipitation) and in total amount of effort are comparable to commercial DNA extraction kits.
In our study, we used several DNA extraction techniques with different number of cleaning
steps. We started with the alkaline isolation technique, that hardly requires any cleaning step,
and finally we tested several commercial DNA extraction kits, containing several different
cleaning steps as well as enzymatic RNA and protein digestion. Our results suggested that for
large-scale investigations the best methods for DNA extraction are CTAB and protein
precipitation, although these require more time compared to the expensive commercially
available kits. Despite of being time-consumable these two methods yielded good quality DNA
suitable for PCR (see Table 3.4. and Figure 3.2.).
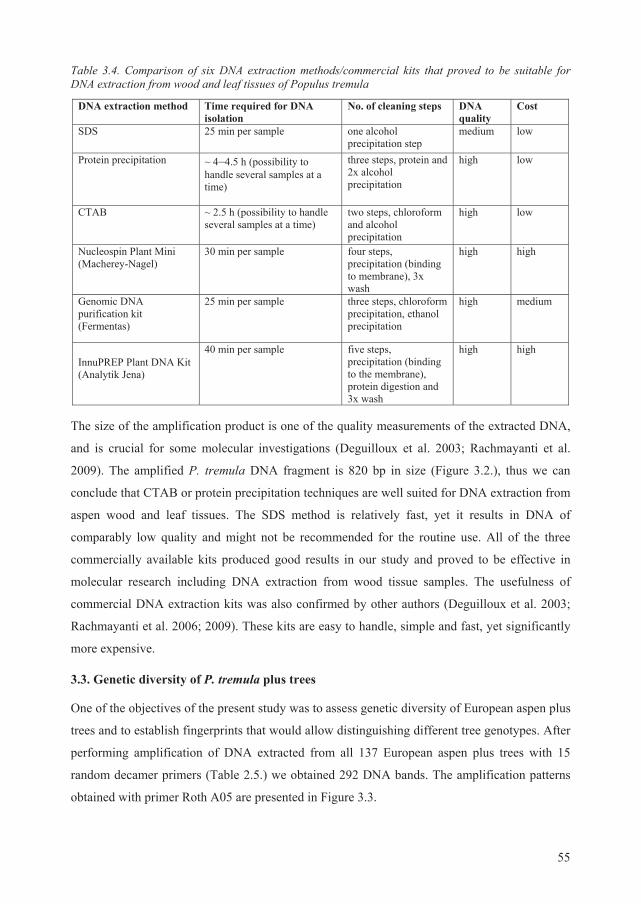
55
Table 3.4. Comparison of six DNA extraction methods/commercial kits that proved to be suitable for DNA extraction from wood and leaf tissues of Populus tremula
DNA extraction method Time required for DNA isolation
No. of cleaning steps DNA quality
Cost
SDS 25 min per sample one alcohol precipitation step
medium low
Protein precipitation ~ 4–4.5 h (possibility to handle several samples at a time)
three steps, protein and 2x alcohol precipitation
high low
CTAB ~ 2.5 h (possibility to handle several samples at a time)
two steps, chloroform and alcohol precipitation
high low
Nucleospin Plant Mini (Macherey-Nagel)
30 min per sample four steps, precipitation (binding to membrane), 3x wash
high high
Genomic DNA purification kit (Fermentas)
25 min per sample three steps, chloroform precipitation, ethanol precipitation
high medium
InnuPREP Plant DNA Kit (Analytik Jena)
40 min per sample five steps, precipitation (binding to the membrane), protein digestion and 3x wash
high high
The size of the amplification product is one of the quality measurements of the extracted DNA,
and is crucial for some molecular investigations (Deguilloux et al. 2003; Rachmayanti et al.
2009). The amplified P. tremula DNA fragment is 820 bp in size (Figure 3.2.), thus we can
conclude that CTAB or protein precipitation techniques are well suited for DNA extraction from
aspen wood and leaf tissues. The SDS method is relatively fast, yet it results in DNA of
comparably low quality and might not be recommended for the routine use. All of the three
commercially available kits produced good results in our study and proved to be effective in
molecular research including DNA extraction from wood tissue samples. The usefulness of
commercial DNA extraction kits was also confirmed by other authors (Deguilloux et al. 2003;
Rachmayanti et al. 2006; 2009). These kits are easy to handle, simple and fast, yet significantly
more expensive.
3.3. Genetic diversity of P. tremula plus trees
One of the objectives of the present study was to assess genetic diversity of European aspen plus
trees and to establish fingerprints that would allow distinguishing different tree genotypes. After
performing amplification of DNA extracted from all 137 European aspen plus trees with 15
random decamer primers (Table 2.5.) we obtained 292 DNA bands. The amplification patterns
obtained with primer Roth A05 are presented in Figure 3.3.
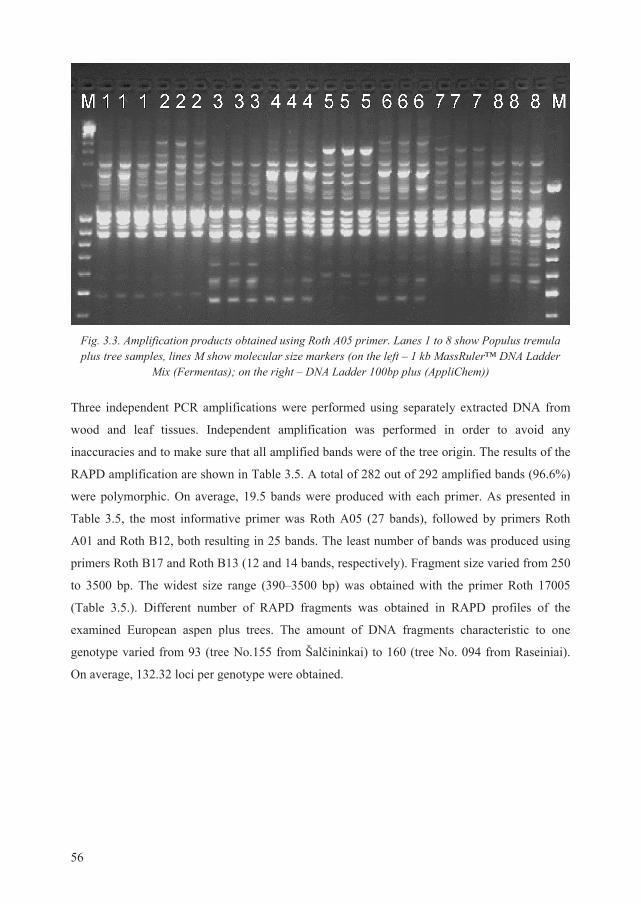
56
Fig. 3.3. Amplification products obtained using Roth A05 primer. Lanes 1 to 8 show Populus tremula plus tree samples, lines M show molecular size markers (on the left – 1 kb MassRuler™ DNA Ladder
Mix (Fermentas); on the right – DNA Ladder 100bp plus (AppliChem))
Three independent PCR amplifications were performed using separately extracted DNA from
wood and leaf tissues. Independent amplification was performed in order to avoid any
inaccuracies and to make sure that all amplified bands were of the tree origin. The results of the
RAPD amplification are shown in Table 3.5. A total of 282 out of 292 amplified bands (96.6%)
were polymorphic. On average, 19.5 bands were produced with each primer. As presented in
Table 3.5, the most informative primer was Roth A05 (27 bands), followed by primers Roth
A01 and Roth B12, both resulting in 25 bands. The least number of bands was produced using
primers Roth B17 and Roth B13 (12 and 14 bands, respectively). Fragment size varied from 250
to 3500 bp. The widest size range (390–3500 bp) was obtained with the primer Roth 17005
(Table 3.5.). Different number of RAPD fragments was obtained in RAPD profiles of the
examined European aspen plus trees. The amount of DNA fragments characteristic to one
genotype varied from 93 (tree No.155 from Šal ininkai) to 160 (tree No. 094 from Raseiniai).
On average, 132.32 loci per genotype were obtained.
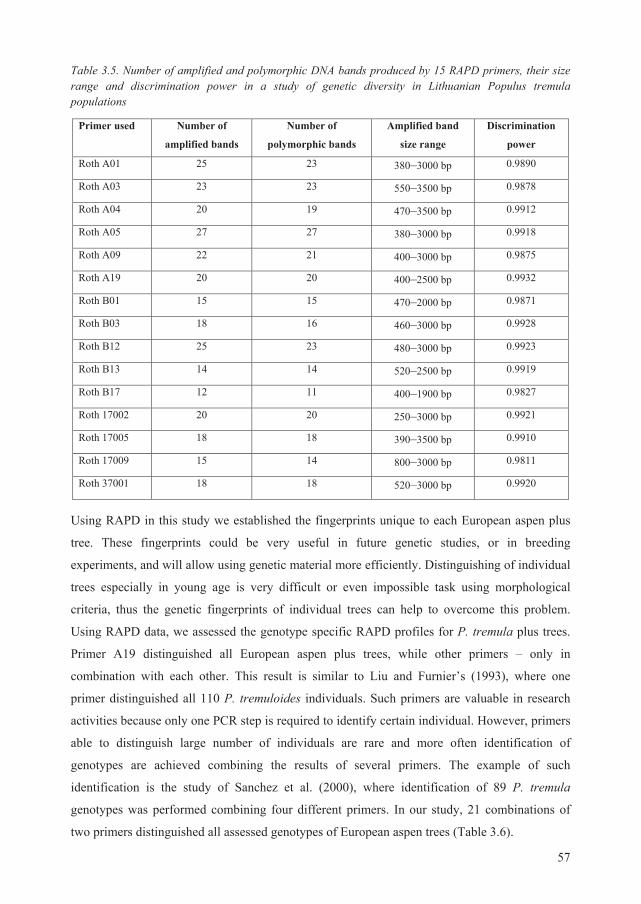
57
Table 3.5. Number of amplified and polymorphic DNA bands produced by 15 RAPD primers, their size range and discrimination power in a study of genetic diversity in Lithuanian Populus tremula populations
Primer used Number of
amplified bands
Number of
polymorphic bands
Amplified band
size range
Discrimination
power
Roth A01 25 23 380–3000 bp 0.9890
Roth A03 23 23 550–3500 bp 0.9878
Roth A04 20 19 470–3500 bp 0.9912
Roth A05 27 27 380–3000 bp 0.9918
Roth A09 22 21 400–3000 bp 0.9875
Roth A19 20 20 400–2500 bp 0.9932
Roth B01 15 15 470–2000 bp 0.9871
Roth B03 18 16 460–3000 bp 0.9928
Roth B12 25 23 480–3000 bp 0.9923
Roth B13 14 14 520–2500 bp 0.9919
Roth B17 12 11 400–1900 bp 0.9827
Roth 17002 20 20 250–3000 bp 0.9921
Roth 17005 18 18 390–3500 bp 0.9910
Roth 17009 15 14 800–3000 bp 0.9811
Roth 37001 18 18 520–3000 bp 0.9920
Using RAPD in this study we established the fingerprints unique to each European aspen plus
tree. These fingerprints could be very useful in future genetic studies, or in breeding
experiments, and will allow using genetic material more efficiently. Distinguishing of individual
trees especially in young age is very difficult or even impossible task using morphological
criteria, thus the genetic fingerprints of individual trees can help to overcome this problem.
Using RAPD data, we assessed the genotype specific RAPD profiles for P. tremula plus trees.
Primer A19 distinguished all European aspen plus trees, while other primers – only in
combination with each other. This result is similar to Liu and Furnier’s (1993), where one
primer distinguished all 110 P. tremuloides individuals. Such primers are valuable in research
activities because only one PCR step is required to identify certain individual. However, primers
able to distinguish large number of individuals are rare and more often identification of
genotypes are achieved combining the results of several primers. The example of such
identification is the study of Sanchez et al. (2000), where identification of 89 P. tremula
genotypes was performed combining four different primers. In our study, 21 combinations of
two primers distinguished all assessed genotypes of European aspen trees (Table 3.6).
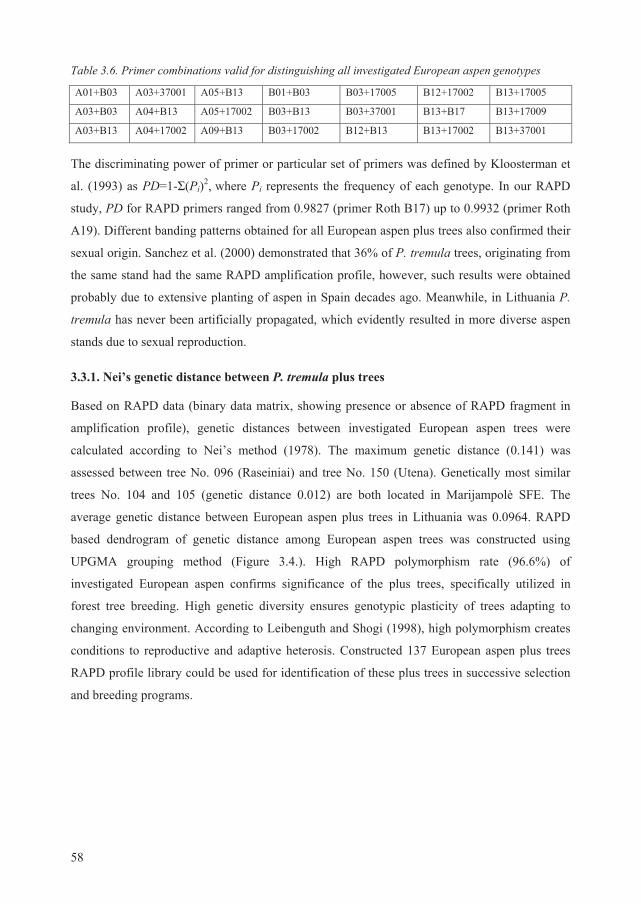
58
Table 3.6. Primer combinations valid for distinguishing all investigated European aspen genotypes
A01+B03 A03+37001 A05+B13 B01+B03 B03+17005 B12+17002 B13+17005
A03+B03 A04+B13 A05+17002 B03+B13 B03+37001 B13+B17 B13+17009
A03+B13 A04+17002 A09+B13 B03+17002 B12+B13 B13+17002 B13+37001
The discriminating power of primer or particular set of primers was defined by Kloosterman et
al. (1993) as PD=1- (Pi)2, where Pi represents the frequency of each genotype. In our RAPD
study, PD for RAPD primers ranged from 0.9827 (primer Roth B17) up to 0.9932 (primer Roth
A19). Different banding patterns obtained for all European aspen plus trees also confirmed their
sexual origin. Sanchez et al. (2000) demonstrated that 36% of P. tremula trees, originating from
the same stand had the same RAPD amplification profile, however, such results were obtained
probably due to extensive planting of aspen in Spain decades ago. Meanwhile, in Lithuania P.
tremula has never been artificially propagated, which evidently resulted in more diverse aspen
stands due to sexual reproduction.
3.3.1. Nei’s genetic distance between P. tremula plus trees
Based on RAPD data (binary data matrix, showing presence or absence of RAPD fragment in
amplification profile), genetic distances between investigated European aspen trees were
calculated according to Nei’s method (1978). The maximum genetic distance (0.141) was
assessed between tree No. 096 (Raseiniai) and tree No. 150 (Utena). Genetically most similar
trees No. 104 and 105 (genetic distance 0.012) are both located in Marijampol SFE. The
average genetic distance between European aspen plus trees in Lithuania was 0.0964. RAPD
based dendrogram of genetic distance among European aspen trees was constructed using
UPGMA grouping method (Figure 3.4.). High RAPD polymorphism rate (96.6%) of
investigated European aspen confirms significance of the plus trees, specifically utilized in
forest tree breeding. High genetic diversity ensures genotypic plasticity of trees adapting to
changing environment. According to Leibenguth and Shogi (1998), high polymorphism creates
conditions to reproductive and adaptive heterosis. Constructed 137 European aspen plus trees
RAPD profile library could be used for identification of these plus trees in successive selection
and breeding programs.
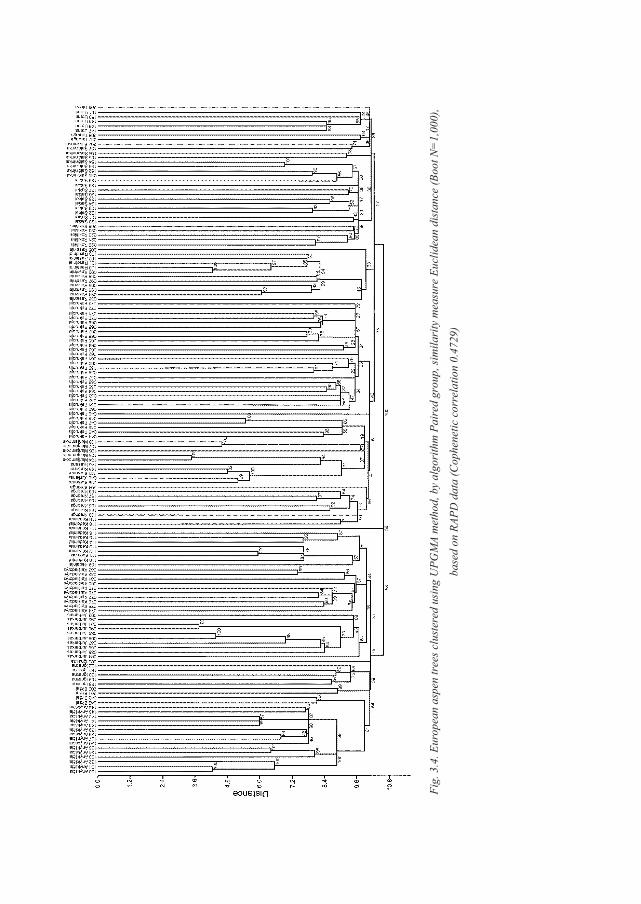
Fig.
3.4
. Eur
opea
n as
pen
tree
s clu
ster
ed u
sing
UPG
MA
met
hod,
by
algo
rith
m P
aire
d gr
oup,
sim
ilari
ty m
easu
re E
uclid
ean
dist
ance
(Boo
t N=
1,00
0),
base
d on
RAP
D d
ata
(Cop
hene
tic c
orre
latio
n 0.
4729
)
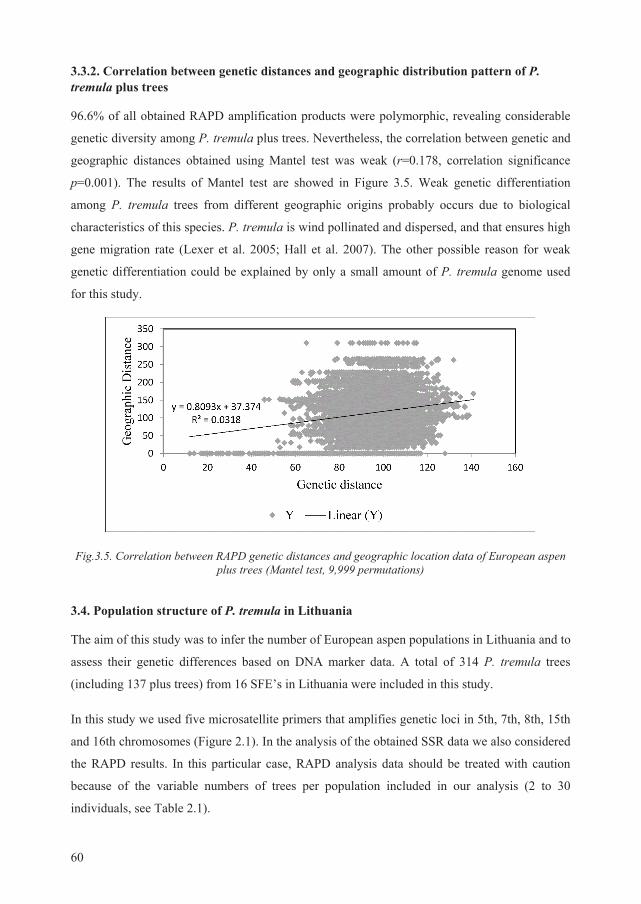
60
3.3.2. Correlation between genetic distances and geographic distribution pattern of P.tremula plus trees
96.6% of all obtained RAPD amplification products were polymorphic, revealing considerable
genetic diversity among P. tremula plus trees. Nevertheless, the correlation between genetic and
geographic distances obtained using Mantel test was weak (r=0.178, correlation significance
p=0.001). The results of Mantel test are showed in Figure 3.5. Weak genetic differentiation
among P. tremula trees from different geographic origins probably occurs due to biological
characteristics of this species. P. tremula is wind pollinated and dispersed, and that ensures high
gene migration rate (Lexer et al. 2005; Hall et al. 2007). The other possible reason for weak
genetic differentiation could be explained by only a small amount of P. tremula genome used
for this study.
Fig.3.5. Correlation between RAPD genetic distances and geographic location data of European aspen plus trees (Mantel test, 9,999 permutations)
3.4. Population structure of P. tremula in Lithuania
The aim of this study was to infer the number of European aspen populations in Lithuania and to
assess their genetic differences based on DNA marker data. A total of 314 P. tremula trees
(including 137 plus trees) from 16 SFE’s in Lithuania were included in this study.
In this study we used five microsatellite primers that amplifies genetic loci in 5th, 7th, 8th, 15th
and 16th chromosomes (Figure 2.1). In the analysis of the obtained SSR data we also considered
the RAPD results. In this particular case, RAPD analysis data should be treated with caution
because of the variable numbers of trees per population included in our analysis (2 to 30
individuals, see Table 2.1).
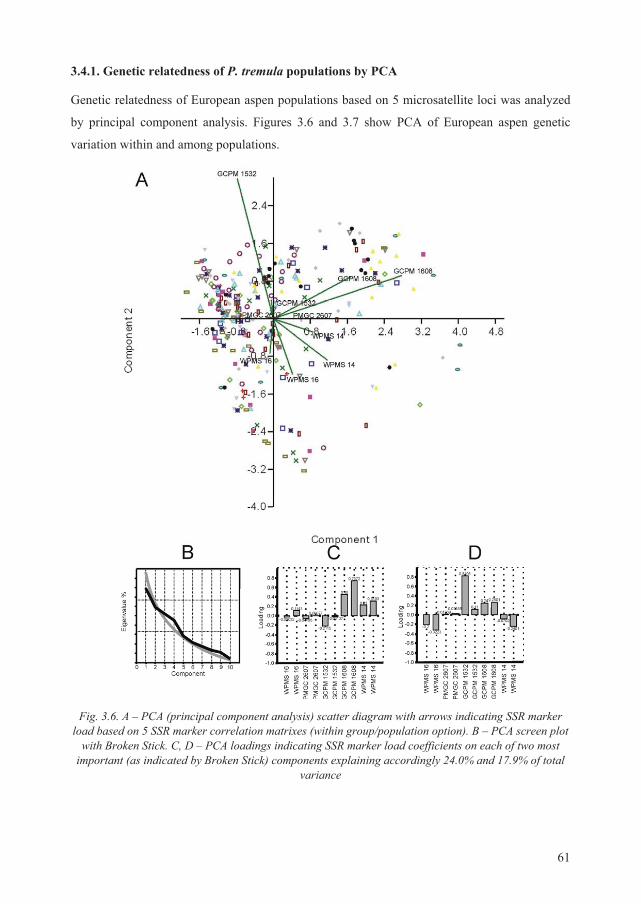
61
3.4.1. Genetic relatedness of P. tremula populations by PCA
Genetic relatedness of European aspen populations based on 5 microsatellite loci was analyzed
by principal component analysis. Figures 3.6 and 3.7 show PCA of European aspen genetic
variation within and among populations.
Fig. 3.6. A – PCA (principal component analysis) scatter diagram with arrows indicating SSR marker load based on 5 SSR marker correlation matrixes (within group/population option). B – PCA screen plot
with Broken Stick. C, D – PCA loadings indicating SSR marker load coefficients on each of two most important (as indicated by Broken Stick) components explaining accordingly 24.0% and 17.9% of total
variance
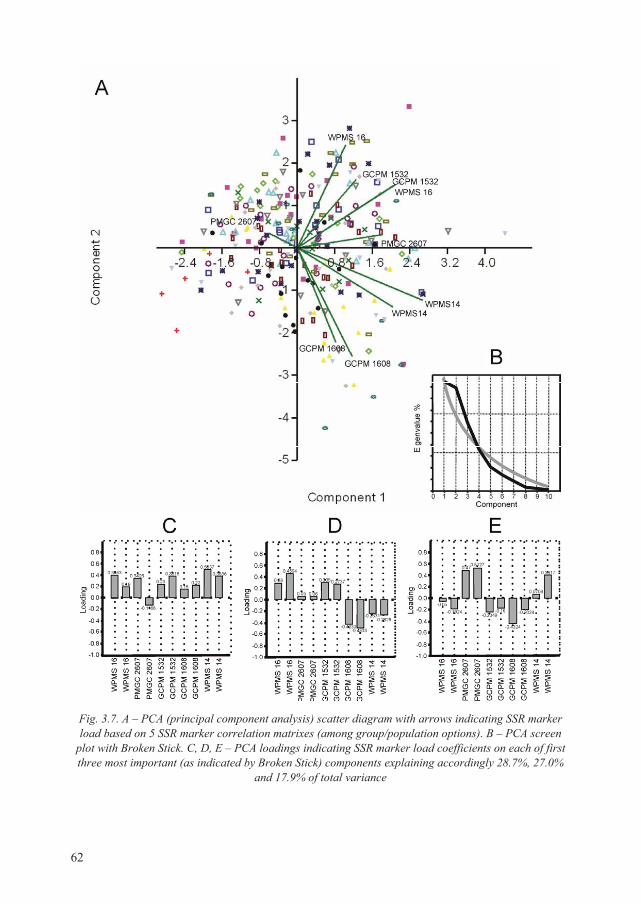
62
Fig. 3.7. A – PCA (principal component analysis) scatter diagram with arrows indicating SSR marker load based on 5 SSR marker correlation matrixes (among group/population options). B – PCA screen
plot with Broken Stick. C, D, E – PCA loadings indicating SSR marker load coefficients on each of first three most important (as indicated by Broken Stick) components explaining accordingly 28.7%, 27.0%
and 17.9% of total variance
63
As demonstrated in Figures 3.6 and 3.7, the first two components are important in within group
analysis and three components are important in between group analysis. GCPM 1608 and
GCPM 1532 SSR markers have the largest load in PCA and are the most important in within
group analysis, while WPMS 14, GCPM 1608 and PMGC 2607 markers are most
discriminating among populations.
3.4.2. Genetic parameters of assessed SSR loci of evaluated P. tremula populations
All five microsatellite loci used in this study were polymorphic and revealed 7 to 14 alleles
(Table 3.7). The locus GCPM 1532 was least polymorphic, while locus WPMS 14 had the
highest number of alleles (Table 3.7). The effective number of alleles was considerably lower
than the observed number of alleles for all the loci investigated. Observed heterozygosity was
higher than expected heterozygosity in all loci except GCPM 1532, where expected
heterozygosity exceeded observed. The Fixation Index (also called the Inbreeding coefficient)
was found to be close to zero at WPMS 16, GCPM 1532 and WPMS 14 loci, thus indicating a
random mating. PMGC 2607 and GCPM 1608 loci had Inbreeding coefficient of -0.41 and -0.59
(Table 3.7), which suggests negative assortative mating or selection for heterozygotes. All loci
used in this study except PMGC 2607 show significant population differentiation based on FST
index (Table 3.7). This indicates that all microsatellite loci selected for this study are suitable for
population genetic structure studies. Based on RST fixation index, populations were significantly
differentiated at all the loci as well, except for PMGC 2607 locus (Table 3.7).
Table 3.7. The mean statistics of microsatellite loci with ± standard error. The differentiation showed in this table is among populations. Na – number of different alleles; Ne – effective number of alleles; I – Shannon's information index; Ho – observed heterozygosity; He – expected heterozygosity; uHe – unbiased expected heterozygosity; F – inbreeding coefficient; Rst – fixation index; Fst – fixation index
Index WPMS 16 PMGC 2607 GCPM 1532 GCPM 1608 WPMS 14 Na 10 9 7 13 14
Ne 4.171±0.333 2.238±0.090 2.809±0.181 2.240±0.071 2.947±0.223
I 1.547±0.080 0.890±0.046 1.175±0.056 0.948±0.041 1.315±0.086 Ho 0.760±0.054 0.759±0.032 0.577±0.050 0.869±0.036 0.747±0.051
He 0.731±0.026 0.544±0.016 0.620±0.026 0.546±0.015 0.627±0.031
uHe 0.751±0.026 0.558±0.016 0.636±0.027 0.563±0.016 0.645±0.032 F -0.034±0.076 -0.406±0.062 0.065±0.073 -0.586±0.043 -0.187±0.073
RST 0.038** 0.003 0.073*** 0.159*** 0.012*
FST 0.046*** 0.010 0.089*** 0.043*** 0.054***
* p 0.05; ** p 0.01; and *** p 0.001
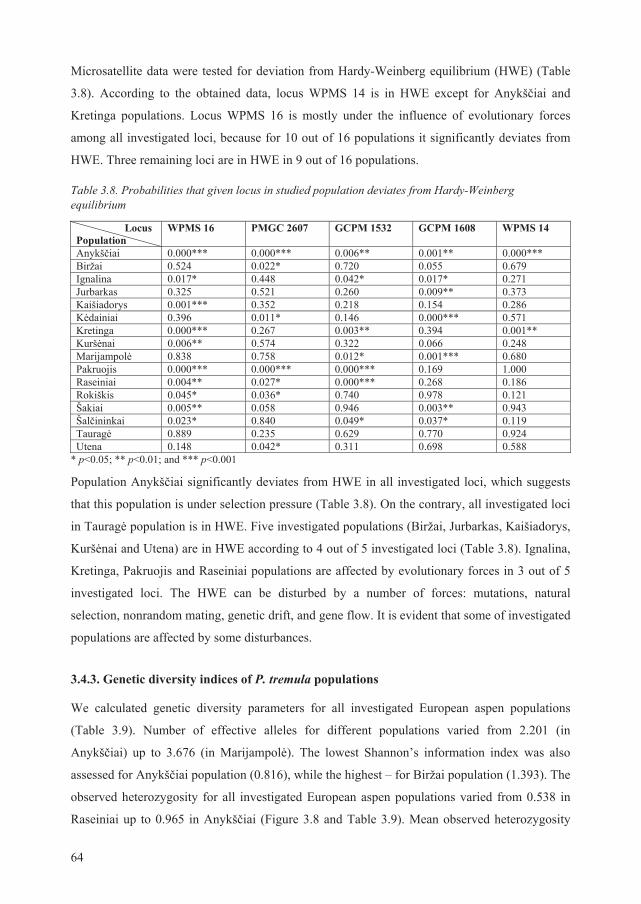
64
Microsatellite data were tested for deviation from Hardy-Weinberg equilibrium (HWE) (Table
3.8). According to the obtained data, locus WPMS 14 is in HWE except for Anykš iai and
Kretinga populations. Locus WPMS 16 is mostly under the influence of evolutionary forces
among all investigated loci, because for 10 out of 16 populations it significantly deviates from
HWE. Three remaining loci are in HWE in 9 out of 16 populations.
Table 3.8. Probabilities that given locus in studied population deviates from Hardy-Weinberg equilibrium
Locus Population
WPMS 16 PMGC 2607 GCPM 1532 GCPM 1608 WPMS 14
Anykš iai 0.000*** 0.000*** 0.006** 0.001** 0.000*** Biržai 0.524 0.022* 0.720 0.055 0.679 Ignalina 0.017* 0.448 0.042* 0.017* 0.271 Jurbarkas 0.325 0.521 0.260 0.009** 0.373 Kaišiadorys 0.001*** 0.352 0.218 0.154 0.286 K dainiai 0.396 0.011* 0.146 0.000*** 0.571 Kretinga 0.000*** 0.267 0.003** 0.394 0.001** Kurš nai 0.006** 0.574 0.322 0.066 0.248 Marijampol 0.838 0.758 0.012* 0.001*** 0.680 Pakruojis 0.000*** 0.000*** 0.000*** 0.169 1.000 Raseiniai 0.004** 0.027* 0.000*** 0.268 0.186 Rokiškis 0.045* 0.036* 0.740 0.978 0.121 Šakiai 0.005** 0.058 0.946 0.003** 0.943 Šal ininkai 0.023* 0.840 0.049* 0.037* 0.119 Taurag 0.889 0.235 0.629 0.770 0.924 Utena 0.148 0.042* 0.311 0.698 0.588
* p 0.05; ** p 0.01; and *** p 0.001
Population Anykš iai significantly deviates from HWE in all investigated loci, which suggests
that this population is under selection pressure (Table 3.8). On the contrary, all investigated loci
in Taurag population is in HWE. Five investigated populations (Biržai, Jurbarkas, Kaišiadorys,
Kurš nai and Utena) are in HWE according to 4 out of 5 investigated loci (Table 3.8). Ignalina,
Kretinga, Pakruojis and Raseiniai populations are affected by evolutionary forces in 3 out of 5
investigated loci. The HWE can be disturbed by a number of forces: mutations, natural
selection, nonrandom mating, genetic drift, and gene flow. It is evident that some of investigated
populations are affected by some disturbances.
3.4.3. Genetic diversity indices of P. tremula populations
We calculated genetic diversity parameters for all investigated European aspen populations
(Table 3.9). Number of effective alleles for different populations varied from 2.201 (in
Anykš iai) up to 3.676 (in Marijampol ). The lowest Shannon’s information index was also
assessed for Anykš iai population (0.816), while the highest – for Biržai population (1.393). The
observed heterozygosity for all investigated European aspen populations varied from 0.538 in
Raseiniai up to 0.965 in Anykš iai (Figure 3.8 and Table 3.9). Mean observed heterozygosity
65
assessed for P. tremula was 0.742, and was higher than mean expected heterozygosity (0.614)
(Table 3.9). Calculated expected heterozygosity varied from 0.484 in Rokiškis up to 0.691 in
Biržai. Expected heterozygosity was lower compared to the observed in all investigated
populations, except Šal ininkai, where expected and observed heterozygosity values were
identical (Table 3.9). Inbreeding, as indicated by Inbreeding coefficient (F), have not been
observed in any of the investigated populations (Table 3.9). According to calculated F, half of
the investigated populations are characterized by random mating, while populations from Biržai,
Jurbarkas, K dainiai, Pakruojis, Šakiai, Taurag and Utena showed signs of increased
heterozygotes number, indicating negative assortative mating. Inbreeding coefficient calculated
for Anykš iai population indicates clear negative assortative mating, or selection against
homozygotes. Mean Inbreeding coefficient value (-0.23) shows, that P. tremula in Lithuania
could be experiencing selection pressure against homozygotes (Table 3.9). This could be
expected from the biology of the species’, as it reproduces not only via seed, but also by root
suckers, and to retain high diversity it needs to favor heterozygotes. High genetic diversity rate
is also crucial for P. tremula as for pioneer species. Petit and Hampe (2006) noticed that
heterozygote advantage is an expected genomic feature of long lived and widely distributed in
different environments forest tree species. As P. tremula is distinguished by longevity (further
enhanced by clonal reproduction) (Wühlisch, 2009) and vast amount of seed production every
year (Reim, 1929), there exists high potential to “filter” fit gene combinations via selection
(Lindtke at al. 2012).
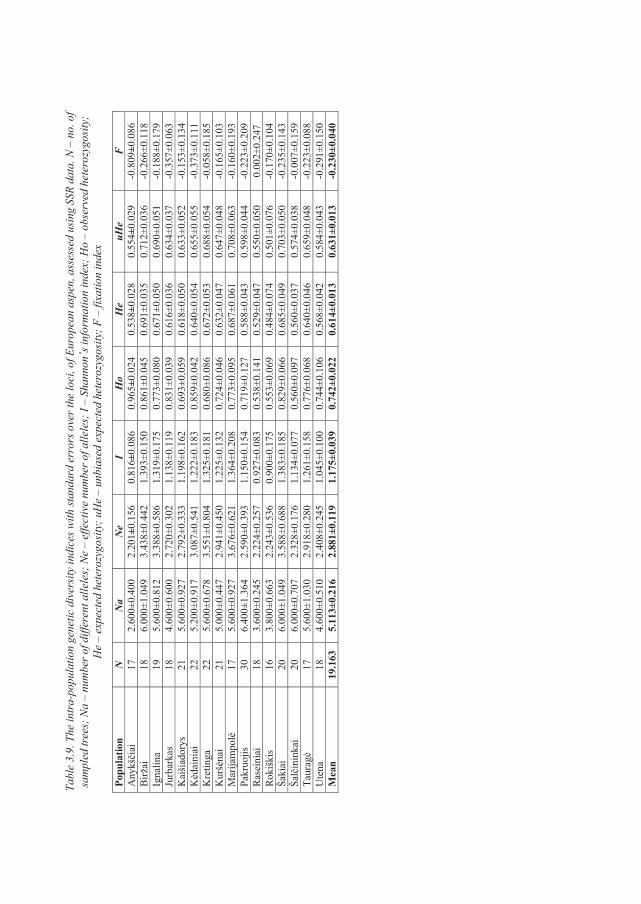
Tabl
e 3.
9. T
he in
tra-
popu
latio
n ge
netic
div
ersi
ty in
dice
s with
stan
dard
err
ors o
ver t
he lo
ci, o
f Eur
opea
n as
pen,
ass
esse
d us
ing
SSR
data
. N –
no.
of
sam
pled
tree
s; N
a –
num
ber o
f diff
eren
t alle
les;
Ne
– ef
fect
ive
num
ber o
f alle
les;
I –
Shan
non ’
s inf
orm
atio
n in
dex;
Ho
– ob
serv
ed h
eter
ozyg
osity
;
He
– ex
pect
ed h
eter
ozyg
osity
; uH
e –
unbi
ased
exp
ecte
d he
tero
zygo
sity
; F –
fixa
tion
inde
x
Popu
latio
n N
N
a N
e I
Ho
He
uHe
F A
nykš
iai
17
2.60
0±0.
400
2.20
1±0.
156
0.81
6±0.
086
0.96
5±0.
024
0.53
8±0.
028
0.55
4±0.
029
-0.8
09±0
.086
B
iržai
18
6.
000±
1.04
9 3.
438±
0.44
2 1.
393±
0.15
0 0.
861±
0.04
5 0.
691±
0.03
5 0.
712±
0.03
6 -0
.266
±0.1
18
Igna
lina
19
5.60
0±0.
812
3.38
8±0.
586
1.31
9±0.
175
0.77
3±0.
080
0.67
1±0.
050
0.69
0±0.
051
-0.1
88±0
.179
Ju
rbar
kas
18
4.60
0±0.
600
2.72
0±0.
302
1.13
8±0.
119
0.83
1±0.
039
0.61
6±0.
036
0.63
4±0.
037
-0.3
57±0
.063
K
aiši
ador
ys
21
5.60
0±0.
927
2.79
2±0.
333
1.19
8±0.
162
0.69
3±0.
059
0.61
8±0.
050
0.63
3±0.
052
-0.1
53±0
.134
K
dain
iai
22
5.20
0±0.
917
3.08
7±0.
541
1.22
2±0.
183
0.85
9±0.
042
0.64
0±0.
054
0.65
5±0.
055
-0.3
73±0
.111
K
retin
ga
22
5.60
0±0.
678
3.55
1±0.
804
1.32
5±0.
181
0.68
0±0.
086
0.67
2±0.
053
0.68
8±0.
054
-0.0
58±0
.185
K
urš
nai
21
5.00
0±0.
447
2.94
1±0.
450
1.22
5±0.
132
0.72
4±0.
046
0.63
2±0.
047
0.64
7±0.
048
-0.1
65±0
.103
M
arija
mpo
l
17
5.60
0±0.
927
3.67
6±0.
621
1.36
4±0.
208
0.77
3±0.
095
0.68
7±0.
061
0.70
8±0.
063
-0.1
60±0
.193
Pa
kruo
jis
30
6.40
0±1.
364
2.59
0±0.
393
1.15
0±0.
154
0.71
9±0.
127
0.58
8±0.
043
0.59
8±0.
044
-0.2
23±0
.209
R
asei
niai
18
3.
600±
0.24
5 2.
224±
0.25
7 0.
927±
0.08
3 0.
538±
0.14
1 0.
529±
0.04
7 0.
550±
0.05
0 0.
002±
0.24
7 R
okiš
kis
16
3.80
0±0.
663
2.24
3±0.
536
0.90
0±0.
175
0.55
3±0.
069
0.48
4±0.
074
0.50
1±0.
076
-0.1
70±0
.104
Ša
kiai
20
6.
000±
1.04
9 3.
588±
0.68
8 1.
383±
0.18
5 0.
829±
0.06
6 0.
685±
0.04
9 0.
703±
0.05
0 -0
.235
±0.1
43
Šal
inin
kai
20
6.00
0±0.
707
2.32
8±0.
176
1.13
4±0.
077
0.56
0±0.
097
0.56
0±0.
037
0.57
4±0.
038
-0.0
07±0
.159
Ta
urag
17
5.
600±
1.03
0 2.
918±
0.28
0 1.
261±
0.15
8 0.
776±
0.06
8 0.
640±
0.04
6 0.
659±
0.04
8 -0
.223
±0.0
88
Ute
na
18
4.60
0±0.
510
2.40
8±0.
245
1.04
5±0.
100
0.74
4±0.
106
0.56
8±0.
042
0.58
4±0.
043
-0.2
91±0
.150
M
ean
19.1
63
5.11
3±0.
216
2.88
1±0.
119
1.17
5±0.
039
0.74
2±0.
022
0.61
4±0.
013
0.63
1±0.
013
-0.2
30±0
.040
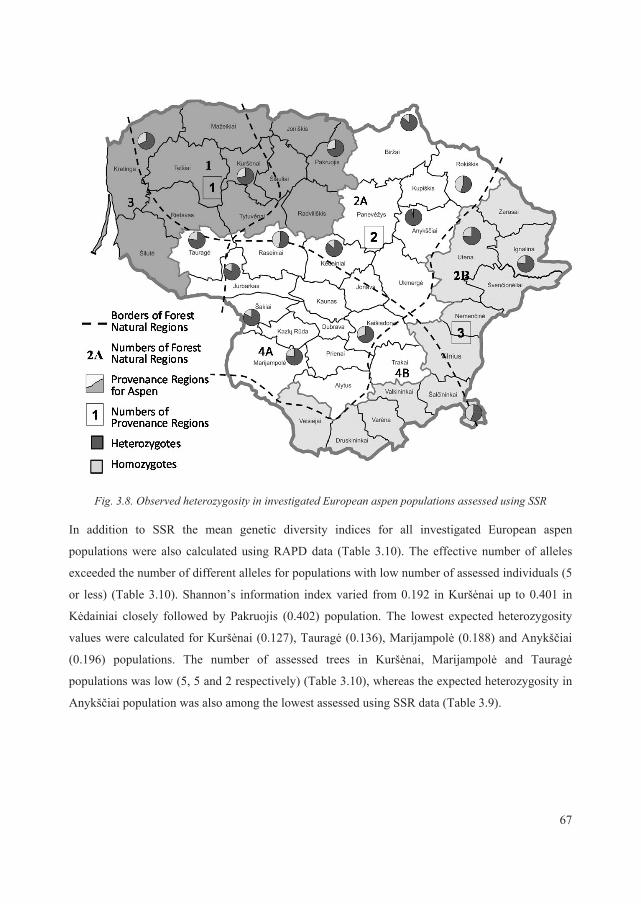
67
Fig. 3.8. Observed heterozygosity in investigated European aspen populations assessed using SSR
In addition to SSR the mean genetic diversity indices for all investigated European aspen
populations were also calculated using RAPD data (Table 3.10). The effective number of alleles
exceeded the number of different alleles for populations with low number of assessed individuals (5
or less) (Table 3.10). Shannon’s information index varied from 0.192 in Kurš nai up to 0.401 in
K dainiai closely followed by Pakruojis (0.402) population. The lowest expected heterozygosity
values were calculated for Kurš nai (0.127), Taurag (0.136), Marijampol (0.188) and Anykš iai
(0.196) populations. The number of assessed trees in Kurš nai, Marijampol and Taurag
populations was low (5, 5 and 2 respectively) (Table 3.10), whereas the expected heterozygosity in
Anykš iai population was also among the lowest assessed using SSR data (Table 3.9).
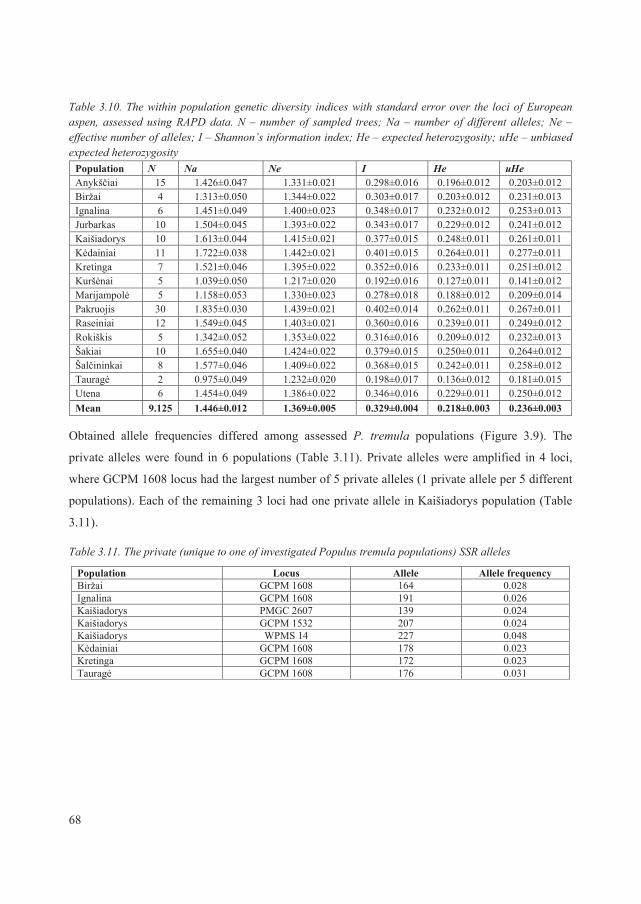
68
Table 3.10. The within population genetic diversity indices with standard error over the loci of European aspen, assessed using RAPD data. N – number of sampled trees; Na – number of different alleles; Ne – effective number of alleles; I – Shannon’s information index; He – expected heterozygosity; uHe – unbiased expected heterozygosity
Population N Na Ne I He uHe Anykš iai 15 1.426±0.047 1.331±0.021 0.298±0.016 0.196±0.012 0.203±0.012 Biržai 4 1.313±0.050 1.344±0.022 0.303±0.017 0.203±0.012 0.231±0.013 Ignalina 6 1.451±0.049 1.400±0.023 0.348±0.017 0.232±0.012 0.253±0.013 Jurbarkas 10 1.504±0.045 1.393±0.022 0.343±0.017 0.229±0.012 0.241±0.012 Kaišiadorys 10 1.613±0.044 1.415±0.021 0.377±0.015 0.248±0.011 0.261±0.011 K dainiai 11 1.722±0.038 1.442±0.021 0.401±0.015 0.264±0.011 0.277±0.011 Kretinga 7 1.521±0.046 1.395±0.022 0.352±0.016 0.233±0.011 0.251±0.012 Kurš nai 5 1.039±0.050 1.217±0.020 0.192±0.016 0.127±0.011 0.141±0.012 Marijampol 5 1.158±0.053 1.330±0.023 0.278±0.018 0.188±0.012 0.209±0.014 Pakruojis 30 1.835±0.030 1.439±0.021 0.402±0.014 0.262±0.011 0.267±0.011 Raseiniai 12 1.549±0.045 1.403±0.021 0.360±0.016 0.239±0.011 0.249±0.012 Rokiškis 5 1.342±0.052 1.353±0.022 0.316±0.016 0.209±0.012 0.232±0.013 Šakiai 10 1.655±0.040 1.424±0.022 0.379±0.015 0.250±0.011 0.264±0.012 Šal ininkai 8 1.577±0.046 1.409±0.022 0.368±0.015 0.242±0.011 0.258±0.012 Taurag 2 0.975±0.049 1.232±0.020 0.198±0.017 0.136±0.012 0.181±0.015 Utena 6 1.454±0.049 1.386±0.022 0.346±0.016 0.229±0.011 0.250±0.012 Mean 9.125 1.446±0.012 1.369±0.005 0.329±0.004 0.218±0.003 0.236±0.003
Obtained allele frequencies differed among assessed P. tremula populations (Figure 3.9). The
private alleles were found in 6 populations (Table 3.11). Private alleles were amplified in 4 loci,
where GCPM 1608 locus had the largest number of 5 private alleles (1 private allele per 5 different
populations). Each of the remaining 3 loci had one private allele in Kaišiadorys population (Table
3.11).
Table 3.11. The private (unique to one of investigated Populus tremula populations) SSR alleles
Population Locus Allele Allele frequency Biržai GCPM 1608 164 0.028 Ignalina GCPM 1608 191 0.026 Kaišiadorys PMGC 2607 139 0.024 Kaišiadorys GCPM 1532 207 0.024 Kaišiadorys WPMS 14 227 0.048 K dainiai GCPM 1608 178 0.023 Kretinga GCPM 1608 172 0.023 Taurag GCPM 1608 176 0.031
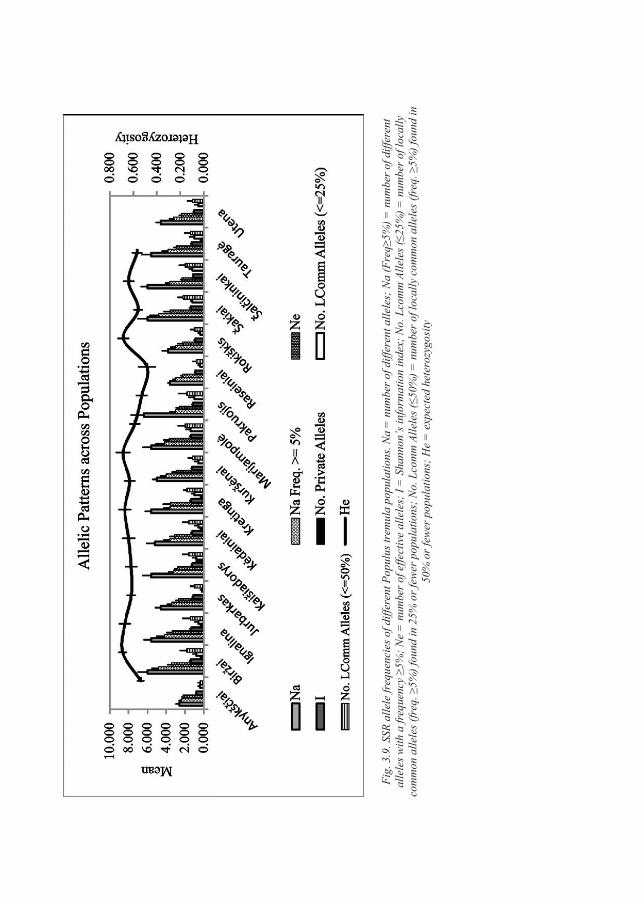
Fig.
3.9
. SSR
alle
le fr
eque
ncie
s of d
iffer
ent P
opul
us tr
emul
a po
pula
tions
. Na
= n
umbe
r of d
iffer
ent a
llele
s; N
a (F
req
5%) =
num
ber o
f diff
eren
t al
lele
s with
a fr
eque
ncy
5%; N
e =
num
ber o
f effe
ctiv
e al
lele
s; I
= S
hann
on’s
info
rmat
ion
inde
x; N
o. L
com
m A
llele
s (25
%) =
num
ber o
f loc
ally
co
mm
on a
llele
s (fr
eq.
5%) f
ound
in 2
5% o
r few
er p
opul
atio
ns; N
o. L
com
m A
llele
s (50
%) =
num
ber o
f loc
ally
com
mon
alle
les (
freq
. 5%
) fou
nd in
50
% o
r few
er p
opul
atio
ns; H
e =
exp
ecte
d he
tero
zygo
sity

70
3.4.4. Nei’s genetic distances between populations of P. tremula
In order to assess genetic relatedness of P. tremula populations in Lithuania we calculated Nei’s
genetic distances between them, according to SSR data. Pairwise genetic distances for P. tremula
populations are presented in Table 3.12. Assessed mean genetic distances among European aspen
populations in Lithuania is 0.125. The most similar populations are from Jurbarkas and Kurš nai
(genetic distance was 0.035). Slightly greater genetic distance was assessed between Pakruojis –
Šal ininkai (0.036) and Šal ininkai – Taurag (0.038) populations (Table 3.12), while the most
distinct populations are from Anykš iai and Rokiškis (0.388). Anykš iai – Utena (0.313),
Marijampol – Rokiškis (0.293) and Anykš iai – Biržai (0.258) populations also are among the
most different P. tremula populations (Table 3.12).
Somewhat similar results were obtained and using RAPD data for population genetic distance
assessment. European aspen pairwise Nei’s genetic distance data are showed in Table 3.12. Mean
genetic distance between P. tremula populations in Lithuania according to RAPD is 0.131. The two
most similar populations are from Pakruojis and Šal ininkai (0.031), confirming Nei’s genetic
distance calculated between these two populations using SSR data. The other genetically similar
populations according to RAPD data are Pakruojis – Utena and Pakruojis – Kaišiadorys (0.037).
Genetic distance between these populations according to SSR data is close to the mean genetic
distance and is equal to 0.103 and 0.123 respectively (Table 3.12). The most different populations
according to RAPD are Kurš nai – Taurag (0.292), Marijampol – Taurag (0.252) and Rokiškis –
Taurag (0.245). Compared to SSR data, these populations are quite similar, Nei’s genetic distances
among them are 0.068, 0.098 and 0.162 respectively. However, only two samples from Taurag
population were used in RAPD analysis, possibly influencing the results (Table 2.1).
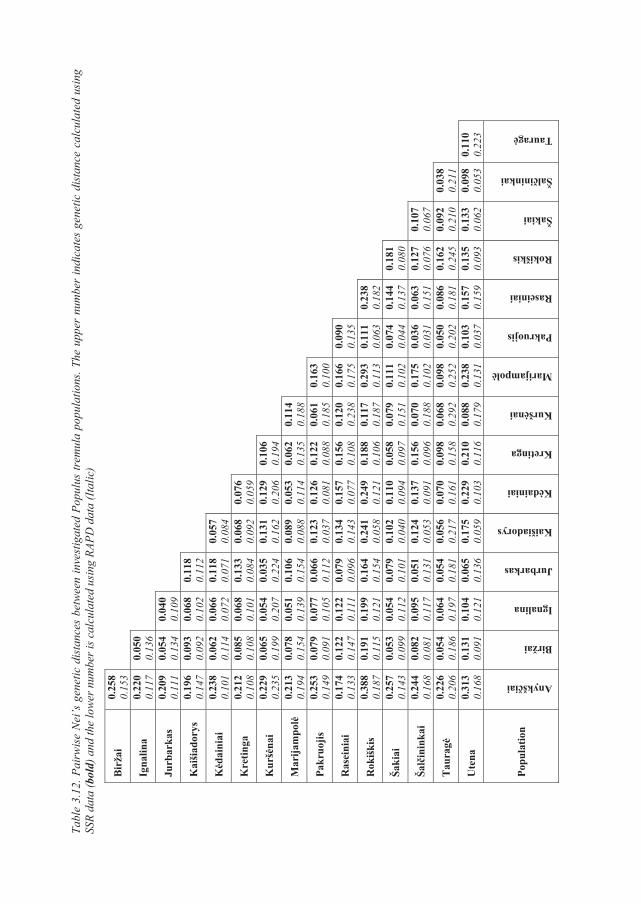
Tabl
e 3.
12. P
airw
ise
Nei
’s g
enet
ic d
ista
nces
bet
wee
n in
vest
igat
ed P
opul
us tr
emul
a po
pula
tions
. The
upp
er n
umbe
r in
dica
tes
gene
tic d
ista
nce
calc
ulat
ed u
sing
SS
R da
ta (b
old)
and
the
low
er n
umbe
r is c
alcu
late
d us
ing
RAPD
dat
a (I
talic
)
Bir
žai
0.25
8 0.
153
Igna
lina
0.22
0 0.
117
0.05
00.
136
Jurb
arka
s 0.
209
0.11
1 0.
054
0.13
4 0.
040
0.10
9
Kai
šiad
orys
0.
196
0.14
7 0.
093
0.09
2 0.
068
0.10
2 0.
118
0.11
2
Kda
inia
i 0.
238
0.10
1 0.
062
0.11
4 0.
066
0.07
2 0.
118
0.07
1 0.
057
0.08
4
Kre
tinga
0.
212
0.10
8 0.
085
0.10
8 0.
068
0.10
1 0.
133
0.08
4 0.
068
0.09
2 0.
076
0.05
9
Kur
šna
i 0.
229
0.23
5 0.
065
0.19
9 0.
054
0.20
7 0.
035
0.22
4 0.
131
0.16
2 0.
129
0.20
6 0.
106
0.19
4
Mar
ijam
pol
0.
213
0.19
4 0.
078
0.15
4 0.
051
0.13
9 0.
106
0.15
4 0.
089
0.08
8 0.
053
0.11
4 0.
062
0.13
5 0.
114
0.18
8
Pakr
uojis
0.
253
0.14
9 0.
079
0.09
1 0.
077
0.10
5 0.
066
0.11
2 0.
123
0.03
7 0.
126
0.08
1 0.
122
0.08
8 0.
061
0.18
5 0.
163
0.10
0
Ras
eini
ai
0.17
4 0.
133
0.12
20.
147
0.12
20.
111
0.07
90.
096
0.13
40.
143
0.15
70.
077
0.15
60.
108
0.12
0 0.
238
0.16
60.
175
0.09
00.
135
Rok
iški
s 0.
388
0.18
7 0.
191
0.11
5 0.
199
0.12
1 0.
164
0.15
4 0.
241
0.05
8 0.
249
0.12
1 0.
188
0.10
6 0.
117
0.18
7 0.
293
0.11
3 0.
111
0.06
3 0.
238
0.18
2
Šaki
ai
0.25
7 0.
143
0.05
30.
099
0.05
40.
112
0.07
90.
101
0.10
20.
040
0.11
00.
094
0.05
80.
097
0.07
9 0.
151
0.11
10.
102
0.07
40.
044
0.14
40.
137
0.18
10.
080
Šal
inin
kai
0.24
4 0.
168
0.08
20.
081
0.09
50.
117
0.05
10.
131
0.12
40.
053
0.13
70.
091
0.15
60.
096
0.07
0 0.
188
0.17
50.
102
0.03
60.
031
0.06
30.
151
0.12
70.
076
0.10
70.
067
Tau
rag
0.
226
0.20
6 0.
054
0.18
6 0.
064
0.19
7 0.
054
0.18
1 0.
056
0.21
7 0.
070
0.16
1 0.
098
0.15
8 0.
068
0.29
2 0.
098
0.25
2 0.
050
0.20
2 0.
086
0.18
1 0.
162
0.24
5 0.
092
0.21
0 0.
038
0.21
1
Ute
na
0.31
3 0.
168
0.13
10.
091
0.10
40.
121
0.06
50.
136
0.17
50.
059
0.22
90.
103
0.21
00.
116
0.08
8 0.
179
0.23
80.
131
0.10
30.
037
0.15
70.
159
0.13
50.
093
0.13
30.
062
0.09
80.
053
0.11
0 0.
223
Popu
latio
n
Anykšiai
Biržai
Ignalina
Jurbarkas
Kaišiadorys
Kdainiai
Kretinga
Kuršnai
Marijampol
Pakruojis
Raseiniai
Rokiškis
Šakiai
Šalininkai
Taurag
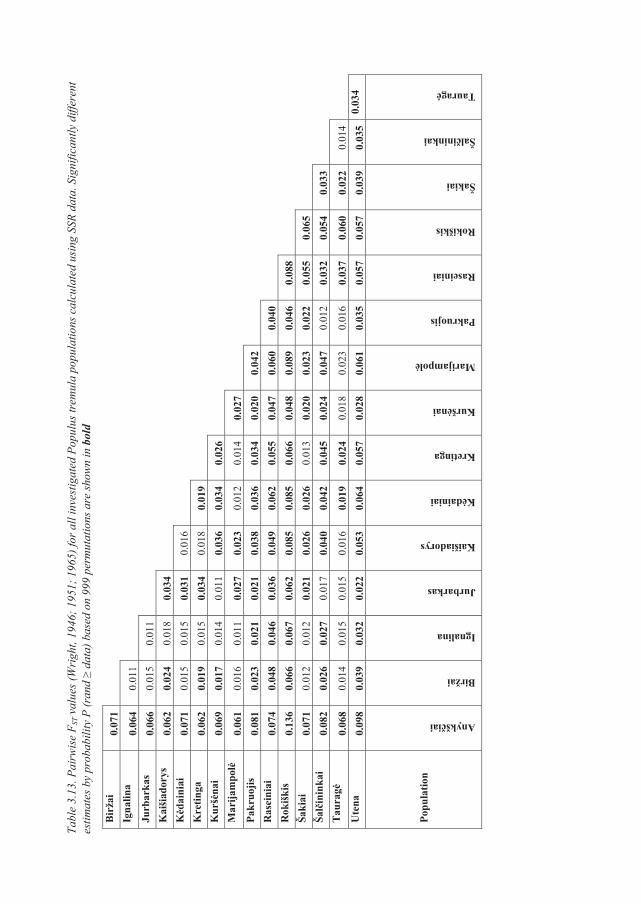
Tabl
e 3.
13. P
airw
ise
F ST v
alue
s (W
righ
t, 19
46; 1
951;
196
5) fo
r all
inve
stig
ated
Pop
ulus
trem
ula
popu
latio
ns c
alcu
late
d us
ing
SSR
data
. Sig
nific
antly
diff
eren
t es
timat
es b
y pr
obab
ility
P (r
and
dat
a) b
ased
on
999
perm
utat
ions
are
show
n in
bol
d
Bir
žai
0.07
1
Ig
nalin
a 0.
064
0.01
1
Jurb
arka
s 0.
066
0.01
5 0.
011
Kai
šiad
orys
0.
062
0.02
4 0.
018
0.03
4
Kda
inia
i 0.
071
0.01
5 0.
015
0.03
1 0.
016
Kre
tinga
0.
062
0.01
9 0.
015
0.03
4 0.
018
0.01
9
Kur
šna
i 0.
069
0.01
7 0.
014
0.01
1 0.
036
0.03
4 0.
026
Mar
ijam
pol
0.
061
0.01
6 0.
011
0.02
7 0.
023
0.01
2 0.
014
0.02
7
Pakr
uojis
0.
081
0.02
3 0.
021
0.02
1 0.
038
0.03
6 0.
034
0.02
0 0.
042
Ras
eini
ai
0.07
4 0.
048
0.04
6 0.
036
0.04
9 0.
062
0.05
5 0.
047
0.06
0 0.
040
R
okiš
kis
0.13
6 0.
066
0.06
7 0.
062
0.08
5 0.
085
0.06
6 0.
048
0.08
9 0.
046
0.08
8
Ša
kiai
0.
071
0.01
2 0.
012
0.02
1 0.
026
0.02
6 0.
013
0.02
0 0.
023
0.02
2 0.
055
0.06
5
Šal
inin
kai
0.08
2 0.
026
0.02
7 0.
017
0.04
0 0.
042
0.04
5 0.
024
0.04
7 0.
012
0.03
2 0.
054
0.03
3
T
aura
g
0.06
8 0.
014
0.01
5 0.
015
0.01
6 0.
019
0.02
4 0.
018
0.02
3 0.
016
0.03
7 0.
060
0.02
2 0.
014
Ute
na
0.09
8 0.
039
0.03
2 0.
022
0.05
3 0.
064
0.05
7 0.
028
0.06
1 0.
035
0.05
7 0.
057
0.03
9 0.
035
0.03
4
Popu
latio
n
Anykšiai
Biržai
Ignalina
Jurbarkas
Kaišiadorys
Kdainiai
Kretinga
Kuršnai
Marijampol
Pakruojis
Raseiniai
Rokiškis
Šakiai
Šalininkai
Taurag
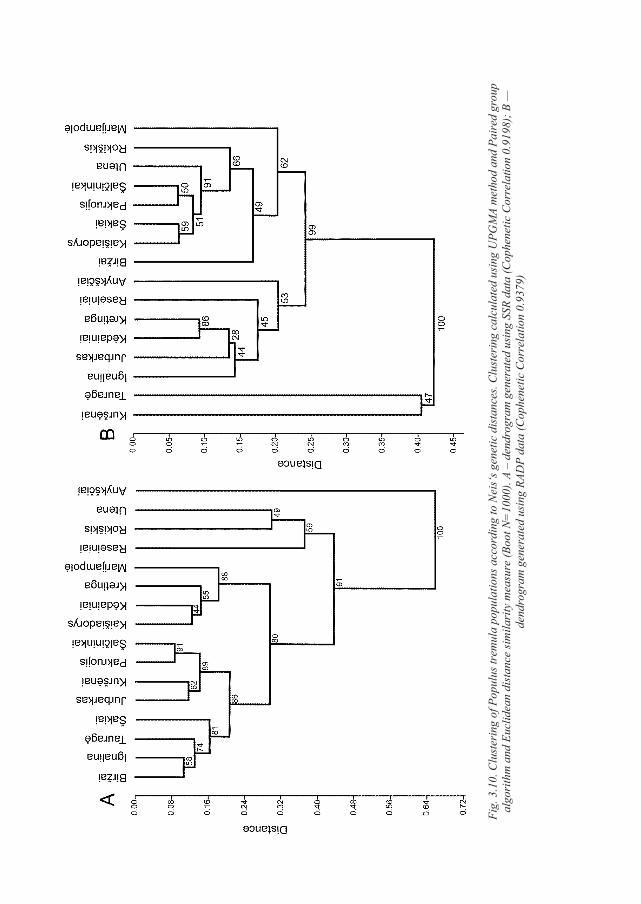
Fig.
3.1
0. C
lust
erin
g of
Pop
ulus
trem
ula
popu
latio
ns a
ccor
ding
to N
eis‘
s gen
etic
dis
tanc
es. C
lust
erin
g ca
lcul
ated
usi
ng U
PGM
A m
etho
d an
d Pa
ired
gro
up
algo
rith
m a
nd E
uclid
ean
dist
ance
sim
ilari
ty m
easu
re (B
oot N
=10
00).
A –
dend
rogr
am g
ener
ated
usi
ng S
SR d
ata
(Cop
hene
tic C
orre
latio
n 0.
9198
); B
—
dend
rogr
am g
ener
ated
usi
ng R
ADP
data
(Cop
hene
tic C
orre
latio
n 0.
9379
)
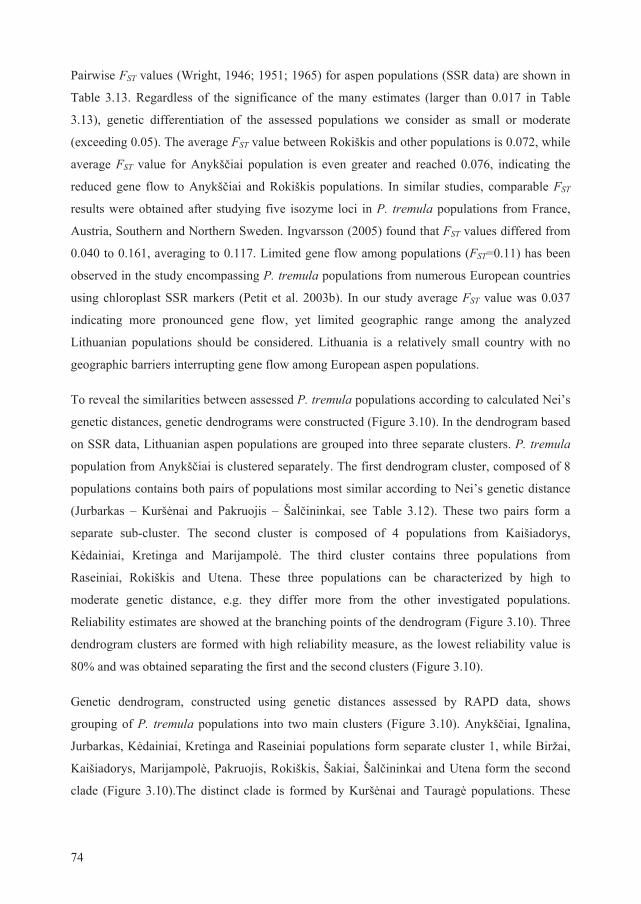
74
Pairwise FST values (Wright, 1946; 1951; 1965) for aspen populations (SSR data) are shown in
Table 3.13. Regardless of the significance of the many estimates (larger than 0.017 in Table
3.13), genetic differentiation of the assessed populations we consider as small or moderate
(exceeding 0.05). The average FST value between Rokiškis and other populations is 0.072, while
average FST value for Anykš iai population is even greater and reached 0.076, indicating the
reduced gene flow to Anykš iai and Rokiškis populations. In similar studies, comparable FST
results were obtained after studying five isozyme loci in P. tremula populations from France,
Austria, Southern and Northern Sweden. Ingvarsson (2005) found that FST values differed from
0.040 to 0.161, averaging to 0.117. Limited gene flow among populations (FST=0.11) has been
observed in the study encompassing P. tremula populations from numerous European countries
using chloroplast SSR markers (Petit et al. 2003b). In our study average FST value was 0.037
indicating more pronounced gene flow, yet limited geographic range among the analyzed
Lithuanian populations should be considered. Lithuania is a relatively small country with no
geographic barriers interrupting gene flow among European aspen populations.
To reveal the similarities between assessed P. tremula populations according to calculated Nei’s
genetic distances, genetic dendrograms were constructed (Figure 3.10). In the dendrogram based
on SSR data, Lithuanian aspen populations are grouped into three separate clusters. P. tremula
population from Anykš iai is clustered separately. The first dendrogram cluster, composed of 8
populations contains both pairs of populations most similar according to Nei’s genetic distance
(Jurbarkas – Kurš nai and Pakruojis – Šal ininkai, see Table 3.12). These two pairs form a
separate sub-cluster. The second cluster is composed of 4 populations from Kaišiadorys,
K dainiai, Kretinga and Marijampol . The third cluster contains three populations from
Raseiniai, Rokiškis and Utena. These three populations can be characterized by high to
moderate genetic distance, e.g. they differ more from the other investigated populations.
Reliability estimates are showed at the branching points of the dendrogram (Figure 3.10). Three
dendrogram clusters are formed with high reliability measure, as the lowest reliability value is
80% and was obtained separating the first and the second clusters (Figure 3.10).
Genetic dendrogram, constructed using genetic distances assessed by RAPD data, shows
grouping of P. tremula populations into two main clusters (Figure 3.10). Anykš iai, Ignalina,
Jurbarkas, K dainiai, Kretinga and Raseiniai populations form separate cluster 1, while Biržai,
Kaišiadorys, Marijampol , Pakruojis, Rokiškis, Šakiai, Šal ininkai and Utena form the second
clade (Figure 3.10).The distinct clade is formed by Kurš nai and Taurag populations. These
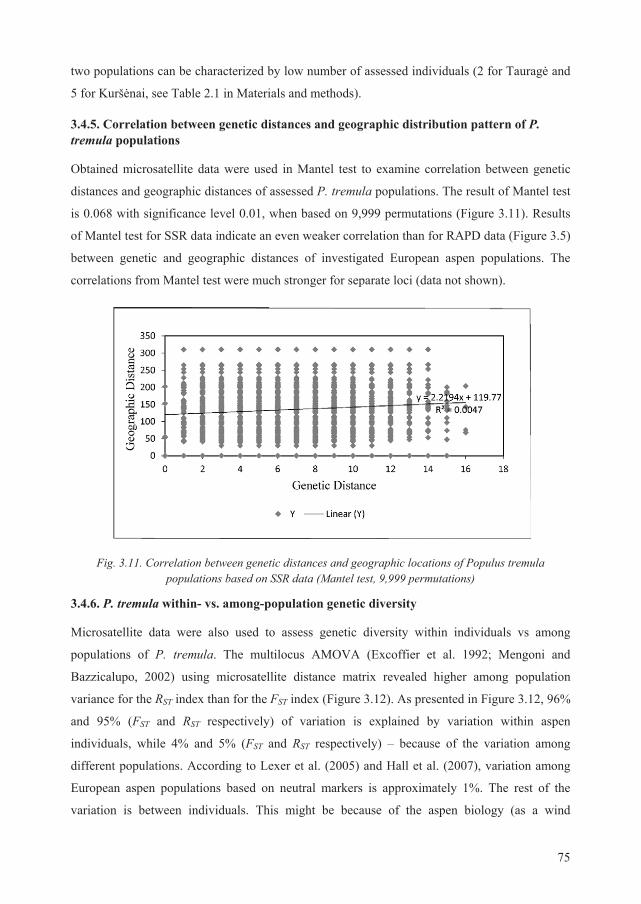
75
two populations can be characterized by low number of assessed individuals (2 for Taurag and
5 for Kurš nai, see Table 2.1 in Materials and methods).
3.4.5. Correlation between genetic distances and geographic distribution pattern of P.tremula populations
Obtained microsatellite data were used in Mantel test to examine correlation between genetic
distances and geographic distances of assessed P. tremula populations. The result of Mantel test
is 0.068 with significance level 0.01, when based on 9,999 permutations (Figure 3.11). Results
of Mantel test for SSR data indicate an even weaker correlation than for RAPD data (Figure 3.5)
between genetic and geographic distances of investigated European aspen populations. The
correlations from Mantel test were much stronger for separate loci (data not shown).
Fig. 3.11. Correlation between genetic distances and geographic locations of Populus tremula populations based on SSR data (Mantel test, 9,999 permutations)
3.4.6. P. tremula within- vs. among-population genetic diversity
Microsatellite data were also used to assess genetic diversity within individuals vs among
populations of P. tremula. The multilocus AMOVA (Excoffier et al. 1992; Mengoni and
Bazzicalupo, 2002) using microsatellite distance matrix revealed higher among population
variance for the RST index than for the FST index (Figure 3.12). As presented in Figure 3.12, 96%
and 95% (FST and RST respectively) of variation is explained by variation within aspen
individuals, while 4% and 5% (FST and RST respectively) – because of the variation among
different populations. According to Lexer et al. (2005) and Hall et al. (2007), variation among
European aspen populations based on neutral markers is approximately 1%. The rest of the
variation is between individuals. This might be because of the aspen biology (as a wind
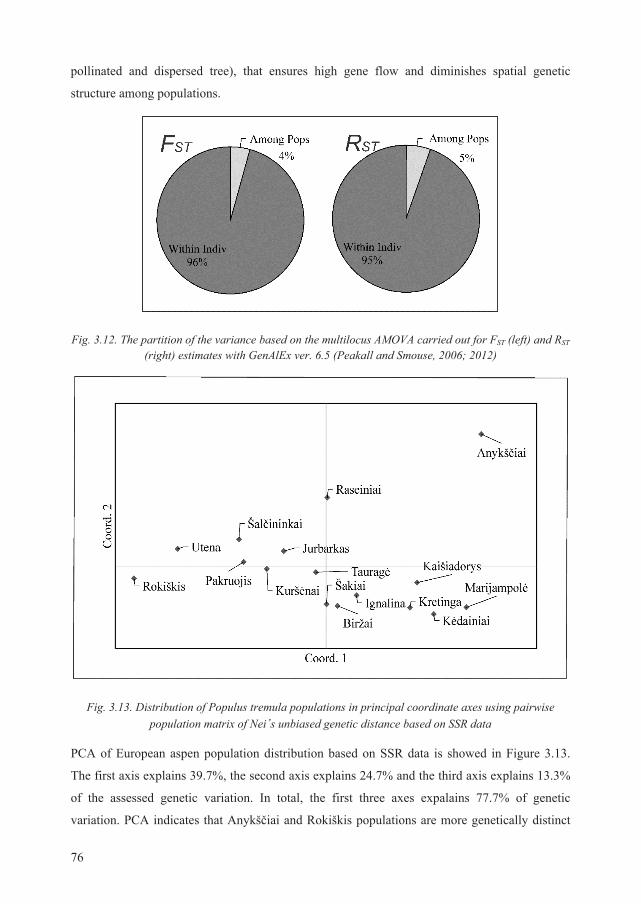
76
pollinated and dispersed tree), that ensures high gene flow and diminishes spatial genetic
structure among populations.
Fig. 3.12. The partition of the variance based on the multilocus AMOVA carried out for FST (left) and RST (right) estimates with GenAlEx ver. 6.5 (Peakall and Smouse, 2006; 2012)
Fig. 3.13. Distribution of Populus tremula populations in principal coordinate axes using pairwise population matrix of Nei’s unbiased genetic distance based on SSR data
PCA of European aspen population distribution based on SSR data is showed in Figure 3.13.
The first axis explains 39.7%, the second axis explains 24.7% and the third axis explains 13.3%
of the assessed genetic variation. In total, the first three axes expalains 77.7% of genetic
variation. PCA indicates that Anykš iai and Rokiškis populations are more genetically distinct
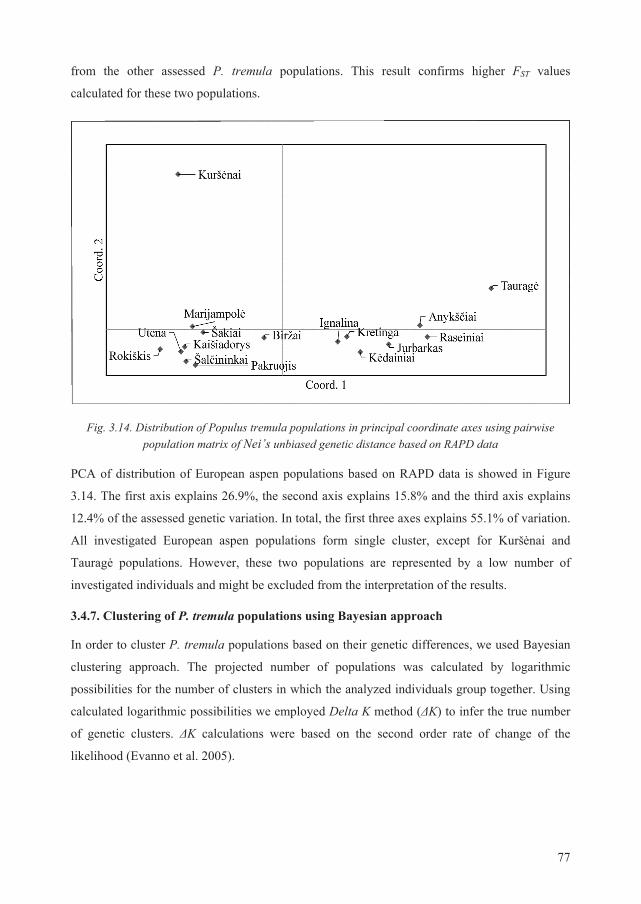
77
from the other assessed P. tremula populations. This result confirms higher FST values
calculated for these two populations.
Fig. 3.14. Distribution of Populus tremula populations in principal coordinate axes using pairwise population matrix of Nei’s unbiased genetic distance based on RAPD data
PCA of distribution of European aspen populations based on RAPD data is showed in Figure
3.14. The first axis explains 26.9%, the second axis explains 15.8% and the third axis explains
12.4% of the assessed genetic variation. In total, the first three axes explains 55.1% of variation.
All investigated European aspen populations form single cluster, except for Kurš nai and
Taurag populations. However, these two populations are represented by a low number of
investigated individuals and might be excluded from the interpretation of the results.
3.4.7. Clustering of P. tremula populations using Bayesian approach
In order to cluster P. tremula populations based on their genetic differences, we used Bayesian
clustering approach. The projected number of populations was calculated by logarithmic
possibilities for the number of clusters in which the analyzed individuals group together. Using
calculated logarithmic possibilities we employed Delta K method ( K) to infer the true number
of genetic clusters. K calculations were based on the second order rate of change of the
likelihood (Evanno et al. 2005).
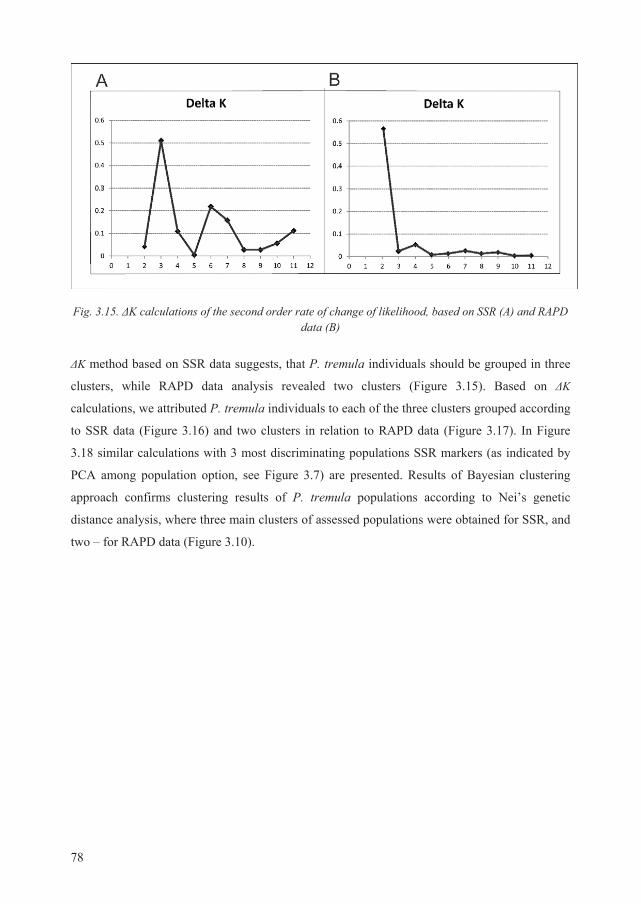
78
Fig. 3.15. K calculations of the second order rate of change of likelihood, based on SSR (A) and RAPD data (B)
K method based on SSR data suggests, that P. tremula individuals should be grouped in three
clusters, while RAPD data analysis revealed two clusters (Figure 3.15). Based on K
calculations, we attributed P. tremula individuals to each of the three clusters grouped according
to SSR data (Figure 3.16) and two clusters in relation to RAPD data (Figure 3.17). In Figure
3.18 similar calculations with 3 most discriminating populations SSR markers (as indicated by
PCA among population option, see Figure 3.7) are presented. Results of Bayesian clustering
approach confirms clustering results of P. tremula populations according to Nei’s genetic
distance analysis, where three main clusters of assessed populations were obtained for SSR, and
two – for RAPD data (Figure 3.10).
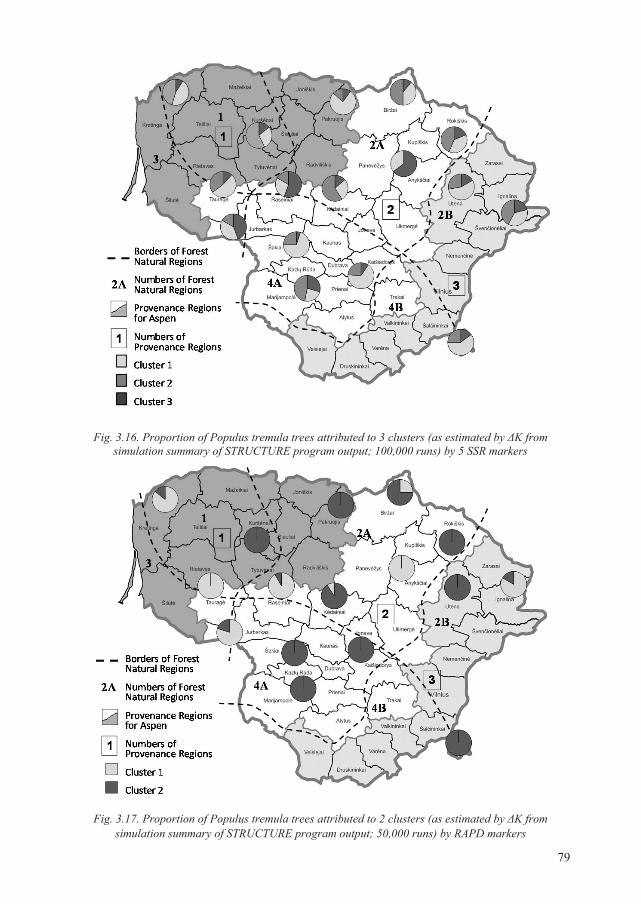
79
Fig. 3.16. Proportion of Populus tremula trees attributed to 3 clusters (as estimated by K from simulation summary of STRUCTURE program output; 100,000 runs) by 5 SSR markers
Fig. 3.17. Proportion of Populus tremula trees attributed to 2 clusters (as estimated by K from simulation summary of STRUCTURE program output; 50,000 runs) by RAPD markers
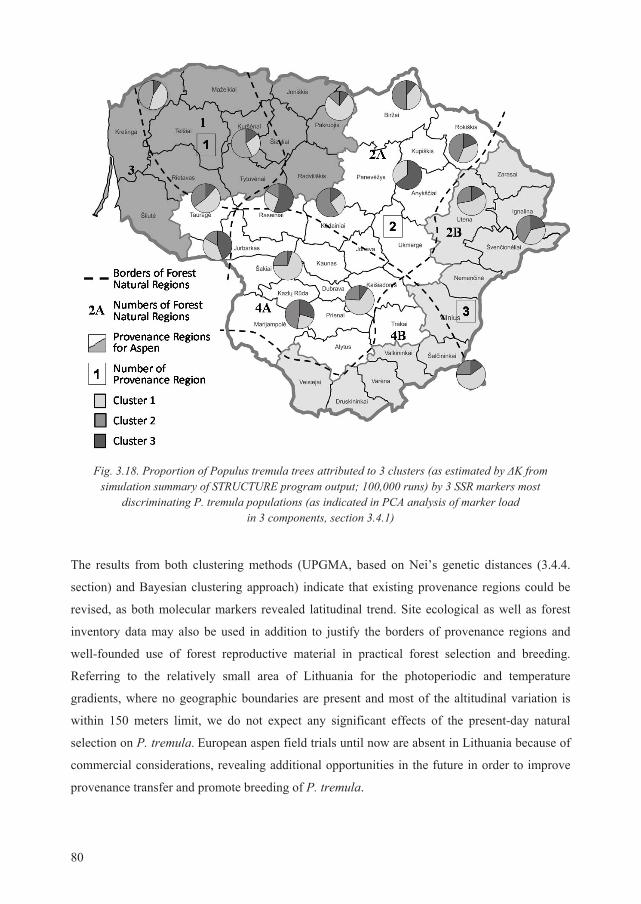
80
Fig. 3.18. Proportion of Populus tremula trees attributed to 3 clusters (as estimated by K from simulation summary of STRUCTURE program output; 100,000 runs) by 3 SSR markers most
discriminating P. tremula populations (as indicated in PCA analysis of marker load in 3 components, section 3.4.1)
The results from both clustering methods (UPGMA, based on Nei’s genetic distances (3.4.4.
section) and Bayesian clustering approach) indicate that existing provenance regions could be
revised, as both molecular markers revealed latitudinal trend. Site ecological as well as forest
inventory data may also be used in addition to justify the borders of provenance regions and
well-founded use of forest reproductive material in practical forest selection and breeding.
Referring to the relatively small area of Lithuania for the photoperiodic and temperature
gradients, where no geographic boundaries are present and most of the altitudinal variation is
within 150 meters limit, we do not expect any significant effects of the present-day natural
selection on P. tremula. European aspen field trials until now are absent in Lithuania because of
commercial considerations, revealing additional opportunities in the future in order to improve
provenance transfer and promote breeding of P. tremula.
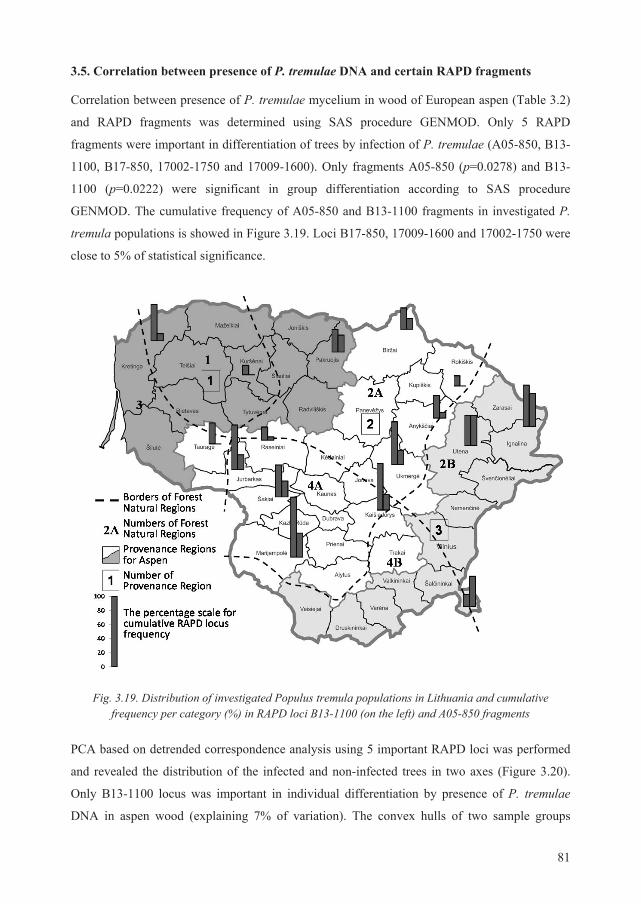
81
3.5. Correlation between presence of P. tremulae DNA and certain RAPD fragments
Correlation between presence of P. tremulae mycelium in wood of European aspen (Table 3.2)
and RAPD fragments was determined using SAS procedure GENMOD. Only 5 RAPD
fragments were important in differentiation of trees by infection of P. tremulae (A05-850, B13-
1100, B17-850, 17002-1750 and 17009-1600). Only fragments A05-850 (p=0.0278) and B13-
1100 (p=0.0222) were significant in group differentiation according to SAS procedure
GENMOD. The cumulative frequency of A05-850 and B13-1100 fragments in investigated P.
tremula populations is showed in Figure 3.19. Loci B17-850, 17009-1600 and 17002-1750 were
close to 5% of statistical significance.
Fig. 3.19. Distribution of investigated Populus tremula populations in Lithuania and cumulative frequency per category (%) in RAPD loci B13-1100 (on the left) and A05-850 fragments
PCA based on detrended correspondence analysis using 5 important RAPD loci was performed
and revealed the distribution of the infected and non-infected trees in two axes (Figure 3.20).
Only B13-1100 locus was important in individual differentiation by presence of P. tremulae
DNA in aspen wood (explaining 7% of variation). The convex hulls of two sample groups

82
(infected and uninfected by P. tremulae) are overlapping, but the frequencies in two loci
indicate quite good possibilities for using these RAPDs loci in tree breeding at early ontogenesis
stages.
Fig. 3.20. Distribution in two axes of European aspen uninfected (indicated as dashed line and diamond shape) and infected by Phellinus tremulae (indicated as solid line and cross shape) trees based on the
results of detrended correspondence analysis using RAPD loci B13-1100, A5-850, B17-850, 17002-1750 and 17009-1600
Additionally, we calculated the correlation whether tree individual heterozygosity, RAPD
marker polymorphism, and provenance region, population or forest soil type had an effect on
presence of P. tremulae in European aspen. Pearson correlation between tree individual
heterozygosity by 5 SSR loci and presence or absence of P. tremulae DNA in wood samples
was estimated close to zero (-0.04). The same correlation between tree individual RAPD marker
polymorphism and presence of fungal DNA also resulted in similar estimate (-0.03). Percentage
of P. tremulae infected trees was slightly lower on temporarily moisturized or overmoistured
and eutrophic sites.
Provenance region and population influence on the presence of P. tremulae in wood of assessed
P. tremula was tested using SAS procedure MIXED (REML option), but the results showed that
these two factors have no effect on distribution of this fungal pathogen.
RAPD markers are known to amplify anonymous regions of genome, thus allowing to catch
some of the genetic variation underlying the resistance mechanisms only by chance. To increase
our chances in capturing correlation, we have used 15 highly informative primers (Table 3.5).
However, statistically significant correlation between the presence of P. tremulae and RAPD
loci was established for only two of them (B13-1100 p=0.0222 and A05-850, p=0.0278).
Obtained results suggest that search for correlation without prior screening of the resistance and
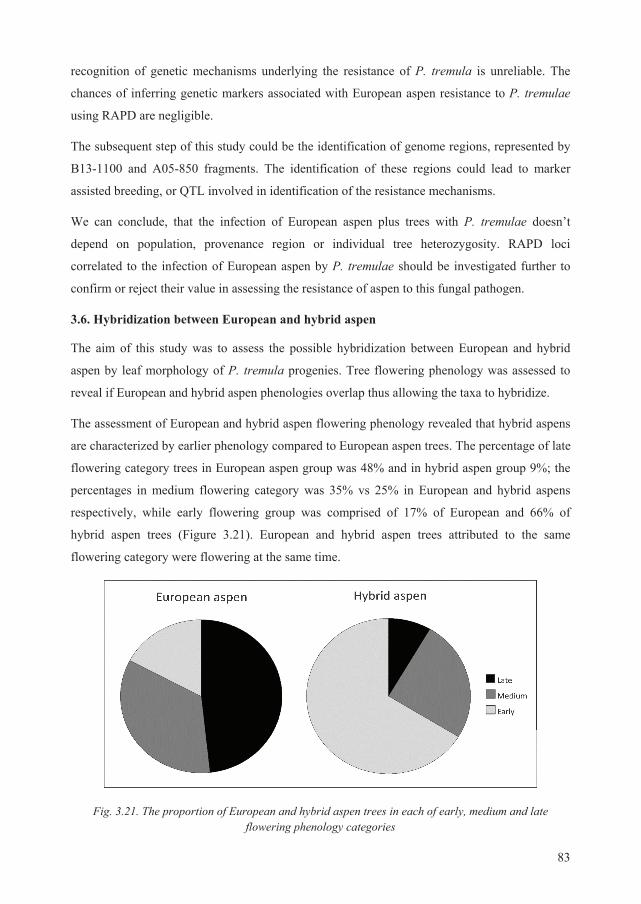
83
recognition of genetic mechanisms underlying the resistance of P. tremula is unreliable. The
chances of inferring genetic markers associated with European aspen resistance to P. tremulae
using RAPD are negligible.
The subsequent step of this study could be the identification of genome regions, represented by
B13-1100 and A05-850 fragments. The identification of these regions could lead to marker
assisted breeding, or QTL involved in identification of the resistance mechanisms.
We can conclude, that the infection of European aspen plus trees with P. tremulae doesn’t
depend on population, provenance region or individual tree heterozygosity. RAPD loci
correlated to the infection of European aspen by P. tremulae should be investigated further to
confirm or reject their value in assessing the resistance of aspen to this fungal pathogen.
3.6. Hybridization between European and hybrid aspen
The aim of this study was to assess the possible hybridization between European and hybrid
aspen by leaf morphology of P. tremula progenies. Tree flowering phenology was assessed to
reveal if European and hybrid aspen phenologies overlap thus allowing the taxa to hybridize.
The assessment of European and hybrid aspen flowering phenology revealed that hybrid aspens
are characterized by earlier phenology compared to European aspen trees. The percentage of late
flowering category trees in European aspen group was 48% and in hybrid aspen group 9%; the
percentages in medium flowering category was 35% vs 25% in European and hybrid aspens
respectively, while early flowering group was comprised of 17% of European and 66% of
hybrid aspen trees (Figure 3.21). European and hybrid aspen trees attributed to the same
flowering category were flowering at the same time.
Fig. 3.21. The proportion of European and hybrid aspen trees in each of early, medium and late flowering phenology categories
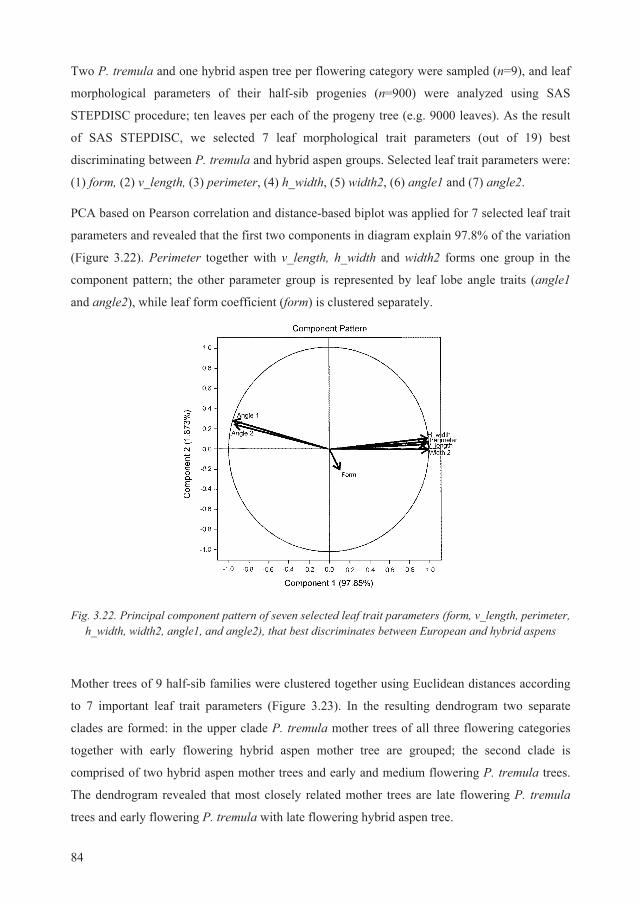
84
Two P. tremula and one hybrid aspen tree per flowering category were sampled (n=9), and leaf
morphological parameters of their half-sib progenies (n=900) were analyzed using SAS
STEPDISC procedure; ten leaves per each of the progeny tree (e.g. 9000 leaves). As the result
of SAS STEPDISC, we selected 7 leaf morphological trait parameters (out of 19) best
discriminating between P. tremula and hybrid aspen groups. Selected leaf trait parameters were:
(1) form, (2) v_length, (3) perimeter, (4) h_width, (5) width2, (6) angle1 and (7) angle2.
PCA based on Pearson correlation and distance-based biplot was applied for 7 selected leaf trait
parameters and revealed that the first two components in diagram explain 97.8% of the variation
(Figure 3.22). Perimeter together with v_length, h_width and width2 forms one group in the
component pattern; the other parameter group is represented by leaf lobe angle traits (angle1
and angle2), while leaf form coefficient (form) is clustered separately.
Fig. 3.22. Principal component pattern of seven selected leaf trait parameters (form, v_length, perimeter, h_width, width2, angle1, and angle2), that best discriminates between European and hybrid aspens
Mother trees of 9 half-sib families were clustered together using Euclidean distances according
to 7 important leaf trait parameters (Figure 3.23). In the resulting dendrogram two separate
clades are formed: in the upper clade P. tremula mother trees of all three flowering categories
together with early flowering hybrid aspen mother tree are grouped; the second clade is
comprised of two hybrid aspen mother trees and early and medium flowering P. tremula trees.
The dendrogram revealed that most closely related mother trees are late flowering P. tremula
trees and early flowering P. tremula with late flowering hybrid aspen tree.
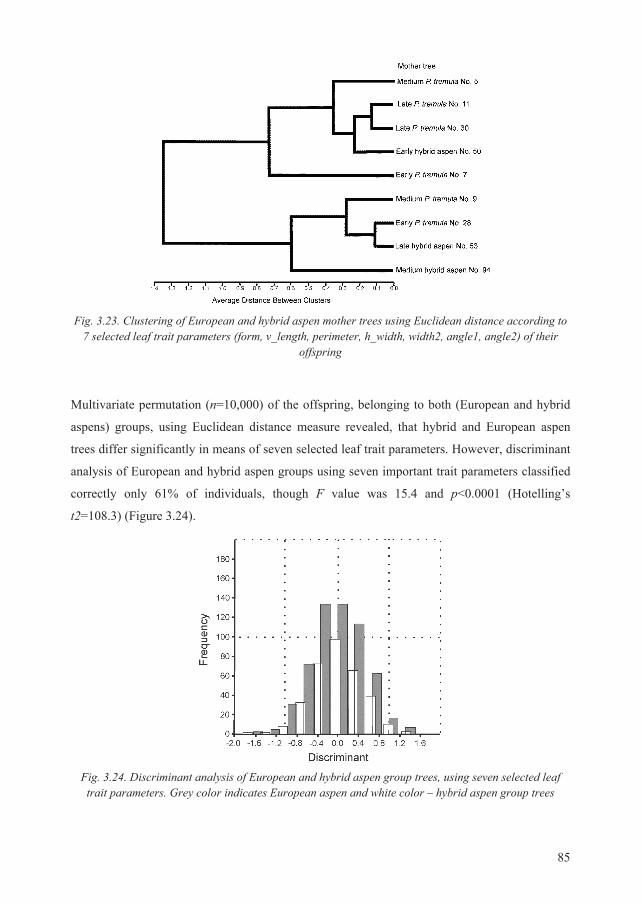
85
Fig. 3.23. Clustering of European and hybrid aspen mother trees using Euclidean distance according to
7 selected leaf trait parameters (form, v_length, perimeter, h_width, width2, angle1, angle2) of their offspring
Multivariate permutation (n=10,000) of the offspring, belonging to both (European and hybrid
aspens) groups, using Euclidean distance measure revealed, that hybrid and European aspen
trees differ significantly in means of seven selected leaf trait parameters. However, discriminant
analysis of European and hybrid aspen groups using seven important trait parameters classified
correctly only 61% of individuals, though F value was 15.4 and p<0.0001 (Hotelling’s
t2=108.3) (Figure 3.24).
Fig. 3.24. Discriminant analysis of European and hybrid aspen group trees, using seven selected leaf trait parameters. Grey color indicates European aspen and white color – hybrid aspen group trees
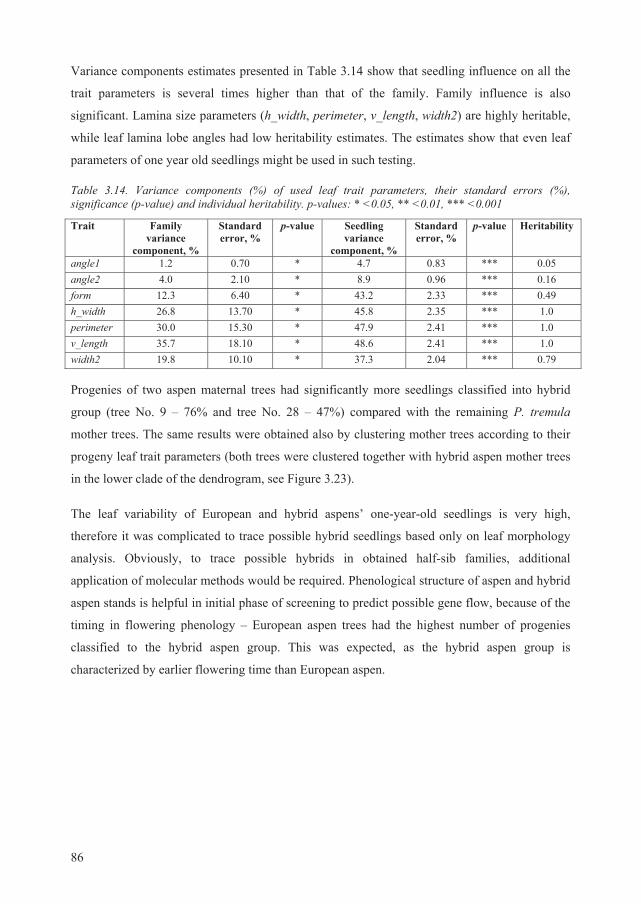
86
Variance components estimates presented in Table 3.14 show that seedling influence on all the
trait parameters is several times higher than that of the family. Family influence is also
significant. Lamina size parameters (h_width, perimeter, v_length, width2) are highly heritable,
while leaf lamina lobe angles had low heritability estimates. The estimates show that even leaf
parameters of one year old seedlings might be used in such testing.
Table 3.14. Variance components (%) of used leaf trait parameters, their standard errors (%), significance (p-value) and individual heritability. p-values: * <0.05, ** <0.01, *** <0.001
Trait Family variance
component, %
Standard error, %
p-value Seedling variance
component, %
Standard error, %
p-value Heritability
angle1 1.2 0.70 * 4.7 0.83 *** 0.05 angle2 4.0 2.10 * 8.9 0.96 *** 0.16 form 12.3 6.40 * 43.2 2.33 *** 0.49 h_width 26.8 13.70 * 45.8 2.35 *** 1.0 perimeter 30.0 15.30 * 47.9 2.41 *** 1.0 v_length 35.7 18.10 * 48.6 2.41 *** 1.0 width2 19.8 10.10 * 37.3 2.04 *** 0.79
Progenies of two aspen maternal trees had significantly more seedlings classified into hybrid
group (tree No. 9 – 76% and tree No. 28 – 47%) compared with the remaining P. tremula
mother trees. The same results were obtained also by clustering mother trees according to their
progeny leaf trait parameters (both trees were clustered together with hybrid aspen mother trees
in the lower clade of the dendrogram, see Figure 3.23).
The leaf variability of European and hybrid aspens’ one-year-old seedlings is very high,
therefore it was complicated to trace possible hybrid seedlings based only on leaf morphology
analysis. Obviously, to trace possible hybrids in obtained half-sib families, additional
application of molecular methods would be required. Phenological structure of aspen and hybrid
aspen stands is helpful in initial phase of screening to predict possible gene flow, because of the
timing in flowering phenology – European aspen trees had the highest number of progenies
classified to the hybrid aspen group. This was expected, as the hybrid aspen group is
characterized by earlier flowering time than European aspen.
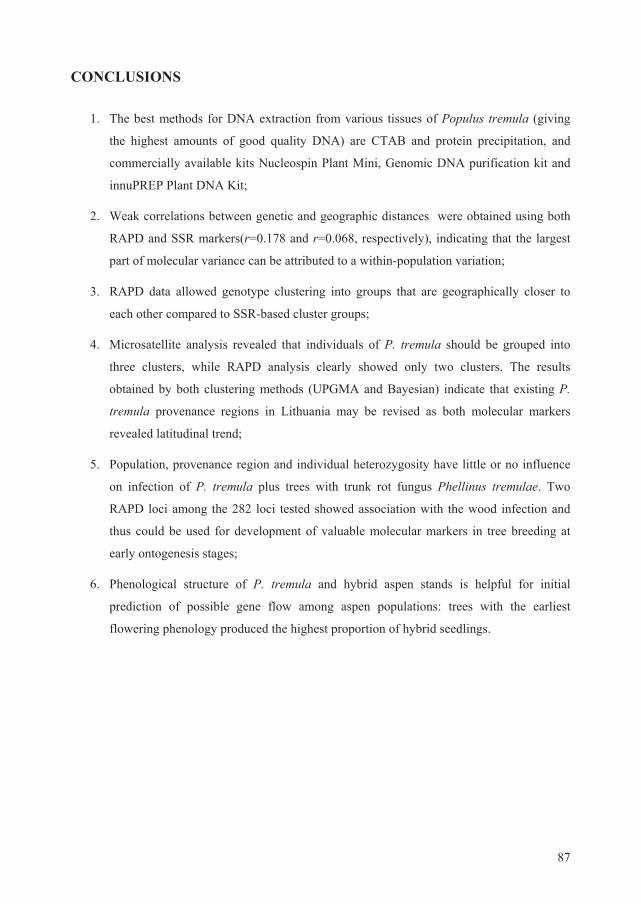
87
CONCLUSIONS
1. The best methods for DNA extraction from various tissues of Populus tremula (giving
the highest amounts of good quality DNA) are CTAB and protein precipitation, and
commercially available kits Nucleospin Plant Mini, Genomic DNA purification kit and
innuPREP Plant DNA Kit;
2. Weak correlations between genetic and geographic distances were obtained using both
RAPD and SSR markers(r=0.178 and r=0.068, respectively), indicating that the largest
part of molecular variance can be attributed to a within-population variation;
3. RAPD data allowed genotype clustering into groups that are geographically closer to
each other compared to SSR-based cluster groups;
4. Microsatellite analysis revealed that individuals of P. tremula should be grouped into
three clusters, while RAPD analysis clearly showed only two clusters. The results
obtained by both clustering methods (UPGMA and Bayesian) indicate that existing P.
tremula provenance regions in Lithuania may be revised as both molecular markers
revealed latitudinal trend;
5. Population, provenance region and individual heterozygosity have little or no influence
on infection of P. tremula plus trees with trunk rot fungus Phellinus tremulae. Two
RAPD loci among the 282 loci tested showed association with the wood infection and
thus could be used for development of valuable molecular markers in tree breeding at
early ontogenesis stages;
6. Phenological structure of P. tremula and hybrid aspen stands is helpful for initial
prediction of possible gene flow among aspen populations: trees with the earliest
flowering phenology produced the highest proportion of hybrid seedlings.
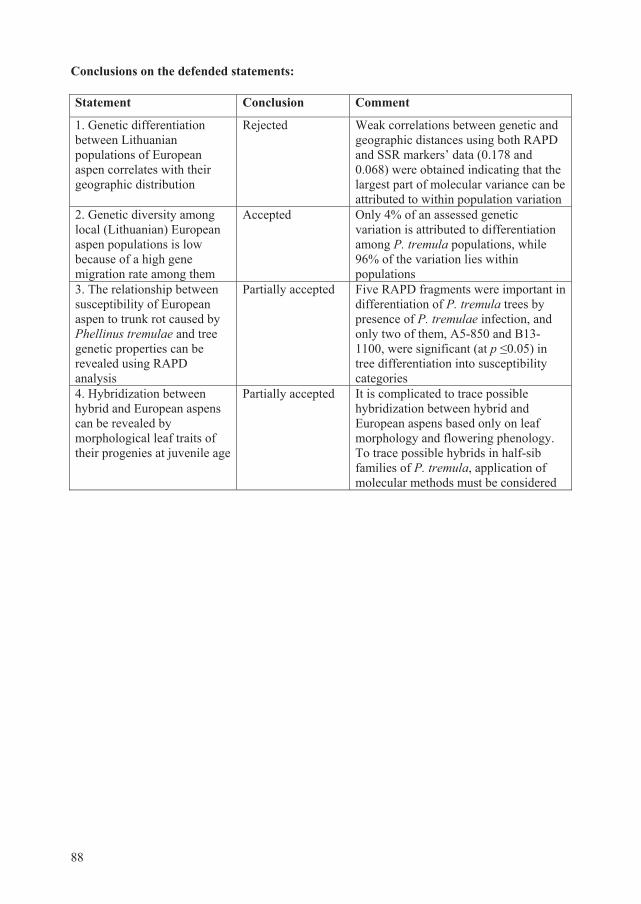
88
Conclusions on the defended statements:
Statement Conclusion Comment
1. Genetic differentiation between Lithuanian populations of European aspen correlates with their geographic distribution
Rejected Weak correlations between genetic and geographic distances using both RAPD and SSR markers’ data (0.178 and 0.068) were obtained indicating that the largest part of molecular variance can be attributed to within population variation
2. Genetic diversity among local (Lithuanian) European aspen populations is low because of a high gene migration rate among them
Accepted Only 4% of an assessed genetic variation is attributed to differentiation among P. tremula populations, while 96% of the variation lies within populations
3. The relationship between susceptibility of European aspen to trunk rot caused by Phellinus tremulae and tree genetic properties can be revealed using RAPD analysis
Partially accepted Five RAPD fragments were important in differentiation of P. tremula trees by presence of P. tremulae infection, and only two of them, A5-850 and B13-1100, were significant (at p 0.05) in tree differentiation into susceptibility categories
4. Hybridization between hybrid and European aspens can be revealed by morphological leaf traits of their progenies at juvenile age
Partially accepted It is complicated to trace possible hybridization between hybrid and European aspens based only on leaf morphology and flowering phenology. To trace possible hybrids in half-sib families of P. tremula, application of molecular methods must be considered
89
REFFERENCES
1. Aagaard J.E., Krutovskii K.V., and Strauss S.H. 1998. RAPD markers of mitochondrial
origin exhibit lower population diversity and higher differentiation than RAPDs of nuclear
origin in Douglas fir. Molecular Ecology 7: 801–812.
2. Abbott R., Albach D., Ansell S., Arntzen J.W., Baird S.J.E., Bierne N. et al. 2013.
Hybridization and speciation. Journal of Evolutionary Biology 26: 229–246.
3. Allen E., Morrison D., and Wallis G. 1996. Common Tree Diseases of British Columbia.
Canadian Forest Service, Pacific Forestry Centre, Victoria, British Columbia, Canada.
4. Lietuvos mišk statistika. 1937. Lietuvos Mišk Departamentas, Kaunas. (In Lithuanian).
5. Lithuanian Statistical Yearbook of Forestry. 2014. State Forest Service, Kaunas.
6. Areshchenkova T., and Ganal M.W. 1999. Long tomato microsatellites are predominantly
associated with centromeric regions. Genome 42: 536–544.
7. Arnold M. 1997. Natural hybridization and evolution. Oxford University Press, New
York, NY.
8. Arnold M., and Martin M. 2010. Hybrid fitness across time and habitats. Trends in
Ecology and Evolution 25: 530–536.
9. Asif M.J., and Cannon C.H. 2005. DNA extraction from processed wood: a case study for
the identification of an endangered timber species (Gonostylus bancanus). Plant
Molecular Biology Reporter 23: 185–192.
10. Bakys R., Vasaitis R., Barklund P., Thomsen I.M., and Stenlid J. 2009. Occurrence and
pathogenicity of fungi in necrotic and non-symptomatic shoots of declining common ash
(Fraxinus excelsior) in Sweden. European Journal of Forest Research 128: 51–60.
11. Barreneche T., Bodenes C., Lexer C., Trontin J.F., Fluch S., Streiff R., Plomion C.,
Roussel G., Steinkellner H., Burg K., Favre J.M., Glössl J., and Kremer A. 1998. A
genetic linkage map of Quercus robus L. (pedunculate oak) based on RAPD, SCAR,
microsatellite, minisatellite, isozyme and 5S rDNA markers. Theoretical and Applied
Genetics 97: 1090–1103.
12. Barret C., Lefort F., and Douglas G.C. 1997. Genetic characterization of oak seedlings,
epicormic, crown and micropropagated shoots from mature trees by RAPD and
microsatellite PCR. Scientia Horticulturae 70: 319–330.
13. Beckman J.S., and Weber J.L. 1992. Survey of human and rat microsatellites. Genomics
12: 627–631.
14. Bellamy A.R., and Ralph R.K. 1968. In: Grossman L. and Moldave K. (editors). Methods
in enzymology, Vol. 12B: Nucleic acids. Academic press, New York, NY.
90
15. Bernhardsson C., and Ingvarsson P.K. 2012. Geographical structure and adaptive
population differentiation in herbivore defense genes in European aspen (Populus tremula
L., Salicaceae). Molecular Ecology 21(9): 2197–2207.
16. Bousquet J., Simpson L., and Lalonde M. 1990. DNA amplification from vegetative and
sexual tissues of trees using polymerase chain reaction. Canadian Journal of Forest
Research 20: 254–257.
17. Bowtell D.L. 1987. Rapid isolation of eukaryotic DNA. Anaytical Biochemistry 162: 463–
468.
18. Brandes A., Thompson H., Dean C., and Heslop-Harrison J.S. 1997. Multiple repetitive
DNA sequences in the paracentromeric regions of Arabidosis thaliana L. Chromosome
Research 5: 238–246.
19. Brock G.J., Anderson N.H., and Monckton D.G. 1999. Cis-acting modifiers of expanded
CAG/CTG triplet repeat expandability: association with flanking GC content and
proximity to CpG islands. Human Molecular Genetics 8: 1061–1067.
20. Brown A.H.D., and Weir B.S. 1983. Measuring genetic variability in plant populations.
219–239. In: Tanksley S.D., Orton T.J. (editors). Isozymes in plant genetics and breeding,
Part A. Elsevier Science Publishing.
21. Bucci G., and Menozzi P. 1993. Segregation analysis of random amplified polymorphic
DNA (RAPD) markers in Picea abies Karst. Molecular Ecology 2: 227–232.
22. Bueno M.A., Gomez A., and Manzanera J.A. 2003. Propagation and DNA Markers
characterization of Populus tremula L. and Populus alba L. 37–74. In: Jain S.M. and Ishii
K. (editors). Micropropagation of woody trees and fruits. Kluwer Academic Publishers.
23. Burke J.M., and Arnold M. 2001. Genetics and the fitness of hybrids. Annual Review of
Genetics 35: 31–52.
24. Butlin R.K., and Ritchie M.G. 2013. Pulling together or pulling apart: hybridization in
theory and practice. Journal of Evoliutionary Biology 26: 294–298.
25. Byrne M., Marquez-Garcia M.I., Uren T., Smith D.S., and Moran G.F. 1996. Conservation
and genetic diversity of microsatellite loci in the genus Eucalyptus. Australian Journal of
Botany 44: 331–341.
26. Cambareri E.B., Aisner R., and Carbon J. 1998. Structure of the chromosome VII
centromere region in Neurospora crassa: degenerate transposons and simple repeats.
Molecular and Cellular Biology 18: 5465–5477.
27. Carlson J.E., Tulsieram L.K., Glaubita J.C., Luk V.W.K., Kauffelddt C., and Rutledge R.
1991. Segregation of random amplified DNA markers in F1 progeny of conifers.
Theoretical and Applied Genetics 83: 194–200.
91
28. Catasti P., Chen X., Mariappan S.V., Bradbury E.M., and Gupta G. 1999. DNA repeats in
the human genome. Genetica 106: 15–36.
29. Centola M., and Carbon J. 1994. Cloning and characterization of centromeric DNA from
Neurospora crassa. Molecular and Cellular Biology 14: 1510–1519.
30. Chakravarty P., and Hiratsuka Y. 2007. Antagonism of two decay fungi, Peniophora
polygonia and Phellinus tremulae associated with Populus tremuloides. European Journal
of Forest Pathology 22(6–7): 354–361.
31. Chalmers K. J., Newton A.C., Waugh R., Wilson J., and Powell W. 1994. Evaluation of
the extent of genetic variation in mahoganies (Meliaceae) using RAPD markers.
Theoretical and Applied Genetics 89: 504–508.
32. Chase M., Kesseli R., and Bawa K. 1996. Microsatellite markers for population and
conservation genetics of tropical trees. American Journal of Botany 83: 51–57.
33. Chen Y., and Roxby R. 1997. Identification of a functional CT-element in the
Phytophthora infestans piypt1 gene promoter. Gene 198: 159–164.
34. Chomczynski P., and Sacchi N. 1987. Single-step method of RNA isolation by acid
guanidinium thiocyanate-phenol-chloroform extraction. Analytical Biochemistry. 162:
156–159.
35. Chomczynski P. 1993. A reagent for the single-step simultaneous isolation of RNA, DNA
and proteins from cell and tissue samples. Biotechniques 15: 532–537.
36. Chomczynski P., and Mackey K. 1995. Short technical reports. Modification of the TRI
reagent procedure for isolation of RNA from polysaccharide- and proteoglycan-rich
sources. Biotechniques 19(6): 942–945.
37. Cox R.A. 1968. In: Grossman L. and Moldave K. (editors). Methods in enzymology, Vol.
12B: Nucleic acids. Academic press, New York, NY.
38. Cuadrado A., and Schwarzacher T. 1998. The chromosomal organization of simple
sequence repeats in wheat and rye genomes. Chromosoma 107: 587–594.
39. Cullingham C.I., James P.M.A., Cooke J.E.K., and Coltman D.W. 2012. Characterizing
the physical and genetic structure of the lodgepole pine x jack pine hybrid zone: mosaic
structure and differential introgression. Evolutionary Applications 5: 879–891.
40. Dawson I.K., Waugh R., Simons A.J., and Powel W. 1997. Simple sequence repeats
provide a direct estimate of pollen-mediated gene dispersal in the tropical tree Gliricidia
sepium. Molecular Ecology 6: 179–183.
41. De Carvalho D., Ingvarsson P.K., Joseph J., Suter L., Sedivy C., Macaya Sanz
D.A.V.I.D., Cottrell J., Heinze B., Schanzer I., and Lexer C. 2010. Admixture facilitates
92
adaptation from standing variation in the European aspen (Populus tremula L.), a
widespread forest tree. Molecular Ecology 19(8): 1638–1650.
42. Deguilloux M.F., Pemonge M.H., Bertel L., Kremer A., and Petit R.J. 2003. Checking the
geographical origin of oak wood: molecular and statistical tools. Molecular Ecology 12:
1629–1636.
43. Dellaporta S.L., Wood J., and Hicks J.B. 1983. A plant DNA minipreparation version II.
Plant Molecular Biology Reporter 1: 19–21.
44. Devey M., Jermstad K.D., Tauer C.G., and Neale D.B. 1991. Inheritance of RFLP loci in a
loblolly pine three-generation pedigree. Theoretical and Applied Genetics 83: 238–242.
45. Devey M., Bell J.C., Smith D.N., Neale D.B., and Moran G.F. 1996. A genetic linkage
map for Pinus radiata based on RFLP, RAPD, and microsatellite markers. Theoretical
and Applied Genetics 92: 673–679.
46. Dickmann D., Isebrands J., Eckenwalder J., and Richardson. 2001. Poplar culture in North
America. NRC Research Press Ottawa, ON, Canada.
47. Dickmann D.I., and Kuzovkina J. 2008. Poplars and willows in the world, with emphasis
on silviculturally important species. FAO, Forestry Department, Working Paper IPC/9-2,
Rome, Italy.
48. Dobzhansky T. 1970. Genetics of the evolutionary process. Columbia University Press,
New York, NY.
49. Dokholyan N.V., Buldyrev S.V., Havlin S., and Stanley H.E. 2000. Distributions of
dimeric tandem repeats in noncoding and coding DNA sequences. Journal of Theoretical
Biology 202: 273–282.
50. Dow B.D., Ashley M.V., and Howe H.F. 1995. Characterization of highly varable
(GA/CT)n microsatellites in the bur oak, Quercus macrocarpa. Theoretical and Applied
Genetics 91: 137–141.
51. Doyle J.J., and Dickson E.E. 1987. Preservation of plant samples for DNA restriction
endonuclease analysis. Taxon 36: 715–722.
52. Doyle J.J., and Doyle J.H. 1987. Isolation of plant DNA from fresh tissue. Focus 12: 13–
15.
53. Dumolin S., Demesure B., and Petit R.J. 1995. Inheritance of chloroplast and
mitochondrial genomes in pedunculate oak investigated with an efficient PCR method.
Theoretical and Applied Genetics 91(8): 1253–1256.
54. Echt C.S., Maymarquardt P., Hseih M., and Zahorchak R. 1996. Characterization of
microsatellite markers in eastern white pine. Genome 39: 1102–1108.
93
55. Eckenwalder J. 1984. Natural intersectional hybridization between North American
species of Populus (Salicaceae) in sections Aigeiros and Tacamahaca. II. Taxonomy.
Canadian Journal of Botany 62: 325–335.
56. Eckenwalder J.E. 1996. Systematics and evolution of Populus. In: Stettler R.F., Bradshaw
H.D., Heilman Jr. P.E. and Hinkley T.M. (editors). Biology of Populus and its
implications for management and conservation. NRC Research Press, National Research
Council Canada, Ottawa, ON.
57. Edwards K., Johnstone C., and Thompson C. 1991. A simple and rapid method for the
preparation of plant genomic DNA for PCR analysis. Nucleic Acids Research 19: 1349.
58. Edwards Y.J., Elgar G., Clark M.S., and Bishop M.J. 1998. The identification and
characterization of microsatellites in the compact genome of the Japanese pufferfish Fugu
rubripes: perspectives in functional and comparative genomic analyses. Journal of
Molecular Biology 278: 843–854.
59. Eichler E.E. 1999. Repetitive conundrums of centromere structure and function. Human
Molecular Genetics 8: 151–155.
60. Ellegren H. 2000. Microsatellite mutations in the germline: implications for evolutionary
inference. Trends in Genetics 16: 551–558.
61. Epplen C., Melmer G., Siedlaczck I., Schwaiger F.W., Mäueler W., and Epplen J.T. 1993.
On the essence of “meaningless” simple repetitive DNA in eukaryote genomes. 39–45. In:
Pena S.D.J., Chakraborty R., Epplen J.T., Jeffreys A.J. (editors). DNA Fingerprinting:
State of the Science Birkh. user Verlag, Basel Switzerland.
62. Evanno G., Regnaut S., and Goudet J. 2005. Detecting the number of clusters of
individuals using the software STRUCTURE: a simulation study. Molecular Ecology,
14(8): 2611–2620.
63. Excoffier L., Smouse P.E., and Quattro J.M. 1992. Analysis of molecular variance inferred
from metric distances among DNA haplotypes: Application to human mitocondrial DNA
restriction sites. Genetics, 131: 479–491.
64. Fabregat I., Koch K.S., Aoki T., Atkinson A.E., Dang H., Amosova O., Fresco J.R.,
Schildkraut C.L., and Leffert H.L. 2001. Functional pleiotropy of an intramolecular
triplex-forming fragment from the 3'-UTR of the rat Pigr gene. Physiological Genomics 5:
53–65.
65. Fang G., Hammar S., and Grumet R. 1992. A quick and inexpensive method for removing
polysaccharides from plant genomic DNA. Biotechniques 13: 52–56.
66. Farrar J.L. 1995. Trees in Canada. Fitzhenry and Whiteside/Canadian Forest Service,
Markham and Ottawa.
94
67. Field D., and Wills C. 1996. Long, polymorphic microsatellite in simple organisms.
Proceedings of Royal Society of London B Biological Sciences 263: 209–215.
68. Field D.L., Ayre D.J., Whelan R.J., and Young A.G. 2011. The importance of pre-mating
barriers and the local demographic context for contemporary mating patterns in hybrid
zones of Eucalyptus aggregata and Eucalyptus rubida. Molecular Ecology 20: 2367–
2379.
69. Fladung M., and Buschbom J. 2009. Identification of single nucleotide polymorphisms in
different Populus species. Trees 23(6): 1199–1212.
70. Floate K. 2004. Extent and patterns of hybridization among the three species of Populus
that constitute the riparian forest of southern Alberta, Canada. Canadian Journal of
Botany 82: 253–264.
71. Fossati T., Patrignani G., Zapelli I., Sabati M., Sala F., and Castiglione S. 2004.
Development of molecular markers to assess the level of introgression of Populus tremula
into P. alba natural populations. Plant breeding 123: 382–385.
72. Fossati T., Zapelli I., Bisoffi S., Micheletti A., Vieto L., Sala F., and Castiglione S. 2005.
Genetic relationships and clonal identity in a collection of commercially relevant poplar
cultivars assessed by AFLP and SSR. Tree Genetics and Genomes 1: 11–19.
73. Fracheboud Y., Luquez V., Björken L., Sjödin A., Tuominen H., and Jansson S. 2009. The
control of autumn senescence in European aspen. Plant Physiology 149: 1982–1991.
74. Fussi B., Lexer C., and Heinze B. 2010. Phylogeography of Populus alba (L.) and
Populus tremula (L.) in Central Europe: secondary contact and hybridization during
recolonization from disconnected refugia. Tree Genetics and Genomes 6(3): 439–450.
75. Fystro I. 1962. Skogbrukets frøforsyning. 299–318. In: Børset O. (editor). Skogbruksboka,
Vol. 2, Skogskjøtsel. Skogforlaget , Oslo, Norway. (In Norwegian).
76. Gallo L.A., and Geburek Th. 1991. Genetics of isozyme variant in Populus tremula, P.
tremuloides and their hybrids. Euphytica 53: 225–233.
77. Gebhardt F., Zanker K.S., and Brandt B. 1999. Modulation of epidermal growth factor
receptor gene transcription by a polymorphic dinucleotide repeat in intron 1. Journal of
Biological Chemistry 274: 13176–13180.
78. Gebhardt F., Burger H., and Brandt B. 2000. Modulation of EGFR gene transcription by a
polymorphic repetitive sequence – a link between genetics and epigenetics. International
Journal of Biological Markers 15: 105–110.
79. Gjerde I., Saetersdal M., and Nilsen T. 2005. Abundance of two threatened woodpecker
species in relation to the proportion of spruce plantations in native pine forests of western
Norway. Biodiversity Conservation 14: 377–393.
95
80. Gomez A., Manzanera J.A., Aguiriano E., Grau J.M., and Bueno M.A. 2003. SSR markers
for monitoring an in vitro core collection of Populus tremula. Silvae genetica 52 (5-6):
224–228.
81. Goodwin D., and Lee S. 1993. Microwave miniprep of total genomic DNA from fungi,
plants, protists and animals for PCR. Biotechniques 15: 441–444.
82. Grattapaglia D., and Sederoff R. 1994. Genetic linkage maps of Eucalyptus grandis and
Eucalyptus urophylla using a pseudo-testcross mapping strategy and RAPD markers.
Genetics 137: 1121–1137.
83. Hall D., Luquez V., Garcia V.M., Onge K.R., Jansson S., and Ingvarsson P.K. 2007
Adaptive population differentiation in phenology across a latitudinal gradient in European
aspen (Populus tremula, L.): a comparison of neutral markers, candidate genes and
phenotypic traits. Evolution 61(12): 2849–2860.
84. Hammer Ø., Harper D.A.T., and Ryan P.D. 2001. PAST: Paleontological Statistics
Software Package for Education and Data Analysis. Palaeontologia Electronica 4(1): 1–9.
85. Hamzeh M., Sawchyn C., Perinet P., and Dayanandan S. 2007. Asymmetrical natural
hybridization between Populus deltoides and P. balsamifera (Salicaceae). Canadian
Journal of Botany 85: 1227–1232.
86. Hancock J.M. 1999. Microsatellites and other simple sequences: genomic context and
mutational mechanisms. 1–9. In: Goldstein D.B., Schlötterer C. (editors). Microsatellites:
Evolution and Applications. Oxford University Press, Oxford.
87. Harding R.M., Boyce A.J., and Clegg J.B. 1992. The evolution of tandemly repetitive
DNA: recombination rules. Genetics 132: 847–859.
88. Hartl D.L., and Clark A.G. 1997. Principles of Population Genetics 3rd Edition,
Sunderland, Massachusetts: Sinauer Associates, Inc.
89. Henaut A., Lisacek F., Nitschke P., Moszer I., and Danchin A. 1998. Global analysis of
genomic texts: the distribution of AGCT tetranucleotides in the Escherichia coli and
Bacillus subtilis genomes predicts translational frameshifting and ribosomal hopping in
several genes. Electrophoresis 19: 515–527.
90. Holmer L., Nitare L., and Stenlid J. 1994. Population structures and decay pattern in
Phellinus tremulae as determined by somatic incompatibility. Canadian Journal of Botany
72: 1391–1396.
91. Houle G. 1999. Mast seeding in Abies balsamea, Acer saccharum and Betula
alleghaniensis in an old growth, cold temperate forest of north-eastern North America.
Journal of Ecology 87: 413–422.
96
92. Ilstedt B., and Gullberg U. 1993. Genetic variation in a 26-year-old hybrid aspen trial in
southern Sweden. Scandinavian Journal of Forest Research 8: 185–192.
93. Ingvarsson P.K. 2005. Nucleotide polymorphism and linkage disequilibrium within and
among natural populations of European aspen (Populus tremula L., Salicaceae). Genetics
169(2): 945–53.
94. Ingvarsson P.K. 2008a. Multilocus patterns of nucleotide polymorphism and the
demographic history of Populus tremula. Genetics 180: 329–340.
95. Ingvarsson P.K. 2008b. Nucleotide polymorphism and phenotypic associations within and
around phytochrome B2 locus in European aspen (Populus tremula, Salicaceae). Genetics
178: 2217–2226.
96. Isabel N., Beaulieu J., and Bousquet J. 1995. Complete congruence between gene diversity
estimates derived from genotypic data at enzyme and RAPD loci in black spruce.
Proceedings of the National Academy of Sciences, USA 92(14): 6369–6373.
97. Isabel N., Lamothe M., and Thompson S. L. 2013. A second-generation diagnostic single
nucleotide polymorphism (SNP) – based assay, optimized to distinguish among eight
poplar (Populus L.) species and their early hybrids. Tree Genetics and Genomes 9: 621–
626.
98. Isagi Y., and Suhandono S. 1997. PCR primers amplifying microsatellite loci of Quercus
myrsinifolia Blume and their conservation between oaks. Molecular Ecology 6: 897–899.
99. Ivanov I., Alexandrova R., Dragulev B., Sarafova A., and AbouHaidar A.G. 1992. Effect
of tandemly repeated AGG triplets on the translation of CAT-mRNA in E. coli. FEBS
Letters 307: 173–176.
100. Jameikis M. 1933: Paskirt kirsti 1929-1934 m. s mat pasiskirstymas veisl mis ir
r šimis. M s girios 6: 478–480. (In Lithuanian).
101. Jasalavich C.A., Ostrofsky A., and Jellison J. 2000. Detection and identification of decay
fungi in spruce wood by restriction fragment length polymorphism analysis at amplified
genes encoding rRNA. Applied and Environmental Microbiology 66 (11): 4725–4734.
102. Jeanpierre M. 1987. A rapid method for the purification of DNA from blood. Nucleic
Acids Research 15: 9611.
103. Jobes D.V., Hurley D.L., and Thien L.B. 1995. Plant DNA isolation: method to efficiently
remove polyphenolics, polysaccharides and RNA. Taxon 44: 379–386.
104. Johnsson H. 1942. Generativ och vegetative förökning av Populus tremula. Svensk
Botanisk Tidskrift 36: 177–199. (In Swedish).
97
105. Joseph J.A., and Lexer C. 2008. A set of novel DNA polymorphisms within candidate
genes potentially involved in ecological divergence between Populus alba and P. tremula,
two hybridizing European forest trees. Molecular Ecology Resources 8: 188–192.
106. Kairi kštis L. 1962. Drebulynai. 231–254. In: Lietuvos TSR miškai. Vilnius. (In
Lithuanian).
107. Kairi kštis L. 1963. Medži augimas vegetacijos metu. Lietuvos mišk kio instituto
mokslini tyrim darbai, VII t. Kaunas: 3–38. (In Lithuanian).
108. Kalela A. 1945. Metsät ja metsien hoito -metsänhoidon alkeita, WSOY. (In Finnish).
109. Katterman F.R.H., and Shattuck V.I. 1983. An effective method of DNA isolation from
the mature leaves of Gossypium species that contain large amounts of phenolic terpenoids
and tannins. Preparative Biochemistry and Biotechnology 13: 347–359.
110. Kazan K., Manners J.M., and Cameron D.F. 1993. Inheritance of random amplified
polymorphic DNA markers in an interspecific cross in the genus Stylosanthes. Genome
36: 50–56.
111. Keim P., Paige N., Whitham G., and Lark K.G. 1989. Genetic analysis of an interspecific
hybrid swarm of Populus: occurrence of unidirectional introgression. Genetics 123: 557–
565.
112. Kim C.S., Lee C.H., Shin J.S., Chung Y.S., and Hyung N.I. 1997. A simple and rapid
method for isolation of high quality genomic DNA from fruit trees and conifers using
PVP. Nucleic Acids Research 25: 1085–1086.
113. Kimura M., and Crow J.F. 1964. The number of alleles that can be maintained in a finite
population. Genetics 49: 725–738.
114. Kleinschmit J. 2000. Tree breeding and plantations in Europe: A regional situation report.
IUFRO WP 2.02.00 and 2.08.00 meeting in Kuala Lumpur, Malaysia.
115. Kloosterman A.D., Budowle B., and Daselaar P. 1993. PCR-amplification and detection of
the human D1S8 VNTR locus. International Journal of Legal Medicine 105: 257–264.
116. König A. 2005. Provenance research: evaluating the spatial pattern of genetic variation.
275–333. In: Geburek T. and Turok J. (editors). Conservation and Management of Forest
Genetic Resources in Europe. Arbora Publishers, Zvolen, Germany.
117. Kouki J., Arnold K., and Martikainen P. 2004. Long-term persistence of aspen – a host for
many threatened species – is endangered in old-growth conservation areas in Finland.
Journal for Nature Conservation 12: 41–52.
118. Latva-Karjanmaa T., Suvanto L., Leinonen K., and Rita H. 2003. Emergence and survival
of Populus tremula seedlings under varying moisture conditions. Canadian Journal of
Forest Research 33: 2081–2088.
98
119. LeBoldus J.M., Isabel N., Floate K.D., Blenis P., and Thomas B.R. 2013. Testing the
‘hybrid susceptibility’ and ‘phenological sink’ hypotheses using the P. balsamifera – P.
deltoides hybrid zone and Septoria leaf spot (Septoria musiva). PLoS ONE. 18(12):
e84437.
120. Leibenguth F., and Shoghi F. 1998. Analysis or random amplified polymorphic DNA
markers in three conifer species. Silvae Genetica 47(2-3): 120–126.
121. Lepais O., and Gerber S. 2011. Reproductive patterns shape introgression dynamics and
species succession within the European white oak species complex. Evolution 65: 156–
170.
122. Lewontin R.C. 1991. Twenty-five years ago in GENETICS. Electrophoresis in the
development of evolutionary genetics: milestone or millstone? Genetics 128: 657–662.
123. Lexer C., Fay M.F., Joseph J.A., Nica M.S., and Heinze B. 2005. Barrier to gene flow
between two ecologically divergent Populus species, P. alba (white poplar) and P.
tremula (European aspen): the role of ecology and life history in gene introgression.
Molecular Ecology 14: 1045–1057.
124. Lexer C., Buerkle C.A., Joseph J.A., Heinze B., and Fay M.F. 2007. Admixture in
European Populus hybrid zones makes feasible the mapping of loci that contribute to
reproductive isolation and trait differences. Heredity 98(2): 74–84.
125. Lexer C., Joseph J.A., van Loo M., Barbara T., Heinze B., Bartha D., Castiglione S., Fay
M.F., and Buerkle C.A. 2010. Genomic admixture analysis in European Populus spp.
reveals unexpected patterns of reproductive isolation and matting. Genetics 186(4): 699–
712.
126. Li Y.C., Fahima T., Peng J.H., Röder M.S., Kirzhner V.M., Beiles A., Korol A.B., and
Nevo E. 2000a. Edaphic microsatellite DNA divergence in wild emmer wheat, Triticum
dicoccoides, at a microsite: Tabigha, Israel. Theoretical and Applied Genetics 101: 1029–
1038.
127. Li Y.C., Röder M.S., Fahima T., Kirzhner V.M., Beiles A., Korol A.B., and Nevo E.
2000b. Natural selection causing microsatellite divergence in wild emmer wheat at the
ecologically variable microsite at Ammiad, Israel. Theoretical and Applied Genetics 100:
985–999.
128. Li Y.C., Fahima T., Korol A.B., Peng J., Röder M.S., Kirzhner V., Beiles A., and Nevo E.
2000c. Microsatellite diversity correlated with ecological-edaphic and genetic factors in
three microsites of wild emmer wheat in North Israel. Molecular Biology and Evolution
17: 851–862.
99
129. Li Y.C., Korol A.B., Fahima T., Beiles A., and Nevo E. 2002a. Microsatellites: genomic
distribution, putative functions and mutational mechanisms: a review. Molecular ecology
11(12): 2453–2465.
130. Li Y.C., Röder M.S., Fahima T., Kirzhner V.M., Beiles A., Korol A.B., and Nevo E.
2002b. Climatic effect on microsatellite diversity in wild emmer wheat, Triticum
dicoccoides, at Yehudiyya microsite, Israel. Heredity 89: 127–132.
131. Liesebach H., Schenck V., and Ewald E. 2009. Clonal fingerprinting in the genus Populus
L. by nuclear microsatellite loci regarding difference between sections, species and
hybrids. Tree Genetics and Genomes 6: 259–269
132. Lin J.J., and Kuo J. 1998. A new reagent for simple isolation of plant genomic DNA.
Focus 20: 46–48.
133. Lindtke D., Buerkle C.A., Barbará T., Heinze B., Castiglione S., Bartha D., and Lexer C.
2012. Recombinant hybrids retain heterozygosity at many loci: new insights into the
genomics of reproductive isolation in Populus. Molecular Ecology 21(20): 5042–5058.
134. Lindtke D., Gompert Z., Lexer C., and Buerkle C.A. 2014. Unexpected ancestry of
Populus seedlings from a hybrid zone implies a large role for postzygotic selection in the
maintenance of species. Molecular ecology 23(17): 4316–4330.
135. Linkosalo T. 1999. Regularities and patterns in the spring phenology of some boreal trees.
Silva Fennica 33(4): 237–245.
136. Liu Z., and Furnier G.R. 1993. Comparison of allozyme, RFLP, and RAPD markers for
revealing genetic variation within and between trembling aspen and bigtooth aspen.
Theoretical and Applied Genetics 87: 97–105.
137. Liu Z., Tan G., Li P., and Dunham R.A. 1999. Transcribed dinucleotide microsatellites
and their associated genes from channel catfish Ictalurus punctatus. Biochemical and
Biophysical Research Communication 259: 190–194.
138. Lodhi M.A., YE G.N., Weeden N.F., and Reisch B.I. 1994. A simple and efficient method
for DNA extraction from grapevine cultivars and Vitis species. Plant Molecular Biology
Reporter 12: 3–13.
139. Lopez-de-Heredia U., Sierra-de-Grado R., Cristobal M.D., Martinez-Zurimendi P., Pando
V., and Martin M.T. 2004. A comparison of isozyme and morphological markers to assess
the within population variation in small populations of European aspen (Populus tremula
L.) in Spain. Silvae Genetica 53: 227–233.
140. Lu M.Z., Szmidt A.E., and Wang X.R. 1995. Inheritance of RAPD fragments in haploid
and diploid tissues of Pinus sylvestris (L.). Heredity 74: 282–589.
100
141. Luquez V., Hall D., Albrectsen B.R., Karlsson J., Ingvarsson P., and Jansson S. 2008.
Natural phenological variation in aspen (Populus tremula): the SwAsp collection. Tree
Genetics and Genomes 4: 279–292.
142. Lynch M., and Milligan B.G. 1994. Analysis of population genetic structure with RAPD
markers. Molecular Ecology 3: 91–99.
143. Ma X.F., Hall D., Onge K.R.S., Jansson S., and Ingvarsson P.K. 2010. Genetic
differentiation, clinal variation and phenotypic associations with growth cessation across
the Populus tremula photoperiodic pathway. Genetics 186(3): 1033–1044.
144. Macarthur R.H. 1957. On the relative abundance of bird species. Proceedings of the
National Academy of Sciences, USA 43(3): 293–295.
145. Macaya-Sanz D., Suter L., Joseph J., Barbara T., Alba N., Gonzalez-Martinez S.C.,
Widmer A., and Lexer C. 2011. Genetic analysis of post-mating reproductive barriers in
hybridizing European Populus species. Heredity 107: 478–486.
146. Mallett K.I., and Myrholm C.L. 1995. The Mating System of Phellinus tremulae.
Mycologia 87(5): 597–603.
147. Mallet J. 2005. Hybridization as an invasion of the genome. Trends in Ecology and
Evolution 20: 229–237.
148. Manion P.D. 1991. Tree Disease Concepts, 2nd edition. Prentice-Hall, Englewood Cliffs,
New Jersey.
149. Mannerlöf M., and Tenning P. 1997. Screening of transgenic plants by multiplex PCR.
Plant Molecular Biology Reporter 15: 38–45.
150. Marcotte E. M., Pellegrini M., Yeates T.O., and Eisenberg D. 1999. A census of protein
repeats. Journal of Molecular Biology 293: 151–160.
151. Markussen T., Pakull B., and Fladung M. 2007. Positioning of sex-correlated markers for
Populus in a AFLP- and SSR- marker based genetic map of Populus tremula x
tremuloides. Silvae Genetica 56: 3–4.
152. Martin-Farmer J., and Janssen G.R. 1999. A downstream CA repeat sequence increases
translation from leadered and unleadered mRNA in Escherichia coli. Molecular
Micobiology 31: 1025–1038.
153. Martinsen G.D., Whitham T.G., Turek R.J., and Keim P. 2001. Hybrid populations
selectively filter gene introgression between species. Evolution 55:1325–1335.
154. Mayr E. 1942. Systematics and the origin of species. Columbia University. Press, New
York, NY.
101
155. Meirmans P.G., Lamothe M., Perinet P., and Isabel N. 2007. Species-specific single
nucleotide polymorphism markers for detecting hybridization and introgression in poplar.
Canadian Journal of Botany 85: 1082–1091.
156. Meirmans P.G., Lamothe M., Gros-Louis M.C., Khasa D., Perinet P., Bousquet J., and
Isabel N. 2010. Complex patterns of hybridization between exotic and native North
American poplar species. American Journal of Botany 97: 1688–1697.
157. Mejeris L. 1936. Kaip išnaikinti drebuli atžalas. M s girios 8-9: 423–424. (In
Lithuanian).
158. Meloni R., Albanese V., Ravassard P., Treilhou F., and Mallet J. 1998. A tetranucleotide
polymorphic microsatellite, located in the first intron of the tyrosine hydroxylase gene,
acts as a transcription regulatory element in vitro. Human Molecular Genetics 7: 423–428.
159. Mengoni A., and Bazzicalupo M. 2002. The statistical treatment of data and the analysis
of molecular variance (AMOVA) in molecular microbial ecology. Annals of microbiology
52: 95-101.
160. Metzgar D., Bytof J., and Wills C. 2000. Selection against frameshift mutations limits
microsatellite expansion in coding DNA. Genome Research 10: 72–80.
161. Mikalaikevi ius V.M. 1958a. Kai kurie drebulin s pinties (Phelinus tremulae Bond et
Boriss.) biologijos klausimai. Lietuvos mišk kio instituto mokslinio tyrimo darbai, 3t.:
187-203. (In Lithuanian).
162. Mikalaikevi ius V.M. 1958b. Centrinis drebul s puvinys. M s girios 9: 6-10. (In
Lithuanian).
163. Milligan B.G. 1998. Total DNA isolation. 29–60. In: Hoelzel A.R. (editor). Molecular
genetic analysis of populations. Oxford University Press, Oxford.
164. Mitchell-Olds T., and Rutledge J.J. 1986. Quantitative genetics in natural plant
populations: a review of the theory. The American Naturalist 127: 379–402.
165. Mitton J.B. 1994. Molecular approaches to population biology. Annual review of Ecology
and Systematics 25: 45–69.
166. Morgante M., and Olivieri A.M. 1993. PCR-amplified microsatellites as markers in plant
genetics. The Plant Journal 3: 175–182.
167. Morgante M., Hanafey M., and Powell W. 2002. Microsatellites are preferentially
associate with nonrepetitive DNA in plant genomes. Nature Genetics 30: 194–200.
168. Mosseler A., Egger K.N., and Hughes G.A. 1992. Low levels of genetic diversity in red
pine confirmed by random amplified polymorphic DNA markers. Canadian Journal of
Forest Research 22: 1322–1327.
102
169. Mullis K.B., and Faloona F.A. 1987. Specific synthesis of DNA in vitro via a polymerase
catalyzed chain reaction. Methods in Enzymology 155: 335–350.
170. Murkait R. 1974. Drebul s (Populus tremula L.) formos, biologija, kryžminimas ir
veisimo s klomis perspektyvos Lietuvoje. Ph.D Dissertation. Kaunas, Girionys. (In
Lithuanian).
171. Murphy T.D., and Karpen G.H. 1995. Localization of centromere function in a Drosophila
minichromosome. Cell 82: 599–609.
172. Murray M.G., and Thompson W.F. 1980. Rapid isolation of high molecular weight plant
DNA. Nucleic Acids Research 8: 4321–4325.
173. Myking T., Bøhler F., Austrheim G., and Solberg E.J. 2011. Life history strategies of
aspen (Populus tremula L.) and browsing effects: a literature review. Forestry 84(1): 61–
71.
174. Nadir E., Hargalit H., Gallily T., and Ben-Sasson S.A. 1996. Microsatellite spreading in
the human genome: Evolutionary mechanisms and structural implications. Proceedings of
the National Academy of Sciences USA 93: 6470–6475.
175. Narayanan S. 1991. Applications of restriction fragment length polymorphism. Annals of
Clinical and Laboratory Science 21(4): 291–296.
176. Nei M. 1972. Genetic distance between populations. American Naturalist 106: 283–392.
177. Nei M. 1978. Estimation of average heterozygosity and genetic distance from a small
number of individuals. Genetics 89: 583–590.
178. Nelson C.D., Kubisiak T.L., Stine M., and Nance W.L. 1994. A genetic linkage map of
longleaf pine (Pinus palustris Mill.) based on random amplified polymorphic DNAs.
Journal of Heredity 85: 433–439.
179. Nesbitt K.A., Potts B.M., Vaillancourt R.E., West A.K., and Reid J.B. 1995. Partitioning
and distribution of RAPD variation in a forest tree species, Eucalyptus globulus
(Myratceae). Heredity 74: 628–637.
180. Newton P.F. 2003. Systematic review of yield responses of four North American conifers
to forest tree improvement practices. Forest Ecology and Management172: 29–51.
181. Niemelä T. 1974. On Fennoscandian polypores. III. Phellinus tremulae (Bond.) Bond. &
Borisov. Annales Botanici Fennici 11: 202–215.
182. OECD 2001. Environmental Health and Safety Publications. Series on Harmonization of
Regulatory Oversight in Biotechnology No. 16. Consensus Document on the Biology of
Populus L. (Poplars).
183. Onge K.R.S. 2006. Natural variation in Populus tremula flowering time gene PtCO2B.
Ph.D. dissertation, University of Umea, Umea, Sweden.
103
184. Ostrowska E., Muralitharan M., Chandler S., Volker P., Hetherington S., and Dunshea F.
1998. Technical review: optimizing conditions for DNA isolation from Pinus radiata. In
Vitro Cellular and Deviation Biology - Plant 34: 108–111.
185. Ozolin ius R. 2003. Populus gentis. In: Navasaitis M., Ozolin ius R., Smaliukas D.,
Balevi ien J. Lietuvos dendroflora. Kaunas. (In Lithuanian).
186. Pakull B., Groppe K., Meyer M., Markussen T., and Fladung M. 2009. Genetic linkage
mapping in aspen (Populus tremula L. and Populus tremuloides Michx.). Tree Genetics
and Genomes 5: 505–515.
187. Pakull B., Groppe K., Mecucci F., Gaudet M., Sabatti M., and Fladung M. 2011. Genetic
mapping of linkage group XIX and identification of sex linked SSR markers in a Populus
tremula x Populus tremuloides cross. Canadian Journal of Forest Research 41: 245–253.
188. Pakull B., Kersten B., Lüneburg J., and Fladung M. 2015. A simple PCR based marker to
determine sex in aspen. Plant Biology 17(1): 256–261.
189. Parker P.G., Show A.A., Schug M.D., Boston G.C., and Fuerst P.A. 1998. What
molecules can tell us about populations: choosing and using a molecular marker. Ecology
79: 361–382.
190. Peakall R., and Smouse P.E. 2006. GenAlEx 6: genetic analysis in Excel. Population
genetic software for teaching and research. Molecular Ecology Notes 6: 288–295.
191. Peakall R., and Smouse P.E. 2012. GenAlEx 6.5: genetic analysis in Excel. Population
genetic software for teaching and research – an update. Bioinformatics 28: 2537–2539.
192. Pérez T., Albornoz J., and Domínguez A. 1998. An evaluation of RAPD fragment
reproducibility and nature. Molecular Ecology 7: 1347-1357.
193. Perron M., and J. Bousquet. 1997. Natural hybridization between black spruce and red
spruce. Molecular Ecology 6:725–734.
194. Petit R., Bodenes C., Ducousso A., Roussel G., and Kremer A. 2003a. Hybridization as a
mechanism of invasion in oaks. New Phytologist 161:151–164.
195. Petit R.J., Aguinagalde I., de Beaulieu J.L., Bittkau C., Brewer S., Cheddadi R., Ennos R.,
Fineschi S., Grivet D., Lascoux M., Mohanty A., Müller-Starck G., Demesure-Musch B.,
Palmé A., Martín J.P., Rendell S., and Vendramin G.G. 2003b. Glacial refugia: hotspots
but not melting pots of genetic diversity. Science 300(5625): 1563–1565.
196. Petit R.J., and Hampe A. 2006. Some evolutionary consequences of being a tree. Annual
Review of Ecology Evolution and Systematics 37: 187–214.
197. Pfeiffer A., Olivieri A.M., and Morgante M. 1997. Identification and characterization of
microsatellites in Norway spruce (Picea abies K.). Genome 40: 411–419.
104
198. Pivorien O. 2008. Paprast j pasikartojan i sek intarp (ISSR) identifikavimas ir
charakterizavimas daugiamet s svidr s genome. Ph.D. dissertation, Lithuanian Institute of
Agriculture, Akademija. (In Lithuanian).
199. Pli ra A. 1993. Drebul s (Populus tremula L.) populiacij genetin s-biologin s ypatyb s,
hibridizacija ir selekcijos galimyb s. Ph.D. dissertation, Lithuanian Forest Research
Institute, Kaunas. (In Lithuanian).
200. Pollastro S., Abbatecola A., Dongiovanni C., and Faretra F. 2000. Usage of molecular
markers (PCR-RAPD) for studying genetic variability in Phellinus (Fomitiporia) sp.
Phytopathologia Mediterranea 39: 107–111.
201. Powell W., Morgante M., McDevitt R., Vendramin G., and Rafalski J. 1996. Polymorphic
simple sequence regions in chloroplast genomes: applications to the population genetics of
pines. Proceedings of the National Academy of Science of the USA 99: 7759–7763.
202. Pritchard J. K., Stephens M., and Donnelly P. 2000. Inference of population structure
using multilocus genotype data. Genetics 155(2): 945–959.
203. Puissant C., and Houdebine L.M. 1990. An improvement of the single-step method of
RNA isolation by acid guanidinium thiocyanate-phenol-chloroform extraction.
Biotechniques 8(2): 148–149.
204. Punt P.J., Dingemanse M.A., Kuyvenhoven A., Soede R.D., Pouwels P.H., and van den
Hondel C.A. 1990. Functional elements in the promoter region of the Aspergillus nidulans
gpdA gene encoding glyceraldehyde-3-phosphate dehydrogenase. Gene 93: 101–109.
205. Rabouam C., Comes A.M., Bretagnolle V., Humbert J.F., Periquet G., and Biqot Y. 1999.
Features of DNA fragments obtained by random amplified polymorphic DNA (RAPD)
assays. Molecular Ecology 8: 493-503.
206. Rachmayanti Y., Leinemann L., Gailing O., and Finkeldey R. 2006. Extraction,
amplification and characterization of wood DNA from Dipterocarpaceae. Plant Molecular
Biology Reporter 24: 45–55.
207. Rachmayanti Y., Leinemann L., Gailing O., and Finkeldey R. 2009. DNA from processed
and unprocessed wood: factors influencing the isolation success. Forensic Science
International: Genetics 3: 185–192.
208. Rauktys J. 1935. Didelis drebul s puvimas. M s girios 10: 504–505. (In Lithuanian).
209. Rauktys J. 1938. Populus tremula L. Drebul . Apuš . Dendrologija. Spindulys, Kaunas.
(In Lithuanian).
210. Reim P. 1929. Die Vermehrungsbiologie der Aspe auf Grundlage des in Estland und
Finnland gesammelten Untersuchungsmaterials. (The regeneration biology of aspen).
University of Tarto: 60. (In German).
105
211. Rhymer J. M., and D. Simberloff. 1996. Extinction by hybridization and introgression.
Annual Review of Ecology, Evolution and Systematics 27: 83–109.
212. Rieseberg L. 1997. Hybrid origins of plant species. Annual Review of Ecology, Evolution
and Systematics 28: 359–389.
213. Rieseberg L.H., Raymond O., Rosenthal D.M., Livingstone Z.L.K., Nakazato T., Durphy
J.L., Schwarzbach A.E., Donovan L.A., and Lexer C. 2003. Major ecological transitions in
annual sunflowers facilitated by hybridization. Science 301: 1211–1216.
214. Röder M.S., Korzun V., Wendehake K., Plaschke J., Tixier M.H., Philippe Leroy Ph., and
Ganal M.W. 1998. A microsatellite map of wheat. Genetics 149: 2007–2023.
215. Roe A.D., MacQuarrie C.J.K., Gros-Louis M.C., Simpson J.D., Lamarche J., Beardmore
T., Thompson S.L., Tanguay P., and Isabel N. 2014. Fitness dynamics within a poplar
hybrid zone: I. Prezygotic and postzygotic barriers impacting a native poplar hybrid stand.
Ecology and Evolution 4(9): 1629–1647.
216. Rogers S.O., and Bendich A.J. 1985. Extraction of DNA from milligram amounts of fresh,
herbarium and mummified plant tissues. Plant Molecular Biology 5: 69–76.
217. Rogers S.O., and Bendich A.J. 1988. Extraction of DNA from plant tissues. 1–10. In:
Gelvin S.B. and Schilperoort R.A. (editors), Plant Molecular Biology Manual, Kluwer
Academic Publishers, Boston.
218. Rytter L., and Stener L.G. 2005. Productivity and thinning effects in hybrid aspen
(Populus tremula L. × P. tremuloides Michx.) stands in southern Sweden. Forestry 78:
285-295.
219. Saghai-Maroof M.A., Soliman K.M., Jorgensen R.A., and Allard R.W. 1984. Ribosomal
DNA spacer-length polymorphisms in barley: Mendelian inheritance, chromosomal
location, and population dynamics. Proceedings of the National Academy of Sciences of
the USA 81(24): 8014–8018.
220. Salvini D., Fineschi S., Malvolti M.E., Taurchini D., Anzidei M., and Vendramin G.G.
2001. Low genetic differentiation among Italian populations of Populus tremula L.
(Salicaceae) estimated using chloroplast PCR-RFLP and microsatellite markers. Forest
genetics 8(1): 81–87.
221. Sanchez N., Grau J.M., Alba N., Manzanera J.A., and De Los Angeles Bueno M. 2000.
Genetic characterisation of Populus tremula regions of origin in Spain using RAPD
fingerprints. Silvae Genetica 49: 66–71.
222. Sandaltzopoulos R., Mitchelmore C., Bonte E., Wall G., and Becker P.B. 1995. Dual
regulation of the Drosophila hsp26 promoter in vitro. Nucleic Acids Research 23: 2479–
2487.
106
223. Sandberg G., and Schalling M. 1997. Effect of in vitro promoter methylation and CGG
repeat expansion on FMR-1 expression. Nucleic Acids Research 14: 2883–2887.
224. Schierenbeck K.A., Skupski M., Lieberman D., and Lieberman M. 1997. Population
structure and genetic diversity in four tropical tree species in Costa Rica. Molecular
Ecology 6: 137–144.
225. Schierenbeck K.A., and Ellstrand N.C. 2009. Hybridization and the evolution of
invasiveness in plants and other organisms. Biological Invasions 11: 1093–1105.
226. Schlötterer C. 2000. Evolutionary dynamics of microsatellite DNA. Chromosoma 109:
365–371.
227. Schmidt T., and Heslop-Harrison J.S. 1996. The physical and genomic organization of
microsatellites in sugar beet. Proceedings of the National Academy of Sciences USA 93:
8761–8765.
228. Schroeder H., and Fladung M. 2010. SSR and SNP markers for the identification of
clones, hybrids and species within the genus Populus. Silvae Genetica 59(6): 257–263.
229. Schroeder H., Hoeltken A.M., and Fladung M. 2012. Differentiation of Populus species
using chloroplast single nucleotide polymorphism (SNP) markers – essential for
comprehensible and reliable poplar breeding. Plant Biology 14(2): 374–381.
230. Schweitzer J.A., Martinsen G.D., and Whitham T.G. 2002. Cottonwood hybrids gain
fitness traits of both parents: a mechanism for their long-term persistence? American
Journal of Botany 89: 981–990.
231. Sederoff R.R. 1987. Molecular mechanisms of mitochondrial genome evolution in higher
plants. The American Naturalist 130: S30–S45.
232. Seehausen O. 2006. Conservation: Losing biodiversity by reverse speciation. Current
Biology 16: 333–337.
233. Shaw J., Lickey E.B., Beck J.T., Farmer S.B., Liu W., Miller J., Siripun K.C., Winder
C.T., Schilling E.E., and Small R.L. 2005. The tortoise and the hare II: relative utility of
21 noncoding chloroplast DNA sequences for phylogenetic analysis. American Journal of
Botany 92(1): 142–166.
234. Shibata M., Tanaka H., Iida S., Abe S., Masaki T., Niiyama K., and Nakashizuka T. 2002.
Synchronized annual seed production by 16 principal tree species in a temperate
deciduous forests, Japan. Ecology 83: 1727–1742.
235. Smith D.N., and Devey M.E. 1994. Occurrence and inheritance of microsatellites in Pinus
radiata. Genome 37: 977–83.

107
236. Smulders M., Van der Schoot J., Arens P., and Vosman B. 2001. Trinucleotide repeat
microsatellite markers for black poplar (Populus nigra L.). Molecular Ecology Notes 1:
188–190.
237. Sneath P.H.A., and Sokal R.R. 1973. Numerical Taxonomy, Freeman, San Francisko.
238. Steinkellner H., Fluch S., Turetschek E., Lexer C., Streiff R., Kremer A., Burg K., and
Gloss J. 1997. Identification and characterization of (GA/CT)n – microsatellite loci from
Qurecus petraea. Plant Molecular Biology 33: 1093–1096.
239. Sterck L., Rombauts S., Jansson S., Sterky F., Rouzé P., and Van de Peer Y. 2005. EST
data suggest that poplar is an ancient polyploidy. New Phytologist 167: 165–170.
240. Stettler R., Bradshaw H. Jr., Heilman P., and Hinckley T. 1996. Biology of Populus and
its implications for management and conservation. NRC, Ottawa, ON, Canada.
241. Stewart N.C., and Via L.E. 1993. A rapid CTAB DNA isolation technique useful for
RAPD fingerprinting and other PCR applications. Biotechniques 14: 748–749.
242. Stölting K.N., Nipper R., Lindtke D., Caseys C., Waeber S., Castiglione S., and Lexer C.
2013. Genome scan for single nucleotide polymorphisms reveals patterns of divergence
and gene flow between ecologically divergent species. Molecular Ecology. 22(3): 842–
855.
243. Strømme C.B., Julkunen-Tiitto R., Krishna U., Lavola A., Olsen J.E., and Nybakken L.
2014. UV-B and temperature enhancement affect spring and autumn phenology in
Populus tremula. Plant, Cell and Environment 1–11.
244. Sunhede S., and Vasiliauskas R. 2002. Ecology and decay pattern of Phellinus robustus in
old-growth Quercus robur. Karstenia 42: 1–11.
245. Suvanto L.I., and Latva-Karjanmaa T.B. 2005. Clone identification and clonal structure of
the European aspen (Populus tremula). Molecular Ecology 14(9): 2851–2860.
246. Suzuki R., and Shimodaira H. 2004. An application of multiscale bootstrap resampling to
hierarchical clustering of microarray data: How accurate are these clusters? The Fifteenth
International Conference on Genome Informatics 2004.
247. Sylvén N. 1940. Lång- och kortdagstyper av de svenska skogsträden. Sv. Papper. 18: 332–
342. (In Swedish).
248. Tachida H., and Iizuka M. 1992. Persistence of repeated sequences that evolve by
replication slippage. Genetics 131: 471–478.
249. Talbot P., Thompson S.L., Schroeder W., and Isabel N. 2011. An efficient single
nucleotide polymorphism assay to diagnose the genomic identity of poplar species and
hybrids on the Canadian prairies. Canadian Journal of Forest Research 41: 1102–1111.
108
250. Talbot P., Schroeder W.R., Bousquet J., and Isabel N. 2012. When exotic poplars and
native Populus balsamifera L. meet on the Canadian Prairies: spontaneous hybridization
and establishment of interspecific hybrids. Forest Ecology and Management 285: 142–
152.
251. Tautz D., and Renz M. 1984. Simple sequences are ubiquitous repetitive components of
eukaryotic genomes. Nucleic Acids Research 12: 4127–4138.
252. Thompson S.L., Lamothe M., Meirmans P.G., Perinet P., and Isabel N. 2010. Repeated
unidirectional introgression towards Populus balsamifera in contact zones of exotic and
native poplars. Molecular Ecology 19:132–145.
253. Tibbits J.F.G., McManus L.J., Spokevicius A.V., and Bossinger G. 2006. A rapid method
for tissue collection and high-throughput isolation of genomic DNA from mature trees.
Plant Molecular Biology Reporter 24: 81–91.
254. Tiffin P., Olson M.S., and Moyle L.C. 2001. Asymmetrical crossing barriers in
angiosperms. Proceedings of the National Academy B: Biological Sciences 268: 861–867.
255. Timchenko N.A., Welm A.L., Lu X., and Timchenko L.T. 1999. CUG repeat binding
protein (CUGBP1) interacts with the 5 region of C/EBP mRNA and regulates translation
of C/EBP isoforms. Nucleic Acids Research 27: 4517–4525.
256. Tulsieram L.K., Glaubitz J.C., Kiss G., and Carlson J.E. 1992. Single-tree genetic linkage
mapping in conifers using haploid DNA from megagametophytes. Biotechnology 10: 686–
690.
257. Tuskan G.A., Gunter L.E., Yang Z.K., Yin T.M., Sewell M.M., and DiFazio S.P. 2004.
Characterization of microsatellites revealed by genomic sequencing of Populus
trichocarpa. Canadian Journal of Forest Research 34: 85–93.
258. Tuskan G.A., DiFazio S., Jansson S., Bohlmann J., Grigoriev I., Hellsten U. et al. 2006.
The genome of black cottonwood, Populus trichocarpa (Torr. & Gray). Science 313:
1596–1604.
259. Tuskan G.A., DiFazio S., Faivre-Rampant P., Gaudet M., Harfouche A., Jorge V., Labbe
J.L., Ranjan P., Sabatti M., Slavov G., Street N., Tschaplinski T.J., and Yin T. 2012. The
obscure events contributing to the evolution of an incipient sex chromosome in Populus: a
retrospective working hypothesis. Tree Genetics and Genomes 8: 559–571.
260. Unneberg P., Strömberg M., Lundeberg J., Jansson S., and Sterky F. 2005. Analysis of
70,000 EST sequences to study divergence between two closely related Populus species.
Tree Genetics and Genomes 1: 109–115.
109
261. Vai ys M. 2006. Lietuvos miško dirvožemio tyrimas, dirvožemi ir miško augavie i
klasifikavimas 7–38. In: Ozolin ius R., Vai ys M., Karazija S., Kuliešis A., Rutkauskas
A. (editors). Miško augavie i tipai. Kaunas. (In Lithuanian).
262. Vanden Broeck A., Villar M., Van Bockstaele E., and Van Slycken J. 2005. Natural
hybridization between cultivated poplars and their wild relatives: evidence and
consequences for native poplar populations. Annals of Forest Science 62: 601–613.
263. Vehmas M., Kouki J., and Eerikainen K. 2009 Long-term spatiotemporal dynamics and
historical continuity of European aspen (Populus tremula L.) stands in the Koli National
Park, eastern Finland. Forestry 82: 135–148.
264. Vendramin G.G., Lelli L., Rossi P., and M. Morgante. 1996. A set of primers for the
amplification of 20 chloroplast microsatellites in Pinaceae. Molecular ecology 5: 595–
598.
265. Vil inskas J. 1931. Medienos prieauglis Lietuvos valstybiniuose miškuose. M s girios
5/13: 315-328. (In Lithuanian).
266. Wagner D.B., Furnier G.R., Saghai-Maroof M.A., Williams S.M., Dancik B.P., and Allard
R.W. 1987. Chloroplast DNA polymorphisms in lodgepole and jack pines and their
hybrids. Proceedings of the National Academy of Sciences USA 84: 2097–2100.
267. Wall R.E. 1971. Variation in decay in aspen stands as affected by their clonal growth
pattern. Canadian Journal of Forestry Research 1(3): 141–146.
268. Wang H., Qi M., and Cutler A.J. 1993. A simple method of preparing plant samples for
PCR. Nucleic Acids Research 21: 4153–4154.
269. Wang Z., Weber J.L., Zhong G., and Tanksley S.D. 1994. Survey of plant short tandem
DNA repeats. Theoretical and Applied Genetics 88: 1–6.
270. Wang X.R., and Szmidt A.E. 2001. Molecular markers in population genetics of forest
trees. Scandinavian Journal of Forest Research: 16(3): 199–220.
271. Weber J.L., and May P.E. 1989. Abundant class of human DNA polymorphism which can
be typed using the polymerase chain reaction. American Journal of Human Genetics 44:
388–396.
272. Weising K., Nybom H., Wolff K., and Kahl G. 2005. DNA fingerprinting in plants:
principles, methods, and applications. Taylor and Francis.
273. Welsh J., and McClelland M. 1990. Fingerprinting genomes using PCR with arbitrary
primers. Nucleic Acids Research 18(24): 7213–7218.
274. White T.J., Bruns T., Lee S., and Taylor J. 1990. Amplification and direct sequencing of
fungal ribosomal RNA genes for phylogenetics. 315–322. In: Innis M.A., Gelfand D.H.,
110
Sninsky J.J., and White T.J. (editors). PCR protocols: a guide to methods and applications.
Academic Press, San Diego, California.
275. White G., and Powell W. 1997. Isolation and characterization of microsatellite marker loci
in Swietenia humilis (Meliaciea) – an endangered tropical hardwood species. Molecular
Ecology 6: 851–860.
276. Whitney K.D., Randell R.A., and Rieseberg L. 2010. Adaptive introgression of abiotic
tolerance traits in the sunflower Helianthus annuus. New Phytologist 187: 230–239.
277. Williams J.G., Kubelik A.R., Livak K.J., Rafalski J.A., and Tingey S.V. 1990. DNA
polymorphisms amplified by arbitrary primers are useful as genetic markers. Nucleic
Acids Research 18(22): 6531–6535.
278. Worrell R. 1995. European aspen (Populus tremula L.): a review with particular reference
to Scotland. Distribution, ecology and genetic variation. Forestry 68(2): 93–105.
279. Wren J.D., Forgacs E., Fondon J.W., Pertsemlidis A., Cheng S.Y., Gallardo T., Williams
R.S., Shohet R.V., Minna J.D., and Garner H.R. 2000. Repeat polymorphisms within gene
regions: Phenotypic and evolutionary implications. American Journal of Human Genetics
67: 345–356.
280. Wright S. 1946. Isolation by distance under diverse systems of mating. Genetics 31: 39–
59.
281. Wright S. 1951. The genetical structure of populations. Annual Eugenics 15: 323–354.
282. Wright S. 1965. The interpretation of population structure by F-Statistics with special
regard to systems of mating. Evolution 19: 395–420.
283. Wühlisch G. 2009. EUFORGEN Technical Guidelines for genetic conservation and use of
Eurasian aspen (Populus tremula) Biodiversity International, Rome, Italy.
284. Yin T.M., DiFazio S.P., Gunter L.E., Zhang X., Sewell M.M., Woolbright S.A., Allan
G.J., Kelleher C.T., Douglas C.J., Wang M., and Tuskan G.A. 2008. Genome structure
and emerging evidence of an incipient sex chromosome in Populus. Genome Research 18:
422–430.
285. Young A., Boshier D., and Boyle T. 2000a. Forest conservation genetics. Principles and
practice. CABI publishing, UK.
286. Young E.T., Sloan J.S., and van Riper K. 2000b. Trinucleotide repeats are clustered in
regulatory genes in Saccharomyces cerevisiae. Genetics 154: 1053–1068.
287. Zhou Ch.J., Song H.Z., Li J.H., Sun J.W., Jin D.M., Zhang Q.W., and Wang B. 2005.
Evaluation of genetic diversity and germplasm identification of 44 species, clones, and
cultivars from 5 sections of the genus Populus based on amplified fragment length
polymorphism analysis. Plant Molecular Biology Reporter 23: 39–51.
111
288. Zsuffa L. 1975. A summary review of interspecific breeding in the genus Populus L. 107–
123. In Proceedings 14th meeting of the Canadian Tree Improvement Association, part 2.
Dept. Environment, Canadian Forestry Service, Ottawa.
289. Žvingila D., Verbylait R., Abraitis R., Kuusien S., and Ozolin ius R. 2002. An
assessment of genetic diversity in plus tree clones of Pinus sylvestris L. using RAPD
markers. Baltic Forestry 8(15): 2–7.
290. . ., . , and . . 1991. . .
. .: . . 304 .
291. . . 1959. .
(Phellinus
tremulae Bond. et Boriss.). Ph.D. dissertation, Vilnius, Lithuania. (In Russian).
292. . . . 1968.
. , , 173 .
112
LIST OF PUBLICATIONS
Journals with impact factor in Web of Knowledge database:
Verbylait R., Beišys P., Rimas V. and Kuusien S. Comparison of ten DNA extraction
protocols from wood of European Aspen (Populus tremula L.). Baltic Forestry, 2010. 16 (1):
35–42.
Journal included in other cited data bases [ISI Proceedings and etc.]
Žvingila D., Verbylait R., Baliuckas V., Pli ra A., Kuusien S. 2006. Genetic diversity
(RAPD) in natural Lithuanian populations of common ash (Fraxinus excelsior L.). Biologija.
3: 46–53.
Verbylait R., Baliuckas V., Kuusien S. European aspen (Populus tremula L.) genetic
diversity assessed by molecular methods correlation with P. tremulae infection incidence.
Biologija, 2015. In Press.
Participation in international scientific conferences:
1. Verbylait R., Kuusien S. and Ozolin ius R. Agrobacterium mediated transformation of
poplar (Populus tremula L.) with rolB (root inducing) gene. International Ph.D. courses
„Applied and fundamental aspects of responses, signaling and development process in the
root-microbe systems“. 2007 07. St. Petersburg, Russia.
2. Verbylait R., Kuusien S., Ozolin ius R., Gotoveckien E. Evaluation of genetic
polymorphism of all Lithuanian Populus tremula selected trees, taking into account their
contagion with steam rotting fungi. IUFRO conference “Adaptation, Breeding and
Conservation in the Era of Forest Tree Genomics and Environmental Change”. 2008 08.
Qvebec, Canada.
3. Pli ra A., Verbylait R. Lithuanian poplar breeding program. International
TREEBREEDEX seminar “Poplar breeding strategies in Europe: lessons from the past and
challenges for the next decade“. 2008 09. Orlean, France.
4. Verbylait R. Genetic diversity assessment of selected European Aspen (Populus tremula
L.) trees in Lithuania using RAPD markers. International conference „Climate Change and
Forest Ecosystems“. 2008 10. Vilnius, Lithuania.
5. Verbylait R. Kuusien S. Gotoveckien E. Genetic diversity of selected European aspen
(Populus tremula L.) trees in Lithuania based on RAPD markers. II International Poplar
Symposium „From genes to Function“. 2009 03. Göttingen, Germany.
113
LIST OF ABBREVIATIONS
ABI – Applied Bio Systems
AFLP – Amplified Fragment Length Polymorphism
AMOVA – Analysis Of Molecular VAriance
BC1 – Back Cross first generation
bp – base pair
CTAB – Cetil Trimetil Amonium Bromide
DNA – DeoxyRibonucleic Acid
dNTP – deoxyNucleotide TriPhosphate
EDTA – Ethylene Diamine Tetraacetic Acid
EST – Expressed Sequence Tag
EUFORGEN - EUropean FORest GENetic resources Programme
F1 – first generation hybrid
FAO – Food and Agriculture Organization of the United Nations
GENMOD – generalized linear models, employed in SAS software
HWE – Hardy-Weinberg Equilibrium
IPGC – International Populus Genome Consortium
ISSR – Inter Simple Sequence Repeat
ITS – Internal Transcribed Spacer situated between the small-subunit ribosomal RNA (rRNA)
and large-subunit rRNA genes
IUFRO - The International Union of Forest Research Organizations
MgCl2 – Magnesium chloride
NaCl – Sodium chloride
NaOH – Sodium hydroxide
OECD – Organization of Economic Co-operation and Development
PCA - Pricipal Coordinate Analysis
PCR – Polymerase Chain Reaction
PCR-RFLP – Restriction Fragment Length Polymorphism Analysis of PCR amplified
fragments
PD – discriminating power
PVP – PoliVinyl Pirolidon
QTL – Quantitative Trait Loci
RAD – Restriction Site Associated DNA
114
RAPD – Random Amplified Polymorphic DNA
RFLP – Restriction Fragment Length Polymorphism
RNA – RiboNucleic Acid
SDS – Sodium Dodecyl Sulphate
SFE – State Forest Enterprise
SNP – Single Nucleotide Polymorphism
SSR – Simple Sequence Repeats
SwAsp – A collection of Populus tremula trees representing different Swedish populations
TBE – Tris-Boric acid-EDTA
TE – Tris-EDTA
Tris – 2-amino-2-(hydroxymethyl)-1,3-propanediol
UPGMA – Unweighted Pair Group Method with Arithmetic mean
UVB – Ultraviolet B radiation 320-290 nm

115
ACKNOWLEDGMENTS
First of all I would like to thank my first supervisor Prof. Habil. Dr. Remigijus Ozolin ius for
inspirational ideas, that led me through this research. I also wish to thank my current supervisor
dr. Virgilijus Baliuckas for huge support and great ideas he provided through these years.
Thanks to all friendly and supportive Institute of Forestry colleagues who made my doctoral
studies an overall enjoyable experience. I would especially like to thank Doc. Dr. Sigut
Kuusien and the Forest biotechnology lab colleagues who through their interest and
engagement have helped me in development of this work.
I wish to thank Dr. Vaidotas Lygis for the enormous amounts of encouragement and help.
Thanks to friends and family for being interested in my work and for keeping me interested in
other things! Thank you from all of my heart.
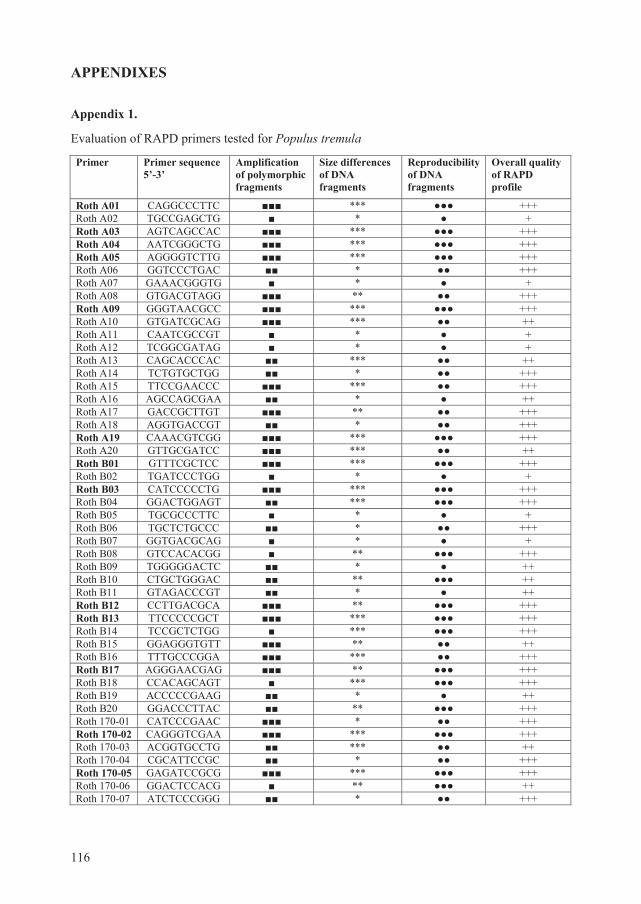
116
APPENDIXES
Appendix 1.
Evaluation of RAPD primers tested for Populus tremula
Primer Primer sequence 5’-3’
Amplification of polymorphic fragments
Size differences of DNA fragments
Reproducibility of DNA fragments
Overall quality of RAPD profile
Roth A01 CAGGCCCTTC *** +++ Roth A02 TGCCGAGCTG * + Roth A03 AGTCAGCCAC *** +++ Roth A04 AATCGGGCTG *** +++ Roth A05 AGGGGTCTTG *** +++ Roth A06 GGTCCCTGAC * +++ Roth A07 GAAACGGGTG * + Roth A08 GTGACGTAGG ** +++ Roth A09 GGGTAACGCC *** +++ Roth A10 GTGATCGCAG *** ++ Roth A11 CAATCGCCGT * + Roth A12 TCGGCGATAG * + Roth A13 CAGCACCCAC *** ++ Roth A14 TCTGTGCTGG * +++ Roth A15 TTCCGAACCC *** +++ Roth A16 AGCCAGCGAA * ++ Roth A17 GACCGCTTGT ** +++ Roth A18 AGGTGACCGT * +++ Roth A19 CAAACGTCGG *** +++ Roth A20 GTTGCGATCC *** ++ Roth B01 GTTTCGCTCC *** +++ Roth B02 TGATCCCTGG * + Roth B03 CATCCCCCTG *** +++ Roth B04 GGACTGGAGT *** +++ Roth B05 TGCGCCCTTC * + Roth B06 TGCTCTGCCC * +++ Roth B07 GGTGACGCAG * + Roth B08 GTCCACACGG ** +++ Roth B09 TGGGGGACTC * ++ Roth B10 CTGCTGGGAC ** ++ Roth B11 GTAGACCCGT * ++ Roth B12 CCTTGACGCA ** +++ Roth B13 TTCCCCCGCT *** +++ Roth B14 TCCGCTCTGG *** +++ Roth B15 GGAGGGTGTT ** ++ Roth B16 TTTGCCCGGA *** +++ Roth B17 AGGGAACGAG ** +++ Roth B18 CCACAGCAGT *** +++ Roth B19 ACCCCCGAAG * ++ Roth B20 GGACCCTTAC ** +++ Roth 170-01 CATCCCGAAC * +++ Roth 170-02 CAGGGTCGAA *** +++ Roth 170-03 ACGGTGCCTG *** ++ Roth 170-04 CGCATTCCGC * +++ Roth 170-05 GAGATCCGCG *** +++ Roth 170-06 GGACTCCACG ** ++ Roth 170-07 ATCTCCCGGG * +++
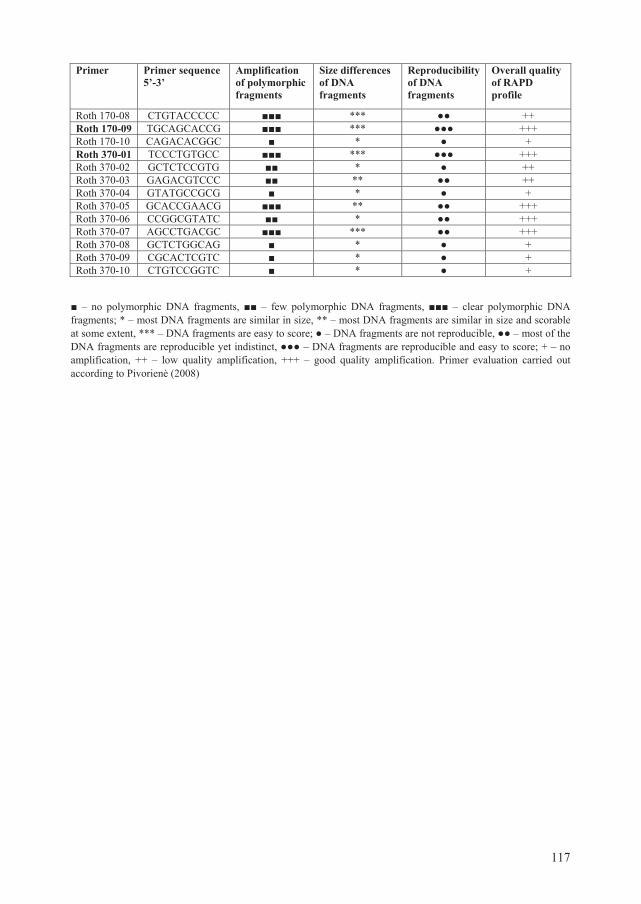
117
Primer Primer sequence 5’-3’
Amplification of polymorphic fragments
Size differences of DNA fragments
Reproducibility of DNA fragments
Overall quality of RAPD profile
Roth 170-08 CTGTACCCCC *** ++ Roth 170-09 TGCAGCACCG *** +++ Roth 170-10 CAGACACGGC * + Roth 370-01 TCCCTGTGCC *** +++ Roth 370-02 GCTCTCCGTG * ++ Roth 370-03 GAGACGTCCC ** ++ Roth 370-04 GTATGCCGCG * + Roth 370-05 GCACCGAACG ** +++ Roth 370-06 CCGGCGTATC * +++ Roth 370-07 AGCCTGACGC *** +++ Roth 370-08 GCTCTGGCAG * + Roth 370-09 CGCACTCGTC * + Roth 370-10 CTGTCCGGTC * +
– no polymorphic DNA fragments, – few polymorphic DNA fragments, – clear polymorphic DNA fragments; * – most DNA fragments are similar in size, ** – most DNA fragments are similar in size and scorable at some extent, *** – DNA fragments are easy to score; – DNA fragments are not reproducible, – most of the DNA fragments are reproducible yet indistinct, – DNA fragments are reproducible and easy to score; + – no amplification, ++ – low quality amplification, +++ – good quality amplification. Primer evaluation carried out according to Pivorien (2008)
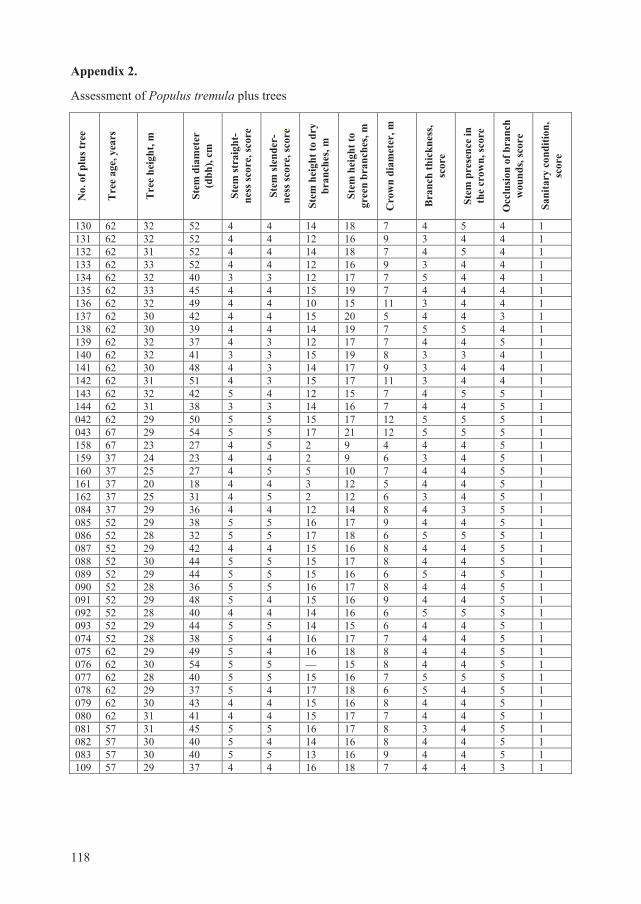
118
Appendix 2.
Assessment of Populus tremula plus trees N
o. o
f plu
s tre
e
Tre
e ag
e, y
ears
Tre
e he
ight
, m
Stem
dia
met
er
(dbh
), cm
Stem
stra
ight
- ne
ss sc
ore,
scor
e
Stem
slen
der-
ne
ss sc
ore,
scor
e
Stem
hei
ght t
o dr
y br
anch
es, m
Stem
hei
ght t
o gr
een
bran
ches
, m
Cro
wn
diam
eter
, m
Bra
nch
thic
knes
s, sc
ore
Stem
pre
senc
e in
th
e cr
own,
scor
e
Occ
lusi
on o
f bra
nch
wou
nds,
scor
e
Sani
tary
con
ditio
n,
scor
e
130 62 32 52 4 4 14 18 7 4 5 4 1 131 62 32 52 4 4 12 16 9 3 4 4 1 132 62 31 52 4 4 14 18 7 4 5 4 1 133 62 33 52 4 4 12 16 9 3 4 4 1 134 62 32 40 3 3 12 17 7 5 4 4 1 135 62 33 45 4 4 15 19 7 4 4 4 1 136 62 32 49 4 4 10 15 11 3 4 4 1 137 62 30 42 4 4 15 20 5 4 4 3 1 138 62 30 39 4 4 14 19 7 5 5 4 1 139 62 32 37 4 3 12 17 7 4 4 5 1 140 62 32 41 3 3 15 19 8 3 3 4 1 141 62 30 48 4 3 14 17 9 3 4 4 1 142 62 31 51 4 3 15 17 11 3 4 4 1 143 62 32 42 5 4 12 15 7 4 5 5 1 144 62 31 38 3 3 14 16 7 4 4 5 1 042 62 29 50 5 5 15 17 12 5 5 5 1 043 67 29 54 5 5 17 21 12 5 5 5 1 158 67 23 27 4 5 2 9 4 4 4 5 1 159 37 24 23 4 4 2 9 6 3 4 5 1 160 37 25 27 4 5 5 10 7 4 4 5 1 161 37 20 18 4 4 3 12 5 4 4 5 1 162 37 25 31 4 5 2 12 6 3 4 5 1 084 37 29 36 4 4 12 14 8 4 3 5 1 085 52 29 38 5 5 16 17 9 4 4 5 1 086 52 28 32 5 5 17 18 6 5 5 5 1 087 52 29 42 4 4 15 16 8 4 4 5 1 088 52 30 44 5 5 15 17 8 4 4 5 1 089 52 29 44 5 5 15 16 6 5 4 5 1 090 52 28 36 5 5 16 17 8 4 4 5 1 091 52 29 48 5 4 15 16 9 4 4 5 1 092 52 28 40 4 4 14 16 6 5 5 5 1 093 52 29 44 5 5 14 15 6 4 4 5 1 074 52 28 38 5 4 16 17 7 4 4 5 1 075 62 29 49 5 4 16 18 8 4 4 5 1 076 62 30 54 5 5 — 15 8 4 4 5 1 077 62 28 40 5 5 15 16 7 5 5 5 1 078 62 29 37 5 4 17 18 6 5 4 5 1 079 62 30 43 4 4 15 16 8 4 4 5 1 080 62 31 41 4 4 15 17 7 4 4 5 1 081 57 31 45 5 5 16 17 8 3 4 5 1 082 57 30 40 5 4 14 16 8 4 4 5 1 083 57 30 40 5 5 13 16 9 4 4 5 1 109 57 29 37 4 4 16 18 7 4 4 3 1
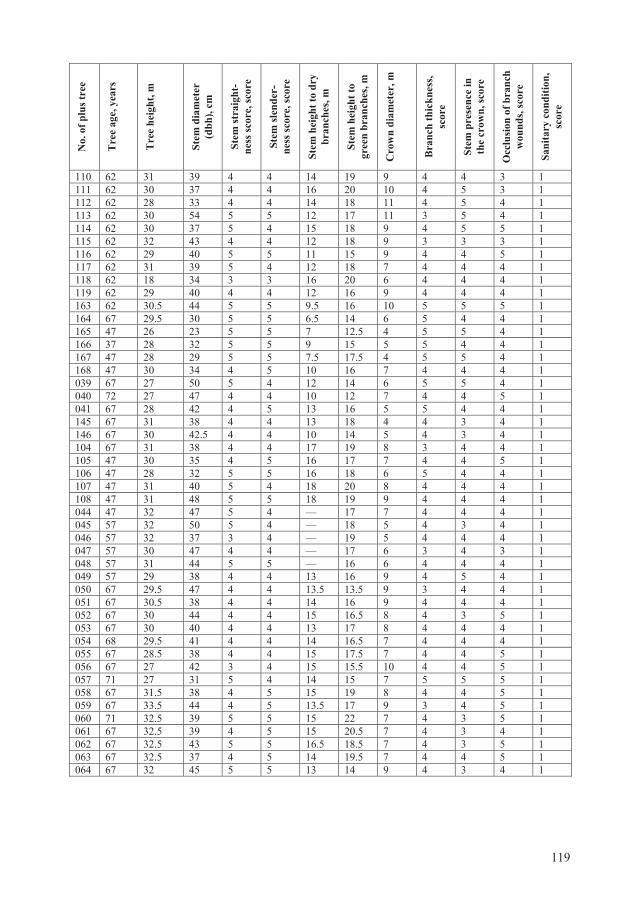
119
No.
of p
lus t
ree
T
ree
age,
yea
rs
Tre
e he
ight
, m
Stem
dia
met
er
(dbh
), cm
Stem
stra
ight
- ne
ss sc
ore,
scor
e
Stem
slen
der-
ne
ss sc
ore,
scor
e
Stem
hei
ght t
o dr
y br
anch
es, m
Stem
hei
ght t
o gr
een
bran
ches
, m
Cro
wn
diam
eter
, m
Bra
nch
thic
knes
s, sc
ore
Stem
pre
senc
e in
th
e cr
own,
scor
e
Occ
lusi
on o
f bra
nch
wou
nds,
scor
e
Sani
tary
con
ditio
n,
scor
e
110 62 31 39 4 4 14 19 9 4 4 3 1 111 62 30 37 4 4 16 20 10 4 5 3 1 112 62 28 33 4 4 14 18 11 4 5 4 1 113 62 30 54 5 5 12 17 11 3 5 4 1 114 62 30 37 5 4 15 18 9 4 5 5 1 115 62 32 43 4 4 12 18 9 3 3 3 1 116 62 29 40 5 5 11 15 9 4 4 5 1 117 62 31 39 5 4 12 18 7 4 4 4 1 118 62 18 34 3 3 16 20 6 4 4 4 1 119 62 29 40 4 4 12 16 9 4 4 4 1 163 62 30.5 44 5 5 9.5 16 10 5 5 5 1 164 67 29.5 30 5 5 6.5 14 6 5 4 4 1 165 47 26 23 5 5 7 12.5 4 5 5 4 1 166 37 28 32 5 5 9 15 5 5 4 4 1 167 47 28 29 5 5 7.5 17.5 4 5 5 4 1 168 47 30 34 4 5 10 16 7 4 4 4 1 039 67 27 50 5 4 12 14 6 5 5 4 1 040 72 27 47 4 4 10 12 7 4 4 5 1 041 67 28 42 4 5 13 16 5 5 4 4 1 145 67 31 38 4 4 13 18 4 4 3 4 1 146 67 30 42.5 4 4 10 14 5 4 3 4 1 104 67 31 38 4 4 17 19 8 3 4 4 1 105 47 30 35 4 5 16 17 7 4 4 5 1 106 47 28 32 5 5 16 18 6 5 4 4 1 107 47 31 40 5 4 18 20 8 4 4 4 1 108 47 31 48 5 5 18 19 9 4 4 4 1 044 47 32 47 5 4 — 17 7 4 4 4 1 045 57 32 50 5 4 — 18 5 4 3 4 1 046 57 32 37 3 4 — 19 5 4 4 4 1 047 57 30 47 4 4 — 17 6 3 4 3 1 048 57 31 44 5 5 — 16 6 4 4 4 1 049 57 29 38 4 4 13 16 9 4 5 4 1 050 67 29.5 47 4 4 13.5 13.5 9 3 4 4 1 051 67 30.5 38 4 4 14 16 9 4 4 4 1 052 67 30 44 4 4 15 16.5 8 4 3 5 1 053 67 30 40 4 4 13 17 8 4 4 4 1 054 68 29.5 41 4 4 14 16.5 7 4 4 4 1 055 67 28.5 38 4 4 15 17.5 7 4 4 5 1 056 67 27 42 3 4 15 15.5 10 4 4 5 1 057 71 27 31 5 4 14 15 7 5 5 5 1 058 67 31.5 38 4 5 15 19 8 4 4 5 1 059 67 33.5 44 4 5 13.5 17 9 3 4 5 1 060 71 32.5 39 5 5 15 22 7 4 3 5 1 061 67 32.5 39 4 5 15 20.5 7 4 3 4 1 062 67 32.5 43 5 5 16.5 18.5 7 4 3 5 1 063 67 32.5 37 4 5 14 19.5 7 4 4 5 1 064 67 32 45 5 5 13 14 9 4 3 4 1
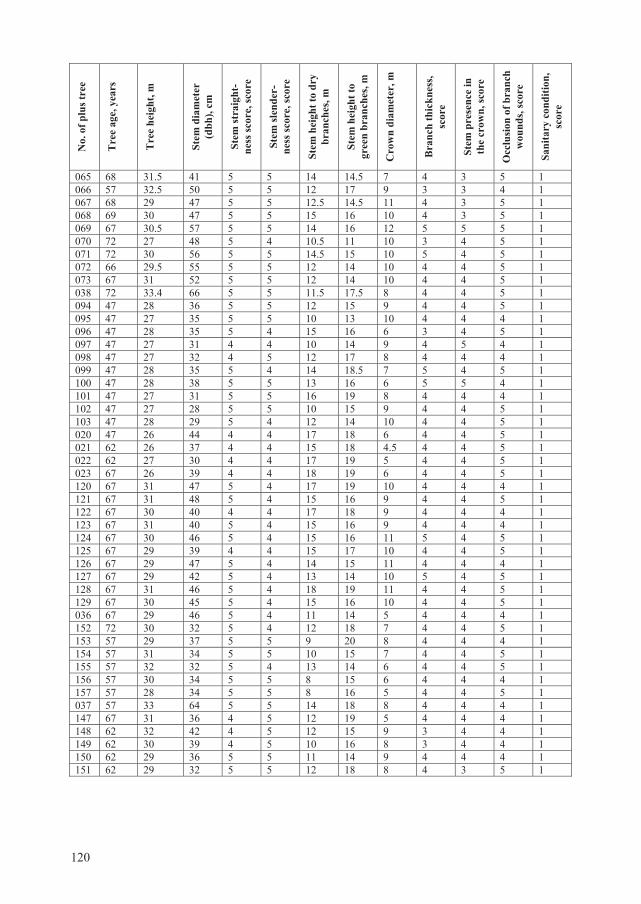
120
No.
of p
lus t
ree
T
ree
age,
yea
rs
Tre
e he
ight
, m
Stem
dia
met
er
(dbh
), cm
Stem
stra
ight
- ne
ss sc
ore,
scor
e
Stem
slen
der-
ne
ss sc
ore,
scor
e
Stem
hei
ght t
o dr
y br
anch
es, m
Stem
hei
ght t
o gr
een
bran
ches
, m
Cro
wn
diam
eter
, m
Bra
nch
thic
knes
s, sc
ore
Stem
pre
senc
e in
th
e cr
own,
scor
e
Occ
lusi
on o
f bra
nch
wou
nds,
scor
e
Sani
tary
con
ditio
n,
scor
e
065 68 31.5 41 5 5 14 14.5 7 4 3 5 1 066 57 32.5 50 5 5 12 17 9 3 3 4 1 067 68 29 47 5 5 12.5 14.5 11 4 3 5 1 068 69 30 47 5 5 15 16 10 4 3 5 1 069 67 30.5 57 5 5 14 16 12 5 5 5 1 070 72 27 48 5 4 10.5 11 10 3 4 5 1 071 72 30 56 5 5 14.5 15 10 5 4 5 1 072 66 29.5 55 5 5 12 14 10 4 4 5 1 073 67 31 52 5 5 12 14 10 4 4 5 1 038 72 33.4 66 5 5 11.5 17.5 8 4 4 5 1 094 47 28 36 5 5 12 15 9 4 4 5 1 095 47 27 35 5 5 10 13 10 4 4 4 1 096 47 28 35 5 4 15 16 6 3 4 5 1 097 47 27 31 4 4 10 14 9 4 5 4 1 098 47 27 32 4 5 12 17 8 4 4 4 1 099 47 28 35 5 4 14 18.5 7 5 4 5 1 100 47 28 38 5 5 13 16 6 5 5 4 1 101 47 27 31 5 5 16 19 8 4 4 4 1 102 47 27 28 5 5 10 15 9 4 4 5 1 103 47 28 29 5 4 12 14 10 4 4 5 1 020 47 26 44 4 4 17 18 6 4 4 5 1 021 62 26 37 4 4 15 18 4.5 4 4 5 1 022 62 27 30 4 4 17 19 5 4 4 5 1 023 67 26 39 4 4 18 19 6 4 4 5 1 120 67 31 47 5 4 17 19 10 4 4 4 1 121 67 31 48 5 4 15 16 9 4 4 5 1 122 67 30 40 4 4 17 18 9 4 4 4 1 123 67 31 40 5 4 15 16 9 4 4 4 1 124 67 30 46 5 4 15 16 11 5 4 5 1 125 67 29 39 4 4 15 17 10 4 4 5 1 126 67 29 47 5 4 14 15 11 4 4 4 1 127 67 29 42 5 4 13 14 10 5 4 5 1 128 67 31 46 5 4 18 19 11 4 4 5 1 129 67 30 45 5 4 15 16 10 4 4 5 1 036 67 29 46 5 4 11 14 5 4 4 4 1 152 72 30 32 5 4 12 18 7 4 4 5 1 153 57 29 37 5 5 9 20 8 4 4 4 1 154 57 31 34 5 5 10 15 7 4 4 5 1 155 57 32 32 5 4 13 14 6 4 4 5 1 156 57 30 34 5 5 8 15 6 4 4 4 1 157 57 28 34 5 5 8 16 5 4 4 5 1 037 57 33 64 5 5 14 18 8 4 4 4 1 147 67 31 36 4 5 12 19 5 4 4 4 1 148 62 32 42 4 5 12 15 9 3 4 4 1 149 62 30 39 4 5 10 16 8 3 4 4 1 150 62 29 36 5 5 11 14 9 4 4 4 1 151 62 29 32 5 5 12 18 8 4 3 5 1

Rita VERBYLAIT
EUROPEAN ASPEN (Populus tremula L.) IN LITHUANIA:
GENETIC DIVERSITY OF PLUS TREES AND POPULATIONS ASSESSED USING MOLECULAR MARKERS
Doctoral Dissertation
Išleido ir spausdino – Vytauto Didžiojo universiteto bibliotekos Leidybos skyrius
(S. Daukanto g. 27, LT-44249 Kaunas) Užsakymo Nr. K15-126. Tiražas 15 egz. 2015 11 13.
Nemokamai.