genetic diversity of roseroot (rhodiola rosea l.) from sweden, greenland and faroe islands
TRANSCRIPT
1
Swedish University of Agricultural Sciences
The Faculty of landscape Planning, Horticulture and Agriculture Science
Plant Breeding and Biotechnology
Collaboration with the Nordic Genetic Resource Center (NordGen)
Genetic diversity of Roseroot
(Rhodiola rosea L.) from Sweden,
Greenland and Faroe Islands
Madeleine Kylin
Photographer Svein Solberg (NordGen Picture Archive, image 004672)
Master´s thesis in Biology • 30 HEC • Advanced E MSc in Horticulture programme • Självständigt arbete vid LTJ-fakulteten, SLU
Alnarp 2010

2
3
Genetic diversity of Roseroot (Rhodiola rosea L.) from Sweden,
Greenland and Faroe Islands
Madeleine Kylin
Supervisor: Li-Hua Zhu, Swedish University of Agricultural Sciences,
Plant Breeding and Biotechnology
Assistant Supervisor: Svein Oivind Solberg, NordGen,
Plants Senior Scientist
Mulatu Gelata, SLU,
Plant Breeding and Biotechnology
Examiner: Björn Salomon, SLU,
Plant Breeding and Biotechnology
Supervisor: Li-Hua Zhu, Associate Professor, Swedish University of Agricul-
tural Sciences,
Plant Breeding and Biotechnology
Assistant Supervisor: Svein Oivind Solberg, NordGen,
Plants, PhD Senior Scientist
Mulatu Geleta, Swedish University of Agricultural Sciences,
Plant Breeding and Biotechnology
Examiner: Björn Salomon, Associate Professor, Swedish University of
Agricultural Sciences,
Plant Breeding and Biotechnology
Credits: 30 hec
Level: Advanced E
Course title: Degree Project for MSc Thesis in Horticulture
Subject: Biology
Course code: EX0544
Programme/education: MSc in Horticulture programme
Place of publication: Alnarp
Year of publication: 2010
Title of series: Självständigt arbete vid LTJ-fakulteten, SLU
Online publication: http://stud.epsilon.slu.se
Key Words: Rhodiola rosea, genetic diversity, microsatellites, SSR, inter-simple sequence
repeat, ISSR,
Swedish University of Agricultural Sciences
The Faculty of landscape Planning, Horticulture and Agriculture Science
Plant Breeding and Biotechnology

4
5
Abstract
Roseroot (R. rosea L.) has gained more attention the last years, mainly because of its phy-
topharmacologic properties. Even though many reports in roseroot have been published,
only a few articles are dealt with the genetic diversity.
The Nordic Genetic Resource Center has collected Roseroot material from Sweden,
Greenland and Faroe Islands under different expeditions. The samples were analysed to
study the genetic diversity study. Such studies would facilitate The Nordic Genetic Re-
source Center (NordGen) in conservation of roseroot in its gene bank.
In this study, the roseroot materials collected in the NGB were analysed using two dif-
ferent DNA marker methods, microsatellites (SSR) and inter simple sequence repeats
(ISSR) for evaluating the genetic diversity. PCR products were separated on polyacryla-
mide gels and developed with fast and sensitive silver staining. Gels were read manually
with replications. Co-dominant and dominant marker data were analysed separately using
POPGENE 1.32; and NTSYSpc 2.11.
Four ISSR primers and four SSR primers were studied and resulted in 37 and 12 poly-
morphic bands, respectively. Percentages of polymorphic bands for ISSR markers were for
Sweden 83.78%, Greenland 94.59% and Faroe Islands 48.65%. Only two samples appear
to be clonal material, the rest 89 samples are unique. No gender-specific or population-
specific primers were found.
Key words: roseroot, rhodiola rosea, genetic diversity, microsatellites (SSR), inter-simple
sequence repeat (ISSR)

6
7
Sammanfattning
Rosenrot (R.rosea L.) är en växt som fått mer intresse om sig de senaste åren, mestadels
för dess fytofarmakologiska egenskaper. Även om många artiklar om rosenrot har blivit
publicerade, så är det endast ett fåtal som handlar om dess genetiska diversitet.
Nordiskt Genresurscenter har samlat in material från rosenrot ifrån Sverige, Grönland och
Färöarna under olika expeditioner. Proven blev analyserade för att studera den genetiska
diversiteten. Resultat från en genetisk diversitetsstudie kan hjälpa Nordiskt Genresurscen-
ter i deras bevarandesyfte för sin genbank.
I den här studien har insamlat material från NordGen blivit analyserade av två olika
DNA markör metoder, mikrosatelliter (SSR) och inter simple sequence repeats (ISSR) för
att utvärdera den genetiska diversiten. PCR produkter blev separerade på en polyacryla-
midgel och framkallades med en silvermetod. Gelerna blev avlästa manuellt med replika-
tioner. Co-dominant och dominant markör data blev separat analyserade med hjälp av
POPGENE 1.32; och NTSYSpc 2.11.
Fyra ISSR-primers och fyra SSR-primers blev studerade och resulterade i 37 (ISSR) och
12 polymorfiska band (SSR). Procent av polymorfiska band för ISSR markörer var för
Sverige 83.78%, Grönland 94.59% och Färöarna 48.65%. Bara två prover visade sig vara
klonmaterial, de resterande 89 proverna var unika. Inga könsspecifika eller populations-
specifika primers hittades.
Nyckelord: rosenrot, Rhodiola rosea, genetisk diversitet, mikrosatelliter (SSR), inter-
simple sequence repeat (ISSR), Nordiskt Genresurscenter, NordGen,

8
9
Table of Content
Introduction 12 1.1 Botany ................................................................................................................... 12 1.2 Distribution ............................................................................................................ 13 1.3 Utilisation ............................................................................................................... 13
1.3.1 Traditional use ............................................................................................ 13 1.3.2 Medicinal use .............................................................................................. 15 1.3.3 Market ........................................................................................................ 16
1.4 Rhodiola, an endangered genus ............................................................................. 17 1.4.1 Genetic diversity studies of Rhodiola and R.rosea ........................................ 18
1.5 DNA Markers ......................................................................................................... 19 1.5.1 Types of DNA markers ................................................................................ 20 1.5.2 Microsatellite markers .................................................................................. 20 1.5.3 Inter-simple sequence repeats ..................................................................... 21 1.5.4 Nordic Genetic Resource Center and its roseroot collection .......................... 22
1.6 Objectives .............................................................................................................. 22
2 Material and Methods 24 2.1 Plant Material ......................................................................................................... 24
2.1.1 Swedish plant material................................................................................. 24 2.1.2 Greenlandic plant material ........................................................................... 25 2.1.3 Faroese plant material ................................................................................. 25
2.2 DNA extraction ....................................................................................................... 25 2.3 ISSR...................................................................................................................... 26
2.3.1 ISSR-PCR................................................................................................... 26 2.4 SSR....................................................................................................................... 27
2.4.1 SSR-PCR ................................................................................................... 27 2.5 PAGE analysis of PCR products ............................................................................. 28 2.6 Developing polyacrylamide gels with fast and sensitive silver staining ...................... 28 2.7 Analysing gels and data ......................................................................................... 29
2.7.1 Analysing the gels ....................................................................................... 29 2.7.2 Data analysis .............................................................................................. 29
3 Results and discussion 30 3.1 Methods ................................................................................................................ 30
3.1.1 ISSR ........................................................................................................... 30 3.1.2 SSR ............................................................................................................ 31
3.2 Unique primers for R.rosea ..................................................................................... 33 3.2.1 Gender ....................................................................................................... 33 3.2.2 Population ................................................................................................... 34
3.3 Clone material........................................................................................................ 34 3.4 Future investigations .............................................................................................. 34
4 Conclusion 35
10
Acknowledgements 36
References 37
Appendices 42 Appendix I – Abbreviations .............................................................................................43 Appendix II – Taxonomy and Nomenclature ....................................................................44 Appendix III – Increased amount of published papers of R.rosea......................................46 Appendix VI – Dataset for R.rosea ..................................................................................48 Appendix V – Maps: Collection sites in Sweden ...............................................................52 Appendix VI – Maps: Collecting sites on Greenland .........................................................53 Appendix VII – Maps: Collecting sites on Faroe Islands ...................................................54 Appendix VIII - Protocol for DNA Extraction .....................................................................55 Appendix IX – Protocol for fast and sensitive silver staining..............................................56 Appendix X- Dendrogram................................................................................................57

11
12
Introduction
1.1 Botany
Rhodiola rosea, belonging to the Crassulaceae family, is a succulent and herba-
ceous perennial plant. The plant ranges from 3 to 30 cm in height, (Mossberg &
Stenberg 2003) but is generally around 20-30 cm (Dragland 2005).
The root is spindle-shaped and become thicker at the base, developing into short
rhizomes (Hegi 1963). During autumn, leaves and stems wither, leaving buds on
rhizomes ready to burst in early spring (Dragland 2005). The scale-leaf structure
(Lagerberg, 1947, Tutin 1964, Flora of China 2010) on the thick short rhizome
emits, when wounded, a rosaceous odour (Hegi 1963, Lindman 1964, Nyman
1980, Krok & Almquist 1994, Mossberg & Stenberg 2003, Ljungkvist 2006).
Stalk is erect, thick, and round (Hegi 1963) ranging from 5-35 cm x 2-6 mm
(Tutin 1964) with alternate placed leaves (Tutin 1964, Nyman 1980, Lid 1985).
Leaves are fleshy (Lindman 1964, Nyman 1980, Sandberg & Göthberg 1998,
Mossberg & Stenberg 2003), 0.7-3.5 x 0.5-1.8 cm (Flora of China 2010), orbicu-
lar-ovate to linear-oblong, dentate, without hair or almost waxy (Lagerberg 1947,
Tutin 1964) with a green-bluish colour (Nyman 1980, Mossberg & Stenberg
2003). Leaf-shape is variable depending on geographical location, where observed
leaves in the south are long and narrow but short and broad in the north (Tutin
1964).
Inflorescence is arranged in terminal cymes (Tutin 1964) with flowers usually
being 4-merous (Tutin 1964, Krok & Almquist 1994, Mossberg & Stenberg 2003)
or sometimes 3- or 5-merous (Hegi 1963). The plant is dioecious with male and
female flowers located on different plants, and rarely hermaphroditic (Tutin 1964,
Krok & Almquist 1994, Mossberg & Stenberg 2003) with various features. The
male flowers are larger and prominent during the flowering period (Dragland
2005), June to August (Hegi 1963, Mossberg & Stenberg 2003). Male flowers
13
have a yellow colour with sometimes reddish nuance (Hegi 1963, Lindman 1964,
Sandberg & Göthberg 1998) and a pleasant scent (Mossberg & Stenberg 2003).
Male plants are larger and heavier then female plants (Galambosi et al 2009).
As soon as the female flowers have developed their erect follicles, the attention
is no longer on the male flowers. Each female flower has four red follicles (Lid
1985, Mossberg & Stenberg 2003, Dragland 2005), 6-12 mm long (Hegi 1963).
Seeds are brown with a lanceolate shape (Hegi 1963, Flora of China 2010), 1-1.5
mm (Hegi 1963) to 2 mm long, having wings at one end. Fruits mature in July-
September (Flora of China 2010). Chromosome number is 2n=22 (Lid 1985).
1.2 Distribution
Occurrence of roseroot is usually in mountainous areas at rock ledges, precipices,
tundra, borders of brooks and river banks (Mossberg & Stenberg 2003). In Europe
the plant is distributed in northern Europe and can be found in mountains of cen-
tral Europe, the Pyrenees, Central Italy and Bulgaria (Tutin 1964). According to
GBIF (2010) roseroot occurs in 28 countries in the northern hemisphere including
Italy, Bulgaria, Andorra, Austria, Bulgaria, Denmark, Faroe Islands, Finland,
France, Germany, Greenland, Iceland, Ireland, Italy, Norway including Svalbard
and Jan Mayen, Poland, Romania, Slovakia, Slovenia, Spain, Sweden, Switzerland
and United Kingdom (GBIF 2010). It is also found in Bosnia-Herzegovina and
Czech Republic (Galambosi et al 2007). In North America it occurs in United
States and Canada and in Asia in China, Japan, Mongolia and Russian Federation
(GBIF 2010).
1.3 Utilisation
1.3.1 Traditional use
As traditional medicinal herb, roseroot has been used for several different pur-
poses, such as to increase physical endurance, work productivity, longevity, resis-
tance to high altitude sickness, and to treat fatigue, depression, anaemia, impo-
tence, gastrotestinal ailments, infections and nervous system disorders. It was also
14
used to improve fertility in Georgia, cure tuberculosis and cancer in Mongolia
(Brown et al 2002). In Norway it has been used to prevent hair loss, heal burns,
scurvy, pneumonia and was seen as a diuretic drug (Dragland 2001).
Swedish botanist and physician Carl von Linné stated in his Flora Svecica in
1755 that roseroot was good against headache and had a very pleasant odour. It
was included in the first Swedish Pharmacopeia in 1755, but sources witness of an
earlier use, the Vikings used it to enhance their physical strength and endurance
(Brown et al 2002).
R.rosea has been used for many purposes by arctic people (Källman 1997,
Ljungkvist 2006) mainly as a medicinal plant, but has also been used in domestic
work, as giving wool a greenish colour when cooked together with alum (Nyman
1980).
Norwegians realised early the broad spectra which the plant can be used for.
Roseroot rhizomes was served to the Danish-Norwegian king Kristian IV when he
visited Norway 1599 (Dragland 2001), but no indications have shown that roseroot
was used as food in Norwegian eating habits (Alm 2004). Roseroot was recom-
mended from the Norwegian government in year 1762 to be planted on peat-moss
roofs as a fire protection (Sandberg & Göthberg 1998, Hanelt 2001, Alm 2004).
Norwegians also have a great word treasure concerning roseroot indicated on
many sectors of applications. Many of the names for roseroot have calf in it, e.g.
kalvedans and kalvegror (Alm 2004). These names could derive from the use of
roseroot as forage to calves in early spring when stored winter supply was finished
(Dragland 2001) or as Alm (2004) indicates that the word calf (anatomy) comes
from roseroot.
In other part of the world, roseroot has been used as food. Both rhizomes and
leaves have been used in cooking. The native population of Greenland, the Inuits,
used it as food, as well as the Eskimos of North America and Alaska natives (Alm
2004). Children ate leaves raw and grounded leaves were mixed with the bread
dough (Dragland 2001, Alm 2004) in harsh times (Alm 2004). On south
Greenland roseroot can only be observed where sheep cannot get access to it, since
it is highly appreciated by sheep (Wedelsbäck Bladh et al 2006).
Among ethnic groups in Alaska and Siberia, roseroot was one of the 20 most
used plants. Here, parts of roseroot have been soured, something similar to sauer-
kraut (Källman 1997).
15
1.3.2 Medicinal use
Pharmacological effects
R. rosea is classified as an adaptogen, meaning a plant which is able to adapt its
effect to the body's needs (Hedman 2000, Brown et al 2002). The pharmacological
effects have been studied by Soviets Union since year 1965, and were given to
athletics and cosmonauts (Hedman 2000). It is classified as a medicine in Russia
(Brown et al 2002). Pharmacological effects are said to be antifatigue, anti-stress,
antihypoxic, anticancer, antioxidant, immune enhancing, and sexual stimulating
effects. Roseroot has very low toxicity level and is reported to have few side ef-
fects (Brown et al 2002).
Phytochemistry
Chemical compounds in R.rosea are divided into six groups (Brown et al 2002):
Phenylpropanoids: rosavin, rosin, rosarin
Phenylethanol derivates: salidroside (rhodioloside), tyrosol
Flavanoids: rodiolin, rodionin, rodiosin, acetylrodalgin, tricin
Monoterpernes: rosiridol, rosaridin
Triterpenes: daucosterol, beta-sitosterol
Phenolic acids: chlorogenic and hydroxycinnamic, gallic acids
Interesting chemical constituents for medicinal purposes are the group
phenylethanol derivates and phenylpropanoids (Brown et al 2002) and are mostly
found in rhizomes and roots, therefore are the root parts mostly used for medicinal
production (Dragland 2001). In a study, natural and cultivated roseroot roots in
Finland were compared. Cultivated material was concluded to be better then raw
material from wild populations, even though cultivated material contained lower
percentage of active substances. Advantages weighing over for using cultivated
plant material was that it had less dead root parts and did not have the low fre-
quency of collectable plants in the wild (Galambosi et al 2007). Concentration of
active substances, rosavins and salidroside, from wild growing roseroot, seems to
differ from different regions in Norway. Collected wild plants were planted in
fields so the growing conditions would be the same. Variations were also visible
regarding the morphological appearance (Dragland & Mordal 2006).
16
It is not only R. rosea that contains salidroside in genus of Rhodiola, something
that has lead to using other Rhodiola species as raw material substitute in the
1970s. Since then, scientific investigations have discovered that R. rosea’s chemi-
cal composition differs from other genus in Rhodiola and therefore cannot be re-
placed or substituted by other Rhodiola species. Specific chemical constituents
only found in R.rosea are the group phenylpropanoids, also called rosavins, con-
taining rosavin, rosin and rosarin, and they are nowadays used as chemical marker
for identifying R.rosea raw material. A standardisation used in many human stud-
ies of roseroot substance is a minimum of 3% rosavins and 0.8-1% salidrose
(Brown et al 2002). For further information concerning studies recently made of
pharmacological effects, see Rhodiola rosea: A phytomedicinal overview by
Brown et al 2002.
Unsatisfied pharmacological studies
Blomkvist et al (2009a & 2009b) proved that many of the recent medicinal studies
concerning roseroot substances show considerable inadequacy in the statistical
part. Blomkvist et al (2009) could only find few reports of the considered studies
where good statistical methods had been applied and where the method had been
fully described. They conclude after evaluating the literature of roseroot that a po-
tential adaptogenic effect is yet to be sufficiently documented in a scientifically
satisfying way. Criticism was given to the different paper editors that published
many of the unsatisfying studies in a Swedish newspaper (Blomkvist et al 2009b)
where the criticised scientists replied, without giving any clarification about the
weak methods used in the studies (Larhammar, personal communication, January
21, 2010).
1.3.3 Market
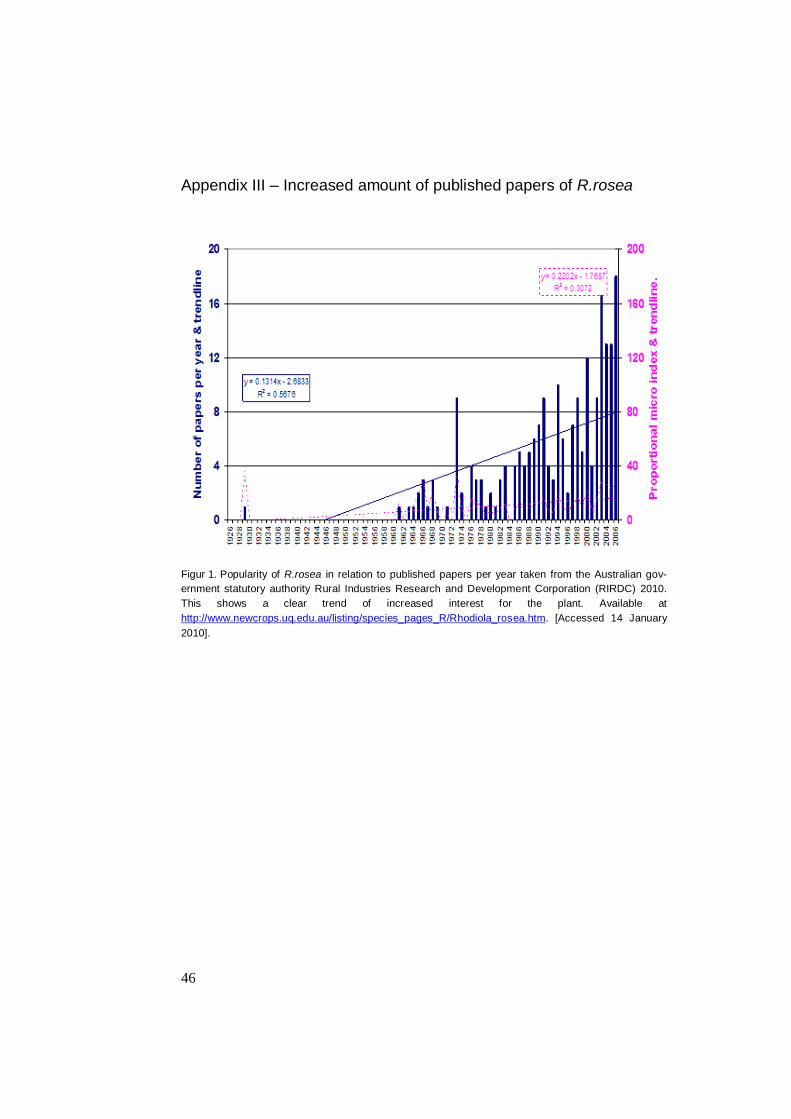
Today, the interest for the plant is great and this can be proved by the amount of
published papers about the medicinal properties (see Appendix III). The market
for roseroot is presumed to reach as high as the market for Ginkgo (Ginkgo biloba)
and Ginseng (Panax spp) and while many scientist claims that roseroot is a better
supplement, there are reasons to believe that the demand of roseroot will increase
more. Perfume industry is interested in Norwegian roseroot (Dragland 2001) and
17
the demand is increasing for wild Norwegian roseroot (Dragland 2005). 46 com-
panies and 30 suppliers use R.rosea in their production worldwide (Ampong-
Nyarko 2005 cited in Galambosi et al 2007). Products made from the plant are
available as either pills, pure alcohol extracts and as combination with other me-
dicinal plants (Galambosi 2006).
1.4 Rhodiola, an endangered genus
The largest population of R.rosea in the world is found in Altai, south Siberia
(Galambosi 2006). Species of Rhodiola has been used in traditional Tibetan medi-
cine for more then 1000 years, but only in small extent by local people. Nowadays
more people are aware of the many beneficial substances found in Rhodiola spe-
cies, which has lead to a higher demand and harvest ratio of natural Rhodiola
populations (Xia et al 2007). Up to now, most of the raw material for production
of roseroot is taken from the natural populations, causing, in many countries, that
the natural populations of roseroot are endangered. Lei et al (2006) report of an
accelerated and uncontrolled use of Rhodiola species during the 1980s in south-
western China to the extent that they are now listed as endangered in whole China
(Lei et al 2006). One example of an endangered species in China is R. sachalinen-
sis, where heavy disturbances by human activities are the main reason for its status
as in danger of extinction (Yan et al 2003). Other factors reported to threaten
Rhodiola is a deforestation of natural habitat and excessive grazing (Xia et al
2007). Galambosi (2006) confide the same pattern is shown in several countries,
among them Russia, where roseroot is nowadays on the Russian Red List and col-
lection is restricted. Despite red listed, estimated quantity of Rhodiola roots ex-
ported from Russia was around 20-30 tons/year (Galambosi 2006). If this quantity
comes from natural populations is unclear. In Europe R.rosea is endangered in
Czech Republic, Bosnia-Herzegovina and vulnerable in Slovakia (Galambosi et al
2007).
Roseroot, as being the only Rhodiola species found in Scandinavia including
Greenland, Faroe Islands and Svalbard (with a few exceptions of R.kirilowii found
in botanical gardens in Sweden) (GBIF 2010), is today not red listed in any of the
Scandinavian countries, except in Västra Götaland County (Länstyrelsen Västra
Götalands län 2010) and Göteborg and Bohuslän counties in Sweden (Mossberg &
18
Rydberg 1995). This might probably be because of the high labour cost of collec-
tion natural populations and difficulties of transport in such an inaccessible area.
The main reason for overexploitation of natural roseroot resources in the alpine
areas is believed to derive from the severe alpine climate it grows in, which leads
to a slow development of the plant (Galambosi et al 2007, Węglarz et al 2008).
Simple solution to this would be cultivating roseroot to produce raw material in
sufficient quantities for industrial purposes (Galambosi et al 2007).
1.4.1 Genetic diversity studies of Rhodiola and R.rosea
Very limited information about the genetic diversity of R. rosea is available
(Elameen et al 2008) and few studies have been carried out concerning genetic
research of the genus Rhodiola (Yan et al 1999, 2003, Xia et al 2005, Lei et al
2006, Yanabaev et al 2007, Xia et al 2007, Elameen et al 2008).
Elameen et al (2008) studied the genetic diversity on R. rosea. This study showed
a wide range of genetic variability in the germplasm collected in Norway. 82.3%
of polymorphic bands were detected among the 97 clones and the genetic similar-
ity ranged from 0.440 to 0.950 with a mean of 0.631 showing no close genetic
similarity among clones related to their original growing county. Further the study
showed a significantly greater variation within regions (92.03%) than among re-
gions (7.97%) and a low level of genetic differentiation (FST=0.043). There was no
finding of a gender-specific marker in the study and the level of genetic diversity
of male, female and hermaphroditic clones was very similar (Elameen et al 2008).
The SSR primers for solely R.rosea were developed to be used for future ge-
netic diversity studies in Italy (Zini et al 2007).
In China, the research has been designated to study the genetic diversity of other
species within the genus Rhodiola. In the case of R. chrysanthemifolia growing in
the Qinghai-Tibet Plateau, Xia et al (2007) found a substantial genetic diversity at
species level (89.7% polymorphic bands). At the population level the percentage
of polymorphic bands (PPB) ranged from 21.97% to 48.8%, and genetic variation
was mainly among populations (77.3%) and only 22.7% occurred among indi-
viduals within populations. This study showed as the one made by Elmeen et al
(2008) that there was no close genetic similarity among clones related to their
original growing location. For R. crenulata from Henduan Mountains Region
(China) the opposite was shown, genetic differentiation is correlated to its geo-
19
graphical distribution. Comparing the genetic diversity within and between popu-
lations was found to be almost equal (Lei et al 2006). In R. angusta the genetic
variability for four populations increased as the altitude was raised (Yan et al
1999).
For R. alsia originating from Tibetan Plateau there was a pronounced genetic
variation at the species level (80%). Genetic diversity was mainly found among
populations (70.3%), and within populations the variation was 29.7% (Xia et al
2005). R. sachalinensis showed similar pattern, genetic differentiation was higher
among populations, followed by within populations (Yan et al 2003). A Russian
study of R.iremelica originating from southern Urals also showed a high genetic
variation at the species level (Yanbaev et al 2007) as for R. alsia and R. chrysan-
themifolia (Xia et al 2005, 2007).
Variation between populations has been proved by studying the essential oils from
the rhizomes of R. crenulata from Tibet and Yunnan in China. Differences in the
two regions were seen by two chemotypes, the first chemotype characterized by
the presence of geraniol as the major compound, while the other having both n-
octanol and geraniol as major compounds (Lei et al 2004).
1.5 DNA Markers
A DNA marker is a sequence of DNA or a gene, which is situated on a chromo-
some (Collard et al 2005, Schulmann 2007). Markers make it possible to detect
differences between individuals by showing polymorphism, and therefore detect-
ing genetic differences between individual organisms or species (Collard et al
2005).
DNA markers are used in many different areas, such as genetic mapping, find-
ing mutant genes which are connected to hereditary diseases, paternal tests, indi-
vidual identification, epidemiology and food safety, population history, population
studies, etc (Hartl & Jones 2005).
The practice in agriculture has since the introduction of DNA makers in the
1980s broaden and simplified both for scientific and commercial uses to reveal
new information about crops, as e.g. disease resistance (Collard et al 2005). Today
many plant breeders use DNA markers to trace and identify desirable traits for
20
crops and other important plants. For some plant researchers, DNA markers are
used to study genetic diversity and construct linkage maps (Schulmann 2007).
There are many advantages of DNA markers compared with morphological and
biochemical markers. For instance, when comparing morphological markers with
DNA markers, the environmental influence can be disregarded with the latter one.
But, if still comparing the two marker groups, the advantage of morphological
markers have over DNA markers is that it does not require a lot of expensive and
often time consuming laboratory work, which is necessary when working with
DNA markers (de Vicente & Fulton 2003).
1.5.1 Types of DNA markers
There are different types of DNA markers available and new methods are continu-
ally being developed. Today, no method is ideal for all applications so scientist
teams must weigh both pros and cons of methods when starting a new project
(Harlt & Jones 2005).
DNA markers are grouped after their different abilities of showing homozygos-
ity (dominant marker) and/or heterozygosity (co-dominant marker) (Hartl 1988,
Hartl & Jones 2005). The most commonly used dominant DNA marker for genetic
diversity in plants are: Random Amplified Polymorphic DNA (RAPD); DNA am-
plification fingerprinting (DAF); Arbitrarily primed polymerase chain reaction
(AP-PCR), Inter-simple sequence repeat (ISSR) and Amplified Fragment Length
Polymorphisms (AFLP), whereas the most used co-dominant markers are: Restric-
tion Fragment Length Polymorphisms (RFLP); Microsatellites (SSR); Sequence-
characterised amplified region (SCAR); Cleaved amplified polymorphic sequence
(CAPS); Expressed sequence tag (EST) and Single-Nucleotide Polymorphism
(SNP) (de Vicente & Fulton 2003). Both dominant and co-dominant markers can
be use to detect DNA polymorphism, which further is used to assess the level of
genetic variation in diverse populations, and can indicate for instance population
history, patterns of migration, and breeding structure (Hartl & Jones 2005).
1.5.2 Microsatellite markers
Microsatellites are short nucleotide tandem repeats of a motif, usually one to six
bases. They are presence in bacterial, fungal, plant, animal and human genomes,
21
and are often referred to simple sequence repeats (SSR). Microsatellites are easy
to amplify and are highly abundant and evenly distributed throughout genome
(Weising et al 2005b), which makes the method highly polymorphic and specific
(Bornet & Branchard 2001). Studies have shown that the most abundant repeated
motifs in plants are (A)n, (AT) n, (GA) n, and (GAA)n (Weising et al 2005a). As
being a co-dominant marker, both homo- and heterozogotes can be detected
(Weising et al 2005b). Nowadays microsatellites are one of the most important
genetic marker for population studies, since they show extensive variation be-
tween individuals and within populations (Coates & Byrne 2005).
The broad spectrum of application for SSR is one of its advantages. SSR are
used for plant breeding, conservation biology and population genetics as forensics,
paternity analysis and gene mapping (Coates & Byrne 2005). The methods require
little amount of DNA, which does not have to be of high quality. Another advan-
tage is the simple interpretation of results (de Vicente & Fulton 2003).
The main disadvantage of SSRs is the requirement of a known sequence to be
amplified (Weising et al 2005b). Developing new microsatellites are time consum-
ing and notably expensive (Coates & Byrne 2005). Another disadvantage is the
phenomena null-alleles, which are nonamplifying alleles and appears frequently.
Null-alleles leave no bands when having homozygousity, but when having het-
erozygousity it leaves one band visual. This will interfere and complicate reading
of data, since it will be registered as a homozygote individual when actually being
a heterozygote. To reduce error due to null alleles, population studies should con-
tain many diverse SSR primers so that different multiple microsatellite loci are
investigated (Weising et al 2005b).
1.5.3 Inter-simple sequence repeats
Inter-simple sequence repeats (ISSRs) are regions found between microsatellite
repeats (Ziętkiewicz et al 1994, Godwin et al 1997, Bornet & Branchard 2001, de
Vincente & Futon 2003). They were developed to overcome the problem of hav-
ing the prior knowledge of genetic sequence, as for SSR (Godwin et al 1997). This
is done by having a primer with a repeat, as (CA)n or (AGC) n with a 3’-achor, re-
sulting in (CA) 8RG or (ACG) 6TY. Sequence amplification will occur in between
two SSRs (Godwin et al 1997), producing multiple loci (Ziętkiewicz et al 1994,
Bornet & Branchard 2001, de Vincente & Futon 2003).
22
ISSR have been used since 1994 for a wide range of organisms (Ziętkiewicz et
al 1994) in DNA fingerprinting, diversity analysis and genome mapping (Godwin
et al 1997, Bornet & Branchard 2001, de Vincente et al 2004). The advantages of
using ISSR is that it is quick, easy to apply, highly reproducible and polymor-
phous and with the most important advantage that no prior information about ge-
nomic sequence is required (Bornet & Branchard 2001).
1.5.4 Nordic Genetic Resource Center and its roseroot collection
The Nordic Genetic Resource Center (NordGen) is responsible for the conserva-
tion and sustainable use of genetic resources of farm animals and cultural plants
within agriculture, horticulture and forestry. The overall collection on NordGen is
today at about 30 000 accessions, the majority being cereals, but also consisting of
accessions of forage, oil, vegetable, and medicinal crops (Ottosson, personal
communications, May 15, 2010).
Current collection of roseroot in NordGen is 108 accessions, originating from
Sweden (23 accessions), Greenland (46 accessions), Finland (13 accessions),
Faroe Islands (21 accessions), and Island (3 accessions). Available is also acces-
sions from Germany (1 accession) and Austria (1 accession).
Collected material from Greenland was made during 2006 under the expedition
ARKPRO, Insamling, odling och nyttjande av Grönländska gräs och medici-
nalväxter för grönländskt bruk, a part project of the climate study, Artic Climate
Impact Assessment (ACIA).
Swedish plant material was collected in the project Spice and medicinal plants
in the Nordic and Baltic countries (SPIMED). The Greenlandic material is only
available for research at NordGen, according to agreements with Greenlandic au-
thorities.
1.6 Objectives
The purpose of this study was to evaluate whether the two different genetic marker
methods, ISSR and SSR, are applicable for analysing the genetic diversity of the
collected materials of R.rosea and to evaluate the genetic diversity of the roseroot
materials collected in NordGen . The results from this study will serve as a base
23
for further genetic diversity studies on R.rosea from Scandinavian countries and
facilitate NordGen to decide which accessions should be kept to maintain suffi-
cient genetic diversity of roseroot in NordGen.
Questions addressed for this study were:
Which SSR and ISSR primers can be applied to R.rosea collected from Swe-
den, Greenland and Faroe Islands?
What is the degree of the genetic diversity of analysed R. rosea?
Are there any gender or population-specific primers for R. rosea?
Are there any clones in the investigated material?
24
2 Material and Methods
Plant material was assembled after their originating country, and each country was
analysed as one population. This decision was based on the way the samples were
collected, and the goal with the different collection expeditions was not to use the
material in a genetic study. In genetics the definition of a population is a group of
individuals who share a common genepool and have the potential to interbreed (de
Vicente et al 2004).
In this project both SSRs and ISSRs markers were chosen. ISSR markers for R.
rosea have been pre-examined in the NordGen laboratory in earlier projects
(Khairullina & Ohlsson, personal communication, January 18, 2010), where dif-
ferent ISSR markers have given polymorphic results. The ISSR markers used have
also shown good results in other reports concerning different species in the genus
of Rhodiola (Xia et al 2005, Lei et al 2006, Xia et al 2007).
Regarding the SSR markers the selected primers specific for R.rosea have been
based on the report by Zini et al (2009).
Both methods have been used considerably in the laboratory of NordGen on
other plant species, e.g. Paeonia (Khairullina & Ohlsson, personal communication,
January 18, 2010).
2.1 Plant Material
2.1.1 Swedish plant material
Of total 91 samples, 24 samples from 20 accessions came from Jämtland County
in Sweden. All Swedish samples came from wild growing plants, except for five
individual samples, which was cross-bred with five parents coming from previous
25
declared county at Alnarp (see appendix IV- Dataset for R.rosea). Swedish sam-
ples were all combined into one population. Collection sites are presented in Ap-
pendix V and all collection sites (including Greenland and Faroe Island collection
sites) are available as a Google map for close-up maps.
2.1.2 Greenlandic plant material
Plant material from Greenland contained 64 samples from 20 accessions. Material
was collected during a field trip to Greenland. The collecting sites were divided
into three areas, South Greenland (Narsaq, Narsarsuaq, Qaqortoq, Brattahlíð),
West Greenland (Nuuk) and East Greenland (Tasiilaq). Collecting sites on South
Greenland was dominated by grassy land, Nuuk was dominated by peat land and
when arriving to Tasiilaq, the snow had already fallen, but could still collect rose-
root. Accessions were collected inside a square metre and material was shipped to
Sweden, Alnarp, where it was cultivated and plant material was prepared for DNA
analysing (Wedelsbäck Bladh et al 2006). Greenlandic samples were all combined
into one population Collection sites are presented in Appendix VI and on Google
maps.
2.1.3 Faroese plant material
In the study three samples from Faroe Islands were included. Chosen samples
were collected sporadically around Faroe Island which is visual in Appendix VII,
and on Google maps.
2.2 DNA extraction
Genomic DNA was previously extracted from leaves year 2007 using a protocol
previously described by Doyle & Doyle (1990) with some modifications (see ap-
pendix VIII- Protocol for DNA Extraction).
26
2.3 ISSR
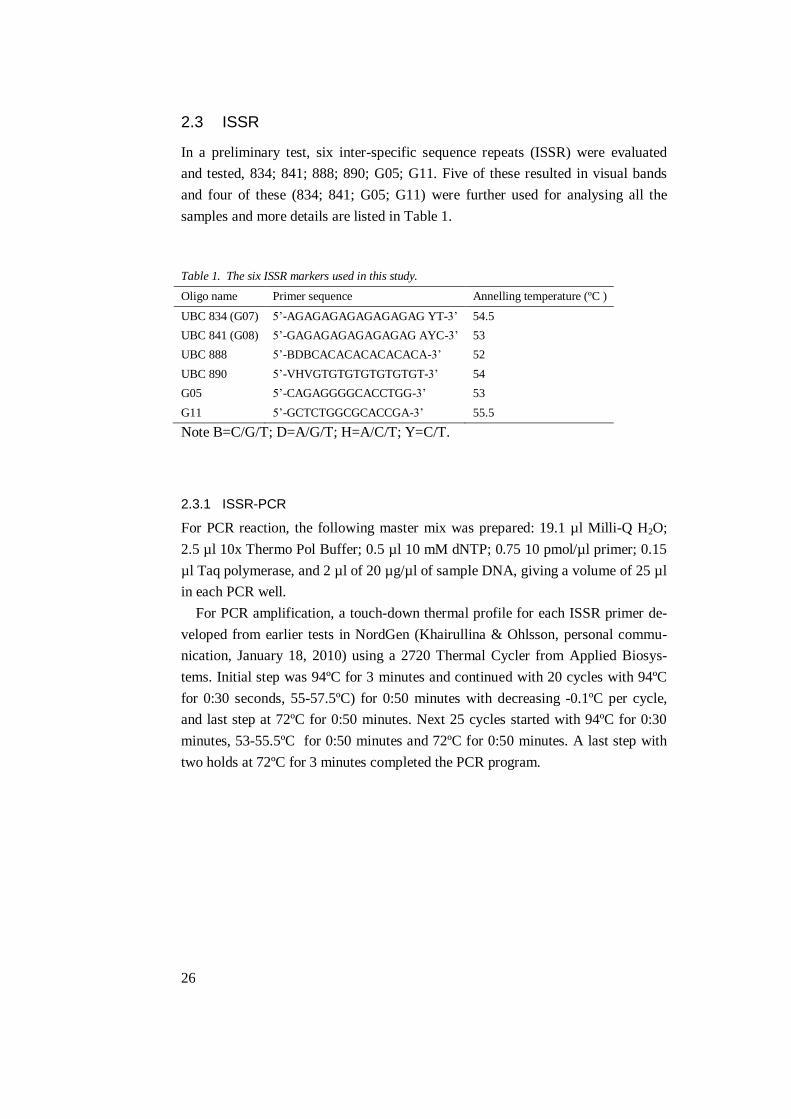
In a preliminary test, six inter-specific sequence repeats (ISSR) were evaluated
and tested, 834; 841; 888; 890; G05; G11. Five of these resulted in visual bands
and four of these (834; 841; G05; G11) were further used for analysing all the
samples and more details are listed in Table 1.
Table 1. The six ISSR markers used in this study.
Oligo name Primer sequence Annelling temperature (ºC )
UBC 834 (G07) 5’-AGAGAGAGAGAGAGAG YT-3’ 54.5
UBC 841 (G08) 5’-GAGAGAGAGAGAGAG AYC-3’ 53
UBC 888 5’-BDBCACACACACACACA-3’ 52
UBC 890 5’-VHVGTGTGTGTGTGTGT-3’ 54
G05 5’-CAGAGGGGCACCTGG-3’ 53
G11 5’-GCTCTGGCGCACCGA-3’ 55.5
Note B=C/G/T; D=A/G/T; H=A/C/T; Y=C/T.
2.3.1 ISSR-PCR
For PCR reaction, the following master mix was prepared: 19.1 µl Milli-Q H2O;
2.5 µl 10x Thermo Pol Buffer; 0.5 µl 10 mM dNTP; 0.75 10 pmol/µl primer; 0.15
µl Taq polymerase, and 2 µl of 20 µg/µl of sample DNA, giving a volume of 25 µl
in each PCR well.
For PCR amplification, a touch-down thermal profile for each ISSR primer de-
veloped from earlier tests in NordGen (Khairullina & Ohlsson, personal commu-
nication, January 18, 2010) using a 2720 Thermal Cycler from Applied Biosys-
tems. Initial step was 94ºC for 3 minutes and continued with 20 cycles with 94ºC
for 0:30 seconds, 55-57.5ºC) for 0:50 minutes with decreasing -0.1ºC per cycle,
and last step at 72ºC for 0:50 minutes. Next 25 cycles started with 94ºC for 0:30
minutes, 53-55.5ºC for 0:50 minutes and 72ºC for 0:50 minutes. A last step with
two holds at 72ºC for 3 minutes completed the PCR program.
27
2.4 SSR
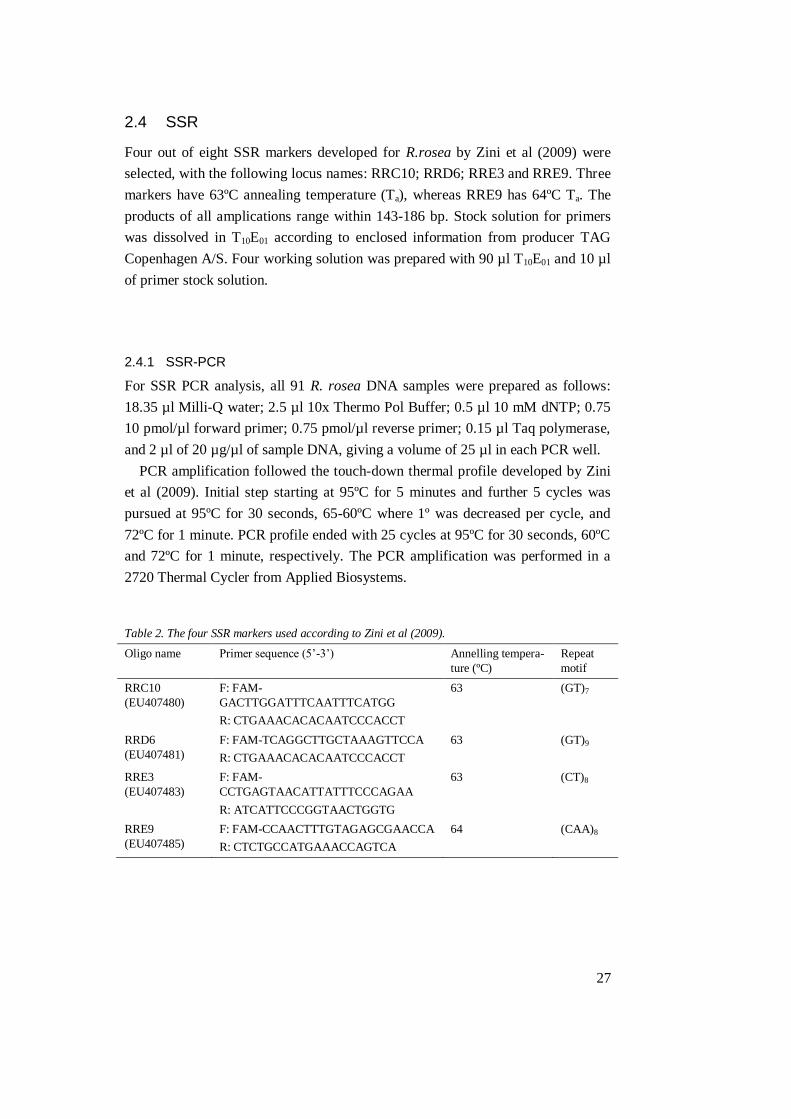
Four out of eight SSR markers developed for R.rosea by Zini et al (2009) were
selected, with the following locus names: RRC10; RRD6; RRE3 and RRE9. Three
markers have 63ºC annealing temperature (Ta), whereas RRE9 has 64ºC Ta. The
products of all amplications range within 143-186 bp. Stock solution for primers
was dissolved in T10E01 according to enclosed information from producer TAG
Copenhagen A/S. Four working solution was prepared with 90 µl T10E01 and 10 µl
of primer stock solution.
2.4.1 SSR-PCR
For SSR PCR analysis, all 91 R. rosea DNA samples were prepared as follows:
18.35 µl Milli-Q water; 2.5 µl 10x Thermo Pol Buffer; 0.5 µl 10 mM dNTP; 0.75
10 pmol/µl forward primer; 0.75 pmol/µl reverse primer; 0.15 µl Taq polymerase,
and 2 µl of 20 µg/µl of sample DNA, giving a volume of 25 µl in each PCR well.
PCR amplification followed the touch-down thermal profile developed by Zini
et al (2009). Initial step starting at 95ºC for 5 minutes and further 5 cycles was
pursued at 95ºC for 30 seconds, 65-60ºC where 1º was decreased per cycle, and
72ºC for 1 minute. PCR profile ended with 25 cycles at 95ºC for 30 seconds, 60ºC
and 72ºC for 1 minute, respectively. The PCR amplification was performed in a
2720 Thermal Cycler from Applied Biosystems.
Table 2. The four SSR markers used according to Zini et al (2009).
Oligo name Primer sequence (5’-3’) Annelling tempera-
ture (ºC)
Repeat
motif
RRC10
(EU407480)
F: FAM-
GACTTGGATTTCAATTTCATGG
R: CTGAAACACACAATCCCACCT
63 (GT)7
RRD6
(EU407481)
F: FAM-TCAGGCTTGCTAAAGTTCCA
R: CTGAAACACACAATCCCACCT
63 (GT)9
RRE3
(EU407483)
F: FAM-
CCTGAGTAACATTATTTCCCAGAA
R: ATCATTCCCGGTAACTGGTG
63 (CT)8
RRE9
(EU407485)
F: FAM-CCAACTTTGTAGAGCGAACCA
R: CTCTGCCATGAAACCAGTCA
64 (CAA)8
28
2.5 PAGE analysis of PCR products
PCR products from the different markers were separated on polyacrylamide gels
(CleanGel 10% 52S from ETC Elektrophorese-Technik GmbH) to visualize poly-
morphism. Every sample from the PCR was prepared by adding 5 µl loading
buffer (20% sucrose, 10% Ficoll, 0.05% Bromephenol blue, 5 M urea and 1 mM
EDTA), centrifuged and followed by mixing for 2 minutes to receive uniformity
with the loading buffer and the samples in the PCR wells. Each well on the gel
was loaded with 7 µl of the dyed samples, leaving one wells on each side which
was loaded with 5 µl of the ladder DNA Molecular Weight Marker V from Roche.
To verify the previous mentioned ladder, an additional DNA ladder from Fermen-
tas (GeneRuler 50bp) was used.
The gels were run for 30 minutes with 310V and increased to 510 V until the
blue dye reached the anode wick (1 hour).
2.6 Developing polyacrylamide gels with fast and sensitive silver staining
For developing gels, fast and sensitive silver staining was used. After electropho-
resis, the gels were transferred into a vessel with 200 ml 0.6% Benzene sulfonic
acid and 24% Ethanol. After 40 minutes the gels was washed with 3x10 minutes in
0.07% Benzene sulfonic acid. The gels were then silvered for 30 minutes in 0.2%
AgNO3, 0.07% Benzene sulfonic acid, 0.05% formalaldehyde and 0.002% Na-
thiosulfate and another 2 minutes in milli-Q water to clean the gels from silver.
For developing, 1-2 minutes appeared to be adequate for PCR products with SSR-
markers, while 3 minutes with an ISSR-marker. Last step was stopping and pre-
serving with 10% acetic acid and 10% glycerol for 30 minutes (see Appendix IX).
This step was repeated and left over night before the gels were dried and analysed.
29
2.7 Analysing gels and data
2.7.1 Analysing the gels
Analysis of the polyacrylamide gels was made manually for both ISSR and SSR
markers, with two replications. Bands on gels made with ISSR markers were
scored as presence (1) or absence (0). Gels with SSR primers were scored for dif-
ferent alleles, including transforming them into presence (1) or absence (0) to be
able to combine the results from the two methods for statistical calculations. The
combined resulting data was calculated as dominant marker data (diploid) for all
statistical analysis.
2.7.2 Data analysis
NTSYSpc 2.11
Numerical Taxonomy System (NTSYSpc), version 2.11, from Applied Biostatics
Inc. (2002), was used to analyse the results obtained from scoring. For measuring
similarity between sample sets, (similarity for qualitative data), Jaccard similarity
coefficient was used (Jaccard 1908).
Cluster analysis was performed with Sequential agglomerative hierarical nested
cluster analysis (SAHN) with unweighted pairgroup method with arithmetic mean
(UPGMA). The output, a dendrogram, from cluster analysis is presented in appen-
dix X - Dendrogram.
POPGENE 1.32
Population Genetic Analysis (POPGENE) version 1.32 (1997) was used to esti-
mate expected (HE) and observed (HO) heterozygosity, deviation from Hardy
Weinberg equilibrium (HWE) and Shannon’s Information Index (I) for co-dominant
data marker (SSR). For dominant marker data (ISSR), POPGENE was used to es-
timate number of polymorphic bands, percentage of polymorphic bands, Nei’s
gene diversity (h*) and Shannon’s Information Index (I).
30
3 Results and discussion
3.1 Methods
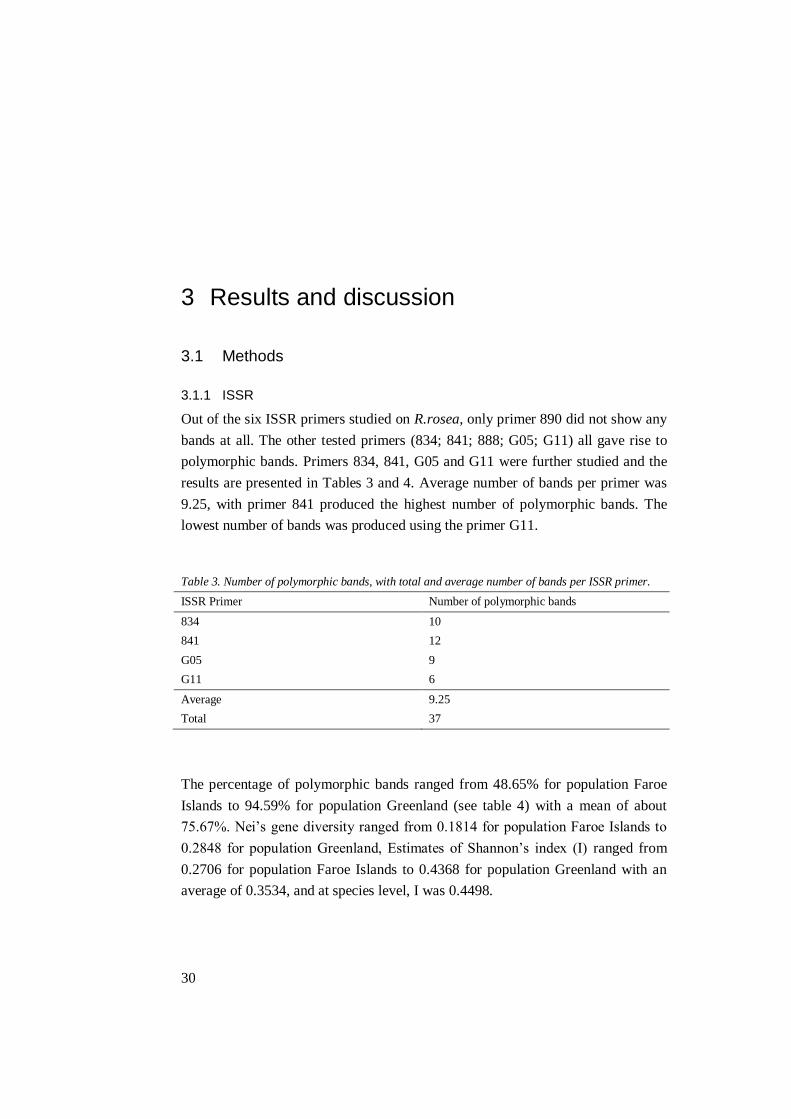
3.1.1 ISSR
Out of the six ISSR primers studied on R.rosea, only primer 890 did not show any
bands at all. The other tested primers (834; 841; 888; G05; G11) all gave rise to
polymorphic bands. Primers 834, 841, G05 and G11 were further studied and the
results are presented in Tables 3 and 4. Average number of bands per primer was
9.25, with primer 841 produced the highest number of polymorphic bands. The
lowest number of bands was produced using the primer G11.
Table 3. Number of polymorphic bands, with total and average number of bands per ISSR primer.
ISSR Primer Number of polymorphic bands
834 10
841 12
G05 9
G11 6
Average 9.25
Total 37
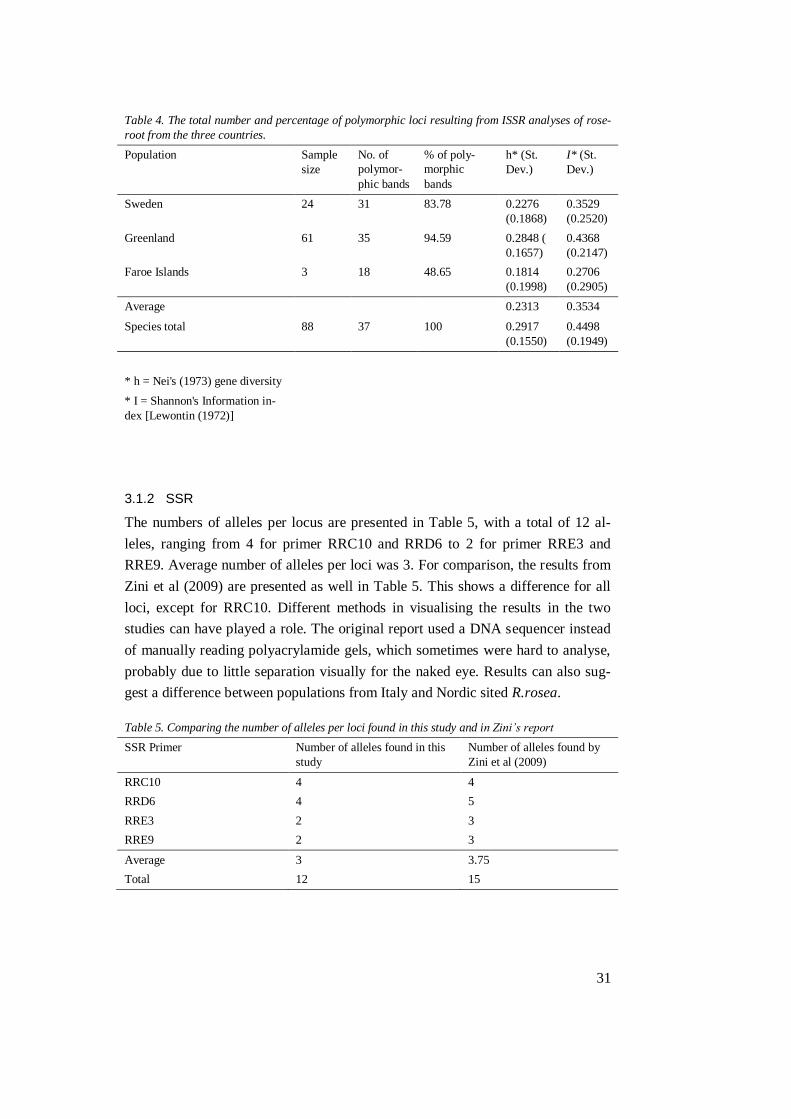
The percentage of polymorphic bands ranged from 48.65% for population Faroe
Islands to 94.59% for population Greenland (see table 4) with a mean of about
75.67%. Nei’s gene diversity ranged from 0.1814 for population Faroe Islands to
0.2848 for population Greenland, Estimates of Shannon’s index (I) ranged from
0.2706 for population Faroe Islands to 0.4368 for population Greenland with an
average of 0.3534, and at species level, I was 0.4498.
31
Table 4. The total number and percentage of polymorphic loci resulting from ISSR analyses of rose-
root from the three countries.
Population Sample
size
No. of
polymor-
phic bands
% of poly-
morphic
bands
h* (St.
Dev.)
I* (St.
Dev.)
Sweden 24 31 83.78 0.2276
(0.1868)
0.3529
(0.2520)
Greenland 61 35 94.59 0.2848 (
0.1657)
0.4368
(0.2147)
Faroe Islands 3 18 48.65 0.1814
(0.1998)
0.2706
(0.2905)
Average 0.2313 0.3534
Species total 88 37 100 0.2917
(0.1550)
0.4498
(0.1949)
* h = Nei's (1973) gene diversity
* I = Shannon's Information in-
dex [Lewontin (1972)]
3.1.2 SSR
The numbers of alleles per locus are presented in Table 5, with a total of 12 al-
leles, ranging from 4 for primer RRC10 and RRD6 to 2 for primer RRE3 and
RRE9. Average number of alleles per loci was 3. For comparison, the results from
Zini et al (2009) are presented as well in Table 5. This shows a difference for all
loci, except for RRC10. Different methods in visualising the results in the two
studies can have played a role. The original report used a DNA sequencer instead
of manually reading polyacrylamide gels, which sometimes were hard to analyse,
probably due to little separation visually for the naked eye. Results can also sug-
gest a difference between populations from Italy and Nordic sited R.rosea.
Table 5. Comparing the number of alleles per loci found in this study and in Zini’s report
SSR Primer Number of alleles found in this
study
Number of alleles found by
Zini et al (2009)
RRC10 4 4
RRD6 4 5
RRE3 2 3
RRE9 2 3
Average 3 3.75
Total 12 15
32
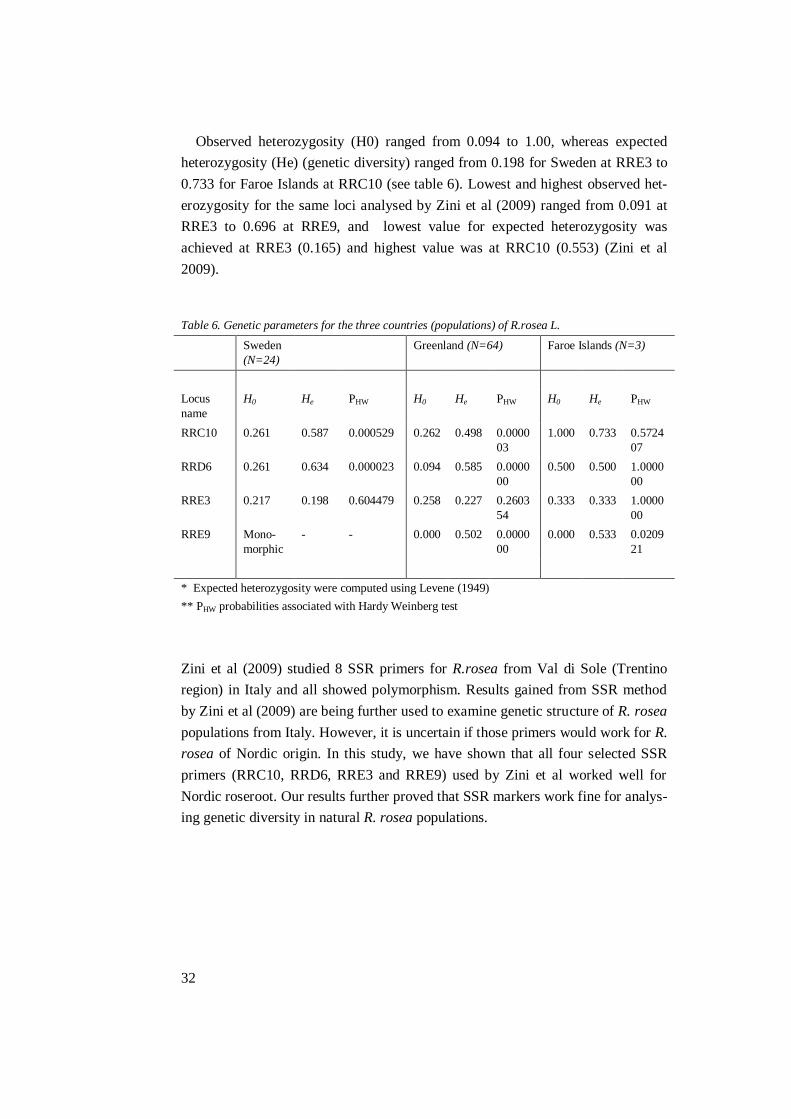
Observed heterozygosity (H0) ranged from 0.094 to 1.00, whereas expected
heterozygosity (He) (genetic diversity) ranged from 0.198 for Sweden at RRE3 to
0.733 for Faroe Islands at RRC10 (see table 6). Lowest and highest observed het-
erozygosity for the same loci analysed by Zini et al (2009) ranged from 0.091 at
RRE3 to 0.696 at RRE9, and lowest value for expected heterozygosity was
achieved at RRE3 (0.165) and highest value was at RRC10 (0.553) (Zini et al
2009).
Table 6. Genetic parameters for the three countries (populations) of R.rosea L.
Sweden
(N=24)
Greenland (N=64) Faroe Islands (N=3)
Locus
name
H0 He PHW H0 He PHW H0 He PHW
RRC10 0.261 0.587 0.000529 0.262 0.498 0.0000
03
1.000 0.733 0.5724
07
RRD6 0.261 0.634 0.000023 0.094 0.585 0.0000
00
0.500 0.500 1.0000
00
RRE3 0.217 0.198 0.604479 0.258 0.227 0.2603
54
0.333 0.333 1.0000
00
RRE9 Mono-
morphic
- - 0.000 0.502 0.0000
00
0.000 0.533 0.0209
21
* Expected heterozygosity were computed using Levene (1949)
** PHW probabilities associated with Hardy Weinberg test
Zini et al (2009) studied 8 SSR primers for R.rosea from Val di Sole (Trentino
region) in Italy and all showed polymorphism. Results gained from SSR method
by Zini et al (2009) are being further used to examine genetic structure of R. rosea
populations from Italy. However, it is uncertain if those primers would work for R.
rosea of Nordic origin. In this study, we have shown that all four selected SSR
primers (RRC10, RRD6, RRE3 and RRE9) used by Zini et al worked well for
Nordic roseroot. Our results further proved that SSR markers work fine for analys-
ing genetic diversity in natural R. rosea populations.
33
This study shows that both SSR and ISSR methods work well for analysing the
genetic diversity of R. rosea. Both methods could be used for detecting and ana-
lysing genetic diversity. Genetic studies of Roseroot using AFLP gave also good
results (Elameen et al 2008). Evaluating which method that could be better suit-
able for R.rosea is not possible, because the low amount of analysed loci (4) as the
case with microsatellites.
Up to now, there are no published reports concerning ISSR method for analys-
ing the genetic diversity of R. rosea. However, ISSR markers have been tested in
R.crenulata (Lei et al 2006), R.chrysanthemifolia (Xia et al 2007), and R.alsia
(Xia et al 2005) and showed polymorphism. In this study, primers 834, 841, G05,
and G11 gave polymorphic bands. Tested primers for R.crenulata,
R.chrysanthemifolia and R.alsia could be of interest for further genetic studies of
R. rosea.
Manual scoring of gels in this study may affect the accurate judgement of bands
since the band density was influenced by many elements, such as developing time
of gels, optimising PCR programme, loading uneven on gels, time for loading
gels, tired eyes when scoring gels, etc,. It would be interesting to confirm these
results by performing sequencing.
3.2 Unique primers for R.rosea
3.2.1 Gender
Eight studied samples were labelled after its gender, four female and four male.
However, studies on gels did not show any specific bands due to gender, implicat-
ing no gender-specific primers for ISSR and SSR were found in this study. The
negative outcome was also reported by Elameen et al (2008) using AFLP method.
They did not find gender-specific primers, and UPGMA cluster analysis did not
group the clones into gender-based clusters. The amount of active substances in
roots from female and male plants was also found to be similar, even if the root of
female plants had a higher dry weight (Galambosi et al 2009). Finding a gender-
specific primer could therefore be rather marginal for industry regarding extract
from Roseroot, but such a finding is still important for breeding purposes and sci-
entific studies. Hence, the search for gender-specific primers should proceed.
34
3.2.2 Population
There was no marker present in one population but absent in other, indication that
no population-specific primers were found with the tested ISSR primers.
3.3 Clone material
Even when many samples came from the same accession, there could not be seen
any indications of clonal material in the investigated material, except within the
accession 18411 (samples 18411_3 and 18411_4) from Greenland. No clone mate-
rial was found among the 20 Swedish and 3 Faroese accessions, indicating that no
material should be discarded. These results are visualised in the dendrogram (ap-
pendix X - dendrogram) and are based on both dominate data from ISSR and con-
verted SSR results.
3.4 Future investigations
Suggestions for future investigations considering R.rosea from Scandinavia coun-
tries could be a combined project where genetic diversity, gender, geographical
location and active substances would be evaluated together. Efforts of finding
gender- and population specific primers should continue. A careful collecting
process could also be on the agenda.
35
4 Conclusion
This study shows that both SSR and ISSR methods work well for analysing the
genetic diversity of R. rosea. The ISSR primers 834, 841, G05 and G11 gave good
result for R. rosea. Percentages of polymorphic bands were for Sweden 83.78%,
Greenland 94.59% and Faroe Islands 48.65%. SSR primers RRC10, RRD6, RRE3,
and RRE9 worked as well on R. rosea samples from Sweden, Greenland and
Faroe Islands. No gender-specific primer was found, nor a population-specific
primer. There was no clone material revealed, except for one accession from
Greenland.
36
Acknowledgements
For this project I have many persons to thank. I am truly grateful for getting the
opportunity to do my thesis at NordGen. The warm welcome that I received from
the lovely staff at NordGen: Thank you all! I owe a larger thank to Alfia Khairul-
lina, who helped me in the lab with this project and always took time to answer
my 1000 daily questions. To Pia Ohlsson, for your great support and for giving a
helping hand whenever needed. Both of you, thank you for letting me share work-
ing-station with you and I can honestly say that I would not have managed so well
without the two of you. Further NordGen tributes to Director Jessica Kathle and
section leader for Plants Morten Rasmussen, for giving me the opportunity;
Fredrik Ottosson, for always taking time for thoughtful reflections; Lena Ma-
bande, for helping me with superior articles and optimising tricky laboratory
works; Simon Jeppson, who helped me making the maps in this project; Malin
Dörre, for keeping me on the right track; Gert Poulsen, for the help with difficult
laboratory problems; Agnese Kolodinska Brantestam, for taking time to read and
giving thoughtful notes; Magnus Göransson; for being a phenomenal lab-partner;
Erik Persson, for introducing me to NordGen, and of course, large thanks to my
trustful supervisor Senior Scientist at NordGen, Svein Solberg.
Huge gratitude to my other supervisor, Li-Hua Zhu, who have the gift of making
everything sound interesting and that nothing is impossible. Thanks to Mulatu Ge-
leta Dida, my assistant supervisor, for helping me with confusing statistics and
laboratory work. Thanks to Björn Salomon, for being my examiner.
My thanks also go to my friends and fellow students, Elin Bengtsson, Anna Eriks-
son, Anna Holmkvist, Jennifer Sandström, Carin Stenberg (Emanuelsson), and
Anna Thynell!
Finally, loving thanks to my supportive Mother and Father, and my much loved
Paul Mittelstädt. And to my Sister, you who made it all possible.
37
References
Alm, T., 2004. Ethnobotany of Rhodiola rosea (Crassulaceae) in Norway. SIDA, 21(1), pp. 321-344.
Applied Biostatistics Inc,. 2002. NTSYSpc 2.11.
Balding, D.J., 2006. A tutorial on statistical methods for population association studies. Nature Re-
views Genetics, 7(10), pp. 781-791.
Balloux, F., & Lugon-Moulin, N., 2002. The estimation of population differentiation with microsa-
tellite markers. Molecular Ecology, 11(2), pp. 155-165.
Blomkvist, J., Taube, A. & Larhammar, D., 2009a. Perspective on Roseroot (Rhodiola rosea)
Studies. Planta Med, 75(11), pp. 1187-90.
Blomkvist, J., Taube, A. & Larhammar, D., 2009b. Storsäljande hälsopiller saknar bevisad effekt.
DN Debatt. Dagens Nyheter, [Online] 9 June. Available at: http://www.dn.se/debatt/storsaljande-
halsopiller-saknar-bevisad-effekt-1.887414 [Accessed 21 January 2010].
Bornet, B. & Branchard, M., 2001. Nonanchored inter simple sequence repeat (ISSR) markers:
Reproducible and specific tools for genome fingerprinting. Plant Molecular Biology Reporter,
19(3), pp. 209-215.
Brown, R.P., Gerbarg, P., & Ramazanov, Z., 2002. Rhodiola rosea: A hytomedicinal overview.
HerbalGram, [Online] 56, pp. 40-52. Available at:
http://cms.herbalgram.org/herbalgram/issue56/article2333.html [Accessed 12 February 2010].
Coetes, D.J. & Byrne, M., 2005. Genetic variation in plant populations. In Henry, R.J, ed. Plant
diversity and Evolutions- Genotypic and phenotypic variation in higher plants. Wallingford, Ox-
fordshire, UK: CABI Publishing. Ch. 9, pp. 139-164.
Collard, B.C.Y., Jahufer, M.Z.Z. & Pang, E.C.K., 2005. An introduction to markers, quantitative
trait loci (QTL) mapping and marker-assissted selection for crop improvement: The basic con-
cepts. Euphytica, 142(1-2), pp. 169-196.
de Vicente, M.C., & Fulton T., 2003. Using molecular marker technology in studies
on plant genetic diversity. [Online] IPGRI, Rome, Italy and Institute for
Genetic Diversity, Ithaca, New York, USA. Available at:
http://www2.bioversityinternational.org/Publications/Molecular_Markers_Volume_1_en/index.as
p [Accessed 4 May 2010].
de Vicente, M.C., López, C., & Fulton T., 2004. Genetic Diversity Analysis with Molecular Marker
Data: Learning Module. [Online] IPGRI, Rome, Italy and Institute for Genetic Diversity, Ithaca,
New York, USA. Available at:
http://www.bioversityinternational.org/publications/molecular_markers_module_volume_2_en.ht
ml [Accessed 4 May 2010].
Doyle, J.J. & Doyle, J.L., 1990. Isolation of plant DNA from fresh tissue. Focus 12:13-15.
38
Dragland, S., 2001. ROSENROT, botanikk, innholdsstoff, dyrkning og bruk- En litteraturoversikt.
Nes på Hedmark: Planteforsk Apelsvoll forskningssenter.
Dragland, S., 2005. Rosenrot, - en ny økonomisk mulighet for norsk landbruk. Grønn kunnskap,
9(4), pp. 210-215.
Dragland, S., & Mordal, R., 2006. Variasjoner I rosenrot (Rhodiola rosea) fra 97 steder i Norge.
Bioforsk TEMA, 1(47).
Flora of China, 2010. Rhodiola rosea. [Online] Available at:
http://www.efloras.org/florataxon.aspx?flora_id=2&taxon_id=200009865 [Accessed 21 January
2010].
Elameen, A., Klemsdal, S.S., Dragland, S., Fjellheim, S. & Rognli, O.A., 2008. Genetic diversity
in a germplasm collection of roseroot (Rhodiola rosea) in Norway studied by AFPL. Biochemical
Systematics and Ecology, 36(-), pp. 706-715.
EURISCO, 2010. Catalogue, http://eurisco.ecpgr.org, date of data consultation (2010-04-05).
Galambosi, B., 2006. Demand and availability of Rhodiola rosea L. in raw material. In R.J. Bogers,
L.E. Craker and D. Lange, eds. Medicinal and Aromatic Plants. Netherland: Springer. Ch. 16, pp.
223-236.
Galambosi, B., Galambosi, Zs. & Slacanin, I., 2007. Comparison of natural and cultivated roseroot
(Rhodiola rosea L.) roots in Finland. Zeitschrift für Arznei- und Gewürzpflanzen, 12(3), pp. 141-
147.
Galambosi, B., Galambosi, Z., Uusitalo, M. & Heinonen, A., 2009. Effects of plant sex on the
biomass production and secondary metabolites in roseroot (Rhodiola rosea L.) from the aspect of
cultivation. Zeitschrift für Arznei- und Gewürzpflanzen, 14(3), pp. 114-121.
GBIF 2010. Biodiversity occurrence data provided by Global Biodiversity Information Facility.
[Online] Available at:
http://data.gbif.org/occurrences/searchCountries.htm?c[0].s=20&c[0].p=0&c[0].o=13784738
[Accessed 28 May 2010].
Godwin, I.D., Aitken, E.A.B., Smith, L.W., 1997. Application of inter simple sequence repeat
(ISSR) markers to plant genetics. Electrophoresis, 18(9), pp. 1524-1528.
Hanelt, P., 2001. Mansfeld's encyclopedia of agricultural and horticultural crops. Berlin: Springer.
pp. 412-413.
Hartl, D.L., 1988. Genetic variation. In A primer of population genetics. 2nd ed. Massachusetts:
Sinauer Associates. Ch. 1. pp. 1-67.
Hartl, D.L. & Jones, E.W., 2005. DNA Structure and DNA manipulation. In Genetics: analysis of
genes and genomes. 5th ed. Sudbury: Jones and Bartlett Pub. Ch. 2 pp. 36-85.
Hedman, S., 2000. Rosenrot: nordens mirakelört. Borgholm: Mika.
Hegi, G., 1963. Illustrierte Flora von Mitteleuropa. pp. 526-528.
Jaccard, P. 1908. Nouvelles rescherches sur la distribution florale. Bull. Soc. Vaud. Sci. Nat.,
44:223-270.
Krok, T. & Almqvist S., 1994. Svensk flora: Fanerogamer och ormbunksväxter. 28th ed. Stock-
holm: Liber AB. p. 320.
Källman, S., 1997. Vilda växter som mat & medicin. Västerås: Ica. pp.
Lagerberg, T., 1947. Vilda växter i Norden. 2nd ed. Stockholm: Natur & Kultur. pp.783-785.
Lei, Y., Nan, P., Tsering, T., Wang, L., Liu, S. & Zhong, Y., 2004. Interpopulation variability of
rhizome essential oils in Rhodiola crenulata from Tibet and Yunnan, China. Biochemical Sys-
tematics and Ecology, 32(-), pp. 611-614.
39
Lei, Y., Gao, H., Tsering, T., Shi, S. & Zhong, Y., 2006. Determination of genetic variation in
Rhodiola crenulata from the Hengduan Mountains Region, China using inter-simple sequence
repeats. Genetics and Molecular Biology, 29(2), pp. 339-344.
Lid, J., 1985. Norsk, svensk, finsk flora. Oslo: Norske Samlaget. p. 210.
Lindman, C.A.M., 1964. Nordens flora. Band II. Stockholm: Wahlström & Widstrand. pp. 255-257.
Ljungkvist, K., 2006. Nyttans växter: uppslagsbok med över tusen växter: historik om svensk medi-
cinalväxtodling. Dals Rostock: Calluna Förlag. p. 351.
Länsstyrelsen Västra Götalands län, 2010. Fridlysta arter i Västra Götalands län. [Online] Avail-
able at:
http://www5.o.lst.se/projekt/frida/artressv.asp?txtSvNamn=rhodiola&s%F6kknapp.x=0&s%F6kk
napp.y=0 [Accessed 27 May 2010].
Mossberg, B. & Rydberg, H., 1995. Alla Sveriges fridlysta växter. Växsjö: Wahlströms & Wid-
strand, Naturskyddsföreningen. p. 45.
Mossberg, B. & Stenberg, L., 2003. Den nya nordiska floran. Stockholm: Wahlström & Widstrand.
p. 248.
Nyman, C.F., 1980. Svenska växternas naturhistoria. Stockholm: Gidlund. pp. 22-23.
Powell, W., Morgante, M., Andre, C., Hanafey, M., Vogel, J., Tingey, S., & Rafalski, A., 1996.
The comparison of RFLP, RAPD, AFLP and SSR (microsatellite) markers for germplasm analy-
sis. Molecular breeding, 2(-), pp. 225-238.
Sandberg, F., & Göthberg, G., 1998. Örtmedicin och växtmagi. Stockholm: Det bästa. p. 233.
Schulmann, A.H., 2007. Molecular markers to assess genetic diversity. Euphytica, 158(3), pp.
313-321.
Selkoe, K.A., & Toonen, R.J., 2006. Microsatellites for ecologists: a practical guide to using and
evaluating microsatellite markers. Ecology Letters, 9(5), pp. 615-29.
Tutin, T.G., 1964. Flora Europaea. Cambridge: Cambridge University Press. p. 363.
von Linné, C., 1986. Svensk flora: Flora Svecica. 1st ed. Stockholm: Forum. p. 316.
Wedelsbäck Bladh, K., Asdal, Å., Bondo, L., Olsson, K., Jönsson, H.A. & Rassmusen, M.C.,
2006. Insamling, odling och nyttjade av Grönländska gräs och medicinalväxter för grönländskt
bruk. Rapport från Grönlandsexpeditionen ARKPRO 2006. Nordic Gene Bank (now Nordic Ge-
netic Resource Center), Alnarp, Sweden.
Węglarz, Z., Przybył, J.L. & Geszprych, A., 2008. Roseroot (Rhodiola rosea L.): Effect of Internal
and External Factors on Accumulating of biologically active compounds. In Ramawat, K.G. &
Mérillon J.M, eds.Bioactive Molecules and Medicinal Plants. Berlin, Heidelberg: Springer Berlin
Heidelberg. Ch. 16, pp. 297- 315.
Weising, K., Nybom, H., Wolff, K. & Kahl, G., 2005a. Repetitive DNA. In DNA fingerprinting in
plants: principles, methods, and applications. 2. ed. Boca Raton, FL: Taylor & Francis. Ch. 1, pp.
1-20.
Weising, K., Nybom, H., Wolff, K. & Kahl, G., 2005b. Detecting DNA variation by molecular
markers. In DNA fingerprinting in plants: principles, methods, and applications. 2. ed. Boca
Raton, FL: Taylor & Francis. Ch. 2, pp. 21-74.
Yan, T-F., Zhou, F-J, Yan, X-F, Zu, Y-G., 1999. Genetic diversity and population differentiation
of Rhodiola angusta. Bulletin of botanical research, [Online] 19(-). Abstract from CNKI Journals
database.Available at: http://en.cnki.com.cn/Article_en/CJFDTOTAL-MBZW902.013.htm [Ac-
cessed 28 May 2010].
Yan, T-F., Zu, Y-G., Yan, X-F. & Zhou, F-J., 2003. Genetic structure of endangered Rhodiola
sachalinensis. Conservation Genetics, 4(2), pp. 213-218.
40
Yanbaev, Y.A., Bairamgulov, N.R., Redkina, N.N., & Mullagulov, R.Y., 2007. Differentation
among Populations of the Rhodiola iremelica Borris. (Grassulaceae) in the Southern Urals. Rus-
sian Journal of Genetics, 43(11), pp. 1314-1318.
Yeh, F.C, Yang, R-C., Boyle, T.B.J., Ye, Z-H., & Mao, J.X., 1997. POPGENE, the user-friendly
shareware for population genetic analysis. Molecular Biology and Biotechnology Centre, Univer-
sity of Alberta, Canada.
Xia, T., Chen, S., Chen, S. & Ge, X., 2005. Genetic Variation Within and Among Populations of
Rhodiola alsia (Crassulaceae) Native to the Tibetan Plateau as Detected by ISSR Markers. Bio-
chemical Genetics, 43(3-4), pp. 87-101.
Xia, T., Chen, S., Chen, S., Zhang, D., Zhang, D., Gao, Q. & Ge, X., 2007. ISSR analysis of ge-
netic diversity of the Qinghai-Tibet Plateau endemic Rhodiola chrysanthemifolia (Crassulacea).
Biochemical Systematics and Ecology 35(-), pp. 209-214.
Zander, R., 2000. Handwörterbuch der Pflanzennamen, 16th ed. Stuttgart: Ulmer. p. 640.
Ziętkiewicz, E., Rafalski, A. & Labuda, D., 1994. Genome fingerprinting by simple sequence re-
peats (SSR)-anchored polymerase chain reaction amplification. Genomics, 20(2), pp. 176-83.
Zini, E., Clamer, M., Passerotti, S., Vender, C., Vendramin, G.G, Komjanc, M., 2009. Eight
novel microsatellite DNA markers in Rhodiola rosea L. Conservation Genetics, 10(5), pp. 1397-
1399.

41

42
Appendices
43
Appendix I – Abbreviations
ACIA Artic Climate Impact Assessment
AFLP Amplified Fragment Length Polymorphisms
AP-PCR Arbitrarily Primed Polymerase Chain Reaction
bp Base Pair
CAPS Cleaved Amplified Polymorphic Sequence
DAF DNA amplification fingerprinting
EST Expressed Sequence Tag
GBIF Global Biodiveristy Information Facility
ISSR Inter Simple Sequence Repeats
NGB Nordic Gene Bank
NordGen Nordic Genetic Resource Center
NTSYSpc Numerical Taxonomy SYStem
PCR Polymerase Chain Reaction
PPB Percentage of Polymorphic Bands
RADP Random Amplified Polymorphic DNA
RFLP Restriction Fragment Length Polymorphisms
SAHN Sequential Agglomerative Hierarical Nested cluster analysis
SCAR Sequence-Characterised Amplified Region
SLU Swedish University of Agricultural Sciences
SNP Single-Nucleotide Polymorphism
SPIMED Spice and medicinal plants in the Nordic and Baltic countries
SSR Simple Sequence Repeats (Microsatellites)
STS Sequence-Tagged Sites
Ta Annealing Temperature
UPGMA Unweighted Pair Group Method with Arithmetic mean
44
Appendix II – Taxonomy and Nomenclature
Classification:
Kingdom: Plantae
Phylum: Magnoliophyta
Class: Magnoliopsida
Order: Rosales
Family: Crassulaceae
Genus: Rhodiola
Species: Rhodiola rosea L. (1753).
Synonyms:
Sedum rosea (L.) Scop. (1771).
Sedum rhodiola DC.
Rhodiola roanensis,
Sedum rosea var. roanense
Subspecies:
Rhodiola rosea subsp. arctica
Rhodiola rosea subsp. atropurpurea
Rhodiola rosea subsp. borealis
Rhodiola rosea subsp. elongata
Rhodiola rosea subsp. integrifolia
Rhodiola rosea subsp. krivochizhinii
Rhodiola rosea subsp. neomexicana
Rhodiola rosea subsp. polygama
Rhodiola rosea subsp. roanensis
Rhodiola rosea subsp. rosea
Rhodiola rosea subsp. sachalinensis
Rhodiola rosea subsp. tachiroi
Common names:
English: Roseroot, artic root, golden root, roseroot stonecrop

45
German: Rosenwurz
Swedish: Rosenrot
Norwegian: Rosenrot
Samí: Galbberáhta
Danish: Rosenrod
Finnish: Ruusujuuri
Icelandic: Burnirót, Svæfla
Russian: Zolotoj koren, rodiola rozovaja
Japanese: Iwa-benkei
46
Appendix III – Increased amount of published papers of R.rosea
Figur 1. Popularity of R.rosea in relation to published papers per year taken from the Australian gov-
ernment statutory authority Rural Industries Research and Development Corporation (RIRDC) 2010.
This shows a clear trend of increased interest for the plant. Available at
http://www.newcrops.uq.edu.au/listing/species_pages_R/Rhodiola_rosea.htm. [Accessed 14 January
2010].

47
48
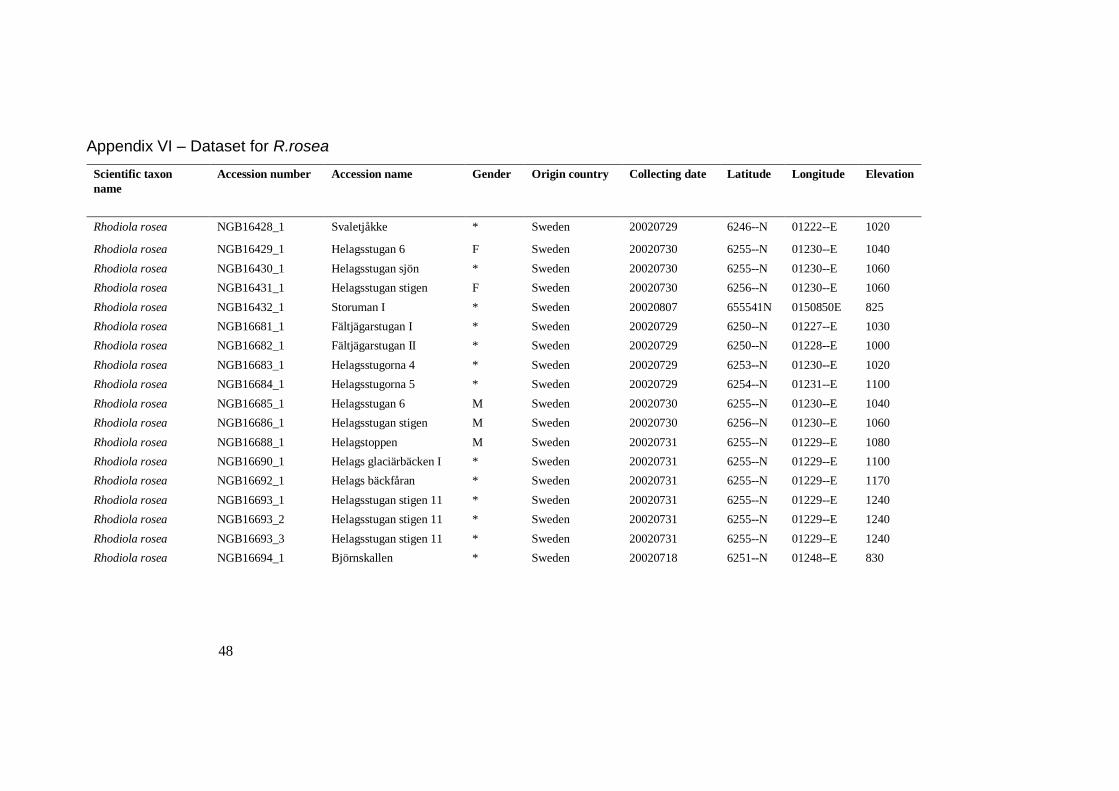
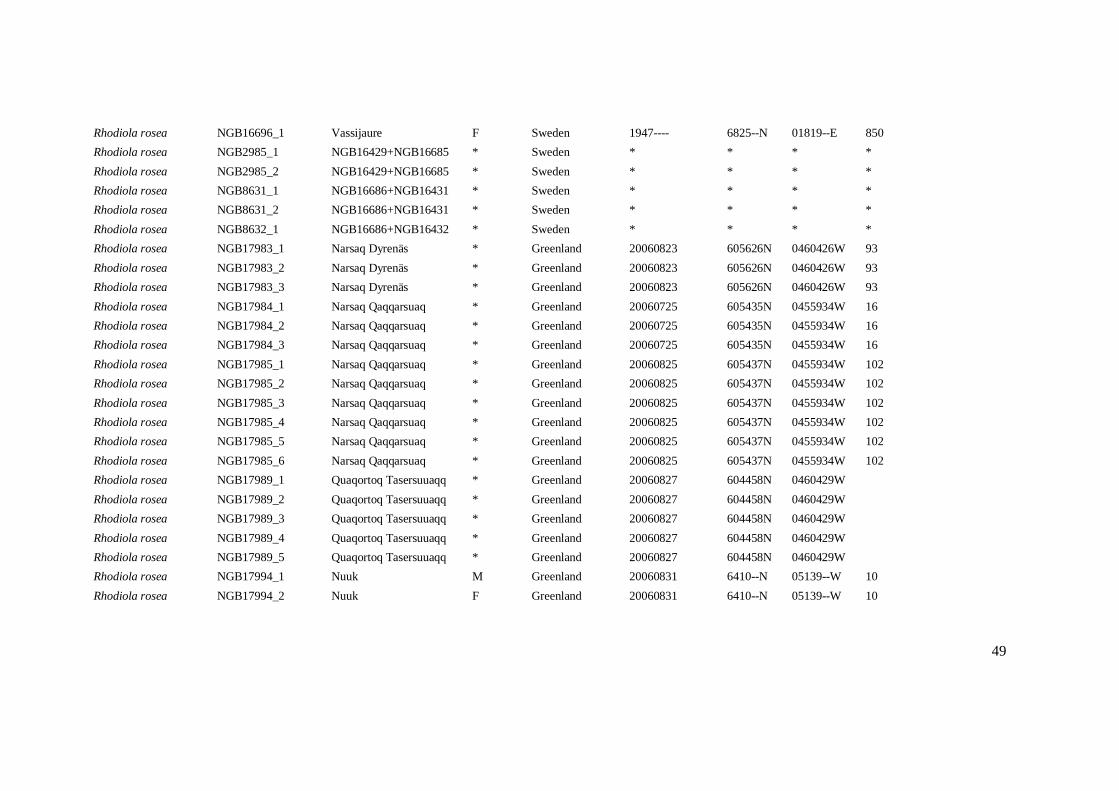
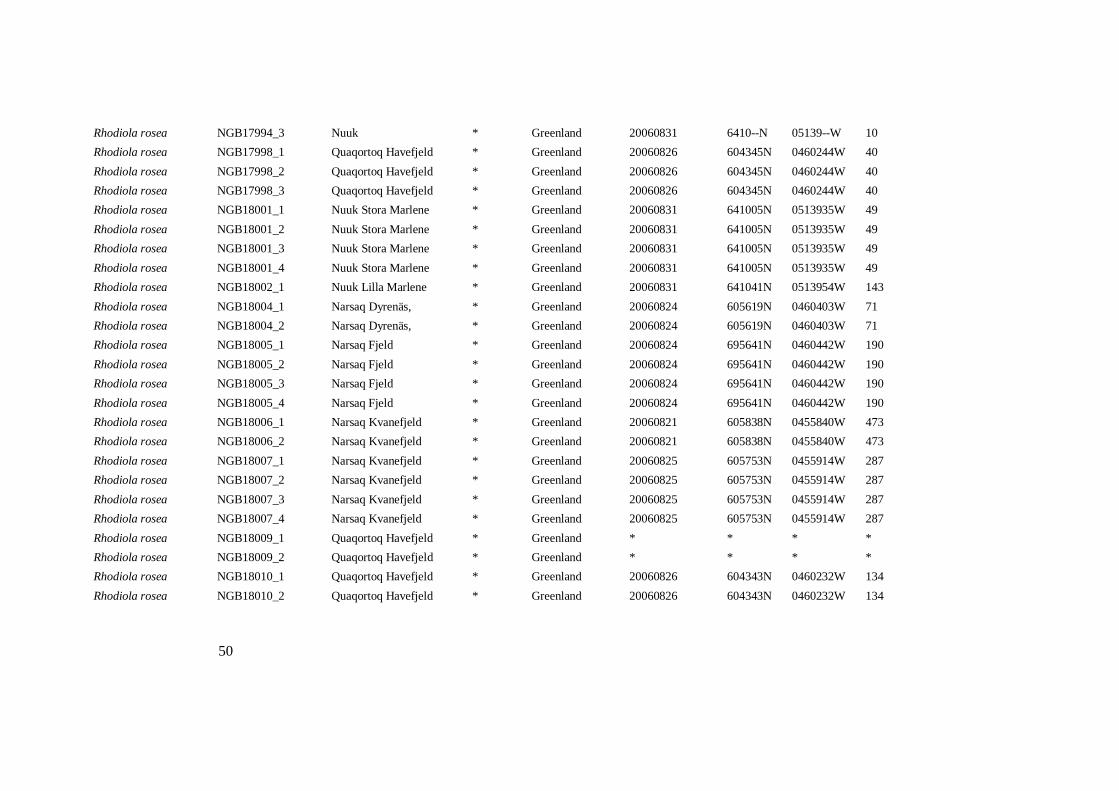
Appendix VI – Dataset for R.rosea
Scientific taxon
name
Accession number
Accession name
Gender
Origin country
Collecting date
Latitude
Longitude
Elevation
Rhodiola rosea NGB16428_1 Svaletjåkke * Sweden 20020729 6246--N 01222--E 1020
Rhodiola rosea NGB16429_1 Helagsstugan 6 F Sweden 20020730 6255--N 01230--E 1040
Rhodiola rosea NGB16430_1 Helagsstugan sjön * Sweden 20020730 6255--N 01230--E 1060
Rhodiola rosea NGB16431_1 Helagsstugan stigen F Sweden 20020730 6256--N 01230--E 1060
Rhodiola rosea NGB16432_1 Storuman I * Sweden 20020807 655541N 0150850E 825
Rhodiola rosea NGB16681_1 Fältjägarstugan I * Sweden 20020729 6250--N 01227--E 1030
Rhodiola rosea NGB16682_1 Fältjägarstugan II * Sweden 20020729 6250--N 01228--E 1000
Rhodiola rosea NGB16683_1 Helagsstugorna 4 * Sweden 20020729 6253--N 01230--E 1020
Rhodiola rosea NGB16684_1 Helagsstugorna 5 * Sweden 20020729 6254--N 01231--E 1100
Rhodiola rosea NGB16685_1 Helagsstugan 6 M Sweden 20020730 6255--N 01230--E 1040
Rhodiola rosea NGB16686_1 Helagsstugan stigen M Sweden 20020730 6256--N 01230--E 1060
Rhodiola rosea NGB16688_1 Helagstoppen M Sweden 20020731 6255--N 01229--E 1080
Rhodiola rosea NGB16690_1 Helags glaciärbäcken I * Sweden 20020731 6255--N 01229--E 1100
Rhodiola rosea NGB16692_1 Helags bäckfåran * Sweden 20020731 6255--N 01229--E 1170
Rhodiola rosea NGB16693_1 Helagsstugan stigen 11 * Sweden 20020731 6255--N 01229--E 1240
Rhodiola rosea NGB16693_2 Helagsstugan stigen 11 * Sweden 20020731 6255--N 01229--E 1240
Rhodiola rosea NGB16693_3 Helagsstugan stigen 11 * Sweden 20020731 6255--N 01229--E 1240
Rhodiola rosea NGB16694_1 Björnskallen * Sweden 20020718 6251--N 01248--E 830
49
Rhodiola rosea NGB16696_1 Vassijaure F Sweden 1947---- 6825--N 01819--E 850
Rhodiola rosea NGB2985_1 NGB16429+NGB16685 * Sweden * * * *
Rhodiola rosea NGB2985_2 NGB16429+NGB16685 * Sweden * * * *
Rhodiola rosea NGB8631_1 NGB16686+NGB16431 * Sweden * * * *
Rhodiola rosea NGB8631_2 NGB16686+NGB16431 * Sweden * * * *
Rhodiola rosea NGB8632_1 NGB16686+NGB16432 * Sweden * * * *
Rhodiola rosea NGB17983_1 Narsaq Dyrenäs * Greenland 20060823 605626N 0460426W 93
Rhodiola rosea NGB17983_2 Narsaq Dyrenäs * Greenland 20060823 605626N 0460426W 93
Rhodiola rosea NGB17983_3 Narsaq Dyrenäs * Greenland 20060823 605626N 0460426W 93
Rhodiola rosea NGB17984_1 Narsaq Qaqqarsuaq * Greenland 20060725 605435N 0455934W 16
Rhodiola rosea NGB17984_2 Narsaq Qaqqarsuaq * Greenland 20060725 605435N 0455934W 16
Rhodiola rosea NGB17984_3 Narsaq Qaqqarsuaq * Greenland 20060725 605435N 0455934W 16
Rhodiola rosea NGB17985_1 Narsaq Qaqqarsuaq * Greenland 20060825 605437N 0455934W 102
Rhodiola rosea NGB17985_2 Narsaq Qaqqarsuaq * Greenland 20060825 605437N 0455934W 102
Rhodiola rosea NGB17985_3 Narsaq Qaqqarsuaq * Greenland 20060825 605437N 0455934W 102
Rhodiola rosea NGB17985_4 Narsaq Qaqqarsuaq * Greenland 20060825 605437N 0455934W 102
Rhodiola rosea NGB17985_5 Narsaq Qaqqarsuaq * Greenland 20060825 605437N 0455934W 102
Rhodiola rosea NGB17985_6 Narsaq Qaqqarsuaq * Greenland 20060825 605437N 0455934W 102
Rhodiola rosea NGB17989_1 Quaqortoq Tasersuuaqq * Greenland 20060827 604458N 0460429W
Rhodiola rosea NGB17989_2 Quaqortoq Tasersuuaqq * Greenland 20060827 604458N 0460429W
Rhodiola rosea NGB17989_3 Quaqortoq Tasersuuaqq * Greenland 20060827 604458N 0460429W
Rhodiola rosea NGB17989_4 Quaqortoq Tasersuuaqq * Greenland 20060827 604458N 0460429W
Rhodiola rosea NGB17989_5 Quaqortoq Tasersuuaqq * Greenland 20060827 604458N 0460429W
Rhodiola rosea NGB17994_1 Nuuk M Greenland 20060831 6410--N 05139--W 10
Rhodiola rosea NGB17994_2 Nuuk F Greenland 20060831 6410--N 05139--W 10
50
Rhodiola rosea NGB17994_3 Nuuk * Greenland 20060831 6410--N 05139--W 10
Rhodiola rosea NGB17998_1 Quaqortoq Havefjeld * Greenland 20060826 604345N 0460244W 40
Rhodiola rosea NGB17998_2 Quaqortoq Havefjeld * Greenland 20060826 604345N 0460244W 40
Rhodiola rosea NGB17998_3 Quaqortoq Havefjeld * Greenland 20060826 604345N 0460244W 40
Rhodiola rosea NGB18001_1 Nuuk Stora Marlene * Greenland 20060831 641005N 0513935W 49
Rhodiola rosea NGB18001_2 Nuuk Stora Marlene * Greenland 20060831 641005N 0513935W 49
Rhodiola rosea NGB18001_3 Nuuk Stora Marlene * Greenland 20060831 641005N 0513935W 49
Rhodiola rosea NGB18001_4 Nuuk Stora Marlene * Greenland 20060831 641005N 0513935W 49
Rhodiola rosea NGB18002_1 Nuuk Lilla Marlene * Greenland 20060831 641041N 0513954W 143
Rhodiola rosea NGB18004_1 Narsaq Dyrenäs, * Greenland 20060824 605619N 0460403W 71
Rhodiola rosea NGB18004_2 Narsaq Dyrenäs, * Greenland 20060824 605619N 0460403W 71
Rhodiola rosea NGB18005_1 Narsaq Fjeld * Greenland 20060824 695641N 0460442W 190
Rhodiola rosea NGB18005_2 Narsaq Fjeld * Greenland 20060824 695641N 0460442W 190
Rhodiola rosea NGB18005_3 Narsaq Fjeld * Greenland 20060824 695641N 0460442W 190
Rhodiola rosea NGB18005_4 Narsaq Fjeld * Greenland 20060824 695641N 0460442W 190
Rhodiola rosea NGB18006_1 Narsaq Kvanefjeld * Greenland 20060821 605838N 0455840W 473
Rhodiola rosea NGB18006_2 Narsaq Kvanefjeld * Greenland 20060821 605838N 0455840W 473
Rhodiola rosea NGB18007_1 Narsaq Kvanefjeld * Greenland 20060825 605753N 0455914W 287
Rhodiola rosea NGB18007_2 Narsaq Kvanefjeld * Greenland 20060825 605753N 0455914W 287
Rhodiola rosea NGB18007_3 Narsaq Kvanefjeld * Greenland 20060825 605753N 0455914W 287
Rhodiola rosea NGB18007_4 Narsaq Kvanefjeld * Greenland 20060825 605753N 0455914W 287
Rhodiola rosea NGB18009_1 Quaqortoq Havefjeld * Greenland * * * *
Rhodiola rosea NGB18009_2 Quaqortoq Havefjeld * Greenland * * * *
Rhodiola rosea NGB18010_1 Quaqortoq Havefjeld * Greenland 20060826 604343N 0460232W 134
Rhodiola rosea NGB18010_2 Quaqortoq Havefjeld * Greenland 20060826 604343N 0460232W 134
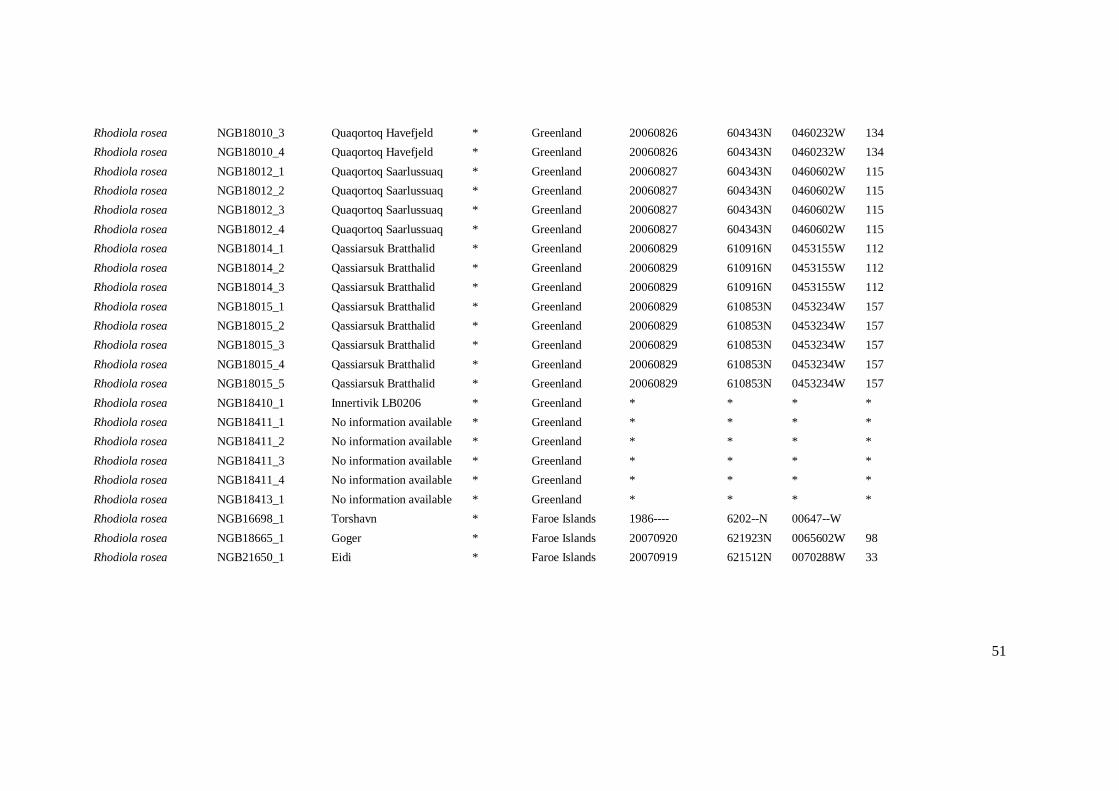
51
Rhodiola rosea NGB18010_3 Quaqortoq Havefjeld * Greenland 20060826 604343N 0460232W 134
Rhodiola rosea NGB18010_4 Quaqortoq Havefjeld * Greenland 20060826 604343N 0460232W 134
Rhodiola rosea NGB18012_1 Quaqortoq Saarlussuaq * Greenland 20060827 604343N 0460602W 115
Rhodiola rosea NGB18012_2 Quaqortoq Saarlussuaq * Greenland 20060827 604343N 0460602W 115
Rhodiola rosea NGB18012_3 Quaqortoq Saarlussuaq * Greenland 20060827 604343N 0460602W 115
Rhodiola rosea NGB18012_4 Quaqortoq Saarlussuaq * Greenland 20060827 604343N 0460602W 115
Rhodiola rosea NGB18014_1 Qassiarsuk Bratthalid * Greenland 20060829 610916N 0453155W 112
Rhodiola rosea NGB18014_2 Qassiarsuk Bratthalid * Greenland 20060829 610916N 0453155W 112
Rhodiola rosea NGB18014_3 Qassiarsuk Bratthalid * Greenland 20060829 610916N 0453155W 112
Rhodiola rosea NGB18015_1 Qassiarsuk Bratthalid * Greenland 20060829 610853N 0453234W 157
Rhodiola rosea NGB18015_2 Qassiarsuk Bratthalid * Greenland 20060829 610853N 0453234W 157
Rhodiola rosea NGB18015_3 Qassiarsuk Bratthalid * Greenland 20060829 610853N 0453234W 157
Rhodiola rosea NGB18015_4 Qassiarsuk Bratthalid * Greenland 20060829 610853N 0453234W 157
Rhodiola rosea NGB18015_5 Qassiarsuk Bratthalid * Greenland 20060829 610853N 0453234W 157
Rhodiola rosea NGB18410_1 Innertivik LB0206 * Greenland * * * *
Rhodiola rosea NGB18411_1 No information available * Greenland * * * *
Rhodiola rosea NGB18411_2 No information available * Greenland * * * *
Rhodiola rosea NGB18411_3 No information available * Greenland * * * *
Rhodiola rosea NGB18411_4 No information available * Greenland * * * *
Rhodiola rosea NGB18413_1 No information available * Greenland * * * *
Rhodiola rosea NGB16698_1 Torshavn * Faroe Islands 1986---- 6202--N 00647--W
Rhodiola rosea NGB18665_1 Goger * Faroe Islands 20070920 621923N 0065602W 98
Rhodiola rosea NGB21650_1 Eidi * Faroe Islands 20070919 621512N 0070288W 33
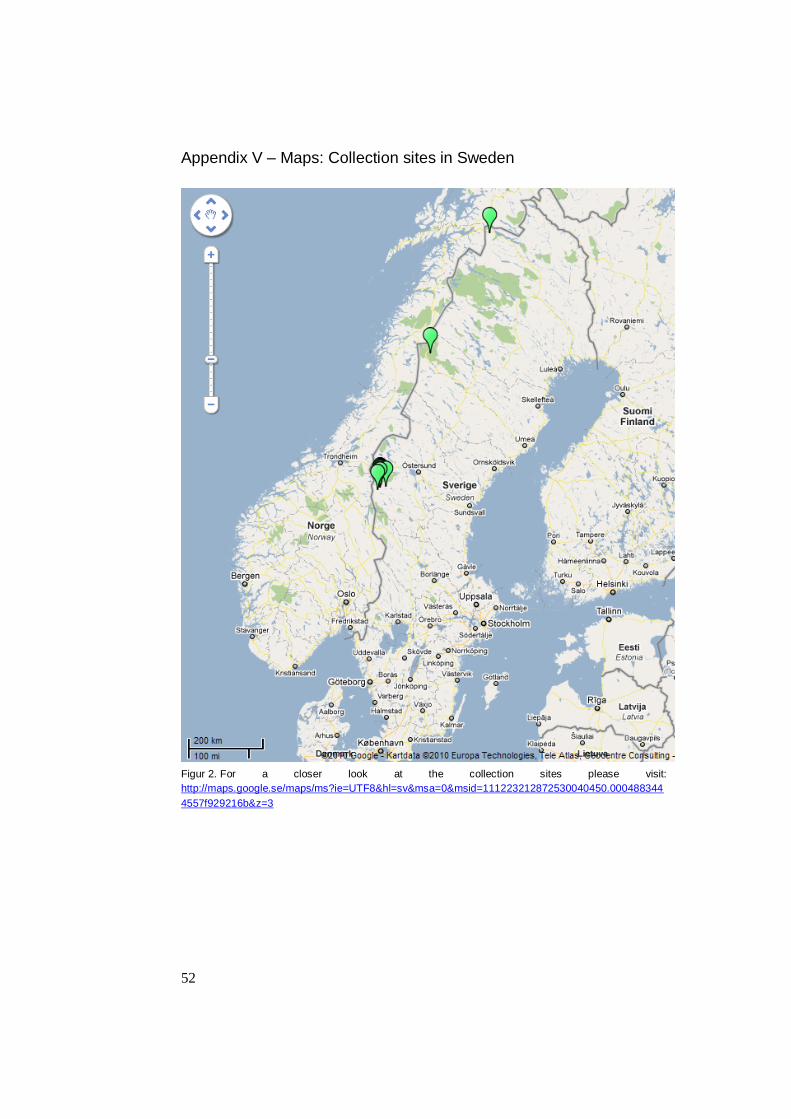
52
Appendix V – Maps: Collection sites in Sweden
Figur 2. For a closer look at the collection sites please visit:
http://maps.google.se/maps/ms?ie=UTF8&hl=sv&msa=0&msid=111223212872530040450.000488344
4557f929216b&z=3
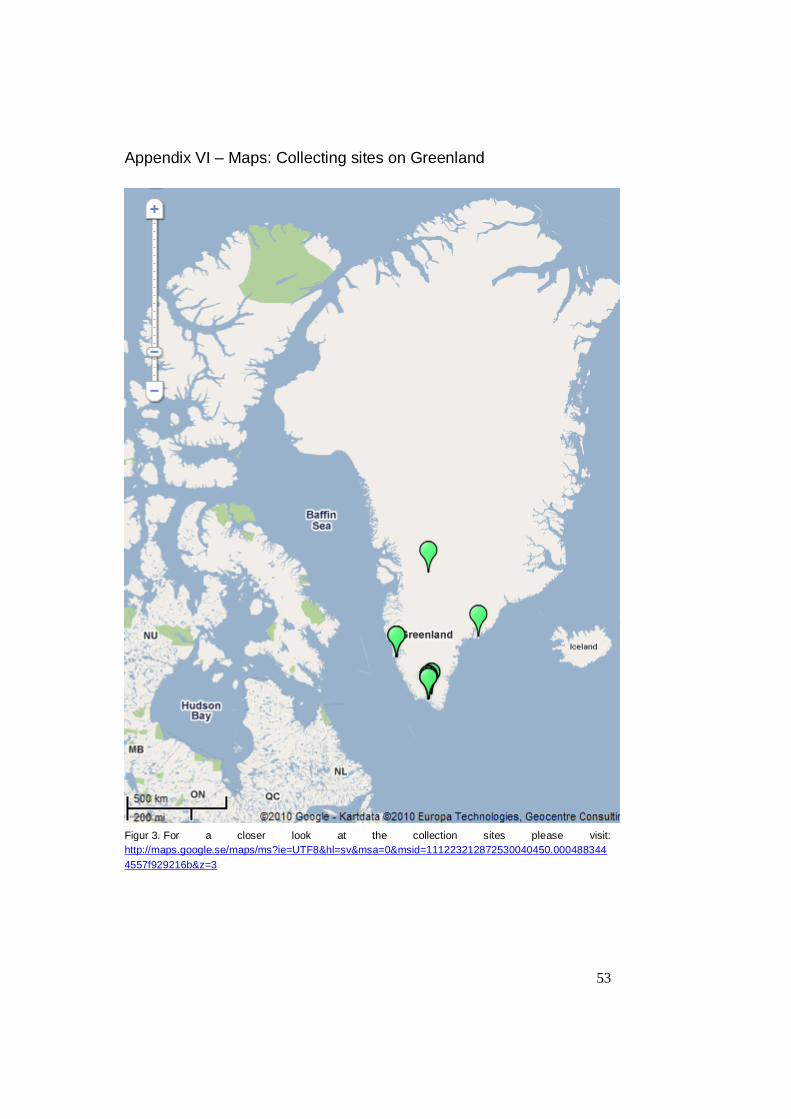
53
Appendix VI – Maps: Collecting sites on Greenland
Figur 3. For a closer look at the collection sites please visit:
http://maps.google.se/maps/ms?ie=UTF8&hl=sv&msa=0&msid=111223212872530040450.000488344
4557f929216b&z=3
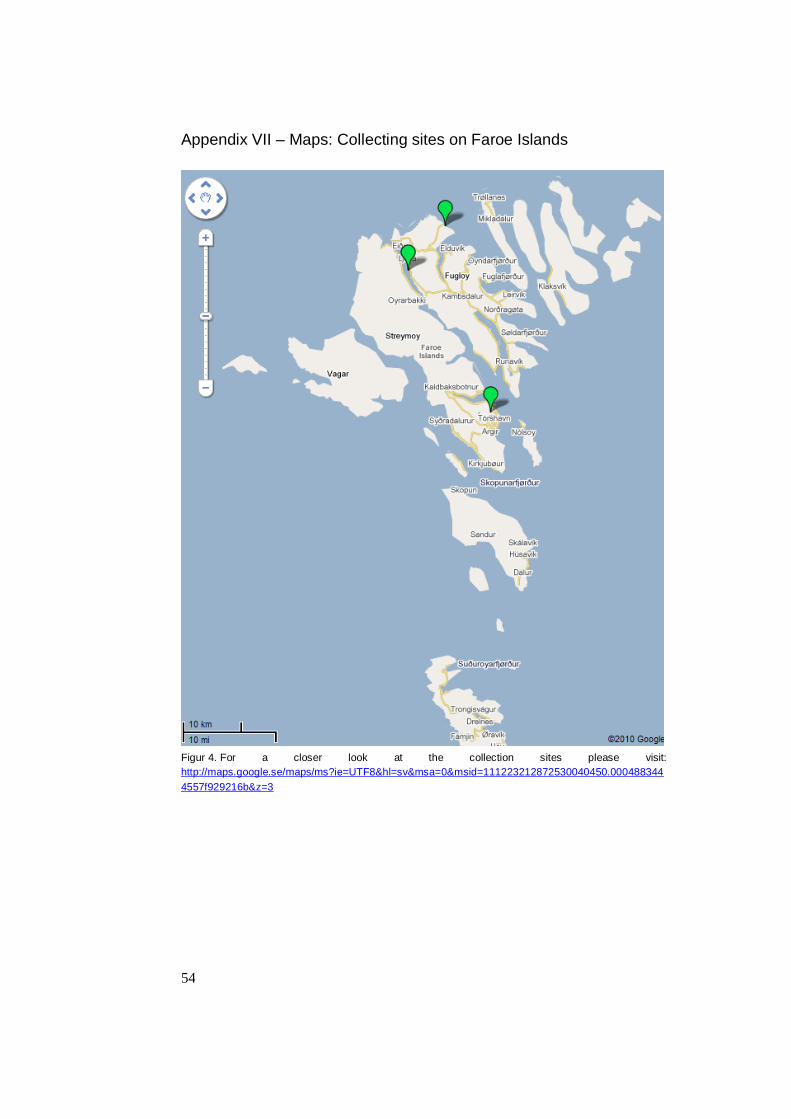
54
Appendix VII – Maps: Collecting sites on Faroe Islands
Figur 4. For a closer look at the collection sites please visit:
http://maps.google.se/maps/ms?ie=UTF8&hl=sv&msa=0&msid=111223212872530040450.000488344
4557f929216b&z=3
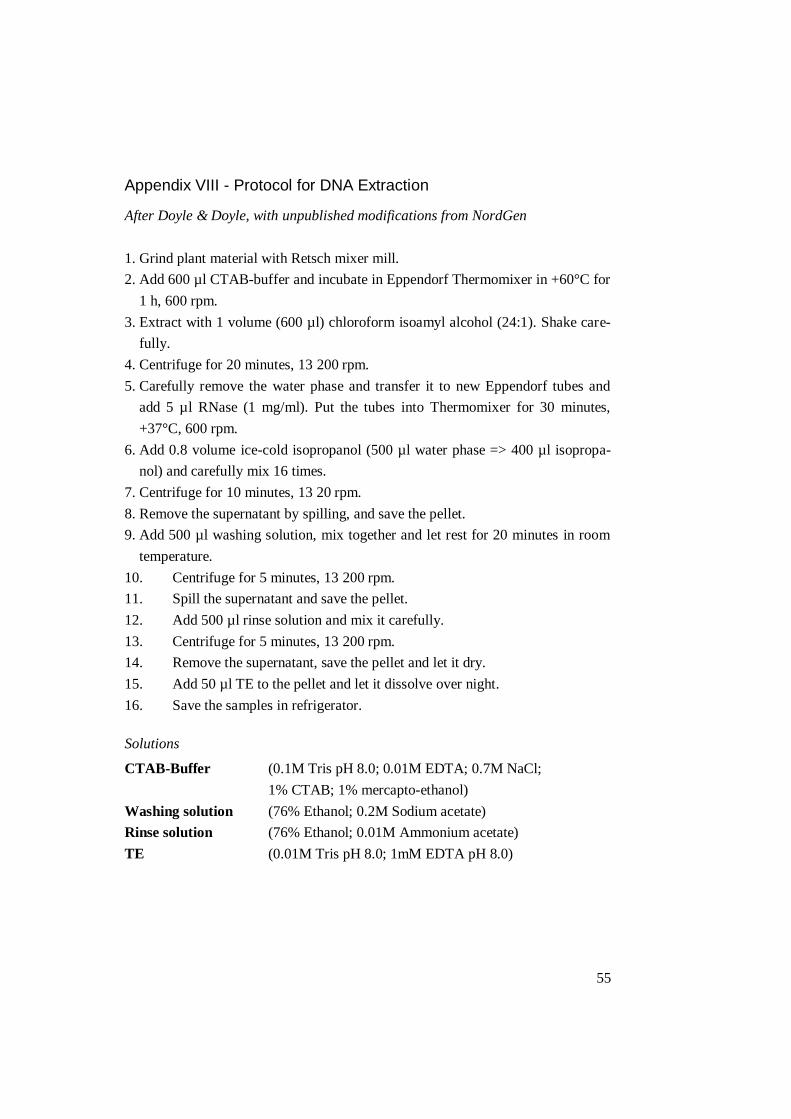
55
Appendix VIII - Protocol for DNA Extraction
After Doyle & Doyle, with unpublished modifications from NordGen
1. Grind plant material with Retsch mixer mill.
2. Add 600 µl CTAB-buffer and incubate in Eppendorf Thermomixer in +60°C for
1 h, 600 rpm.
3. Extract with 1 volume (600 µl) chloroform isoamyl alcohol (24:1). Shake care-
fully.
4. Centrifuge for 20 minutes, 13 200 rpm.
5. Carefully remove the water phase and transfer it to new Eppendorf tubes and
add 5 µl RNase (1 mg/ml). Put the tubes into Thermomixer for 30 minutes,
+37°C, 600 rpm.
6. Add 0.8 volume ice-cold isopropanol (500 µl water phase => 400 µl isopropa-
nol) and carefully mix 16 times.
7. Centrifuge for 10 minutes, 13 20 rpm.
8. Remove the supernatant by spilling, and save the pellet.
9. Add 500 µl washing solution, mix together and let rest for 20 minutes in room
temperature.
10. Centrifuge for 5 minutes, 13 200 rpm.
11. Spill the supernatant and save the pellet.
12. Add 500 µl rinse solution and mix it carefully.
13. Centrifuge for 5 minutes, 13 200 rpm.
14. Remove the supernatant, save the pellet and let it dry.
15. Add 50 µl TE to the pellet and let it dissolve over night.
16. Save the samples in refrigerator.
Solutions
CTAB-Buffer (0.1M Tris pH 8.0; 0.01M EDTA; 0.7M NaCl;
1% CTAB; 1% mercapto-ethanol)
Washing solution (76% Ethanol; 0.2M Sodium acetate)
Rinse solution (76% Ethanol; 0.01M Ammonium acetate)
TE (0.01M Tris pH 8.0; 1mM EDTA pH 8.0)
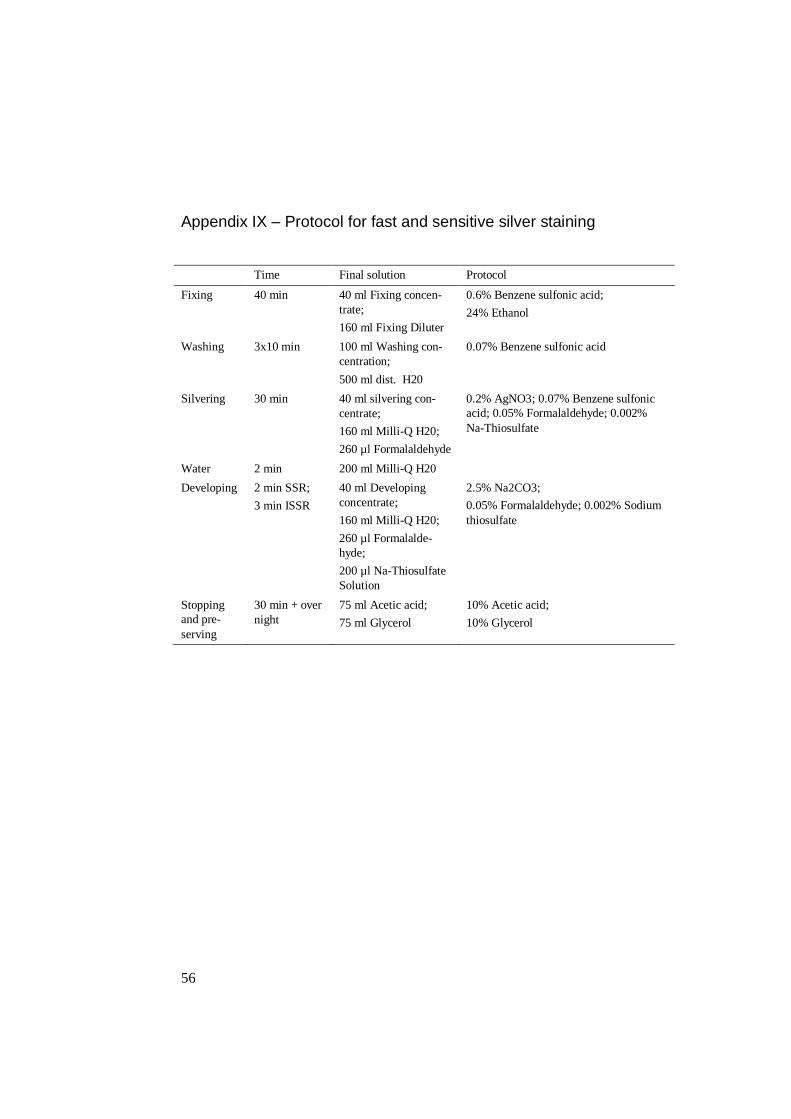
56
Appendix IX – Protocol for fast and sensitive silver staining
Time Final solution Protocol
Fixing
40 min 40 ml Fixing concen-
trate;
160 ml Fixing Diluter
0.6% Benzene sulfonic acid;
24% Ethanol
Washing 3x10 min 100 ml Washing con-
centration;
500 ml dist. H20
0.07% Benzene sulfonic acid
Silvering 30 min 40 ml silvering con-
centrate;
160 ml Milli-Q H20;
260 µl Formalaldehyde
0.2% AgNO3; 0.07% Benzene sulfonic
acid; 0.05% Formalaldehyde; 0.002%
Na-Thiosulfate
Water 2 min 200 ml Milli-Q H20
Developing 2 min SSR;
3 min ISSR
40 ml Developing
concentrate;
160 ml Milli-Q H20;
260 µl Formalalde-
hyde;
200 µl Na-Thiosulfate
Solution
2.5% Na2CO3;
0.05% Formalaldehyde; 0.002% Sodium
thiosulfate
Stopping
and pre-
serving
30 min + over
night
75 ml Acetic acid;
75 ml Glycerol
10% Acetic acid;
10% Glycerol
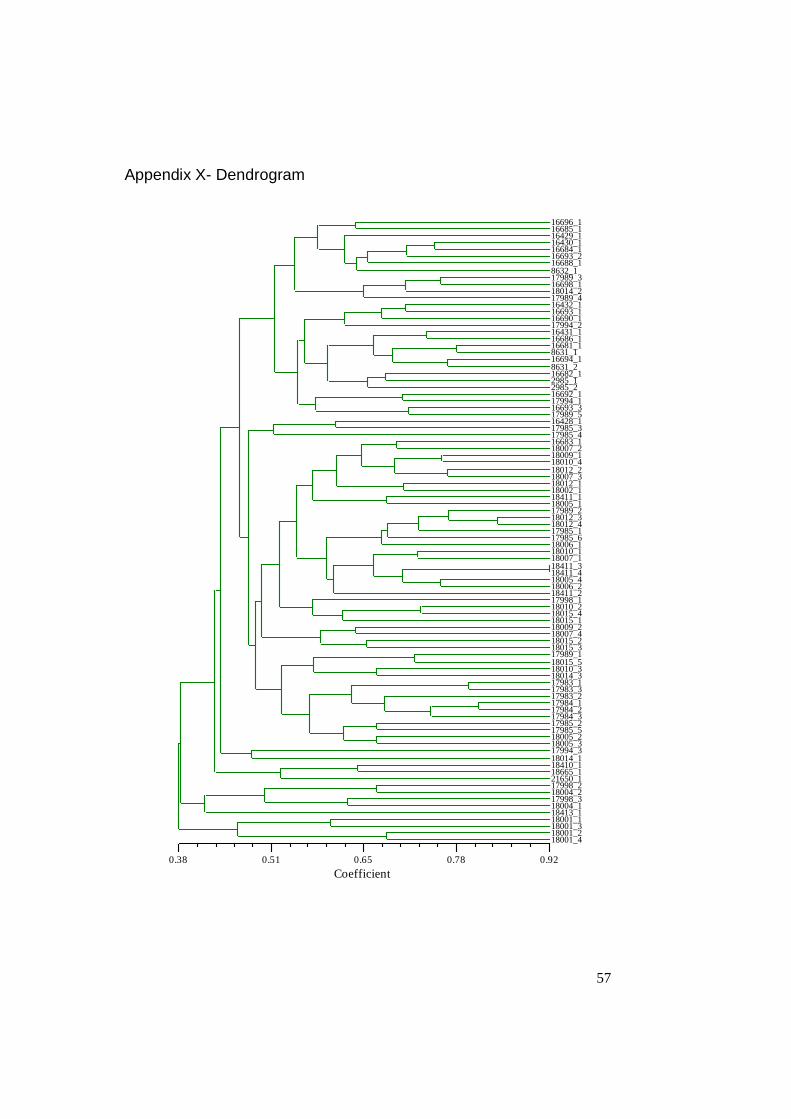
57
Appendix X- Dendrogram
Coefficient
0.38 0.51 0.65 0.78 0.92
16696_1MW
16696_1 16685_1 16429_1 16430_1 16684_1 16693_2 16688_1 8632_1 17989_3 16698_1 18014_2 17989_4 16432_1 16693_1 16690_1 17994_2 16431_1 16686_1 16681_1 8631_1 16694_1 8631_2 16682_1 2985_1 2985_2 16692_1 17994_1 16693_3 17989_5 16428_1 17985_3 17985_4 16683_1 18007_2 18009_1 18010_4 18012_2 18007_3 18012_1 18002_1 18411_1 18005_1 17989_2 18012_3 18012_4 17985_1 17985_6 18006_1 18010_1 18007_1 18411_3 18411_4 18005_4 18006_2 18411_2 17998_1 18010_2 18015_4 18015_1 18009_2 18007_4 18015_2 18015_3 17989_1 18015_5 18010_3 18014_3 17983_1 17983_3 17983_2 17984_1 17984_2 17984_3 17985_2 17985_5 18005_2 18005_3 17994_3 18014_1 18410_1 18665_1 21650_1 17998_2 18004_2 17998_3 18004_1 18413_1 18001_1 18001_3 18001_2 18001_4

58