genetic evidence for recent population mixture in...
TRANSCRIPT

Please cite this article in press as: Moorjani et al., Genetic Evidence for Recent Population Mixture in India, The American Journal of HumanGenetics (2013), http://dx.doi.org/10.1016/j.ajhg.2013.07.006
ARTICLE
Genetic Evidence for RecentPopulation Mixture in India
Priya Moorjani,1,2,6,* Kumarasamy Thangaraj,3,6,* Nick Patterson,2 Mark Lipson,4 Po-Ru Loh,4
Periyasamy Govindaraj,3 Bonnie Berger,2,4 David Reich,1,2,7 and Lalji Singh3,5,7
Most Indian groups descend from a mixture of two genetically divergent populations: Ancestral North Indians (ANI) related to Central
Asians, Middle Easterners, Caucasians, and Europeans; and Ancestral South Indians (ASI) not closely related to groups outside the
subcontinent. The date of mixture is unknown but has implications for understanding Indian history. We report genome-wide data
from 73 groups from the Indian subcontinent and analyze linkage disequilibrium to estimate ANI-ASI mixture dates ranging from about
1,900 to 4,200 years ago. In a subset of groups, 100% of the mixture is consistent with having occurred during this period. These results
show that India experienced a demographic transformation several thousand years ago, from a region in which major population
mixture was common to one in which mixture even between closely related groups became rare because of a shift to endogamy.
Introduction
Genetic evidence indicates that most of the ethno-linguis-
tic groups in India descend from a mixture of two diver-
gent ancestral populations: Ancestral North Indians
(ANI) related to West Eurasians (people of Central Asia,
the Middle East, the Caucasus, and Europe) and Ancestral
South Indians (ASI) related (distantly) to indigenous Anda-
man Islanders.1 The evidence for mixture was initially
documented based on analysis of Y chromosomes2 and
mitochondrial DNA3–5 and then confirmed and extended
through whole-genome studies.6–8
Archaeological and linguistic studies provide support for
the genetic findings of a mixture of at least two very
distinct populations in the history of the Indian subconti-
nent. The earliest archaeological evidence for agriculture in
the region dates to 8,000–9,000 years before present (BP)
(Mehrgarh in present-day Pakistan) and involved wheat
and barley derived from crops originally domesticated in
West Asia.9,10 The earliest evidence for agriculture in the
south dates to much later, around 4,600 years BP, and
has no clear affinities to West Eurasian agriculture (it was
dominated by native pulses such as mungbean and horse-
gram, as well as indigenous millets11). Linguistic analyses
also support a history of contacts between divergent popu-
lations in India, including at least one with West Eurasian
affinities. Indo-European languages including Sanskrit and
Hindi (primarily spoken in northern India) are part of a
larger language family that includes the great majority of
European languages. In contrast, Dravidian languages
including Tamil and Telugu (primarily spoken in southern
India) are not closely related to languages outside of South
Asia. Evidence for long-term contact between speakers of
1Department of Genetics, Harvard Medical School, Boston, MA 02115, U3CSIR-Centre for Cellular andMolecular Biology, Hyderabad 500 007, India; 4D
Laboratory, Massachusetts Institute of Technology, Cambridge, MA 02139, US5Present address: Banaras Hindu University, Varanasi 221 005, India6These authors contributed equally to this work7These authors contributed equally to this work and are co-senior authors
*Correspondence: [email protected] (P.M.), [email protected]
http://dx.doi.org/10.1016/j.ajhg.2013.07.006. �2013 by The American Societ
The Am
these two language groups in India is evident from the
fact that there are Dravidian loan words (borrowed vocab-
ulary) in the earliest Hindu text (the Rig Veda, written in
archaic Sanskrit) that are not found in Indo-European lan-
guages outside the Indian subcontinent.12,13
Although genetic studies and other lines of evidence are
consistent in pointing to mixture of distinct groups in In-
dian history, the dates are unknown. Three different hy-
potheses (which are not mutually exclusive) seem most
plausible for migrations that could have brought together
people of ANI and ASI ancestry in India. The first hypoth-
esis is that the current geographic distribution of people
with West Eurasian genetic affinities is due to migrations
that occurred prior to the development of agriculture. Evi-
dence for this comes from mitochondrial DNA studies,
which have shown that the mitochondrial haplogroups
(hg U2, U7, and W) that are most closely shared between
Indians and West Eurasians diverged about 30,000–
40,000 years BP.3,14 The second is that Western Asian peo-
ples migrated to India along with the spread of agriculture;
such mass movements are plausible because they are
known to have occurred in Europe as has been directly
documented by ancient DNA.15,16 Any such agriculture-
related migrations would probably have begun at least
8,000–9,000 years BP (based on the dates for Mehrgarh)
and may have continued into the period of the Indus civi-
lization that began around 4,600 years BP and depended
upon West Asian crops.17 The third possibility is that
West Eurasian genetic affinities in India owe their origins
to migrations from Western or Central Asia from 3,000 to
4,000 years BP, a time during which it is likely that Indo-
European languages began to be spoken in the subconti-
nent. A difficulty with this theory, however, is that by
SA; 2Broad Institute of Harvard and MIT, Cambridge, MA 02142, USA;
epartment of Mathematics and Computer Science and Artificial Intelligence
A
es.in (K.T.)
y of Human Genetics. All rights reserved.
erican Journal of Human Genetics 93, 1–17, September 5, 2013 1

Figure 1. Principal Component Analysis(A) Map showing the sampling locations for Indian groups in our study (except central_mix1_nihali7).(B) Principal component analysis (PCA) of 70 of 73 groups with non-Indians (EuropeanAmericans [CEU], Georgian, Iranian, Basque, andHanChinese [CHB]) highlights the ‘‘Indian cline,’’ a gradient ofWest Eurasian relatedness. Great Andamanese and Siddi are not includedbecause of their evidence of relatively recent admixture with non-Indian groups, and central_mix1_nihali7 is not included because itincludes multiple ethno-linguistic groups under one label. To aid visualization, we represent each group by the average PCA coordinatesof all the individuals in it. Footnote a indicates groups from Metspalu et al.7 and footnote b indicates groups from HGDP.
Please cite this article in press as: Moorjani et al., Genetic Evidence for Recent Population Mixture in India, The American Journal of HumanGenetics (2013), http://dx.doi.org/10.1016/j.ajhg.2013.07.006
this time India was a densely populated region with wide-
spread agriculture, so the number of migrants of West
Eurasian ancestry must have been extraordinarily large to
explain the fact that today about half the ancestry in India
derives from the ANI.18,19 It is also important to recognize
that a date of mixture is very different from the date of a
migration; in particular, mixture always postdates migra-
tion. Nevertheless, a genetic date for the mixture would
place a minimum on the date of migration and identify
periods of important demographic change in India.
Material and Methods
Data SetsTo learn about population history in India at higher resolution
than was previously possible, we assembled genome-wide data
for 571 individuals from 73 well-defined ethno-linguistic groups
from South Asia (71 Indian and 2 Pakistani groups). We refer to
all these groups in what follows as ‘‘Indian.’’ For samples geno-
typed on Affymetrix 6.0 arrays, we required at least 99% complete-
ness for all SNPs and samples; this resulted in 383 individuals from
52 groups (27 groups newly genotyped for this study)1 genotyped
at 494,863 SNPs. For samples genotyped on Illumina 650K arrays,
we required at least 95% completeness, yielding 188 individuals
2 The American Journal of Human Genetics 93, 1–17, September 5, 2
from 21 groups7,20 genotyped at 543,980 SNPs. Sample collection
was in accordance with the ethical standards of the responsible
committees on human experimentation (institutional and
national), and informed consent consistent with genetic studies
of population history was obtained from all participants.
We filtered the data set in two stages. First, we filtered out data
from 49 individuals with the following characteristics: (1) dupli-
cate individuals (for each pair of individuals that match at least
90% of genotypes, we remove one individual); (2) related individ-
uals (for mother-father-child trios we exclude the child, and for
first-degree relative pairs we remove one of the two individuals);
(3) all individuals previously excluded by Metspalu et al.;7 and
(4) six Pakistani groups (Hazara, Kalash, Burusho, Makrani,
Balochi, and Brahui) that had previously been shown to have a
complex history involving more than a simple mixture of two
ancestral populations1 (Table S1 available online). Second, we
excluded an additional 194 individuals based on principal com-
ponent analysis (PCA): (1) all individuals with evidence of recent
ancestry from populations other than ANI and ASI1,21 or visual
identification of outliers in Figure 1, which led us to exclude all
Austro-Asiatic and Tibeto-Burman speakers; (2) all individuals
from groups that were not homogenous in PCA in the sense of
having multiple clusters in the scatterplot; and (3) individuals
who were ancestry outliers compared with the majority of individ-
uals from their own group based on visual inspection of the PCA
clusters (Table S1). After curation, we had 211 individuals
013
Please cite this article in press as: Moorjani et al., Genetic Evidence for Recent Population Mixture in India, The American Journal of HumanGenetics (2013), http://dx.doi.org/10.1016/j.ajhg.2013.07.006
(30 groups) genotyped on Affymetrix arrays and 117 individuals
(15 groups) genotyped on Illumina arrays.
We coanalyzed the Indian data with HGDP-CEPH data from 51
groups (257 individuals genotyped on Affymetrix 500K SNP
arrays22 and 940 on Illumina 650K arrays20); International Haplo-
type Map Phase 3 (HapMap) data from 11 groups (1,158 individ-
uals genotyped on Affymetrix 6.0 arrays and Illumina 1M
arrays23); Behar et al.24 data from 41 groups (466 individuals
genotyped on Illumina 610K arrays); and Yunusbayev et al.25
data from 13 groups (214 individuals genotyped on Illumina
610K arrays). Our ‘‘Affymetrix’’ merged data set consisted of
210,482 SNPs obtained by merging data from 211 Indians (30
groups) with data from non-Indians typed on Affymetrix arrays
(HapMap and Affymetrix HGDP). Our ‘‘Illumina’’ merged data
set consisted of 500,703 SNPs obtained by merging data from
117 Indians (15 groups) with data from non-Indians typed on
Illumina arrays (HapMap, Illumina HGDP; Behar et al.,24 and
Yunusbayev et al.25). Our ‘‘Illumina-Affymetrix’’ merged data set
consisted of an intersection of these two data sets and included
328 Indian individuals (45 groups) genotyped at 86,213 SNPs.
F4 Ratio EstimationWe use f4 ratio estimation as implemented in ADMIXTOOLS26 to
estimate the proportion of ANI ancestry in Indian groups. Specif-
ically, we compute the ANI ancestry proportion (a) as:
a ¼ f4ðYRI;Basque; India;OngeÞf4ðYRI;Basque;Georgians;OngeÞ
: (Equation 1)
This assumes the model of Figure S1 with Pop1 ¼ Georgians and
Pop2 ¼ Basque.
For f4 ratio estimation to provide unbiased results, it requires ac-
cess to four outgroup populations that branch off at four distinct
positions on the ancestral lineage relating ANI andASI.26We chose
to work with Yoruba (YRI), Andamanese (Onge),27 and two West
Eurasian populations (Pop1 and Pop2) that are at successively
increasing phylogenetic distances from the ANI (that is, the tree
for West Eurasian populations is (Pop2, (Pop1, ANI))) (Figure S1).
We first searched for a population to use as Pop1. For each Indian
group (X), we compute D(Onge, X; YRI, Y) where Y ¼ any West
Eurasian population from a panel of 43 groups including Euro-
peans, Central Asians, Middle Easterners, and Caucasians. For all
45 Indian groups on the Indian cline (described in the Results sec-
tion), we find that Georgians alongwith other Caucasus groups are
consistent with sharing the most genetic drift with ANI (Tables S2
and S3), aswas also previously observed inMetspalu et al.7 basedon
clusteringanalysis. Therefore,weuseGeorgians as Pop1 (Figure S1).
We next determined a second population to use as Pop2.We exam-
ined all possibleWest Eurasian populations to find groups that pro-
vide a good fit to the model (YRI, (Pop2, (Georgians, ANI)), [(ASI,
Onge])) by using our admixture graph phylogeny testing soft-
ware.26 Within the limits of our resolution, we find six groups
(Pop2 ¼ Italian, Tuscan, Basque, Kurd, Abhkasian, Spaniard) that
are consistent with thismodel in the sense that none of the f statis-
tics relating the groups are greater than three standard errors from
expectation. To evaluate the uncertainty in the ANI ancestry pro-
portions ranging over these six candidates for Pop2, we ran f4 ratio
estimation with two choices of Pop2 representing different
geographic extremes (Pop2 ¼ Abhkasian and Pop2 ¼ Basque). We
obtain similar ANI ancestry estimates (Table S4). Our ancestry esti-
mates are also statistically consistent (within two standard errors)
with those of Reich et al.1 (Table S4).
The Am
Estimating Admixture Dates via RolloffFor each pair of SNPs (x,y) separated by a distance d Morgans, we
compute the covariance between (x,y), which we use to measure
the linkage disequilibrium (LD) resulting from population
mixture. Specifically, we use the rolloff26,28,29 statistic
RðdÞ ¼
Pj x�y jzd
zðx; yÞwðx; yÞP
j x�y jzd
wðx; yÞ2 ; (Equation 2)
where z(x,y) is the covariance between SNPs x and y, and w(x,y) is a
weight function. The weight can be either (1) the allele frequency
difference between the two groups we use as surrogates for the
ancestors (Europeans, Onge), (2) the allele frequency difference
between a tested Indian group and one reference group
(Europeans), or (3) the PCA-based loadings for SNPs (x, y)
computed by performing PCA with Europeans and various Indian
cline groups. We plot the weighted covariance with distance and
obtain a date by fitting an exponential function with an affine
term y ¼ Ae�nd þ c, where d is the distance in Morgans and we
interpret n as the number of generations since admixture. We
compute standard errors with a weighted block jackknife,30 with
one chromosome dropped per run.
Admixture Dates and Their Difference
in Indo-European and Dravidian SpeakersFor many analyses in this study, we cluster Indians into two cate-
gories based on their linguistic affiliation: ‘‘Indo-Europeans’’
to indicate groups that speak Indo-European languages and
‘‘Dravidians’’ to indicate groups that speak Dravidian languages.
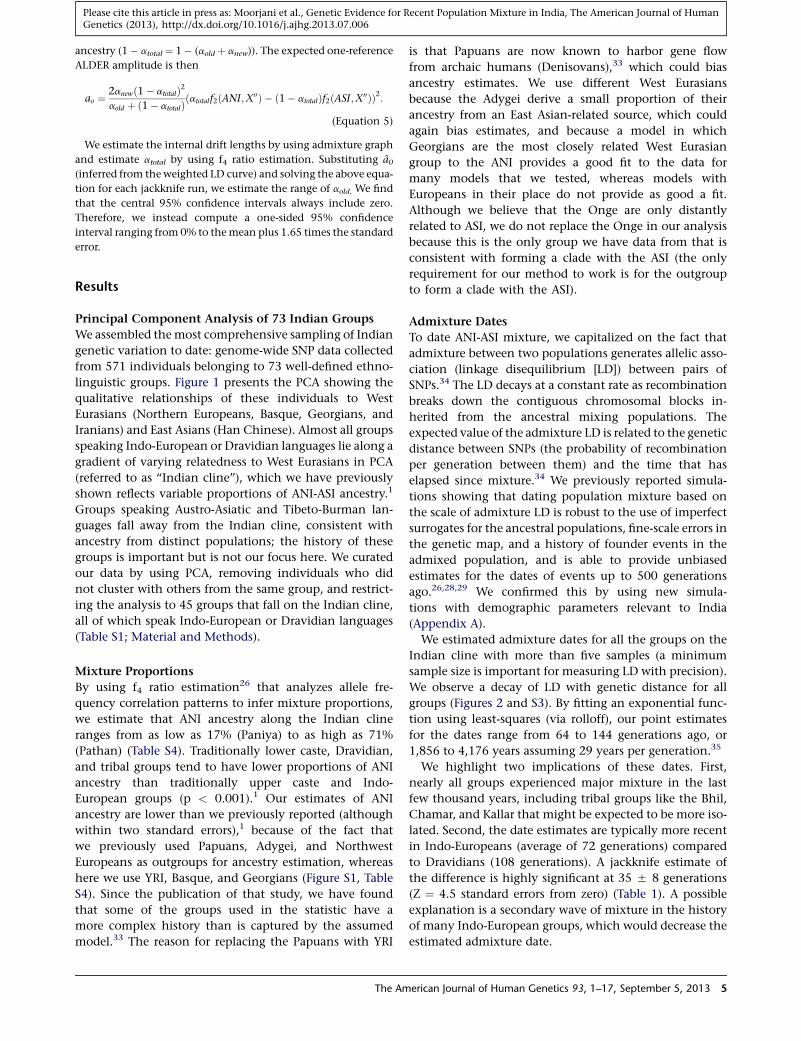
For the dating analysis shown in Figure 2, we applied rolloff to
the merged Illumina-Affymetrix data set of 86,213 SNPs, with
weights from PCA-based SNP loadings computed with Basque
and speakers of the language group other than the one being
analyzed (for example, for estimating the dates of mixture for
Indo-Europeans, we use Dravidians and Basque to compute the
PCA-based SNP loadings). To compute the significance of the dif-
ference in the date estimates, we leave out each of the 22 chromo-
somes in turn and use a weighted block jackknife procedure to
convert the variability into a standard error. As a robustness check,
we repeat this analysis with the Affymetrix data set of 210,482
SNPs for the four Indo-European and five Dravidian groups that
we found were consistent with a simple ANI-ASI mixture
(described in the Results section). For this analysis we use Basque
and all other Indian cline groups to compute SNP loadings. We
confirm a younger date for Indo-Europeans than for Dravidians,
with the difference of 44 5 18 generations being statistically sig-
nificant at Z ¼ 2.4 standard errors from zero.
Identifying Groups Consistent with Simple ANI-ASI
AdmixtureFor each of the 37 Indian groups including Onge (this is less than
the total number of groups on the Indian cline because we applied
a minimum sample size requirement of 5), we tested whether they
are consistent with deriving all their ancestry from the same ANI
and ASI ancestral populations by studying the matrix of all
possible statistics of the form f4(Indianbase, Indianother;
NonIndianbase, NonIndianother) with a panel of 38 non-Indian
populations. Many f4 statistics can be written as linear combina-
tions of each other, and therefore we need to pick a basis for the
space of f4 statistics. In practice, we fix one Indian group as
erican Journal of Human Genetics 93, 1–17, September 5, 2013 3

Figure 2. Dates of MixtureWe pool samples based on linguistic affiliation (Indo-Europeans[n ¼ 175] and Dravidians [n ¼ 144]) and run rolloff (with themerged Illumina-Affymetrix data set of 86,213 SNPs) to measurethe LD resulting from mixture between ANI and ASI. To obtainweights proportional to the allele frequency differences betweenANI and ASI at each SNP (needed to run rolloff), we use SNPloadings obtained from a PCA of Basque and a pool of groupsfrom the linguistic cluster whose admixture is not being dated(e.g., we run PCA with Indo-European and Basque when we aredating Dravidian admixture). The output of rolloff is representedas points and the line shows the exponential fit ðy ¼ Ae�nd þ cÞused for estimating the time in generations (n) since mixture.The nonzero constant c allows for variability in the mixtureproportion among the groups we pooled and d is the geneticdistance in Morgans. Standard errors are computed via a weightedblock jackknife (see Material and Methods).
Please cite this article in press as: Moorjani et al., Genetic Evidence for Recent Population Mixture in India, The American Journal of HumanGenetics (2013), http://dx.doi.org/10.1016/j.ajhg.2013.07.006
‘‘Indianbase’’ and compute the f4 statistic for each of the 36 remain-
ing Indian groups as ‘‘Indianother.’’ We use an African group (YRI)
as ‘‘NonIndianbase’’ and the ‘‘NonIndianother’’ groups include Dai,
Papuans, Karitiana, and diverse West Eurasian groups including
Europeans, Middle Easterners, and Caucasians (the choice of
base has no mathematical impact on the test). To identify sets of
Indian groups consistent with having the same relationship to
the panel of non-Indians, we use a Hotelling T test as in Reich
et al.31 to evaluate whether thematrix of all f4 statistics has exactly
one linearly independent component (rank 1). For sets of Indian
groups that are consistent with being rank 1, we also run the
admixture graph testing software to evaluate whether the rela-
tionships in Figure S1 (where Pop1 ¼ Georgians, Pop2 ¼ Basque)
are consistent with the data. We began by applying this procedure
to all possible sets of three Indian groups. For the sets that passed,
we added each possible fourth Indian group in turn and tested the
consistency with a simple ANI-ASI mixture. We applied this pro-
cess iteratively until no additional Indian groups could be added
to the rank 1 set.
Admixture Graph AnalysisWe applied the admixture graph26 formal phylogeny testing
software to evaluate whether the model of simple ANI-ASI admix-
4 The American Journal of Human Genetics 93, 1–17, September 5, 2
ture in rank 1 Indo-European and Dravidian groups provides a fit
to the data. Admixture graph studies the correlations in allele
frequency differentiation statistics (f2, f3, and f4)26 among groups,
comparing the observed values to those specified by the model
(with a standard error from a block jackknife) to test hypotheses
about population relationships. To test whether a proposed model
provides a fit to the data, the software examines individual f
statistics and considers statistics more than three standard errors
from expectation to be indicative of a poor fit. We also use this
method to estimate the internal genetic drift lengths required by
ALDER for estimating admixture proportions (on the lineages
separating (ANI, X’’) and (ASI, X’’) in Figure S2).
Estimating the Date and Proportion of Mixture via
ALDERWe run ALDER32 with one reference population (a West Eurasian
group; we tried seven diverse West Eurasian groups). The ALDER
statistic for measuring admixture LD is similar to the rolloff
statistic:
aðdÞ ¼
PSðdÞ
zðx; yÞwðx; yÞ
j SðdÞ j: (Equation 3)
Asbefore, z(x,y) is the covariancebetweenSNPsxandy.Herew(x,y)
is the product of the allele frequency differences at x and y between
the two referencegroups (in this case, aWest Eurasiangroupand the
admixed group itself), and SðdÞ ¼ fðx; yÞ : jx� yj < d � ε=2g (where
ε is a discretization parameter).
We plot the weighted covariance against genetic distance and
perform a least-squares fit by y ¼ Ae�nd þ c, where n is the number
of generations since admixture and d is the genetic distance in
Morgans. Under a single-wave mixture model, the amplitude
of admixture LD decay defined as ao ¼ Aþ c=2 is analytically
predicted by the ANI ancestry proportion (a):
ao ¼ 2að1� aÞðaf2ðANI;X00Þ � ð1� aÞf2ðASI;X00ÞÞ2: (Equation 4)
Here, X00 is the common ancestor of the reference West Eurasian
group (X) and the ANI lineage (Figure S2). We estimate f2ðANI;X00Þand f2ðASI;X00Þ via our admixture graph software with one West
Eurasian outgroup (because we do not have access to Georgians
in the 210,482 SNP Affymetrix data set). Having only a single
West Eurasian outgroup in the admixture graph makes the model
poorly constrained, but we address this limitation by fixing
the value of the admixture proportion to be equal to the ANI
ancestry inferred from f4 ratio estimation. We compare the
expected amplitude ao (from Equation 4) and the observed ampli-
tude ao (from the weighted LD curve) to test whether the model of
a single wave of mixture between ANI and ASI provides a good fit
to the data. The entire procedure is repeated, dropping each chro-
mosome in turn to generate block jackknife standard errors on the
quantities of interest.
95% Confidence Interval on the ANI Ancestry
Proportion prior to MixtureConsider the model that an Indian group derives its ancestry from
two waves of admixture involving ANI-related populations
(assumed to have the same allele frequencies), where the older
wave is old enough that its contribution to the measured LD is
negligible. If so, the groupwould have ancestry from three sources:
old ANI ancestry (aold), recent ANI ancestry (anew), and ASI
013
Please cite this article in press as: Moorjani et al., Genetic Evidence for Recent Population Mixture in India, The American Journal of HumanGenetics (2013), http://dx.doi.org/10.1016/j.ajhg.2013.07.006
ancestry (1� atotal ¼ 1 � (aold þ anew)). The expected one-reference
ALDER amplitude is then
ao ¼ 2anewð1� atotalÞ2aold þ ð1� atotalÞðatotalf2ðANI;X00Þ � ð1� atotalÞf2ðASI;X00ÞÞ2:
(Equation 5)
We estimate the internal drift lengths by using admixture graph
and estimate atotal by using f4 ratio estimation. Substituting a0(inferred from the weighted LD curve) and solving the above equa-
tion for each jackknife run, we estimate the range of aold. We find
that the central 95% confidence intervals always include zero.
Therefore, we instead compute a one-sided 95% confidence
interval ranging from 0% to themean plus 1.65 times the standard
error.
Results
Principal Component Analysis of 73 Indian Groups
We assembled themost comprehensive sampling of Indian
genetic variation to date: genome-wide SNP data collected
from 571 individuals belonging to 73 well-defined ethno-
linguistic groups. Figure 1 presents the PCA showing the
qualitative relationships of these individuals to West
Eurasians (Northern Europeans, Basque, Georgians, and
Iranians) and East Asians (Han Chinese). Almost all groups
speaking Indo-European or Dravidian languages lie along a
gradient of varying relatedness to West Eurasians in PCA
(referred to as ‘‘Indian cline’’), which we have previously
shown reflects variable proportions of ANI-ASI ancestry.1
Groups speaking Austro-Asiatic and Tibeto-Burman lan-
guages fall away from the Indian cline, consistent with
ancestry from distinct populations; the history of these
groups is important but is not our focus here. We curated
our data by using PCA, removing individuals who did
not cluster with others from the same group, and restrict-
ing the analysis to 45 groups that fall on the Indian cline,
all of which speak Indo-European or Dravidian languages
(Table S1; Material and Methods).
Mixture Proportions
By using f4 ratio estimation26 that analyzes allele fre-
quency correlation patterns to infer mixture proportions,
we estimate that ANI ancestry along the Indian cline
ranges from as low as 17% (Paniya) to as high as 71%
(Pathan) (Table S4). Traditionally lower caste, Dravidian,
and tribal groups tend to have lower proportions of ANI
ancestry than traditionally upper caste and Indo-
European groups (p < 0.001).1 Our estimates of ANI
ancestry are lower than we previously reported (although
within two standard errors),1 because of the fact that
we previously used Papuans, Adygei, and Northwest
Europeans as outgroups for ancestry estimation, whereas
here we use YRI, Basque, and Georgians (Figure S1, Table
S4). Since the publication of that study, we have found
that some of the groups used in the statistic have a
more complex history than is captured by the assumed
model.33 The reason for replacing the Papuans with YRI
The Am
is that Papuans are now known to harbor gene flow
from archaic humans (Denisovans),33 which could bias
ancestry estimates. We use different West Eurasians
because the Adygei derive a small proportion of their
ancestry from an East Asian-related source, which could
again bias estimates, and because a model in which
Georgians are the most closely related West Eurasian
group to the ANI provides a good fit to the data for
many models that we tested, whereas models with
Europeans in their place do not provide as good a fit.
Although we believe that the Onge are only distantly
related to ASI, we do not replace the Onge in our analysis
because this is the only group we have data from that is
consistent with forming a clade with the ASI (the only
requirement for our method to work is for the outgroup
to form a clade with the ASI).
Admixture Dates
To date ANI-ASI mixture, we capitalized on the fact that
admixture between two populations generates allelic asso-
ciation (linkage disequilibrium [LD]) between pairs of
SNPs.34 The LD decays at a constant rate as recombination
breaks down the contiguous chromosomal blocks in-
herited from the ancestral mixing populations. The
expected value of the admixture LD is related to the genetic
distance between SNPs (the probability of recombination
per generation between them) and the time that has
elapsed since mixture.34 We previously reported simula-
tions showing that dating population mixture based on
the scale of admixture LD is robust to the use of imperfect
surrogates for the ancestral populations, fine-scale errors in
the genetic map, and a history of founder events in the
admixed population, and is able to provide unbiased
estimates for the dates of events up to 500 generations
ago.26,28,29 We confirmed this by using new simula-
tions with demographic parameters relevant to India
(Appendix A).
We estimated admixture dates for all the groups on the
Indian cline with more than five samples (a minimum
sample size is important for measuring LD with precision).
We observe a decay of LD with genetic distance for all
groups (Figures 2 and S3). By fitting an exponential func-
tion using least-squares (via rolloff), our point estimates
for the dates range from 64 to 144 generations ago, or
1,856 to 4,176 years assuming 29 years per generation.35
We highlight two implications of these dates. First,
nearly all groups experienced major mixture in the last
few thousand years, including tribal groups like the Bhil,
Chamar, and Kallar that might be expected to be more iso-
lated. Second, the date estimates are typically more recent
in Indo-Europeans (average of 72 generations) compared
to Dravidians (108 generations). A jackknife estimate of
the difference is highly significant at 35 5 8 generations
(Z ¼ 4.5 standard errors from zero) (Table 1). A possible
explanation is a secondary wave of mixture in the history
of many Indo-European groups, which would decrease the
estimated admixture date.
erican Journal of Human Genetics 93, 1–17, September 5, 2013 5

Table 1. Characterization of Population Admixture along the Indian Cline
Pop Data Set nLanguageFamily
Traditional Casteor Social Group State/Territory
Latitude,Longitude ANI%
Date ofMixture(gens)
Date ofMixture(years)
Madiga Reich et al.1 andthis study
13 (9) Dravidian lower caste Andhra Pradesh 17�580N, 79�350E 32.0 5 1.7 120 5 21 3,480
Mala Reich et al.1 andthis study
13 (10) Dravidian lower caste Andhra Pradesh 17�220N, 78�290E 34.3 5 1.7 96 5 16 2,784
Kallara Metspalu et al.7 8 Dravidian tribal Tamil Nadu 10�990N, 78�220E 37.7 5 1.8 113 5 15 3,277
Vysya Reich et al.1 andthis study
14 (10) Dravidian middle caste Andhra Pradesh 14�410N, 77�390E 37.9 5 1.8 144 5 27 4,176
Chamara Metspalu et al.7 10 Indo-European
tribal Uttar Pradesh 25�370N, 83�040E 38.7 5 1.7 113 5 13 3,277
Bhil Reich et al.1 andthis study
17 (10) Indo-European
tribal Gujarat 23�020N, 72�400E 38.9 5 1.6 78 5 7 2,262
Scheduledcaste/tribea
Metspalu et al.7 6 Dravidian lower caste Tamil Nadu 21�460N, 86�780E 40.5 5 1.9 83 5 21 2,407
Dushadha Metspalu et al.7 7 Indo-European
lower caste Uttar Pradesh 25�440N, 84�560E 41.0 5 1.8 107 5 13 3,103
Velamaa Metspalu et al.7 9 Dravidian upper caste Andhra Pradesh 17�050N, 79�270E 43.4 5 1.7 85 5 15 2,465
Dharkara Metspalu et al.7 11 Indo-European
nomadic group Uttar Pradesh 25�440N, 83�10E 47.8 5 1.5 64 5 11 1,856
Kanjara Metspalu et al.7 8 Indo-European
nomadic group Uttar Pradesh 26�450N, 80�320E 48.2 5 1.7 75 5 10 2,175
Kshatriyaa Metspalu et al.7 7 Indo-European
upper caste Uttar Pradesh 27�560N, 78�650E 54.6 5 1.6 78 5 9 2,262
Kshatriya this study 15 Indo-European
upper caste Uttar Pradesh 25�450N, 82�410E 60.9 5 1.3 76 5 10 2,204
Brahmina Metspalu et al.7 8 Indo-European
upper caste Uttar Pradesh 26�060N, 83�180E 61.2 5 1.4 86 5 7 2,494
Brahmin this study 10 Indo-European
upper caste Uttar Pradesh 25�450N, 82�410E 62.8 5 1.4 65 5 9 1,885
Sindhib Li et al.20 10 Indo-European
urban groups Pakistan 24�270N, 68�700E 64.3 5 1.3 67 5 8 1,943
KashmiriPandit
Reich et al.1 andthis study
15 (10) Indo-European
upper caste Kashmir 34�220N, 75�500E 65.2 5 1.3 103 5 17 2,987
Pathanb Li et al.20 15 Indo-European
urban groups Pakistan 32�350N, 69�720E 70.4 5 1.2 73 5 9 2,117
We estimate the ANI ancestry proportion and date of admixture by using f4 ratio estimation and rolloff, respectively, for all the groups on the Indian cline that havegreater than five samples (the requirement of a minimum sample size is important for measuring LD with precision). Because inferences of dates based on admix-ture LD are greatly improved by higher SNP density, we performed the date analysis with either the Illumina data set of the 500,714 SNPs or the full Affymetrix 6.0data set of 494,863 SNPs (this contains approximately double the number of SNPs compared to the merged Affymetrix data set we discuss in the Material andMethods because it removes the HGDP samples typed on the smaller Affymetrix 500K array). For the five instances marked Reich et al.1 and this study, we indicatethe number of newly genotyped samples in parentheses. To convert dates in generations to years, we assume 29 years per generation.aSamples from Metspalu et al.7bSamples from HGDP.
Please cite this article in press as: Moorjani et al., Genetic Evidence for Recent Population Mixture in India, The American Journal of HumanGenetics (2013), http://dx.doi.org/10.1016/j.ajhg.2013.07.006
Testing for Multiple Layers of Admixture in the
History of Indian Groups
A caveat for these dating analyses is that they assume that
the entire admixture occurred instantaneously (or over a
small number of generations). However, population
mixture can be noninstantaneous, such that the date we
obtain from our method may actually be an average of
multiple dates spread out over a substantial period. One
way to detect a history of noninstantaneous gene flow is
to fit a sum of exponential functions to the decay of admix-
6 The American Journal of Human Genetics 93, 1–17, September 5, 2
ture LD and to show that this provides a better fit to the
data than a single exponential function, as we in fact
find for the Kashmiri Pandit, Kshatriya, Sindhi, and Pathan
(Table 2, Appendix B). However, even if we fail to detect a
nonexponential decay, we cannot rule out noninstantane-
ous gene flow, because the decay can be noisy, making the
statistical detection of a mixture of exponential functions
difficult.36 A particularly important scenario we could
not rule out by this method is that several thousand years
ago, Indian groups were already admixed, and thus the LD
013
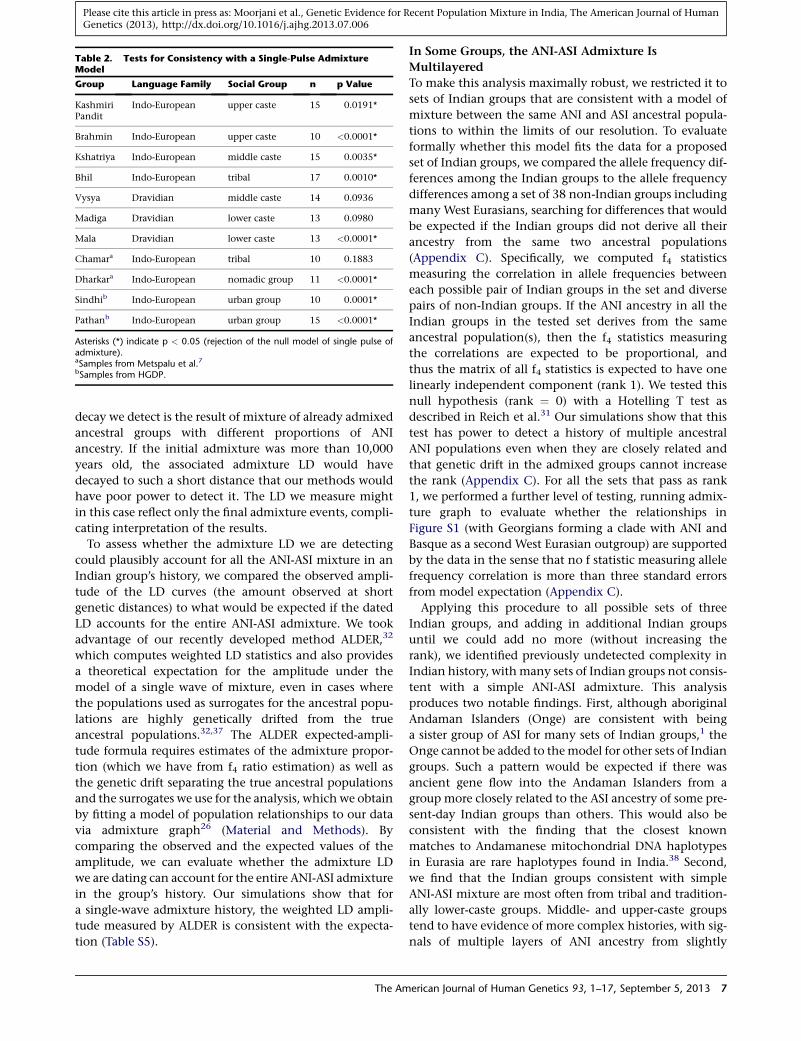
Table 2. Tests for Consistency with a Single-Pulse AdmixtureModel
Group Language Family Social Group n p Value
KashmiriPandit
Indo-European upper caste 15 0.0191*
Brahmin Indo-European upper caste 10 <0.0001*
Kshatriya Indo-European middle caste 15 0.0035*
Bhil Indo-European tribal 17 0.0010*
Vysya Dravidian middle caste 14 0.0936
Madiga Dravidian lower caste 13 0.0980
Mala Dravidian lower caste 13 <0.0001*
Chamara Indo-European tribal 10 0.1883
Dharkara Indo-European nomadic group 11 <0.0001*
Sindhib Indo-European urban group 10 0.0001*
Pathanb Indo-European urban group 15 <0.0001*
Asterisks (*) indicate p < 0.05 (rejection of the null model of single pulse ofadmixture).aSamples from Metspalu et al.7bSamples from HGDP.
Please cite this article in press as: Moorjani et al., Genetic Evidence for Recent Population Mixture in India, The American Journal of HumanGenetics (2013), http://dx.doi.org/10.1016/j.ajhg.2013.07.006
decay we detect is the result of mixture of already admixed
ancestral groups with different proportions of ANI
ancestry. If the initial admixture was more than 10,000
years old, the associated admixture LD would have
decayed to such a short distance that our methods would
have poor power to detect it. The LD we measure might
in this case reflect only the final admixture events, compli-
cating interpretation of the results.
To assess whether the admixture LD we are detecting
could plausibly account for all the ANI-ASI mixture in an
Indian group’s history, we compared the observed ampli-
tude of the LD curves (the amount observed at short
genetic distances) to what would be expected if the dated
LD accounts for the entire ANI-ASI admixture. We took
advantage of our recently developed method ALDER,32
which computes weighted LD statistics and also provides
a theoretical expectation for the amplitude under the
model of a single wave of mixture, even in cases where
the populations used as surrogates for the ancestral popu-
lations are highly genetically drifted from the true
ancestral populations.32,37 The ALDER expected-ampli-
tude formula requires estimates of the admixture propor-
tion (which we have from f4 ratio estimation) as well as
the genetic drift separating the true ancestral populations
and the surrogates we use for the analysis, which we obtain
by fitting a model of population relationships to our data
via admixture graph26 (Material and Methods). By
comparing the observed and the expected values of the
amplitude, we can evaluate whether the admixture LD
we are dating can account for the entire ANI-ASI admixture
in the group’s history. Our simulations show that for
a single-wave admixture history, the weighted LD ampli-
tude measured by ALDER is consistent with the expecta-
tion (Table S5).
The Am
In Some Groups, the ANI-ASI Admixture Is
Multilayered
To make this analysis maximally robust, we restricted it to
sets of Indian groups that are consistent with a model of
mixture between the same ANI and ASI ancestral popula-
tions to within the limits of our resolution. To evaluate
formally whether this model fits the data for a proposed
set of Indian groups, we compared the allele frequency dif-
ferences among the Indian groups to the allele frequency
differences among a set of 38 non-Indian groups including
many West Eurasians, searching for differences that would
be expected if the Indian groups did not derive all their
ancestry from the same two ancestral populations
(Appendix C). Specifically, we computed f4 statistics
measuring the correlation in allele frequencies between
each possible pair of Indian groups in the set and diverse
pairs of non-Indian groups. If the ANI ancestry in all the
Indian groups in the tested set derives from the same
ancestral population(s), then the f4 statistics measuring
the correlations are expected to be proportional, and
thus the matrix of all f4 statistics is expected to have one
linearly independent component (rank 1). We tested this
null hypothesis (rank ¼ 0) with a Hotelling T test as
described in Reich et al.31 Our simulations show that this
test has power to detect a history of multiple ancestral
ANI populations even when they are closely related and
that genetic drift in the admixed groups cannot increase
the rank (Appendix C). For all the sets that pass as rank
1, we performed a further level of testing, running admix-
ture graph to evaluate whether the relationships in
Figure S1 (with Georgians forming a clade with ANI and
Basque as a second West Eurasian outgroup) are supported
by the data in the sense that no f statistic measuring allele
frequency correlation is more than three standard errors
from model expectation (Appendix C).
Applying this procedure to all possible sets of three
Indian groups, and adding in additional Indian groups
until we could add no more (without increasing the
rank), we identified previously undetected complexity in
Indian history, withmany sets of Indian groups not consis-
tent with a simple ANI-ASI admixture. This analysis
produces two notable findings. First, although aboriginal
Andaman Islanders (Onge) are consistent with being
a sister group of ASI for many sets of Indian groups,1 the
Onge cannot be added to themodel for other sets of Indian
groups. Such a pattern would be expected if there was
ancient gene flow into the Andaman Islanders from a
group more closely related to the ASI ancestry of some pre-
sent-day Indian groups than others. This would also be
consistent with the finding that the closest known
matches to Andamanese mitochondrial DNA haplotypes
in Eurasia are rare haplotypes found in India.38 Second,
we find that the Indian groups consistent with simple
ANI-ASI mixture are most often from tribal and tradition-
ally lower-caste groups. Middle- and upper-caste groups
tend to have evidence of more complex histories, with sig-
nals of multiple layers of ANI ancestry from slightly
erican Journal of Human Genetics 93, 1–17, September 5, 2013 7

Table 3. Consistent Estimates of the Amplitude of Admixture LDfor the Indo-European and Dravidian Rank 1 Sets
Reference WestEurasian (X)
ExpectedAmplitude 310,000
ObservedAmplitude 310,000
Z Score forDifference
Indo-European Rank 1 Set
Basque 0.7 5 0.2 0.6 5 0.1 �0.5
CEU 0.6 5 0.2 0.5 5 0.1 �0.8
French 0.9 5 0.2 0.8 5 0.1 �0.6
Italian 0.5 5 0.2 0.6 5 0.1 0.1
Orcadian 0.8 5 0.2 0.7 5 0.1 �0.5
Sardinian 0.7 5 0.2 0.7 5 0.1 0.4
Tuscan 0.7 5 0.2 0.7 5 0.1 �0.2
Dravidian Rank 1 Set
Basque 1.1 5 0.2 0.8 5 0.1 �1.7
CEU 0.9 5 0.1 0.5 5 0.1 �2.7
French 1.1 5 0.2 0.6 5 0.1 �2.4
Italian 0.8 5 0.1 0.8 5 0.2 �0.1
Orcadian 0.9 5 0.1 0.3 5 0.4 �1.6
Sardinian 0.9 5 0.2 0.9 5 0.2 0.0
Tuscan 1.0 5 0.2 1.0 5 0.1 0.2
We use Equation 4 to compute the expected amplitude of admixture LD wherea, f2(ANI, X’’), and f2(ASI,X’’) are computed by admixture graph (Figure S2). arepresents the weighted average of the ANI ancestry in the set (weighted bythe sample size of the groups in the set). The observed amplitude is estimatedby ALDER with X as the reference population. We ignore inter-SNP distancesless than the threshold automatically chosen by ALDER after comparing sharedLD between the reference and the admixed group. To infer statistical uncer-tainty in (observed � expected) amplitude, we use a weighted block jackknifedropping each chromosome in turn. This produces a standard error and allowsus to test whether the difference is consistent with zero (jZj < 3).
Please cite this article in press as: Moorjani et al., Genetic Evidence for Recent Population Mixture in India, The American Journal of HumanGenetics (2013), http://dx.doi.org/10.1016/j.ajhg.2013.07.006
different ANI ancestral populations (Appendix C). Further
evidence for multiple waves of admixture in the history of
many traditionally middle- and upper-caste groups (as well
as Indo-European and northern groups) comes from the
more recent admixture dates we observe in these groups
(Table 1) and the fact that a sum of two exponential func-
tions often produces a better fit to the decay of admixture
LD than does a single exponential (as noted above for
some northern groups; Appendix B). Evidence for multiple
components of West Eurasian-related ancestry in northern
Indian populations has also been reported by Metspalu
et al.7 based on clustering analysis.
In Some Groups, the ANI Admixture Is Consistent
with Being Simple and All due to Events in the Last
Few Thousand Years
Focusing on the largest set of Indo-Europeans (four groups)
and the largest set of Dravidians (five groups) consistent
with mixture of the same ANI and ASI ancestral popula-
tions, we find that the expected and observed admixture
LD amplitudes are equivalent to within the limits of our
resolution. We restricted this analysis to Indian groups
genotyped on Affymetrix arrays because this allowed us
8 The American Journal of Human Genetics 93, 1–17, September 5, 2
to analyze about 2.5 timesmore SNPs (n¼ 210,482), which
improves the accuracy of inferences based on admixture
LD. Limiting our analysis to samples genotyped on
Affymetrix arrays raised the challenge that we could not
use Georgians as part of our admixture graph fitting (we
need a second West Eurasian outgroup to obtain tight
constraints on the absolute estimates of ANI-ASI admix-
ture), but in Appendix D we show that we can accurately
infer the difference between the two amplitude values
(observed � expected) even without access to Georgians
by constraining the admixture proportions estimated via
f4 ratio estimation. For both the Indo-European and
Dravidian rank 1 sets, the observed amplitudes are statisti-
cally consistent with the expected values (Table 3). Thus,
our data are consistent with all of the ANI ancestry in
some selected sets of Indians (including groups speaking
both Indo-European and Dravidian languages) being due
to admixture events that we can date to within the past
few thousand years. Accounting for statistical uncertainty,
we estimate that the ANI ancestry that cannot be
explained by a single wave of admixture in the last few
thousand years has a 95% confidence interval (truncated
to 0) of 0%–19% for Indo-Europeans and 0%–16% for
Dravidians. Thus, all the ANI ancestry in some groups is
consistent with deriving from admixture events that
have occurred in the past few thousand years.
Discussion
Our analysis documents major mixture between popula-
tions in India that occurred 1,900–4,200 years BP, well after
the establishment of agriculture in the subcontinent. We
have further shown that groups with unmixed ANI and
ASI ancestry were plausibly living in India until this
time. This contrasts with the situation today in which all
groups in mainland India are admixed. These results are
striking in light of the endogamy that has characterized
many groups in India since the time of mixture. For
example, genetic analysis suggests that the Vysya from
Andhra Pradesh have experienced negligible gene flow
from neighboring groups in India for an estimated 3,000
years.1 Thus, India experienced a demographic transforma-
tion during this time, shifting from a region where major
mixture between groups was common and affected even
isolated tribes such as the Palliyar and Bhil to a region in
which mixture was rare.
Our estimated dates of mixture correlate to geography
and language, with northern groups that speak Indo-
European languages having significantly younger admix-
ture dates than southern groups that speak Dravidian
languages. This shows that at least some of the history of
population mixture in India is related to the spread of
languages in the subcontinent. One possible explanation
for the generally younger dates in northern Indians is
that after an original mixture event of ANI and ASI that
contributed to all present-day Indians, some northern
013

Please cite this article in press as: Moorjani et al., Genetic Evidence for Recent Population Mixture in India, The American Journal of HumanGenetics (2013), http://dx.doi.org/10.1016/j.ajhg.2013.07.006
groups received additional gene flow from groups with
high proportions of West Eurasian ancestry, bringing
down their average mixture date. This hypothesis would
also explain the nonexponential decays of LD in many
northern groups and their higher proportions of ANI
ancestry. A prediction of this model is that some northern
Indians will have genomes consisting of long stretches of
ANI ancestry interspersed with stretches that are mosaics
of both ANI and ASI ancestry (inherited from the initial
mixture). Although we have not been able to test the pre-
dictions of this hypothesis, it may become possible to do so
in future by developing a method to infer the ancestry at
each locus in the genome of Indians that can provide accu-
rate estimates even in the absence of data from ancestral
populations.
The dates we report have significant implications for
Indian history in the sense that they document a period
of demographic and cultural change in which mixture be-
tween highly differentiated populations became pervasive
before it eventually became uncommon. The period of
around 1,900–4,200 years BP was a time of profound
change in India, characterized by the deurbanization of
the Indus civilization,39 increasing population density in
the central and downstream portions of the Gangetic sys-
tem,40 shifts in burial practices,41 and the likely first
appearance of Indo-European languages and Vedic religion
in the subcontinent.18,19 The shift from widespread
mixture to strict endogamy that we document is mirrored
in ancient Indian texts. The Rig Veda, the oldest text in In-
dia, has sections that are believed to have been composed
at different times. The older parts do not mention the caste
system at all, and in fact suggest that there was substantial
social movement across groups as reflected in the accep-
tance of people with non-Indo-European names as kings
(or chieftains) and poets.42 The four-class (varna) system,
comprised of Brahmanas, Ksatriyas, Vaisyas, and Sudras,
is mentioned only in the part of the Rig Veda that was
likely to have been composed later (the appendix: book
10).42 The caste (jati) system of endogamous groups having
specific social or occupational roles is not mentioned in
the Rig Veda at all and is referred to only in texts composed
centuries after the Rig Veda, for example, the law code of
Manu that forbade intermarriage between castes.43 Thus,
the evolution of Indian texts during this period provides
confirmatory support as well as context for our genetic
findings.
It is also important to emphasize what our study has not
shown. Although we have documented evidence for
mixture in India between about 1,900 and 4,200 years
BP, this does not imply migration from West Eurasia into
India during this time. On the contrary, a recent study
that searched forWest Eurasian groups most closely related
to the ANI ancestors of Indians failed to find any evidence
for shared ancestry between the ANI and groups in West
Eurasia within the past 12,500 years3 (although it is
possible that with further sampling and new methods
such relatedness might be detected). An alternative possi-
The Am
bility that is also consistent with our data is that the ANI
and ASI were both living in or near South Asia for a sub-
stantial period prior to their mixture. Such a pattern has
been documented elsewhere; for example, ancient DNA
studies of northern Europeans have shown that Neolithic
farmers originating in Western Asia migrated to Europe
about 7,500 years BP but did not mix with local hunter
gatherers until thousands of years later to form the pre-
sent-day populations of northern Europe.15,16,44,45
The most remarkable aspect of the ANI-ASI mixture is
how pervasive it was, in the sense that it has left its mark
on nearly every group in India. It has affected not just
traditionally upper-caste groups, but also traditionally
lower-caste and isolated tribal groups, all of whom are
united in their history of mixture in the past few thousand
years. It may be possible to gain further insight into the
history that brought the ANI and ASI together by studying
DNA from ancient human remains (such studies need to
overcome the challenge of a tropical environment not
conducive to DNA preservation). Ancient DNA studies
could be particularly revealing about Indian history
because they have the potential to directly reveal the
geographic distribution of the ANI and ASI prior to their
admixture.
Appendix A: Statistics Used for Estimating Dates
of Admixture
Here we describe the rolloff and ALDER linkage disequilib-
rium (LD) statistics that we use for dating admixture events
in India.
Both rolloff and ALDER are based on the insight that
mixture between populations creates allelic correlation
(or LD) between alleles whose frequencies differ between
the ancestral populations. This LD decays exponentially
as recombination occurs, and explicitly as e�nd, where n
is the number of generations since admixture and d is
the genetic distance between SNP pairs.
The rolloff statistic introduced in Moorjani et al.28 esti-
mates admixture LD by computing pairwise correlation
between SNPs and weighting them by the differences in
allele frequencies between the reference populations:26,28
AðdÞ ¼
Pj x�y jzd
zðx; yÞwðx; yÞffiffiffiffiffiffiffiffiffiffiffiffiffiffiffiffiffiffiffiffiffiffiffiffiffiffiffiffiffiffiffiPj x�y jzd
zðx; yÞ2r ffiffiffiffiffiffiffiffiffiffiffiffiffiffiffiffiffiffiffiffiffiffiffiffiffiffiffiffiffiffiffiffiP
j x�y jzd
wðx; yÞ2r : (Equation A1)
Here, x, y are SNPs separated by a distance d Morgans;
z(x,y) is the correlation between alleles at SNPs x and y;
and the weight function w(x,y) is the product of the allele
frequency differences between the reference populations
at x and y. We plot the weighted correlation with genetic
distance and obtain a date by fitting an exponential func-
tion with a constant offset (affine) term y ¼ Ae�nd þ c,
where n is the number of generations since admixture
and d is the distance in Morgans. Standard errors are
erican Journal of Human Genetics 93, 1–17, September 5, 2013 9

Please cite this article in press as: Moorjani et al., Genetic Evidence for Recent Population Mixture in India, The American Journal of HumanGenetics (2013), http://dx.doi.org/10.1016/j.ajhg.2013.07.006
computed via a weighted block jackknife,30 with one
chromosome dropped per run.
Although this statistic provides accurate results under
most scenarios, Moorjani et al.29 found that for groups
that have a history of a very strong bottleneck after
admixture, the normalization term z(x,y)2 exhibits an
exponential decay, thereby biasing the estimated dates of
admixture.29 Although this does not affect the estimates
in outbred groups such as Europeans and Africans, it could
cause a bias in the case of Indian groups such as Vysya and
Chenchu that have a history of strong founder events in
the past 100 generations.
Following Moorjani et al.,29 we modify the rolloff
Equation A1 as follows. (1) We substitute z(x,y) with the
covariance between SNPs x and y. This makes the statistic
more mathematically tractable, allowing us to use the
amplitude of the exponential decay to estimate admixture
proportions as in ALDER.32 (2) We remove the normaliza-
tion term z(x,y)2 to remove the bias in the date. The result-
ing statistic is shown in Equation 2. Simulations show that
these changes provide accurate date estimates even in
groups with a history of founder events.29
The rolloff statistic requires access to estimates of the
allele frequency differences between the reference groups
to weight the SNPs and to make the statistic sensitive to
admixture-related LD. This means that we need data
from reference groups that are related to the true ancestral
populations. A challenge is that the ASI are not closely
related to any extant group. Although they are anciently
related to indigenous Andaman Islanders (Onge), the
Onge provide poor estimates of ASI allele frequencies
because their population size has been small for the tens
of thousands of years since separation from the ASI so
that allele frequencies have experienced substantial
genetic drift. To overcome these limitations, we further
modified the implementation of rolloff as follows.
(1) Use of SNP loadings estimated based on PCA as the
weights in rolloff. For India,wedonothaveaccess to samples
of unadmixed ASI but we have access to multiple admixed
groups differing in their mixture proportions. Thus, we can
use SNP loadings from PCA of multiple admixed groups
and a surrogate for ANI (say, Europeans) in place of fre-
quencies in Equation 2. This idea was first introduced in
Moorjani et al.,29where simulations showed that PCA-based
SNP loadings can be used to accurately infer dates.
(2) Using the admixed group as one reference popula-
tion. Loh et al.32 extended the ideas from rolloff in the
new method ALDER. ALDER can infer admixture dates
with just one reference population (with the admixed
group itself as the other reference) and can also relate the
amplitude of the fitted exponential to admixture propor-
tions (see also Appendix D). Specifically, we compute the
statistic shown in Equation 3. Simulations show that
ALDER provides accurate estimates for the date with one
reference population, even when groups that are highly
diverged from the true ancestral populations are used as
reference populations.32
10 The American Journal of Human Genetics 93, 1–17, September 5,
We applied both rolloff and ALDER to infer the dates of
admixture by using PCA-based loadings and single refer-
ence populations and show that we obtain qualitatively
similar results from both methods (Table S6).
Simulations with Demographic Parameters Relevant
to Indian Groups
Moorjani et al.28 reported that rolloff estimates can be
upwardly biased in the cases of low admixture proportion
and small sample sizes. To evaluate how this might affect
our results in India, we created simulated chromosomes
of mixed European and Asian ancestry for demographic
parameters relevant to Indian groups (Table S7). The
choice of Europeans and East Asians as the ancestral popu-
lations for these simulations was motivated by the
fact that Fst(ANI, ASI) is approximately equivalent to
Fst(CEU, CHB) ¼ 0.09.1
We simulated data based on the framework described in
Moorjani et al.28 For each Indian group (Brahmins, Mala,
Pathan, Dravidian rank 1, and Indo-European rank 1), we
ran 100 simulations where we set the mixture proportion,
time since mixture, and number of samples to match the
parameters estimated for the specific group. Table S7 shows
that the average date of mixture from the 100 simulations
is consistent with the expected date (within one standard
error).
Appendix B: Test for Multiple Waves of Admixture
Here we describe amethod for identifying groups that have
evidence for more than one wave of admixture in their
history. The method is based on a likelihood ratio test
(LRT) for whether the admixture LD decay curves fit the
simple exponential decay expected for a single wave of
admixture. For this purpose we use the output obtained
from rolloff by using PCA-based SNP loadings as the
weights (Appendix A).
The null hypothesis is that there has been a single pulse
of admixture. We use least-squares to estimate the param-
eters of the null model by fitting y ¼ Ae�nd þ c, where
n ¼ the date of admixture and d ¼ the genetic distance.
The alternative hypothesis is that the population
has a history of two pulses of admixture. We fit
y ¼ Ae�n1d þ Be�n2d þ c where n1 ¼ date of the first pulse
of admixture and n2 ¼ date of the second pulse of admix-
ture. The log likelihood of each model is
�N
2
logeð2pÞ þ 1� logeðNÞ þ loge
Xni¼1
ε2i
!!;
(Equation A2)
where N ¼ the number of data points in each simulation
and εi ¼ the residuals of the fitted model (true(y) �fitted(y)).
The difference between the log likelihood of the null
versus the alternative hypothesis (�2*loge(likelihood of
2013
Please cite this article in press as: Moorjani et al., Genetic Evidence for Recent Population Mixture in India, The American Journal of HumanGenetics (2013), http://dx.doi.org/10.1016/j.ajhg.2013.07.006
null model) þ 2*loge(likelihood of the alternate model)) is
expected to be chi-square distributed with two degrees of
freedom.
To test whether the c2 approximation holds true in our
case, we performed 100,000 numerical simulations of
data under the null model of a single pulse of mixture
(date range of 1–300 generations) with normal noise
(mean ¼ 0, standard deviation ¼ 0.02). We then used
least-squares to estimate the parameters of the null
ðy ¼ Ae�nd þ cÞ and alternative ðy ¼ Ae�n1d þ Be�n2d þ cÞmodels and record the p value of the likelihood ratio test
assuming a distribution with 2 d.f. We reject the null hy-
pothesis in 5.7% of the simulations (Figure S4).
We applied the LRT method to all groups with R10
samples (the requirement of a minimum sample size is
motivated by the sensitivity of the test to noise in the
case of few samples). For most traditionally upper-caste
Indo-European groups, there is evidence to reject the null
hypothesis (Table 2). In contrast, other groups can be
reasonably well fit by the null model to within the limits
of our resolution.
We conclude by highlighting three caveats of this LRT.
(1) Without comparing the model of two pulses of
admixture with models of multiple pulses (>2) or gradual
admixture, we cannot conclude that a group has a history
of exactly two waves of admixture. In general, the true
histories of the groups consistent with the null model
almost certainly involved some amount of nonins-
tantaneous gene flow, so with sufficiently high sample
size, our test for a nonexponential decay would be almost
guaranteed to reject the null model.
(2) A second caveat is that our method might reject the
null because of sources of LD other than admixture, such
as LD due to founder events or ancestral LD. In theory,
however, this problem is mitigated by using PCA loadings
as weights.
(3) A third caveat is that autocorrelation across distant
bins in rolloff will make our likelihood scores anticonserva-
tive; we do not currently know how to correct for this auto-
correlation. Thus, we treat the evidence of multiple waves
of admixture as suggestive only and apply other formal
methods to identify groups that are consistent with a
single wave of ANI-ASI admixture.
Appendix C: Inferring the Number of Admixture
Events
Here we describe how we identified sets of Indian groups
consistent with mixture of the same two ancestral popula-
tions within the limits of our resolution.
Our approach was first introduced in Reich et al.,31
where it was applied to estimate the number of migrations
from Siberia into the Americas. Here, we coanalyze a
panel of Indian groups (m) along with a panel of non-
Indian groups (n). The idea is to compute f4 statistics
measuring the correlation in allele frequencies between
The Ame
each possible pair of Indian groups (m(m � 1)/2 compar-
isons) and each possible pair of non-Indian groups
(n(n � 1)/2 comparisons). Specifically, we compute statis-
tics like f4(Indian1, Indian2; NonIndian1, NonIndian2). If
the analyzed Indian groups harbor ancestry from exactly
the same pair of ancestral populations ANI and ASI (but
in different proportions), then the f4 statistics should be
proportional up to a scaling factor, and we can test this
null hypothesis.
To implement this procedure, we need to address the fact
that many of the f4 statistics can be written as linear com-
binations of each other, and therefore we need to pick a
basis for the space of f4 statistics. We fix one Indian group
as ‘‘Indianbase’’ and compute the f4 statistic for each of the
36 remaining Indian groups as ‘‘Indianother.’’ We fix an
African group (YRI) as ‘‘NonIndianbase’’ and use 37 diverse
Eurasian groups as ‘‘NonIndianother’’ (the choice of base
has no impact on the statistical findings). We then
compute all possible f4 statistics:
f4ðIndianbase; Indianother; NonIndianbase; NonIndianotherÞ:
This yields a matrix of m � 1 3 n � 1 dimensions. By
using a variant of singular value decomposition (SVD)
as in Reich et al.,31 we estimate the number of indepen-
dent components or rank of the f4 relationship
matrix.31 If the ANI and ASI ancestry in all tested Indian
groups derives from the same ancestral populations, the f4statistics measuring these correlations are expected to all
be proportional, and thus the matrix will have one inde-
pendent component or rank ¼ 1. However, if a tested
Indian group has a history of multiple gene flow events,
the rank is expected to be greater than 1. We test this
null hypothesis (rank ¼ 0) with a Hotelling T test as in
Reich et al.31 An extension of the same approach allows
us to also compute the minimum rank of the f4 matrix
needed to explain the data.31 Assuming no back-
migration from India into the panel of non-Indian
groups, we can interpret a rank of r as implying at least
r þ1 ancestral populations.
Simulations
To test the method for demographic parameters relevant to
Indian groups, we performed coalescent simulations by
ms.46 For each simulation, we generated data for ~250K
independent SNPs for 15 groups (Pop1–15, 10 samples
for each group). We set the effective population size (Ne)
for all groups to be 12,500 and the mutation and recombi-
nation rates at 23 10�8 and 13 10�8 per base pair per gen-
eration, respectively. Pop1 is the outgroup that diverged
from Pop2 and Pop3 about 1,800 generations ago. Pop2
and Pop3 diverged 900 generations ago. The relationship
of Pop1, Pop2, and Pop3 can be considered analogous to
the relationship of YRI, Onge, and CEU, respectively.
Pop4–9 are related to Pop3 analogously to the relationship
of West Eurasians to ANI, and these populations diverged
from Pop3 200–450 generations ago (Figure S5).
rican Journal of Human Genetics 93, 1–17, September 5, 2013 11
Please cite this article in press as: Moorjani et al., Genetic Evidence for Recent Population Mixture in India, The American Journal of HumanGenetics (2013), http://dx.doi.org/10.1016/j.ajhg.2013.07.006
Simulation 1: Single Gene-Flow Event with the Same
Admixing Populations
Consider the model in Figure S5. Pop10–15 are admixed
and derive between 20% and 80% ancestry from Pop20,which is closely related to Pop2 (the remaining ancestry
is from Pop30, which is related to Pop3). The date of admix-
ture for all groups (Pop10–15) is 100 generations ago.
These groups are analogous to the Indian cline with the
range of admixture proportions and dates set to be similar
to those inferred from real data. We estimate the rank of
the f4 relationship matrix, f4(Pop10–15; Pop1–9). Here,
Pop10 is analogous to Indianbase and Pop1 (an outgroup
to Pop2–15) is analogous to NonIndianbase. We infer that
the number of independent components is 1 (rank 1 at p
> 0.05).
Simulation 2: Two Gene-Flow Events Involving
Different Ancestral Populations
Pop10–15 are admixed and Pop10–14 have ancestry from
Pop20 and Pop30, with Pop30 ancestry varying between
20% and 80% (the remaining ancestry is from Pop20).Pop15 has 35% Pop40 and 65% Pop20 ancestry. All admix-
ture events occurred 100 generations ago. We estimate the
rank of the f4 relationship matrix as f4(Pop10–15; Pop1–9)
and infer the number of independent components to be 2.
If we remove Pop15 from the analysis, that is f4(Pop10–14;
Pop1–9), the inferred rank is 1, as expected.
Simulation 3: Three Independent Gene Flows with
Different Mixing Populations
Pop10–15 are admixed and Pop10–13 have ancestry from
populations 20 and 30, with Pop30 ancestry between 20%
and 80% (the remaining ancestry is from Pop20). Pop14has 70% Pop50 and 30% Pop20 ancestry, and Pop15 has
35% Pop40 and 65% Pop20 ancestry. All admixture events
occurred 100 generations ago. We estimate the rank of
the f4 relationship matrix f4(Pop10–15; Pop1–9) and infer
the number of independent components is 3.
Simulation 4: Two Independent Gene-Flow Events at
Different Time Periods
Pop10–15 are admixed and have ancestry from Pop20 andPop30, with Pop30 ancestry between 20% and 80%. Admix-
ture occurred 100 generations ago. Pop15 also has ancestry
from an older gene-flow event that occurred 150 genera-
tions ago with 50% Pop20 and 50% Pop30 ancestry. Thusoverall, Pop15 has 70% Pop20 and 30% Pop30 ancestry.
We estimate the rank of the f4 relationship matrix
f4(Pop10–15; Pop1–9) and infer the number of indepen-
dent components is 2.
Simulation 5: Multiple Independent Gene-Flow
Events at Different Time Periods
Pop10–15 are admixed with ancestry from Pop20 and
Pop30. Pop30 ancestry is between 20% and 80%. Admixture
occurred 50–300 (intervals of 50) generations ago (such
that Pop10 was admixed 50 generations ago, Pop11 was
12 The American Journal of Human Genetics 93, 1–17, September 5,
admixed 100 generations ago, etc.). We estimate the rank
of the f4 relationship matrix, f4(Pop10–15; Pop1–9), and
infer the number of independent components is 3.
In conclusion, our simulations demonstrate that we can
accurately estimate the minimum number of gene flow
events and that postadmixture drift alone does not change
the rank of the f4 relationship matrix.
Results
We performed a systematic analysis to identify groups that
have a similar history of ANI-ASI mixture, meaning that all
their ancestry is consistent with deriving from the same
ANI and ASI ancestral populations to within the limits of
our resolution. We restrict this analysis to Indian groups
with at least five samples and non-Indian groups that
have at least ten samples, including groups from East
Asia, Europe, the Middle East, the Caucasus, and Africa.
We remove Central Asian and South Asian populations
from the list of non-Indian groups because these have an
increased likelihood of back-migration from India in the
recent past that can complicate interpretation. We include
Vedda (four samples), an aboriginal population from Sri
Lanka, they appeared to have a relatively simple history
of ANI-ASI mixture in our preliminary analysis. The
analyzed data thus consists of m ¼ 37 Indian groups
(including Onge) and n ¼ 38 non-Indian groups.
To identify sets of Indian populations that are consistent
with deriving all their ancestry from exactly the same ANI-
ASI ancestral populations, we systematically explored sets
of these Indian groups. We used an iterative procedure,
as follows.
(1) Testing all possible sets of three Indian groups. We
start by computing
f4�Indianset of three groups; YRI; NonIndianother
�and estimate the ranks of the resulting 2 3 (n � 1) matrix
by a likelihood ratio test. We repeat this for all (37 3 36 3
35)/6 possible triples of Indian groups.
For each set of three Indian groups consistent with a
simple mixture of ANI and ASI (rank 1 at p > 0.05), we per-
formed a further level of testing for whether the model is
consistent with our data. Specifically, we run the admixture
graph phylogeny-testing software1,26 to test whether the
relationships shown in Figure S1 with Pop1 ¼ Georgians,
Pop2¼Basque, and India¼ set of three Indian groups being
tested is consistent with the data to within the limits of our
resolution (this is the same set of reference populations we
use for estimating ancestry proportions in f4 ratio estima-
tion and thus we are formally testing whether the model
underlying the estimation is valid). To evaluate signifi-
cance,we use the criterion thannone of the f2, f3, and f4 sta-
tistics relating the seven analyzed groups in the admixture
graph is more than three standard errors from expectation.
(2) Testing sets of four Indian groups. For all sets of three
Indian groups that pass these two tests, we advanced to the
next round, testing sets of four Indian groups for
2013
Please cite this article in press as: Moorjani et al., Genetic Evidence for Recent Population Mixture in India, The American Journal of HumanGenetics (2013), http://dx.doi.org/10.1016/j.ajhg.2013.07.006
consistency with being a simple mix of exactly the same
ANI and ASI ancestral populations. Specifically, we took
each of the passing sets of three Indian groups and added
in turn each of the remaining groups that were part of at
least one set that was rank 1.We applied the same two tests
for consistency with a simple ANI-ASI mixture, leading to
passing quadruples.
(3) Testing sets of five, six, and seven Indian groups. We
applied the same procedure to test larger sets of groups.
The results of each round are recorded in Tables S8 and
S9. We stopped finding sets of groups that pass the test
after m ¼ 6.
We highlight two qualitative results that emerge from
this analysis:
d Onge is often included in the sets of groups consistent
with rank 1, consistent with their being an ancient
sister group for ASI.1 However, for some sets of Indian
groups qualifying as rank 1, we cannot add in Onge,
suggesting that there also might be differences in
ASI ancestry within India.
d A higher proportion of sets including lower-caste and
tribal groups have rank 1 than is the case for sets
including upper-caste groups.
Appendix D: Test for a Single Wave of Admixture:
Comparison of Predicted and Observed ALDER
Amplitudes
To evaluate whether the admixture LD we are detecting in
India could plausibly reflect a single wave of gene flow
accounting for all the ANI-ASI mixture, we compared the
observed amplitude of LD decay and the ALDER theoret-
ical expectation for a model of single wave of mixture.32
We run ALDER with one reference population (X) and
plot the weighted covariance against genetic distance and
perform a least-squares fit by using y ¼ Ae�nd þ c, where n
is the number of generations since admixture and d the
genetic distance in Morgans. Under a single-wave mixture
model, the amplitude of admixture LD ðao ¼ Aþ c=2Þ is
analytically predicted by the ANI ancestry proportion (a)
and the genetic drift separating the ANI-ASI lineages by
Equation 4 (see population relationships in Figure S2).
The ANI ancestry proportion (a) can be estimated by
admixture graph or f4 ratio estimation, and the genetic drift
f2ðANI;X00Þ and f2ðASI;X00Þ (Figure S2) can be estimated by
fitting amodel of population relationships by using admix-
ture graph to the data for an analyzed set of populations. By
comparing the observed amplitude inferred from LD
(measured with ALDER) and the expected amplitude from
frequency correlations (using admixture graph or f4 ratio
estimation that use similar information), we can infer
how much of the total ANI ancestry in each Indian group
is due to mixture in the last few thousand years.
We applied this analysis to two sets of Indian groups, an
Indo-European rank 1 set consisting of four groups and a
The Ame
Dravidian rank 1 set consisting of five groups. We chose
these from all the sets identified in Appendix C based on
two criteria. (1) All groups are genotyped on the Affymetrix
arrays. This allows us to use significantly more SNPs (n ¼210,482 SNPs), thus improving the accuracy of ALDER. It
also allows us to include Onge, an essential population
for our admixture graph analysis. (2) The groups in the
sets span as large a range as possible of ANI ancestry, which
is valuable for constraining internal branch lengths in
admixture graph.
Based on these criteria, we chose the following two sets:
Indo-European rank 1 set (n ¼ 4 groups; 32 samples), con-
sisting of Bhil, Jain, Lodi, and Tharu; and Dravidian rank 1
set (n ¼ 5 groups, 33 samples), consisting of Adi-Dravidar,
Kuruchiyan, Madiga, Malai Kuravar, and Narikkuravar.
We used the population relationships shown in
Figure S1, but now with only one West Eurasian outgroup
(because we do not have access to Georgians on the
Affymetrix array) as input to admixture graph. We
confirmed that the Indo-European (n ¼ 32) and Dravidian
(n¼ 33) rank 1 sets are still good fits to the proposedmodel
by using the larger number of SNPs (n ¼ 210,482 rather
than n ¼ 86,213 used in Appendix C). Specifically, none
of the f2, f3, and f4 statistics comparing all possible sets of
groups are more than three standard errors from the
model-based expectation.
The fit generated by admixture graph allows us to esti-
mate the genetic drift that occurred between (1) ANI and
the population X00 that was ancestral to ANI and the sister
group (X) that we use in our admixture graph analysis (we
tried a range of West Eurasian groups X), and (2) ASI and
the population that was ancestral to ASI and the sister
group we use for them (Onge) (Figure S2). We are able to
estimate these branch lengths because we have access to
several admixed populations that we hypothesize descend
from the same admixture event based on the results of
Appendix C.
We compare the predicted amplitude of the admixture
LD from admixture graph (based on allele frequency
correlation and the expectation of Equation 4) to the
observations from ALDER for a variety of proposed West
Eurasian outgroups X and for the Indo-European and
Dravidian rank 1 sets (Table 3).
A complication of having only a single West Eurasian
outgroup in the admixture graph is that it causes the
model to be poorly constrained, but we can address this
limitation by fixing the value of the admixture proportion
(a) to be equal to the ANI ancestry inferred from f4 ratio
estimation by using the merged Illumina-Affymetrix data
set. In this merged data set, we have access to two West
Eurasian outgroups, allowing us to obtain precise ancestry
estimates. We use Georgians and Basque, based on the
admixture graph testing of Appendix C, and observe that
this model provides a good fit to the data for many Indian
groups.
To test whether the expected amplitude based on the
model of single admixture is consistent with the observed
rican Journal of Human Genetics 93, 1–17, September 5, 2013 13

Please cite this article in press as: Moorjani et al., Genetic Evidence for Recent Population Mixture in India, The American Journal of HumanGenetics (2013), http://dx.doi.org/10.1016/j.ajhg.2013.07.006
amplitude, we measure the difference between expected
amplitude and observed amplitude. For expected ampli-
tude, we use f4 ratio estimation on the set of Indian groups
to obtain a point estimate of the admixture proportion,
and we use admixture graph analysis on the same set of
Indian groups (using the constrained model described
above) to infer the genetic drift lengths f2ðANI;X00Þ and
f2ðASI;X00Þ. Substituting these numbers into the ALDER
amplitude formula (Equation 4) provides a precise mathe-
matical expectation for the amplitude of admixture LD for
the scenario that all the ANI-ASI admixture is due to a sin-
gle admixture event. For observed amplitude, we obtain
this by performing ALDER analysis for the same set of
Indian groups with Basque as the reference population.
To infer statistical uncertainty of (observed � expected)
amplitude, we use a weighted block jackknife, dropping
each chromosome in turn and repeating the entire proce-
dure. This produces a standard error and allows us to test
whether the difference is consistent with zero (consistent
with the nullmodel of a single wave of ANI-ASI admixture).
In practice, we did not find significant evidence for a dif-
ference between the observed and expected amplitudes in
India. However, it is also valuable to estimate an upper
bound on the proportion of ANI ancestry that could
possibly derive from an earlier wave of admixture under
the assumption that there were multiple waves but we
cannot detect significant evidence for them. To do this,
we consider the alternative hypothesis that there were
two waves of admixture and infer the maximum propor-
tion of ANI ancestry from the earlier wave that could
possibly be consistent with the observed LD decay.
Specifically, the model we are considering is two waves
of admixture from ANI-related ancestral populations with
the same allele frequencies, with the older wave old
enough that its contribution to the measured LD is negli-
gible. In this model, present-day Indian groups derive their
ancestry from three sources: old ANI (aold), recent ANI
(anew), and ASI (1 � atotal ¼ 1 � (aold þ anew)). Hence, the
second wave of ANI ancestry (proportion: anew) enters an
admixed population (proportion: 1 � anew) whose allele
frequencies can be written as a linear combination from
the first wave:�aold
ð1� anewÞ�� Aþ
�1�
�aold
ð1� anewÞ��
� B
(Equation A3)
where A is the allele frequency in ANI and B is the allele fre-
quency in ASI.
The expected one-reference-population ALDER amplitude
is then
ao¼2anewð1�anewÞð1�atotalÞ2ð1�anewÞ2
ðatotalf2ðANI;X00Þ
�ð1�atotalÞf2ðASI;X00ÞÞ2; (Equation A4)
which reduces to Equation 5 shown earlier.
14 The American Journal of Human Genetics 93, 1–17, September 5,
The last squared factor remains the same as in the single-
wave case because we have assumed that the two ANI
populations have the same allele frequencies. Note that
replacing aold ¼ 0 (so that anew ¼ atotal) reduces Equation 5
to Equation 4. The amplitude with the two-wave model is
lower than the corresponding value for a single wave of
admixture, because the admixture LD resulting from the
older wave is no longer detectable beyond the shortest
genetic distances. Thus, if the observed amplitude is lower
than the expected (single-wave) amplitude, we can find
the value of aold that would explain the difference under
a two-wave model. We run a weighted block jackknife
(removing one chromosome in each run) to estimate the
range of aold. In practice, our 95% central confidence
interval overlaps zero. Thus, we compute a one-sided
95% confidence interval for aold of 0% to the mean þ1.65*(standard error).
Simulations
We tested the accuracy of the methodology in scenarios
simulated to resemble hypothetical admixture histories
of India. To capture some of the complexities of real
human populations, we built our simulated data sets by
using phased haplotypes from real groups from HGDP
and HapMap via the method described in Moorjani
et al.28 Specifically, we simulated two sets of admixed
groups. Set 1 consisted of three groups with [30%, 50%,
70%] ancestry from Europeans (HapMap CEU) and the re-
maining ancestry from East Asians (HGDP Han). Set 2 con-
sisted of three groups with [20%, 30%, 40%] ancestry from
Europeans and the remaining ancestry from East Asians.
For each group, we generated 14 diploid individuals un-
der two alternative admixture histories: (1) a single CEU-
Han admixture event 100 generations ago and (2) two
waves of CEU admixture into Han, 300 and 75 generations
ago, that together produce the same total fraction of CEU
ancestry as shown above.
To perform the admixture graph analysis, we require
additional outgroups. For this we use real data from
HGDP French, Basque, Yoruba, and Dai and use the model
shown in Figure S6.We use the drift lengths and admixture
proportions estimated by admixture graph to compute the
expected amplitude (note that the constraint of fixing the
admixture proportion from f4 ratio estimation is not
required because we have two West Eurasian outgroups
here). We performed ALDER single-reference analysis for
each set of admixed groups with the Basque and Dai as
single reference populations (independently). We note
that we do not reuse the CEU or Han populations (used
for generating the simulated data) in our inference proce-
dure, to account for the fact that we do not have access
to the true ancestral populations (ANI and ASI) for India.
We created simulated populations in groups of three to
allow us to infer the necessary f2 values in the amplitude
formula.
We designed our simulations to qualitatively match the
scenario relevant to India. In Figure S6, the four outgroups
2013
Please cite this article in press as: Moorjani et al., Genetic Evidence for Recent Population Mixture in India, The American Journal of HumanGenetics (2013), http://dx.doi.org/10.1016/j.ajhg.2013.07.006
(French, Basque, Yoruba, and Dai) take the place of
Georgians, Basque, YRI, and Onge in Figure S1. For the
simulated histories, we chose a date of 100 generations
ago to be similar to the observed average age of ANI-ASI
admixture in India. The two-wave dates of 300 and 75 gen-
erations ago provide a plausible alternative scenario
yielding an ALDER curve similar to the expectation for a
single-wave mixture 100 generations ago. Finally, the two
simulated population sets covered distinct ranges of
admixture proportion space, one with larger CEU ancestry
components and higher ancestry proportion variation
than the other. For both sets, our inference methods pro-
vide reliable results (Table S5).
Our simulation results demonstrate that for a single-
wave admixture history, the weighted LD amplitude
measured by ALDER is consistent with the expectation of
our formula, whereas in the case of two-wave admixture,
the measured ALDER amplitude is smaller than the
expectation of Equation 4 (Table S5). Out of the 12 popu-
lation-reference pairs, the difference in the amplitudes is
statistically consistent with zero (jZj < 3) for all single-
wave simulations, whereas the difference is significantly
different from zero in 8 of the 12 two-wave simulations,
including all 6 with Basque as the reference population.
The estimates of the mixture proportion aold required to
explain the amplitude discrepancy under the alternate
model are considerably smaller for the single-wave simu-
lated data, with zero always within the confidence interval
(Table S5).
Results
(1) Indo-European rank 1 set: For all West Eurasian groups,
the model of relationships shown in Figure S2 provides a
good fit to the Indo-European rank 1 data as assessed by
admixture graph (such that none of the f statistics are
greater than three standard errors from expectation).
Therefore we substitute the admixture proportions and
drift lengths f2ðANI;X00Þ and f2ðASI;X00Þ computed by
admixture graph in Equation 4 to estimate the expected
amplitude. We observe that the expected amplitude is
consistent with the observed amplitude (jZj< 3 for a differ-
ence between the two estimates over all seven West
Eurasian groups we tested) (Table 3).
For the constrained analysis, we focused on Basque as the
reference population and fixed the ANI ancestry propor-
tion from f4 ratio estimation as described above. We com-
pute the difference in amplitude (observed � expected)
and find that the two estimates are statistically consistent
(Z ¼ �0.35). This suggests that the model of a single wave
of ANI-ASI admixture is consistent with our data.
Applying the alternate two-wave amplitude formula
(Equation 5), we estimate aold to be 4.5% 5 8.5%, giving
a 95% confidence interval of 0%–18.6%. Therefore we
find no evidence to reject a single-wave model with all
ancestry contributing to the measured admixture LD.
(2) Dravidian rank 1 set: Similar to the Indo-European
rank 1 set, we applied admixture graph and ALDER to
The Ame
the Dravidian rank 1 data with various West Eurasian
groups as references and found that the expected and
observed amplitudes are consistent (jZj < 3) for all refer-
ence populations tested (Table 3).
We focused next on Basque as the reference population
and used the ANI estimate from f4 ratio estimation. The
expected amplitude is consistent with the observed ampli-
tude in ALDER (Z ¼ �1.06), suggesting that the model of a
single wave of ANI-ASI ancestry provides a fit to the data.
The proportion of ANI ancestry unexplained by our model
(aold) is 7.1% 5 5.5%, with a 95% confidence interval of
0%–16.2% (truncated at 0).
In conclusion, our data are consistent with the null
model of a single wave of ANI-ASI admixture in selected
Indo-European and Dravidian groups in India.
Supplemental Data
Supplemental Data include six figures and nine tables and can be
found with this article online at http://www.cell.com/AJHG/.
Acknowledgments
We thank the volunteers who donated DNA samples.We acknowl-
edge the help of Rakesh Tamang, Justin Carlus, and A. Govardhana
Reddy in sample collection and handling. We thank Richard
Meadow and Michael Witzel for discussions and critical readings
of themanuscript. P.M., N.P., and D.R. were supported by National
Institutes of Health grant GM100233 and National Science Foun-
dation HOMINID grant 1032255. M.L. and P.-R.L. were supported
by NSF Graduate Research Fellowships. K.T. was supported by a
UKIERI Major Award (RG-4772) and the Network Project
(GENESIS: BSC0121) fund from the Council of Scientific and
Industrial Research, Government of India. L.S. was supported by
a Bhatnagar Fellowship grant from the Council of Scientific and
Industrial Research of the Government of India and by a J.C.
Bose Fellowship from the Department of Science and Technology,
Government of India. Genotyping data for the samples collected
for this study will be made available upon request from the corre-
sponding authors.
Received: March 4, 2013
Revised: May 29, 2013
Accepted: July 1, 2013
Published: August 8, 2013
References
1. Reich, D., Thangaraj, K., Patterson, N., Price, A.L., and Singh,
L. (2009). Reconstructing Indian population history. Nature
461, 489–494.
2. Sahoo, S., and Kashyap, V.K. (2006). Phylogeography of mito-
chondrial DNA and Y-chromosome haplogroups reveal asym-
metric gene flow in populations of Eastern India. Am. J. Phys.
Anthropol. 131, 84–97.
3. Kivisild, T., Bamshad, M.J., Kaldma, K., Metspalu, M.,
Metspalu, E., Reidla, M., Laos, S., Parik, J., Watkins, W.S.,
Dixon, M.E., et al. (1999). Deep common ancestry of indian
and western-Eurasian mitochondrial DNA lineages. Curr.
Biol. 9, 1331–1334.
rican Journal of Human Genetics 93, 1–17, September 5, 2013 15
Please cite this article in press as: Moorjani et al., Genetic Evidence for Recent Population Mixture in India, The American Journal of HumanGenetics (2013), http://dx.doi.org/10.1016/j.ajhg.2013.07.006
4. Thangaraj, K., Chaubey, G., Singh, V.K., Vanniarajan, A.,
Thanseem, I., Reddy, A.G., and Singh, L. (2006). In situ origin
of deep rooting lineages of mitochondrial Macrohaplogroup
‘M’ in India. BMC Genomics 7, 151.
5. Metspalu, M., Kivisild, T., Metspalu, E., Parik, J., Hudjashov,
G., Kaldma, K., Serk, P., Karmin, M., Behar, D.M., Gilbert,
M.T.P., et al. (2004). Most of the extant mtDNA boundaries
in south and southwest Asia were likely shaped during the
initial settlement of Eurasia by anatomically modern humans.
BMC Genet. 5, 26.
6. Brahmachari, S., Majumder, P., Mukerji, M., Habib, S., Dash,
D., Ray, K., and Bahl, S.; Indian Genome Variation Con-
sortium. (2008). Genetic landscape of the people of India: a
canvas for disease gene exploration. J. Genet. 87, 3–20.
7. Metspalu, M., Romero, I.G., Yunusbayev, B., Chaubey, G.,
Mallick, C.B., Hudjashov, G., Nelis, M., Magi, R., Metspalu,
E., Remm, M., et al. (2011). Shared and unique components
of human population structure and genome-wide signals of
positive selection in South Asia. Am. J. Hum. Genet. 89,
731–744.
8. Auton, A., Bryc, K., Boyko, A.R., Lohmueller, K.E., Novembre,
J., Reynolds, A., Indap, A., Wright, M.H., Degenhardt, J.D.,
Gutenkunst, R.N., et al. (2009). Global distribution of genomic
diversity underscores rich complex history of continental
human populations. Genome Res. 19, 795–803.
9. Renfrew, C. (1990). Archaeology and Language: The Puzzle of
Indo-European Origins (New York: Cambridge University
Press).
10. Costantini, L. (1984). The beginning of agriculture in the
Kachi Plain: the evidence of Mehrgarh. In South Asian Archae-
ology 1981, B. Allchin, ed. (Cambridge: Cambridge University
Press), pp. 29–33.
11. Fuller, D.Q. (2011). Finding plant domestication in the Indian
subcontinent. Curr. Anthropol. 52 (S4), S347–S362.
12. Witzel, M. (1999). Substrate languages in Old Indo-Aryan
(Rgvedic, Middle and Late Vedic). Electronic J. Vedic Studies
5, 1–67.
13. Mallory, J.P., and Adams, D.Q. (1997). Encyclopedia of Indo-
European Culture (London: Routledge).
14. Kivisild, T., Rootsi, S., Metspalu, M., Metspalu, E., Parik, J.,
Kaldma, K., Usanga, E., Mastana, S., Papiha, S., and Villems,
R. (2003). The genetics of language and farming spread
in India. Examining the farming/language dispersal
hypothesis. In McDonald Institute Monograph Series (Cam-
bridge: McDonald Institute for Archaeological Research),
pp. 215–222.
15. Bramanti, B., Thomas, M.G., Haak, W., Unterlaender, M.,
Jores, P., Tambets, K., Antanaitis-Jacobs, I., Haidle, M.N.,
Jankauskas, R., Kind, C.-J., et al. (2009). Genetic discontinuity
between local hunter-gatherers and central Europe’s first
farmers. Science 326, 137–140.
16. Skoglund, P., Malmstrom, H., Raghavan, M., Stora, J., Hall, P.,
Willerslev, E., Gilbert, M.T.P., Gotherstrom, A., and Jakobsson,
M. (2012). Origins and genetic legacy of Neolithic farmers and
hunter-gatherers in Europe. Science 336, 466–469.
17. Kenoyer, J.M. (1998). Ancient Cities of the Indus Valley
Civilization (Karachi: Oxford University Press).
18. Trautmann, T.R. (2005). The Aryan Debate (New Delhi: Ox-
ford University Press).
19. Bryant, E.F., and Patton, L.L. (2005). The Indo-Aryan Contro-
versy: Evidence and Inference in Indian History (London:
Routledge).
16 The American Journal of Human Genetics 93, 1–17, September 5,
20. Li, J.Z., Absher, D.M., Tang, H., Southwick, A.M., Casto, A.M.,
Ramachandran, S., Cann, H.M., Barsh, G.S., Feldman, M.,
Cavalli-Sforza, L.L., and Myers, R.M. (2008). Worldwide hu-
man relationships inferred from genome-wide patterns of
variation. Science 319, 1100–1104.
21. Shah, A.M., Tamang, R., Moorjani, P., Rani, D.S., Govindaraj,
P., Kulkarni, G., Bhattacharya, T., Mustak, M.S., Bhaskar,
L.V., Reddy, A.G., et al. (2011). Indian Siddis: African des-
cendants with Indian admixture. Am. J. Hum. Genet. 89,
154–161.
22. Lopez Herraez, D., Bauchet, M., Tang, K., Theunert, C.,
Pugach, I., Li, J., Nandineni, M.R., Gross, A., Scholz, M., and
Stoneking, M. (2009). Genetic variation and recent positive
selection in worldwide human populations: evidence from
nearly 1 million SNPs. PLoS ONE 4, e7888.
23. Altshuler, D.M., Gibbs, R.A., Peltonen, L., Altshuler, D.M.,
Gibbs, R.A., Peltonen, L., Dermitzakis, E., Schaffner, S.F., Yu,
F., Peltonen, L., et al.; International HapMap 3 Consortium.
(2010). Integrating common and rare genetic variation in
diverse human populations. Nature 467, 52–58.
24. Behar, D.M., Yunusbayev, B., Metspalu, M., Metspalu, E.,
Rosset, S., Parik, J., Rootsi, S., Chaubey, G., Kutuev, I., and
Yudkovsky, G. (2010). The genome-wide structure of the Jew-
ish people. Nature 466, 238–242.
25. Yunusbayev, B., Metspalu, M., Jarve, M., Kutuev, I., Rootsi, S.,
Metspalu, E., Behar, D.M., Varendi, K., Sahakyan, H., Khusai-
nova, R., et al. (2012). The Caucasus as an asymmetric semi-
permeable barrier to ancient human migrations. Mol. Biol.
Evol. 29, 359–365.
26. Patterson, N., Moorjani, P., Luo, Y., Mallick, S., Rohland, N.,
Zhan, Y., Genschoreck, T., Webster, T., and Reich, D. (2012).
Ancient admixture in human history. Genetics 192, 1065–
1093.
27. Abbi, A. (2009). Is Great Andamanese genealogically and
typologically distinct from Onge and Jarawa? Lang. Sci. 31,
791–812.
28. Moorjani, P., Patterson, N., Hirschhorn, J.N., Keinan, A.,
Hao, L., Atzmon, G., Burns, E., Ostrer, H., Price, A.L., and
Reich, D. (2011). The history of African gene flow into
Southern Europeans, Levantines, and Jews. PLoS Genet. 7,
e1001373.
29. Moorjani, P., Patterson, N., Loh, P.-R., Lipson, M., Kisfali, P.,
Melegh, B.I., Bonin, M., Kada�si, L’., Rieß, O., Berger, B., et al.
(2013). Reconstructing Roma history from genome-wide
data. PLoS ONE 8, e58633.
30. Busing, F., Meijer, E., and Leeden, R. (1999). Delete-m Jack-
knife for Unequal m. Stat. Comput. 9, 3–8.
31. Reich, D., Patterson, N., Campbell, D., Tandon, A., Mazieres,
S., Ray, N., Parra, M.V., Rojas, W., Duque, C., Mesa, N., et al.
(2012). Reconstructing Native American population history.
Nature 488, 370–374.
32. Loh, P.R., Lipson, M., Patterson, N., Moorjani, P., Pickrell, J.K.,
Reich, D., and Berger, B. (2013). Inferring admixture histories
of human populations using weighted linkage disequilibrium.
Genetics 193, 1233–1254.
33. Reich, D., Patterson, N., Kircher, M., Delfin, F., Nandineni,
M.R., Pugach, I., Ko, A.M.S., Ko, Y.C., Jinam, T.A., Phipps,
M.E., et al. (2011). Denisova admixture and the first modern
human dispersals into Southeast Asia and Oceania. Am. J.
Hum. Genet. 89, 516–528.
34. Chakraborty, R., and Weiss, K.M. (1988). Admixture as a tool
for finding linked genes and detecting that difference from
2013

Please cite this article in press as: Moorjani et al., Genetic Evidence for Recent Population Mixture in India, The American Journal of HumanGenetics (2013), http://dx.doi.org/10.1016/j.ajhg.2013.07.006
allelic association between loci. Proc. Natl. Acad. Sci. USA 85,
9119–9123.
35. Fenner, J.N. (2005). Cross-cultural estimation of the
human generation interval for use in genetics-based popula-
tion divergence studies. Am. J. Phys. Anthropol. 128,
415–423.
36. Osborne, M., and Smyth, G. (1986). An algorithm for expo-
nential fitting revisited. J. Appl. Probab. 23, 419–430.
37. Pickrell, J.K., Patterson, N., Barbieri, C., Berthold, F., Gerlach,
L., Guldemann, T., Kure, B., Mpoloka, S.W., Nakagawa, H.,
Naumann, C., et al. (2012). The genetic prehistory of southern
Africa. Nat. Commun. 3, 1143.
38. Barik, S.S., Sahani, R., Prasad, B.V., Endicott, P., Metspalu,
M., Sarkar, B.N., Bhattacharya, S., Annapoorna, P.C., Sree-
nath, J., Sun, D., et al. (2008). Detailed mtDNA genotypes
permit a reassessment of the settlement and population
structure of the Andaman Islands. Am. J. Phys. Anthropol.
136, 19–27.
39. Meadow R.H., ed. (1991). Harappa Excavations 1986-1990: A
Multidisciplinary Approach to Third Millenium Urbanism
(Madison: Prehistory Press).
The Ame
40. Lawler, A. (2008). Unmasking the Indus. Indus collapse: the
end or the beginning of an Asian culture? Science 320,
1281–1283.
41. Sarkar, S.S. (1964). Ancient Races of Baluchistan, Panjab, and
Sind (Calcutta: Bookland).
42. Witzel, M. (1995). Early Indian history: linguistic and textual
parameters. In The Indo-Aryans of Ancient South Asia: Lan-
guage, Material Culture and Ethnicity, G. Erdosy, ed. (Berlin:
de Gruyter), pp. 85–125.
43. Naegele, C.J. (2008). History and influence of law code of
Manu. SJD thesis, Golden Gate University School of Law,
San Francisco, CA.
44. Haak, W., Forster, P., Bramanti, B., Matsumura, S., Brandt, G.,
Tanzer, M., Villems, R., Renfrew, C., Gronenborn, D., and Alt,
K.W. (2005). Ancient DNA from the first European farmers in
7500-year-old Neolithic sites. Science 310, 1016–1018.
45. Malmer, M.P. (2002). The Neolithic of South Sweden: TRB,
GRK, and STR (Stockholm: Royal Academy of Letters).
46. Hudson, R.R. (2002). Generating samples under a Wright-
Fisher neutral model of genetic variation. Bioinformatics 18,
337–338.
rican Journal of Human Genetics 93, 1–17, September 5, 2013 17