indo-european languages in europe -...
TRANSCRIPT

LETTERdoi:10.1038/nature14317
Massive migration from the steppe was a source forIndo-European languages in EuropeWolfgang Haak1*, Iosif Lazaridis2,3*, Nick Patterson3, Nadin Rohland2,3, Swapan Mallick2,3,4, Bastien Llamas1, Guido Brandt5,Susanne Nordenfelt2,3, Eadaoin Harney2,3,4, Kristin Stewardson2,3,4, Qiaomei Fu2,3,6,7, Alissa Mittnik8, Eszter Banffy9,10,Christos Economou11, Michael Francken12, Susanne Friederich13, Rafael Garrido Pena14, Fredrik Hallgren15, Valery Khartanovich16,Aleksandr Khokhlov17, Michael Kunst18, Pavel Kuznetsov17, Harald Meller13, Oleg Mochalov17, Vayacheslav Moiseyev16,Nicole Nicklisch5,13,19, Sandra L. Pichler20, Roberto Risch21, Manuel A. Rojo Guerra22, Christina Roth5, Anna Szecsenyi-Nagy5,9,Joachim Wahl23, Matthias Meyer6, Johannes Krause8,12,24, Dorcas Brown25, David Anthony25, Alan Cooper1,Kurt Werner Alt5,13,19,20 & David Reich2,3,4
We generated genome-wide data from 69 Europeans who livedbetween 8,000–3,000 years ago by enriching ancient DNA librariesfor a target set of almost 400,000 polymorphisms. Enrichment ofthese positions decreases the sequencing required for genome-wideancient DNA analysis by a median of around 250-fold, allowing usto study an order of magnitude more individuals than previousstudies1–8 and to obtain new insights about the past. We show thatthe populations of Western and Far Eastern Europe followed oppositetrajectories between 8,000–5,000 years ago. At the beginning of theNeolithic period in Europe, 8,000–7,000 years ago, closely relatedgroups of early farmers appeared in Germany, Hungary and Spain,different from indigenous hunter-gatherers, whereas Russia was inhab-ited by a distinctive population of hunter-gatherers with high affinityto a 24,000-year-old Siberian6. By 6,000–5,000 years ago, farmersthroughout much of Europe had more hunter-gatherer ancestry thantheir predecessors, but in Russia, the Yamnaya steppe herders of thistime were descended not only from the preceding eastern Europeanhunter-gatherers, but also from a population of Near Eastern ances-try. Western and Eastern Europe came into contact 4,500 years ago,as the Late Neolithic Corded Ware people from Germany traced
75% of their ancestry to the Yamnaya, documenting a massivemigration into the heartland of Europe from its eastern periphery.This steppe ancestry persisted in all sampled central Europeans untilat least 3,000 years ago, and is ubiquitous in present-day Europeans.These results provide support for a steppe origin9 of at least some ofthe Indo-European languages of Europe.
Genome-wide analysis of ancient DNA has emerged as a transform-ative technology for studying prehistory, providing information that iscomparable in power to archaeology and linguistics. Realizing its pro-mise, however, requires collecting genome-wide data from an adequatenumber of individuals to characterize population changes over time,which means not only sampling a succession of archaeological cultures2,but also multiple individuals per culture. To make analysis of large num-bers of ancient DNA samples practical, we used in-solution hybridiza-tion capture10,11 to enrich next generation sequencing libraries for a
target set of 394,577 single nucleotide polymorphisms (SNPs) (‘390kcapture’), 354,212 of which are autosomal SNPs that have also beengenotyped using the Affymetrix Human Origins array in 2,345 humansfrom 203 populations4,12. This reduces the amount of sequencing re-quired to obtain genome-wide data by a minimum of 45-fold and amedian of 262-fold (Supplementary Data 1). This strategy allows us toreport genomic scale data on more than twice the number of ancientEurasians as has been presented in the entire preceding literature1–8
(Extended Data Table 1).We used this technology to study population transformations in Europe.
We began by preparing 212 DNA libraries from 119 ancient samples indedicated clean rooms, and testing these by light shotgun sequencingand mitochondrial genome capture (Supplementary Information sec-tion 1, Supplementary Data 1). We restricted the analysis to librarieswith molecular signatures of authentic ancient DNA (elevated damagein the terminal nucleotide), negligible evidence of contamination basedon mismatches to the mitochondrial consensus13 and, where available,a mitochondrial DNA haplogroup that matched previous results usingPCR4,14,15 (Supplementary Information section 2). For 123 librariesprepared in the presence of uracil-DNA-glycosylase16 to reduce errorsdue to ancient DNA damage17, we performed 390k capture, carried outpaired-end sequencing and mapped the data to the human genome.We restricted analysis to 94 libraries from 69 samples that had at least0.06-fold average target coverage (average of 3.8-fold) and used major-ity rule to call an allele at each SNP covered at least once (Supplemen-tary Data 1). After combining our data (Supplementary Informationsection 3) with 25 ancient samples from the literature — three UpperPaleolithic samples from Russia1,6,7, seven people of European hunter-gatherer ancestry2,4,5,8, and fifteen European farmers2,3,4,8 — we had datafrom 94 ancient Europeans. Geographically, these came from Germany(n 5 41), Spain (n 5 10), Russia (n 5 14), Sweden (n 5 12), Hungary(n 5 15), Italy (n 5 1) and Luxembourg (n 5 1) (Extended Data Table 2).Following the central European chronology, these included 19 hunter-gatherers (,43,000–2,600 BC), 28 Early Neolithic farmers (,6,000–4,000 BC), 11 Middle Neolithic farmers (,4,000–3,000 BC) including
*These authors contributed equally to this work.
1Australian Centre for Ancient DNA, School of Earth and Environmental Sciences& Environment Institute, University of Adelaide, Adelaide, South Australia5005, Australia. 2Departmentof Genetics, HarvardMedical School, Boston, Massachusetts 02115, USA. 3Broad Institute of Harvard and MIT, Cambridge, Massachusetts 02142, USA. 4Howard Hughes Medical Institute, Harvard Medical School, Boston,Massachusetts 02115, USA. 5Institute of Anthropology, Johannes Gutenberg University of Mainz, D-55128 Mainz, Germany. 6Max Planck Institute for Evolutionary Anthropology, D-04103 Leipzig,Germany. 7Key Laboratory of Vertebrate Evolution and Human Origins of Chinese Academy of Sciences, IVPP, CAS, Beijing 100049, China. 8Institute for Archaeological Sciences, University of Tubingen,D-72070 Tubingen, Germany. 9Institute of Archaeology, Research Centre for the Humanities, Hungarian Academy of Science, H-1014 Budapest, Hungary. 10Romisch Germanische Kommission (RGK)Frankfurt, D-60325 Frankfurt, Germany. 11Archaeological Research Laboratory, Stockholm University, 114 18 Stockholm, Sweden. 12Departments of Paleoanthropology and Archaeogenetics,Senckenberg Center for Human Evolution and Paleoenvironment, University of Tubingen, D-72070 Tubingen, Germany. 13State Office for Heritage Management and Archaeology Saxony-Anhalt and StateMuseum of Prehistory, D-06114 Halle, Germany. 14Departamento de Prehistoria y Arqueologıa, Facultad de Filosofıa y Letras, Universidad Autonoma de Madrid, E-28049 Madrid, Spain. 15The CulturalHeritage Foundation, Vasteras 722 12, Sweden. 16Peter the Great Museum of Anthropology and Ethnography (Kunstkamera) RAS, St Petersburg 199034, Russia. 17Volga State Academy of Social Sciencesand Humanities, Samara 443099, Russia. 18Deutsches Archaeologisches Institut, Abteilung Madrid, E-28002 Madrid, Spain. 19Danube Private University, A-3500 Krems, Austria. 20Institute for Prehistoryand Archaeological Science, University of Basel, CH-4003 Basel, Switzerland. 21Departamento de Prehistoria, Universitat Autonoma de Barcelona, E-08193 Barcelona, Spain. 22Departamento dePrehistoria y Arqueolgia, Universidad de Valladolid, E-47002 Valladolid, Spain. 23State Office for Cultural Heritage Management Baden-Wurttemberg, Osteology, D-78467 Konstanz, Germany. 24Max PlanckInstitute for the Science of Human History, D-07745 Jena, Germany. 25Anthropology Department, Hartwick College, Oneonta, New York 13820, USA.
0 0 M O N T H 2 0 1 5 | V O L 0 0 0 | N A T U R E | 1
Macmillan Publishers Limited. All rights reserved©2015
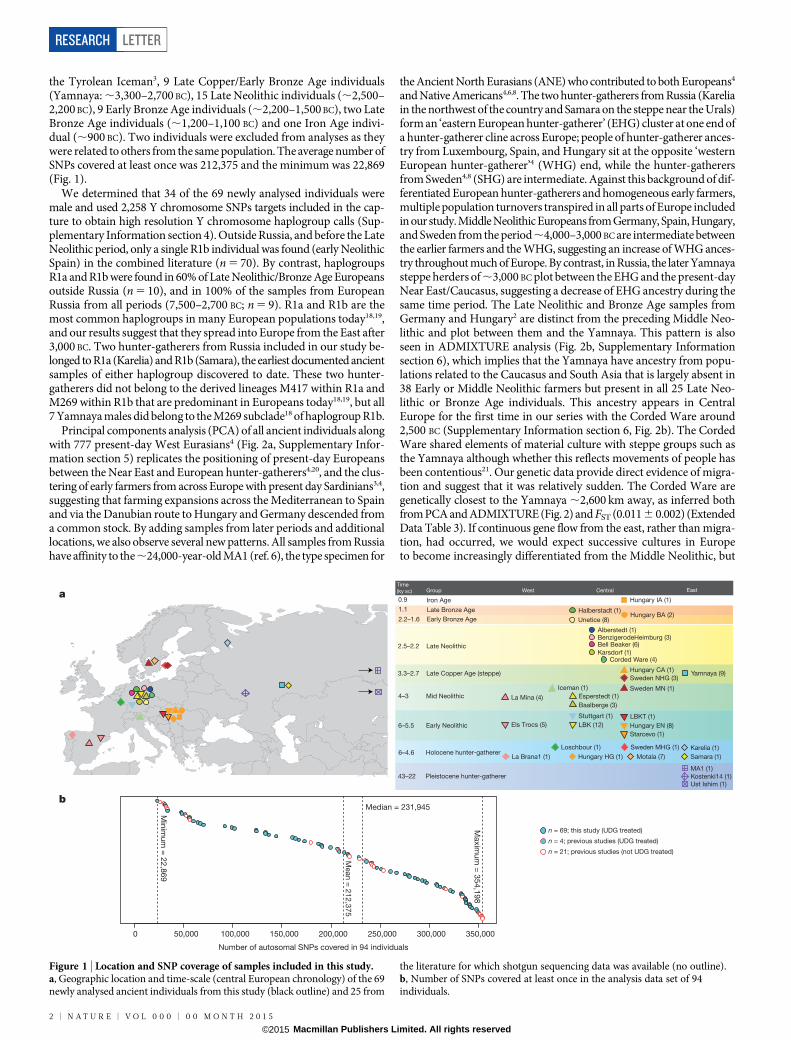
the Tyrolean Iceman3, 9 Late Copper/Early Bronze Age individuals(Yamnaya: ,3,300–2,700 BC), 15 Late Neolithic individuals (,2,500–2,200 BC), 9 Early Bronze Age individuals (,2,200–1,500 BC), two LateBronze Age individuals (,1,200–1,100 BC) and one Iron Age indivi-dual (,900 BC). Two individuals were excluded from analyses as theywere related to others from the same population. The average number ofSNPs covered at least once was 212,375 and the minimum was 22,869(Fig. 1).
We determined that 34 of the 69 newly analysed individuals weremale and used 2,258 Y chromosome SNPs targets included in the cap-ture to obtain high resolution Y chromosome haplogroup calls (Sup-plementary Information section 4). Outside Russia, and before the LateNeolithic period, only a single R1b individual was found (early NeolithicSpain) in the combined literature (n 5 70). By contrast, haplogroupsR1a and R1b were found in 60% of Late Neolithic/Bronze Age Europeansoutside Russia (n 5 10), and in 100% of the samples from EuropeanRussia from all periods (7,500–2,700 BC; n 5 9). R1a and R1b are themost common haplogroups in many European populations today18,19,and our results suggest that they spread into Europe from the East after3,000 BC. Two hunter-gatherers from Russia included in our study be-longed to R1a (Karelia) and R1b (Samara), the earliest documented ancientsamples of either haplogroup discovered to date. These two hunter-gatherers did not belong to the derived lineages M417 within R1a andM269 within R1b that are predominant in Europeans today18,19, but all7 Yamnaya males did belong to the M269 subclade18 of haplogroup R1b.
Principal components analysis (PCA) of all ancient individuals alongwith 777 present-day West Eurasians4 (Fig. 2a, Supplementary Infor-mation section 5) replicates the positioning of present-day Europeansbetween the Near East and European hunter-gatherers4,20, and the clus-tering of early farmers from across Europe with present day Sardinians3,4,suggesting that farming expansions across the Mediterranean to Spainand via the Danubian route to Hungary and Germany descended froma common stock. By adding samples from later periods and additionallocations, we also observe several new patterns. All samples from Russiahave affinity to the ,24,000-year-old MA1 (ref. 6), the type specimen for
the Ancient North Eurasians (ANE) who contributed to both Europeans4
and Native Americans4,6,8. The two hunter-gatherers from Russia (Kareliain the northwest of the country and Samara on the steppe near the Urals)form an ‘eastern European hunter-gatherer’ (EHG) cluster at one end ofa hunter-gatherer cline across Europe; people of hunter-gatherer ances-try from Luxembourg, Spain, and Hungary sit at the opposite ‘westernEuropean hunter-gatherer’4 (WHG) end, while the hunter-gatherersfrom Sweden4,8 (SHG) are intermediate. Against this background of dif-ferentiated European hunter-gatherers and homogeneous early farmers,multiple population turnovers transpired in all parts of Europe includedin our study. Middle Neolithic Europeans from Germany, Spain, Hungary,and Sweden from the period ,4,000–3,000 BC are intermediate betweenthe earlier farmers and the WHG, suggesting an increase of WHG ances-try throughout much of Europe. By contrast, in Russia, the later Yamnayasteppe herders of ,3,000 BC plot between the EHG and the present-dayNear East/Caucasus, suggesting a decrease of EHG ancestry during thesame time period. The Late Neolithic and Bronze Age samples fromGermany and Hungary2 are distinct from the preceding Middle Neo-lithic and plot between them and the Yamnaya. This pattern is alsoseen in ADMIXTURE analysis (Fig. 2b, Supplementary Informationsection 6), which implies that the Yamnaya have ancestry from popu-lations related to the Caucasus and South Asia that is largely absent in38 Early or Middle Neolithic farmers but present in all 25 Late Neo-lithic or Bronze Age individuals. This ancestry appears in CentralEurope for the first time in our series with the Corded Ware around2,500 BC (Supplementary Information section 6, Fig. 2b). The CordedWare shared elements of material culture with steppe groups such asthe Yamnaya although whether this reflects movements of people hasbeen contentious21. Our genetic data provide direct evidence of migra-tion and suggest that it was relatively sudden. The Corded Ware aregenetically closest to the Yamnaya ,2,600 km away, as inferred bothfrom PCA and ADMIXTURE (Fig. 2) and FST (0.011 6 0.002) (ExtendedData Table 3). If continuous gene flow from the east, rather than migra-tion, had occurred, we would expect successive cultures in Europeto become increasingly differentiated from the Middle Neolithic, but
0 50,000 100,000 150,000 200,000 250,000 300,000 350,000
Number of autosomal SNPs covered in 94 individuals
Maxim
um
= 3
54,1
98
Min
imum
= 2
2,8
69
Mean
= 2
12
,37
5
Median = 231,945
n = 69; this study (UDG treated)
n = 4; previous studies (UDG treated)
n = 21; previous studies (not UDG treated)
Time
(ky BC) Group West Central East
43–22 Pleistocene hunter-gatherer
6–4.6 Holocene hunter-gatherer
6–5.5 Early Neolithic
4–3 Mid Neolithic
3.3–2.7 Late Copper Age (steppe)
2.5–2.2 Late Neolithic
2.2–1.6 Early Bronze Age
1.1 Late Bronze Age
0.9 Iron Age
Ust Ishim (1)Kostenki14 (1)
MA1 (1)
Karelia (1)
Samara (1)Motala (7)
Sweden MHG (1)
Sweden NHG (3)
Loschbour (1)
La Brana1 (1) Hungary HG (1)
Starcevo (1)
LBKT (1)
Hungary EN (8)LBK (12)
Stuttgart (1)
Els Trocs (5)
Iceman (1)
La Mina (4)Baalberge (3)
Esperstedt (1)
Sweden MN (1)
Yamnaya (9)Hungary CA (1)
Corded Ware (4)Karsdorf (1)
Bell Beaker (6)BenzigerodeHeimburg (3)Alberstedt (1)
Unetice (8)Hungary BA (2)
Halberstadt (1)
Hungary IA (1)
b
a
Figure 1 | Location and SNP coverage of samples included in this study.a, Geographic location and time-scale (central European chronology) of the 69newly analysed ancient individuals from this study (black outline) and 25 from
the literature for which shotgun sequencing data was available (no outline).b, Number of SNPs covered at least once in the analysis data set of 94individuals.
RESEARCH LETTER
2 | N A T U R E | V O L 0 0 0 | 0 0 M O N T H 2 0 1 5
Macmillan Publishers Limited. All rights reserved©2015

instead, the Corded Ware are both the earliest and most strongly dif-ferentiated from the Middle Neolithic population.
‘Outgroup’ f3 statistics6 (Supplementary Information section 7), whichmeasure shared genetic drift between a pair of populations (ExtendedData Fig. 1), support the clustering of hunter-gatherers, Early/MiddleNeolithic, and Late Neolithic/Bronze Age populations into differentgroups as in the PCA (Fig. 2a). We also analysed f4 statistics, which allowus to test whether pairs of populations are consistent with descent fromcommon ancestral populations, and to assess significance using a nor-mally distributed Z score. Early European farmers from the Early andMiddle Neolithic were closely related but not identical. This is reflectedin the fact that Loschbour, a WHG individual from Luxembourg4, sharedmore alleles with post-4,000 BC European farmers from Germany, Spain,Hungary, Sweden and Italy than with early farmers of Germany, Spain,and Hungary, documenting an increase of hunter-gatherer ancestry inmultiple regions of Europe during the course of the Neolithic. The twoEHG form a clade with respect to all other present-day and ancient popu-lations (jZj, 1.9), and MA1 shares more alleles with them (jZj. 4.7)than with other ancient or modern populations, suggesting that theymay be a source for the ANE ancestry in present Europeans4,12,22 as theyare geographically and temporally more proximate than Upper PaleolithicSiberians. The Yamnaya differ from the EHG by sharing fewer alleleswith MA1 (jZj5 6.7) suggesting a dilution of ANE ancestry between5,000–3,000 BC on the European steppe. This was likely due to admixtureof EHG with a population related to present-day Near Easterners, as themost negative f3 statistic in the Yamnaya (giving unambiguous evidenceof admixture) is observed when we model them as a mixture of EHGand present-day Near Eastern populations like Armenians (Z 5 26.3;
Supplementary Information section 7). The Late Neolithic/Bronze Agegroups of central Europe share more alleles with Yamnaya than theMiddle Neolithic populations do (jZj5 12.4) and more alleles with theMiddle Neolithic than the Yamnaya do (jZj5 12.5), and have a nega-tive f3 statistic with the Middle Neolithic and Yamnaya as references(Z 5 220.7), indicating that they were descended from a mixture ofthe local European populations and new migrants from the east. More-over, the Yamnaya share more alleles with the Corded Ware (jZj$ 3.6)than with any other Late Neolithic/Early Bronze Age group with at leasttwo individuals (Supplementary Information section 7), indicating thatthey had more eastern ancestry, consistent with the PCA and ADMIXTUREpatterns (Fig. 2).
Modelling of the ancient samples shows that while Karelia is gen-etically intermediate between Loschbour and MA1, the topology thatconsiders Karelia as a mixture of these two elements is not the only onethat can fit the data (Supplementary Information section 8). To avoidbiasing our inferences by fitting an incorrect model, we developed newstatistical methods that are substantial extensions of a previously reportedapproach4, which allow us to obtain precise estimates of the proportionof mixture in later Europeans without requiring a formal model for therelationship among the ancestral populations. The method (Supplemen-tary Information section 9) is based on the idea that if a Test populationhas ancestry related to reference populations Ref1, Ref2, …, RefN inproportions a1, a2, ..., aN, and the references are themselves differenti-ally related to a triple of outgroup populations A, B, C, then:
f4 Test,A; B,Cð Þ~PN
i~1aif4 Ref i,A; B,Cð Þ
K =
16
Baalberge_MN
Esperstedt_MN
Spain_MN
SwedenSkoglund_MNIceman
Spain_EN
HungaryGamba_CAStarcevo_EN
Stuttgart
HungaryGamba_EN
LBK_EN
LBKT_ENKarelia_HG
Samara_HGSwedenSkoglund_MHG
SwedenSkoglund_NHG
LaBrana1
Motala_HG
HungaryGamba_HGLoschbour
BenzigerodeHeimburg_LN
Unetice_EBA
HungaryGamba_BA
Bell_Beaker_LN
Alberstedt_LNHalberstadt_LBA
HungaryGamba_IA
Yamnaya
Corded_Ware_LN
Karsdorf_LNUst_Ishim
MA1Kostenki14–0.10 –0.05 0.00 0.05 0.10
–0.10
–0.05
0.00
0.05
0.10
Dimension 1
Dim
en
sio
n 2
●●
●●
●
●● ●●
●●
●●●●
●● ●●●●●
●
●●●
●●●
●●
●
●●●●●
●●●
●
●
●●●●●
●●
●●●
●
●●●●●
●
●●
●●●●
●●●●●●●●●●●●
●●●●●● ●●●●●
●
●
●●●●
●
●●● ●
●
●
●
●
●
●
●
●
●●●
●
●
●
●
● ●
●●●●●●
●
●
●●●●
●
●
●
●
●●
●●●●
●●
●●
●● ●● ●●●●
●
● ●●
●●●
●
●●
●●
●●
●
●
●●●
●●● ●●
●
●●●
●●●●●●● ●
●
●●● ●●
●●
●●●●●●
●●
●
● ●●●
●●●
●●● ●
●
●● ●
●
●
●●
●
●● ●
●●
●● ●●
●
●●●
●
●
●●
●
●
●● ●●●●●●
●●
●●●●
●●●
●●●
●
●●
●●
●●
●●●●
●
●
●●
●●
●
●●
●●●●
●
●●
●
●●● ●
● ●●
●
●●●
●
●●●●●●●●
●
●●●●● ●●
●
●
● ●●●●●
●●●●● ●
●●
●●●●
●●●●●● ●●
●●
●●●
●●●●●●
●●● ●●●●● ●●
●●●
●
●● ●●●●●
●●●●●
●●
●
●
●●
●●●●
● ●
●●
●
●
●
●
●
●
●●●●
●
●●
●
●
●
●
●
●●●
●
●●
●●●●●
●●
●
●●● ●● ●●●
● ●●●●●●
●●●
●● ●●
●
●
●
●
●●
●
●●●
●●●
●
●
●
●●●
●
●●●●
●
●●
●●●
●●●●●●●●●●●●●●
●●●●●●●●
●● ●●
●
●
●
●
●●
●
●●●●●
● ●
●●●
●●
●● ●●
●●
●
●●●●
●
●●●●
●●
●●
●●●●●●
●●
● ●●●
●●
●●●●
●
●●●●●
● ●●
● ●●
●
●●●●●●●●●●●●
●
●●
●
●
●
●●
●
●●
●●
●●
● ● ●●● ●● ●
●● ●
● ●●●
●●
●
●●●
●
●●
●●●●●
●●●
●●●
●
●
●●
● ●●●●
●● ●●●
●●●● ●●
●●●●
●
●●●●
●●●●●
●
●
●
●
●
●
●●●
●● ●
●●
●
●
●
●
●
●
●
●
●● ●
●
●
●●
●
●
●
●●
●
●
●
●●
● ●
● ●
●
●●
●●
●
●●
●●
●
●
●●●
●●● ●●
●
●●
●●
●●●
●
●
●
●●
●
●●●●
●●
●●●●●
● ●
●●●●
●
●
●
●
●
● ●
●● ●
●
●●●● ●
●
●
●●
●
●●●
●
●
●●●●
● ●
●
● ●●
Eastern European hunter−gatherers (EHG)
Scandinavian hunter−gatherers (SHG)
Early Neolithic (EN)Middle Neolithic (MN)
Late Neolithic / Bronze Age (LN/BA)
Yamnaya
Western European hunter−gatherers (WHG)
Ancient North Eurasians (ANE)
Corded Ware
WHG replaced by early European farmers
>5,500 BC Resurgence of WHG
~5,000–3,000 BC
Dilution of EHG
~5,000–3,000 BC
Arriva
l of e
aste
rn m
igra
nts
~3,0
00–2,5
00 B
C
a b
●●●●●●●●
Ust_Ishim
Kostenki14
MA1
Karelia_HG
Samara_HG
Motala_HG
SwedenSkoglund_MHG
SwedenSkoglund_NHG
Loschbour
LaBrana1
HungaryGamba_HG
Starcevo_EN
LBKT_EN
HungaryGamba_EN
LBK_EN
Stuttgart
Spain_EN
Iceman
Spain_MN
Baalberge_MN
Esperstedt_MN
SwedenSkoglund_MN
Yamnaya
HungaryGamba_CACorded_Ware_LNKarsdorf_LN
Bell_Beaker_LN
BenzigerodeHeimburg_LN
Alberstedt_LN
Unetice_EBA
HungaryGamba_BA
Halberstadt_LBA
HungaryGamba_IA
Figure 2 | Population transformations in Europe. a, PCA analysis. b, ADMIXTURE analysis. The full ADMIXTURE analysis including present-day humans isshown in Supplementary Information section 6.
LETTER RESEARCH
0 0 M O N T H 2 0 1 5 | V O L 0 0 0 | N A T U R E | 3
Macmillan Publishers Limited. All rights reserved©2015

By using a large number of outgroup populations we can fit the admix-ture coefficients ai and estimate mixture proportions (SupplementaryInformation section 9, Extended Data Fig. 2). Using 15 outgroupsfrom Africa, Asia, Oceania and the Americas, we obtain good fits asassessed by a formal test (Supplementary Information section 10), andestimate that the Middle Neolithic populations of Germany and Spainhave ,18–34% more WHG-related ancestry than Early Neolithicpopulations and that the Late Neolithic and Early Bronze Age popula-tions of Germany have ,22–39% more EHG-related ancestry than theMiddle Neolithic ones (Supplementary Information section 9). If wemodel them as mixtures of Yamnaya-related and Middle Neolithicpopulations, the inferred degree of population turnover is doubled to48–80% (Supplementary Information sections 9 and 10).
To distinguish whether a Yamnaya or an EHG source fits the databetter, we added ancient samples as outgroups (Supplementary Infor-mation section 9). Adding any Early or Middle Neolithic farmer resultsin EHG-related genetic input into Late Neolithic populations being apoor fit to the data (Supplementary Information section 9); thus, LateNeolithic populations have ancestry that cannot be explained by a mix-ture of EHG and Middle Neolithic. When using Yamnaya instead ofEHG, however, we obtain a good fit (Supplementary Information sec-tions 9 and 10). These results can be explained if the new genetic materialthat arrived in Germany was a composite of two elements: EHG and atype of Near Eastern ancestry different from that which was introducedby early farmers (also suggested by PCA and ADMIXTURE; Fig. 2, Sup-plementary Information sections 5 and 6). We estimate that these twoelements each contributed about half the ancestry of the Yamnaya(Supplementary Information sections 6 and 9), explaining why thepopulation turnover inferred using Yamnaya as a source is about twiceas high compared to the undiluted EHG. The estimate of Yamnaya-related ancestry in the Corded Ware is consistent when using eitherpresent populations or ancient Europeans as outgroups (Supplemen-tary Information sections 9 and 10), and is 73.1 6 2.2% when both setsare combined (Supplementary Information section 10). The best pro-xies for ANE ancestry in Europe4 were initially Native Americans12,22,and then the Siberian MA1 (ref. 6), but both are geographically andtemporally too remote for what appears to be a recent migration intoEurope4. We can now add three new pieces to the puzzle of how ANEancestry was transmitted to Europe: first by the EHG, then the Yamnayaformed by mixture between EHG and a Near Eastern related popu-lation, and then the Corded Ware who were formed by a mixture of theYamnaya with Middle Neolithic Europeans. We caution that the sampledYamnaya individuals from Samara might not be directly ancestral toCorded Ware individuals from Germany. It is possible that a morewestern Yamnaya population, or an earlier (pre-Yamnaya) steppe popu-lation may have migrated into central Europe, and future work mayuncover more missing links in the chain of transmission of steppe ancestry.
By extending our model to a three-way mixture of WHG, Early Neolithicand Yamnaya, we estimate that the ancestry of the Corded Ware was79% Yamnaya-like, 4% WHG, and 17% Early Neolithic (Fig. 3). A smallcontribution of the first farmers is also consistent with uniparentallyinherited DNA: for example, mitochondrial DNA haplogroup N1a andY chromosome haplogroup G2a, common in early central Europeanfarmers14,23, almost disappear during the Late Neolithic and BronzeAge, when they are largely replaced by Y haplogroups R1a and R1b (Sup-plementary Information section 4) and mtDNA haplogroups I, T1, U2, U4,U5a, W, and subtypes of H14,23,24 (Supplementary Information section 2).The uniparental data not only confirm a link to the steppe populationsbut also suggest that both sexes participated in the migrations (Sup-plementary Information sections 2 and 4 and Extended Data Table 2).The magnitude of the population turnover that occurred becomes evenmore evident if one considers the fact that the steppe migrants may wellhave mixed with eastern European agriculturalists on their way to cen-tral Europe. Thus, we cannot exclude a scenario in which the CordedWare arriving in today’s Germany had no ancestry at all from localpopulations.
Our results support a view of European pre-history punctuated bytwo major migrations: first, the arrival of the first farmers during theEarly Neolithic from the Near East, and second, the arrival of Yamnayapastoralists during the Late Neolithic from the steppe. Our data furthershow that both migrations were followed by resurgences of the previousinhabitants: first, during the Middle Neolithic, when hunter-gathererancestry rose again after its Early Neolithic decline, and then betweenthe Late Neolithic and the present, when farmer and hunter-gathererancestry rose after its Late Neolithic decline. This second resurgencemust have started during the Late Neolithic/Bronze Age period itself,as the Bell Beaker and Unetice groups had reduced Yamnaya ancestrycompared to the earlier Corded Ware, and comparable levels to that insome present-day Europeans (Fig. 3). Today, Yamnaya related ances-try is lower in southern Europe and higher in northern Europe, and allEuropean populations can be modelled as a three-way mixture of WHG,Early Neolithic, and Yamnaya, whereas some outlier populations showevidence for additional admixture with populations from Siberia andthe Near East (Extended Data Fig. 3, Supplementary Information sec-tion 9). Further data are needed to determine whether the steppe ances-try arrived in southern Europe at the time of the Late Neolithic/BronzeAge, or is due to migrations in later times from northern Europe25,26.
Our results provide new data relevant to debates on the origin andexpansion of Indo-European languages in Europe (Supplementary Infor-mation section 11). Although the findings from ancient DNA are silenton the question of the languages spoken by preliterate populations,they do carry evidence about processes of migration which are invokedby theories on Indo-European language dispersals. Such theories makepredictions about movements of people to account for the spread of
Starcevo_ENLBKT_EN
Spain_ENBaalberge_MN
Esperstedt_MNSpain_MN
Stuttgart
HungaryGamba_CA
HungaryGamba_EN
Iceman
Sardinian
HungaryGamba_BA
AlbanianGreek
SpanishBergamo
BasqueTuscan
BulgarianSpanish_North
FrenchCroatian
French_SouthOrcadian
English
Unetice_EBA
UkrainianHungarian
Bell_Beaker_LN
BelarusianCzech
ScottishIcelandicEstonian
LithuanianNorwegian
Halberstadt_LBA
Alberstedt_LNBenzigerode_LN
Karsdorf_LNCorded_Ware_LN
Early Neolithic (LBK_EN)
Western European hunter−gatherer (Loschbour)
Yamnaya
0 0.2 0.4 0.6 0.8 1.0
Mo
dern
Ancie
nt
Tim
e
Figure 3 | Admixture proportions. We estimate mixture proportionsusing a method that gives unbiased estimates even without an accuratemodel for the relationships between the test populations and the outgrouppopulations (Supplementary Information section 9). Population samplesare grouped according to chronology (ancient) and Yamnaya ancestry(present-day humans).
RESEARCH LETTER
4 | N A T U R E | V O L 0 0 0 | 0 0 M O N T H 2 0 1 5
Macmillan Publishers Limited. All rights reserved©2015
languages and material culture (Extended Data Fig. 4). The technologyof ancient DNA makes it possible to reject or confirm the proposedmigratory movements, as well as to identify new movements thatwere not previously known. The best argument for the ‘Anatolianhypothesis’27 that Indo-European languages arrived in Europe fromAnatolia ,8,500 years ago is that major language replacements arethought to require major migrations, and that after the Early Neolithicwhen farmers established themselves in Europe, the population basewas likely to have been so large that later migrations would not havemade much of an impact27,28. However, our study shows that a latermajor turnover did occur, and that steppe migrants replaced ,75% ofthe ancestry of central Europeans. An alternative theory is the ‘steppehypothesis’, which proposes that early Indo-European speakers werepastoralists of the grasslands north of the Black and Caspian Seas, andthat their languages spread into Europe after the invention of wheeledvehicles9. Our results make a compelling case for the steppe as a sourceof at least some of the Indo-European languages in Europe by doc-umenting a massive migration ,4,500 years ago associated with theYamnaya and Corded Ware cultures, which are identified by proponentsof the steppe hypothesis as vectors for the spread of Indo-Europeanlanguages into Europe. These results challenge the Anatolian hypothesisby showing that not all Indo-European languages in Europe can plaus-ibly derive from the first farmer migrations thousands of years earlier(Supplementary Information section 11). We caution that the locationof the proto-Indo-European9,27,29,30 homeland that also gave rise to theIndo-European languages of Asia, as well as the Indo-European lan-guages of southeastern Europe, cannot be determined from the datareported here (Supplementary Information section 11). Studying themixture in the Yamnaya themselves, and understanding the geneticrelationships among a broader set of ancient and present-day Indo-European speakers, may lead to new insight about the shared homeland.
Online Content Methods, along with any additional Extended Data display itemsandSourceData, are available in the online version of the paper; references uniqueto these sections appear only in the online paper.
Received 29 December 2014; accepted 12 February 2015.
Published online 2 March 2015.
1. Fu, Q. et al. Genome sequence of a 45,000-year-old modern human from westernSiberia. Nature 514, 445–449 (2014).
2. Gamba, C. et al. Genome flux and stasis in a five millennium transect of Europeanprehistory. Nature Commun. 5, 5257 (2014).
3. Keller, A. et al. New insights into the Tyrolean Iceman’s origin and phenotype asinferred by whole-genome sequencing. Nature Commun. 3, 698 (2012).
4. Lazaridis, I. et al. Ancient human genomes suggest three ancestral populations forpresent-day Europeans. Nature 513, 409–413 (2014).
5. Olalde, I.et al.Derived immune andancestral pigmentation alleles in a 7,000-year-old Mesolithic European. Nature 507, 225–228 (2014).
6. Raghavan, M. et al. Upper Palaeolithic Siberian genome reveals dual ancestry ofNative Americans. Nature 505, 87–91 (2014).
7. Seguin-Orlando, A. et al. Genomic structure in Europeans dating back at least36,200 years. Science 346, 1113–1118 (2014).
8. Skoglund, P. et al. Genomic diversity and admixture differs for Stone-AgeScandinavian foragers and farmers. Science 344, 747–750 (2014).
9. Anthony,D.W.The Horse, theWheel, andLanguage: HowBronze-AgeRiders fromtheEurasian Steppes Shaped the Modern World (Princeton Univ. Press, 2007).
10. Fu, Q. et al. DNA analysis of an early modern human from Tianyuan Cave, China.Proc. Natl Acad. Sci. USA 110, 2223–2227 (2013).
11. Rohland, N., Harney, E., Mallick, S., Nordenfelt, S. & Reich, D. Partial uracil–DNA–glycosylase treatment for screeningofancientDNA.Phil. Trans. R. Soc. Lond. B 370,20130624 (2015).
12. Patterson, N. et al. Ancient admixture in human history. Genetics 192, 1065–1093(2012).
13. Fu, Q. et al. A revised timescale for human evolution based on ancientmitochondrial genomes. Curr. Biol. 23, 553–559 (2013).
14. Brandt, G. et al. Ancient DNA reveals key stages in the formation of centralEuropean mitochondrial genetic diversity. Science 342, 257–261 (2013).
15. Der Sarkissian, C. et al. Ancient DNA reveals prehistoric gene-flow from Siberia inthe complex human population history of North East Europe. PLoS Genet. 9,e1003296 (2013).
16. Briggs, A. W. et al. Removal of deaminated cytosines and detection of in vivomethylation in ancient DNA. Nucleic Acids Res. 38, e87 (2010).
17. Briggs, A. W. et al. Patterns of damage in genomic DNA sequences from aNeandertal. Proc. Natl Acad. Sci. USA 104, 14616–14621 (2007).
18. Myres, N. M. et al. A major Y-chromosome haplogroup R1b Holocene erafounder effect in Central and Western Europe. Eur. J. Hum. Genet. 19, 95–101(2011).
19. Underhill, P. A. et al. The phylogenetic and geographic structure of Y-chromosomehaplogroup R1a. Eur. J. Hum. Genet. 23, 124–131 (2015).
20. Skoglund, P. et al. Origins and genetic legacy of Neolithic farmers and hunter-gatherers in Europe. Science 336, 466–469 (2012).
21. Czebreszuk, J. in Ancient Europe, 8000 B.C. to A.D. 1000: Encyclopedia of theBarbarian World (eds Bogucki, P. I. & Crabtree, P. J.) 467–475 (Charles Scribners &Sons, 2003).
22. Lipson, M. et al. Efficient moment-based inference of admixture parameters andsources of gene flow. Mol. Biol. Evol. 30, 1788–1802 (2013).
23. Szecsenyi-Nagy, A. et al. Tracing the genetic origin of Europe’s first farmers revealsinsights into their social organization. Preprint at bioRxiv http://dx.doi.org/10.1101/008664 (2014).
24. Haak, W. et al. Ancient DNA from European early Neolithic farmers reveals theirNear Eastern affinities. PLoS Biol. 8, e1000536 (2010).
25. Hellenthal, G. et al. A genetic atlas of human admixture history. Science 343,747–751 (2014).
26. Ralph, P.& Coop, G. The geography of recent genetic ancestry across Europe.PLoSBiol. 11, e1001555 (2013).
27. Renfrew, C. Archaeology and Language: The Puzzle of Indo-European Origins(Pimlico, 1987).
28. Bellwood, P. First Farmers: The Origins of Agricultural Societies (Wiley-Blackwell,2004).
29. Gamkrelidze, T. V. & Ivanov, V. V. The early history of Indo-European languages. Sci.Am. 262, 110–116 (1990).
30. Mallory, J. P. In Search of the Indo-Europeans: Language, Archaeology and Myth(Thames and Hudson, 1991).
Supplementary Information is available in the online version of the paper.
Acknowledgements We thank P. Bellwood, J. Burger, P. Heggarty, M. Lipson,C. Renfrew, J. Diamond, S.Paabo, R. Pinhasi and P. Skoglund for critical comments, andthe Initiative for the Science of the Human Past at Harvard for organizing a workshoparound the issues touched on by this paper. We thank S. Paabo for support forestablishing the ancient DNA facilities in Boston, and P. Skoglund for detecting thepresence of two related individuals in our data set. We thank L. Orlando,T. S. Korneliussen, and C. Gamba for help in obtaining data. We thank AgilentTechnologies and G. Frommer for help in developing the capture reagents. We thankC. Der Sarkissian, G. Valverde, L. Papac and B. Nickel for wet laboratory support. Wethank archaeologists V. Dresely, R. Ganslmeier, O. Balanvosky, J. Ignacio Royo Guillen,A. Osztas, V. Majerik, T. Paluch, K. Somogyi and V.Voicsek for sharing samples anddiscussion about archaeological context. This research was supported by an AustralianResearch Council grant to W.H. and B.L. (DP130102158), and German ResearchFoundation grants to K.W.A. (Al 287/7-1 and 7-3, Al 287/10-1 and Al 287/14-1) and toH.M. (Me 3245/1-1 and 1-3). D.R. was supported by US National Science FoundationHOMINID grant BCS-1032255, US National Institutes of Health grant GM100233, andthe Howard Hughes Medical Institute.
Author Contributions W.H., N.P., N.R., J.K., K.W.A. and D.R. supervised the study. W.H.,E.B., C.E., M.F., S.F., R.G.P., F.H., V.K., A.K., M.K., P.K., H.M., O.M., V.M., N.N., S.L.P., R.R.,M.A.R.G., C.R., A.S.-N., J.W., J.K., D.B., D.A., A.C., K.W.A. andD.R. assembledarchaeologicalmaterial, W.H., I.L., N.P., N.R., S.M., A.M. and D.R. analysed genetic data. I.L., N.P. and D.R.developed methods using f statistics for inferring admixture proportions. W.H., N.R.,B.L., G.B., S.N., E.H., K.S. and A.M. performed wet laboratory ancient DNA work. I.L., N.R.,S.M., B.L., Q.F., M.M. and D.R. developed the 390k capture reagent. W.H., I.L. and D.R.wrote the manuscript with help from all co-authors.
Author Information The aligned sequences are available through the EuropeanNucleotide Archive under accession number PRJEB8448. The Human Originsgenotype dataset including ancient individuals can be found at (http://genetics.med.harvard.edu/reichlab/Reich_Lab/Datasets.html). Reprints andpermissions information is available at www.nature.com/reprints. The authors declareno competing financial interests. Readers are welcome to comment on the onlineversion of the paper. Correspondence and requests for materials should be addressedto D.R. ([email protected]).
LETTER RESEARCH
0 0 M O N T H 2 0 1 5 | V O L 0 0 0 | N A T U R E | 5
Macmillan Publishers Limited. All rights reserved©2015
METHODSScreening of libraries (shotgun sequencing and mitochondrial capture). The212 libraries screened in this study (Supplementary Information section 1) froma total of 119 samples (Supplementary Information section 3) were producedat Adelaide (n 5 151), Tubingen (n 5 16), and Boston (n 5 45) (SupplementaryData 1).
The libraries from Adelaide and Boston had internal barcodes directly attachedto both sides of the molecules from the DNA extract so that each sequence beginswith the barcode10. The Adelaide libraries had 5 base pair (bp) barcodes on bothsides, while the Boston libraries had 7 bp barcodes. Libraries from Tubingen had nointernal barcodes, but were differentiated by the sequence of the indexing primer31.
We adapted a reported protocol for enriching for mitochondrial DNA10, withthe difference that we adjusted the blocking oligonucleotides and PCR primers tofit our libraries with shorter adapters. Over the course of this project, we also loweredthe hybridization temperature from 65 uC to 60uC and performed stringent washesat 55 uC instead of 60 uC32.
We used an aliquot of approximately 500 ng of each library for target enrich-ment of the complete mitochondrial genome in two consecutive rounds32, using abait set for human mtDNA32. We performed enrichment in 96-well plates with onelibrary per well, and used a liquid handler (Evolution P3, Perkin Elmer) for thecapture and washing steps33. We used blocking oligonucleotides in hybridizationappropriate to the adapters of the truncated libraries. After either of the two enrich-ment rounds, we amplified the enriched library molecules with the primer pair thatkeeps the adapters short (PreHyb) using Herculase Fusion II PCR Polymerase. Weperformed an indexing PCR of the final capture product using one or two indexingprimers31. We cleaned up all PCR reactions using SPRI technology34 and the liquidhandler. Libraries from Tubingen were amplified with the primer pair IS5/IS631.
For libraries from Boston and Adelaide, we used a second aliquot of each libraryfor shotgun sequencing after performing an indexing PCR31. We used uniqueindex combinations for each library and experiment, allowing us to distinguishshotgun sequencing and mitochondrial DNA capture data, even if both experimentswere in the same sequencing run. We sequenced shotgun libraries and mtDNAcaptured libraries from Tubingen in independent sequencing runs since the indexwas already attached at the library preparation stage.
We quantified the sequencing pool with the BioAnalyzer (Agilent) and/or theKAPA Library Quantification kit (KAPA Biosystems) and sequenced on IlluminaMiSeq, HiSeq2500 or NextSeq500 instruments for 2 3 75, 2 3 100 or 2 3 150cycles along with the indexing read(s).Enrichment for 394,577 SNP targets (‘390k capture’). The protocol for enrich-ment for SNP targets was similar to the mitochondrial DNA capture, with theexception that we used another bait set (390k) and about twice as much library (upto 1,000 ng) compared to the mtDNA capture.
The specific capture reagent used in this study is described for the first time here.To target each SNP, we used a different oligonucleotide probe design compared toref. 10. We used four 52 base pair probes for each SNP target. One probe ends justbefore the SNP, and one starts just after. Two probes are centred on the SNP, andare identical except for having the alternate alleles. This probe design avoidssystematic bias towards one SNP allele or another. For the template sequence fordesigning the San and Yoruba panels baits, we used the sequence that was sub-mitted for these same SNPs during the design of the Affymetrix Human OriginsSNP array12. For SNPs that were both in the San and Yoruba panels, we used theYoruba template sequence in preference. For all other SNPs, we used the humangenome reference sequence as a template. Supplementary Data 2a–d gives the listof SNPs that we targeted, along with details of the probes used. The breakdown ofSNPs into different classes is as follows.
124,106 ‘Yoruba SNPs’: all SNPs in ‘panel 5’ of the Affymetrix Human Originsarray (discovered as heterozygous in a Yoruba male: HGDP00927)12 that passedthe probe design criteria specified in ref. 11.
146,135 ‘San SNPs’: all SNPs in ‘panel 4’ of the Affymetrix Human Origins array(discovered as heterozygous in a San male: HGDP01029)12 that passed probedesign criteria11. The full Affymetrix Human Origins array panel 4 contains severaltens of thousands of additional SNPs overlapping those from panel 5, but we didnot wish to redundantly capture panel 5 SNPs.
98,166 ‘compatibility SNPs’: SNPs that overlap between the Affymetrix HumanOrigins, the Affymetrix 6.0, and the Illumina 610 Quad arrays, which are not alreadyincluded in the ‘Yoruba SNPs’ or ‘San SNPs’ lists12 and that also passed the probedesign design criteria11.
26,170 ‘miscellaneous SNPs’: SNPs that did not overlap the Human Originsarray. The subset analysed in this study were 2,258 Y chromosome SNPs (http://isogg.org/tree/ISOGG_YDNA_SNP_Index.html) that we used for Y haplogroupdetermination.Processing of sequencing data. We restricted analysis to read pairs that passedquality control according to the Illumina software (‘PF reads’).
We assigned read pairs to libraries by searching for matches to the expectedindex and barcode sequences (if present, as for the Adelaide and Boston libraries).We allowed no more than 1 mismatch per index or barcode, and zero mismatchesif there was ambiguity in sequence assignment or if barcodes of 5 bp length wereused (Adelaide libraries).
We used Seqprep (https://github.com/jstjohn/SeqPrep) to search for overlap-ping sequence between the forward and reverse read, and restricted to moleculeswhere we could identify a minimum of 15 bp of overlap. We collapsed the two readsinto a single sequence, using the consensus nucleotide if both reads agreed, and theread with higher base quality in the case of disagreement. For each merged nuc-leotide, we assigned the base quality to be the higher of the two reads. We furtherused Seqprep to search for the expected adaptor sequences at either ends of themerged sequence, and to produce a trimmed sequence for alignment.
We mapped all sequences using BWA-0.6.1 (ref. 35). For mitochondrial ana-lysis we mapped to the mitochondrial genome RSRS36. For whole-genome analysiswe mapped to the human reference genome hg19. We restricted all analyses tosequences that had a mapping quality of MAPQ $ 37.
We sorted all mapped sequences by position, and used a custom script to searchfor mapped sequences that had the same orientation and start and stop positions.We stripped all but one of these sequences (keeping the best quality one) asduplicates.Mitochondrial sequence analysis and assessment of ancient DNA authenticity.For each library for which we had average coverage of the mitochondrial genomeof at least tenfold after removal of duplicated molecules, we built a mitochondrialconsensus sequence, assigning haplogroups for each library as described in Sup-plementary Information section 2.
We used contamMix-1.0.9 to search for evidence of contamination in the mito-chondrial DNA13. This software estimates the fraction of mitochondrial DNAsequences that match the consensus more closely than a comparison set of 311worldwide mitochondrial genomes. This is done by taking the consensus sequenceof reads aligning to the RSRS mitochondrial genome, and requiring a minimumcoverage of 5 after filtering bases where the quality was ,30. Raw reads are thenrealigned to this consensus. In addition, the consensus is multiply aligned with theother 311 mitochondrial genomes using kalign (2.0.4)37 to build the necessaryinputs for contamMix, trimming the first and last 5 bases of every read to mitigateagainst the confounding factor of ancient damage. This software had difficultyrunning on data sets with higher coverage, and for these data sets, we down-sampled to 50,000 reads.
For all sequences mapping to the mitochondrial DNA for which the consensusmitochondrial DNA sequence had a cytosine at the terminal nucleotide, we mea-sured the proportion of sequences with a thymine at that position. For populationgenetic analysis, we only used partially UDG-treated libraries with a minimum of3% CRT substitutions as recommended by ref. 33. In cases where we used a fullyUDG-treated library for 390k analysis, we examined mitochondrial capture datafrom a non-UDG-treated library made from the same extract, and verified that thenon-UDG library had a minimum of 10% CRT at the first nucleotide as recom-mended by ref. 38. Metrics for the mitochondrial DNA analysis on each library aregiven in Supplementary Data 1.390k capture, sequence analysis and quality control. For 390k analysis, werestricted to reads that not only mapped to the human reference genome hg19but that also overlapped the 354,212 autosomal SNPs genotyped on the HumanOrigins array4. We trimmed the last two nucleotides from each sequence becausewe found that these are highly enriched in ancient DNA damage even for UDG-treated libraries. We further restricted analyses to sites with base quality $ 30.
We made no attempt to determine a diploid genotype at each SNP in each sample.Instead, we used a single allele—randomly drawn from the two alleles in theindividual—to represent the individual at that site20,39. Specifically, we made anallele call at each target SNP using majority rule over all sequences overlapping theSNP. When each of the possible alleles was supported by an equal number ofsequences, we picked an allele at random. We set the allele to ‘no call’ for SNPsat which there was no read coverage.
We restricted population genetic analysis to libraries with a minimum of 0.06-fold average coverage on the 390k SNP targets, and for which there was an un-ambiguous sex determination based on the ratio of X to Y chromosome reads(Supplementary Information section 4 and Supplementary Data 1). For indivi-duals for whom there were multiple libraries per sample, we performed a series ofquality control analysis. First, we used the ADMIXTURE software40,41 in super-vised mode, using Kharia, Onge, Karitiana, Han, French, Mbuti, Ulchi and Eskimoas reference populations. We visually inspected the inferred ancestry componentsin each individual, and removed individuals with evidence of heterogeneity ininferred ancestry components across libraries. For all possible pairs of librariesfor each sample, we also computed statistics of the form D(Library1, Library2;Probe, Mbuti), where Probe is any of a panel of the same set of eight reference
RESEARCH LETTER
Macmillan Publishers Limited. All rights reserved©2015

populations), to determine whether there was significant evidence of the Probepopulation being more closely related to one library from an ancient individualthan another library from that same individual. None of the individuals that weused had strong evidence of ancestry heterogeneity across libraries. For samplespassing quality control for which there were multiple libraries per sample, wemerged the sequences into a single BAM.
We called alleles on each merged BAM using the same procedure as for theindividual libraries. We used ADMIXTURE41 as well as PCA as implemented inEIGENSOFT42 (using the lsqproject: YES option to project the ancient samples) tovisualize the genetic relationships of each set of samples with the same culture labelwith respect to 777 diverse present-day West Eurasians4. We visually identifiedoutlier individuals, and renamed them for analysis either as outliers or by the nameof the site at which they were sampled (Extended Data Table 1). We also identifiedtwo pairs of related individuals based on the proportion of sites covered in pairs ofancient samples from the same population that had identical allele calls usingPLINK43. From each pair of related individuals, we kept the one with the most SNPs.Population genetic analyses. We determined genetic sex using the ratio of X andY chromosome alignments44 (Supplementary Information section 4), and Y chro-mosome haplogroup for the male samples (Supplementary Information section 4).We studied population structure (Supplementary Information sections 5 and 6).We used f statistics to carry out formal tests of population relationships (Supplemen-tary Information section 6) and built explicit models of population history consistentwith the data (Supplementary Information section 7). We estimated mixture pro-portions in a way that was robust to uncertainty about the exact population historythat applied (Supplementary Information section 8). We estimated the minimumnumber of streams of migration into Europe needed to explain the data (Supplemen-tary Information sections 9 and 10). The estimated mixture proportions shownin Fig. 3 were obtained using the lsqlin function of Matlab and the optimizationmethod described in Supplementary Information section 9 with 15 world outgroups.
Sample size. No statistical methods were used to predetermine sample size.
31. Kircher, M., Sawyer, S. & Meyer, M. Double indexing overcomes inaccuracies inmultiplex sequencing on the Illumina platform. Nucleic Acids Res. 40, e3(2012).
32. Meyer, M. et al. A mitochondrial genome sequence of a hominin from Sima de losHuesos. Nature 505, 403–406 (2014).
33. Rohland, N., Harney, E., Mallick, S., Nordenfelt, S. & Reich, D. Partial uracil–DNA–glycosylase treatment for screeningofancientDNA.Phil. Trans. R. Soc. Lond. B 370,20130624 (2015).
34. Rohland, N. & Reich, D. Cost-effective, high-throughput DNA sequencing librariesfor multiplexed target capture. Genome Res. 22, 939–946 (2012).
35. Li, H. & Durbin, R. Fast and accurate short read alignment with Burrows–Wheelertransform. Bioinformatics 25, 1754–1760 (2009).
36. Behar, D. M. et al. A ‘‘Copernican’’ reassessment of the human mitochondrial DNAtree from its root. Am. J. Hum. Genet. 90, 675–684 (2012).
37. Lassmann, T. & Sonnhammer, E. L. L. Kalign—an accurate and fast multiplesequence alignment algorithm. BMC Bioinformatics 6, 298 (2005).
38. Sawyer, S., Krause, J., Guschanski, K., Savolainen, V. & Paabo, S. Temporal patternsof nucleotide misincorporations and DNA fragmentation in ancient DNA. PLoSONE 7, e34131 (2012).
39. Green, R. E. et al. A draft sequence of the Neandertal genome. Science 328,710–722 (2010).
40. Alexander, D. H. & Lange, K. Enhancements to the ADMIXTURE algorithm forindividual ancestry estimation. BMC Bioinformatics 12, 246 (2011).
41. Alexander,D.H.,Novembre, J.&Lange,K. Fastmodel-basedestimationofancestryin unrelated individuals. Genome Res. 19, 1655–1664 (2009).
42. Reich, D., Price, A. L. & Patterson, N. Principal component analysis of genetic data.Nature Genet. 40, 491–492 (2008).
43. Purcell, S. et al. PLINK: a tool set for whole-genome association and population-based linkage analyses. Am. J. Hum. Genet. 81, 559–575 (2007).
44. Skoglund, P., Stora, J., Gotherstrom, A. & Jakobsson, M. Accurate sex identificationof ancient human remains using DNA shotgun sequencing. J. Archaeol. Sci. 40,4477–4482 (2013).
LETTER RESEARCH
Macmillan Publishers Limited. All rights reserved©2015
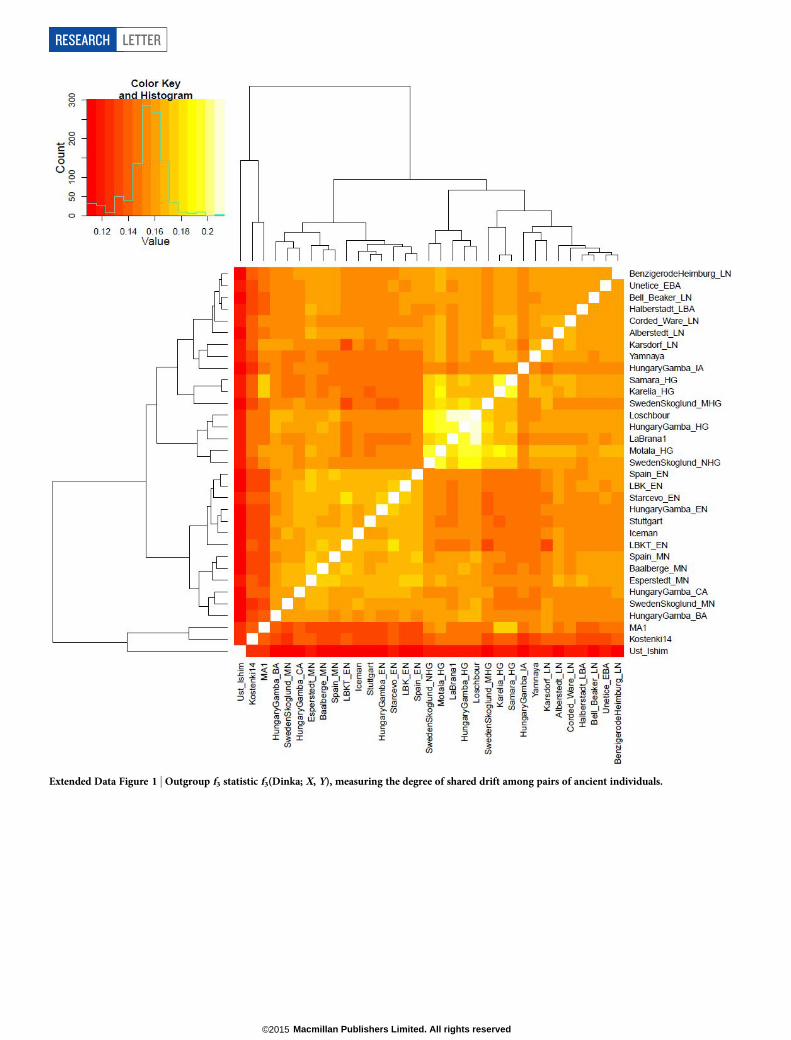
Extended Data Figure 1 | Outgroup f3 statistic f3(Dinka; X, Y), measuring the degree of shared drift among pairs of ancient individuals.
RESEARCH LETTER
Macmillan Publishers Limited. All rights reserved©2015

Extended Data Figure 2 | Modelling Corded Ware as a mixture of N 5 1, 2,or 3 ancestral populations. a, The left column shows a histogram of raw f4
statistic residuals and on the right Z-scores for the best-fitting (lowestsquared 2-norm of the residuals, or resnorm) model at each N. b, The data on
the left show resnorm and on the right show the maximum | Z | score change fordifferent N. c, resnorm of different N 5 2 models. The set of outgroups used inthis analysis in the terminology of Supplementary Information section 9 is‘World Foci 15 1 Ancients’.
LETTER RESEARCH
Macmillan Publishers Limited. All rights reserved©2015
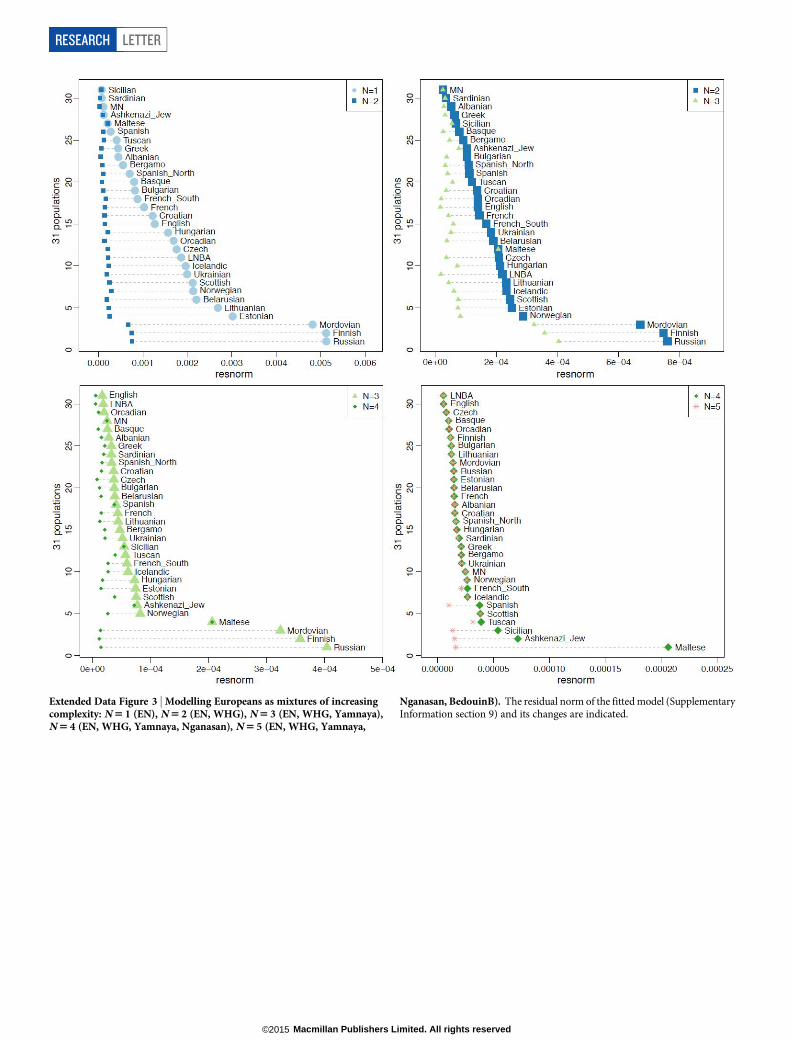
Extended Data Figure 3 | Modelling Europeans as mixtures of increasingcomplexity: N 5 1 (EN), N 5 2 (EN, WHG), N 5 3 (EN, WHG, Yamnaya),N 5 4 (EN, WHG, Yamnaya, Nganasan), N 5 5 (EN, WHG, Yamnaya,
Nganasan, BedouinB). The residual norm of the fitted model (SupplementaryInformation section 9) and its changes are indicated.
RESEARCH LETTER
Macmillan Publishers Limited. All rights reserved©2015

Extended Data Figure 4 | Geographic distribution of archaeologicalcultures and graphic illustration of proposed population movements /turnovers discussed in the main text. a, Proposed routes of migration by earlyfarmers into Europe ,9,00027000 years ago. b, Resurgence of hunter-gatherer
ancestry during the Middle Neolithic 7,00025,000 years ago. c, Arrival ofsteppe ancestry in central Europe during the Late Neolithic ,4,500 years ago.White arrows indicate the two possible scenarios of the arrival of Indo-European language groups. Symbols of samples are identical to those in Fig. 1.
LETTER RESEARCH
Macmillan Publishers Limited. All rights reserved©2015
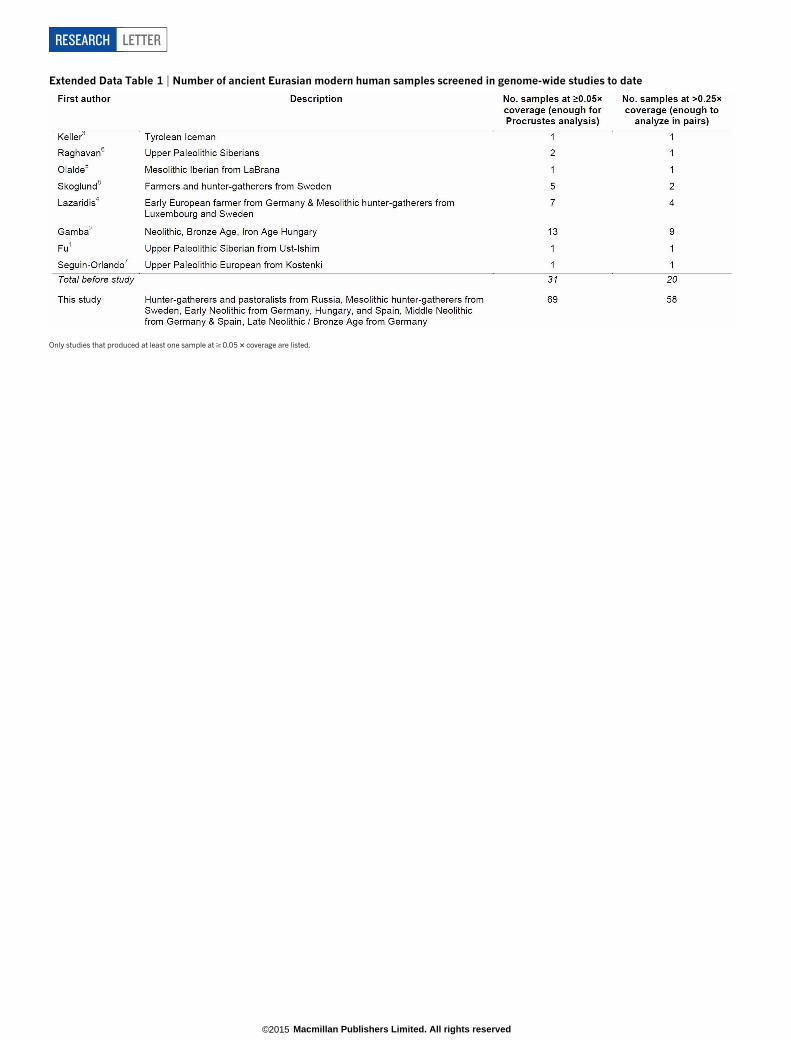
Extended Data Table 1 | Number of ancient Eurasian modern human samples screened in genome-wide studies to date
Only studies that produced at least one sample at $ 0.05 3 coverage are listed.
RESEARCH LETTER
Macmillan Publishers Limited. All rights reserved©2015
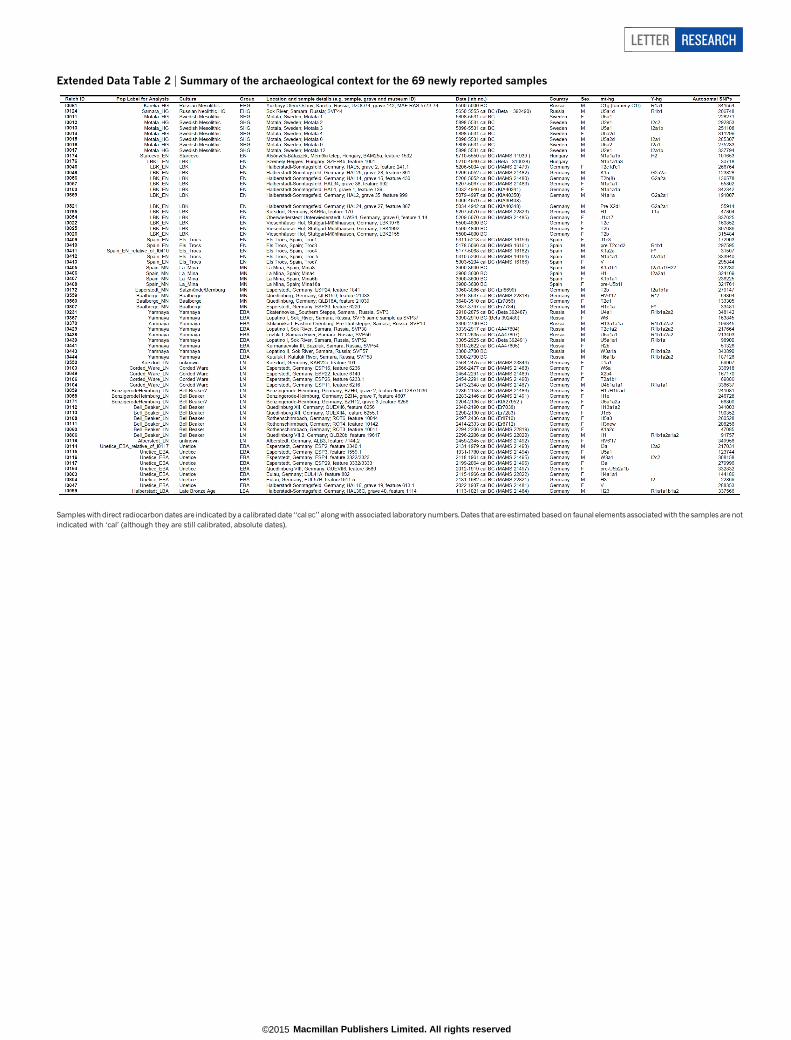
Extended Data Table 2 | Summary of the archaeological context for the 69 newly reported samples
Samples with direct radiocarbon dates are indicated by a calibrated date ‘‘cal BC’’ along with associated laboratory numbers. Dates that are estimated based on faunal elements associated with the samples are notindicated with ‘cal’ (although they are still calibrated, absolute dates).
LETTER RESEARCH
Macmillan Publishers Limited. All rights reserved©2015

Extended Data Table 3 | Pairwise FST for all ancient groups with $ 2 individuals, present-day Europeans with $ 10 individuals, and selectedother groups
FST (below the diagonal), standard deviation (above the diagonal).
RESEARCH LETTER
Macmillan Publishers Limited. All rights reserved©2015