genetic polymorphism of sheep hemoglobin
TRANSCRIPT
AN ABSTRACT OF THE THESIS OF
Joe Wayne Templeton for the(Name of student)
in Genetic s(Major)
presented on
Ph. D.(Degree)
July 19, 1968(Date)
Title: GENETIC POLYMORPHISM OF SHEEP HEMOGLOBIN
Abstract approved:Redacted for Privacy
F Ralph BoOrt
Five breeds of sheep (Columbia, Targhee, Rambouillet, Lin-
coln, and Suffolk) were found to possess two hemoglobin types (Hb. A
and Hb. B) when their hemoglobins were examined by disc gel electro-
phoresis. The hemoglobin alleles proved to be co-dominant.
Three of the breeds (Columbia, Targhee, and Rambouillet)
were maintained at altitudes of 4, 800 to 7, 500 feet above sea level and
the Lincoln breed investigated was maintained at altitudes of 750 to
1, 200 feet above sea level. These four breeds had a frequency of
Hb. A of 16% or greater. The Suffolk flock maintained at an altitude
of 250 feet above sea level had a frequency of Hb. A of approximately
5%. These data suggest an adaptive advantage for Hb. A at higher
altitudes.
An increase in inbreeding was observed to be associated with an
increase in the homozygosity at the hemoglobin locus. The association
was linear to a level of 35% inbreeding after which there was a
noticeable drop in the amount of homozygosity as inbreeding exceeded
35%.
There were no significant differences among the means of pro-
duction traits for the three classes of hemoglobin alleles when the
mean values of the following production traits were tested: (1) ave-
rage daily gain from birth to weaning, (2) weaning weight, (3) weaning
conformation, (4) weaning condition, (5) weaning index, (6) yearling
weight, (7) average daily gain from weaning to yearling, (8) yearling
condition, (9) yearling conformation, (10) yearling grease fleece
weight, (11) yearling fleece grade, and (12) yearling index.

Genetic Polymorphism of Sheep Hemoglobin
by
Joe Wayne Templeton
A THESIS
submitted to
Oregon State University
in partial fulfillment ofthe requirements for the
degree of
Doctor of Philosophy
June 1969
APPROVED:
Redacted for PrivacyProfessor of Animal Genetics
in charge of major
Redacted for PrivacyChairman of Genetics Board
Redacted for PrivacyDean of Graduate School
Date thesis is presented July 19, 1968
Typed by Jamie Sue Templeton for Joe Wayne Templeton

ACKNOWLEDGMENTS
The author would, first of all, like to express appreciation to
his wife, Jamie, whose interest and dedication in the preparation of
this thesis was nearly limitless.
The author is especially grateful to Drs. Ralph Bogart and Rod
Frakes and to two of his fellow graduate students, Carroll Nix and
Paul Humes. These people encouraged and assisted the author even
when it was inconvenient for them to do so.
The author is grateful to Drs. E. J. Dornfeld, D. L.. MacDonald,
and H. H. Stoevener who served as committee members for his pro-
gram.
A special thanks is extended to Dr. Ken Rowe who analyzed part
of the data and to Jerry Reeves, Dr. Donald Price, Harry Dunn, and
Paul Sanders who assisted in collection of data.

TABLE OF CONTENTS
Page
INTRODUCTION 1
REVIEW OF LITERATURE 3
MATERIALS AND METHODS 11
RESULTS AND DISCUSSION 16
Allele Frequency 20Inbreeding 31
Hemoglobin Types and Production Traits 33
SUMMARY AND CONCLUSIONS 39
BIBLIOGRAPHY 43

LIST OF FIGURES
Figure Page
1. Photographs of hemoglobin hemolysates after 19electrophoresis.
2. Response of increase in homozygosity to increase 32in inbreeding.
LIST OF TABLES
Table Page
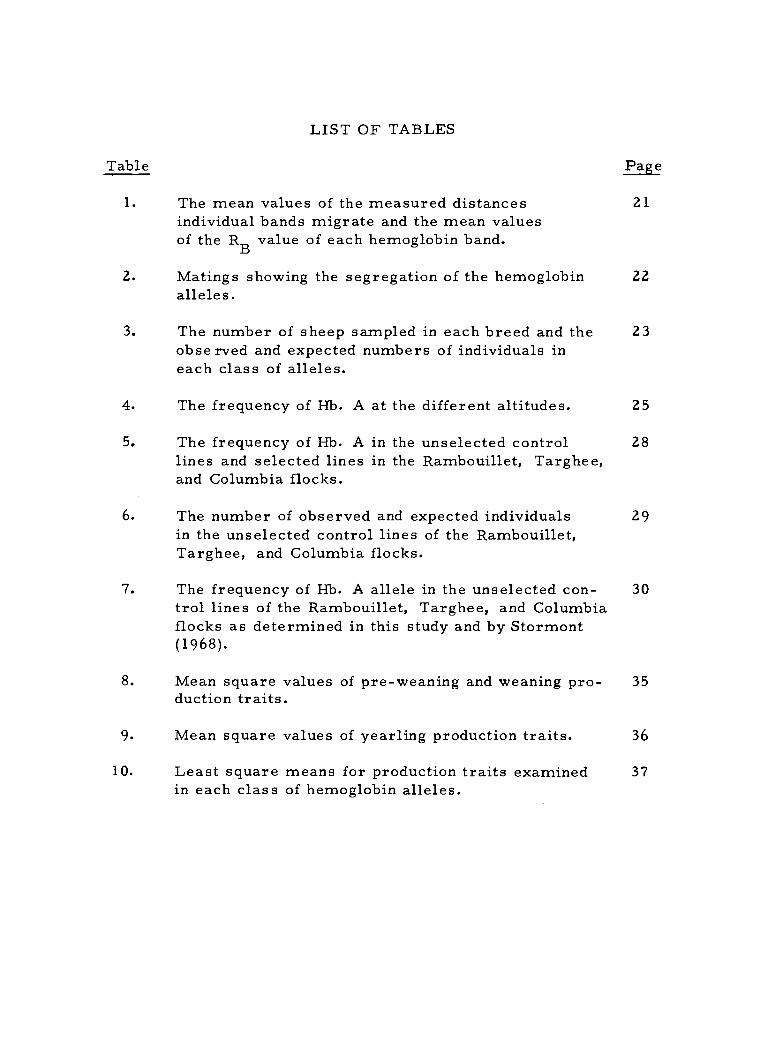
1. The mean values of the measured distances 21individual bands migrate and the mean valuesof the RB value of each hemoglobin band.
2. Matings showing the segregation of the hemoglobin 22alleles.
3. The number of sheep sampled in each breed and the 23obse rved and expected numbers of individuals ineach class of alleles.
4. The frequency of Hb. A at the different altitudes. 25
5. The frequency of Hb. A in the unselected control 28lines and selected lines in the Rambouillet, Targhee,and Columbia flocks.
6. The number of observed and expected individuals 29in the unselected control lines of the Rambouillet,Targhee, and Columbia flocks.
7. The frequency of Hb. A allele in the unselected con- 30trol lines of the Rambouillet, Targhee, and Columbiaflocks as determined in this study and by Stormont(1968).
8. Mean square values of pre-weaning and weaning pro- 35duction traits.
9. Mean square values of yearling production traits. 36
10. Least square means for production traits examined 37in each class of hemoglobin alleles.
GENETIC POLYMORPHISM OF SHEEP HEMOGLOBIN
INTRODUCTION
The discovery of genetic polymorphism demonstrated by pro-
teins that differ electrophoretically furnishes information for the
study of the genetics of the organism at all levels, i. e. molecular,
cellular, or the entire organism. The knowledge obtained from the
determination of genetic polymorphism from protein differences per-
mits the study of protein evolution and thus the evolution of the
organism.
Qualitative genetic traits enable man to examine the effects of
breeding systems on the frequencies of alleles where inbreeding and
selection are practiced. It is assumed that the genes for quantitative
traits behave in the same manner as the qualitative genes and thereby
allow a monitoring of the shifts in gene frequencies of all genes where
various breeding systems are used. The discovery of a qualitative
gene trait that may serve as a genetic marker for a desirable combi-
nation of quantitative genes which will make for better animal pro-
duction is possible as well as desirable.
The purpose of this study was to determine the polymorphic
forms of sheep hemoglobin as demonstrated by electrophoretic
patterns of sheep hemoglobins and to determine the inheritance of
these different hemoglobins.

2
Frequencies of the different hemoglobins were determined in
unselected control lines, and these frequencies were compared with
the frequencies of the hemoglobins in inbred lines and line crosses.
By comparing the lines in which selection has been practiced with the
line crosses, one should be able to determine gene frequency re-
sponse to inbreeding and selection.
The frequency of hemoglobin types was compared between
breeds that were maintained in different environments. Three of the
breeds (Columbia, Rambouillet, and Targhee) were maintained at
high altitudes of 4, 800 to 7, 500 feet above sea level; the Lincoln breed
was maintained at altitudes of 750 to 1, 200 feet above sea level; and
the Suffolk breed was maintained at an altitude of 250 feet above sea
level. The different environments may result in a different frequency
of hemoglobin alleles. Also, two of the breeds (Columbia and Targhee)
were developed from a cross between the Lincoln and Rambouillet
breeds.
The association of hemoglobin types with production traits of
the sheep was examined to see if the hemoglobin types might be use-
ful to predict better performing animals. The study not only adds to
our store of knowledge, but it should have economic value if there is
a reasonable association between hemoglobin types and productivity
of the animals.

3LITERATURE REVIEW
Pau ling et al. (1949) discovered that sickle cell anemia in
humans could be attributed to a hemoglobin (Hb. S) that differed
electrophoretically from the normal adult hemoglobin (Hb. A1).
Since then, there has been an extensive search for polymorphic hemo-
globins that differ electrophoretically in most all of the animals using
hemoglobin as a respiratory pigment.
Lehmann and Huntsman (1966) report that 35 human hemoglobin
variants have been discovered by electrophoresis, and many more
are being discovered and reported. Lehmann and Huntsman (1966)
point out that, while all hemoglobin variants in humans are not re-
sponsible for abnormal conditions, there are a considerable number
that are responsible for abnormal conditions. It is the association of
hemoglobin variants with abnormal conditions in humans that has
prompted the extensive investigations of hemoglobins in farm animals..
The most extensively studied hemoglobins of farm animals are
bovine (cattle) and ovine (sheep). Efremov and Braend (1965) report
that five normal adult hemoglobins (Hb. A, Hb. B, Hb. C, Hb. D,
and Hb. K) and one normal fetal hemoglobin (Hb. F) have been demon-
strated in cattle. Beale et al. (1966) reported that two normal adult
hemoglobins (Hb. A and Hb. B), one abnormal adult hemoglobin
(Hb. C), and one normal fetal hemoglobin (Hb. F) have been demon-
strated in sheep.
4
Harris and Warren (1955) were the first investigators to report
the discovery of polymorphic hemoglobins in sheep. They tested 12
pregnant ewes and observed Hb. A and Hb. B in the homozygous and
heterozygous state in the various individual ewes (5 AB, 3 AA, and
4 BB). Each of the fetuses had only one type of hemoglobin (Hb. F).
This has since been confirmed by many investigators on a large
scale, notably Evans et al. (1956); Evans, Harris, and Warren (1957);
Huisman, van Vliet, and Sebens (1958) and Stormont (1968).
The discovery of Hb. C was first made by Blunt and Evans
(1963) when they were observing potassium and hemoglobin type
changes under anemic stress. They did not label the new hemoglobin
because they thought it may be one of the two normal adult hemoglo-
bins.
Independently Braend, Efremov, and Helle (1964) and van Vliet
and Huisman (1964) discovered that a new adult hemoglobin was pro-
duced when anemia occurred naturally or when anemia was induced.
Braend, Efremov, and Helle (1964) observed a new hemoglobin
in a sheep that had parasitically induced anemia. They called this
new hemoglobin - hemoglobin N. [ This Hb. N is the same hemo-
globin as the Hb. C observed by van Vliet and Huisman (1964). See
Efremov and Braend (1966).1
van Vliet and Huisman observed that a new hemoglobin that
they called Hb. C was produced in a sheep that had been bled to an

5
anemic state. They observed that Hb. C occurred only in sheep
that possessed the normal Hb. A in the homozygous or heterozygous
state. They observed that Hb. C replaced only Hb. A as anemia was
induced; but as the sheep was allowed to recover to normal levels of
hemoglobin, the Hb. C was replaced by Hb. A. The term Hb. C will
be used to refer to Hb. C and Hb. N in subsequent discussions in
order to avoid confusion.
The occurrence of Hb. C in non-anemic sheep that possess
Hb. A has been studied by Braend and Efremov (1965). They found
that Hb. C composed one to two percent of the hemoglobin in some
breeds but was not detectable in other breeds. They investigated six
breeds of sheep (Spael, Ia la, Rygja, Cheviot, Oxford Down, and
Spanish Merino) and could detect Hb. C in the sheep that possessed
Hb. A in the Spael, Ia la, and Rygja (old Norwegian mountain breeds)
but could not detect Hb. C in the sheep that possessed Hb. A in the
Cheviot, Oxford Down and Spanish Merino. They suggest that there
is a definite breed difference.
Boyer et al. (1966) have completed an extensive investigation
on the three adult hemoglobins which has culminated in their deter-
mination of the primary amino acid sequence of the beta chains of
each of the hemoglobins. They concluded that the sheep hemoglobin
molecule is a tetramer consisting of two alpha ( a ) chains and two
beta ( (3 ) chains. The three hemoglobins (Hb. A, Hb. B, and Hb. C)
6
differ only in the p chains, and the p chains of the Hb. A and
Hb. B are allelic products. The p chains of Hb. A and Hb. B differ
by seven amino acid residues and the 3 chain sequence of Hb. C
differs from Hb. A by 16 amino acid residues and from Hb. B by 21
amino acid residues.
The discovery of two normal polymorphic hemoglobins in adult
sheep has prompted intensive investigation into the frequency of these
alleles to see if they are the same in all breeds. The investigation
of hemoglobin frequencies has been done more extensively in Euro-
pean sheep (Evans et al., 1956; Evans, Harris, and Warren, 1957,
1958a, and 1958b; Efremov and Braend, 1966; and Braend and
Efremov, 1965) with only one investigator observing the frequencies
of sheep hemoglobin in the U. S. (Stormont, 1968).
The frequencies of the two normal alleles varies quite markedly
from breed to breed, but the frequency of the alleles has very good
association with particular environments. Evans, Harris, and
Warren (1958b), after investigating the frequency of Hb. A and Hb. B
in 33 breeds of British sheep, were able to show that the breeds of
sheep that were common to higher altitudes had a significantly higher
frequency of Hb. A; and the breeds that were common to lower alti-
tudes had a significantly higher frequency of Hb. B. They postulate
a selective advantage for Hb. A at the higher altitudes.
Evans and Blunt (1961) have added to the theory of selective

7
advantages for the different hemoglobin types in different environ-
ments by comparing the frequencies of the hemoglobin types in
Romney Marsh and Southdown breeds of sheep in different environ-
ments. The frequencies of the hemoglobin types were compared
between the Romney Marsh and Southdown breeds in England and in
Australia. It was found that the frequency of Hb. A had increased
significantly in Australia in both breeds (frequency of Hb. A in Great
Britain was 9.0% in Southdown and 11.0% in Romney Marsh and the
frequency of Hb. A in Australia was 28. 0% in the Southdown and
44. 0% in the Romney Marsh). The above evidence, according to
Evans and Blunt, demonstrates that the selective advantages of Hb.
A and Hb. B have been altered in the different environments and
account for the shift in the frequency of the alleles.
The selective advantages the two different hemoglobins might
give the animals have been explained by several authors on the
difference in oxygen affinity (oxygen tension curves) between the
hemoglobins (Huisman, van Vliet, and Sebens, 1958; van Vliet and
Huisman, 1964; and Dawson and Evans, 1966). All of these investi-
gators have found that Hb. A has a greater oxygen affinity than Hb.
B; and this evidence, when coupled with the occurrence of Hb. A in
higher frequency at the higher altitudes, seems to be the explanation
for Hb. A having a selective advantage over Hb. B in environments
where oxygen is in shorter supply.

8
The difference in oxygen affinity might be a plausible explan-
ation for maintenance of the hemoglobin polymorphism, but several
investigators think that the association of hemoglobin type with
some critical production trait might better explain the maintenance
of the hemoglobin polymorphism. This idea is still maintained,
even though the association of other single loci traits with production
traits in sheep is not encouraging (Stansfield et al., 1964).
Parker, Weseli, and Cartwright (1967) attempted to associate
the hemoglobin types of six different breeds of cattle (Angus, Brah-
man, Charbray, Charolais, Hereford, and Santa Gertrudis) and
breed crosses between these six breeds with production traits as an
explanation for the polymorphic hemoglobins in cattle. However,
they were unable to find sufficient variation of the two types of hemo-
globin (Hb. A and Hb. B) in any of the six breeds and the breed
crosses and they concluded that herds with more variation of hemo-
globin phenotypes would have to be found in order to test association
of hemoglobin types with productivity.
Stansfield et al. (1964) attempted to associate red cell antigen
types in Rambouillet, Targhee, Columbia, and two flocks of cross
bred sheep with several production traits: (1) condition score of lamb
at weaning, (2) conformation of lamb at weaning, (3) side wool grade,
(4) thigh wool grade, (5) staple length of lamb's fleece, (6) amount of
face covered by wool, (7) composite selection index score (of above

9
traits), (8) body weight as a yearling, (9) condition score as a
yearling, (10) conformation score as yearling, (11) amount of grease
in yearling fleece, (12) staple length of yearling fleece, (13) yearling
fleece grade, and (14) neck score (based on skin folds). They con-
cluded there was no significant association between any of the red
cell antigens and the production traits mentioned above.
King et al. (1958) determined the frequency of the class of
alleles (60.7% AA, 35.1% AB, and 5.2% BB) of hemoglobin types in
a flock of Scottish black face Lanark sheep and correlated the hemo-
globin type classes with the following production traits: (1) Body
weight of the ewe in November before mating, (2) fleece weight of
the ewe at shearing in July, (3) birth weight of the lamb, (4) June
weight of the lamb, (5) weaning weight of the lamb in August, (6)
cannon bone length of the lamb (measured on hind cannon bone in
June), (7) medulation index of the lamb's fleece, and (8) mean fiber
length of the lamb's fleece. They concluded that there was no signifi-
cant association between any of the above-mentioned traits and the
hemoglobin types. However, they did find a tendency for those sheep
possessing Hb. B, whether in homozygous or heterozygous state, to
produce and to wean more lambs than sheep which were homozygous
for Hb. A.
Evans and Turner (1965) investigated further the possibility of
Hb. B being associated with better lamb production in the Australian
10
Merino sheep. They investigated four experimental flocks of Austra-
lian Merino where (1) one flock was not selected for reproductive
performance, (2) one flock was selected for high twinning rate, (3)
one flock was selected for low twinning rate, and (4) one flock was
selected for multiple births (triplets and quadruplets were reported
very common in this flock). They concluded from their evidence
that sheep with Hb. B (BB or AB) did in fact produce and wean more
lambs than did the sheep homozygous for Hb. A, but Hb. A seemed
to confer advantages after weaning which accounted for the main-
tenance of the polymorphism of hemoglobins.
From the preceding literature, it can be generalized that there
exist two normal adult sheep hemoglobins (Hb. A and Hb. B) which
differ electrophoretically. The frequencies of these hemoglobin
types differ from breed to breed and they seem to be maintained in
polymorphic frequencies by the environment under which the sheep
are maintained.
The possible adaptive value one hemoglobin type has over the
other in a particular environment might be due to the higher oxygen
affinity Hb. A has over Hb. B in environments of higher altitudes or
where oxygen is not as readily available. The adaptive value Hb. B
seems to have over Hb. A where oxygen supply is plentiful is that it
is associated in some way with better reproductive performance.

11
MATERIALS AND METHODS
Five different breeds of sheep-- Targhee, Columbia, Ram-
bouillet, Lincoln, and Suffolkwere used in the study. The Targhee,
Columbia, and Rambouillet breeds were checked for frequency of
their hemoglobin alleles, and their hemoglobin types were examined
for association with their production traits; but the Suffolks and the
Lincolns were checked only for the frequency of their hemoglobin
alleles.
The Targhee, Columbia, and Rambouillet breeds used in this
study were part of the United States Department of Agriculture flock
kept at the United States Sheep Experiment Station at Dubois, Idaho.
The Targhee and Columbia breeds were developed at the U. S. Sheep
Breeding Station from crosses of Lincoln X Rambouillet.
The Columbia, Targhee and Rambouillet sheep used were bred
in a diallel mating system in which four inbred lines of each breed
were crossed in all possible ways to produce 12 line crosses. Blood
samples were taken from all animals of a four-line diallel in each of
the three breeds; and, in addition, blood samples were taken from
unselected control populations in each of the three breeds. The
sample size obtained in these three breeds was unequal as indicated
in Table 3.
The Suffolk sheep are part of the Oregon State University flock
12
kept at Corvallis, Oregon. The Suffolks are a closed line of sheep
that was started with three sires and 45 dams in 1952.
The Lincoln sheep used in this study are part of a purebred
flock of Lincoln sheep owned by Mr. Don Kessi of Harlan, Oregon.
The Lincolns are an open population in which Mr. Kessi purchases
breeding rams each year from different sources, and keeps the
better ewe lambs for breeding stock as they are needed.
Approximately 15 ml of blood were drawn from the jugular vein
with a 16-gauge needle into a heparinized test tube which contained
three drops of 1000 USP units per milliliter heparin solution. The
test tubes were stoppered and placed in an ice chest to keep them
cool until the red blood cells could be separated from the plasma and
lysed. The whole blood was centrifuged at 1800 RPM for ten minutes
in order to remove the plasma. The cells were then washed three
times with sterile 0. 9% sodium chloride solution and were centrifuged
at 1800 RPM for ten minutes after each washing to remove the saline
' solution. After the saline solution from the last washing had been
removed,- the cells were lysed with a volume of cold distilled water
that equaled that of the packed cells. After lysing the cells, the
hemolysate was centrifuged at 2700 RPM for 20 minutes. Five milli-
liters of the hemolysate were decanted and placed in a 15 milliliter
serum bottle. The bottle was stoppered and carbon monoxide was
slowly bubbled through each bottle for one minute. After this, the
13
hemolysate was frozen for transfer and storage until analysis of the
hemoglobin types could be made.
The determination of hemoglobin types was accomplished by
disc acrylamide gel electrophoresis after the method of Ornstein
(1964) and Davis (1964). The following modifications were made:
The acrylamide gels were set up in glass tubes that were three inches
in length with an inside diameter of 5 millimeters. The separation
gel and the sample gel were each five-sixteenths of an inch in length.
A sample size of two microliters was run from the cathode toward the
anode with a constant amperage of three and one-half milliamperes
per tube until the tracker dye (Bromophenol blue) had reached a con-
stant distance of seven-eighths of an inch (+ one-sixteenth of an inch)
from the end of the glass tube.
The gels were removed from the glass tubes and the two upper
gels (the sample and the spacer gels) were removed from the separa-
tion gel so that a clean surface was obtained at the interface between
the spacer gel and the separation gel. This cleaned surface was con-
sidered the origin when the distances the various bands had moved
were measured. The hemoglobin bands were located by their natural
color.
The gels were placed on a plexiglass block that had a groove
five millimeters wide and two and one-half millimeters deep machined
in it. The block had been ruled off 50 lines to the inch on both sides

14
of the groove making it possible to measure the distances the hemo-
globin bands and the tracker dye band had moved. The distance the
various bands had moved was measured in total lines the bands had
moved.
After the measurement of the distance the bands had moved,
the RB was calculated. The RB is defined as the decimal fraction
obtained when the total distance the tracker dye moved is divided
into the total distance the hemoglobin bands had moved:
distance hemoglobin migratedRB distance tracker dye migrated
After identification of the various hemoglobins by the RB
value, the frequency of each allele in each breed of sheep was cal-
culated in the following manner:
No. of homozygous+ 1 / 2 No. heterozygous
Frequency individuals individualsof allele Total No. of individuals observed
In the three breeds of sheep (Rambouillet, Targhee, and
Columbia) that were bred in the diallel mating system, the percent
homozygosity in the inbred lines was compared with the percent
homozygosity of the line crosses. This was done to check the effect
inbreeding has on the amount of homozygosity.
The frequencies of the alleles in each breed were used in the
15
Hardy - Weinburg equilibrium equation (p2 + 2 pq + q2 = 1) in order
to calculate the expected frequencies of the homozygotes and the fre-
quency of the heterozygotes. This was compared with the frequencies
obtained to examine if one combination of alleles has some type of
selective advantage.
The mean values of the following production traits were com-
pared by the Least Squares method of analysis between each combi-
nation of alleles, i. e. homozygous AA, heterozygous AB, and homo-
zygous BB, in order to check the possibility of one of the combi-
nations of alleles being a genetic marker for one of the production
traits: (1) average daily gain from birth to weaning, (2) confor-
mation at weaning, (3) condition at weaning, (4) weaning weight, (5)
average daily gain from weaning to yearling age, (6) conformation at
yearling age, (7) condition at yearling age, (8) grease fleece weight
as yearling, (9) yearling fleece grade, (10) yearling body weight,
(11) yearling index score, and (12) weaning index score.
The segregation of the alleles is demonstrated by showing some
matings where all alleles are involved. Matings where the sire was
homozygous for Hb. A were not observed in the present study, but
there were several matings where the Hb. A allele in the heterozygous
state was involved.

16RESULTS AND DISCUSSION
By use of the disc acrylamide electrophoretic technique accord-
ing to the method of Ornstein (1964) and Davis (1964) it was found that
the polymorphic hemoglobins in the five breeds of sheep (Columbia,
Lincoln, Rambouillet, Suffolk, and Targhee) investigated were of
two types--Hb. A and Hb. B. The presence of any other hemoglobin
in the samples observed was not detected. It is believed that the
electrophoretic technique employed allowed a sufficiently strict clas-
sification of the hemoglobin types observed, and thus minimum
amount of error was involved in the detection of hemoglobin polymor-
phism.
All samples of hemolysate containing Hb. A were investigated
for the presence of Hb. C, and there was no Hb. C detectable in the
blood of any of the breeds. This is not conclusive proof that Hb. C
does not comprise a small percentage of the hemoglobin of the sheep
in these five breeds that possess the allele for Hb. A, because it is
possible that the small sample size (2. 0 microliters) of hemolysate
used was not large enough to detect the presence of molecules in such
small amounts.
The identification of the two hemoglobins found was aided by
a sample of Hb. AB hemolysate from a heterozygous sheep sent by
Dr. R. A. Rasmusen from the University of Illinois College of Agri-
culture, Urbana, Illinois.

17
There was an immediate problem in the determination of the
hemoglobin types because of the presence of two bands in some
samples and three bands in the rest of the samples instead of the one
band for homozygous sheep and two bands for heterozygotes which is
normally found in electrophoretic patterns of sheep hemoglobins
when starch gel electrophoresis is used (Beale et al., 1966).
Ornstein (1964) states, however, that the disc acrylamide electro-
phoretic technique will dissociate a complex molecule if the electro-
phoretic mobilities of the components of the complex molecule are
different from one another. This seemed to be what was happening,
i. e. the hemoglobin tetramer was dissociating into the a and p
chains (see Figure 1).
To further test this hypothesis, the hemolysate samples were
purposefully dissociated to see if there were any differences detect-
able. Duesberg and Rueckert (1965) and Lehmann and Huntsman
(1966) report that hemoglobin dissolved in 8 m urea solution would
dissociate into its a and p chain components. The technique of
Duesberg and Rueckert (1965) was applied to the sheep hemoglobins,
and it was found that there was no difference in the number of bands
or the RB values of the bands between the same samples when one
portion of the hemolysate was dissolved in 8 m urea solution and was
subjected to electrophoresis at the same time as a portion of the
same hemolysate which was not dissolved in 8 m urea.

A. Sample 210 - Homozygous AA
1. aA RB = O. 500
2. 13
A R = 0. 549
B. Sample 210 - Homozygous AA and sample 637 - Homozygous BB -mixed in equal volume
3. 13 RB= 0.430
4. aA and a B RB= 0.492
5.RA
RB= O. 551
C. Sample 637 - Homozygous BB
6. RB RB= 0.425
7.B
RB = O. 491
D. Sample 571 - Heterozygous AB
8.
9.
10.
RB
aA and a B
13
A
RB =
RB=
RB =
O. 429
O. 489
0. 562
Tracker dye band
Figure 1. Photographs of hemoglobin hemolysates after electro-phoresis.

12
A
345
B
67
C
89
10
D
19
20
It was observed that length of storage and carbon monoxide
affecting the hemolysate also influenced the dissociation of the hemo-
globin tetramer. It was observed that when hemoglobin samples
were electrophoresed the same day the blood was collected and car-
bon monoxide was not bubbled through the hemolysate the dissociation
of the tetramer was not as complete. This was determined by the
density of the bands.
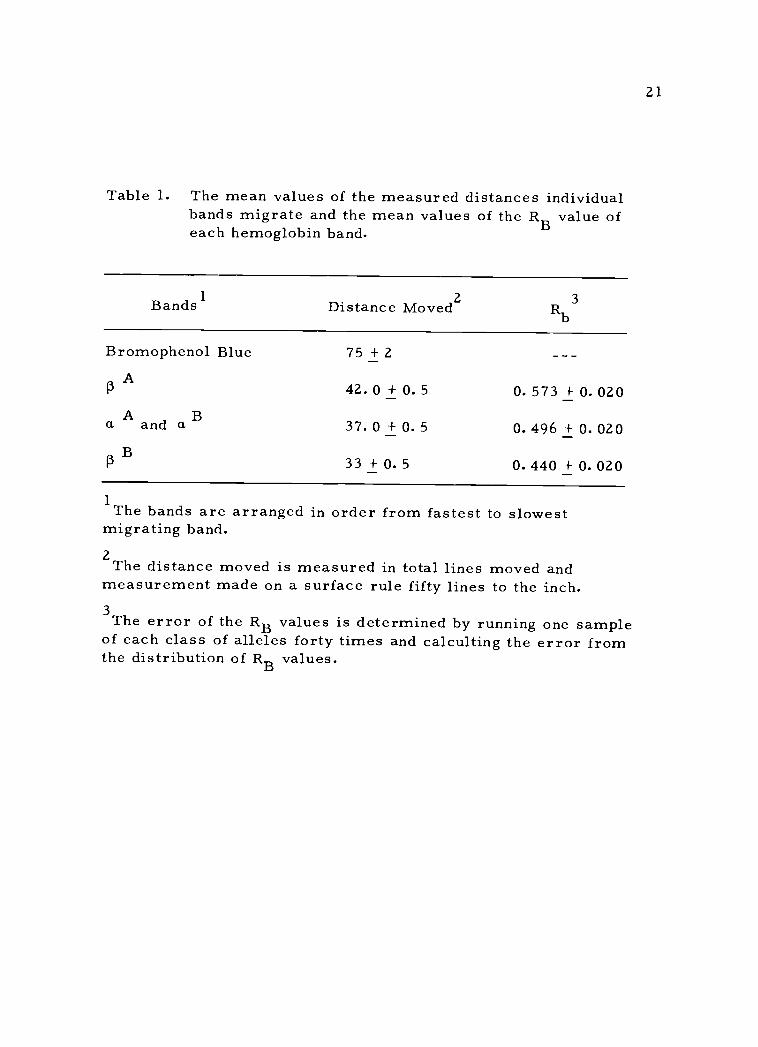
The 3 chain of Hb. A ( (3A) was the most rapidly moving
band; the a chain which is common to both hemoglobin types was the
intermediate moving band (this was determined by the middle band
in heterozygotes and the middle band when homozygous AA and homo-
zygous BB samples were mixed being the heaviest of the three bands);
and the p chain of Hb. B (R B) was the slowest moving band (see
Table 1).
The inheritance of the hemoglobin is by co-dominant alleles
since the allele is expressed if the sheep possess it, i. e. in the
heterozygous Hb. A and Hb. B are readily detected in the hemoglobin
phenotype of the sheep. The alleles segregate freely from one
another as is shown by the matings shown in Table 2.
Allele frequency
The frequencies of the hemoglobin types found in the five breeds
of sheep examined are indicated in Table 3. The expected number of
21
Table 1. The mean values of the measured distances individualbands migrate and the mean values of the RB value ofeach hemoglobin band.
Bands 1
Distance Moved2R
b3
Bromophenol Blue
PA
A Ba and a
13
B
75 +2 -_
42. 0 + 0. 5 O. 573 + O. 020
37. 0 + O. 5 0. 496 + 0. 020
33 +0.5 5 0. 440 + 0. 020_
1The bands are arranged in order from fastest to slowestmigrating band.2The
distance moved is measured in total lines moved andmeasurement made on a surface rule fifty lines to the inch.3The error of the RB values is determined by running one sample
of each class of alleles forty times and calculting the error fromthe distribution of RB values.
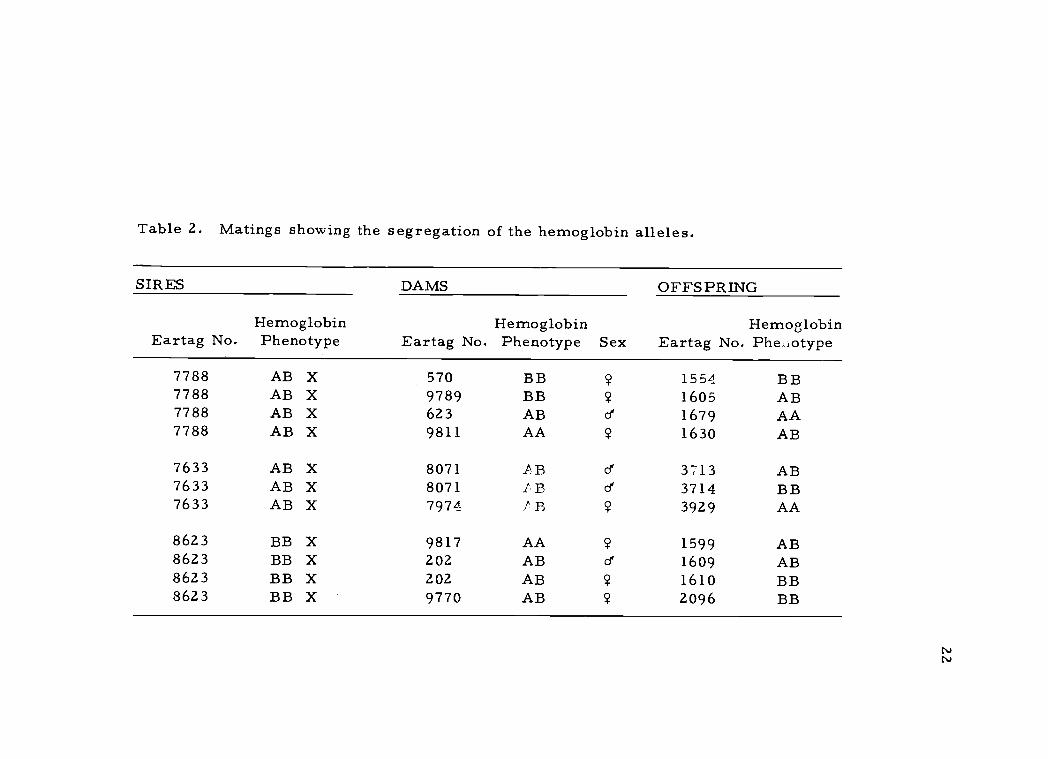
Table 2. Matings showing the segregation of the hemoglobin alleles.
SIRES DAMS OFFSPRING
Eartag No.HemoglobinPhenotype
HemoglobinEartag No. Phenotype Sex
HemoglobinEartag No. Phe iotype
7788 AB X 570 BB ? 1554 BB7788 AB X 9789 BB ? 1605 AB7788 AB X 623 AB e 1679 AA7788 AB X 9811 AA ? 1630 AB
7633 AB X 8071 1B di 3713 AB7633 AB X 8071 I'D cf 3714 BB7633 AB X 7974 r B ? 3929 AA
8623 BB X 9817 AA ? 1599 AB8623 BB X 202 AB e 1609 AB8623 BB X 202 AB ? 1610 BB8623 BB X 9770 AB ? 2096 BB
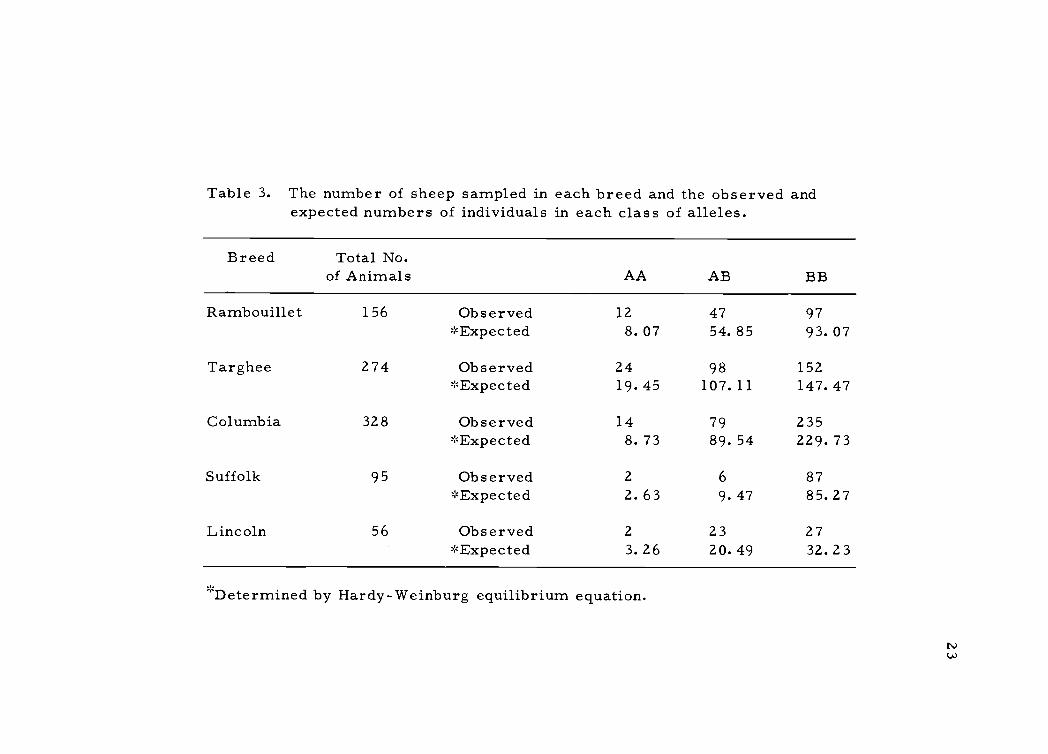
Table 3. The number of sheep sampled in each breed and the observed andexpected numbers of individuals in each class of alleles.
Breed Total No.of Animals AA AB BB
Rambouillet 156 Observed*Expected
128.07
4754.85
9793.07
Targhee 274 Observed 24 98 152*Expected 19. 45 107.11 147.47
Columbia 328 Observed 14 79 235*Expected 8.73 89.54 229.73
Suffolk 95 Observed 2 6 87*Expected 2. 63 9. 47 85.27
Lincoln 56 Observed 2 23 27*Expected 3.26 20.49 32.23
''Determined by Hardy-Weinburg equilibrium equation.

24
individuals in each class of alleles was calculated using the Hardy-
Weinburg equilibrium equation. Differences between the observed
number and expected number of individuals was tested for significance
by the chi-square method. There were no significant chi-square
values obtained when the differences between observed and expected
number of individuals in any class of alleles in any of the breeds
were examined. This indicates that the breeds exam fined are in
equilibrium for the hemoglobin alleles and that there is no natural
selection favoring any class of the alleles.
The fact that natural selection is not favoring one class of the
alleles does not determine if one of the alleles is better adapted to a
particular environment. It is expected that offspring of even a selec-
ted population would be in Hardy-Weinburg equilibrium until selection
is practiced on them with the qualification that the parents are mated
at random. The adaptive advantage of an allele in different environ-
ments can be determined by examining the frequency of the allele in
different environments and testing for significant difference between
the frequency of the allele in the two environments.
The Rambouillet, Columbia, and Targhee flocks that are
maintained at altitudes of 4, 800 to 7, 500 feet above sea level and
the Lincoln flock maintained at altitudes of 750 to 1, 200 feet above
sea level had gene frequencies of the Hb. A allele of 16% or more
as indicated in Table 4. The frequency of Hb. A allele in the Suffolk

25
flock that is maintained at 250 feet above sea level was 5. 26% as
indicated in Table 4. There is a highly significant difference between
the frequency of Hb. A in the flocks maintained at higher altitudes
and the one flock maintained at the relatively low altitude when the
difference between the frequencies of Hb. A at the different altitudes
is tested by the chi-square method. The Hb. A seems to give the
animals that possess it an adaptive advantage in higher altitudes.
This conclusion agrees with the data of several investigators, prin-
cipally Evans, Harris, and Warren (1958b).
Table 4. The frequency of Hb. A at the different altitudes.
Breed Frequency of A allele Altitude*
Rambouillet 22. 76% 4, 800-7, 500
Targhee 26. 64% 4, 800-7, 500
Columbia 16. 31% 4, 800-7, 500
Lincoln 24. 11% 750-1, 200
Suffolk 5. 26% 250
-Altitude in feet above sea level.
The adaptive advantage Hb. A gives the animals is believed to
be the result of Hb. A having a greater oxygen affinity than Hb. B.
This possibility has been investigated by Dawson and Evans (1966) and
they concluded that Hb. A did deliver more oxygen to the tissue
26
when the animals were exercised or when placed in an atmosphere
with reduced oxygen content. They concluded from the results of
their investigation that oxygen affinity differences between Hb. A and
Hb. B were great enough to give Hb. A an adaptive advantage in higher
altitudes.
The data in the present study are in agreement with the theory
of selective advantage for Hb. A in higher altitudes. It is especially
in agreement when the frequency of Hb. A is compared between the
Rambouillets, Columbias, and Targhees that are maintained at the
high altitudes around Dubois, Idaho, and the Suffolks which are main-
tained at the low altitudes of Corvallis, Oregon (see Table 4).
The Lincoln flock investigated also possess a frequency of
Hb. A that is approximately the same as that of the breeds maintained
at higher altitudes (see Table 4). This is not readily explainable
because it is doubtful that the difference in 500 to 950 feet in altitude
between the Lincoln and Suffolk flocks would exert the same selection
pressure as the difference of 4, 550 to 7,250 feet in altitude between
the flocks at Dubois and the flock at Corvallis.
There are several explanations that are plausible: (1) This
could possibly be an example of genetic drift by a small population
(there are few Lincoln sheep in the area) where the frequencies deter-
mined are not representative of a population of sheep maintained at
this altitude. (2) The sample number was small and this could result

27
in a very gross sampling error which might make the sample investi-
gated not representative of a population maintained at this altitude.
(3) It is possible that the altitude alone does not fully indicate the
selection pressure of the environment in which these sheep are main-
tained. (4) It is possible that there is some selection for Hb. B in
the flocks at Dubois which would lower the frequency of Hb. A in these
flocks and thereby account for the frequency of Hb. A being approxi-
mately the same even though there is a big difference in altitude.
All of these things could explain the frequency of Hb. A being
approximately the same in the Rambouillet, Columbia, Targhee, and
Lincoln flocks even though they are in different environments. How-
ever, the possibility of the altitude not being fully indicative of the
environment in which the Lincoln flock is maintained seems to be the
most plausible. This is most evident when the pasture in which this
Lincoln flock was maintained is observed. The pasture on which the
sheep are grazed most of the time consists of very steep slopes and
rugged terrain. The rugged terrain, when coupled with the wet and
cold winters the sheep experience, constitutes an environment which
might increase oxygen demands and thereby give Hb. A an adaptive
advantage.
Additional evidence for the adaptive advantage of Hb. A in the
Rambouillet, Columbia, and Targhee breeds is obtained when the
difference in frequency of Hb. A between the unselected control lines
28
and the selected lines in these three breeds is examined.
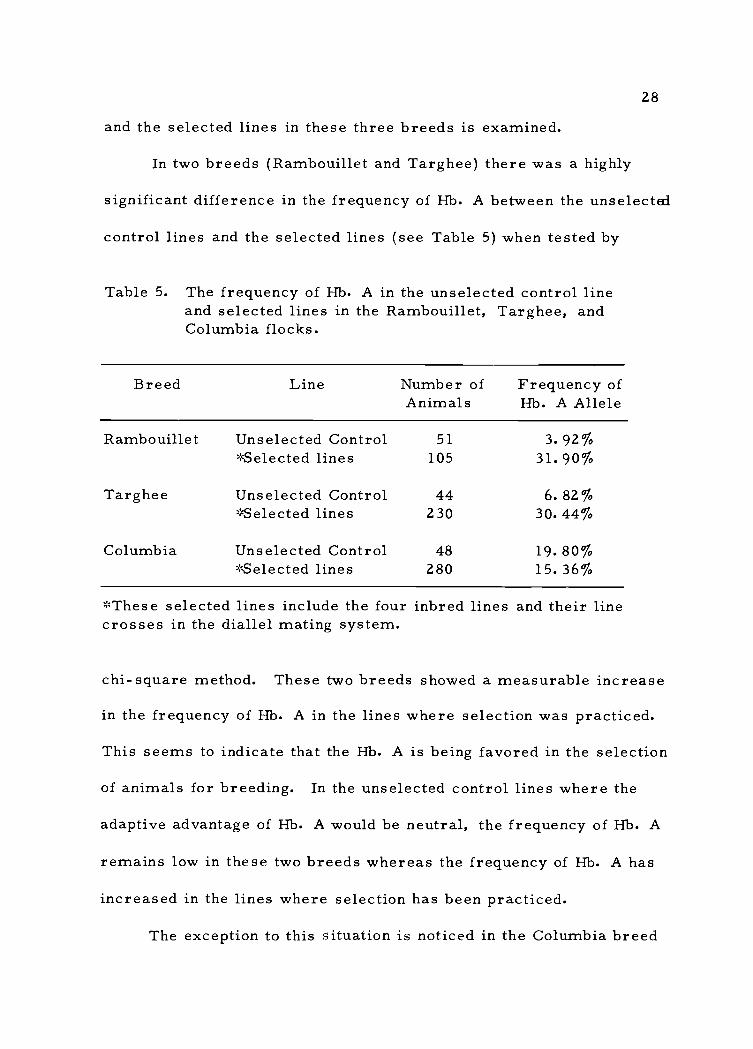
In two breeds (Rambouillet and Targhee) there was a highly
significant difference in the frequency of Hb. A between the unselected
control lines and the selected lines (see Table 5) when tested by
Table 5. The frequency of Hb. A in the unselected control lineand selected lines in the Rambouillet, Targhee, andColumbia flocks.
Breed Line Number ofAnimals
Frequency ofHb. A Allele
Rambouillet Unselected Control 51 3. 92%*Selected lines 105 31. 90%
Targhee Unselected Control 44 6. 82%*Selected lines 230 30. 44%
Columbia Unselected Control 48 19. 80%*Selected lines 280 15. 36%
*These selected lines include the four inbred lines and their linecrosses in the diallel mating system.
chi-square method. These two breeds showed a measurable increase
in the frequency of Hb. A in the lines where selection was practiced.
This seems to indicate that the Hb. A is being favored in the selection
of animals for breeding. In the unselected control lines where the
adaptive advantage of Hb. A would be neutral, the frequency of Hb. A
remains low in these two breeds whereas the frequency of Hb. A has
increased in the lines where selection has been practiced.
The exception to this situation is noticed in the Columbia breed
29
where there is no significant difference in the frequency of Hb. A
between the unselected control line and the selected lines (see Table
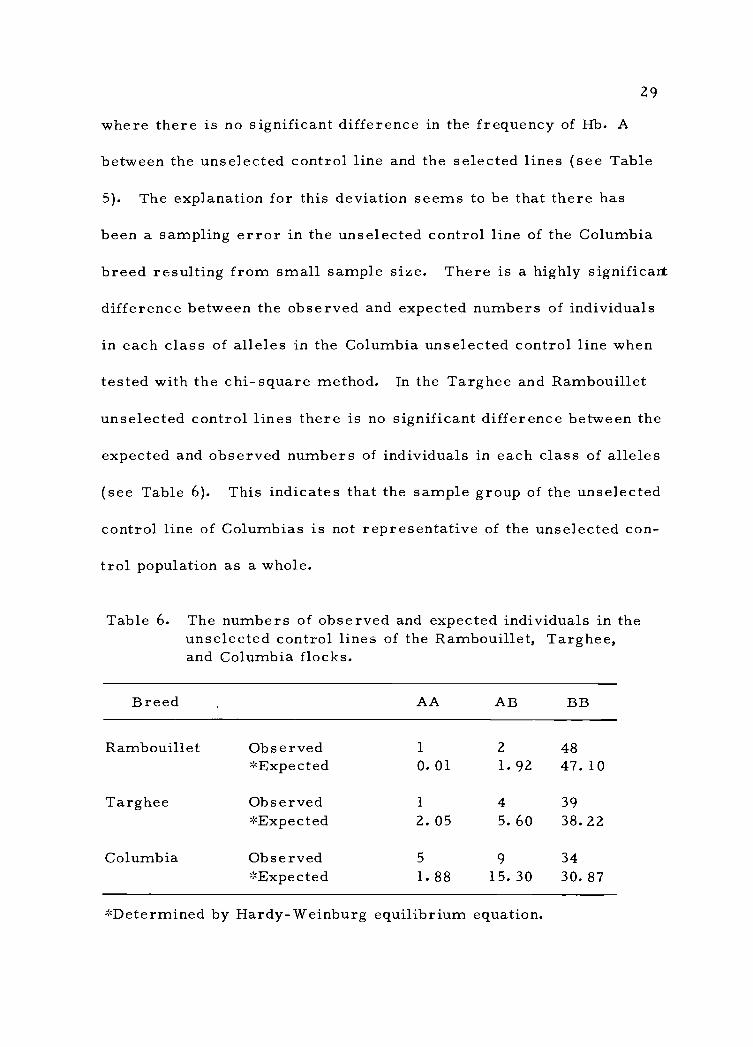
5). The explanation for this deviation seems to be that there has
been a sampling error in the unselected control line of the Columbia
breed resulting from small sample size. There is a highly significant
difference between the observed and expected numbers of individuals
in each class of alleles in the Columbia unselected control line when
tested with the chi-square method. In the Targhee and Rambouillet
unselected control lines there is no significant difference between the
expected and observed numbers of individuals in each class of alleles
(see Table 6). This indicates that the sample group of the unselected
control line of Columbias is not representative of the unselected con-
trol population as a whole.
Table 6. The numbers of observed and expected individuals in theunselected control lines of the Rambouillet, Targhee,and Columbia flocks.
Breed AA AB BB
Rambouillet Observed 1 2 48*Expected 0.01 1.92 47.10
Targhee Observed 1 4 39*Expected 2.05 5.60 38.22
Columbia Observed 5 9 34*Expected 1.88 15.30 30.87
*Determined by Hardy-Weinburg equilibrium equation.
30
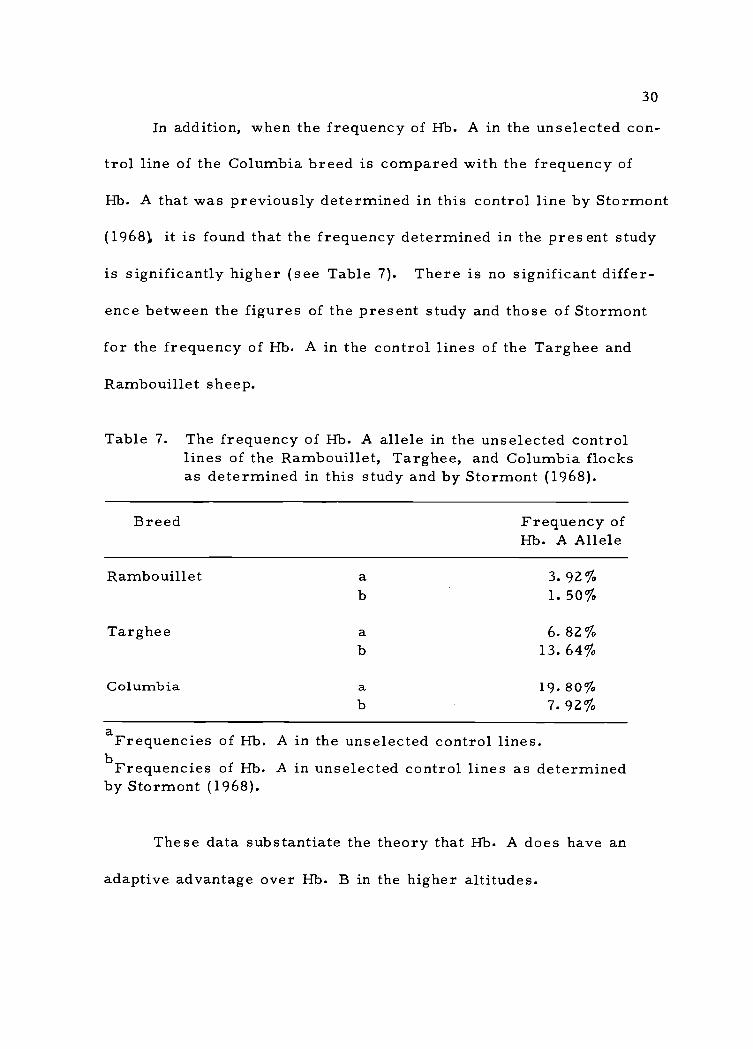
In addition, when the frequency of Hb. A in the unselected con-
trol line of the Columbia breed is compared with the frequency of
Hb. A that was previously determined in this control line by Stormont
(1968), it is found that the frequency determined in the present study
is significantly higher (see Table 7). There is no significant differ-
ence between the figures of the present study and those of Stormont
for the frequency of Hb. A in the control lines of the Targhee and
Rambouillet sheep.
Table 7. The frequency of Hb. A allele in the unselected controllines of the Rambouillet, Targhee, and Columbia flocksas determined in this study and by Stormont (1968).
Breed Frequency ofHb. A Allele
Rambouillet a 3. 92%b 1. 50%
Targhee a 6. 82%b 13. 64%
Columbia a 19. 80%b 7.92%
aFrequencies of Hb. A in the unselected control lines.bFrequencies of Hb. A in unselected control lines as determinedby Stormont (1968).
These data substantiate the theory that Hb. A does have an
adaptive advantage over Hb. B in the higher altitudes.
31
Inbreeding
It is expected that inbreeding an unselected population would
increase homozygosity in a linear order, i. e. as the calculated co-
efficient of inbreeding increases one unit, the percent homozygosity
should increase one unit. The hemoglobin locus provides an oppor-
tunity to examine the response of an uncomplicated two allele genetic
system to inbreeding. The Columbia, Targhee, and Rambouillet
breeds provide the opportunity to examine the homozygosity at
different levels of inbreeding by investigating the four inbred lines in
the diallel system in each breed. In this portion of the study the four
inbred lines in each breed and the three breeds were all combined in
order to provide meaningful numbers of individuals in each class of
inbreeding percentage.
In these data, it is observed that an increase of inbreeding does
increase the percent homozygosity regularly (see Figure 1). It is
surprising that the response in the increase of homozygosity is as
rapid as it apparently is at such relatively low levels of inbreeding.
The class with the highest level of inbreeding may represent a sam-
pling error since there are only ten animals in that class; however,
it may represent a leveling off of the increase in homozygosity. The
leveling off of an increase in homozygosity is what is expected with
higher levels of inbreeding because the higher inbreeding might be

32
100
90
80
70
-4-J,--1
(1) 60otoNo 50E0
40ct
30
20
10
0
273842 1015b
16-20 21-25 26-30 31-35 36-40
% Inbreeding
Figure 2. The response of increase in homozygosity toincreased inbreeding.
a%homozygosity is calculated by dividing the number of homo-
zygous individuals (AA and BB) by the total number of individualsin each class of inbreeding.
b Total number of individuals in each class of inbreeding.

33
expected to depress vigor and productivity of the animals. This
depression of vigor is believed to be the result of the increase in
homozygosity which accompanies increased inbreeding, creating a
situation where the heterozygous individuals have a selective advan-
tage; consequently homozygosity would not increase proportionally to
the calculated coefficient of inbreeding. This may be what is occur-
ring in the class of 36-40% inbreeding, i. e. the lower percentage of
homozygosity may be indicating that the percentage homozygosity is
lower than the calculated coefficient of inbreeding as a result of
selecting for the heterozygous state.
The hemoglobin locus does not give a fair estimate of the
amount of homozygosity in the entire genotype but it may be a reason-
able monitor of the entire genotype.
Hemoglobin Types and Production Traits
The association of the hemoglobin alleles (AA, AB, or BB)
with several production traits was examined in the Columbia, Ta.rglw,
and Rambouillet breeds. In the analysis all three breeds were com-
bined to provide greater numbers. The mean values of the following
production traits were determined for each of the hemoglobin alleles:
(1) average daily gain from weaning to yearling age, (2) conformation
at weaning, (3) condition at weaning, (4) weaning weight, (5) average
daily gain from weaning to yearling age, (6) conformation at yearling
34
age, (7) condition at yearling age, (8) grease fleece weight as year-
ling, (9) yearling fleece grade, (10) yearling body weight, (11)
yearling index score, and (12) weaning index score. The effects of
sex, breed, year of birth, age of dam, and type of birth (twin or
single) were removed by the Least Squares method of analysis, and
the adjusted means of the production traits were tested for signifi-
cant differences between class of alleles by F ratio values (see Table
8 and Table 9).
It was observed from the mean square values in Table 8 and
Table 9 that none of the hemoglobin alleles serves as a genetic mar-
ker for the production traits which were examined. It was also obser-
ved from Table 8 and Table 9 that the effects of sex, breed, year of
birth, age of dam, and type of birth influenced the production traits
examined in this study.
The fact that one of the hemoglobin phenotypes does not serve
as a genetic marker for at least one of the production traits is sur-
prising since there has been an increase in the frequency of Hb. A in
the selected populations (see Table 5). There are at least two expla-
nations that are plausible for Hb. A not being associated significantly
with any of the production traits examined. First, it can be observed
from Table 10 that in most of the mean values of the production traits
examined the heterozygous sheep for the Hb. alleles have a tendency
to have higher values than either of the homozygous classes, although
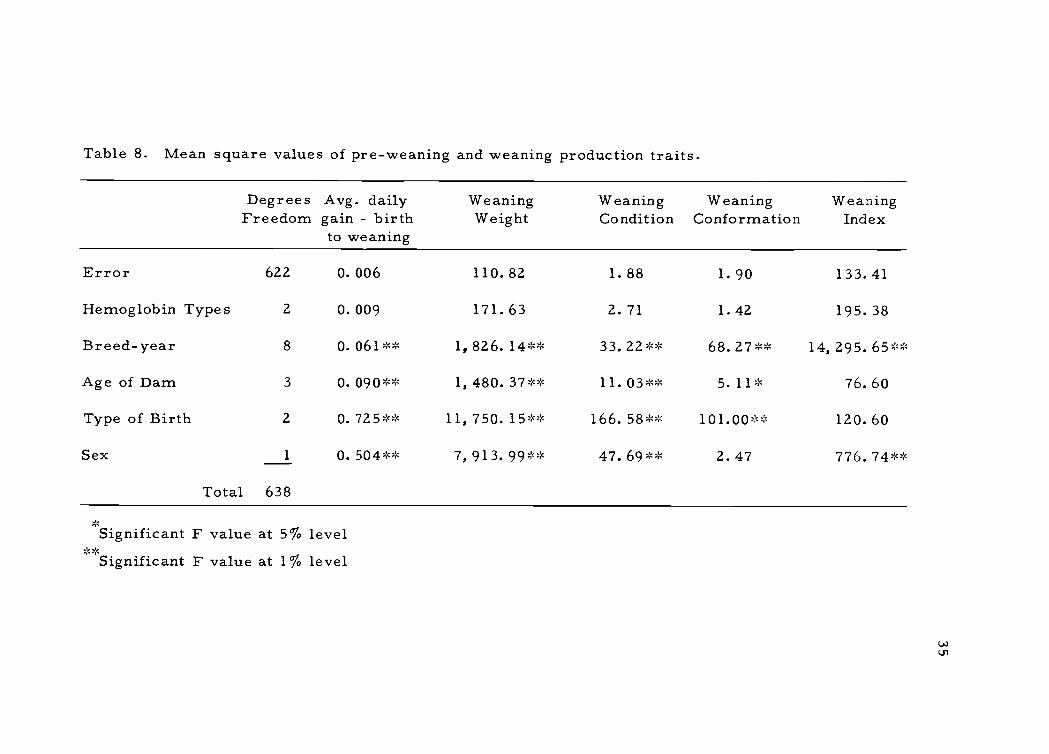
Table 8. Mean square values of pre-weaning and weaning production traits.
Degrees Avg. dailyFreedom gain - birth
to weaning
WeaningWeight
WeaningCondition
WeaningConformation
WeaningIndex
Error 622 0.006 110.82 1.88 1.90 133.41
Hemoglobin Types 2 0.009 171.63 2.71 1.42 195.38
Breed-year 8 0.061** 1,826.14** 33.22** 68.27** 14,295.65**
Age of Dam 3 0. 090** 1,480.37** 11. 03 ** 5. 11* 76.60
Type of Birth 2 0.725** 11, 750. 15 ** 166. 58 ** 101.00** 120.60
Sex 1 0.504** 7,913.99** 47.69** 2.47 776. 74*
Total 638
Significant F value at 5% levelSignificant F value at 1% level
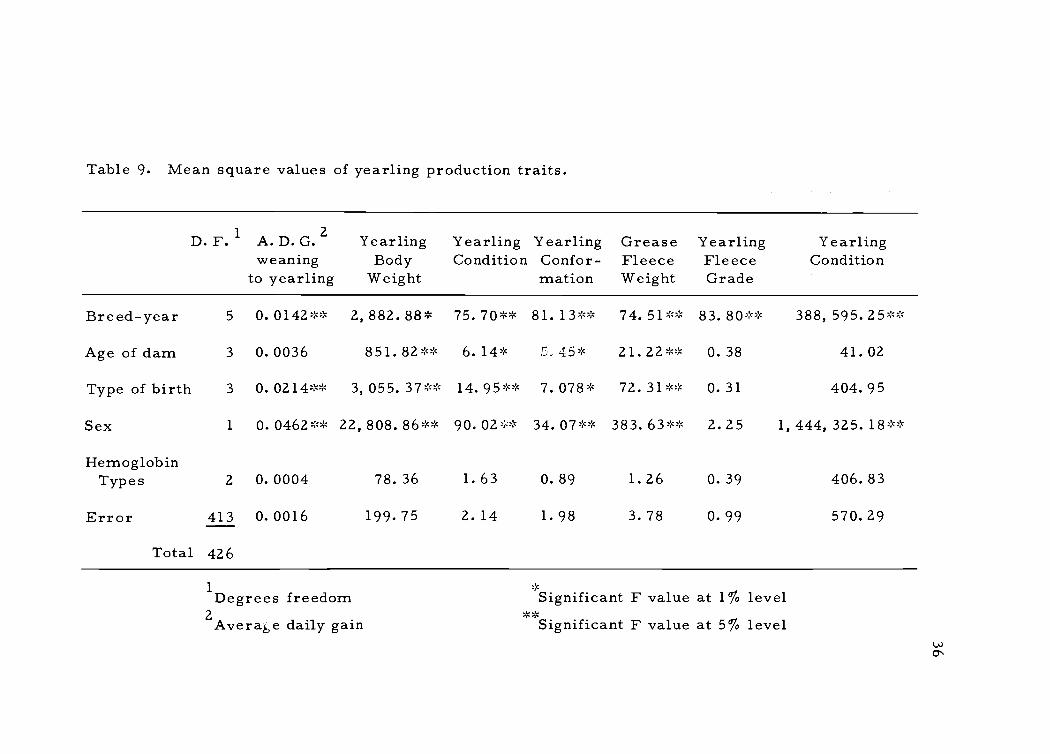
Table 9. Mean square values of yearling production traits.
D. F. 1 2A. D. G.weaning
to yearling
YearlingBody
Weight
YearlingCondition
YearlingConfor-mation
GreaseFleeceWeight
YearlingFleeceGrade
YearlingCondition
Breed-year 5 0. 0142 ** 2,882.88* 75. 70 ** 81. 13 ** 74.51** 83.80** 388,595.25**
Age of dam 3 0.0036 851.82** 6.14* .r: 45* 21.22** 0.38 41.02
Type of birth 3 0. 0214 ** 3,055.37** 14.95** 7.078* 72.31** 0.31 404.95
Sex 1 0.0462** 22,808.86** 90.02** 34. 07 ** 383.63** 2.25 1,444,325.18**
HemoglobinTypes 2 0.0004 78.36 1.63 0.89 1.26 0.39 406.83
Error 413 0.0016 199.75 2.14 1.98 3.78 0.99 570.29
Total 426
1 Degrees freedom2 Avera4,e daily gain
Significant F value at 1% levelSignificant F value at 5% level

37
Table 10. Least-square means for production traits examined ineach class of hemoglobin alleles.
AA AB BB
Avg. daily gainbirth to weaning 0.53 lbs. 0.55 lbs. 0.54 lbs.
Weaning Weight 72.47 lbs. 75.72 lbs. 74.31 lbs.
Weaning Condition 8.12 7.72 .7.90
Weaning Conformation 8. 65 8. 35 8. 48
Weaning Index 140.98 144.55 143.20
Yearling Body Weight 100.97 103.59 102.69
Avg. Daily Gainweaning to yearling 0.10 lbs. 0.10 lbs. 0.10 lbs.
Yearling Condition 7.92 8.15 8.01
Yearling Type S. 39 8.42 8.36
Yearling GreaseFleece Weight 10.56 10. 90 10. 76
Yearling Fleece Grade 3.46 3.34 3. 41
Yearling Index 219.78 223.48 222.91
38
not significantly higher. This may result in the favoring of hetero-
zygous individuals when selection is practiced. This would mean that
the hemoglobin alleles serve as a monitor for the rest of the genotype
but are neutral otherwise and do not furnish the animal any adaptive
value. In this instance if the heterozygous individuals are favored in
selection and the hemoglobin alleles are also in the heterozygous
state, then the increase in frequency of hemoglobin A may be explained.
Second, the hemoglobin alleles may be directly influencing some
other trait such as more lambs being produced by sheep possessing
Hb. A; or the sheep that possess Hb. A may have longer production
life spans which would result in sheep that possess Hb. A remaining
in the population longer and thereby cause an increase in the frequency
of Hb. A. No information could be obtained from the data to deter-
mine if either one of these explanations are feasible.
39
SUMMARY AND CONCLUSIONS
The examination of five breeds of sheep (Columbia, Targhee,
Rambouillet, Lincoln, and Suffolk) for hemoglobin polymorphism by
disc gel electrophoresis revealed that in the individuals sampled
there exist two hemoglobin types--Hb. A and Hb. B. These two
hemoglobin types were observed in the homozygous and heterozygous
state and the alleles were found to segregate freely from one another.
The hemoglobin alleles were found to be co-dominant.
It was observed that the frequency of Hb. A was influenced by
the altitude at which the sheep were maintained. The Columbias,
Targhees, and Rambouillets were maintained at altitudes of 4, 800 to
7, 500 feet above sea level; the Lincolns were maintained at altitudes
of 750 to 1, 200 feet above sea level; and the Suffolks were maintained
at 250 feet above sea level. The four breeds maintained at the rela-
tively high altitudes had frequencies of Hb. A of 16% or greater while
the Suffolks maintained at the relatively low altitude had a frequency
of 5.26%. This is one indication that Hb. A has an adaptive advantage
over Hb. B at high altitudes.
The discovery that the frequency of Hb. A is approximately the
same in the Lincoln flock and the Columbia, Targhee, and Rambouillet
flocks although the latter are maintained at much higher altitudes
could be explained in several ways: (1) The Lincoln flock could

40
possibly be an example of genetic drift, (2) the small sample size of
the Lincoln flock could have resulted in a sampling error, (3) it is
possible that the altitude alone does not fully indicate the extreme
environment in which these sheep are maintained, and (4) it is possi-
ble that there is some reason for Hb. A not being in as high a fre-
quency as it would in natural conditions at the Dubois station. The
possibility of the Lincoln flock being maintained in a more rigorous
environment than indicated by altitude alone seems to be the most
plausible explanation for the above results.
In addition, the increase of the frequency of Hb. A in the selec-
ted populations of the Rambouillet and Targhee breeds over the fre-
quency of Hb. A in the unselected control populations of these two
breeds seems to indicate that Hb. A has increased where selection is
practiced. It would seem from these data that Hb. A has an adaptive
advantage in the higher altitudes and has increased by selection, but
in the unselected control population where the adaptive advantage of
Hb. A would be neutral, it has remained low.
It was discovered that an increase in homozygosity, at least in
the hemoglobin locus, was produced by increasing the inbreeding.
The increase in homozygosity was approximately in a straight line
with an increase in inbreeding until inbreeding reached a level of 35%
after which there was a drop in the homozygosity at the hemoglobin
locus. This drop in homozygosity could be explained by a sampling
41
error since there were only ten animals in the 36-40% level of in-
breeding or it could represent a favoring of the heterozygous indivi-
duals due to inbreeding depression.
The mean values of the following production traits adjusted for
sex, breed, year of birth, age of dam, and type of birth were com-
pared to determine if significant differences in production traits were
associated with allelic differences at the hemoglobin locus (Hb. AA,
AB, and BB): (1) average daily gain from birth to weaning, (2)
weaning weight, (3) weaning condition, (4) weaning conformation, (5)
weaning index, (6) average daily gain from weaning to yearling, (7)
yearling condition, (8) yearling conformation, (9) yearling body
weight, (10) yearling grease fleece weight, (11) yearling fleece grade,
and (12) yearling trait. There were no significant differences between
the adjusted mean values of the production traits associated with class
of alleles, however, there was a tendency for the animals hetero-
zygous at the hemoglobin locus to have higher mean production values.
This could possibly explain the increase in the frequency of Hb. A in
selected populations, i. e. the hemoglobin locus may be an indicator
of the heterozygosity for the rest of the genotype. Thus, the indivi-
duals heterozygous for the hemoglobin locus would be favored in
selection, and an increase in the frequency of Hb. A would result.
Other possibilities which would explain the increase in frequency of
Hb. A in the selected lines is that Hb. A could endow those sheep that

42
possess it with a longer production life span so that they are less
likely to be replaced; or those sheep that possess Hb. A might pro-
duce more lambs which would make more individuals which possess
Hb. A available for selection as replacements. The information to
support these possibilities is not available in the present study.

43
BIBLIOGRAPHY
Beale, D., H. Lehmann, A. Drury and E. Tucker. 1966. Hemo-globins of sheep. Nature 209:1099-1102.
Blunt, M. H. and J. V. Evans. 1963. Changes in the concentrationof potassium in the erythrocytes and in haemoglobin type inMerino sheep under severe anaemic stress. Nature 200 :1215 -1216.
Boyer, S. H., P. Hathaway, F. Pascasio, C. Orton, J. Bordley andM. A. Naughton. 1966. Hemoglobins in sheep: Multipledifferences in amino acid sequences of three beta-chains andpossible origins. Science 153:1539-1543.
Braend, M., G. D. Efremov and 0. He lle. 1964. Abnormal hemo-globin in sheep. Nature 204:700-701.
Braend, M. and G. D. Efremov. 1965. Hemoglobin N of sheep.Nature 205:186-189.
Davis, B. J. 1964. Disc electrophoresis-II: Method and applicationto human serum proteins. Annals of the New York Academy ofSciences 121:404-427.
Dawson, T. J. and J. V. Evans. 1966. Effect of hypoxia on oxygentransport in sheep with different hemoglobin types. The Ameri-can Journal of Physiology 210:1021-1025.
Duesberg, P. H. and R. R. Rueckert. 1965. Preparative zone elec-trophoresis of proteins on polyacrylamide gels in 8 M urea.Analytical Biochemistry 11:342-361.
Efremov, G. D. and M. Braend. 1965. Differences in cattle globins.Biochemical Journal 97:867-869.
1966. Hemoglobin N of sheep. Age, breed, andseasonal distribution. Animal Production 8:161-169.
Evans, J. V. and M. H. Blunt. 1961. Variation in the gene fre-quencies of potassium and hemoglobin types in Romney Marshand Southdown sheep established away from their native environ-ment. Australian Journal of Biological Sciences 14:100-106.
Evans, J. V., H. Harris and F. L. Warren. 1957. Haemoglobintypes in British breeds of sheep. Proceedings of the Bio-chemical Society. Biochemical Journal 65:42P.
44
1958a. Haemoglobin and potassium blood types insome non-British breeds of sheep and in certain rare Britishbreeds. Nature 182:320-321.
1958b. The distribution of haemoglobin and bloodpotassium types in British breeds of sheep. Royal Society ofLondon, Proceedings - Biological Sciences, Series B 149:249-254.
Evans, J. V., J. W. B. King, B. L. Cohen, H. Harris and F. L.Warren. 1956. Genetics of haemoglobin and blood potassiumdifferences in sheep. Nature 178:849-851.
Evans, J. V. and H. N. Turner. 1965. Haemoglobin type and repro-ductive performance in Australian Merino sheep. Nature 207:1396-1397.
Harris, H. and F. L. Warren. 1955. Occurrence of electrophoreti-cally distinct haemoglobins in ruminants. Proceedings of theBiochemical Society. Biochemical Journal 60:xxix.
Huisman, T. H. J., G. van Vliet and T. Sebens. 1958. Sheep hae-moglobins. Nature 182:171-173.
Huisman, T. H. J., C. A. Reynolds, A. M. Dozy and J. B. Wilson.1965. The structure of sheep haemoglobin. Journal of Biolo-gical Chemistry 240:2455-2461.
King, J. W. B., J. V. Evans, H. Harris and F. L. Warren. 1958.The performance of sheep with differing haemoglobins andpotassium blood types. Journal of Agriculture Science 51 :342-348.
Lehman, H. and R. G. Huntsman. 1966. Man's hemoglobins. Philadelphia, J. B. Lippincott. 400 p.
Ornstein, L. 1964. Disc electrophoresis. I. Background and theory.Annals of the New York Academy of Sciences 121:321-349.

45
Parker, B. A., D. F. Weseli and T. C. Cartwright. 1967. Rela-tionship of hemoglobin types to production traits in beef cattle.Paper read before the 59th Annual Meeting of the AmericanSociety of Animal Science, Reno, Nevada, July 31.
Pau ling, L., H. W. Itano, S. J. Singer and I. C. Wells. 1949.Sickle cell anemia, a molecular disease. Science 110:543-555.
Stansfield, W. D., G. E. Bradford, C. Stormont and R. L. Black-well. 1964. Blood groups and their associations with produc-tion and reproduction in sheep. Genetics 50:1357-1367.
Stormont, Clyde. 1968. Professor, University of California,Department of Veterinarian Microbiology. Personal communi-cation. Davis, California. May 14.
van Vliet, G. and T. H. J. Huisman. 1964. Changes in the hemo-globin types of sheep as a response to anemia. BiochemicalJournal 93:401-410.