genetic polymorphism study at 15 autosomal locus in
TRANSCRIPT
Shrivastava et al. SpringerPlus (2015) 4:566 DOI 10.1186/s40064-015-1364-1
DATABASE
Genetic polymorphism study at 15 autosomal locus in central Indian populationPankaj Shrivastava*, Toshi Jain and Veena Ben Trivedi
Abstract
The analysis of 15 autosomal STR locus (TH01, D3S1358, vWA, D21S11, TPOX, D7S820, D19S433, D5S818, D2S1338, D16S539, CSF1PO, D13S317, FGA, D18S51, D8S1179) was done in 582 healthy unrelated individuals (Male-366, Female-216) originating from the various geographical regions of Madhya Pradesh, India. All locus fall under Hardy–Weinberg equilibrium except TPOX. These STR loci were highly informative and discriminating with combined power of discrimination (CPD) >0.99999. Locus wise allele frequencies of the studied population were compared with the other published populations. Also the Clustering pattern and genetic distance of studied populations is compared and presented with various populations. The studied population showed the genetic proximity with geographically close populations of India and significant genetic variation with distant populations which is also evident by cluster-ing pattern of the NJ tree and the PCA plot.
Keywords: DNA typing, Autosomal STR, Central India, Population data, Forensic
© 2015 Shrivastava et al. This article is distributed under the terms of the Creative Commons Attribution 4.0 International License (http://creativecommons.org/licenses/by/4.0/), which permits unrestricted use, distribution, and reproduction in any medium, provided you give appropriate credit to the original author(s) and the source, provide a link to the Creative Commons license, and indicate if changes were made.
BackgroundAfter almost 30 years since the first formal application of DNA technology (Jeffreys et al. 1985), short tandem repeats (STR’s) based DNA analysis (Edwards et al. 1992) was accepted as a core method in forensics, it is still being routinely used in cases of simple paternity test-ing (Zupanic Pajnic et al. 2001), identification of human remains testing (Zupanic Pajnic et al. 2010) and in com-plicated criminal casework analysis, including rape and mass rape. STR’s form approximately 3 % of the total human genome and on an average are present once in every 10,000 nucleotides (Butler 2005). Due to ease of use due to multiplexing, these markers are routinely used in forensic, anthropological and medical studies. With the growing number of laboratories using STR analysis tech-nology, more and more population STR data have been reported (Tandon et al. 2002; Sarkar and Kashyap 2002; Sahoo and Kashyap 2002; Gaikwad and Kashyap 2002; Rajkumar and Kashyap 2004; Narkuti et al. 2008; Dubey et al. 2009; Ghosh et al. 2011; Chaudhari and Dahiya 2014; Giroti and Talwar 2010; Shrivastava et al. 2015a; b).
India is the largest secular country with a polygenetic population. Various known religions are found in India and the Indian population belongs to various linguis-tic and ethnic groups of different castes and tribes and it is said to be the melting pot of various ethnic groups (Eaaswarkhanth et al. 2009). Human diversity in India is defined by 4693 differently documented population groups that include 2205 major communities, 589 seg-ments and 1900 territorial units spread across the coun-try (Singh 1998). Major population migrations, social structure and caste endogamy has influenced the genetic structure of Indian populations.
Madhya Pradesh, a state in Central India is the second largest state in the country by area. Population of Madhya Pradesh is 72,597,565 comprising 37,612,920 males and 34,984,645 females, contributing 6 percent to India’s total population (Census of India 2011). With these rationales 15 highly polymorphic autosomal microsatellite markers including 13 core forensic loci, have been analyzed and the distribution of alleles across various populations is compared with the previously published data on the same markers from different parts of India (caste specific avail-able data) and other area specific reported data only one from India and rest from other parts of world, in order to decipher genetic delineation amongst the populations
Open Access
*Correspondence: [email protected] DNA Fingerprinting Unit, State Forensic Science Laboratory, Department of Home (Police), Govt. of MP, Sagar 470001, India
Page 2 of 12Shrivastava et al. SpringerPlus (2015) 4:566
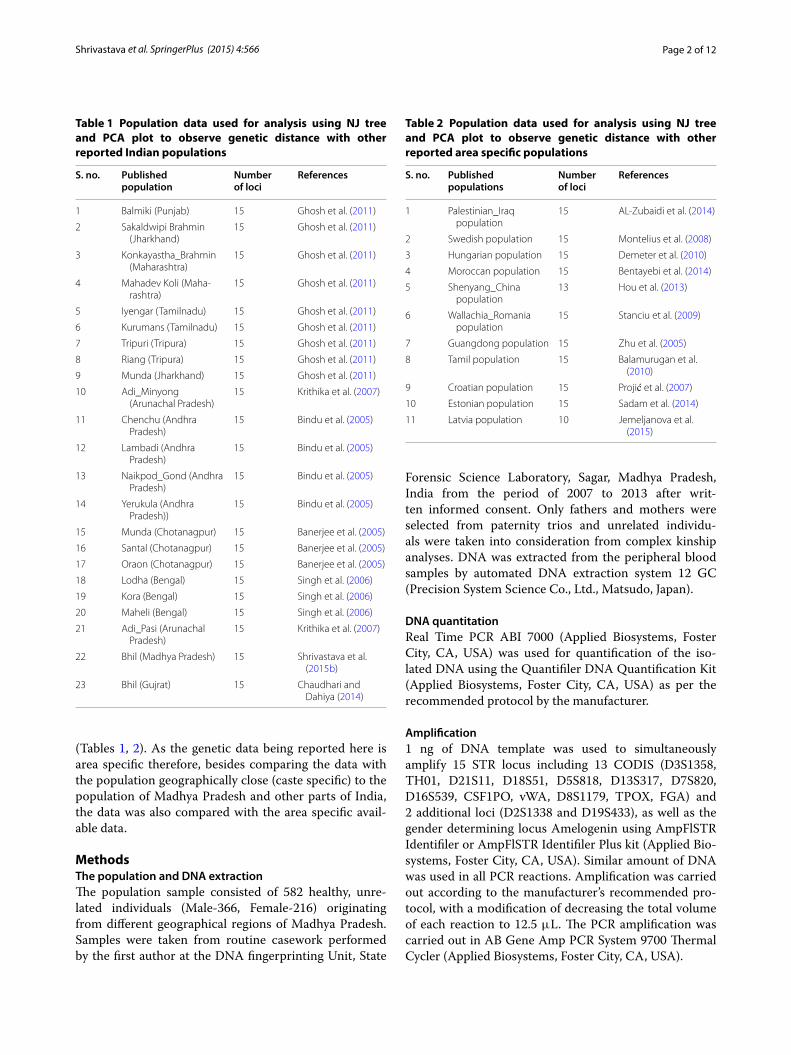
(Tables 1, 2). As the genetic data being reported here is area specific therefore, besides comparing the data with the population geographically close (caste specific) to the population of Madhya Pradesh and other parts of India, the data was also compared with the area specific avail-able data.
MethodsThe population and DNA extractionThe population sample consisted of 582 healthy, unre-lated individuals (Male-366, Female-216) originating from different geographical regions of Madhya Pradesh. Samples were taken from routine casework performed by the first author at the DNA fingerprinting Unit, State
Forensic Science Laboratory, Sagar, Madhya Pradesh, India from the period of 2007 to 2013 after writ-ten informed consent. Only fathers and mothers were selected from paternity trios and unrelated individu-als were taken into consideration from complex kinship analyses. DNA was extracted from the peripheral blood samples by automated DNA extraction system 12 GC (Precision System Science Co., Ltd., Matsudo, Japan).
DNA quantitationReal Time PCR ABI 7000 (Applied Biosystems, Foster City, CA, USA) was used for quantification of the iso-lated DNA using the Quantifiler DNA Quantification Kit (Applied Biosystems, Foster City, CA, USA) as per the recommended protocol by the manufacturer.
Amplification1 ng of DNA template was used to simultaneously amplify 15 STR locus including 13 CODIS (D3S1358, TH01, D21S11, D18S51, D5S818, D13S317, D7S820, D16S539, CSF1PO, vWA, D8S1179, TPOX, FGA) and 2 additional loci (D2S1338 and D19S433), as well as the gender determining locus Amelogenin using AmpFlSTR Identifiler or AmpFlSTR Identifiler Plus kit (Applied Bio-systems, Foster City, CA, USA). Similar amount of DNA was used in all PCR reactions. Amplification was carried out according to the manufacturer’s recommended pro-tocol, with a modification of decreasing the total volume of each reaction to 12.5 μL. The PCR amplification was carried out in AB Gene Amp PCR System 9700 Thermal Cycler (Applied Biosystems, Foster City, CA, USA).
Table 1 Population data used for analysis using NJ tree and PCA plot to observe genetic distance with other reported Indian populations
S. no. Published population
Number of loci
References
1 Balmiki (Punjab) 15 Ghosh et al. (2011)
2 Sakaldwipi Brahmin (Jharkhand)
15 Ghosh et al. (2011)
3 Konkayastha_Brahmin (Maharashtra)
15 Ghosh et al. (2011)
4 Mahadev Koli (Maha-rashtra)
15 Ghosh et al. (2011)
5 Iyengar (Tamilnadu) 15 Ghosh et al. (2011)
6 Kurumans (Tamilnadu) 15 Ghosh et al. (2011)
7 Tripuri (Tripura) 15 Ghosh et al. (2011)
8 Riang (Tripura) 15 Ghosh et al. (2011)
9 Munda (Jharkhand) 15 Ghosh et al. (2011)
10 Adi_Minyong (Arunachal Pradesh)
15 Krithika et al. (2007)
11 Chenchu (Andhra Pradesh)
15 Bindu et al. (2005)
12 Lambadi (Andhra Pradesh)
15 Bindu et al. (2005)
13 Naikpod_Gond (Andhra Pradesh)
15 Bindu et al. (2005)
14 Yerukula (Andhra Pradesh))
15 Bindu et al. (2005)
15 Munda (Chotanagpur) 15 Banerjee et al. (2005)
16 Santal (Chotanagpur) 15 Banerjee et al. (2005)
17 Oraon (Chotanagpur) 15 Banerjee et al. (2005)
18 Lodha (Bengal) 15 Singh et al. (2006)
19 Kora (Bengal) 15 Singh et al. (2006)
20 Maheli (Bengal) 15 Singh et al. (2006)
21 Adi_Pasi (Arunachal Pradesh)
15 Krithika et al. (2007)
22 Bhil (Madhya Pradesh) 15 Shrivastava et al. (2015b)
23 Bhil (Gujrat) 15 Chaudhari and Dahiya (2014)
Table 2 Population data used for analysis using NJ tree and PCA plot to observe genetic distance with other reported area specific populations
S. no. Published populations
Number of loci
References
1 Palestinian_Iraq population
15 AL-Zubaidi et al. (2014)
2 Swedish population 15 Montelius et al. (2008)
3 Hungarian population 15 Demeter et al. (2010)
4 Moroccan population 15 Bentayebi et al. (2014)
5 Shenyang_China population
13 Hou et al. (2013)
6 Wallachia_Romania population
15 Stanciu et al. (2009)
7 Guangdong population 15 Zhu et al. (2005)
8 Tamil population 15 Balamurugan et al. (2010)
9 Croatian population 15 Projić et al. (2007)
10 Estonian population 15 Sadam et al. (2014)
11 Latvia population 10 Jemeljanova et al. (2015)

Page 3 of 12Shrivastava et al. SpringerPlus (2015) 4:566
Tabl
e 3
Obs
erve
d al
lele
freq
uenc
y an
d fo
rens
ic p
aram
eter
s fo
r 15
auto
som
al lo
ci in
cen
tral
Indi
an p
opul
atio
n (N
= 5
82)
Alle
le/n
D8S
1179
D21
S11
D7S
820
CSF1
POD
3S13
58TH
O1
D13
S317
D16
S539
D2S
1338
D19
S433
VWA
TPO
XD
18S5
1D
5S81
8FG
A
60.
282
70.
021
0.00
30.
154
0.00
3
80.
005
0.23
40.
005
0.12
70.
220
0.08
50.
352
0.00
1
90.
007
0.06
70.
030
0.29
30.
107
0.14
90.
001
0.14
50.
001
0.02
3
9.3
0.13
8
100.
168
0.23
20.
193
0.00
60.
090
0.09
30.
003
0.09
50.
003
0.12
4
110.
072
0.24
70.
294
0.25
30.
315
0.00
40.
375
0.02
70.
337
11.2
0.00
2
120.
109
0.17
00.
381
0.00
10.
246
0.22
70.
074
0.02
70.
068
0.31
4
12.2
0.00
40.
005
130.
166
0.02
80.
079
0.00
20.
070
0.11
40.
290
0.00
30.
129
0.18
6
13.2
0.01
7
140.
199
0.00
10.
013
0.04
50.
015
0.01
40.
245
0.10
80.
280
0.01
1
14.2
0.06
0
150.
176
0.00
10.
306
0.00
30.
136
0.09
50.
169
15.2
0.08
70.
002
160.
084
0.30
20.
008
0.04
80.
224
0.14
4
16.2
0.02
10.
001
170.
013
0.24
10.
067
0.00
90.
258
0.07
6
17.2
0.00
20.
001
180.
001
0.09
70.
158
0.20
40.
040
0.00
7
18.2
0.00
1
190.
008
0.14
40.
092
0.03
30.
049
200.
131
0.01
30.
015
0.10
7
20.2
0.00
5
210.
053
0.00
10.
008
0.14
3
21.2
0.00
4
220.
069
0.00
40.
152
22.2
0.01
2
230.
168
0.00
10.
183
23.2
0.00
9
240.
099
0.00
10.
156
24.2
0.00
6
250.
090
0.12
1

Page 4 of 12Shrivastava et al. SpringerPlus (2015) 4:566
Pm m
atch
ing
prob
abili
ty, P
D p
ower
of d
iscr
imin
atio
n, P
IC p
olym
orph
ism
info
rmat
ion
cont
ent,
PE p
ower
of e
xclu
sion
, PI p
ater
nity
inde
x, H
obs o
bser
ved
hete
rozy
gosi
ty, H
exp e
xpec
ted
hete
rozy
gosi
ty, P
val
ue H
WE
test
Tabl
e 3
cont
inue
d
Alle
le/n
D8S
1179
D21
S11
D7S
820
CSF1
POD
3S13
58TH
O1
D13
S317
D16
S539
D2S
1338
D19
S433
VWA
TPO
XD
18S5
1D
5S81
8FG
A
25.2
0.00
1
260.
010
0.03
0
270.
008
0.00
30.
015
280.
143
290.
209
29.2
0.00
4
300.
187
30.2
0.02
7
310.
045
31.2
0.12
5
320.
008
32.2
0.18
2
33.2
0.04
8
34.2
0.01
2
350.
001
35.2
0.00
2
P m0.
043
0.04
10.
069
0.12
10.
108
0.08
40.
068
0.07
00.
028
0.05
60.
063
0.13
90.
046
0.11
20.
034
PD0.
957
0.95
90.
931
0.87
90.
892
0.91
60.
932
0.93
00.
972
0.94
40.
937
0.86
10.
954
0.88
80.
966
PIC
0.83
10.
828
0.76
50.
678
0.70
20.
741
0.77
40.
770
0.86
60.
796
0.78
60.
653
0.82
40.
693
0.85
4
PE0.
699
0.64
90.
517
0.41
90.
505
0.48
20.
566
0.55
90.
709
0.59
10.
623
0.39
10.
672
0.47
90.
709
PI3.
384
2.88
12.
035
1.63
51.
980
1.87
72.
291
2.25
63.
506
2.44
52.
670
1.54
03.
096
1.86
53.
506
Hob
s0.
852
0.82
60.
754
0.69
40.
747
0.73
40.
782
0.77
80.
857
0.79
60.
813
0.67
50.
838
0.73
20.
857
Hex
p0.
850
0.84
80.
797
0.72
50.
747
0.77
60.
804
0.79
80.
879
0.81
90.
813
0.70
50.
842
0.73
80.
869
Pval
ue0.
016
0.48
80.
559
0.04
30.
292
0.01
10.
749
0.03
80.
261
0.07
40.
079
0.00
10.
038
0.32
70.
014
Page 5 of 12Shrivastava et al. SpringerPlus (2015) 4:566
TypingMulticapillary electrophoresis of the amplification prod-ucts was performed on an ABI Prism 3100 Avant Genetic Analyzer (Applied Biosystems, Foster City, CA, USA) using LIZ 500 size standard (Applied Biosystems, Foster City, CA, USA) provided with the kit and the data was analysed using GeneMapper™ 3.5 Software (Applied Biosystems, Foster City, CA, USA). All steps were done according to the Laboratory’s internal control standards
and respective kit controls, according to the IFSH recom-mendations (DNA recommendations 1994).
Quality controlPassed Proficiency testing of the GITAD, Spain http://gitad.ugr.es/principal.htm). Also, laboratory internal con-trol standards and kit controls used.
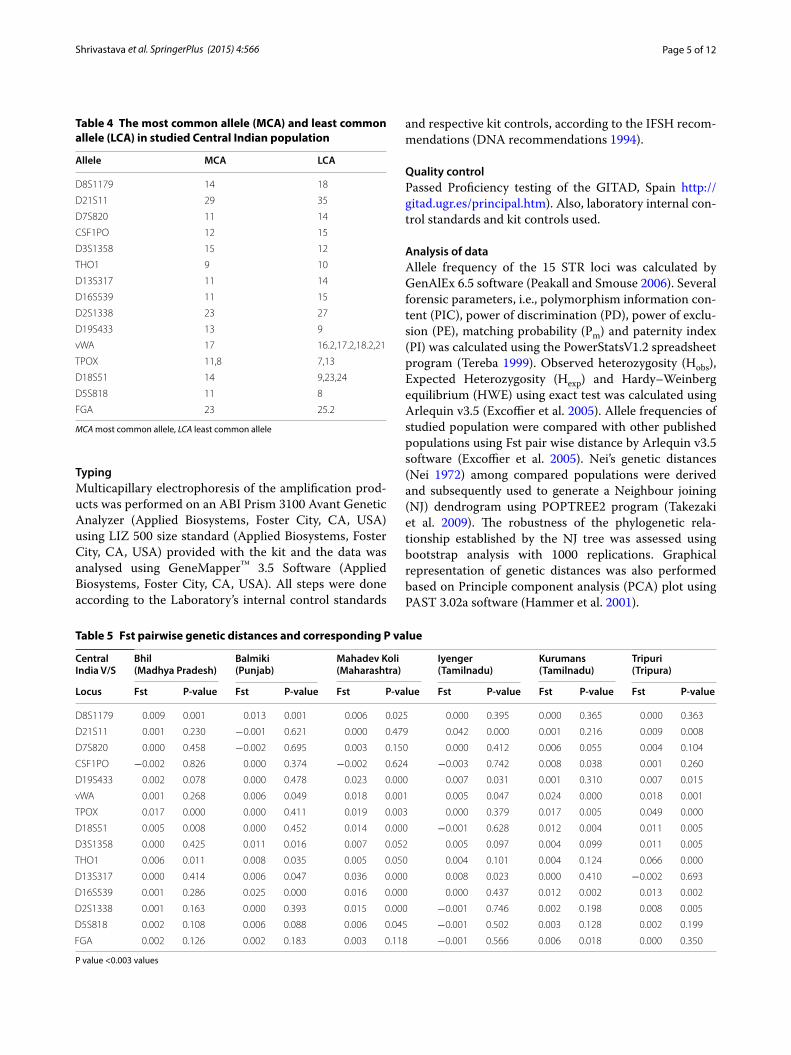
Analysis of dataAllele frequency of the 15 STR loci was calculated by GenAlEx 6.5 software (Peakall and Smouse 2006). Several forensic parameters, i.e., polymorphism information con-tent (PIC), power of discrimination (PD), power of exclu-sion (PE), matching probability (Pm) and paternity index (PI) was calculated using the PowerStatsV1.2 spreadsheet program (Tereba 1999). Observed heterozygosity (Hobs), Expected Heterozygosity (Hexp) and Hardy–Weinberg equilibrium (HWE) using exact test was calculated using Arlequin v3.5 (Excoffier et al. 2005). Allele frequencies of studied population were compared with other published populations using Fst pair wise distance by Arlequin v3.5 software (Excoffier et al. 2005). Nei’s genetic distances (Nei 1972) among compared populations were derived and subsequently used to generate a Neighbour joining (NJ) dendrogram using POPTREE2 program (Takezaki et al. 2009). The robustness of the phylogenetic rela-tionship established by the NJ tree was assessed using bootstrap analysis with 1000 replications. Graphical representation of genetic distances was also performed based on Principle component analysis (PCA) plot using PAST 3.02a software (Hammer et al. 2001).
Table 4 The most common allele (MCA) and least common allele (LCA) in studied Central Indian population
MCA most common allele, LCA least common allele
Allele MCA LCA
D8S1179 14 18
D21S11 29 35
D7S820 11 14
CSF1PO 12 15
D3S1358 15 12
THO1 9 10
D13S317 11 14
D16S539 11 15
D2S1338 23 27
D19S433 13 9
vWA 17 16.2,17.2,18.2,21
TPOX 11,8 7,13
D18S51 14 9,23,24
D5S818 11 8
FGA 23 25.2
Table 5 Fst pairwise genetic distances and corresponding P value
P value <0.003 values
Central India V/S
Bhil (Madhya Pradesh)
Balmiki (Punjab)
Mahadev Koli (Maharashtra)
Iyenger (Tamilnadu)
Kurumans (Tamilnadu)
Tripuri (Tripura)
Locus Fst P-value Fst P-value Fst P-value Fst P-value Fst P-value Fst P-value
D8S1179 0.009 0.001 0.013 0.001 0.006 0.025 0.000 0.395 0.000 0.365 0.000 0.363
D21S11 0.001 0.230 −0.001 0.621 0.000 0.479 0.042 0.000 0.001 0.216 0.009 0.008
D7S820 0.000 0.458 −0.002 0.695 0.003 0.150 0.000 0.412 0.006 0.055 0.004 0.104
CSF1PO −0.002 0.826 0.000 0.374 −0.002 0.624 −0.003 0.742 0.008 0.038 0.001 0.260
D19S433 0.002 0.078 0.000 0.478 0.023 0.000 0.007 0.031 0.001 0.310 0.007 0.015
vWA 0.001 0.268 0.006 0.049 0.018 0.001 0.005 0.047 0.024 0.000 0.018 0.001
TPOX 0.017 0.000 0.000 0.411 0.019 0.003 0.000 0.379 0.017 0.005 0.049 0.000
D18S51 0.005 0.008 0.000 0.452 0.014 0.000 −0.001 0.628 0.012 0.004 0.011 0.005
D3S1358 0.000 0.425 0.011 0.016 0.007 0.052 0.005 0.097 0.004 0.099 0.011 0.005
THO1 0.006 0.011 0.008 0.035 0.005 0.050 0.004 0.101 0.004 0.124 0.066 0.000
D13S317 0.000 0.414 0.006 0.047 0.036 0.000 0.008 0.023 0.000 0.410 −0.002 0.693
D16S539 0.001 0.286 0.025 0.000 0.016 0.000 0.000 0.437 0.012 0.002 0.013 0.002
D2S1338 0.001 0.163 0.000 0.393 0.015 0.000 −0.001 0.746 0.002 0.198 0.008 0.005
D5S818 0.002 0.108 0.006 0.088 0.006 0.045 −0.001 0.502 0.003 0.128 0.002 0.199
FGA 0.002 0.126 0.002 0.183 0.003 0.118 −0.001 0.566 0.006 0.018 0.000 0.350

Page 6 of 12Shrivastava et al. SpringerPlus (2015) 4:566
Results and discussionThe genetic variations in the allele-frequency distribution at 15 STR loci and statistical analysis of forensic param-eters for the studied populations are shown in Table 3. In total, 158 alleles were observed in the central Indian population with corresponding allele frequencies rang-ing from 0.001 to 0.381 (Table 3). In which CSF1PO locus
was found to have a maximum allele frequency with allele 12 (0.381) being the most frequent allele in this popula-tion. Locus wise distribution of the most common and least common allele in studied population is summa-rized and presented in Table 4. The peak high threshold was 50 RFU for heterozygous and 200 RFU for homozy-gous alleles. The combined power of exclusion (CPE) and
Table 6 Fst pairwise genetic distances and corresponding P value
P value <0.003 values
Central India V/S
Riang (Tripura) Munda (Jharkhand) Lambadi (Andhra Pradesh)
Naikpod Gond (Andhra Pradesh)
Yerukula (Andhra Pradesh)
Munda (Chotanagpur)
Locus Fst P-value Fst P-value Fst P-value Fst P-value Fst P-value Fst P-value
D8S1179 0.006 0.030 0.027 0.000 0.004 0.020 0.030 0.000 0.016 0.000 0.013 0.000
D21S11 0.012 0.001 0.009 0.006 0.001 0.157 0.003 0.048 0.015 0.000 0.015 0.000
D7S820 0.007 0.041 0.009 0.009 0.004 0.035 0.000 0.404 0.014 0.000 0.003 0.090
CSF1PO 0.000 0.354 −0.001 0.507 0.001 0.256 0.003 0.104 0.002 0.179 0.003 0.076
D19S433 0.019 0.000 0.005 0.049 0.000 0.292 0.004 0.044 0.014 0.000 0.000 0.414
vWA 0.029 0.000 0.008 0.013 0.001 0.244 0.008 0.002 0.041 0.000 0.012 0.000
TPOX 0.247 0.000 0.005 0.097 0.002 0.184 0.027 0.000 0.000 0.328 0.008 0.007
D18S51 0.010 0.006 0.004 0.072 −0.001 0.630 0.007 0.004 0.006 0.004 0.002 0.074
D3S1358 0.007 0.042 0.005 0.068 0.010 0.007 0.001 0.270 0.031 0.000 0.003 0.073
THO1 0.065 0.000 0.021 0.000 0.000 0.462 0.042 0.000 0.022 0.000 0.030 0.000
D13S317 0.000 0.401 0.018 0.000 0.002 0.159 0.014 0.000 0.030 0.000 0.049 0.000
D16S539 0.029 0.000 0.001 0.259 0.004 0.029 0.003 0.057 0.005 0.036 0.001 0.195
D2S1338 0.003 0.079 0.004 0.042 0.001 0.163 0.009 0.000 0.024 0.000 0.009 0.000
D5S818 0.035 0.000 0.001 0.288 −0.001 0.573 0.010 0.002 0.012 0.001 0.009 0.006
FGA 0.007 0.011 0.002 0.176 0.004 0.014 0.010 0.000 0.004 0.025 0.010 0.000
Table 7 Fst pairwise genetic distances and corresponding P value
P value <0.003 values
Central India V/S
Santal (Chotanagpur)
Oraon (Chotanagpur)
Lodha (Bengal)
Kora (Bengal)
Maheli (Bengal)
Adi Pasi (Arunachal Pradesh)
Locus Fst P-value Fst P-value Fst P-value Fst P-value Fst P-value Fst P-value
D8S1179 0.016 0.000 0.008 0.000 0.004 0.002 0.017 0.000 0.026 0.000 0.016 0.000
D21S11 0.004 0.015 0.009 0.001 0.019 0.000 0.014 0.000 0.071 0.000 0.041 0.000
D7S820 0.020 0.000 0.028 0.000 0.017 0.000 0.001 0.208 0.001 0.278 0.021 0.000
CSF1PO 0.005 0.026 0.004 0.069 0.010 0.001 0.040 0.000 −0.003 0.960 0.018 0.002
D19S433 0.005 0.012 0.003 0.067 0.017 0.000 0.012 0.000 0.040 0.000 0.039 0.000
vWA 0.013 0.000 0.009 0.001 0.011 0.000 0.115 0.000 0.010 0.005 0.060 0.000
TPOX 0.002 0.108 0.004 0.074 0.037 0.000 0.024 0.000 0.008 0.016 0.005 0.033
D18S51 0.002 0.115 0.007 0.002 0.020 0.000 0.028 0.000 0.016 0.000 0.069 0.000
D3S1358 0.002 0.121 0.004 0.037 0.050 0.000 0.002 0.167 0.023 0.000 0.006 0.018
THO1 0.010 0.001 0.029 0.000 0.119 0.000 0.064 0.000 0.023 0.000 0.097 0.000
D13S317 0.007 0.007 0.006 0.010 0.035 0.000 0.011 0.001 0.009 0.002 0.005 0.010
D16S539 0.000 0.271 0.005 0.029 0.005 0.002 0.009 0.000 0.008 0.004 0.040 0.000
D2S1338 0.034 0.000 0.006 0.001 0.027 0.000 0.030 0.000 0.015 0.000 0.007 0.001
D5S818 0.000 0.490 0.002 0.117 0.005 0.008 0.003 0.089 0.019 0.000 0.043 0.000
FGA 0.018 0.000 0.012 0.000 0.007 0.000 0.002 0.079 0.018 0.000 0.006 0.003

Page 7 of 12Shrivastava et al. SpringerPlus (2015) 4:566
combined power of discrimination (CPD) for all 15 STR locus were 0.9999 and greater than 0.99999 respectively in studied population. The combined matching probabil-ity was found to be 1.51 × 10¹⁸. Among all the studied locus, no significant deviations from Hardy–Weinberg expectations were observed even after Bonferroni cor-rection (Bland and Altman 1995) except at locus TPOX (p < 0.003). At TPOX locus all the homozygotic peaks were found with a peak height of more than 200 RFU, thus removing the possibility of any heterozygous peak. Allele 11(437 out of 1164) followed by allele 8 (410 out of 1164) were found to be the dominating alleles in this population.
The expected heterozygosity and the power of dis-crimination calculated from allele frequencies obtained from central Indian population revealed that in com-bination, the 15 autosomal STRs have a high forensic efficacy. Locus wise allele frequencies of studied popu-lation were compared at all 15 loci with the other pub-lished Indian populations including geographically close populations viz. Chenchu (Andhra Pradesh), Lambadi (Andhra Pradesh), Yerucula (Andhra Pradesh) and Nai-kpood (Andhra Pradesh) (Bindu et al. 2005), Adimiong (Arunachal Pradesh) and Adipasi (Arunachal Pradesh) (Krithika et al. 2007), Munda (Chotanagpur), Santal (Chotanagpur) and Oraon (Chotanagpur) (Banerjee et al. 2005), Kora (Bengal), Lodha (Bengal) and Maheli (Bengal) (Singh et al. 2006), Bhil (Gujrat) (Chaudhari and Dahiya 2014), Balmiki (Punjab), Sakaldwipi Brah-min (Jharkhand), Munda (Jharkhand), Konkanastha
Brahmin (Maharashtra), Mahadev Koli (Maharashtra), Iyengar (Tamilnadu), Kurumans (Tamilnadu), Tripuri (Tripura) and Riang (Tripura) (Ghosh et al. 2011), Bhil (Madhya Pradesh) (Shrivastava et al. 2015b) popula-tions using Pairwise Fst distance ranging from −0.003 to 0.247 (Tables 5, 6, 7, 8). Central Indian population showed a considerable genetic distance with other pub-lished indian population which were used for comparison (Table 1). Central Indian population showed significant variation at 14 loci with Lodha (Bengal), at 11 loci with Adi pasi population (Arunachal Pradesh) and Kora pop-ulation (Bengal), at 10 loci with Yerukula population (Andhra Pradesh) and Maheli population (Bengal), at 9 loci with Adiminyong population (Arunachal Pradesh), at 8 loci with Naikpod Gond population (Andhra Pradesh) and Oraon population (Chotanagpur), at 7 loci with Riang population (Tripura) and Munda popula-tion (Chotanagpur), at 6 loci with Chencheu population (Andhra Pradesh), Santal population (Chotanagpur) and Mahadev koli population (Maharashtra), at 5 loci with Bhil (Gujrat), at 4 loci with Tripuri population (Tripura), at 3 locus with Munda population (Jharkhand) and Sakaldwipi brahmin population (Jharkhand), at 2 loci with Konkanastha Brahmin population (Maharashtra), Kurumans population (Tamilnadu), Balmiki population (Punjab) and Bhil population (Madhya Pradesh) and at 1 locus with Iyengar (Tamilnadu). Central Indian popula-tion showed no significant variation from Lambadi popu-lation (Andhra Pradesh). Neighbour Joining dendrogram (Figs. 1, 2) based on Nei’s genetic distance (Nei 1972)
Table 8 Fst pairwise genetic distances and corresponding P value
P value <0.003 Values
Central India V/S
Bhil (Gujrat) Sakaldwipi Brahman (Jharkhand)
Konkayastha Brahmin (Maharashtra)
Locus Fst P-value Fst P-value Fst P-value
D8S1179 0.005 0.000 0.010 0.007 0.008 0.005
D21S11 0.002 0.024 0.004 0.054 0.051 0.000
D7S820 0.001 0.182 0.001 0.271 0.010 0.012
CSF1PO 0.002 0.082 −0.001 0.469 0.012 0.015
D19S433 0.001 0.142 0.007 0.019 0.003 0.073
vWA 0.005 0.001 0.002 0.155 0.006 0.040
TPOX 0.014 0.000 0.003 0.155 0.007 0.032
D18S51 0.002 0.022 0.012 0.001 0.002 0.131
D3S1358 0.000 0.309 0.005 0.072 0.004 0.129
THO1 0.001 0.131 0.032 0.000 0.000 0.395
D13S317 0.001 0.164 0.027 0.000 0.008 0.016
D16S539 0.003 0.007 0.005 0.070 0.010 0.006
D2S1338 0.005 0.000 0.010 0.004 0.010 0.003
D5S818 −0.001 0.603 0.006 0.055 −0.001 0.514
FGA 0.004 0.000 0.001 0.236 0.018 0.000

Page 8 of 12Shrivastava et al. SpringerPlus (2015) 4:566
showed genetic relationships of the studied population with other Indian published populations. The grouping of populations in PCA plot (Fig. 3) is also found consistent with the clustering pattern observed in the NJ tree.
The central Indian population showed significant vari-ations at maximum number of studied loci (14 out of 15) with Lodha (Bengal) and showed no significant dis-parity from Lambadi population (Andhra Pradesh). This finding is found consistent with the clustering pattern of observed in the NJ tree and PCA plot. We also compared central Indian population on the basis of locus wise allele frequencies at all the 15 loci with the other published
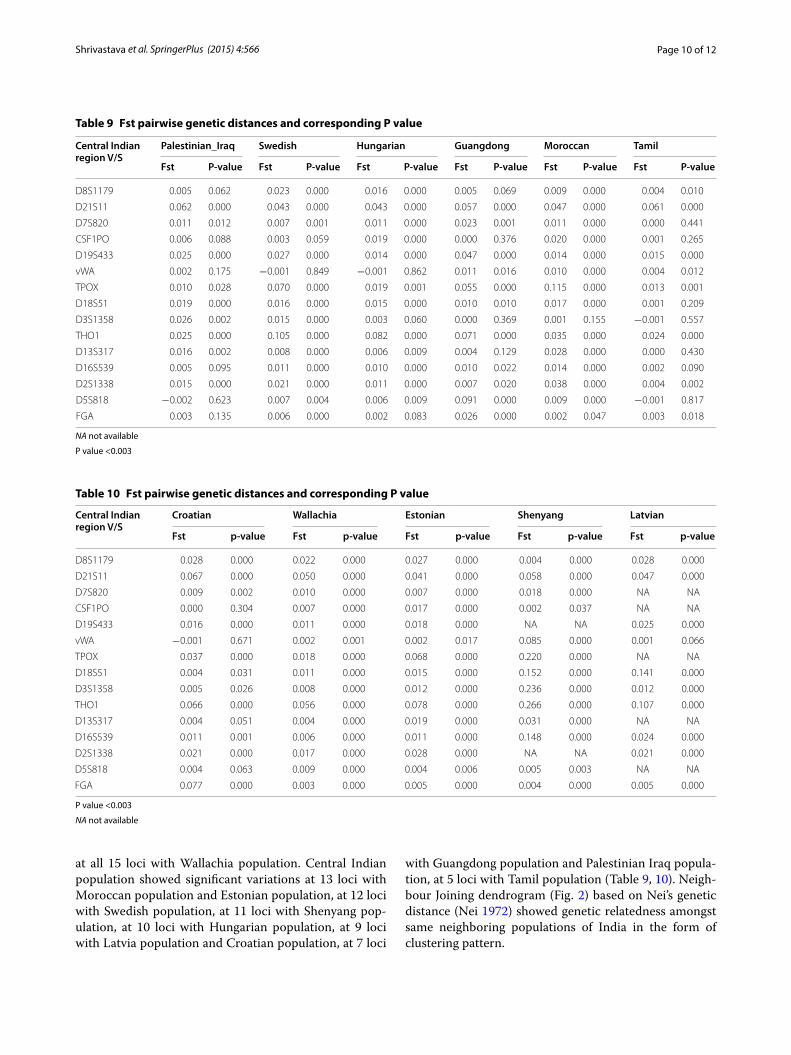
populations from Palestinian_Iraq (AL-Zubaidi et al. 2014), Swedish (Montelius et al. 2008), Hungarian (Dem-eter et al. 2010), Shenyang_China (Hou et al. 2013), Guangdong (Zhu et al. 2005), Moroccan (Bentayebi et al. 2014), Tamil (Balamurugan et al. 2010), Croatian (Projić et al. 2007), Wallachia_ Romania (Stanciu et al. 2009), Estonia (Sadam et al. 2014) and Latvia (Jemeljanova et al. 2015) populations using Pairwise Fst distance rang-ing from −0.001 to 0.266 (Table 9, 10). Central Indian population showed genetic detachment from all other area specific published population data (Table 2), used for comparison and also showed significant variation
Fig. 1 NJ tree based on Nei’s genetic distance showing genetic distance of central Indian population with other reported Indian populations

Page 9 of 12Shrivastava et al. SpringerPlus (2015) 4:566
Fig. 2 NJ tree for the studied population with other reported populations from different countries based on Nei’s genetic distances
Fig. 3 PCA plot of central Indian population showing distance pattern with other published Indian populations of India
Page 10 of 12Shrivastava et al. SpringerPlus (2015) 4:566
at all 15 loci with Wallachia population. Central Indian population showed significant variations at 13 loci with Moroccan population and Estonian population, at 12 loci with Swedish population, at 11 loci with Shenyang pop-ulation, at 10 loci with Hungarian population, at 9 loci with Latvia population and Croatian population, at 7 loci
with Guangdong population and Palestinian Iraq popula-tion, at 5 loci with Tamil population (Table 9, 10). Neigh-bour Joining dendrogram (Fig. 2) based on Nei’s genetic distance (Nei 1972) showed genetic relatedness amongst same neighboring populations of India in the form of clustering pattern.
Table 9 Fst pairwise genetic distances and corresponding P value
NA not available
P value <0.003
Central Indian region V/S
Palestinian_Iraq Swedish Hungarian Guangdong Moroccan Tamil
Fst P-value Fst P-value Fst P-value Fst P-value Fst P-value Fst P-value
D8S1179 0.005 0.062 0.023 0.000 0.016 0.000 0.005 0.069 0.009 0.000 0.004 0.010
D21S11 0.062 0.000 0.043 0.000 0.043 0.000 0.057 0.000 0.047 0.000 0.061 0.000
D7S820 0.011 0.012 0.007 0.001 0.011 0.000 0.023 0.001 0.011 0.000 0.000 0.441
CSF1PO 0.006 0.088 0.003 0.059 0.019 0.000 0.000 0.376 0.020 0.000 0.001 0.265
D19S433 0.025 0.000 0.027 0.000 0.014 0.000 0.047 0.000 0.014 0.000 0.015 0.000
vWA 0.002 0.175 −0.001 0.849 −0.001 0.862 0.011 0.016 0.010 0.000 0.004 0.012
TPOX 0.010 0.028 0.070 0.000 0.019 0.001 0.055 0.000 0.115 0.000 0.013 0.001
D18S51 0.019 0.000 0.016 0.000 0.015 0.000 0.010 0.010 0.017 0.000 0.001 0.209
D3S1358 0.026 0.002 0.015 0.000 0.003 0.060 0.000 0.369 0.001 0.155 −0.001 0.557
THO1 0.025 0.000 0.105 0.000 0.082 0.000 0.071 0.000 0.035 0.000 0.024 0.000
D13S317 0.016 0.002 0.008 0.000 0.006 0.009 0.004 0.129 0.028 0.000 0.000 0.430
D16S539 0.005 0.095 0.011 0.000 0.010 0.000 0.010 0.022 0.014 0.000 0.002 0.090
D2S1338 0.015 0.000 0.021 0.000 0.011 0.000 0.007 0.020 0.038 0.000 0.004 0.002
D5S818 −0.002 0.623 0.007 0.004 0.006 0.009 0.091 0.000 0.009 0.000 −0.001 0.817
FGA 0.003 0.135 0.006 0.000 0.002 0.083 0.026 0.000 0.002 0.047 0.003 0.018
Table 10 Fst pairwise genetic distances and corresponding P value
P value <0.003
NA not available
Central Indian region V/S
Croatian Wallachia Estonian Shenyang Latvian
Fst p-value Fst p-value Fst p-value Fst p-value Fst p-value
D8S1179 0.028 0.000 0.022 0.000 0.027 0.000 0.004 0.000 0.028 0.000
D21S11 0.067 0.000 0.050 0.000 0.041 0.000 0.058 0.000 0.047 0.000
D7S820 0.009 0.002 0.010 0.000 0.007 0.000 0.018 0.000 NA NA
CSF1PO 0.000 0.304 0.007 0.000 0.017 0.000 0.002 0.037 NA NA
D19S433 0.016 0.000 0.011 0.000 0.018 0.000 NA NA 0.025 0.000
vWA −0.001 0.671 0.002 0.001 0.002 0.017 0.085 0.000 0.001 0.066
TPOX 0.037 0.000 0.018 0.000 0.068 0.000 0.220 0.000 NA NA
D18S51 0.004 0.031 0.011 0.000 0.015 0.000 0.152 0.000 0.141 0.000
D3S1358 0.005 0.026 0.008 0.000 0.012 0.000 0.236 0.000 0.012 0.000
THO1 0.066 0.000 0.056 0.000 0.078 0.000 0.266 0.000 0.107 0.000
D13S317 0.004 0.051 0.004 0.000 0.019 0.000 0.031 0.000 NA NA
D16S539 0.011 0.001 0.006 0.000 0.011 0.000 0.148 0.000 0.024 0.000
D2S1338 0.021 0.000 0.017 0.000 0.028 0.000 NA NA 0.021 0.000
D5S818 0.004 0.063 0.009 0.000 0.004 0.006 0.005 0.003 NA NA
FGA 0.077 0.000 0.003 0.000 0.005 0.000 0.004 0.000 0.005 0.000

Page 11 of 12Shrivastava et al. SpringerPlus (2015) 4:566
ConclusionThe data generated here will add to the databank of various studies conducted on Indian populations. With respect to the distribution of alleles at each STR locus, all the 15 STR loci were found to be substantially polymor-phic in this population. The virtue of being polymorphic makes these 15 STR loci specific and valuable in indi-vidual identification. Central Indian population showed genetic distance from all the compared (published) populations.
Authors’ contributionsPS designed the study, did genotyping of samples and contributed signifi-cantly in data analysis and manuscript preparation. TJ carried out data man-agement, statistical analysis and drafted the manuscript. VBT helped in data analysis contributed in drafting the manuscript. All authors read and approved the final manuscript.
Compliance with ethical guidelines
Competing interestsThe authors declare that they have no competing interest.We declare that our research was carried out according to our institution’s ethical guidelines and that all subjects gave their consent to participate in this study.
Received: 25 May 2015 Accepted: 21 September 2015
ReferencesAL-Zubaidi MM, Daim Saleh MA, Jaber Alawedi S (2014) Genetic variation of
15 autosomal short tandem repeat (STR) locus in sample of Palestinian population residing in Iraq. Int J Dev Res 4:153–156
Balamurugan K, Kanthimathi S, Vijaya M, Suhasini G, Duncan G, Tracey M, Budowle B (2010) Genetic variation of 15 autosomal microsatellite locus in a Tamil population from Tamil Nadu, Southern India. J Legal Med 12:320–323
Banerjee J, Trivedi R, Kashyap VK (2005) Polymorphism at 15 short tandem repeat AmpFlSTR Identifiler Locus in three aboriginal populations of India: an assessment in human identification India. J Forensic Sci 50(5):1229–1234
Bentayebi K, Abada F, Ihzmad H, Amzazi S (2014) Genetic ancestry of a Moroc-can population as inferred from autosomal STRs. Meta Gene 2:427–438
Bindu HG, Trivedi R, Kashyap VK (2005) Genotypic polymorphisms at fifteen tetranucleotides and two pentanucleotide repeat locus in four tribal pop-ulations of Andhra Pradesh, southern India. J Forensic Sci 50(4):978–983
Bland JM, Altman DG (1995) Multiple significance tests: the Bonferroni method. BMJ 310:170
Butler JM (2005) Forensic DNA typing: biology, technology, and genetics of STR markers. Elsevier, Burlington
Census of India (2011) http://censusindia.gov.in/. Accessed 22/02/2015. Data highlights: The scheduled tribes, Census of India 2001, Source: Office of the Registrar General, India. Retrieved on 20.07.2014 from http://censusindia.gov.in/Tables_Published/SCST/dh_st_madhya_pradesh.pdf
Chaudhari RR, Dahiya MS (2014) Genetic diversity of 15 autosomal short tandem repeats locus using the AmpFLSTR® Identifiler™ kit in a Bhil Tribe Population from Gujarat state, India. Indian J Hum Genet 20(2):148–152
Demeter SF, Kelemen B, Székely G, Popescu O (2010) Genetic variation at 15 polymorphic, autosomal, short tandem repeat locus of two Hungarian populations in Transylvania, Romania. Croat Med J 51:515–523
DNA recommendations (1994) Report concerning further recommendations of the DNA commission of the ISFH regarding PCR-based polymorphisms in STR (short tandem repeat) system. Forensic Sci Int 69:103–104
Dubey B, Meganathan PR, Eaaswarkhanth M, Vasulu TS, Haque I (2009) Foren-sic STR profile of two endogamous populations of Madhya Pradesh, India. Legal Med 11:41–44
Eaaswarkhanth M, Dubey B, Meganathan PR, Noor S (2009) Microsatellite diversity delineates genetic relationships of Shia and Sunni Muslim popu-lations of Uttar Pradesh, India. Human Biol 81(4):427–445
Edwards A, Hammond HA, Jin L, Caskey CT, Chakraborty R (1992) Genetic vari-ation at five trimeric and tetrameric tandem repeat locus in four human population groups. Genomics 12(2):241–253
Excoffier L, Laval G, Schneider S (2005) Arlequinver 3.0: an integrated software package for population genetics data analysis. Evol Bioinform Online 1:47–50
Gaikwad S, Kashyap VK (2002) Polymorphism at fifteen hypervariable micro-satellite locus in four population of Maharashtra, India. Forensic Sci Int 126:267–271
Ghosh T, Kalpana D, Mukerjee S, Mukherjee M, Sharma AK, Nath S, Rathod VR, Thakar MK, Jha GN (2011) Genetic diversity of autosomal STRs in eleven populations of India. Forensic Sci Int Genet 5(3):259–261
Giroti R, Talwar I (2010) The most ancient democracy in the world is a genetic isolate: an autosomal and Y-chromosome study of the hermit village of Malana (Himachal Pradesh, India). Hum Biol 82(2):123–141. doi:10.3378/027.082.0201
Hammer O, Harper DAT, Ryan PD (2001) PAST: palaeontological Statistics soft-ware package for education and data analysis. Palaeontologia Electronica 4:9
Hou G, Jiang X, Wang Y, Li Q, Sun H (2013) Genetic distribution on 15 STR locus from a Han population of Shenyang region in northeast China. Forensic Sci Int Genet 7:86–87
Jeffreys AJ, Brookfield JF, Semeonoff R (1985) Positive identification of an immi-gration test-case using human DNA fingerprints. Nature 317:818–819
Jemeljanova V, Gobrusjonoka O, Bergere O, Latisheva K, Axelsson EP, Pajnič I (2015) Population data for 15 autosomal STR locus from Latvia. Int J Legal Med 129(4):739–740. doi:10.1007/s00414-015-1205-3
Krithika S, Trivedi R, Kashyap VK, Vasulu TS (2007) Genotype Profile for fifteen Trtranucleotide Repeat locus in two tibeto-burman speakin tribal popula-tions at Arunachal pradesh, India. India J Forensic Sci 52(1):1229–1234
Montelius K, Karlsson AO, Holmlund G (2008) STR data for the AmpFℓSTR Iden-tifiler locus from Swedish population in comparison to European, as well as with non-European population. Forensic Sci Int Genet 2:49–52
Narkuti V, Vellanki RN, Oraganti NM, Mangamoori LN (2008) Paternal exclusion: allele sharing in microsatellite testing. Clin Chem Lab Med 46(11):1586–1588. doi:10.1515/CCLM.2008.312
Nei M (1972) Genetic distance between populations. Am Nat 106:283–291Peakall R, Smouse PE (2006) GENALEX 6: genetic analysis in excel. Population
genetic software for teaching and research. MolEcol Notes 6:288–295Projić P, Škaro V, Šamija I, Pojskić N, Durmić-Pašić A, Kovačević L, Bakal N,
Primorac D, Marjanović D (2007) Allele frequencies for 15 short tandem repeat locus in representative sample of croatian population. Croat Med J 48:473–477
Rajkumar R, Kashyap VK (2004) Genetic structure of four socio-culturally diver-sified caste populations of southwest India and their affinity with related Indian and global groups. BMC Genet 5:23. doi:10.1186/1471-2156-5-23
Sadam M, Tasa G, Tiidla A, Lang A, Axelsson EP, Pajnič IZ (2014) Population data for 22 autosomal STR locus from Estonia. Int J Legal Med. doi:10.1007/s00414-014-1089-7
Sahoo S, Kashyap VK (2002) Genetic variation at 15 autosomal microsatellite locus in three highly endogamous populations of orissa, India. Forensic Sci Int 130:189–193
Sarkar N, Kashyap VK (2002) Genetic diversity at two pentanucleotide STR and thirteen tetranucleotide STR locus by multiplex PCR in four predominant population groups of central India. Forensic Sci Int 128:196–201
Shrivastava P, Jain T, Gupta U, Trivedi VB (2015a) Genetic polymorphism study on 12 X STR locus of investigator Argus X STR kit in Bhil tribal population of Madhya Pradesh, India. Leg Med 17(2015):214–217
Shrivastava P, Jain T, Gupta U, Trivedi VB (2015b) Genetic variation at 15 auto-somal STR locus in Bhil tribal population of Central India. Ann Hum Bio 24:1–4. doi:10.3109/03014460.2015.1014419
Singh KS (1998) India’s communities. People of India. National Series Volume IV. India Oxford University Press

Page 12 of 12Shrivastava et al. SpringerPlus (2015) 4:566
Singh A, Trivedi R, Kashyap VK (2006) Genetic Polymorphism at 15 tetrameric short tandem repeat locus in four aboriginal tribal populations of Bengal. J Forensic Sci 51(1):183–187
Stanciu F, Stoian IM, Popescu OR (2009) Population data for 15 short tandem repeat locus from Wallachia Region, South Romania. Croat Med J 50:321–325
Takezaki N, Nei M, Tamura K (2009) POPTREE2: software for constructing popu-lation trees from allele frequency data and computing other population statistics with windows-interface. Mol Biol Evol 27:747–752
Tandon M, Trivedi R, Kashyap VK (2002) Genomic diversity at 15 fluorescent labeled short tandem repeat locus in few important populations of State of Uttar Pradesh, India. Forensic Sci Int 28:190–195
Tereba A (1999) Tools for analysis of population statistics. Profiles DNA 2:14–16
Zhu J, Li J, Guo Y, Liu K, Zhu B, Liu Y (2005) Population data of 15 STR in Chinese Han population from north of Guangdong. J Forensic Sci 50:1510–1511
Zupanic Pajnic I, Sterlinko H, Balaic J, Komel R (2001) Parentage testing with 14 STR locus and population data for 5 STRs in the Slovenian population. Int J Legal Med 114(3):178–180
Zupanic Pajnic I, Gornjak Pogorelc B, Balazic J (2010) Molecular genetic identification of skeletal remains from the Second World War Konfin I mass grave in Slovenia. Int J Legal Med 124(4):307–317. doi:10.1007/s00414-010-0431-y