genetic recombination in eukaryotes: crossing over, part 1 i.genes found on the same chromosome =...
Post on 21-Dec-2015
218 views
TRANSCRIPT
Genetic recombination in Genetic recombination in Eukaryotes: crossing over, part 1Eukaryotes: crossing over, part 1
I.I. Genes found on the same Genes found on the same chromosome = linked geneschromosome = linked genes
II.II. Linkage and crossing overLinkage and crossing over
III.III. Crossing over & Crossing over & chromosome mappingchromosome mapping
I. Genes found on the same I. Genes found on the same chromosome = linked geneschromosome = linked genes
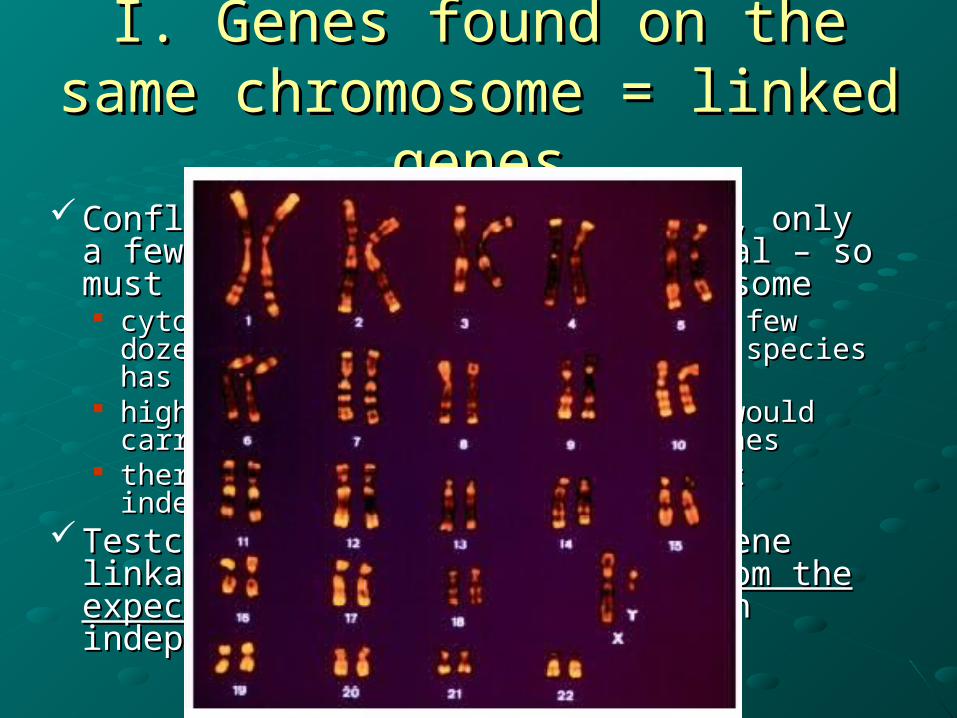
Conflicting cytological evidence, only a few Conflicting cytological evidence, only a few dozen chromosomes/individual – so must be dozen chromosomes/individual – so must be several genes per chromosomeseveral genes per chromosome cytological studies revealed only a few dozen cytological studies revealed only a few dozen
chromosomes present, yet each species has chromosomes present, yet each species has thousands of genesthousands of genes
highly likely that each chromosome would carry highly likely that each chromosome would carry many hundreds/thousands of genesmany hundreds/thousands of genes
therefore not all genes could assort independentlytherefore not all genes could assort independently Testcross experiments revealed gene linkage – Testcross experiments revealed gene linkage –
observed observed deviationsdeviations from the expected 1:1:1:1 from the expected 1:1:1:1 ratioratio based upon independent assortment based upon independent assortment
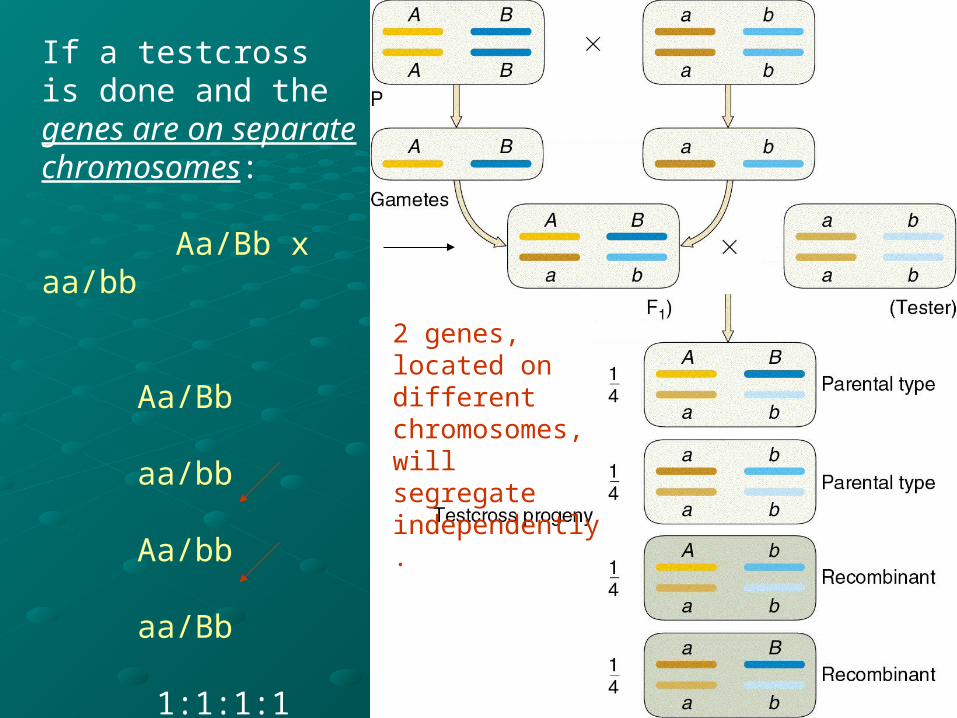
If a testcross is done and the genes are on separate chromosomes:
Aa/Bb x aa/bb
Aa/Bb
aa/bb
Aa/bb
aa/Bb
1:1:1:1 observed
2 genes, located on different chromosomes, will segregate independently.
Chromosome is the unit of Chromosome is the unit of transmission, not the genetransmission, not the gene
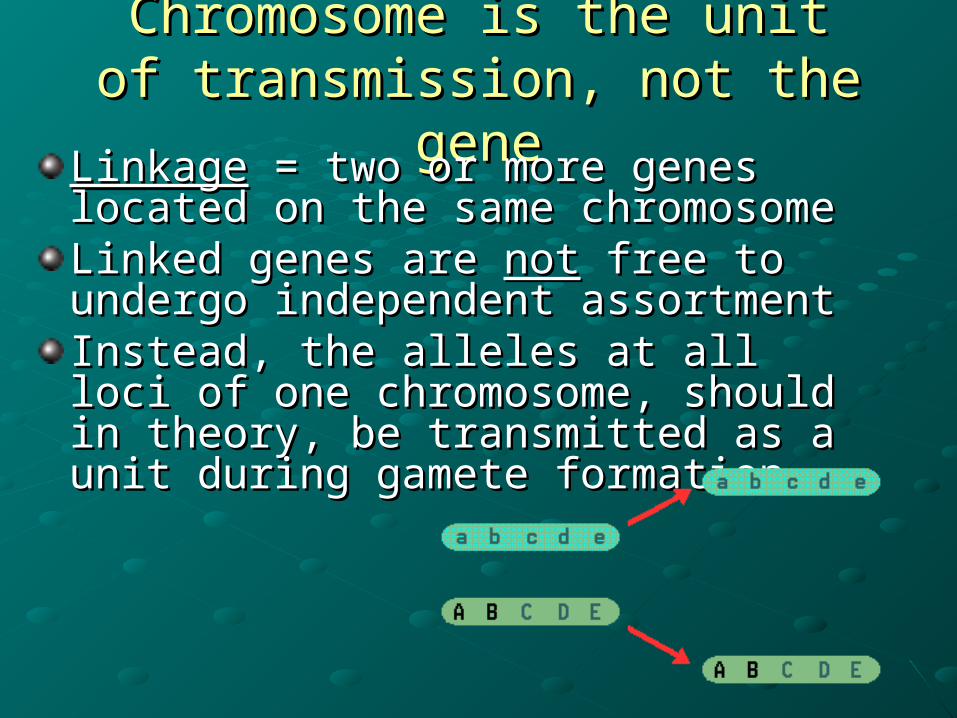
LinkageLinkage = two or more genes located on = two or more genes located on the same chromosomethe same chromosomeLinked genes are Linked genes are notnot free to undergo free to undergo independent assortmentindependent assortmentInstead, the alleles at all loci of one Instead, the alleles at all loci of one chromosome, should in theory, be chromosome, should in theory, be transmitted as a unit during gamete transmitted as a unit during gamete formation.formation.

When two genes are compeletely linked, no crossing over occurs therefore, each gamete receives the alleles present on one chromatid or the other:
AB or ab
II. Linkage and crossing overII. Linkage and crossing over
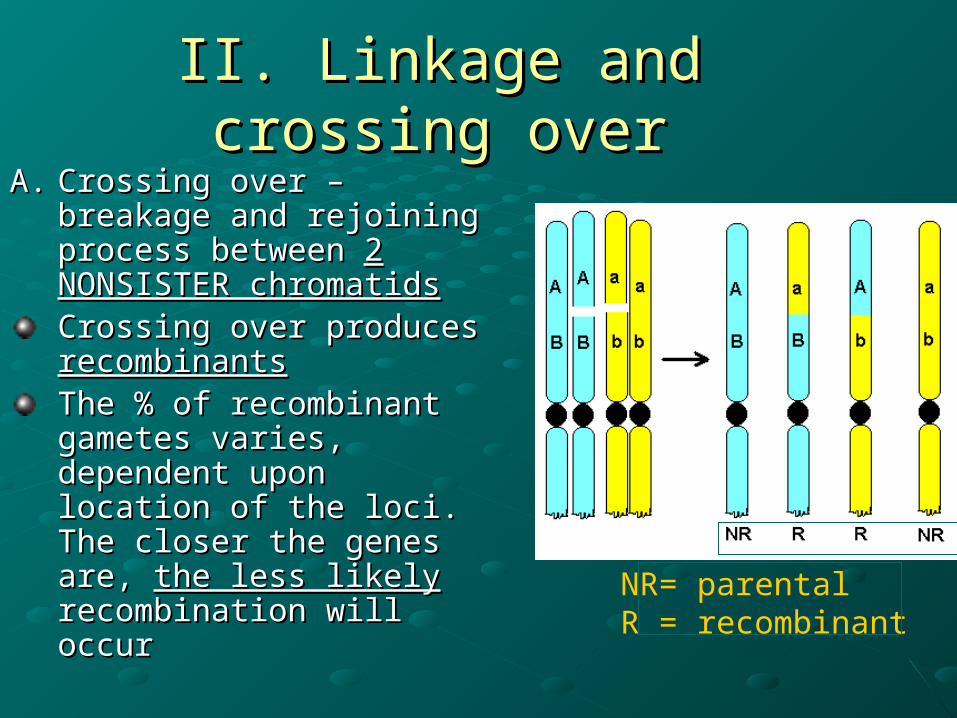
A.A. Crossing over – breakage Crossing over – breakage and rejoining process and rejoining process between between 2 NONSISTER 2 NONSISTER chromatidschromatidsCrossing over produces Crossing over produces recombinantsrecombinantsThe % of recombinant The % of recombinant gametes varies, gametes varies, dependent upon location dependent upon location of the loci. The closer the of the loci. The closer the genes are, genes are, the less likelythe less likely recombination will occurrecombination will occur
NR= parentalR = recombinant
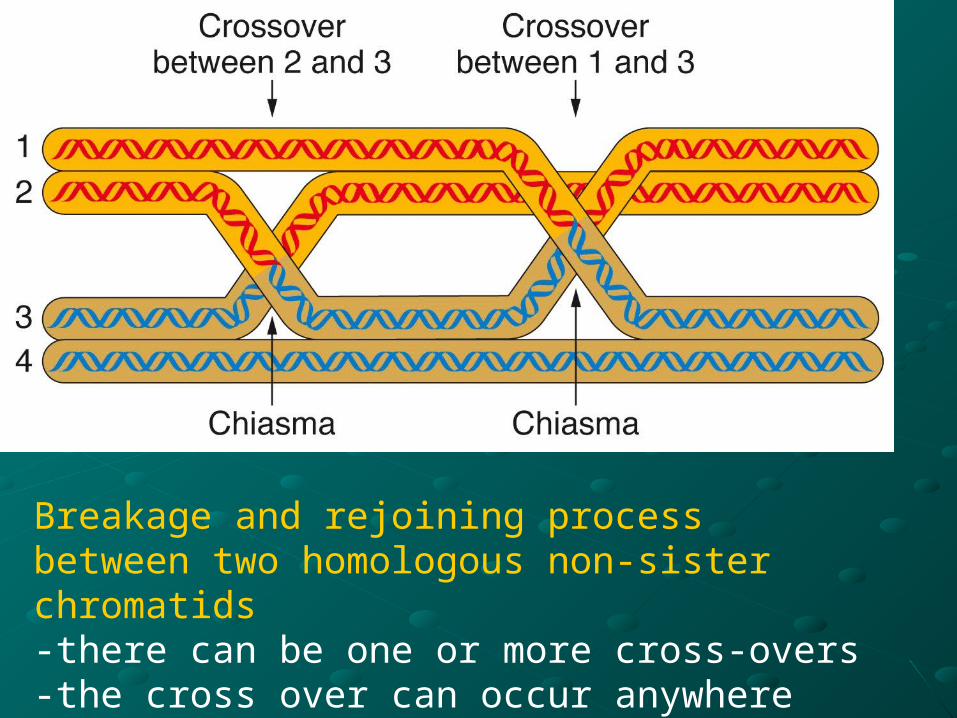
Breakage and rejoining process between two homologous non-sister chromatids-there can be one or more cross-overs-the cross over can occur anywhere

RECOMBINANT
RECOMBINANTCrossovergamete
Recombination Frequency = the # of recombinants/total progeny
Parentalgamete
Parental gamete

1). In the case of unlinked genes, independent assortment holds true…
Testcross: Heterozygous x homozygous mutantAaBb x aabb
Offspring: the # of recombinants = the # of parental types
Recombination Frequency =
(RF) = 1/2 or 50%
B. Recombination Frequency, unlinked B. Recombination Frequency, unlinked genes v. linked genesgenes v. linked genes
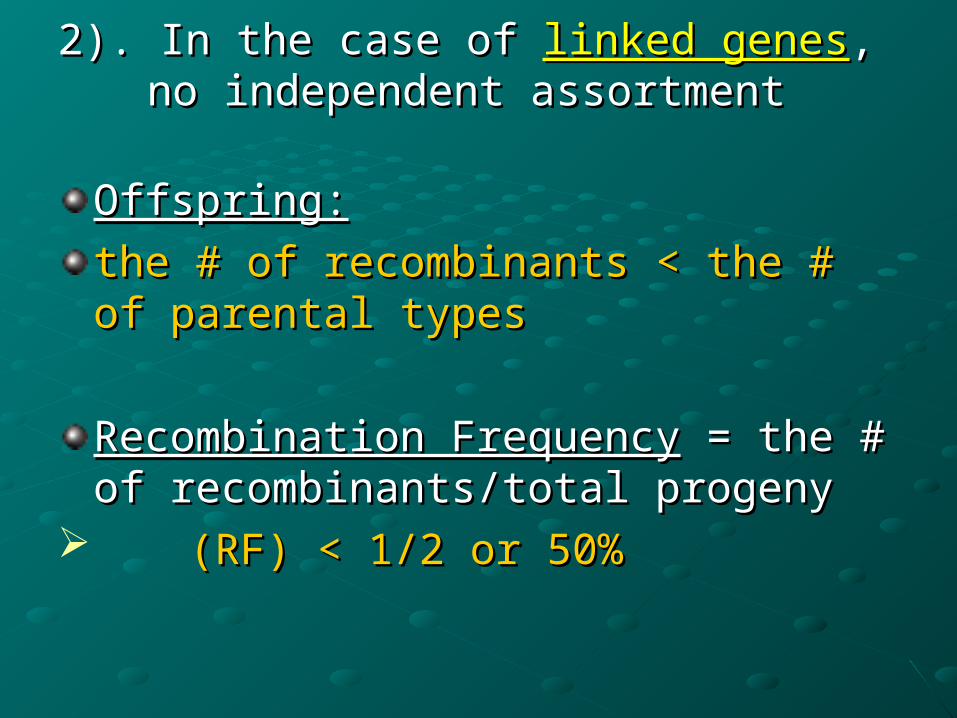
2). In the case of 2). In the case of linked geneslinked genes, no , no independent assortment independent assortment
Offspring:Offspring:
the # of recombinants < the # of parental the # of recombinants < the # of parental typestypes
Recombination FrequencyRecombination Frequency = the # of = the # of recombinants/total progenyrecombinants/total progeny
(RF) < 1/2 or 50%(RF) < 1/2 or 50%
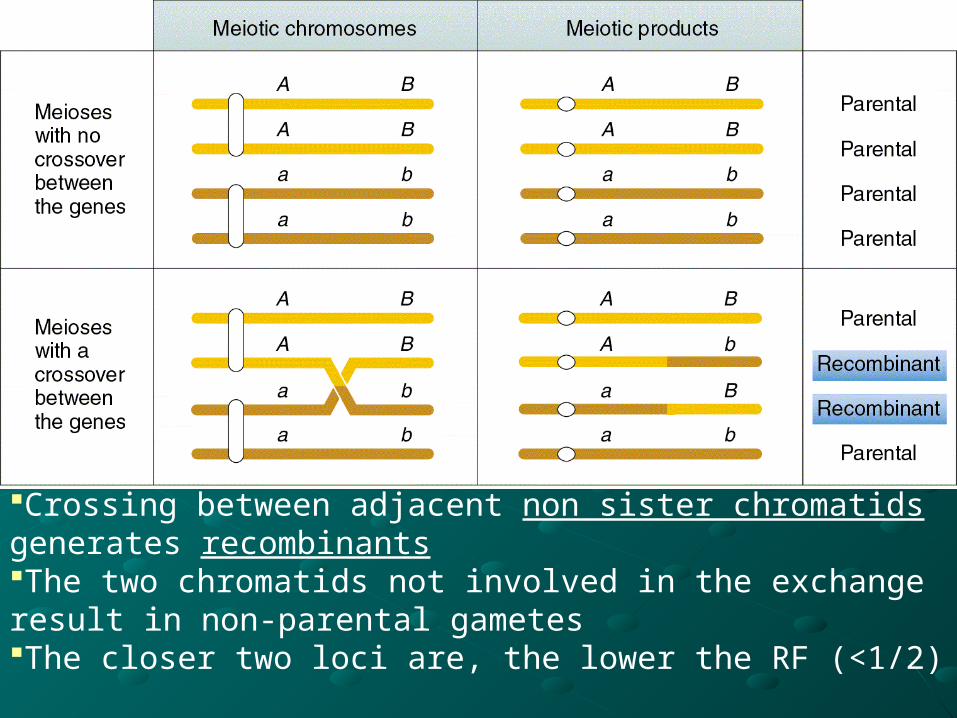
Crossing between adjacent non sister chromatids generates recombinantsThe two chromatids not involved in the exchange result in non-parental gametesThe closer two loci are, the lower the RF (<1/2)
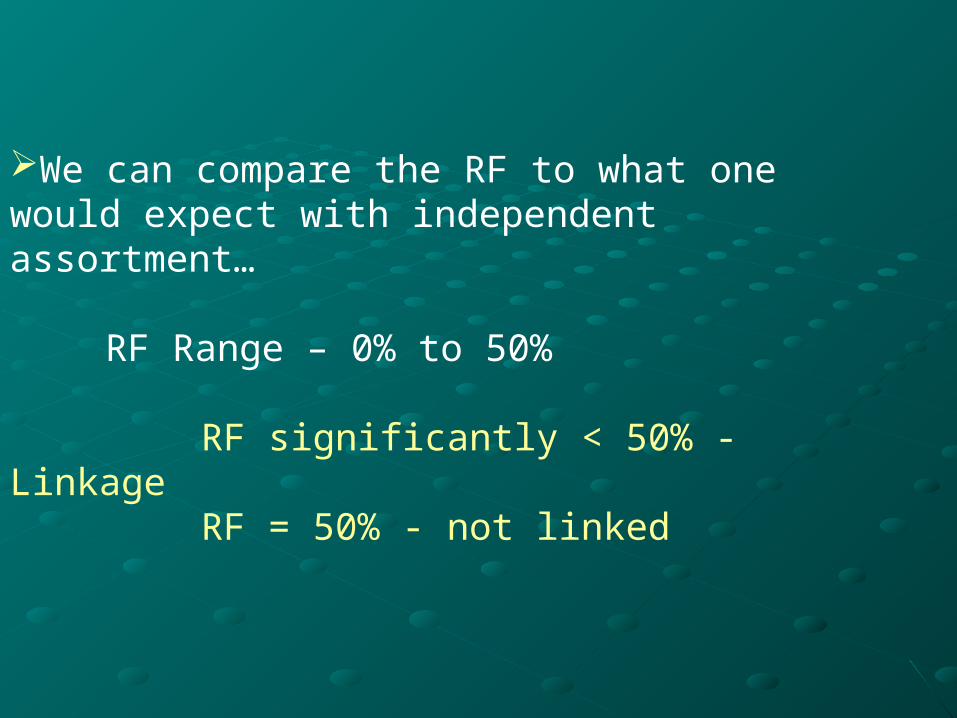
We can compare the RF to what one would expect with independent assortment…
RF Range – 0% to 50%
RF significantly < 50% - LinkageRF = 50% - not linked
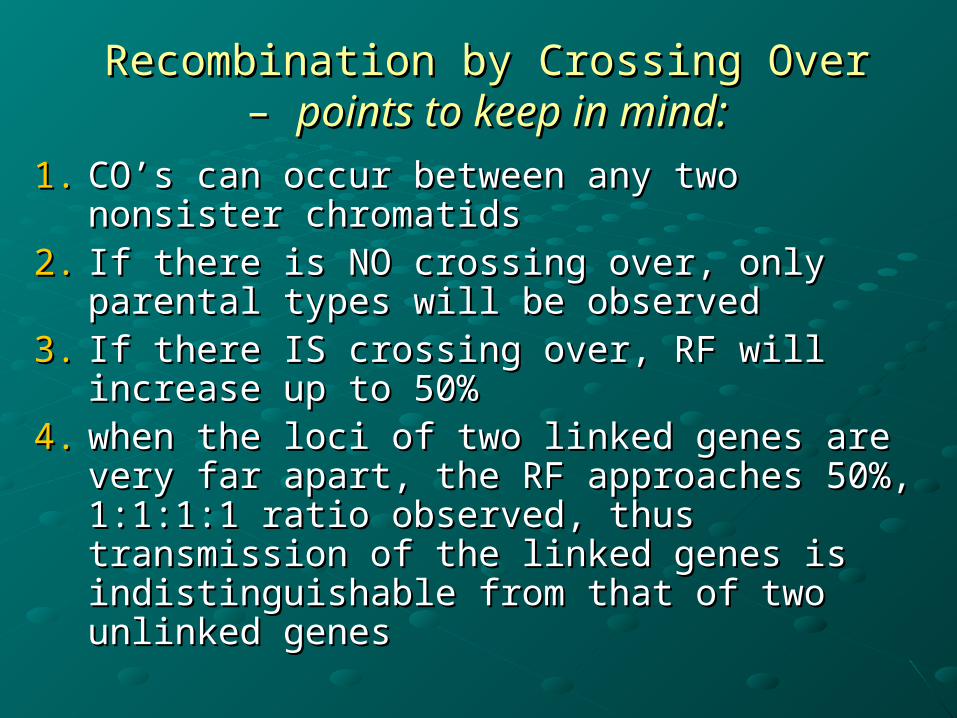
Recombination by Crossing Over – Recombination by Crossing Over – points points to keep in mind:to keep in mind:
1.1. CO’s can occur between any two nonsister CO’s can occur between any two nonsister chromatids chromatids
2.2. If there is NO crossing over, only parental If there is NO crossing over, only parental types will be observedtypes will be observed
3.3. If there IS crossing over, RF will increase up If there IS crossing over, RF will increase up to 50%to 50%
4.4. when the loci of two linked genes are very far when the loci of two linked genes are very far apart, the RF approaches 50%, 1:1:1:1 ratio apart, the RF approaches 50%, 1:1:1:1 ratio observed, thus transmission of the linked observed, thus transmission of the linked genes is indistinguishable from that of two genes is indistinguishable from that of two unlinked genesunlinked genes
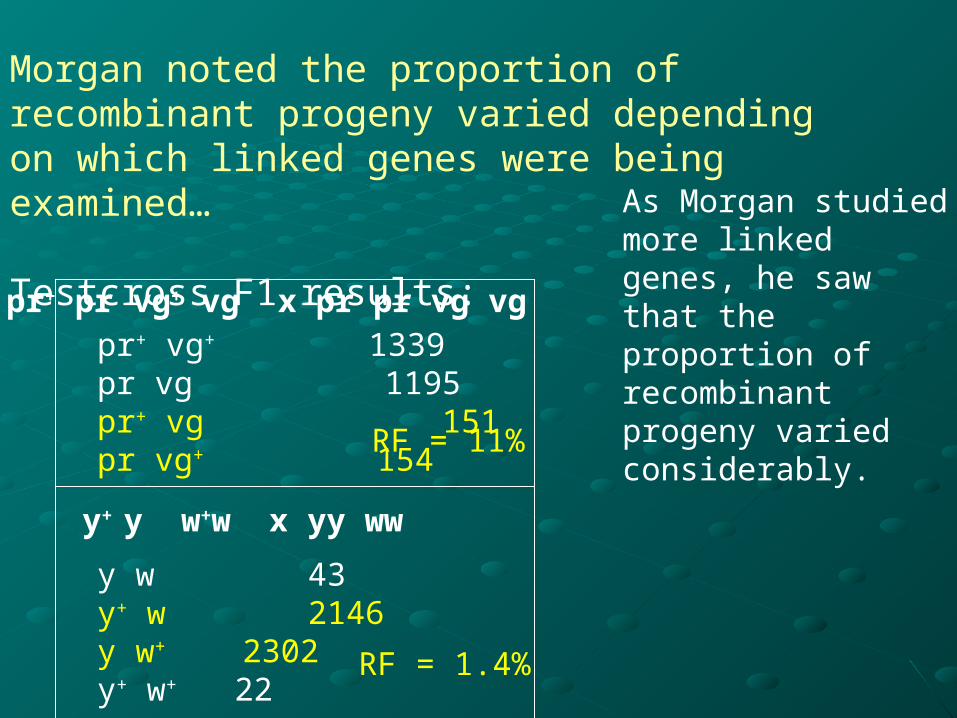
Morgan noted the proportion of recombinant progeny varied depending on which linked genes were being examined…
Testcross F1 results:
RF = 11%
RF = 1.4%
As Morgan studied more linked genes, he saw that the proportion of recombinant progeny varied considerably.
pr+ vg+ 1339pr vg 1195pr+ vg 151pr vg+ 154
y w 43y+ w 2146y w+ 2302y+ w+ 22
pr+ pr vg+ vg x pr pr vg vg
y+ y w+w x yy ww
III. Crossing over & chromosome mappingIII. Crossing over & chromosome mapping
Morgan thought the variations in RF might Morgan thought the variations in RF might indicate the actual distances separating genes indicate the actual distances separating genes on the chromosomes.on the chromosomes.
Sturtevant (Morgan’s student) compiled data on Sturtevant (Morgan’s student) compiled data on recombination between genes in recombination between genes in DrosophilaDrosophila test test crossescrosses
The closer the two linked genes, the lower the The closer the two linked genes, the lower the recombination frequency-recombination frequency- thus RF may be thus RF may be correlated with the map distance between two correlated with the map distance between two loci on a chromosomeloci on a chromosome
A. Linkage MapsA. Linkage Maps
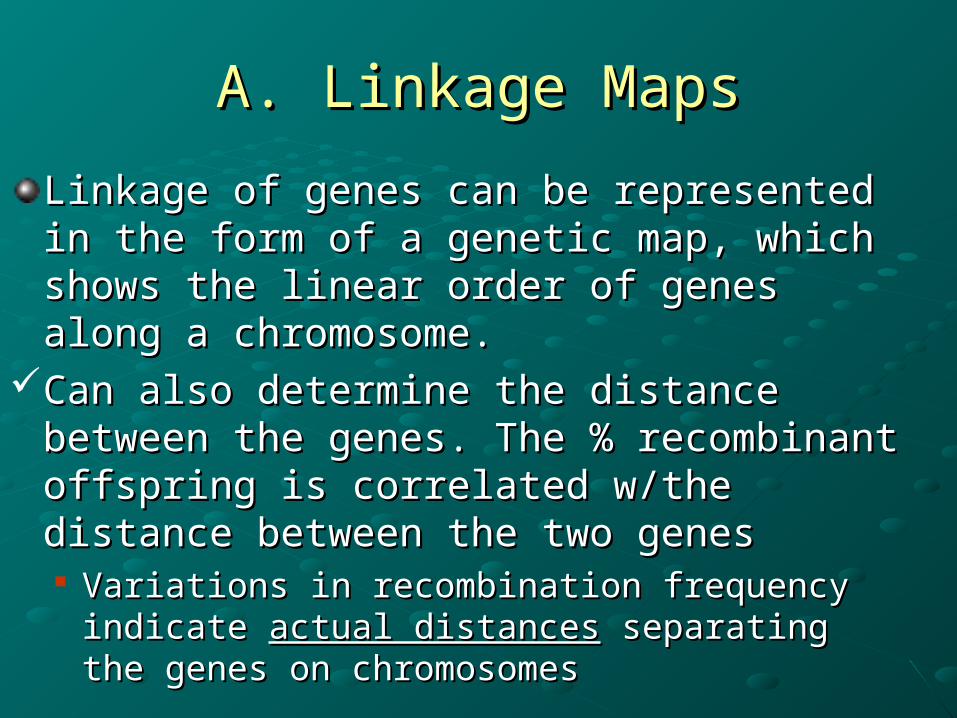
Linkage of genes can be represented in the Linkage of genes can be represented in the form of a genetic map, which shows the form of a genetic map, which shows the linear order of genes along a chromosome.linear order of genes along a chromosome.
Can also determine the distance between the Can also determine the distance between the genes. The % recombinant offspring is genes. The % recombinant offspring is correlated w/the distance between the two correlated w/the distance between the two genesgenes Variations in recombination frequency indicate Variations in recombination frequency indicate
actual distancesactual distances separating the genes on separating the genes on chromosomeschromosomes
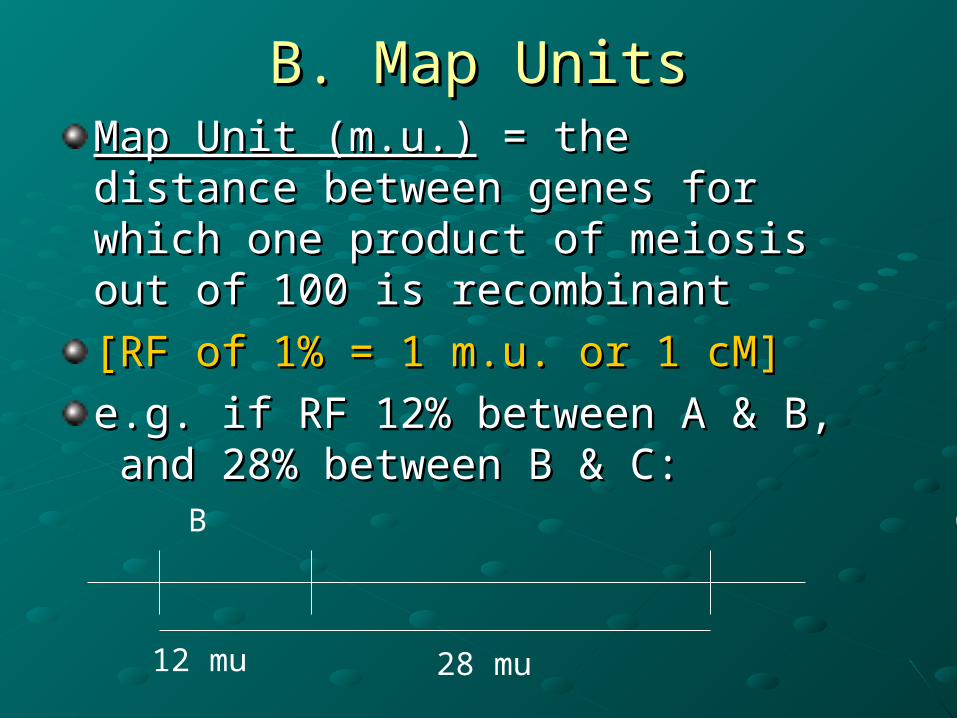
B. Map UnitsB. Map UnitsMap Unit (m.u.)Map Unit (m.u.) = the distance between = the distance between genes for which one product of meiosis genes for which one product of meiosis out of 100 is recombinantout of 100 is recombinant
[RF of 1% = 1 m.u. or 1 cM][RF of 1% = 1 m.u. or 1 cM]
e.g. if RF 12% between A & B, and e.g. if RF 12% between A & B, and 28% between B & C:28% between B & C:
A B C
12 mu 28 mu
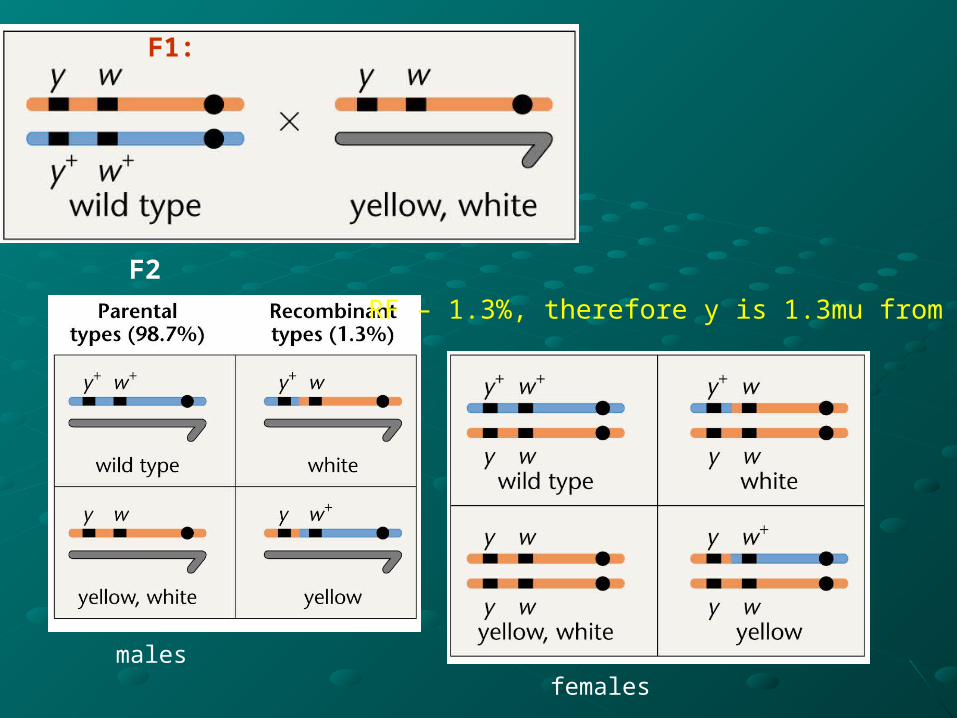
F1:
F2
RF – 1.3%, therefore y is 1.3mu from w
malesfemales
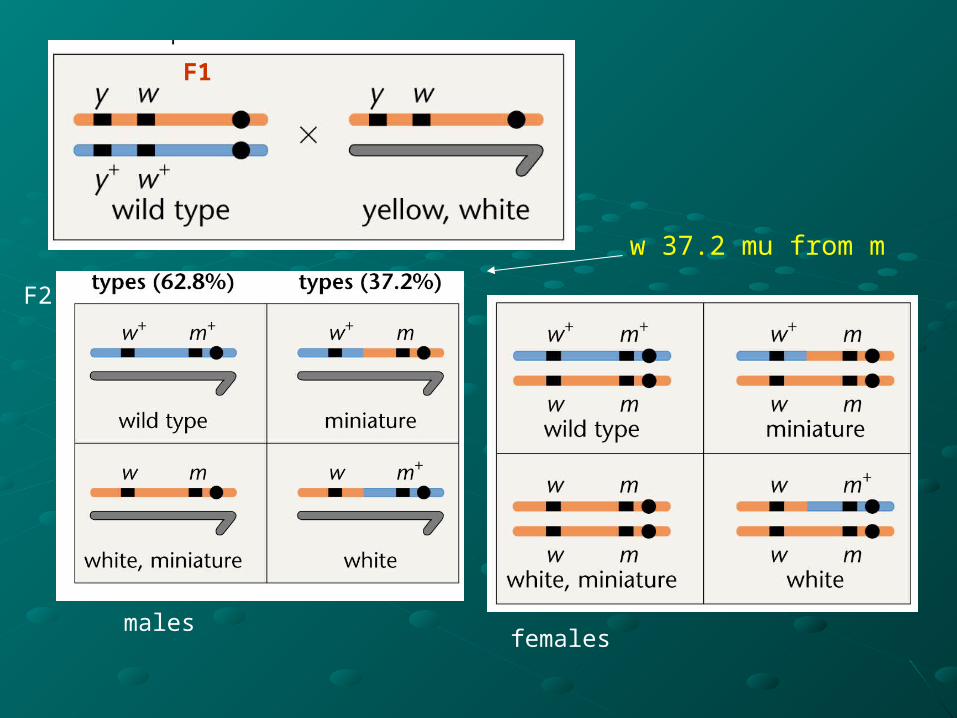
F1
F2
malesfemales
w 37.2 mu from m
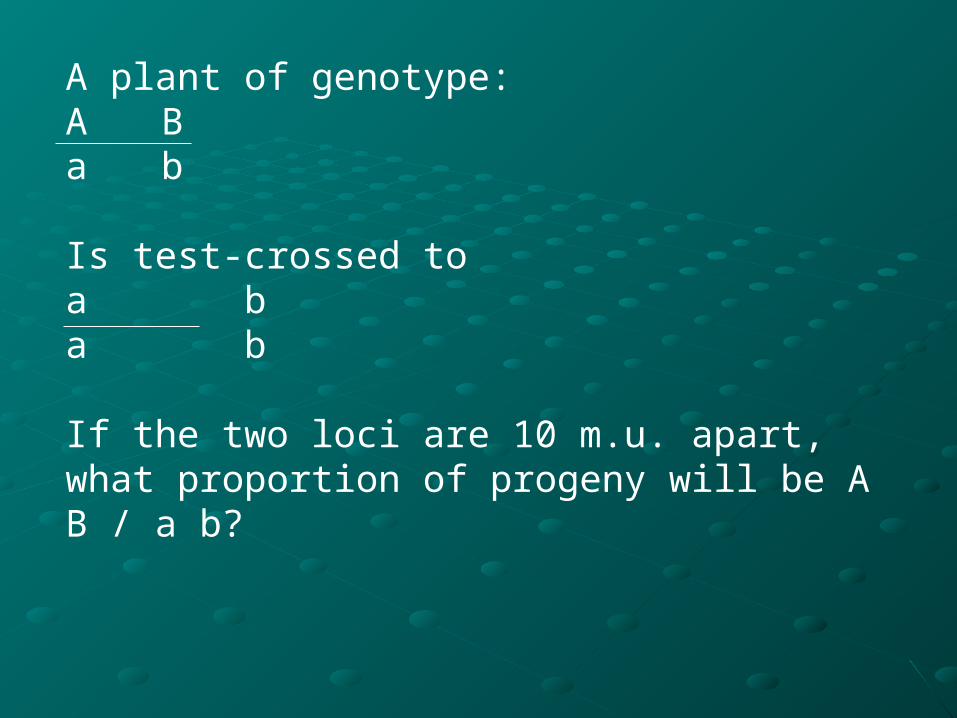
A plant of genotype:A Ba b
Is test-crossed toa ba b
If the two loci are 10 m.u. apart, what proportion of progeny will be A B / a b?
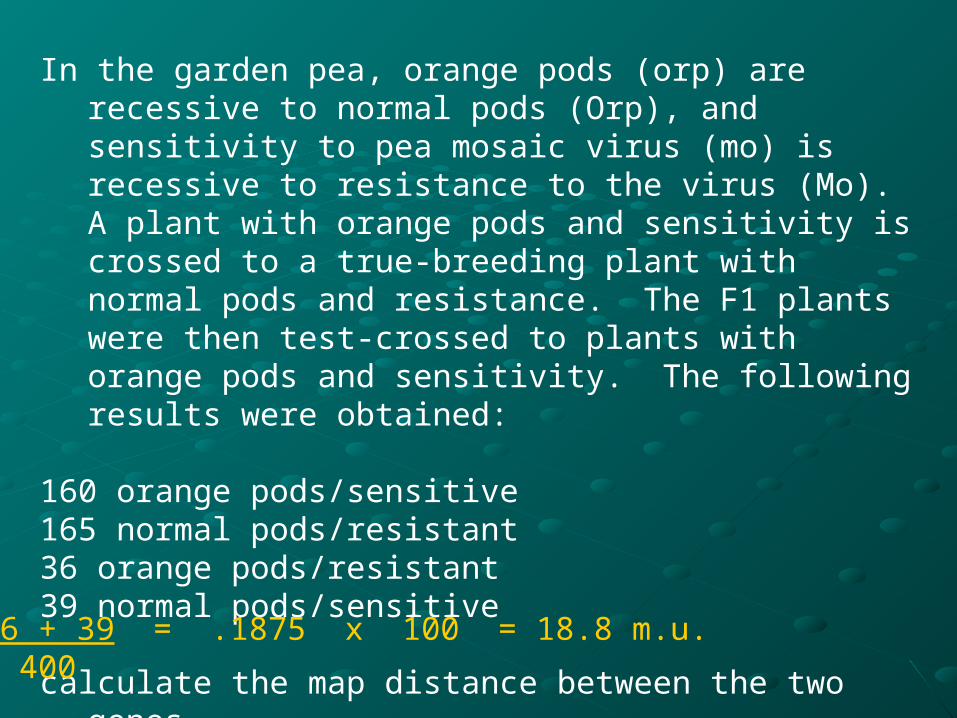
In the garden pea, orange pods (orp) are recessive to normal pods (Orp), and sensitivity to pea mosaic virus (mo) is recessive to resistance to the virus (Mo). A plant with orange pods and sensitivity is crossed to a true-breeding plant with normal pods and resistance. The F1 plants were then test-crossed to plants with orange pods and sensitivity. The following results were obtained:
160 orange pods/sensitive165 normal pods/resistant36 orange pods/resistant39 normal pods/sensitive
calculate the map distance between the two genes36 + 39 = .1875 x 100 = 18.8 m.u. 400
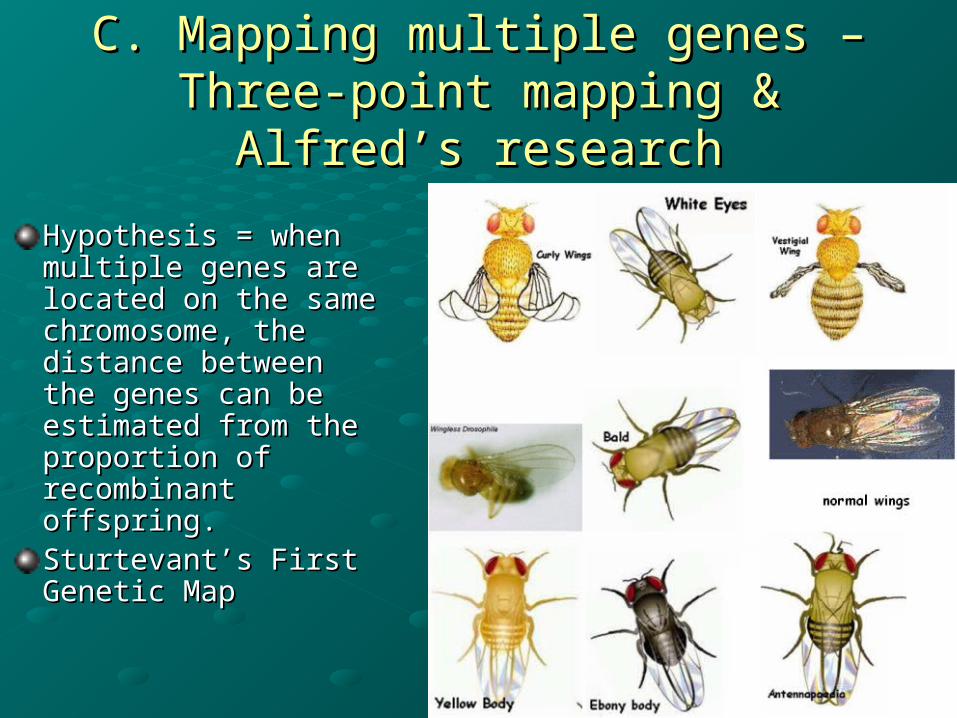
C. Mapping multiple genes – Three-C. Mapping multiple genes – Three-point mapping & Alfred’s researchpoint mapping & Alfred’s research
Hypothesis = when Hypothesis = when multiple genes are multiple genes are located on the same located on the same chromosome, the chromosome, the distance between the distance between the genes can be genes can be estimated from the estimated from the proportion of proportion of recombinant offspring.recombinant offspring.Sturtevant’s First Sturtevant’s First Genetic MapGenetic Map

A.Sturtevant’s First Genetic Map• The linear order of these genes can be determined
using testcross dataExamined 5 different genes: y, w, v, m, r
All alleles were found to be recessive and X linked.
Crossed the double heterozygote female with hemizygous male recessive for the same alleles.
Example: y+y w+w x ywy+w+ yw y+wyw+
RF = 214/21,736 = 0.0098
w+w r+r x wrw+r+wrw+rwr+RF = 2,062/6116 = 0.337
1 mu between y & w, 33.7 mu between w & r

genes are arranged on the chromosome in a linear order- which can be determined…
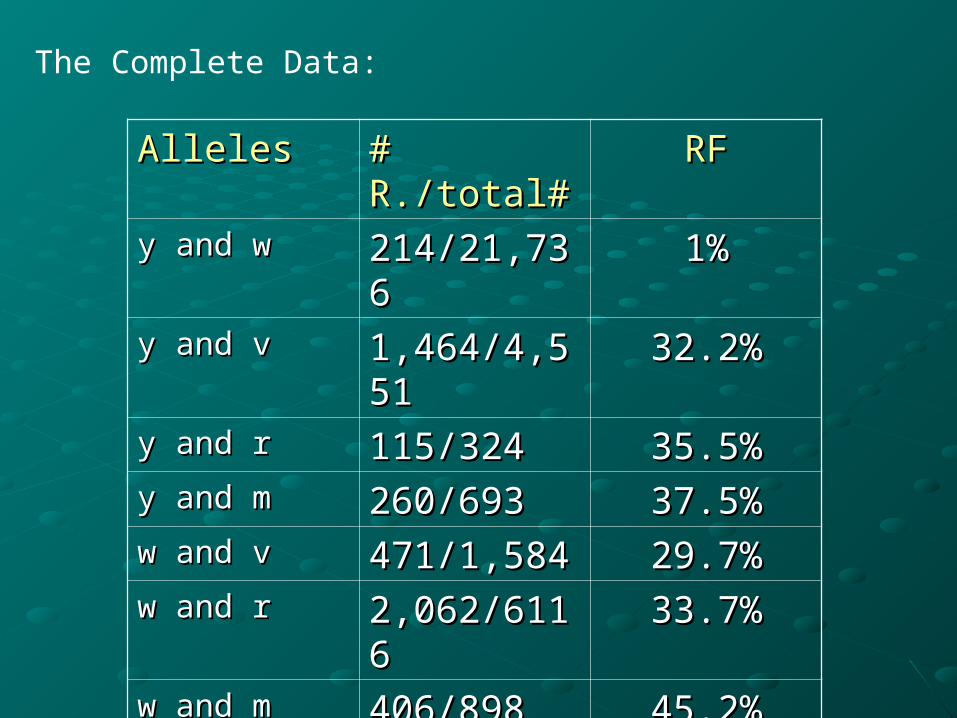
AllelesAlleles # R./total## R./total# RFRFy and wy and w 214/21,736214/21,736 1%1%y and vy and v 1,464/4,5511,464/4,551 32.2%32.2%
y and ry and r 115/324115/324 35.5%35.5%y and my and m 260/693260/693 37.5%37.5%w and vw and v 471/1,584471/1,584 29.7%29.7%w and rw and r 2,062/61162,062/6116 33.7%33.7%w and mw and m 406/898406/898 45.2%45.2%v and rv and r 17/57317/573 3%3%w and mw and m 109/405109/405 26.9%26.9%
The Complete Data:

y-w = 1 m.u. v-r = 3 m.u.
y-m = 37.5 m.u.
w-r = 33.7 m.u.
w-v = 29.7 m.u.
Suggesting that v is between r & w, but closer to r
y w v r m
57.6
1 29.7 3 23.9
Map distances more accurate between genes that are closer together, as the RF approaches 50%, the value becomes more inaccurate as a measure of map distance…
More accurate