geneva13
TRANSCRIPT

8/3/2019 Geneva13
http://slidepdf.com/reader/full/geneva13 1/162
Geneva Reports on the World Economy 13
Public Debts: Nuts, Bolts andWorries

8/3/2019 Geneva13
http://slidepdf.com/reader/full/geneva13 2/162
International Center or Monetary and Banking Studies (ICMB)
International Center for Monetary and Banking Studies
11A Avenue de la Paix
1202 GenevaSwitzerland
Tel: (41 22) 734 9548
Fax: (41 22) 733 3853
Web: www.icmb.ch
© September 2011 International Center for Monetary and Banking Studies
Centre or Economic Policy Research
Centre for Economic Policy Research
3rd Floor
77 Bastwick Street
London EC1V 3PZ
UK
Tel: +44 (20) 7183 8801
Fax: +44 (20) 7183 8820
Email: [email protected]
Web: www.cepr.org
ISBN: 978-1-907142-31-4

8/3/2019 Geneva13
http://slidepdf.com/reader/full/geneva13 3/162
Geneva Reports on the World Economy 13
Barry EichengreenUniversity of California, Berkeley and CEPR
Robert FeldmanMorgan Stanley
Je LiebmanHarvard University
Jürgen von HagenUniversity of Bonn and CEPR
Charles WyploszThe Graduate Institutte, Geneva and CEPR
Public Debts: Nuts, Bolts andWorries
ICMB InternatIonal Center
For Monetary
and BankIng StudIeS
CIMB Centre InternatIonal
d’etudeS MonetaIreS
et BanCaIreS

8/3/2019 Geneva13
http://slidepdf.com/reader/full/geneva13 4/162
International Center or Monetary and Banking Studies (ICMB)The International Centre for Monetary and Banking Studies was created in 1973as an independent, non-prot foundation. It is associated with Geneva’s GraduateInstitute of International Studies. Its aim is to foster exchanges of views between
the nancial sector, central banks and academics on issues of common interest.It is nanced through grants from banks, nancial institutions and central banks.
The Center sponsors international conferences, public lectures, original researchand publications. It has earned a solid reputation in the Swiss and internationalbanking community where it is known for its contribution to bridging the gapbetween theory and practice in the eld of international banking and nance.
In association with CEPR, the Center launched a new series of Geneva Reportson the World Economy in 1999. The eleven subsequent volumes have attractedconsiderable interest among practitioners, policy-makers and scholars working
on the reform of international nancial architecture.
The ICMB is non-partisan and does not take any view on policy. Its publications,including the present report, reect the opinions of the authors, not of ICM orany of its sponsoring institutions.
President of the Foundation Board Philipp HildebrandDirector Charles Wyplosz
Centre or Economic Policy Research (CEPR)The Centre for Economic Policy Research is a network of over 700 ResearchFellows and Afliates, based primarily in European universities. The Centrecoordinates the research of its Fellow and Afliates and communicates the resultsto the public and private sectors. CEPR is an entrepreneur, developing researchinitiatives with the producers, consumers and sponsors of research. Establishedin 1983, CEPR is a European economics research organization with uniquelywide-raning scope and activities.
The Centre is pluralist and non-partisan, bringing economic research to bearon the analysis of medium- and long-term policy questions. CEPR research may
include views on policy, but the Executive Committee of the Centre does notgive prior review to its publications, and the Centre takes no institutional policypositions. The opinions expressed in this report are those of the authors notthose of the Centre for Economic Policy Research.
CEPR is a registered charity (No. 287287) and a company limited by guaranteeand registered in England (No. 1727026).
Chair of the Board Guillermo de la DehesaPresident Richard PortesChief Executive Ofcer Stephen Yeo
Research Director Lucrezia ReichlinPolicy DIrector Richard Baldwin

8/3/2019 Geneva13
http://slidepdf.com/reader/full/geneva13 5/162
v
About the Authors
Barry Eichengreen is the George C. Pardee and Helen N. Pardee Professor of
Economics and Professor of Political Science at the University of California,
Berkeley, where he has taught since 1987. He is a Research Associate of the
National Bureau of Economic Research (Cambridge, Massachusetts) and Research
Fellow of the Centre for Economic Policy Research (London, England). In 1997-
98 he was Senior Policy Advisor at the International Monetary Fund. He is a
fellow of the American Academy of Arts and Sciences (class of 1997).
Professor Eichengreen is the convener of the Bellagio Group of academics
and economic ofcials and chair of the Academic Advisory Committee of the
Peterson Institute of International Economics. He has held Guggenheim and
Fulbright Fellowships and has been a fellow of the Center for Advanced Study in
the Behavioral Sciences (Palo Alto) and the Institute for Advanced Study (Berlin).
He is a regular monthly columnist for Project Syndicate.
His most recent books are Exorbitant Privilege: The Rise and Fall of the Dollar and
the Future of the International Monetary System (January 2011), Emerging Giants:
China and India in the World Economy, co-edited with Poonam Gupta and Ranjiv
Kumar (2010), Labor in the Era of Globalization, co-edited with Clair Brown and
Michael Reich (2009), Institutions for Regionalism: Enhancing Asia’s Economic
Cooperation and Integration, coedited with Jong-Wha Lee (2009), and Fostering
Monetary & Financial Cooperation in East Asia, co-edited with Duck-Koo Chung
(2009). Other books include What G20 Leaders Must Do to Stabilize Our Economy
and Fix the Financial System, coedited with Richard Baldwin,(e-book 2008),
Rescuing Our Jobs and Savings: What G7/8 Leaders Can Do to Solve the Global Credit
Crisis, coedited with Richard Baldwin,(e-book 2008), Globalizing Capital: A History of the International Monetary System, Second Edition (2008), The European Economy
since 1945: Coordinated Capitalism and Beyond (updated paperback edition, 2008),
Bond Markets in Latin America: On the Verge of a Big Bang?, co-edited with Eduardo
Borensztein, Kevin Cowan, and Ugo Panizza (2008), and China, Asia, and the New
World Economy, co-edited with Charles Wyplosz and Yung Chul Park (2008).
Professor Eichengreen was awarded the Economic History Association’s
Jonathan R.T. Hughes Prize for Excellence in Teaching in 2002 and the University
of California at Berkeley Social Science Division’s Distinguished Teaching Award
in 2004. He is the recipient of a doctor honoris causa from the American University
in Paris, and the 2010 recipient of the Schumpeter Prize from the International

8/3/2019 Geneva13
http://slidepdf.com/reader/full/geneva13 6/162
vi Public Debts: Nuts, Bolts and Worries
Schumpeter Society. He is President of the Economic History Association in the
2010-11 academic year.
Robert Feldman is a Managing Director who joined Morgan Stanley Japan Ltd.in February 1998 as the chief economist for Japan. In 2003, he also became Co-
Director of Japan Research. He continues to focus on the outlook for the Japanese
economy and on interest rate movements. Robert has published three books,
Japanese Financial Markets: Decits, Dilemmas, and Deregulation (MIT Press, 1986),
Nihon no Suijaku (“The Weakening of Japan”, Toyo Keizai 1996, in Japanese) and
Nihon no Saiki (“Starting Over ”, Toyo Keizai 2001, in Japanese). A uent speaker of
Japanese, he has also translated four books from Japanese to English, including
Economic Growth in Prewar Japan (by Takafusa Nakamura, Yale University Press).
In addition, he is a regular commentator on World Business Satellite, TV Tokyo’s
nightly business program. Robert was the chief economist for Japan at Salomon
Brothers from 1990 to 1997. He worked for the International Monetary Fund
from 1983 through 1989, in the Asian, European, and Research Departments.
Robert holds a Ph.D. in economics from the Massachusetts Institute of
Technology, and B.A.s in economics and in Japanese studies from Yale.
Between college and graduate school, he worked at both the Federal Reserve Bank
of New York and at Chase Manhattan Bank. Robert rst came to Japan as an
exchange student and also studied at the Nomura Research Institute and the
Bank of Japan.
Jeffrey B. Liebman, Malcolm Wiener Professor of Public Policy, teaches courses
in social policy, public sector economics, and American economic policy. In his
research, he studies tax and budget policy, social insurance, poverty, and income
inequality. Recent research has examined the impacts of government programs
such as the Earned Income Tax Credit, Social Security, and housing vouchers.
During the rst two years of the Obama Administration, Liebman served at OMB,
rst as Executive Associate Director and Chief Economist and then as Acting
Deputy Director. From 1998 to 1999, Liebman served as Special Assistant to the
President for economic policy and coordinated the Clinton Administration’s
Social Security reform technical working group. Liebman received his BA from
Yale University and his MA and PhD in economics from Harvard.
Professor Dr. Jürgen von Hagen was Director at the Center for European
Integration Studies from 1996 to 2005. Since then, he has been a Professor of
economics at the University of Bonn and director of the Institute for International
Economics. He is in charge of the economic research pillar of ZEI. Since 2009
Prof. von Hagen is also vice-rector for research and junior academic personnel at
the University of Bonn.
Prof. von Hagen´s main research focuses on isssues of economic policy,
monetary theory and policy, European economic integration as well as
international and public nance.
After studying economics at the University of Bonn, von Hagen was researchassistant at the Institute for International Economics there. Subsequently after

8/3/2019 Geneva13
http://slidepdf.com/reader/full/geneva13 7/162
About the Authors vii
the conferement of his doctorate he was a research fellow at Indiana University
(USA) from 1987–1992. From 1992–1996 he was Professor of economics at
the University of Mannheim. Among other things, von Hagen was a research
consultant at the International Monetary Fund. He was also visiting professorat the Universities of Gießen, Leuven (Belgium) and Tel Aviv (Israel). Moreover
he did major consultancies for the European Commission, the World Bank,
the Interamerican Development Bank, the Sultanate of Oman, the Republic of
Cyprus, the European Parliament and the Swedish Parliament.
Prof. von Hagen was a member of evaluation commissions
for the German Research Foundation (DFG), the German
Academic Council and the US National Science Foundation.
He received various research grants, inter alia from the VW Foundation, the DFG,
the European Commission and the German Academic Exchange Service (DAAD).
Von Hagen is co-editor of the journal European Economic Review. He is author
and editor of more than 250 publications.
Charles Wyplosz is Professor of International Economics at the Graduate
Institute in Geneva where he is Director of the International Centre for Money
and Banking Studies.
Previously, he has served as Associate Dean for Research and Development at
INSEAD and Director of the PhD program in Economics at the Ecole des Hautes
Etudes en Science Sociales in Paris. He also has been Director of the International
Macroeconomics Program of CEPR, the leading European network of economists.
His main research areas include nancial crises, European monetary
integration, scal policy and regional monetary integration. He is the co-author
of two leading textbooks ( Macroeconomics and European Economic Integration)
and has published several books. Previously a founding Managing Editor of the
review Economic Policy, he serves on several boards of professional reviews and
European research centers. He is a regular columnist in newspapers ( Financial
Times, Le Monde, Libération, Le Temps, Finanz und Wirtschaft , and Handelsblatt )
and speaks weekly on Radio Suisse Romande.
Currently a member of the Panel of Experts of the European Parliament’s
Economic and Monetary Affairs Committee and of the “Bellagio Group”, Charles
is an occasional consultant to the European Commission, the IMF, the World
Bank, the United Nations, the Asian Development Bank, and the Inter-AmericanDevelopment Bank. He has been a member of the Conseil d’Analyse Economique
which reports to the Prime Minister of France, of the French Finance Minister’s
Commission des Comptes de la Nation and has advised the governments of the
Russian Federation and of Cyprus.
Charles holds degrees in Engineering and Statistics from Paris and a PhD in
Economics from Harvard University.

8/3/2019 Geneva13
http://slidepdf.com/reader/full/geneva13 8/162
8/3/2019 Geneva13
http://slidepdf.com/reader/full/geneva13 9/162
Contents
About the Authors
List of Conference Participants xiii
Acknowledgements
Foreword
Executive Summary 1
1 Introduction and Overview 7
2 The Political Economy o Fiscal Consolidation 152.1 Introduction 15
2.2 The common pool problem of public nances and the 16
budget process
2.3 The budget process: Comprehensiveness and transparency 17
2.4 Results-oriented approaches 21
2.5 Budgeting institutions: Designing the budget process 24
3 The United States: Can the 1990s Fiscal Rebalancing Be 33Repeated?
3.1 Introduction 33
3.2 The deterioration in the scal outlook 34
3.3 Prospects for medium-term scal consolidation 38
3.4 The longer-term outlook: Demographics and health care 41
expenditures3.5 The political economy of reform 43
3.6 Conclusion 45
4 Europe’s Public Debt Challenge 47
4.1 Introduction 47
4.2 The decit bias 48
4.3 The effect of population ageing 49
4.4 Radical change during the crisis 53
4.5 The debt challenge 554.7 Conclusion 63

8/3/2019 Geneva13
http://slidepdf.com/reader/full/geneva13 10/162
5 Japan’s Fiscal Woes 65
5.2 The true state of Japanese nances 65
5.3 Political economy of scal policy in Japan: The common pool 70
is very deep5.4 The budget procedure problem 73
5.5 Budget screenings: An attempt at process improvement 74
5.6 Taming the beast: The arithmetic of scal restructuring 75
5.7 The economics of scal reform 78
5.8 A growth-model approach to scal reform 78
5.9 Prospects for scal reform 81
5.10 Deation and scal reform 82
Appendix: The Tohoku earthquake and scal policy 86
6 Recommendations 896.1 Institutional reforms 90
6.2 European countries 96
6.3 The Eurozone 96
6.4 The United States 98
6.5 Japan 101
6.6 Pro-growth policies 104
6.7 Conclusion 109
Appendix: Examples of successful and unsuccessful institutions 111
Discussion 119

8/3/2019 Geneva13
http://slidepdf.com/reader/full/geneva13 11/162
List o Figures
Figure 3.1 The deterioration of the US budget outlook 35Figure 4.1 Public debt of the US and of the Eurozone 49
Figure 4.2 Change in total population, 2008–2060 50
Figure 4.3 Dependency ratio 51
Figure 4.4 Increase in ageing-related spending between 2007 and 2035 52
Figure 4.5 Debt increases from 2007 to 2011 54
Figure 4.6 Public spending in the OECD: regressing to the mean 61
Figure 4.7 British public debt 63
Figure 5.1 General government balances, by “business line” 69
Figure 5.2 Social spending and revenues, vs. ageing 69
Figure 5.3 Old/young ratios vs. population/seat, by prefecture 72
Figure 5.4 Saving and investment by corporates and households 83
Figure 5.5 Energy supply and demand scenario, 2007–75 87
Figure 6.1 Public debts in The Netherlands and the Eurozone 111
Figure 6.2 Public debt in Switzerland 113
Figure 6.3 Budget decit in the UK 114
Figure 6.4 Gross public debt in France 116
List o TablesTable 3.1 Components of US federal spending 36
Table 3.2 Three projections of the US budget balance 37
Table 4.1 Gross public debts in 2012 55
Table 4.2 Gross public debts in 2035 56
Table 4.3 Debt reductions 58
Table 4.4 Evolution between 1999 and 2006 59
Table 5.1 General account of the central govt., initial budget, FY2008 66
Table 5.2 Accounts of general government, consolidated, FY2008 67Table 5.3 Business line breakdown of government transactions, FY2008 68
Table 5.4 Rough estimate of government transfers for seniors, FY2008 71
Table 5.5 General government scal consolidation scenarios 77
Table 5.6 Macro/scal scenarios in a growth model: values for 2035 80
Table 5.7 Time trend projection of trade and current balances 83
Table 5.8 Interest rate assumptions for simulations 86
Table 6.1 The budget process in European countries 91
Table 6.2 Actual and predicted budgetary institutions 95

8/3/2019 Geneva13
http://slidepdf.com/reader/full/geneva13 12/162
List o Boxes
Box 4.1 Inationary nancing of large debts 62

8/3/2019 Geneva13
http://slidepdf.com/reader/full/geneva13 13/162
List o Conerence Participants
Ivan Adamovich Member of Executive ManagementWegelin & CoGeneva
Filippo Altissimo EconomistBrevan Howard Investment Products Limited
Geneva
Agnès Arlandis Managing Director, Head of Emerging MarketsHSBC Private Bank SuisseGeneva
Vit Barta Advisor to GovernorCzech National BankPrague
Rémy Bersier Member of the Executive BoardBank Julius Baer & Cie SAGeneva
Laurence Boone Chief EconomistBarclays CapitalParis
Pascal Boris Chief Executive Ofcer BNP Paribas (Suisse) SAGeneva
Luigi Buttiglione Head of Global StrategyBrevan Howard Investment Products LimitedGeneva
Mark Carey Senior AdviserFederal Reserve BoradWashington, D.C.
Stephen Cecchetti Economic AdviserBank for International SettlementsBasel
8/3/2019 Geneva13
http://slidepdf.com/reader/full/geneva13 14/162
xiv Public Debts: Nuts, Bolts and Worries
Eric Chaney Chief EconomistAXAParis
Benoît Coeure Deputy Director General, Chief EconomistDirectorate General of the TreasuryParis
Jean-Pierre Danthine Member of the Governing BoardSwiss National BankZürich
Pierre Darier Partner
Lombard Odier Darier Hentsch & CieGeneva
Jacques Delpla EconomistConseil d’Analyse EconomiqueParis
Paul H. Dembinski ProfessorUniversity of Fribourg and L’Observatoire de laFinanceGeneva
Andreas Dombret Member of the Executive Board
Deutsche BundesbankFrankfurt am Main
Christophe Donay Head of Asset Allocation & Macro ResearchPictet & CieGeneva
Christopher Donohue Managing DirectorGlobal Association of Risk ProfessionalsJersey City, N.J.
Bernard Droux Managing PartnerLombard Odier Darier Hentsch & CieGeneva
Robert Feldman Managing DirectorMorgan Stanley MUFG
Daniele Franco Head of DepartmentStructural Economic AnalysisBanca d’Italia

8/3/2019 Geneva13
http://slidepdf.com/reader/full/geneva13 15/162
List of Conference Participants xv
Paolo Garonna General DirectorANIARome
Hans Genberg Assistant DirectorIndependent Evaluation Ofce of the IMFWashington, D.C.
Stefan Gerlach Managing DirectorInstitute for Monetary and Financial StabilityHouse of FinanceGoethe University of FrankfurtFrankfurt
Michel Girardin Member of Senior Management
Union Bancaire PrivéeGeneva
Christos Gortsos Secretary GeneralHellenic Bank AssociationAthens
Anne Heritier Lachat ProfessorChair of the Board of DirectorsFINMABern
Philipp Hildebrand Chairman of the Governing BoardSwiss National BankZürich
Kasumasa Iwata PresidentJapan Center of Economic ResearchTokyo
Thomas Jordan Vice Chairman of the Governing BoardSwiss National Bank
Bern
Christian Kastrop Deputy Director GeneralMinistry of FinanceBerlin
Pierre Keller Former Senior PartnerLombard Odier Darier Hentsch & CieGeneva
Ulrich Kohli Professor of Economics
University of GenevaGeneva

8/3/2019 Geneva13
http://slidepdf.com/reader/full/geneva13 16/162
xvi Public Debts: Nuts, Bolts and Worries
Akira Kohsaka ProfessorSchool of International StudiesKwansei Gakuin University
Hyogo Dino Kos Managing Director
Hamiltonian Associates, LtdNew York
Signe Krogstrup Deputy Head of Monetary Policy AnalysisSwiss National BankZürich
Jean-Pierre Landau Deputy Governor
Banque de FranceParis
Jeffrey Liebman Professor of Public PolicyHarvard UnversityCambridge, M.A.
Henri Louberge ProfessorUniversity of GenevaGeneva
Thierry Malleret PartnerIJ Partners SAGeneva
Michael Manz Head of International Finance and Financial StabilityFederal Department of FinanceBern
Alessandro Missale Professor of EconomicsFaculty of Political ScienceUniversity of Milan
Milan
Maurice Monbaron Member of the BoardCredit Agricole (Suisse) SAGeneva
Trifon Natsis Senior Portfolio ManagerBervan Howard Investment Products LimitedGeneva
Alexander Notter Senior International Adviser
Millenium Associates AGZug

8/3/2019 Geneva13
http://slidepdf.com/reader/full/geneva13 17/162
List of Conference Participants xvii
Lars Nyberg Deputy GovernorSveriges RiksbankStockholm
Sebastian Paris-Horvitz Chief Market StrategistHSBC Private Bank SuisseGeneva
Michel Peytrignet Director, Head Economic AffairsSwiss National BankZürich
Ivan Pictet Former Senior Managing PartnerPictet & Cie
Geneva
Jean Pisani-Ferry DirectorBRUEGELBrussels
Friederike Pohlenz Deputy Head of SectionMultilateral AffairsState Secretariat for International Finance MattersBern
Richard Portes Professor of EconomicsLondon Business SchoolPresident, CEPRLondon
Jan Frederic Qvigstad Deputy GovernorNorges BankOslo
David Ramsden Chief Economic AdvisorHead of Government Economic Service
HM TreasuryLondon
Barbara Roos Team Head and Relationship Manager, InternationalClientsWegelin & Co Private BankersGeneva
Jean-Pierre Roth ChairmanGeneva Cantonal BankGeneva

8/3/2019 Geneva13
http://slidepdf.com/reader/full/geneva13 18/162
xviii Public Debts: Nuts, Bolts and Worries
Amlan Roy Managing DirectorCredit Suisse (Securities) Europe LimitedLondon
Monica Rubiolo Head Macroeconomic SupportSECOBern
Hans-Joerg Rudloff Chairman
Barclays CapitalLondon
Neal Soss Chief EconomistCredit SuisseNew York
Alexander Swoboda Emeritus Professor of EconomicsThe Graduate InstituteGeneva
Jens Thomsen Governor, retiredDanmars NationalbankCopenhagen
Cedric Tille Professor of EconomicsThe Graduate Institute
Geneva
Edwin Truman Senior FellowPeterson Institute for International EconomicsWashington, D.C.
Angel Ubide Director of Global EconomicsTudor Investment CorporationWashington, D.C.
Ignazio Visco Member of the Governing Board and Deputy Director
GeneralBanca d’ItaliaRome
Juergen von Hagen Professor of EconomicsUniversity of BonnBonn
Sushil Wadhwani Chief Executive OfcerWadhwani Asset ManagementLondon

8/3/2019 Geneva13
http://slidepdf.com/reader/full/geneva13 19/162
List of Conference Participants xix
Pawel Wyczanksi Advisor, Financial SystemNational Bank of PolandWarsaw
Charles Wyplosz Professor of International EconomicsThe Graduate InstituteDirectorICMB, GenevaCEPR, London
Fabrizio Zampolli Senior EconomistBank for International SettlementsBasel

8/3/2019 Geneva13
http://slidepdf.com/reader/full/geneva13 20/162
xx
The authors are grateful to the discussants and to the participants at the Geneva
Conference of May 2011, where a preliminary version of the present report was
presented and carefully discussed. Additional comments from Francesco Giavazzi,
and Claire Wakeeld are gratefully acknowledged.
The discussion section has been prepared by Lucie Majstrova and Daniel
Walter. Many thanks as well to Laurence Procter who singlehandedly organized
the conference and performed all of the background work behind this Report.
Finally, the athors are grateful to Anil Shamdasani and Samantha Reid for an
outstanding job at editing and publishing the report, and to Viv Davies and Anil
Shamdasani for support and guidance at various steps of this undertaking.
Acknowledgements

8/3/2019 Geneva13
http://slidepdf.com/reader/full/geneva13 21/162
xxi
The thirteenth Geneva Report on the World Economy examines the scal woes of the
US, the EU and Japan. Each faces serious medium term challenges, but they have
arisen in different ways and admit of no common solution. Faster growth would
help in each case: Japan’s difculties have arisen in part from two decades of
slow growth, and it would be easier to stabilise debt burdens in both the US and
the EU if growth were to pick up. But growth alone won’t resolve the problems.
In Japan, the report argues, the level of social benets paid to older people is far
too high, squeezing out many other forms of government spending as a result.
Reducing these benets is difcult: older people tend to live in rural areas, which
are overrepresented in the Diet. In the US, on the other hand, part of the problem
is insufcient tax revenue, another part of the problem is an inefcient health
system, but the checks and balances built into the US political system have so
far made it impossible to agree on adequate measures. In Europe the problem is
different again: government expenditure has tended to be high in Europe, but
member states have little incentive to balance their books because they think will
be bailed out when difculties arise.
The Geneva reports have never shied away from confronting difcult, apparently
intractable issues. The thirteenth report is no exception. Fiscal policy problems
build up slowly, often over decades, and so there is seldom the sense of urgency
necessary to adopt painful reforms. And these reforms must be sustained over the
long term in order to be effective. Since there is always a political constituency for
lower taxes or higher spending, sustaining painful reforms is what democraciesnd most difcult.
As the authors of the report note, ‘there is no magic formula for successful scal
consolidation’. All the more reason for ICMB and CEPR to welcome the report’s
painstaking and thoughtful analysis, which we are sure will stimulate a lively
debate.
Charles Wyplosz Stephen Yeo
Director, ICMB Chief Executive Ofcer, CEPR
15 September 2011
Foreword

8/3/2019 Geneva13
http://slidepdf.com/reader/full/geneva13 22/162

8/3/2019 Geneva13
http://slidepdf.com/reader/full/geneva13 23/162
1
Executive Summary
This 13th Geneva Report on the World Economy is devoted to scal policy reforms
in the USA, Europe and Japan. It offers a common political-economy framework
to diagnose the need for scal consolidation. It proposes institutional solutions
rooted in that diagnosis.
Even before the global nancial crisis, scal burdens had grown so heavy in
most advanced countries that doubts emerged about scal sustainability. The
global crisis of 2008–10 then severely aggravated scal problems. Ageing of
populations will aggravate them more. Thus, credible plans for medium-term
scal consolidation are an urgent priority.
Political economy ramework or diagnosis
All democracies face the common pool problem that nancing public policies
from general tax funds creates an externality. Those who enjoy the marginal
benet of more spending are not the same as those who bear the marginal cost.
The same argument applies to tax cuts. The result is that lobbies successfully
call for more spending or less taxes, and force the costs on society as a whole.
Those costs will be paid, now or in the future, resulting in lower growth, higher
unemployment, social stress and higher ination.
Improve decision rules
Durable solutions require institutional reform. But different institutions work
best in different political environments. Reforms must be tailored to the politicalenvironment of each country.
Two broad classes of solutions exist. Results-oriented approaches focus on
outcomes. (These include constitutional or legal decit, debt or spending limits
and scal rules specifying (multi)annual spending or decit targets.) Procedural
approaches focus on decision-making processes and take two main forms:
delegation and contracts. Delegation is based on hierarchical structures among
the decision makers; contracts are based on horizontal relationships. Delegation
is appropriate in parliamentary systems with single-party governments, while
contracts is the proper approach for multiparty coalition governments.

8/3/2019 Geneva13
http://slidepdf.com/reader/full/geneva13 24/162
2 Public Debts: Nuts, Bolts and Worries
Similarly, there is no magic formula for successful scal consolidation. Where
the proximate source of the problem is excessive government spending – as has
historically been the case across much of Europe – successful scal consolidation
will have to rely principally on spending cuts. Where the proximate source of the problem is inadequate revenue – as is partly (but only partly) the case in the
United States today – successful scal consolidation will have to involve revenue
increases.
Growth is crucial or scal sustainability
The debt-to-GDP ratio has not just a numerator but also a denominator. The
best way to reduce that ratio is by growing the denominator. This is an issue in
virtually every nation. In the United States, the controversy over the recent debt
ceiling agreement revolved around whether the debt deal would help or hinder
growth. In Europe, sharp cutbacks in public spending in the UK and southern
Europe have depressed growth, and a long-lasting series of increases in tax rates
caused a decade and a half of depressed growth in Germany without solving the
underlying scal problems. In Japan, the exceptionally high debt ratio reects
the economy’s inability to escape from its low-growth trap.
The United States
As a country with a presidential system with frequently divided government,
the United States and its system of checks and balances has a bias toward inertia
that in theory makes it difcult to address scal imbalances. Yet, the US political
system has historically performed quite well in correcting scal imbalances. If
scal imbalances are perceived to threaten the health of the economy, voters will
reward elected ofcials who correct those imbalances. Voters also reward political
leaders whom they perceive as ‘doing what’s right for the country’.
Despite the past success of US institutions, the recent build-up of an
exceptionally large public debt makes it worth considering whether they could be
made stronger. Since the 1980s, the favoured approach to overcoming inertia has
been to negotiate decit reduction packages in multiple stages. First, legislation
is passed establishing multiyear targets for the amount of decit reduction to beachieved and the consequences, typically across-the-board cuts in spending, if
subsequent legislation is not passed to achieve the targets. Then decisions are
made about the specic policies needed to reach the targets. The appeal of this
approach is two-fold. First, by obtaining agreement in two stages, reaching a
consensus is easier. Second, automatic cuts if no agreement is reached raise the
cost to the President and Congress of failing to come to an agreement.
The US political system’s bias towards inaction raises particular challenges for
mandatory spending programmes, such as social insurance programmes (Social
Security retirement benets and Medicare health benets) that are increasing
as a share of GDP. One way to overcome this inertia would be to subject theseprogrammes to annual appropriations. Another way would be to make the

8/3/2019 Geneva13
http://slidepdf.com/reader/full/geneva13 25/162
Executive Summary 3
programmes completely self-nancing and to institute a trigger mechanism to
ensure that spending and revenues remain equal, or to fund them via a dedicated
revenue source like a VAT.
Today, projections are for persistent decits exceeding 6% of GDP. While thereis a broad consensus around the menu of policy changes that could achieve
the necessary scal rebalancing, there is no clear path to the political deal that
will be needed to enact the changes. Three comprehensive proposals for scal
consolidation have recently been released.in the USA with the aim of reducing
the decit to no more than 3% of GDP by 2015 and stabilising the debt to GDP
ratio at around 70%. A compromise limiting tax expenditures appears to be the
most viable approach to a bipartisan agreement.
It is likely that the US political system will be able to make the scal adjustments
necessary to stabilise the debt-to-GDP level during the upcoming decade, but
demography ensures that there will then be further deterioration in the scal
outlook between 2021 and 2035. The challenging scal environment, in other
words, is not going away.
Given that any legislated decit reduction procedure can be negated by
subsequent legislation, it is worth considering whether a serious constitutional
amendment would help overcome inertia in closing scal imbalances. In theory
this would be possible – including provisions to allow for countercyclical
scal policies, designing effective enforcement and allowing for overrides
by a Congressional supermajority. Whether it is in fact possible to design an
amendment of this sort whose benets outweigh the costs of lost economic policy
exibility is an open question. We have seen in the recent debt limit negotiations
that articial attempts to force action can be destabilising. Regardless, no such
amendment is imminent, however, because the process for amending the US
Constitution is difcult.• Between 1979 and 2007, US real GDP per capita increased by a
reasonably healthy 1.9% annual rate. Looking forward, the USA facesfour challenges in sustaining high rates of growth:
• If the current high unemployment rates are allowed to persist for anextended period of time, potential GDP may be permanently lowered.Growth will likely suffer.
• Spending cuts may reduce growth-enhancing government investments
in research and development, infrastructure and education.• Growth rates may be limited if the country’s human capital policies fail
to improve as college completion rates fall and the large US nancialsector attracts too much of the country’s top talent.
• Increasing income inequality could threaten future growth rates.
Europe
Europe’s public debt outlook has deteriorated because of population ageing and
the global economic and nancial crisis. Absent corrective action, public debts
are projected to rise from 59% to 128% GDP by 2035 – and much more for somecountries.

8/3/2019 Geneva13
http://slidepdf.com/reader/full/geneva13 26/162
4 Public Debts: Nuts, Bolts and Worries
In addition to the usual national common pool problem, the Eurozone suffers
from an international common pool problem whereby individual countries may
be led to expect support from others, including through bailouts, as is currently
the case. Alleviating these two common pool problems is therefore in theindividual and collective interest of Eurozone countries.
Europe offers a rich variety of situations that illustrate both successful and
unsuccessful scal consolidations. It also provides a rich body of evidence on the
role of budgetary institutions.
One unsuccessful arrangement is the Stability and Growth Pact. It has not
achieved its aims largely because it is a contract between each country and the
EU (which represents the other countries). Since budget decisions ultimately rest
in the hands of member states, it is local institutions that matter. Currents plans
to strengthen the Pact do not acknowledge this aspect. The alternative, which
implicitly underlies a one-size-ts-all approach, is a transfer of competence from
member states to the EU or, more likely, to the Eurozone. Many in Europe see
this as a bridge too far.
If member states are to retain scal policy sovereignty, the solution must be
rst and foremost sought at the national level. Since one size will not t all,
these solutions cannot be identical. A solution would be for every Eurozone
member country to adopt a combination of rules and institutional arrangements
appropriate to its own political circumstances. This implies the acknowledgment
that the one-size-ts-all approach, which has dominated the scal framework of
the Eurozone so far, is inappropriate.
The European Commission would evaluate existing or planned national
arrangements and approve those that are likely to be effective in dealing with
the decit bias. Countries that fail to pass this requirement, or countries that
breach their own arrangements, would face a serious disadvantage: their debt
instruments would not be accepted as collateral by the European Central Bank.
Growth has also been slow in most Eurozone countries. Closing the gap in
GDP per capita with the US can be a source of higher growth for a number of
years. Early retirement, market-unfriendly regulation, both in labour markets
and in product markets, and large, relatively low-productivity public sectors are
some of the key reasons for Europe’s lacklustre growth performance. They are one
aspect of the common pool problem.
Spending ceilings that imply a reduction of the public sector size maytherefore be useful a complement to debt and decit rules in European countries.
Growth could also be boosted in practice by tax systems and personal bankruptcy
regulations designed to encourage rather than discourage risk taking. Improving
the ability of European nancial markets to provide venture capital and other
forms of nancing for start-ups and the development of new products and
technologies would improve growth in Europe.

8/3/2019 Geneva13
http://slidepdf.com/reader/full/geneva13 27/162
Executive Summary 5
Japan
With the world’s highest ratio of public debt to GDP and a history of two decades
of stagnation, Japan is arguably the most challenging case. In fact, Japan runs
a tight scal ship with one single exception: social benets. Virtually everyother part of government is being starved in order to pay for underfunded social
benets.
This is the result of an especially serious common-pool problem, which is
built into the electoral system in a way that makes scal problems inevitable.
Older voters, who are heavily over-represented in the current system of election
districting, benet while the young pay. This problem will persist until the
electoral system is reformed.
Japan also suffers from the shortcomings of its budgeting procedures. It relies
on a very loose ‘contracts approach’ to reconciling the interests of different
political factions. Unfortunately, Japanese scal contracts are short-term, implicit
and unenforceable. In addition, the budget suffers from a lack of transparency,
which results in the absence of timely data on the true state of nances.
Finally, Japan has been able to nance its scal decits only because net
private saving is very large, and the key reason is deation. Consumers and rms
rationally wish to avoid investments in a deationary economy. The stability of
the government bond market is due in large part to deation.
Solving Japan’s scal problem requires a coordinated package designed to raise
growth, end deation, and cut entitlement spending.
It must start with reform to end the skew in Diet representation towards the
elderly. Because the elderly live more densely in rural areas, redistricting would
have to aim at a one-person-one-vote in both Houses of the Diet by taking about
20 seats away from the most rural districts and adding them to the most urban
ones.
It will have to revive the budget-screening exercise of 2009–10 to keep the
pressure of public scrutiny on spending items. Ex post scrutiny, with sanctions,
must also increase, in order to strengthen incentives for achieving goals within
budget limits. Needed accounting improvements include shifting public sector
accounting to private sector principles and concepts, and shortening of the lags
between the end of a scal accounting period and availability of accounts. Top-
down discipline in setting budget content and execution must also be increased.
The quickest approach would be to revive the Council on Economic and FiscalPolicy (CEFP), which has legal power to set budget priorities but was abandoned.
In healthcare, a binding budget constraint on spending is needed, especially
in light of the sharp increase of the elderly over the next decade. One solution
is to set an upper limit of taxation that supports healthcare. Should the funding
prove inadequate at a given level of spending, then a national vote on raising
the taxation limit would be triggered and a supermajority should be required to
authorise higher taxes.
But scal reconstruction in Japan cannot be viewed as simply a matter of
cutting spending or raising taxes. The best way to lower the debt/GDP ratio is by
raising the denominator. This can be accomplished most effectively by policiesto raise productivity and end deation. Tax reform should be oriented toward

8/3/2019 Geneva13
http://slidepdf.com/reader/full/geneva13 28/162
6 Public Debts: Nuts, Bolts and Worries
enhancing productivity growth by encouraging work and risk-taking. Regarding
deation, the Bank of Japan ought to adopt ination targeting. Its current soft
ination target of 0–2% has no teeth. A shift towards a government-imposed
ination target of 1–3% would help, especially if the Diet should have the optionto replace the management of the Bank should the target be missed.
All in all
Recent discussions of debt sustainability and scal consolidation have been
motivated by crisis: markets are impatient, and time is short. While not denying
the need for immediate measures to address immediate problems, this Report
views the public debt situation from a longer-term perspective. Even if the
immediate scal challenges confronting the advanced countries are successfully
addressed, further challenges will emerge, as populations age and interest rates
rise back toward more normal levels. Rather than remaining permanently in
crisis-management mode, we ask what should be done to create an environment
conducive to bringing public debts to a sustainable level. This Report provides
some proposals.

8/3/2019 Geneva13
http://slidepdf.com/reader/full/geneva13 29/162
7
1 Introduction and Overview
Chronic public-sector decits and soaring debts are among the most pressing
policy challenges facing the advanced economies. Even before the outbreak of the
global nancial crisis, scal burdens had grown heavy and doubts had developed
about scal sustainability in the United States, Japan and Europe’s heavily
indebted countries.1 In some countries like Italy, commentators highlighted
what came to be seen as chronic decit bias. In others like Finland, Sweden and
Japan, decits exploded and debt burdens soared as the result of costly banking
crises.2 In still others like the United States, decits widened as a result of specic
economic policy decisions taken in the course of the last decade.3
Whatever the precise nature of pre-existing problems, they were severely
aggravated, without exception, by the global crisis of 2008–10. The crisis and
the recession that followed cut into tax revenues and led to automatic increases
in spending on, inter alia, unemployment benets. The G20 countries agreed in
early 2009 to a coordinated scal stimulus which, while limiting the severity of
the global recession, widened decits and raised debt burdens still further. The
collapse of property prices and construction activity in the United States, Ireland
and Spain, among other countries, led to banking crises whose costs ultimately
ended up on governments’ balance sheets.
The result has been to bring debt-to-GDP ratios in Europe, the United States
and Japan alarmingly close or, in the cases of Japan and a subset of European
countries, well beyond the critical 90% threshold where Reinhart and Rogoff
(2010) have argued that sovereign creditworthiness and economic growth are
at risk.4 Putting in place a credible plan for scal consolidation is now an urgent
priority for the advanced economies.
The importance of that task becomes that much greater when one considers
the future prospects for entitlement spending and economic growth. Cecchettiet al (2010), writing for the Bank for International Settlements, look several
decades into the future. Extrapolating on the basis of current policy, they paint
a terrifying picture of exploding decits and crushing debts. The implication is
that something that cannot continue indenitely won’t. Current policy will have
to change.
1 For countries like Italy, these concerns go back all the way to the late 1980s: see for example Giavazziand Spaventa (1988) and Dornbusch and Draghi (1990).
2 The contrasting experience subsequently of the Scandinavians on the one hand and Japan on the othershows how important growth is for bringing high debt burdens down – this is one of our themes inwhat follows.
3 This is a reference to the Bush tax cuts of 2001–2, more on which below.4 Whether 90% is a magical threshold has, of course, been questioned (eg Irons and Bevin, 2010), and
we will raise further questions about it below.

8/3/2019 Geneva13
http://slidepdf.com/reader/full/geneva13 30/162
8 Public Debts: Nuts, Bolts and Worries
In this Geneva Report we provide a synthetic view of the scal situation in
the advanced economies and the need for scal consolidation. We provide a
general framework for understanding the sources of decit bias and the obstacles
to consolidation. In addition we present detailed studies of scal problems, theirsources, and potential solutions in the United States, Europe and Japan.
This review and analysis render us sceptical of the indiscriminate application
of rules of thumb for sustainable debt-to-GDP ratios, whether 90% or anything
else. What level of debt is sustainable varies according to country circumstances.
The advanced economies differ in their demographic outlooks, economic growth
prospects, and the current and likely future extent of home bias on the part of
investors. What is a sustainable debt burden and therefore the extent of the scal
consolidation that is needed differ signicantly across them as well.
We are similarly sceptical that there exists a single magic budgetary formula
for successful scal consolidation. Where the proximate source of the problem is
excessive government spending – as has historically been the case across much
of Europe – successful scal consolidation will rely principally on expenditure
cuts (as previous research on the continent has shown – see, inter alia, Alesina et
al, 1998). Attempting to consolidate under these circumstances by raising taxes
is likely to only stie growth and fails to address the root of the problem. But
where the proximate source of the problem is inadequate revenue – as is patently
the case in the United States today – successful scal consolidation will have to
involve revenue increases at least in part. Under these circumstances, attempting
to consolidate through spending cuts alone runs the risk of depressing growth
by cutting essential support for growth-supporting public goods (infrastructure
repair, basic research, education and training). It is unlikely to be sustainable
politically insofar as it entails deep cuts on basic social services likely to give rise
to a political reaction once their effects are felt.
Appropriate institutional arrangements are critically important for the ability
of a country to surmount the obstacles to consolidation. But different institutions
work best in different circumstances, as we emphasise in Chapter 2. There is no
single magic institutional solution for successful scal consolidation. Here, too,
it is important to take national circumstances into account and avoid one-size-
ts-all policy advice.
Throughout, we emphasise that scal policy creates a common pool problem.
Financing public policies from general tax funds creates an externality: thoseindividuals or groups enjoying the marginal benet of an extra dollar spent on
a project are not the same individuals or groups who bear the marginal cost of
funding it. If they fully bore that cost, they would choose the level of spending
that equates the marginal benet and cost of funding. But since the two groups
are not in general the same, those beneting from a policy will tend to ask for
higher levels of spending, since others pay the freight.
One can make precisely the same argument about tax cuts or tax expenditures.
(Logically enough, since tax expenditures are just another form of budgetary
spending.) Those enjoying the marginal benet of a discretionary tax cut (or
of an extra dollar devoted to specic tax expenditures) are not in general thesame individuals or groups who bear the marginal cost of funding it through

8/3/2019 Geneva13
http://slidepdf.com/reader/full/geneva13 31/162
Introduction and Overview 9
the issuance and service of additional debt. This encourages different groups to
lobby for cuts in taxes and increases in tax expenditures from which they benet
without fully internalising that society as a whole will have to pay for them, now
or in the future.It is not an accident that those who benet from public-spending programmes
are not, in general, those who pay for the policy; this pattern follows from the
fact that scal policy is redistributive. But the purpose of addressing the common
pool problem is not to counteract redistributive goals. It is to limit the adverse
consequences of redistributive policies for the overall level of government
spending, decits and debt. It is to prevent the political process from favouring
additional consumption today at the expense of future wealth, the implication
being that there will be less consumption for future generations.
A variety of solutions have been proposed and tried for solving this common
pool problem. These different solutions attack it in different ways, some by
prohibiting or discouraging certain scal outcomes, others by structuring
decision-making processes in ways that strengthen social relative to private costs
and benets.
It is useful to distinguish two broad classes of solutions: results-oriented
approaches focusing on the outcomes of scal decisions, and procedural
approaches focusing on the making of scal decisions. A rst kind of results-
oriented approach is constitutional numerical rules focusing on certain aspects
of the budget. An example is the balanced-budget constraints and debt limits
prevailing in many US states and Canadian and Argentine provinces.5 In practice
there is a fair degree of variation in the structure of these rules. Balanced budget
rules typically apply only to the current budget, the implication being that
borrowing for capital expenditure is not forbidden. Some rules, while obliging
the executive branch of government to present a balanced budget proposal to
the legislature and (in some cases) requiring the legislature to pass a balanced
budget, allow government borrowing ex post . Others require the government to
offset any ex post decit this year with surpluses next year.
A second kind of results-oriented approach is numerical scal rules that specify
annual targets for key budgetary aggregates such as annual government decits,
debts, or spending.6 In contrast to constitutional rules, these numerical targets
can be made conditional on the state of the economy, providing more exibility.
Procedural approaches, in contrast, aim at structuring scal decisions such thatthe common pool externality is internalised by the relevant decision makers. They
encourage decision makers to take a comprehensive view of the costs and benets
of all public policies and their funding. In practice, procedural solutions take two
main forms: delegation and contracts. With delegation, signicant agenda setting
and enforcement powers are given to a central player in the budget process, usually
the nance minister, who is expected to take a comprehensive view of the budget
and to be less bound by the interests of individual constituencies than individual
5 For a discussion of balanced-budget constraints in the United States and other countries and theireffects on scal performance, see von Hagen (1991), Fatas and Mihov (2003), Canova and Pappa
(2005), Kennedy and Robbins (2001), and Kopits (2001).6 For a discussion of general principles and the design of scal rules see Kopits and Symansky (1998) and
Buiter (2003).

8/3/2019 Geneva13
http://slidepdf.com/reader/full/geneva13 32/162
10 Public Debts: Nuts, Bolts and Worries
line ministers. With contracts, the budget process starts with a negotiation of
targets for the main budgetary parameters among all participants and the leaders
of all parties forming in the government; these targets are considered binding
and effectively enforced during the remainder of the budget process. Here, it isthe bargaining process that reveals the common pool externality.
Note that delegation is based on hierarchical structures among decision makers,
while contracts are based on horizontal relationships. Thus, the two approaches
are t for different political settings. But while approaches differ, the underlying
theme is the same. It is that chronic decits and obstacles to scal consolidation
arise when budgetary decisions fail to internalise the relevant externalities. A
further theme, however, is that there is no appropriate one-size-ts-all policy
advice. The same institutional reforms are not appropriate for distinctive national
circumstances. Reforms must be tailored to the environment into which they are
introduced.
One point that applies equally to the United States, Europe and Japan is
that scal consolidation is easier with healthy and robust economic growth.
Historically, most countries that have achieved a signicant reduction in their
debt ratios have done so, at least in part, by growing out of their debt burdens.
Consolidation with growth is easier economically, since the denominator of
the debt/GDP ratio will be rising, and because the revenue side of the revenue-
expenditure equation will be contributing more to the solution of the problem.
It is easier politically, since those making sacrices today can look forward to
higher living standards tomorrow. Fiscal consolidation is easier to bear, in other
words, when it does not imply ‘all pain and no gain’.
It is important therefore that scal consolidation should not be done in a way
that dims the prospects for growth. Spending cuts that fall disproportionately
on education, training and infrastructure, for example, are unlikely therefore to
make for a durable solution.
Chapter 3 discusses scal challenges in the United States in more detail. Ten
years ago, the USA was running federal budget surpluses equal to 2% of GDP, and
projections showed surpluses persisting far into the future. The ratio of debt to
GDP had fallen from 49% in 1993 to 33% in 2000, nearly undoing the increase in
the debt from 26% to 49% that occurred in the 1980s. Today projections are for
persistent decits exceeding 6% of GDP, even after the economy has recovered
from the recent recession. If current policies are continued, there will have beena worsening of the budget balance of more than 8% of GDP over a period of 15
years.
Roughly half of this scal deterioration happened prior to the Great Recession.
Spending had increased because of wars in the Middle East and the homeland
security expenditures introduced in the aftermath of the 11 September 2001
attacks. A new prescription drug programme for the elderly was enacted. At the
same time, revenues were reduced by about 2% of GDP as a result of legislation
passed in 2001 and 2003.
Further scal deterioration is now occurring for two reasons. First, spending
on Medicare, Medicaid and Social Security is projected to grow by 3.5% of GDPas the baby boomers retire. Second, interest on the debt is projected to grow by
8/3/2019 Geneva13
http://slidepdf.com/reader/full/geneva13 33/162
Introduction and Overview 11
almost 3% of GDP, reecting rising debt levels and the resulting higher interest
rates. These rising debt levels are overwhelmingly the result of the direct effects
of the Great Recession – of falling revenues and increased automatic stabiliser
spending on programmes like unemployment insurance. Less than one-sixth of the rise in interest costs can be attributed to the Recovery Act and other stimulus
efforts.
Three comprehensive proposals for scal consolidation have recently been
released in the USA with the aim of reducing the decit to no more than 3% of
GDP by 2015 and stabilising the debt to GDP ratio at around 70%. While there
is a broad consensus around the menu of policy changes that could achieve the
necessary scal rebalancing, there is no clear path to the political deal that will
be needed to enact the changes. It will be very difcult to achieve signicant
savings from retirement and health benets by 2015, and signicant cuts to
discretionary spending are already incorporated into the baseline projections.
Thus, it will almost certainly require additional revenue of approximately 2% of
GDP to achieve the 2015 target. A compromise limiting tax expenditures appears
to be the most viable approach to a bipartisan agreement, as Republicans can
interpret this policy as reducing spending, while Democrats interpret it as raising
revenue.
While we are optimistic that the US political system will be able to make
the scal adjustments necessary to stabilise the debt-to-GDP level during the
upcoming decade, there will then be further deterioration in the scal outlook
between 2021 and 2035. Without policy changes, spending on retirement and
health programmes is projected to increase by another 4% of GDP over that time
frame. The challenging scal environment, in other words, is not going away.
Chapter 4 turns to Europe. Europe’s public debt outlook has deteriorated
because of population ageing and the global economic and nancial crisis. The
crisis raised European public debts by some 25–30% of GDP on average. While
population ageing has not yet seriously impacted current debts, ageing-related
public spending is likely to increase signicantly as a share of GDP in coming
decades. Absent corrective action, public debts are projected to rise from 59% to
128% GDP by 2035 – and much more for some countries.
The acuteness of this problem varies by country. The main determinant of
that variation is pensions, which generally include a pay-as-you-go component
with dened benets. The larger are the PAYGO component and dened benets,the grimmer is the outlook. Public health spending also is expected to rise, but
here the driving force is less demography and more problems of incentives and
technology-related cost increases.
Europe also offers examples of successful debt stabilisation. In most of these
cases (those of Finland, Ireland, Spain, Sweden), debt/GDP ratios fell because
GDP grew faster than debt. This was sometimes possible because the heavily
indebted countries were starting out well inside the technology frontier; they
could grow quickly by catching up. From this point of view, it is a complication
that most if not all European countries have now reached the end of the catch-up
growth process and will have to focus on reducing their public debts or, at least,on ensuring that public debts grow signicantly less fast than GDP, although

8/3/2019 Geneva13
http://slidepdf.com/reader/full/geneva13 34/162
12 Public Debts: Nuts, Bolts and Worries
some countries (Greece, Portugal) could in principle rely on catch-up growth as
part of their debt-stabilisation efforts.
Growth does not explain everything, however. Some countries have achieved
impressive debt reductions despite growing slowly: examples include Belgium,Denmark and the Netherlands. Others, meanwhile, have allowed debts to grow
even faster than GDP; Greece, of course, is the poster child for this problem.
Europe, therefore, offers a rich variety of situations that illustrate both successful
and unsuccessful consolidations. It also provides a rich body of evidence on the
role of budgetary institutions. In both Belgium and the Netherlands, for example,
an independent committee evaluates budget plans before they are adopted. Italy
halted its debt build-up in the 1990s by giving broad agenda-setting powers to
the nance minister.
Achieving scal consolidation where it is most urgently needed will require
European countries to further reform their budget processes. This will require
explicit delegation or the adoption of contracts. The Stability and Growth
Pact, again under revision, aims at strengthening the contractual approach and
providing signicant oversight from the EU. The Euro-plus pact would cover
a wider range of objectives (adding measures of external competitiveness and
putting more focus on the debt ratio) and specify mandatory decit reductions.
In addition, the decision-making process would become more automatic. While,
so far, the Council would vote on a recommendation from the Commission, the
new pact envisions that Commission recommendations would be considered as
adopted unless a qualied majority of Council members oppose it.
The Pact, however, has not achieved its aims since 1999, largely because
the contract is between each country and the EU (which represents the other
countries). Since budget decisions ultimately rest in the hands of member states,
it is local institutions that matter. It is local budgeting procedures that must be
reformed, in other words, in order for hard choices to be made. Consistent with
this fact, we would observe violations of the Pact have been relatively rare in
countries that already have adopted the contracts approach domestically and
had already implemented scal rules in that context.
However, the contractual approach may not work in each and every European
country since, as noted previously, its effectiveness depends on local political
circumstances. It works well in countries where governments are multi-party
coalitions and electoral systems are competitive. In these circumstances scalcontracts are enforced by the threat of breaking up the coalition when individual
partners renege on the commitment to scal consolidation. European examples
include the Netherlands and Sweden.
In contrast, where governments are typically formed by one party or by a
coalition with no viable alternative partners, such enforcement does not work.
In this case the government can decide to walk away from the promise of
consolidation with no consequences for its survival until the next election. An
example of this is Germany, whose violation of the Pact caused the 2005 reforms
that watered down its rules. In such political settings, delegation of signicant
agenda-setting powers to the nance minister is required to strengthen the

8/3/2019 Geneva13
http://slidepdf.com/reader/full/geneva13 35/162
Introduction and Overview 13
commitment to scal consolidation. Other European examples of such settings
include France and the United Kingdom.
The alternative, which implicitly underlies the one-size-ts-all approach, is
a transfer of competence from member states to the EU or, more likely, to theEurozone. While this need not be a complete transfer – it might only concern
the debt path, leaving decisions on spending and taxes (and their size and
composition) at the national level – many in Europe see this as a bridge too far.
Chapter 5 turns nally to Japan. We argue that solving Japan’s scal problem
requires a coordinated package designed to raise growth, end deation, and
cut entitlement spending. The last of these three elements, in particular, will
require comprehensive reform of the electoral system and budgetary procedures
that have resulted in low investment, chronic deation, and overly generous
entitlements over the years.
Our assessment, which may surprise many, is that � Japan runs a tight scal
ship except in the area of social benets. As things now stand, virtually every
other part of government – including defence, education, science and economic
development – is being starved in order to pay for underfunded social benets.
At the same time, Japan has an especially serious common-pool problem. This
problem is built into the electoral system in a way that makes scal problems
inevitable. Specically, older voters are heavily over-represented in the current
system of election districting. Thus it is no surprise that the old benet, while
the young pay. This problem will persist until the electoral system is reformed.
Japan also suffers from the shortcomings of its budgeting procedures. It relies on
a very loose ‘contracts approach’ to reconciling the interests of different political
factions. Japanese contracts are mostly short term, implicit and unenforceable. In
addition, the transparency of budgeting is low and unlikely to rise soon.
Japanese scal policy also suffers from a lack of transparency. The absence of
timely data on the true state of nances stems from multiple sources, among
them:• Incomplete denition of government . The standard presentation gives
only a subset of the central government’s accounts; an accuratepresentation would focus on the ‘general government’ as dened instandard national accounts (ie central government, local government,and social security accounts consolidated).
• Lax accounting standards. The standard presentation is a mixture of operating, transfer, nancing and capital transactions. An accuratepresentation would break the government into ‘business lines’, suchas operations (eg defence, foreign policy, education), social benets(pensions, medical, etc), interest payments, and capital transactions.
• Prevalence of off-budget items. The standard presentation does notinclude the many ‘special accounts’ of the central government, muchless similar accounts at local governments.
• Recourse to supplementary budgets . Japan adopts a ‘supplementary budget’virtually every year. Basing the budget debate on comparison of initialbudget in year t to initial budget in year t – 1 necessarily excludes such
supplementary budgets, and thus distorts the debate.

8/3/2019 Geneva13
http://slidepdf.com/reader/full/geneva13 36/162
14 Public Debts: Nuts, Bolts and Worries
Finally, scal reform plans lack specicity on how much is proposed in terms of
tax hikes and how much in spending cuts. At one extreme, a solution with no
tax hikes would require a cut of overall spending by about 20%. Social spending
would have to fall from ¥104 trillion to ¥82 trillion. At the other extreme, withno spending cuts at all, the consumption tax would have to rise to 24%. One
is reminded of the scal debate in the United States, where competing political
factions similarly deny the need to address the problem simultaneously on both
margins. In addition, the scal debate in Japan contains little mention of how
scal reform plans will impact the economy for either Keynesian or supply-side
reasons.
Even a casual glance at sectoral saving balances shows that Japan has been able
to nance its scal decits only because investment in the household sector has
fallen, while savings in the corporate sector have far outstripped investment. The
net savings of the corporate sector are attributable to deation: rms rationally
wish to avoid investments in a deationary economy. Put another way, the
stability of the government bond market is due in large part to deation.
The way deation ends, however, is critical to the outlook for bond market
stability. If the elasticity of tax revenue to ination is sufciently high compared
to the elasticity of bond yields to ination, then an exit from deation would
lower scal decits, and obviate the need for destabilising bond yield increases.
If not, then a bond market crisis could occur. This makes early progress on scal
consolidation all the more urgent.
Although the particulars of the US, European and Japanese cases are different,
a common analytical framework can be used to understand the challenges they
all face. It is to that framework that we turn next.
8/3/2019 Geneva13
http://slidepdf.com/reader/full/geneva13 37/162
15
2 The Political Economy o FiscalConsolidation
2.1 Introduction
Voters and their elected representatives generally prefer more spending and lower
taxes. Without mechanisms to enforce a budget constraint, these preferences
lead to a tendency toward budget decits. Counteracting this tendency is a
strong preference for a healthy economy. But since the adverse economic effects
of decits are not immediate, voters and their elected representatives tend to give
them less than appropriate weight in their decisions.
In modern democracies, the vast majority of government spending is nanced
from a general tax fund to which all tax payers contribute. This includes
government spending on social programmes that benet individual, albeit large,
groups in society like the elderly or those in need of more health care, and tax
expenditures, that is, tax exemptions or benets targeting certain groups in
society. Because those who benet from a given public policy do not bear the
full burden of funding it, they tend to ask for more spending (or tax benets)
than they would if they did. Economists call this the common pool property of
public nances. This property also concerns the revenue side. Voters would prefer
to receive the benets of public spending, but let others either in the current
generation or future generations pay for those benets.
The discrepancy between private and social benets and costs of individual
public policies is a source of excessive public spending similar to the problem
of the excessive exploitation of common pool resources such as sheries andenvironmental goods.7 The common pool property of public nances leads to
excessive decits and debts.8 As Kontopoulos and Perotti (1999) show empirically,
the tendency to engage in excessive spending and incur excessive decits and
debt increases with the number of decision makers with access to the general
tax fund. Ideological and ethnic divisions or ethno-linguistic and religious
fractionalisation increase the tendency for those on one side of the divide in
question to neglect the tax burden falling on the other side, further aggravating
the common pool problem. Thus, empirical studies showing that such schisms
result in higher spending levels, as well as decits and debts, conrm the
7 See, eg, Hallerberg and Von Hagen (1999) and Hallerberg et al (2009).8 See, eg, Von Hagen and Harden (1995), Milesi-Ferretti (2004), Velasco (1999).

8/3/2019 Geneva13
http://slidepdf.com/reader/full/geneva13 38/162
16 Public Debts: Nuts, Bolts and Worries
importance of the common pool problem (Roubini and Sachs, 1989; Alesina
and Perotti, 1996; Alesina et al, 1997; Annett, 2000). Good governance of public
nances provided by appropriate scal institutions is necessary to reign in these
tendencies and enforce a budget constraint on political actors.Reducing excessive debt burdens and achieving the necessary scal
consolidations present the same problem in reverse. Instead of benets, pain
must be distributed but – again – citizens, even if they favour scal adjustment
in principle, would prefer that others bear the burden of the adjustment. Good
governance and good scal institutions are necessary to make scal consolidations
successful and lasting.
A variety of institutional mechanisms have been proposed for this purpose.
In this chapter, we review and discuss these proposals as well as the empirical
evidence and experience related to them in order to lay the ground for the
subsequent country-specic chapters. We begin, in Section 2.2, with a more
detailed explanation of the common pool problem and the role of the budget
process. In Section 2.3 we then discuss the alternative institutional proposals.
2.2 The common pool problem o public nances and thebudget process
Financing public policies from a general tax fund creates an externality: those
enjoying the marginal benet from an extra dollar spent on a project are not
those bearing the marginal cost of funding it. If they did, they would choose the
level of spending that equates the marginal benet and cost of funding. But since
the two groups are not in general the same, those who benet from a policy tend
to ask for higher levels of spending.
The fact that those who benet are not those who pay for a policy is not
an accident. It follows from the fact that scal policy is generally redistributive,
either within or between generations. The purpose of addressing the common
pool problem is not to counteract redistributive goals. It is to limit the adverse
consequences of the common pool problem for the overall level of government
spending, decits and debt, and for the efciency of resource allocation and
economic growth.
The common pool problem of public nances manifests itself in a numberof ways. The rst concerns the decisions over public spending and taxation at a
given level of government. Representatives of different political constituencies
compete for nancial resources and must reach a decision on the level of taxation
and spending and the distribution of spending over a range of public policies.
The larger is the number of decision makers and constituencies, the more
serious is the common pool problem (Kontopoulos and Perotti, 1999). The more
narrowly individual policies are targeted toward individual constituencies, the
more pervasive the common pool problem becomes. This is the core of all pork-
barrel programmes in modern democracies, where each representative of a local
constituency wants to use general tax revenues to fund programmes benetting

8/3/2019 Geneva13
http://slidepdf.com/reader/full/geneva13 39/162
The Political Economy of Fiscal Consolidation 17
her own electoral district.9 Where constituencies are not dened geographically,
as in many countries with electoral systems based on proportional representation,
cultural, ethnic, and other divides among the population aggravate the common
pool problem, since each constituency pays less attention to the scal burdensfalling on the other.
A second manifestation of the common pool problem occurs when current
government spending can be nanced by borrowing, since this gives today’s
decision makers access to future general tax funds. If decision makers discount
the future more heavily than capital markets, for example because of electoral
uncertainty, the common pool problem leads to excessive decits and levels of
debt.10
A third manifestation concerns the nancial relations between different levels
of government (the central government and state governments in a federation,
or the central government and municipal governments in unitary states). An
important characteristic of these relations is the degree of vertical imbalance,
that is, the ratio of spending at the lower level to the own tax revenue collected
by lower-level units. The greater the degree of vertical imbalance, the more the
sub-central units depend on revenues transferred from the central government.
Such transfers give the lower units the opportunity to spend taxes collected from
citizens in other parts of the federation or country. They distort policy decisions
at the lower level toward excessive spending and toward spending on public
consumption rather than investment. They invite strategic behaviour trying to
extract more transfers from the higher-level government.11 If the lower units can
borrow from banks or capital markets, bailouts of over-indebted jurisdictions are
a particularly pernicious form of vertical transfers.12
A variety of solutions have been proposed, and tried, to contain the
common pool problem. They attack it in different ways, some by prohibiting
or discouraging certain scal outcomes, others by structuring decision-making
processes in ways that strengthen the weight of social relative to private costs and
benets. It is useful to distinguish two broad approaches, one focusing on the
outcomes of scal decisions and one focusing on the institutions governing scal
decisions. We examine these two broad approaches below, after setting some
general requirements for proper budgetary practice.
2.3 The budget process: Comprehensiveness and transparency
In all modern democracies, a multitude of different interest groups and political
constituencies compete for nancial resources drawn from the general tax fund.
The budget process is the constitutional and political framework within which
this competition takes place. In a broad sense, the budgeting process describes
how decisions regarding the use and funding of public resources are made.
9 The classical analysis of this problem is Wyplosz and Krogstrup (2010).
10 See Von Hagen (1996) and Weingast, Shepsle and Johnsen (1981).11 See, eg , Wildasin (1997) and Carreaga and Weingast (2000).12 See Rodden et al (2003) and Von Hagen et al (2000).

8/3/2019 Geneva13
http://slidepdf.com/reader/full/geneva13 40/162
18 Public Debts: Nuts, Bolts and Worries
Budgeting institutions comprise the formal and informal rules and principles
governing the budget process. They divide the budget process into different
steps, determine who does what when, and regulate the ow of information
among the various actors. In doing so, they distribute strategic inuence andcreate or destroy opportunities for collusion and for holding individual agents
accountable for their actions.
2.3.1 Four requent deviations rom comprehensiveness
For budgeting institutions to govern budgetary decisions appropriately, it is
important that all claims on public nancial resources are manifested and
reconciled within the framework of the budget process. That is to say, the
budget process must be comprehensive so that the full set of policy trade-offs are
considered. In actual practice, however, there are ve important deviations from
comprehensiveness. Some of these deviations unambiguously weaken the cause
of effective governance. Others have both advantages and disadvantages.
2.3.1.1 Off-budget funds
The rst is the use of off-budget funds to nance government activities. In some
cases, off-budget funding hides true spending levels from view in a way that
can make it difcult to assess a nation’s comprehensive scal situation. This is
clearly a threat to effective governance.13 In other cases, particularly when off-
budget spending is matched with a dedicated revenue stream, it can be a useful
way to enforce pay-as-you-go discipline on a portion of spending like retirement
benets or transportation spending that might otherwise be particularly
susceptible to the common pool problem. This would require a strict balance of
revenues and spending for the off-budget fund, such that it neither receives nor
pays transfers from or into the general tax fund. Even in the cases in which off-
budget spending is combined with a dedicated revenue stream, it can have the
effect of shielding that component of spending from the trade-offs involved in
the annual appropriations process. Whether this is a good or bad thing will vary
with the type of spending and the effectiveness of the particular country’s annual
appropriations process.
2.3.1.2 Automatic linksThe second deviation from comprehensiveness is to tie expenditures included in
the budget to developments exogenous to the budget process. Prime examples
are the indexation of spending programmes to macroeconomic variables such
as the price level or aggregate nominal income, and ‘open-ended’ spending
appropriations such as the government wage bill and welfare payments based
on entitlements with legally xed parameters. These features shield beneciaries
from the risk associated with short-term economic uctuations, allow present
13 A prime example for the use of off-budget funds comes from the national government in Japan, where
the ordinary budget, the ‘General Account’ makes around 20% of gross total government spending and32–40% of total spending net of transfers between the general and the special accounts (Von Hagen,2006b).

8/3/2019 Geneva13
http://slidepdf.com/reader/full/geneva13 41/162
The Political Economy of Fiscal Consolidation 19
and future beneciaries to make economic decisions that depend on projections
of future benet levels, and streamline the budgeting process by not requiring
complicated benet programmes to be reassessed every year. But with no action-
forcing event to require spending on these categories of programmes to be re-evaluated, they allow tough political decisions to be postponed (Weaver, 1986)
and, as in the case with off-budget account, they shield large classes of spending
from the trade-offs of the annual budgeting process.
2.3.1.3 Mandatory spending laws
The third deviation is inadequate distinction between laws outside the budget
process that create the legal basis for the public policies pursued by the
government and the budget law that authorises actual government expenditures
for these policies. In most modern democracies, legislative processes differ for
the former and the latter type of laws. When ‘mandatory spending laws’ – laws
outside the budget law that make certain government expenditures compulsory
during the scal year – are used, they too circumvent the trade-offs of the annual
spending process. Some spending programmes are sufciently complicated that
they require stand-alone authorisation acts to establish programme parameters.
But except in cases where mandatory funding is justied to protect beneciaries
from risk, the authorisation and appropriation functions should be separated and
the funding for programmes should be set as part of the annual budget process.
A particularly egregious version of making budget decisions outside the budget
process is when politicians attach ‘riders’ or ‘earmarks’ to laws requiring the
government to spend funds on certain projects. This practice can lead to extreme
versions of the common pool problem in which legislation is constructed to
include ‘something for everyone’. This practice also undermines merit-based
allocation of funds by the executive branch, although it is occasionally argued
that legislators may be better able to identify high value spending in their districts
than can a centralised bureaucracy. On the other hand, many political processes
have a strong status quo bias, and it can be necessary to grease the wheel of the
legislative process simply to enact policies with social benets that exceed social
costs. Thus, policies are sometimes advocated that limit log-rolling rather than
eliminate it altogether, for example by capping the fraction of the budget that
can be earmarked.
2.3.1.4 Contingent liabilities
The fourth deviation occurs when the government assumes contingent liabilities
such as guarantees for the liabilities of other public or non-public entities. Implicit
or explicit promises to bail out sub-national governments (as in Germany in
the late 1980s), regional development banks (as in the past in Brazil), nancial
institutions (as in the Savings & Loan debacle of the 1980s in the United States,
and in the recent nancial crisis in the USA and Europe) can suddenly create
large government expenditures outside the ordinary budget. Even more run
of the mill credit market activities such as offering loan guarantees to small
businesses or to support the construction of nuclear power plants can createfuture liabilities. Since government by its very nature serves as social insurance,
8/3/2019 Geneva13
http://slidepdf.com/reader/full/geneva13 42/162
20 Public Debts: Nuts, Bolts and Worries
contingent liabilities cannot be completely avoided, and properly accounting for
them in the budget is difcult. However, their existence and implications for the
government’s nancial position can be brought out by requiring the government
to report on the nancial guarantees it has entered into. In particular, thegovernment should account for explicit guarantees by scoring the expected loss
to the budget up front at the time the contractual guarantee is entered into.14
2.3.1.5 Supplementary budgets
Another aspect of comprehensiveness is that decisions made within the budget
process should be binding throughout the period for which the budget applies.
This requires tight limits on changes in the original budget once that period has
begun. Specically, it means that the use of supplementary budgets should be
limited. Where supplementary budgets during the scal year become the norm,
as in Italy and Belgium in the 1980s and Germany and Japan in the 1990s, one
cannot expect policymakers to take the constraints embedded in the budget
process. Of course, governments need some exibility to adapt spending and
revenues to unforeseen events and developments during the year. However,
such changes should be governed by the same rules and procedures as the initial
budget law.
2.3.2 Transparency
For the budget process to discipline scal policy, it must be transparent.
According to Kopits and Craig (1998), transparency in the budgeting process
‘involves ready access to reliable, comprehensive, timely, understandable and
internationally comparable information on government activities … so that the
electorate and nancial markets can accurately assess the government’s nancial
position and the true costs and benets of government activities…’. Poterba and
Von Hagen (1999) argue that special accounts and the failure to consolidate
all scal activity into a bottom-line measure reduce transparency. Alesina and
Perrotti (1996) include misleading macroeconomic forecasts, new and unfamiliar
policies, and creative accounting as additional factors reducing transparency. The
availability of information linking budgetary gures to the national accounts
is another prerequisite of transparency. More generally, the budget should not
allow policymakers to hide expenditures or use them for purposes other thanthose stated in the executive’s budget proposal and authorised by the legislature.
Another aspect is procedural transparency. Budgeting should be transparent
in the sense that all actors know what they and others are expected to do.
Opaque processes for bargaining and conict resolution promote log-rolling
and reciprocity and obscure the responsibilities of the actors involved. Alt and
Dreyer-Lassen (2006) identify four dimensions of procedural transparency. First
is the number of separate documents in which a given amount of information is
processed; the larger this number, the lower the degree of transparency. Second
is the ability of outsiders to independently verify the data and assumptions in
the budget. Third is a commitment to avoiding opaque and arbitrary language,14 This has been the practice in the United States since the Federal Credit Reform Act of 1990.

8/3/2019 Geneva13
http://slidepdf.com/reader/full/geneva13 43/162
The Political Economy of Fiscal Consolidation 21
including the use of generally accepted accounting standards. Fourth is the
provision of explicit justications of the data and explanations of the assumptions
underlying the budget.15
2.4 Results-oriented approaches
A rst approach to mitigate the common pool problem is to directly limit its
impact on decits and debts. Two main arrangements exist. The rst one
constrains budgetary decisions to t within explicitly stated limits and make
these limits binding by enshrining into high-level legislation, possibly the
Constitution. The second category of arrangement establishes numerical targets,
which need not be limits, to be achieved over various horizons.
2.4.1 Constitutional or legal limits
A rst, prominent kind of results-oriented approach is ex ante numerical rules
focusing on certain aspects of the budget. An example is the balanced-budget
constraints prevailing in most US states and many Canadian and Argentine
provinces.16 In practice there is a fair degree of variation in the structure of
these rules. Balanced budget rules typically apply only to the current budget,
the implication being that borrowing for capital expenditure is not forbidden.
This is often called the ‘Golden Rule’. Some rules oblige the executive branch
of the government to present a balanced budget proposal to the legislature and
(in some cases) the legislature to pass a balanced budget but allow government
borrowing ex post . Others require the government to offset any ex post decit
with surpluses the next year. In some US states, special referenda are required to
authorise government borrowing. In the European Union, member states must
avoid ‘excessive decits’, which is commonly interpreted as keeping their annual
government budget decits below 3% of GDP and their government debts
below 60% of GDP. Germany, Italy, Japan and the Netherlands introduced rules
requiring balanced current budgets after World War II to enhance the credibility
of their macroeconomic stabilisation programmes. Since the late 1990s, the
UK government has been required to balance its current budget on average
over the business cycle. The US federal government operates under a nominaldebt ceiling that limits the dollar amount of debt it can issue. In Switzerland a
constitutional amendment called the debt brake, adopted in 1998, required the
federal government to balance the budget by 2001 and to set annual ceilings
for federal government expenditures afterwards. A similar rule was put into the
German constitution in 2009. It requires a balanced budget from the Federal
Government after 2016 and from the state governments after 2020. Debt brakes as
15 Alt and Dreyer-Lassen operationalise their approach and calculate indexes of transparency thatfacilitate international comparisons.
16 For a discussion of balanced-budget constraints in the USA and other countries and their effects onscal performance, see Von Hagen (1991), Fatas and Mihov (2003), Canova and Pappa (2005), Kennedyand Robbins (2001), and Kopits (2001).

8/3/2019 Geneva13
http://slidepdf.com/reader/full/geneva13 44/162
22 Public Debts: Nuts, Bolts and Worries
a class of scal rule require the government to maintain a balanced budget over
the cycle and provide a legal basis for calculating the latter.
The advantage of such limits is their specicity. They spell out exactly what a
government can and cannot do. But this specicity is also a drawback, insofar as itlimits the exibility with which scal policy can be used to respond to unforeseen
events. Thus, the question of whether or not balanced-budget rules keep states
in the US from responding efciently to revenue and expenditure shocks has
been the subject of considerable debate (eg, Fatas and Mihov, 2003; Canova and
Pappa, 2005). Similarly, the political debate over the EU’s scal framework in the
rst years of European Monetary Union (EMU) focused largely on the question
to what extent it prevents governments from smoothing taxes and expenditures
over the business cycle. This approach may thus have a cost in terms of the
efciency of scal policies and that cost may undermine the credibility of the
rules in question. The experience of EMU suggests that governments will ignore
the limits if they perceive this cost to be very large. Very stringent constitutional
or legal limits may lack credibility precisely because they are so strict. Credibility
requires some exibility to react to unexpected developments. However, too
much exibility obviously implies that the rule no longer effectively constrains
political agents. It follows that constitutional and legal limits on decits and debt
embody a trade-off between effectiveness and credibility.
One way of addressing this issue is by conditioning what governments are
allowed to do on the state of the economy. The need to balance the budget
might be stated in terms of the cyclically adjusted budget decit rather than the
actual decit, or a decit or spending limit might be stated as a ratio of potential
rather than actual GDP. Such contingent limits would require smaller decits
and spending during cyclical upswings while allowing larger decits and more
spending in downswings, in this way allowing for the operation of the automatic
stabilisers built into the tax and transfer system. This approach may be subject to
credibility problems of its own, however, since the cyclical component of GDP
and government spending and revenues is not easily determined in real time,
when scal policy decisions have to be made.17
The attractiveness of constitutional or legal limits stems from their simplicity.
Once the limit is in place, it is straightforward to measure the government’s
performance against it, or so it is argued.18 Empirical evidence suggests, however,
that the effectiveness of such limits is often questionable. For example, US stategovernments subject to stringent numerical debt limits tend to borrow using
debt instruments not covered by the legal rule, resulting in no discernible impact
on total debt (Strauch, 1998; Von Hagen, 1991). Kiewiet and Szakaly (1996) nd
that state governments subject to more restrictive borrowing constraints tend to
substitute municipal for state debt. Fatas et al (2003) nd that the decit limits
of the EMU did not constrain decits in the large member states. Von Hagen
and Wolff (2006) show that the member states of the EMU have regularly used
17 For example, Mills and Quinet (2002) report OECD estimates of the output gap in France for 1995. The1995 estimate was below –3.0%, while the 1999 estimate was –0.5%.
18 Historically, in fact, such approaches were often imposed by voters responding to scal crises and risingtakes that were perceived to be the result of the proigacy of their political representatives. See, eg,Eichengreen and Von Hagen (1996), Millar (1997), and Alm and Skidmore (1999).

8/3/2019 Geneva13
http://slidepdf.com/reader/full/geneva13 45/162
The Political Economy of Fiscal Consolidation 23
creative accounting to circumvent the 3% decit limit. The European public debt
crisis started in 2009 with the revelation that the Greek government had used
creative accounting massively to hide decits far in excess of what was deemed
allowable. In US states, constitutional expenditure limits tend to shift spendingfrom the (constrained) current budget to the (unconstrained) capital budget
(Strauch, 1998). Rueben (1997) and Shadbegian (1996) nd no signicant effect
of tax and expenditure limits on the level of spending in a cross-section of US
states. In sum, the nding of all this research is that the effectiveness of results-
oriented approaches is limited because rules can be circumvented.
2.4.2 Fiscal rules
Fiscal rules specify numerical targets for key budgetary aggregates such as annual
government decits, debts or spending.19 Typically the goal of such rules is to
improve scal discipline and reduce government decits and debts.
The Fiscal Consolidation Agreement adopted in Japan in 1981 is an early
example: it set annual targets for the growth of major spending aggregates; for
details see below. In 1996, the Japanese government then adopted a new rule – its
so-called Fiscal Restructuring Targets – and in 1997 the Fiscal Structural Reform
Act set annual spending targets for several years.
The US Congress adopted a scal rule in the Balanced Budget and Emergency
Decit Control Act (Gramm-Rudman-Hollings Act I) of 1985, establishing
numerical targets for the federal budget decit for every scal year through
1991. These targets were later revised and extended by the Balanced Budget and
Emergency Decit Control Reafrmation Act of 1987 (Gramm-Rudman-Hollings
Act II), which effectively postponed the goal of balancing the budget to 1993. The
Budget Enforcement Act of 1990 then eliminated the decit targets and replaced
them by nominal ceilings on annual discretionary spending. At the same time it
introduced a number of reforms of the annual budget process to strengthen the
enforcement of the targets (Peach, 2001).
In Europe, the Stability and Growth Pact (SGP) introduced the concept of
scal rules at the national level. The SGP requires governments to submit annual
Stability Programmes to the European Commission, in which they set targets
for the main budgetary aggregates for the current and the following two years
and explain how they intend to reach the targets in question. The targets mustbe consistent with the medium-term budgetary objective of keeping the budget
close to balance or in surplus.
The government of Canada enacted scal rules for 1991–2 to 1995–6 under
the Federal Spending Control Act (Kennedy and Robbins, 2001). These targets
limited annual spending under all federal programmes except those that are self-
nancing. In New Zealand the Fiscal Responsibility Act of 1994 set out principles
of prudent scal management promoting accountability and long-term scal
planning. Although the Act does not require this explicitly, New Zealand
governments have dened specic numerical targets for public debt under the
19 For a discussion of general principles and the design of scal rules see Kopits and Symansky (1998) andBuiter (2003).

8/3/2019 Geneva13
http://slidepdf.com/reader/full/geneva13 46/162
24 Public Debts: Nuts, Bolts and Worries
new scal regime. Similarly, the Australian government has operated under self-
imposed targets for net public debt since 1998 (Kennedy and Robbins, 2001;
Hemming and Kell, 2001). The Convergence, Stability, Growth and Solidarity Pact
adopted by the member countries of the West African Economic and MonetaryUnion also contains numerical limits for scal aggregates.20
The effectiveness of scal rules for keeping government decits and debts
in check is questionable for much the same reasons as the effectiveness of
constitutional or legal limits on decits or debts. Neither in the USA nor in
Japan (Von Hagen, 2006b) did the governments stick to the rules consistently. In
Canada, Australia and New Zealand, the scal rules seem to have been adopted
only after the start of and the rst successes of scal consolidation programmes.
In these countries, the rules may have served more as a signalling device to
demonstrate the governments’ commitment to scal consolidation to nancial
markets than as a constraint on budgetary policies.
In Europe, the rules of the SGP have contributed little to scal discipline
on average in the EU or the Eurozone. At a closer look, it turns out that the
performance of individual countries has been very different since the introduction
of the SGP. Some countries consistently violated the limits set by the SGP and
the annual scal targets they dened under their annual Stability Programmes.
These include in particular Germany, Italy and France. Other countries showed
consistent commitment to the limits and annual targets. As Hallerberg et al
(2009) show, the latter group consists of those countries that had already adopted
a practice of setting multiannual scal targets as part of their budget institutions
(see below). Von Hagen (2006b) shows that there is a strong correlation between
the commitment to the SGP rules and the commitment to a budget process
of the contract type that focuses on numerical targets for the main budgetary
parameters. Thus, the European experience suggests that an internationally
imposed scal rule requires a strong anchoring in domestic budgetary institutions
to be effective. This observation leads us to the role of budgeting institutions.
2.5 Budgeting institutions: Designing the budget process
The institutional design of the budget process aims at structuring scal decisions
such that the common pool is internalised by the relevant decision makers tothe greatest possible extent. To this end, it aims at inducing decision makers to
take a comprehensive view of the costs and benets of all public policies and
their funding. In practice, institutional design takes two main forms: delegation
and contracts. Delegation is based on hierarchical structures among the decision
makers, contracts are based on horizontal relationships.
20 See Kennedy and Robbins (2001), Emmerson and Frayne (2002), Dore and Masson (2002). Daban et al (2001) provide a description of scal rules in a variety of countries.

8/3/2019 Geneva13
http://slidepdf.com/reader/full/geneva13 47/162
The Political Economy of Fiscal Consolidation 25
2.5.1 Delegation
Under delegation, one key player in the budget process, usually the nance
minister, is vested with strong agenda setting power relative to the other players.
During the initial phase of the budget process, the role of this player is to monitorthe bids of others, negotiate with them directly, and determine their overall
budget allocations. At the legislative stage, the delegation approach assigns
agenda-setting powers to the executive over parliament. An important case in
point is provisions limiting the scope of amendments that parliamentarians can
make to the executive’s budget proposal, for example allowing only amendments
that reduce spending or add new revenue sources. Such restrictions cause the
budget constraint to be felt more powerfully. Furthermore, the executive may
control the voting procedure and force the legislature to vote the entire budget
(or large parts) up or down. It may make the vote on the budget a vote of
condence, which similarly raises the stakes. Where two houses of parliament
exist, the delegation approach limits the budgetary authority of the Upper House
where the executive typically has less control.
At the implementation stage, the delegation approach gives the nance
minister the ability to monitor and control the ow of resources during the
budget period, for example through the authorisation of disbursements and the
imposition of cash limits during the budget period. Effective monitoring and
control are also important to prevent other actors from behaving strategically,
by for example spending their appropriations early in the period and demanding
additional funds later under the threat of curtailing important public services.
2.5.2 Fiscal contracts
Under the contract approach, the budget process starts with a set of binding scal
targets negotiated among ministers. Emphasis here is on the bargaining process
as a mechanism for revealing the externalities involved in budget decisions
and on the binding nature of the targets. Often, these targets are derived from
medium-term scal programmes or coalition agreements. The nance minister’s
role is then to evaluate the consistency of the individual spending bids with
these targets.
At the legislative stage, this approach places less weight on the executive as
agenda setter and more on the legislature as monitor of the implementation of scal targets. The information rights of the legislature are typically more powerful
than under the delegation approach, and parliamentary committees reect the
interests of the spending departments.
At the implementation stage, the contract approach resembles the
delegation approach in emphasising the monitoring and control powers of
the nance minister. However, the contract approach achieves exibility to
react to unforeseen budgetary developments less by giving the nance minister
managerial discretion and more by setting up contingent rules for dealing with
such events. The scal targets negotiated at the initial stage of the budget process
are often backed up by precise prescriptions for how to deal with unexpectedrevenue and expenditure shocks. An example is Belgium’s ‘Golden Hamster’, the
8/3/2019 Geneva13
http://slidepdf.com/reader/full/geneva13 48/162
26 Public Debts: Nuts, Bolts and Worries
rule that any unexpected surpluses in the budget arising from unexpectedly high
revenues or low expenditures must be used to pay down the national debt.
2.5.3 EectivenessThe effectiveness of both approaches to reign in excessive debts and decits
has been demonstrated in what is now a large body of literature.21 Empirical
studies have covered the EU (Von Hagen, 1992; Von Hagen and Harden, 1994b;
Hallerberg et al, 2008 ), EU accession countries (Gleich, 2008; Yläoutinen, 2004),
Asian emerging markets (Lao-Araya, 1997), Latin American countries (Alesina,
Hommes, and Stein, 1997; Eichengreen et al, 1999), and state governments in the
US (Strauch, 1998). The empirical evidence clearly shows that institutions which
induce decision makers to internalise the common pool externality of public
nances have signicant, negative effects on public sector decits and debts.
What does this research say about the recent build-up of large piles of public
debt in Europe? Portugal and Greece are no surprises to this literature, as both have
been consistently shown to be among the countries with the weakest budgetary
institutions in Europe. Ireland comes as a surprise, though, as Ireland has one of
the best-designed budget processes in the EU (Hallerberg et al, 2008). Importantly,
however, the source of the recent surge in debt is different in Ireland compared
to Greece and Portugal. While the latter consistently had problems controlling
their scal ows during the last decade, Ireland did not. Instead, the Irish surge
in debt resulted from the government’s bailout of the country’s largest banks.
The lesson from the Irish – and other European countries’ – recent experience,
therefore, is that the design of budgetary institutions must pay greater attention
to how governments deal with conditional and hidden liabilities.
2.5.4 Institutional choice
What determines the choice between delegation and contracts? While the former
relies on hierarchical structures within the executive and between the executive
and the legislature, the latter builds on a more even distribution of authority
within government. In democratic settings, hierarchical structures typically
prevail within political parties, while relations between parties are horizontal.
This suggests that the key to the institutional choice between the two approacheslies in the number of parties in government.
In parliamentary systems, delegation is an appropriate approach to
centralisation for single-party governments, while contracts is the proper
approach for multiparty coalition governments (Hallerberg and Von Hagen,
1999). There are two reasons for this. First, members of the same political
party are more likely to have similar political views regarding basic spending
priorities. Disagreement will mainly result from the common pool problem –
that is, from the perceived cost of distributive policies. In coalition governments,
in contrast, cabinet members are likely to have more divergent views regarding
the distribution of government spending over different groups of recipients.21 See Hallerberg et al (2009) for an extensive review of this research.

8/3/2019 Geneva13
http://slidepdf.com/reader/full/geneva13 49/162
The Political Economy of Fiscal Consolidation 27
Agreeing on a budget therefore requires compromise between coalition partners.
For a coalition government, delegation of strategic powers to the nance minister
would create a new principal-agent problem, as a strong nance minister might
abuse his or her powers and unduly promote the political interests of his or herown party. Thus, governments formed by two or more parties are more likely to
opt for the contracts approach.
Second, delegation and contracts rely on different enforcement mechanisms.
In one-party governments, the ultimate punishment for a spending minister
reneging on the budget agreement is dismissal from ofce. This punishment is
heavy for the individual minister who overspends but light for the government
as a whole. It can be used because the prime minister is the strongest cabinet
member in most one-party governments and has the authority to select and
replace cabinet members. In coalition governments, in contrast, punishments
are not easily applied to defecting ministers. The distribution of portfolios is set
by the coalition agreement. The prime minister cannot therefore easily dismiss
intransigent spending ministers from parties other than his or her own, since
doing so would be an intrusion into the internal party affairs of coalition partners.
The most important punishment mechanism in coalition governments is the
threat of dissolving the coalition if a spending minister reneges on the budget
agreement. This punishment is heavy for the entire coalition, since it can cause
the fall of the government. The point is illustrated by the fact that scal targets
are often part of coalition agreements. But the credibility of this enforcement
mechanism hinges on two important factors. The rst is the existence of
alternative coalition partners. If there are other potential partners with whom
the aggrieved party can form a coalition, the threat of leaving the coalition is
clearly more credible than if no potential partner is available. The second factor
is the expected response of the voters, as a coalition may be broken up with the
anticipation of new elections.
These different enforcement mechanisms also explain the different relations
between the executive and the legislature in the legislative phase of the budgeting
process. Single-party governments typically arise in two-party settings such as pre-
1994 New Zealand, the United Kingdom and the United States, where each party
is large and party discipline is low. Although the ruling party enjoys a majority,
the main concern at the legislative stage of the budgeting process is to limit the
scope of defections from budget proposals by individual members who wish todivert government funds to their own electoral districts or personal objectives.
Multiparty coalitions, in contrast, typically arise in settings where parties are
small and homogeneous and where party discipline is strong. In this situation,
defections from the budget agreement are a lesser concern, but each party in
the coalition will want to watch carefully to be sure that the executive sticks to
the coalition agreement. Compared to the contracts approach, the delegation
approach therefore makes the executive a stronger agenda setter in parliament,
while the contracts approach gives greater monitoring powers to the legislature.
Finally, the commitment to scal targets embedded in the contracts approach is
not credible for one-party governments. Consider a single-party government witha weak prime minister and weak nance minister. Assume that this government

8/3/2019 Geneva13
http://slidepdf.com/reader/full/geneva13 50/162
28 Public Debts: Nuts, Bolts and Worries
announces a set of scal targets at the outset of the budgeting process and that
spending ministers then renege on the agreement during the implementation
phase. Other cabinet members cannot credibly threaten defectors with dissolving
the government, since this would amount to punishing themselves. Absent acredible threat, the cabinet would just walk away from the initial agreement.
In sum, the contracts approach is more effective in countries where coalition
governments are the norm and the elections are competitive, while the delegation
approach is more likely to be found in countries where governments are formed by
a single party or the electoral process is not competitive. Coalition governments
are the norm under electoral regimes of proportional representation, which
allow even small parties to gain seats in the legislature. In contrast, single-party
majority governments are the norm under majoritarian electoral regimes, which
favour the emergence of a small number of large parties. Empirical research
conrms this conjecture (Hallerberg et al, 2008 ).
The reliance of the contracts approach on scal targets bears a close
resemblance to the use of scal rules as discussed above. This is particularly true if
the annual scal targets are derived from multiannual scal agreements. Indeed,
the experience with scal rules in the EU has shown that governments following
the contracts approach have applied the rules-based scal framework of the SGP
more consistently and stringently than governments relying on the delegation
approach. This suggests that the effectiveness of scal rules depends strongly on
the internal organisation of a country’s government. Such rules should not be
expected to work independently of the institutional design of the budget process.
The above reasoning applies to European-style parliamentary democracies.
Presidential democracies like the US differ in that presidents do not rely directly
on the legislature for their position. Voters can support a president from one party
while denying that party a majority in the legislature. Coordination of budgetary
decisions between the executive and legislative branches is more difcult for
obvious reasons when the president and the majority are from different parties.
The role of the executive in the budgeting process is not that different in
presidential and parliamentary systems. In presidential systems, the structure
of administration lends itself more to delegation. The relationship between the
executive and legislature, however, is more difcult in that the two are conceived
to be more equal than in parliamentary governments. Designing the budget
process in presidential systems thus must recognise two institutional dimensions.One is the internal organisation of the legislature, where strong agenda-setting
powers can be created by elevating the position of the speaker and creating a
hierarchical committee structure. The Budget Enforcement Act passed under the
rst Bush administration in the early 1990s, for example, reformed congressional
procedures designed to protect decisions about budgetary parameters negotiated
at the budget summit between the president and the legislature against later
modications.
The second dimension is the relation between the executive and the legislature.
The greater the extent to which the constitution places the two institutions on
an equal footing, the more that budget agreements between the two must rely onscal targets as under the contracts approach.

8/3/2019 Geneva13
http://slidepdf.com/reader/full/geneva13 51/162
The Political Economy of Fiscal Consolidation 29
2.5.5 Fiscal Councils
While the delegation and the contract approach refers to the design of the
budget process within the executive and legislative branches of the government,
recent proposals calling for the creation of scal councils suggest to add anotherplayer to the budget process which is neither part of the executive nor of the
legislature. Such proposals have been made by a number of economists,22 and
some countries have indeed established institutions along these lines.23 For
example, the agreement between the European Commission and the government
of Romania contains language suggesting the creation of an independent scal
council.24 IMF staff have supported the idea in the context of reforming the
Stability and Growth Pact.25 In the UK the Conservative Party has launched the
Ofce for Budget Responsibility as an independent scal policy watchdog.26
Proposals for scal councils cite three justications: improving the transparency
and predictability of the public nances, strengthening the long-term orientation
of scal policy, and overcoming distributional conicts. Wren-Lewis (1996) and
Jonung and Larch (2006) argue that governments have an incentive to bias
economic forecasts and that the uncertainty surrounding economic forecasts
is too large to detect such biases. They propose an independent forecasting
body with a mandate to deliver the medium- and long-term economic forecasts
necessary for formulating a scal policy strategy over the business cycle.27
Annett (2005) and Annett et al (2005) recommend scal councils as part of a
strategy to strengthen the Stability and Growth Pact. Such councils would provide
independent assessments of scal policies, together with the macroeconomic
and scal projections underlying the budget planning process. The fact that they
would report to their national parliaments would strengthen the involvement
of legislatures in the budgeting process and improve parliamentary control over
the executive. Leeper (2009) argues that the effectiveness of discretionary scal
policies depends critically on the public’s expectations of future policies; he
concludes that, as in the case of monetary policy, more predictable future policies
would enhance policy effectiveness. He suggests that independent scal forecasts
could achieve better predictability.
The second justication for scal councils starts from the notion that scal
policy decisions are excessively inuenced by short-sighted political concerns and
inadequately shaped by the need to stay within the government’s intertemporal
budget constraint. Blinder (1997) and Gruen (1997) propose an independentinstitution patterned after the Federal Reserve Board with the authority to set
tax policies. Wyplosz (2005) sees an independent scal council as a solution
22 See, eg, Eichengreen et al (1999), Wyplosz (2002, 2005, 2008), Blinder (1997), Wren-Lewis (2002), Leithand Wren-Lewis (2005); Annett (2005), Khemani (2007), Leeper (2009).
23 See the cases listed below.24 Memorandum of Understanding between the European Community and Romania, signed 6 May 2009,
p. 3, available at http://ec.europa.eu/economy_nance/publications/publication15409_en.pdf 25 eg Annett (2005), Annett et al (2005), Schadler (2005).26 See http://news.bbc.co.uk/2/hi/uk_news/politics/8401517.stm. Debrun et al (2009) provide an overview of
the various proposals.27 In the USA the Congressional Budget Ofce (CBO) performs this role, providing a separate set of
economic projections that are released at approximately the same date as those in the president’sbudget. If the projections in the president’s budget differ too much from those of the CBO, theAdministration incurs a cost in terms of credibility.

8/3/2019 Geneva13
http://slidepdf.com/reader/full/geneva13 52/162
30 Public Debts: Nuts, Bolts and Worries
to the time-inconsistency problem that arises from the tension between the
commitment to long-run scal discipline and the desire to pursue short-run
macroeconomic stability. Arguing in a Latin American context, Eichengreen et
al (1999) and Ter-Minassian (2002) suggest that an independent scal councilcould help countries ameliorate the procyclicality of scal policies in the region.
Alternatively, an independent scal council could focus narrowly on
macroeconomic stabilisation. It could be designed to minimise its interference
with other aspects of scal policy, especially those with prominent distributional
aspects. Wren-Lewis (2002) and Leith and Wren-Lewis (2005) advocate
independent scal councils with a mandate that extends only to the conduct of
countercyclical scal policies and that entails the authority to use a small set of
taxes for that purpose. This would assure that any distributional consequences
of the council’s decisions would be at best temporary.28 Similarly, Gruen (1997)
proposes an independent scal authority with a mandate to balance the
budget over the cycle using a general tax indicator that changes all tax rates
simultaneously while leaving the tax structure to be determined by political
authorities. Ball (1997) advocates an independent scal council with a similar
mandate and the authority to change only income tax rates.
The third approach (Von Hagen and Harden, 1994b; Hausmann et al, 1999;
Fatas et al, 2003; Wyplosz, 2002, 2008) views scal councils as instruments for
achieving a degree of coordination in the decisions of the different actors in the
budget process. In these proposals, the scal council has the authority to set
and enforce annual decit limits to assure the sustainability of public nances.
The important difference between the second and third approach is that, in
the former, the FPC is in charge of macroeconomic stabilisation. In the latter,
in contrast, the scal council is in charge of assuring that scal policy remains
within the intertemporal budget constraint, which is only a necessary condition
for optimal policy. The task of identifying and implementing optimal policy
would then be left to the government.
Two types of actual existing scal councils can be distinguished. One primarily
carries out the function of increasing the transparency of the budget process by
reporting publicly on budgetary developments and commenting on or providing
the economic forecasts underlying the government’s scal plans. Examples are
the Federal Planning Bureau (FPB) in Belgium, the Central Planning Bureau (CPB)
in the Netherlands, the Hungarian Fiscal Council (which was recently dissolvedby the national government), the Slovenian Fiscal Council, and the Swedish
Fiscal Council.
The second type of scal council is those that possess real decision-making
power in the budget process. These include the Public Debt Committee in Austria,
the High Council of Finances (HCF) in Belgium, the Australian Loan Council, the
Indian Finance Committee, and the Nigerian Fiscal Responsibility Commission.
These councils are typically staffed with politicians representing the central
and state governments, whereas the members of the rst group are typically
28 Leith and Wren-Lewis (2005) argue that this might be politically acceptable in light of the fact that theuse of short-term interest rates in the conduct of monetary policy by an independent central bank hasdistributional consequences too.

8/3/2019 Geneva13
http://slidepdf.com/reader/full/geneva13 53/162
The Political Economy of Fiscal Consolidation 31
independent experts. The task of the second type revolves around setting limits
onto the spending and borrowing of subnational governments.
So far, there is no systematic research concerning the effectiveness of scal
councils, yet. Jonung and Larch (2006) suggest that scal councils that serve toincrease transparency lead to better quality scal and economic forecasts used in
the national budget processes. Anecdotal evidence suggests that scal councils in
Belgium and India had some positive effect on scal discipline. Apart from that,
however, the data are still too scant to identify a signicant contribution of scal
councils to scal discipline.

8/3/2019 Geneva13
http://slidepdf.com/reader/full/geneva13 54/162

8/3/2019 Geneva13
http://slidepdf.com/reader/full/geneva13 55/162
33
3 The United States: Can the1990s Fiscal Rebalancing BeRepeated?
3.1 Introduction
For more than 35 years, it has been evident that the 2011–20 period would be
one of scal stress in the United States as the baby-boom generation retired. The
US government has been making 75-year projections of its health and retirement
programmes for many years, and as early as 1974, these projections showed
spending increases similar to the ones that are in fact occurring.29
In 1983, the US government instituted policy changes to prepare for this scal
challenge, setting revenue levels for its main retirement and disability insurance
programme signicantly above spending levels – with the explicit purpose
of reaching our current point in history with a lower debt-to-GDP level than
would otherwise have occurred. Facing large decits in the early 1990s, the US
adopted a formal ‘pay-as-you-go’ policy to prevent further scal deterioration in
advance of the retirement of the baby boomers. This policy required that any
tax cuts or permanent new spending be offset so as to be decit neutral or decit
reducing. When budget surpluses emerged in the late 1990s, President Clinton
articulated a ‘save Social Security rst’ policy of dedicating the budget surpluses
to debt reduction in advance of the baby boomer’s retirement. The US House of
Representatives endorsed this general approach in 2000, voting 381–3 to use the
portion of the budget surplus attributable to Old-Age, Survivors, and DisabilityInsurance (OASDI) and Medicare for debt reduction. Between 1993 and 2001
federal debt as a share of GDP fell from 49% to 33%.30
29 Detailed 75-year projections of the Old-Age, Survivors, and Disability Insurance programme areavailable beginning in the 1960s, though projections for the year 2050 were already being made in the1950s. The 75-year projections for the Medicare Hospital Insurance Trust Fund began in 1983.
30 US budget policy discussions tend to focus on federal government debt (central government debt), asstate and local debt is determined by the decentralised decisions of hundreds of jurisdictions. Overthe past 30 years, state and local government debt has uctuated in a narrow range of 12% to 18% of GDP and thus changes in state and local debt have not been of macroeconomic signicance. But incomparing US debt levels to gross government debt numbers from other countries, it is necessary to
add about 15% of GDP to the federal numbers discussed in this chapter. Like the federal government,state and local governments have made pension and health care promises that cannot be met withoutnew revenues or reductions in other spending.

8/3/2019 Geneva13
http://slidepdf.com/reader/full/geneva13 56/162
34 Public Debts: Nuts, Bolts and Worries
The US commitment to preparing for the retirement challenge dissolved
during the 2001–7 period as the pay-as-you-go law was permitted to lapse in FY
2002. Tax cuts of roughly 2% of GDP were enacted without offsetting spending
reductions. A signicant new social insurance programme, subsidising thepurchase of prescription drugs for the elderly and costing approximately 0.4%
of GDP, was introduced, also without offsetting nancing. In addition, spending
increased for the security and war-ghting expenses of the post 9/11 period, with
no new revenue collected for this purpose. In total, the scal balance worsened
by about 4% of GDP, from surpluses that averaged 1.7% of GDP from 1999 to
2001 to decits averaging 2.5% of GDP during the post-9/11, pre-recession years
of 2003–2007.
Today rising health and retirement costs associated with the ageing of the baby
boomers and rising interest costs attributable largely to the direct scal impact
of the deep recession are leading to further deterioration of the scal outlook.
Projections are for persistent decits exceeding 6% of GDP in the coming decade,
even after the economy has recovered from the 2007–9 recession. Policy debates
are focused on how to reduce the decit to 3% of GDP over the medium term so
that the ratio of debt to GDP can stabilise at roughly 70%. While there is a broad
consensus around the menu of policy changes that could achieve the necessary
scal rebalancing, there is no clear path to the political deal that will be necessary
to enact the changes.
This chapter begins by reviewing the deterioration in the US scal outlook
over the 2000 to 2011 period. Next it discusses the outlook for stabilising the
debt-to-GDP ratio over the coming decade, and then turns to longer-term issues.
It concludes with a discussion of the political economy of scal consolidation in
the US.
3.2 The deterioration in the scal outlook
Ten years ago, the US was running federal budget surpluses equal to 2% of GDP,
and projections showed surpluses persisting far into the future. Debt-to-GDP had
fallen from 49% in 1993 to 33% in 2000, nearly undoing the increase in the debt
from 26% to 49% that had occurred during the presidencies of Ronald Reagan
and George H.W. Bush. Policymakers were actively debating the implicationsof the US paying down all of its publicly held debt, raising questions such as
whether nancial markets could tolerate a world without US Treasury bonds and
whether the US government should use surpluses to acquire private sector assets
so that it could continue to issue debt to the public.31
Today, projections are for persistent decits exceeding 6% of GDP, even after
the economy has recovered from the 2007–9 recession. Figure 3.1 shows the
Congressional Budget Ofce’s 10-year budget projections made in January 2001,
the actual path of the decit during that decade, and a projection for decits in
31 For a discussion of the 1990s emergence of budget surpluses see Elmendorf et al (2002).

8/3/2019 Geneva13
http://slidepdf.com/reader/full/geneva13 57/162
The United States: Can the 1990s Fiscal Rebalancing Be Repeated? 35
the coming decade if current policies are continued.32 The gure reveals that if
current policies are continued, there will have been a worsening of the budget
balance of more than 8% of GDP over a period of 15 years.
Table 3.1 shows that roughly half of the scal deterioration happened prior to
the recession. Discretionary outlays increased by 1.3% of GDP between 1999-
2001 and the pre-recession years of 2003–7 primarily because of spending
associated with the wars in the Middle East and the increased homeland security
expenditures in the aftermath of the 11 September 2001 attacks. Mandatory
spending rose by almost 1% of GDP as a new prescription drug programme for the
elderly was enacted, health expenditures continued to rise, and refundable tax
credits (scored as outlays) were expanded. Neither the security spending nor thenew drug programme was accompanied with any signicant offsetting spending
cuts or revenue increases. Moreover, revenues were reduced by about 2% of GDP
via legislation passed in 2001 and 2003. This tax legislation reduced marginal
tax rates at all income levels, reduced the preferential tax rates that apply to
dividends and capital gains, and expanded middle-class tax expenditures such as
child tax credits. The weaker than expected economic performance of this period
also contributed to the 2.7% decline in revenue as a share of GDP. To a large
32 The projections for the coming decade assume that the 2001/2003 tax cuts are made permanent, otherexpiring tax provisions are extended, the Alternative Minimum Tax is indexed for ination, and thescheduled 20% cut in Medicare payments to physicians does not occur.
Figure 3.1 The deterioration o the US budget outlook
Source: CBO (2001) and CBO(2011).
Notes: Projection assumes that the 2001/2003 tax cuts are made permanent, other expiring tax provisions
are extended, the AMT continues to be indexed for ination, and the scheduled 20 percent cuts in Medicarepayments to doctors do not occur.
-12
-10
-8
-6
-4
-2
0
2
4
6
8
1 9 9 9
2 0 0 0
2 0 0 1
2 0 0 2
2 0 0 3
2 0 0 4
2 0 0 5
2 0 0 6
2 0 0 7
2 0 0 8
2 0 0 9
2 0 1 0
2 0 1 1
2 0 1 2
2 0 1 3
2 0 1 4
2 0 1 5
2 0 1 6
2 0 1 7
2 0 1 8
2 0 1 9
2 0 2 0
2 0 2 1
F e d e r a l b u d g e t b a l a n c e ( %
o f G D P )
2001 CBO projection Actual 2011 CBO projection (modified)

8/3/2019 Geneva13
http://slidepdf.com/reader/full/geneva13 58/162
36 Public Debts: Nuts, Bolts and Worries
extent, the scal deterioration of this period was a replay of the incompatible
security spending and tax-cutting policies of the Reagan years.
Table 3.1 Components o US ederal spending (share o GDP)
1999-2001 2003-2007 2021
Social security, Medicare, andMedicaid
7.5 8.0 11.5
Interest 2.3 1.5 4.4
Discretionary spending 6.3 7.6 6.7
Other mandatory 2.3 2.6 2.8
Total outlays 18.3 19.8 25.4
Revenues 20.0 17.3 18.4
Surplus 1.7 -2.5 -7.0
Unemployment rate 4.3 5.2 5.2
Source: Congressional Budget Ofce (2011) with baseline modied to extend current tax and Medicarepolicies.
Before turning to the further deterioration that is projected for the coming
decade, it is necessary to discuss the several alternate budget projections that
are available for the US. The most widely used projections are those of the non-
partisan Congressional Budget Ofce (CBO), an independent budget agency
established by Congress in 1974. The CBO is required to make its projections
based upon ‘current law’. In particular, if a tax cut or spending programme is
scheduled to expire, the CBO assumes in its projections that the policy will
indeed expire. This convention has enabled policymakers to mask the true out-
year decit impact of policies by scheduling policies to expire even though they
are intended to be permanent. The 2001/2003 tax cuts were scheduled to expire
after 10 years for this reason. A large set of business tax preferences expire and
are renewed annually, masking their out-year impact on the decit. In addition,
Congress annually indexes the income-thresholds for the alternate minimum tax
for ination, but only for one year at a time, which again obscures the out-year
decit impact. Finally, Congress has legislated a 20% reduction in payments to
doctors under Medicare. Every year this cut is undone for the current year only –allowing Congress to spend money without showing the out-year decit impact.
Table 3.2 shows three sets of budget projections for the next decade. The rst
row contains the ofcial CBO baseline projection which includes the effects of the
budget gimmicks described above. Under these unrealistic assumptions, decits
in the second half of the decade level off at approximately 3% of GDP and the
debt-to-GDP ratio is stabilised. The second row adjusts the CBO projections to
extend current tax and Medicare policies, producing current policy projections
similar to those that Auerbach et al (2003, 2006) have produced in the past.
Under these ‘current policy’ assumptions, decits in the second half of the
decade average 6.6% of GDP. The nal row shows decits under the President’sFebruary 2011 budget proposal. This projection shows decits of around 3% of

8/3/2019 Geneva13
http://slidepdf.com/reader/full/geneva13 59/162
The United States: Can the 1990s Fiscal Rebalancing Be Repeated? 37
GDP in the second half of the decade. The Administration’s projections start from
a baseline that is about 1% of GDP more favourable than the CBO projections,
largely due to different assumptions about labour force growth and interest rates.
As is discussed below, the Administration’s projections also incorporate about 2%of GDP worth of specic decit reduction measures relative to the current policy
baseline.
Table 3.2 Three projections o the US budget balance
2001 2012 2013 2014 2015 2016 2017 2018 2019 2020 2021
CBO January2011 baseline
-9.8 -7.0 -4.3 -3.1 -3.0 -3.4 -3.1 -2.9 -3.2 -3.2 -3.2
CBO January2011 adjusted
-9.8 -7.2 -6.3 -6.0 -6.1 -6.6 -6.3 -6.3 -6.7 -6.9 -7.0
President'sFebruary 2011budget
-10.9 -7.0 -4.6 -3.6 -3.2 -3.3 -3.0 -2.9 -3.0 -3.1 -3.1
Returning to Table 3.1, we see that the deterioration in the ‘current policy’ budget
outlook from the pre-recession period has two components. First, spending on
the big social insurance programmes, Medicare, Medicaid, and Social Security, is
projected to grow by 3.5% of GDP over this period as the baby boomers retire.
Second, interest on the debt is projected to grow by almost 3% of GDP, reecting
rising debt levels and the resulting higher interest rates. These rising debt levels
are overwhelmingly the result of the direct effects of the recession – of falling
revenues and increased automatic stabiliser spending on programmes like
unemployment insurance. Less than one-sixth of the rise in interest costs can be
attributed to the Recovery Act and other stimulus efforts.33
Much of the budget debate in Washington this year has been focused on
setting a level for the 30% of spending that is appropriated annually – so-
called discretionary spending. Table 3.1 shows that under CBO projections,
this component of spending is projected to fall from 7.6% of GDP in the pre-
recession years to 6.7% of GDP in 2021. In his budget, the President proposed
freezing non-security discretionary spending at its 2010 nominal level for ve
years and to allowing it to grow with ination thereafter. This, along with timelywithdrawals of troops from Afghanistan, would result in overall discretionary
spending in 2021 of approximately 6.0% of GDP. Congressional Republicans
have been arguing for further reductions in non-security discretionary spending
beyond what the President has proposed. Republicans largely achieved these
objectives in the recent debt limit agreement which set caps on discretionary
spending that would reduce such spending to about 5.5% of GDP by 2021, not
33 There are two reasons why the stimulus policies have had only a negligible impact on the budgetoutlook. First, they were much smaller than the direct scal impact of the recession. The direct effectsof the recession raised the decit from about 2% of GDP to about 8% of GDP. The stimulus programmes
raised decits by another 2% of GDP to 10%. Second, the duration of the stimulus programmes waslimited. In contrast, the direct scal effects of the recession started earlier and will continue to persistuntil the economy returns to full employment.

8/3/2019 Geneva13
http://slidepdf.com/reader/full/geneva13 60/162
38 Public Debts: Nuts, Bolts and Worries
counting any spending for operations in Afghanistan and Iraq that may still be
necessary at the end of the decade.
3.3 Prospects or medium-term scal consolidation
In his February 2010 budget submission, President Obama set a medium-term
scal target of bringing the primary (non-interest) budget into balance by 2015,
thereby stabilising the debt to GDP ratio at ‘an acceptable level once the economy
recovers’. This target implies reducing the decit to approximately 3% of GDP
and, with nominal GDP growth projected to average 4.4% in the second half of
the decade, stabilising the ratio of debt to GDP at approximately 70%.
The President’s February 2010 budget made specic policy proposals to reduce
the decit to approximately 4% of GDP by 2015 and established a bipartisan
National Commission on Fiscal Responsibility and Reform charged with
completing the job of identifying the policies necessary to stabilise the debt to
GDP ratio by 2015 and with examining ‘policies to meaningfully improve the
long-run scal outlook’ (Ofce of Management and Budget, 2010). In December
2010, 11 of the 17 members of the scal commission, including ve Democrats,
ve Republicans, and one independent voted to approve the commission report
(National Commission on Fiscal Responsibility and Reform, 2010). This vote
tally was smaller than the 14 votes necessary to trigger a vote on the proposal
by Congress. Another bipartisan group of scal experts released a separate set of
recommendations in November 2010 (Debt Reduction Task Force, 2010). The
President’s February 2011 budget contains specic proposals that would reduce
the decit to 3.2% of GDP by 2015. Thus, there are now three comprehensive
plans for achieving scal sustainability. These plans illustrate both the menu of
options available for achieving a scal rebalancing as well as the challenges that
will make it difcult to enact the necessary reforms.34
The plans of both the Fiscal Commission and the Bipartisan Policy Center go
beyond the President’s 3% of GDP target for 2015, reducing the 2015 decit to
2.3 and 1.2% of GDP respectively. Thus these plans propose not only to stabilise
the debt-to-GDP ratio at 70%, but also to put it on a downward trajectory in
the second half of the decade. There is both a substantive reason and a strategic
reason to aim for a 2015 decit target below 3% of GDP. The substantive reasonis that stabilising the debt-to-GDP ratio at 70% would leave the country with
less than the ideal amount of exibility to respond to future economic shocks.
The strategic reason is that in order to make it through the legislative process,
proposals will likely need to become less stringent. Thus a proposal that starts out
by reducing the 2015 decit to 2% of GDP is likely to be enacted as a proposal
34 Two less comprehensive frameworks for decit reduction have recently been released. The rst, fromHouse Republicans, proposed to reduce marginal tax rates for high-income taxpayers and pay for thetax cut with unspecied base broadening. It also proposed deep cuts in discretionary spending andreplacing the current single payer health care system for the elderly with a system in which seniorswould purchase health insurance from private insurance companies using vouchers whose value
would grow at only the economy wide ination rate (signicantly below the historic growth rate of health care costs). The second, a new proposal from President Obama, proposed additional budget cutsbeyond those included in the budget proposal he released in February.

8/3/2019 Geneva13
http://slidepdf.com/reader/full/geneva13 61/162
The United States: Can the 1990s Fiscal Rebalancing Be Repeated? 39
that reduces the decit by an amount closer to 3% of GDP. Put another way, all
three plans contain components that are very unlikely to be enacted.
To see why it will be difcult to enact policies stabilising the decit at 3% of
GDP by 2015, it is helpful to refer once again to Table 3.1. In 2021, about two-thirds of government spending will be for interest costs, Social Security, Medicare
and Medicaid. And these categories of spending are projected to account for more
than 100% of the increase in spending since 2003–7. But the amount of spending
cuts achievable in these categories during the 5 to 10 year horizon for stabilising
debt to GDP is quite limited. Spending on interest costs can be affected only
indirectly. Social Security is often described as the third rail of US politics (‘touch
it and you die’). It is funded with a dedicated revenue stream, and the solvency of
the system is generally judged on a 75-year basis. Social Security reform proposals
almost always phase in benet cuts and tax increases very slowly so as to exempt
current retirees and near-retirees from benet cuts and current workers from
immediate tax increases. Thus, even a scally responsible Social Security reform
that was projected to produce long-run nancial stability for the programme
would likely do little to improve the medium-term scal outlook.
It will similarly be challenging to make a signicant dent in Medicare and
Medicaid spending over the medium term. The 2010 Affordable Care Act (ACA)
included $455 billion in spending reductions in these programmes over the
coming decade. In theory, it would be possible to ‘double down’ on the cost
savings provisions in the ACA, for example, by accelerating some of the payment
reforms that are currently scheduled to be rolled out gradually as pilots. In
practice, Republicans are trying to repeal many of the provisions of the ACA,
and it will be challenging to maintain the cost savings that have already been
legislated, much less to introduce signicantly more aggressive policies to reduce
costs.
The limited role that reducing mandatory spending is likely to play in stabilising
debt to GDP over the medium term can be seen in the three frameworks for scal
consolidation that were described above. The decit reduction achieved by 2015
from reforming Social Security in the two scal commission plans is 0.10 and
0.03% of GDP respectively. The President’s budget does not propose changes to
Social Security, though the President has expressed support for improving Social
Security’s nancial status. On health care, the two commission plans propose
about 0.2% of GDP in heath care related decit reduction. The President’s budgetproposes an even smaller amount. Overall, achievable savings on the mandatory
side of the budget over the coming decade are likely to be around 0.5% of GDP
and even those savings assume reforms to Social Security and increased Medicare
premiums for seniors that have not been politically feasible in the past.
With policy adjustments of approximately 3.5% of GDP necessary to reach
scal sustainability targets and only around 0.5% of GDP of adjustment likely
to come from mandatory spending, the remainder will need to come from
discretionary spending and increases in revenue. As noted above, discretionary
spending is projected in the CBO baseline to decline from the 7.6% of GDP of
the pre-recession years to 6.7% of GDP by 2021. The recent debt limit agreementset caps on discretionary spending that would reduce such spending to about

8/3/2019 Geneva13
http://slidepdf.com/reader/full/geneva13 62/162
40 Public Debts: Nuts, Bolts and Worries
6.2% of GDP by 2021. This number includes 0.7% of GDP worth in spending for
operations in Afghanistan and Iraq that may not be necessary by the end of the
decade.
Whether the cap levels will actually be achieved is unknowable. Theconventional wisdom about the discretionary caps of the 1990s is that when they
were set at ‘reasonable’ levels, Congress and the President abided by the caps. But
when, toward the end of the decade, the caps were set at implausibly low levels,
the appropriations process simply ignored the caps.
Overall, while there are conceivable scenarios in which spending reductions
exceeding 2% of GDP are achieved by the end of the decade, it seems more likely
that the political process will produce savings in the range of 1.0 to 1.5% of GDP.
Moreover, the savings achieved by 2015 are likely to be toward the low end of
this range. This observation implies that additional revenue of at least 2% of GDP
will be needed by 2015 to stabilise the decit at 3% of GDP.
There are three main approaches to raising revenue that are currently receiving
signicant attention in the US, all of which could raise 2% of GDP in additional
revenue. The rst approach is to let the 2001/2003 tax cuts expire as scheduled
in 2012. Doing so would raise roughly 2% of GDP in new revenues and has the
political economy benet of not requiring policy action. If Congress and the
President simply do nothing and let the tax code revert to what it was during the
booming 1990s, the US will have accomplished about two-thirds of the policy
change necessary to stabilising its debt to GDP ratio. Doing nothing, however, is
unlikely to be politically feasible. The Republican Party is committed to making
the tax cuts permanent and President Obama favours extending these tax cuts
for taxpayers with incomes below $250,000. It is almost certain that the 2012
presidential election campaign will provide an opportunity for both parties to
harden their commitments to extending these tax cuts.
The second approach to raising revenue is to broaden the tax base by reducing
tax expenditures. The US tax code excludes many items from taxation that would
be included in an ideal income tax base – for example, compensation received
in the form of employer provided health insurance is not taxed. It also contains
expensive tax deductions for items like mortgage interest and state and local taxes
paid. Finally, it administers spending-like programmes through the tax code,
such as tax credits for college tuition. Cutting back on tax expenditures offers the
opportunity to raise revenue without raising tax rates, while simplifying the taxcode and, in some cases, eliminating the economic inefciencies that come from
the deviations from the ideal tax base. The challenge here is that most of the
largest tax expenditures are quite popular. Thus, recent discussion has focused
on the possibility of allowing most of the existing tax expenditures to remain,
but capping the total amount of tax expenditures that a taxpayer may claim.
This approach is likely to be more politically feasible than attempting to directly
eliminate any specic tax expenditure.
The third approach is to introduce a Value Added Tax (VAT) to supplement
existing revenue sources (the US is the only OECD country without a VAT).
Because Americans are accustomed to paying retail sales taxes assessed by stategovernments and because the VAT has negative connotations of being associated

8/3/2019 Geneva13
http://slidepdf.com/reader/full/geneva13 63/162
The United States: Can the 1990s Fiscal Rebalancing Be Repeated? 41
with European social welfare states, proposals for a US VAT generally describe it
as a ‘national retail sales tax’. In the short term, the VAT appears much less likely
to be enacted than the other two revenue approaches. The idea has received little
serious discussion outside of academia and think tanks and would be perceived asmore radical by most Americans. Moreover, Democrats tend to be wary of a VAT
because of progressivity concerns, while Republicans tend to worry that it is too
efcient a tax and could therefore lead to bigger government.
It is, of course, possible to combine the three approaches to raising revenue.
The President’s budget proposal would allow the 2001/2003 tax cuts to expire for
income ranges above $250,000, while limiting tax expenditures both by capping
the rate at which itemised deductions can be claimed and by eliminating subsidies
for fossil fuel production. The two scal commission proposals aggressively cap
tax expenditures and overshoot their revenue target so as to allow marginal tax
rates to come down. The Bipartisan Policy Center proposal includes a 6.5% ‘Debt
Reduction Sales Tax’ as well.
In general, the political feasibility of revenue increases is no greater than that
of the more aggressive spending cuts. In particular, a large fraction of Republican
elected ofcials have publicly committed to opposing any tax increases. However,
there are two considerations that may make it possible to achieve an increase in
revenue. First, the fact that the 2001/2003 tax cuts are scheduled to expire creates
some ambiguity about what qualies as a tax increase. While most Republicans
are clear that they would view the expiration of the tax cuts as an impermissible
tax increase, others such as Feldstein (2010) have simultaneously argued against
tax increases while cautioning against extending the tax cuts before there is
more clarity about the scal outlook. Second, because tax expenditures can be
interpreted as government spending that occurs through the tax code, there
appears to be a real opportunity for a bipartisan agreement on tax expenditures
that would allow Republicans to claim that they are reducing this large category
of government ‘spending’ and Democrats to claim that they have managed to
increase government revenue.
3.4 The longer-term outlook: Demographics and health careexpenditures
Even if the US is successful at stabilising the debt to GDP ratio within the next
5–10 years, longer-term scal challenges associated with population ageing and
rising health care expenditures will remain.
The US has a more favourable demographic outlook than many European
countries. The US total fertility rate has averaged slightly above two for the past
20 years, and current projections from the OASDI actuaries are for a long-run
fertility rate of 2.0. With immigration rates projected to continue to exceed one
million per year, the US labour force is projected to increase by 0.5% per year
between 2019 and 2050 (OASDI Trustees Report, 2010).
As discussed above, the retirement of the baby boom generation is leadingto a dramatic rise in social insurance spending. But the demographic burden is

8/3/2019 Geneva13
http://slidepdf.com/reader/full/geneva13 64/162
42 Public Debts: Nuts, Bolts and Worries
projected to stabilise within the next 15 years. The number of workers per OASDI
beneciary is falling from 3.3 in 2007 to 2.3 in 2025. But beyond 2025, this ratio
falls very gradually – reaching 2.1 in 2065. OASDI spending as a share of GDP is
rising from 4.2% in 2007 to 5.8 in 2025. Between 2025 and 2065 expenditureson these old age and disability benets are projected to remain nearly constant –
reaching only 5.9% of GDP in 2065 (OASDI Trustees Report, 2010).
Thus the main long-term scal challenge comes from health care costs. Since
1975, expenditures per beneciary on the two main government health care
programmes, Medicare and Medicaid, have grown at an average annual rate of
2% faster than per capita GDP. The CBO projects that federal spending on health
programmes and OASDI will increase by 4% of GDP between 2021 and 2035. By
comparison, the primary decit in 2021 under the ‘current policy’ scenario is
2.6% of GDP.35
There is, of course, nothing wrong with a society choosing to spend a greater
fraction of its income on health care over time. With rising income levels it is
possible to simultaneously spend a rising fraction of income on health care and
increase consumption of non-health care goods and services (Hall and Jones,
2007). Moreover, research suggests that the benets of increased health care
spending in the US have exceeded the cost (Cutler et al, 2006). Nonetheless, there
are reasons to believe that a signicant portion of US health care consumption
is inefcient (Garber and Skinner, 2008) and the extent to which US health care
spending exceeds that of other countries is extraordinary even after adjusting for
levels of per capita income (Reinhardt, 2008). Even if rapidly increasing health
care spending were optimal, it would still create a scal challenge. Since about
half of US health care spending is government nanced, such a path would imply
steadily increasing tax rates.
In recent years, health care experts in the US have suggested a long list of
changes to eliminate inefciencies in the system (Engelberg Center for Health
Care Reform, 2009). These include moving the payment regime away from
paying based on the quantity of services delivered and instead paying on a
capitated basis, or based on measures of health care quality outcomes. They
also include investing more in learning about the clinical effectiveness of
different treatments and pricing unproven treatments differently than proven
ones. And they also include streamlining administration, eliminating the tax
incentive to overconsume health insurance, reforming the medical malpracticesystem, standardising insurance plans to facilitate quality and price-based
competition, and investing in health information technology and electronic
medical records. The 2010 Affordable Care Act (ACA) contained elements of all
of these recommendations, though in many cases only in a pilot form. The CBO
estimates that the ACA reforms will reduce the decit by over $1 trillion in its
second decade of operation. Some health care experts think that with proper
implementation, these reforms could produce much greater savings � (Cutler,
35 We focus here on the primary decit because when unsustainable scal trajectories are extended farinto the future, interest costs dominate the overall decit, and it becomes hard to judge the size of
the necessary policy adjustment. Under the assumption that revenues and non-health, non-OASDIspending remain a constant share of GDP, then the primary decit will grow from 2.6% of GDP toalmost 7% of GDP between 2021 and 2035.

8/3/2019 Geneva13
http://slidepdf.com/reader/full/geneva13 65/162
The United States: Can the 1990s Fiscal Rebalancing Be Repeated? 43
2010). Other experts suggest that many of the cost savings provisions will not be
politically sustainable and will be repealed before they go into effect (Holtz-Eakin
and Ramlet, 2010).
Many countries use hard budget caps to limit health care spending, settingaggregate budgets at the provincial or hospital level and requiring providers
to deliver care within that cap. A plan based on this philosophy is currently
being promoted by Representative Paul Ryan, the Republican chair of the
House Budget Committee, along with Alice Rivlin, one of President Clinton’s
budget directors. The Ryan–Rivlin plan would replace the current US system of
government-provided health insurance for seniors with a new system in which
Medicare recipients would receive a voucher and purchase insurance from
private insurance companies. Under the Ryan–Rivlin plan, the vouchers, and
therefore Medicare costs per beneciary, would grow at GDP + 1%, essentially
cutting excess cost growth in half. Under this system, seniors would bear the
risk associated with health care costs growth exceeding GDP+1 as they would
be responsible for paying the portion of the insurance premium that was not
covered by the voucher.36
Most likely the coming decade will be one of messy innovation in the US
health care system, as different states use the exibilities and nancial incentives
provided in the Affordable Care Act to try different approaches to cost control
and quality improvement. In the US, state governments are often described as
the laboratories of democracy, since successful innovations demonstrated in
one state can be expanded nationwide. So long as at least a few states nd a
way to reorganise to provide higher quality care at a lower cost, it is likely that
the Affordable Care Act approach of learning what works and testing different
payments systems will continue to be the main approach to health care cost
control for the US. However, if excess cost growth persists at 2% a year for another
decade, then the blunter approach of directly setting expenditure levels could
emerge as a politically viable alternative.
3.5 The political economy o reorm
There is relatively recent precedent for the US correcting a scal imbalance. From
1982 through 1997, the US faced what appeared to be an intractable budgetdecit problem. It required three pieces of decit reduction legislation – in
1990, 1993 and 1997 – each of which reduced decits by approximately 1% of
GDP, along with the good fortune provided by a booming economy, to turn the
persistent budget decits into surpluses. None of the budget deals were easy. The
tax increases in the 1990 deal required President George H.W. Bush to renege on
his ‘read my lips, no new taxes’ pledge and contributed to his electoral defeat in
1992. President Clinton’s 1993 budget, which also included higher taxes, passed
Congress without a single Republican vote. Several of the rst term Democratic
36 Representative Ryan has recently released a new plan, no longer supported by Alice Rivlin, in whichthe vouchers would grow only with ination. Vouchers growing at ination would increase in nominalterms by about 2% a year. Vouchers growing at GDP+1 would grow at about 5.5% per year.
8/3/2019 Geneva13
http://slidepdf.com/reader/full/geneva13 66/162
44 Public Debts: Nuts, Bolts and Worries
members of Congress who voted for the 1993 decit reduction package lost their
seats in the 1994 election. The path to the 1997 budget deal involved a three-
week government shut down in December 1995.
Elmendorf et al (2002) note a key difference between the unsuccessful effortsat decit reduction during the 1980s and the successful efforts during the 1990s.
The Gramm-Rudman-Hollings decit reduction law of 1985 set explicit annual
decit targets that declined to zero over several years, but it did not specify the
policy actions to achieve the decit reduction. When the target proved too
difcult to meet in 1987, the targets were raised. Starting in 1990, however,
decit reduction efforts included specic actions to reduce the decit rather than
a set of decit targets. The lesson that unrealistic decit reduction targets are
unlikely to bind policymakers was learned a second time in the late 1990s. While
discretionary spending caps were an important component of the 1990 and 1993
budget legislation, when caps were set unrealistically low in the 1997 budget
agreement, they were simply ignored.
For much of the year, policymakers in Washington have been trying to
decide whether to try to make a serious effort at scal consolidation before
the November 2012 elections or whether instead to spend the next 18 months
trying to lay the ground work for a budget deal in early 2013. While a successful
scal consolidation would eliminate the risks associated with nancial markets
becoming impatient with the lack of progress, a failed effort could exacerbate
market concerns. Moreover, an attempt to address contentious scal issues in
the heat of the 2012 election campaign could result in responsible options being
taken off the table and could fail in a way that made reaching a compromise in
2013 more difcult. Perhaps the strongest argument for trying to address the
medium-run scal imbalances now is that doing so could create a climate in
which the additional short-term scal stimulus that the US economy so badly
needs becomes politically feasible.
The debt limit agreement reached in August sets up a dynamic that both
allows for one more attempt at a grand scal bargain between Democrats and
Republicans before the November 2012 election and intensies pressure for an
agreement right after the election. It requires Congress to pass legislation by 15
January 2012 reducing the decit by $1.2 trillion over 10 years. If Congress fails to
produce $1.2 trillion in savings, automatic spending cuts go into effect beginning
in 2013 to achieve the $1.2 trillion in savings. The automatic spending cuts wereexplicitly designed to be unappealing to both Democrats and Republicans, so as
to increase the costs of failing to come to an agreement. Thus, there will be a set of
negotiations this autumn, similar to those that occurred this summer, aiming at a
scal agreement. If these negotiations fail, then, after the November presidential
election, the conuence of the start of a presidential term, the imminent (31
December) expiration of the 2001/2003 tax cuts, and the desire to prevent the
automatic spending cuts will set the stage for a post-election agreement.

8/3/2019 Geneva13
http://slidepdf.com/reader/full/geneva13 67/162
The United States: Can the 1990s Fiscal Rebalancing Be Repeated? 45
3.6 Conclusion
The policy adjustments that are needed for the US to stabilise its debt-to-GDP
level over the next decade are not large relative to policy adjustments that haveoccurred in the recent past. For example, simply reversing the tax cuts and
increased war spending of the past decade would be sufcient. It is uncertain,
however, whether the political system will nd a way to enact the needed
adjustments before the 2012 election. The harder problem is rising health care
expenditures. Finding the right long-term mix of cost-reducing reforms and
additional revenue will occupy US policymakers far beyond the point when the
current scal imbalance is corrected.

8/3/2019 Geneva13
http://slidepdf.com/reader/full/geneva13 68/162

8/3/2019 Geneva13
http://slidepdf.com/reader/full/geneva13 69/162
47
4 Europe’s Public Debt Challenge
4.1 Introduction
Many in Europe have been stunned by the fact that developed countries, too,
can face the wrath of nancial markets if they do not keep their scal houses in
order. Yet, European countries are no strangers to high public debts. For nearly
two decades, some countries have sported public debts in excess of 100% of GDP.
Just before the nancial crisis, the public debts of Eurozone countries amounted
to 70% of GDP on average, more or less the same level as when the euro was
launched, and 10 percentage points higher than in the early 1990s. Since 2007,
debt ratios have increased by 10–60% of GDP. Obviously, bringing debts down
is not part of the European tradition, with the exception of only a few countries
that were able to outgrow their debts as the result of their catching-up processes.
To make things much worse, Europe’s population is ageing quickly, a process
that has long been in the making and that is now picking up speed. The
resulting, implicit scal liabilities are gradually becoming explicit, potentially
adding another 30–40% to the debt/GDP ratio. A safe conclusion is that nearly
all European countries will have to devote the next two decades to rolling back
their public debts to levels that allow for comfortable interest service and permit
occasional decits in the face of unexpected shocks, including recurrent cyclical
downswings, without triggering a wave of crises. Unfortunately, budgetary
institutions are not designed to deliver such a massive and sustained rollback in
most countries. In spite of the current debt crisis, public opinion and governments
are largely in denial of the problem. Political parties show themselves unwilling
or unable to take the measures that need to be taken.This chapter starts with a review of the debt build-up before the nancial
crisis to argue that the decit bias, a consequence of the common pool problem
presented in Chapter 2, has been commonplace in Europe. The chapter next
examines the upcoming scal implications of population ageing. There is no lack
of information about the seriousness of the issue, including at the ofcial level.
Since 2001, the European Commission occasionally conducts a coordinated study
of the demographic evolution and its budgetary implications in the member

8/3/2019 Geneva13
http://slidepdf.com/reader/full/geneva13 70/162
48 Public Debts: Nuts, Bolts and Worries
countries.37 This chapter relies on the latest results (European Commission, 2009)
to present an evaluation of this part of the debt challenge.
Then the present chapter looks at the legacy of the nancial and economic
crisis that started in 2007. It shows that public debt increases have been uneventhroughout the Eurozone. Unsurprisingly, they have been the largest in the three
countries currently under IMF-EU programmes (Greece, Ireland and Portugal)
but other, larger, countries (Spain and France) do not stand far behind.
Sections 4.5 and 4.6 look at what could be done. It argues that, with few
exceptions, growth is unlikely to play a signicant role in bringing down debt
ratios in Europe. The challenge will have to be met with better policies, which
will require better incentives to policymakers, not just for a couple of years,
but for the very long run. Looking at the margins of adjustment, it seems that
public spending rather than tax revenues will have to bear the largest burden,
mainly because taxes already impose high deadweight losses in most European
countries. While debt monetisation and ination are unlikely to be condoned by
the ECB, the crisis has exposed some weaknesses in the central bank’s position. In
spite of its harsh language about the lack of scal discipline within the Eurozone,
the ECB has surprised many observers with its large purchases of the debt of
distressed governments.
4.2 The decit bias
While later sections will look at two major reasons for large public debt increases
– the economic and nancial crisis – this section looks at the practical relevance
of the decit bias described in Chapter 2. Keeping in mind that each country
is different, the evidence presented in Figure 4.1 shows a relentless rise in the
average debt of the Eurozone countries that started several decades ago. Even
though a decit bias is also present in the USA, the gure shows that the best
that the Eurozone countries were able to manage (again, individual stories differ)
was to stabilise public debt as a ratio to GDP during the rst 10 years of the single
currency. Even so, this happened at high debt levels, far above the 60% threshold
set by the Excessive Decit Procedure.
In order to understand the European decit bias, it is helpful to look at the
pre-crisis situation. Among the now 17 Eurozone members, more than half hada debt ratio in excess of 60% in 2006. This was true for only one of the ten
remaining EU member countries. Three Eurozone countries, Greece, Italy and
Belgium, had debt ratios in excess of 90%.
These debts were not accumulated due to wars or exogenous disasters. Instead,
debt nancing was regarded as a convenient way of providing ever-increasing
public services and transfers. This is precisely what the common pool theory
predicts. In Germany, for example, the ratio of spending on transfers and
37 The studies are prepared by the Ageing Populations Working Group (AWG) that is attached to the
Economic Policy Committee (EPC). The EPC includes the Heads of Finance Ministries and of theEuropean Commission’s Directorate General for Economic and Financial Affairs. The AWG was set upin 1999 and produced its report in 2001, see Economic Policy Committee (2001).

8/3/2019 Geneva13
http://slidepdf.com/reader/full/geneva13 71/162
Europe’s Public Debt Challenge 49
subsidies rose by 9.5 percentage points of GDP between 1970 and 1995, while
total revenues increased by only 6.1 percentage points. In the Netherlands, the
other EU country for which the OECD provides data back to 1970, the same
changes amounted to 7.1 and 5.6 percentage points.
4.3 The eect o population ageing
4.3.1 Demographics
The ageing of European population has long been foreseen. In Germany, for
example, it started in the 1870s.38 Fertility rates declined signicantly in some
countries in the late 1960s, and the decline spread to the rest of Europe over
the next decades, Ireland being the last country to be affected as late as 2000(European Commission, 2009). In parallel, the increase in life expectancy
at birth has continued to increase, adding about one month every year since
1950. The balance of these effects is unambiguous: After some time, low fertility
rates dominate. This is why total population size is expected to decrease in
some countries. Immigration is unlikely to stem the tide in these countries, as
immigrants tend to adopt the fertility patterns of their host countries quickly
and, therefore, even large-scale immigration postpones the population decline
for a while at best. As Figure 4.2 illustrates, population decline is expected in 14
of the 27 EU countries between 2008 and 2060. At the same time, the number of
38 Federal Institute for Demographics, http://www.bib-demograe.de/cln_090/nn_750722/DE/ DatenundBefunde/Ueberblick/demogr__trends.html
Notes: Included are the rst 14 countries members of the euro area.
Source: Economic Outlook, OECD
Figure 4.1 Public debt o the US and o the Eurozone (% o GDP)
0
20
40
60
80
100
120
1 9 6 9
1 9 7 1
1 9 7 3
1 9 7 5
1 9 7 7
1 9 7 9
1 9 8 1
1 9 8 3
1 9 8 5
1 9 8 7
1 9 8 9
1 9 9 1
1 9 9 3
1 9 9 5
1 9 9 7
1 9 9 9
2 0 0 1
2 0 0 3
2 0 0 5
2 0 0 7
2 0 0 9
2 0 1 1
Euro area USA

8/3/2019 Geneva13
http://slidepdf.com/reader/full/geneva13 72/162
50 Public Debts: Nuts, Bolts and Worries
people aged 65 and more will almost double, from 85 million to 151 according
to the European Commission (2009) and the share of older people in the EU’s
population will increase. According to EUROSTAT projections, the share of people
age 65 years and above will be 30% in 2060, up from 17.2% in 2009. Figure 4.3.shows that the old-age dependency ratio (the number of those age 65 and up
divided by those in working age (15 to 64 years)) will increase from 25.6% in
2009 to 53.5% in 2060.39
39 epp.eurostat.ec.europa.eu/statistics_explained/index.php/Population_structure_and_ageing#Future_trends_in_ population_ageing
Figure 4.2 Change in total population 2008–2060 (%)
Source: European Commission (2009).
-40 -20 0 20 40 60 80
Cyprus
Ireland
Luxembourg
Norway
UK
Sweden
France
Belgium
Spain
Austria
Denmark
Portugal
Finland
NetherlandsItaly
Greece
Malta
Czech Rep.
Slovenia
Hungary
Germany
Estonia
Slovakia
Poland
Romania
Lithuania
Latvia
Bulgaria

8/3/2019 Geneva13
http://slidepdf.com/reader/full/geneva13 73/162
Europe’s Public Debt Challenge 51
4.3.2 Implications or public nances
The implications for public nances involve both public revenues and spending,
but the attention is normally focused exclusively on the spending side,
presumably because revenues are the main variable of adjustment once measures
have been taken to contain spending.
Predicting the necessarily long-term effects of demographic changes is
obviously difcult and involves a large number of assumptions. A starting point is
the large-scale study conducted by the European Commission (2009). This study
considers ve spending items: pensions, healthcare, long-term care, education
and unemployment benets. The last two items are usually little affected by the
demographic transition – if anything, the impact is estimated to be favourable –
and are not examined here. Overall, for the 25 EU countries covered by the study,
ageing-related public expenditures are expected to rise by 2.7% of GDP between2007 and 2035 and by 4.7% between 2007 and 2060. At the 2035 horizon,
pension increases account for 1.6% of GDP, healthcare for 1.0% and long-term
care for another 0.6%.
These averages for the EU as a whole conceal massive differences across
member countries, as Figure 4.4 makes clear. At one end of the spectrum, annual
ageing-related expenditures are expected to decline between 2007 and 2035 by
2.7% of GDP in Poland while, at the other end, they are expected to increase
by 9.1% of GDP in Greece. Here again, the crucial item is public pensions. The
countries where the estimated impact is smallest generally are those that have
implemented major reforms, usually involving a partial privatisation of thepension system.
Figure 4.3 Dependency ratio (total inactive population as a percentage o employedpopulation aged 15 to 64)
Source: European Commission (2009).
90 110 130 150 170 190
Italy
Greece
France
Spain
Portugal
Germany
Finland
Ireland
UK
Sweden
EU27 2007
2020
2060

8/3/2019 Geneva13
http://slidepdf.com/reader/full/geneva13 74/162
52 Public Debts: Nuts, Bolts and Worries
A general feature of these estimates is that the main public nance impact of
the demographic transition is related to public pensions. This is predicated by
the sharply increasing dependency ratio and points to clear policy implications,
discussed in the next section. At the same time, it might seem surprising thathealth-related spending is expected only to increase modestly (as noted above,
an addition of 1% of GDP to annual decits on average in the EU27 countries).
This is a controversial conclusion.
For example, a study conducted by the IMF (2009) foresees healthcare
spending alone to rise by 3% of GDP by 2030. Cumulated over decades, the
difference is large and reects different assumptions about the role of technology
in increasing health care costs. Another controversy, discussed at some length
in European Commission (2008), concerns life-time health spending. One view
is that longer lifetime comes with longer periods of illness, which would imply
a sizeable increase in health spending. Another view is that most people sufferfrom ailments requiring cost-intensive care only in the last years of life, implying
Figure 4.4 Increase in ageing-related spending between 2007 and 2035 (% o GDP)
Source: European Commission (2009).
-4 -2 0 2 4 6 8 10
Greece
Luxembourg
Netherlands
Slovenia
Norway
Finland
Belgium
Romania
Cyprus
Malta
Spain
Ireland
Denmark
FranceUK
Germany
Austria
Italy
Lithuania
Slovakia
Sweden
Portugal
Czech Republic
Bulgaria
Hungary
LatviaEstonia
Poland

8/3/2019 Geneva13
http://slidepdf.com/reader/full/geneva13 75/162
Europe’s Public Debt Challenge 53
that a longer lifetime merely postpones health care spending with little effect on
total lifetime spending. An intermediate view links spending to age, irrespective
of life length, possibly allowing for savings as health at a given age improves as
life expectancy rises. This intermediate assumption is used in the Ageing Report projections. Sensitivity analysis indicates that more pessimistic assumptions
could add up to 1.5% of GDP to spending on health care.
4.4 Radical change during the crisis
The nancial crisis that broke out in 2007 has radically changed the debt
situation in Europe. In fact, it has prompted an unprecedented and possibly
contagious public debt crisis, which is still unfolding. At the time of this writing,
three countries (Greece, Ireland and Portugal) are under adjustment programmes
negotiated with the IMF and the European Commission. Italy and Spain may
well follow suite. The frontline issue is sovereign default.
As a response, Eurozone member countries have created a temporary
emergency facility, the European Financial Stability Fund (EFSF). The Fund allows
for nancial assistance to the countries in crises outside of the European Treaty
framework, in which such assistance was not foreseen.40 Meanwhile, the EU
governments have agreed to turn this facility into a permanent and expanded
European Stability Mechanism (ESM), which will stand ready to give nancial
assistance to governments that nd themselves in difculty following periods of
excessive borrowing. With no respite from market pressure, further steps appear
necessary. Whatever the outcome of this crisis, the Eurozone is going to emerge
profoundly transformed.
The direct cause of the crisis is the large increase in public debts. From 2007 to
2011, the average public debt ratio in the Eurozone has increased by 10% to 60%,
as can be seen in Figure 4.5. The four countries with the largest increases, Spain,
Portugal, Ireland and Greece, have experienced severe difculties renancing
their debts in the nancial markets. The disquieting observation is that, according
to the Commission’s estimates, the proximate main source of debt increase in
these countries was cyclical. It is disquieting, because it means that countries like
Ireland and Spain, which abruptly went into recession as a result of the bursting
of the housing price bubble, could not have prevented a debt build-up easily.Even more disquieting is the fact that the end is not in sight. Current
European Commission forecasts indicate that output gaps will remain negative
at least through 2012 in the Eurozone countries, with the exception of Malta and
Slovakia. For the area as a whole, the 2012 gap is forecasted to stand at 1.6% of
GDP, following a peak of 3.8% in 2009. Unsurprisingly, public debts are generally
expected to keep rising relative to GDP at least until 2012, which is the limit of
current Commission forecasts. The expected debt to GDP ratios shown in Table
4.1 include some very large debt levels, with an overall ratio close to 90%.
40 It is sometimes believed that, in fact, the Treaty’s no-bailout clause (Art. 125) forbids such assistance.

8/3/2019 Geneva13
http://slidepdf.com/reader/full/geneva13 76/162
54 Public Debts: Nuts, Bolts and Worries
Figure 4.5 Debt increases rom 2007 to 2011 - (% o GDP)
Notes: “Cyclical” and “discretionary” refer to the two components of the primary current account,cumulated over the period. “Interest and growth” measures debt service net of GDP growth. Stock-owis an adjustment to account for the debt increase. It includes one-off items such as the costs of bankrescues. Notes: ‘Cyclical’ and ‘discretionary’ refer to the two components of the primary current account,cumulated over the period. ‘Interest and growth’ measures debt service net of GDP growth. Stock-ow isan adjustment to account for the debt increase. It includes one-off items such as the costs of bank rescues.
The accounting relationship between b the debt, r and g the real interest rate and real growth ratesrespectively, and pd the primary decit, all measured as percentage of GDP (except r ) is:
Δb = (r – g )b + pd
Decomposing pd into its cyclical and non-cyclical components, pdc and pdnc respectively, and into one-off items sf , gives:
Δb = (r – g )b + pdc + pdnc + sf
which underlies the numbers in Figure 4.5. Note that the decomposition of the decit is a source of error,which is amalgamated into the residual term sf .
Source: European Commission (2010a), AMECO on-line and authors’ calculation.
-10 0 10 20 30 40 50 60 70
Ireland
Greece
Spain
Portugal
France
Netherlands
Slovenia
Finland
Luxembourg
Belgium
Germany
Italy
Slovakia
Austria
Malta
CyprusCyclical
Discretionary
Interest and growth
Stock-flow

8/3/2019 Geneva13
http://slidepdf.com/reader/full/geneva13 77/162
Europe’s Public Debt Challenge 55
Table 4.1 Gross public debts in 2012
Eurozone Belgium Germany Ireland Greece Spain
88.5 97.5 81.1 117.9 166.1 71.0
France Italy Cyprus Luxembourg Malta Netherlands86.8 119.8 64.3 19.0 67.9 64.0
Austria Portugal Slovenia Slovakia Finland Estonia
75.4 107.4 46.0 46.8 52.2 6.9
Source: AMECO, European Commission.
4.5 The debt challenge
These numbers do not, however, include yet the impact of the demographic
transition examined in Section 4.3. We provide a very rough estimate at the
horizon of 2035 of the overall challenge by combining the two events. To do so
we must make strong assumptions, which do not have to be plausible or realistic.
These assumptions are the following:• In countries were the debt has not been stabilised by 2012, stabilisation
will be achieved by 2015 through a linear extrapolation.41 Thereafter,the debt is assumed to remain constant.
• The costs of the demographic transition are not covered by tax increasesnor reduced spending.
• The resulting debt increases kick in linearly starting in 2012 to reachthe amounts indicated in Figure 4.4 by 2035.
• The increases are cumulated at a growth-adjusted interest rate of 1%,with a second scenario of 3%.
The results of these simulations, presented in Table 4.2, are probably optimistic
regarding both the stabilisation of the debt after the crisis and the slow and
gradual phasing-in of age-related expenditures. They are not forecasts either,
mainly because they rule out adjustments to age-related expenditures, which
could reduce the debt build-up. The only purpose of this exercise is to provide an
order of magnitude of the debt challenge.
The challenge is steep. For the Eurozone as a whole, gross debts will morethan double. With two notable exceptions (Estonia and Slovenia), indebtedness
will exceed 100% of GDP in 2035 under both scenarios. The countries at the
bottom of the table face debt levels that would be unlikely to be nanceable
under current conditions. Even those countries whose gross debts are currently
small (Luxembourg, Slovenia and Finland, for example) face burdens that may
not be viable.
41 More precisely, the increase between 2011 and 2012 is reduced by one-third each of the following threeyears.

8/3/2019 Geneva13
http://slidepdf.com/reader/full/geneva13 78/162
56 Public Debts: Nuts, Bolts and Worries
Table 4.2 Gross public debts in 2035 (percentage o GDP)
20072035 2035
Adjusted rate = 1% Adjusted rate = 3%
European Union 59 121 128Eurozone 66 132 140
Estonia 4 15 15
Slovakia 30 71 75
Austria 59 106 111
Germany 65 110 116
Portugal 63 111 113
France 64 129 136
Malta 62 130 141
Cyprus 58 132 143
Spain 36 134 145Finland 35 137 152
Slovenia 23 144 160
Luxembourg 7 145 167
Italy 104 147 152
Netherlands 45 161 178
Ireland 25 172 180
Belgium 84 179 193
Greece 105 285 307
Source: European Commission (AMECO online) and authors’ calculations.
4.6 Facing up to the challenge
The combination of the ageing process and of the nancial crisis represents a
major challenge for policymakers in most European countries. There is clear
awareness that difcult decisions lie ahead, in fact a number of countries have
already implemented major measures. Others, however, have made little progress.
The European sovereign debt crisis is a clear reminder that inaction is not a viable
option.
This section looks at the strategic options to conclude that, in most Eurozonecountries, along pension reforms, spending cuts will have to bear most of the
burden of debt rollbacks, with little relief from growth and limited room for tax
increases.
The emphasis then shifts to the budgetary process and its political
underpinnings in light of the principles developed in Chapter 2.
4.6.1 Growth will not do it
Over the past 20 years, some countries (Finland, Ireland, Spain, Sweden) have
succeeded in reducing their debt/GDP ratios very signicantly. In most cases, the

8/3/2019 Geneva13
http://slidepdf.com/reader/full/geneva13 79/162
Europe’s Public Debt Challenge 57
key success factor was rapid growth.42 The debt consolidation success stories of
yesteryear mainly occurred in countries that were catching up to the technology
frontier, either because of reforms following low initial per capita GDPs (Ireland is
a prime example) or because other reforms jumpstarted innovations in relativelysmall countries where industry-level successes had large macroeconomic effects
(Finland, Sweden). The question is whether sufciently fast growth is a possible
strategy. Rapid growth can help stabilise public debts as a proportion of GDP
through two main channels:1. Mechanically, the faster GDP increases, the more the ratio of debt to
GDP tends to decline, everything else being equal.
2. Faster GDP growth raises tax revenues without forcing the governmentto raise tax rates, and it allows the government to reduce the ratio of spending to GDP without having to cut the level of spending. Thus,reducing the debt ratio becomes less politically painful if it is based on
sufcient economic growth.
The question then is whether and to what extent European countries can reasonably
hope for growth to help reduce their public debts. Rapid and sustainable growth
is possible, where the economy is far enough from the technology frontier. Table
4.3 takes an informal look at this issue for the OECD countries. We study the debt
reduction episodes, most of which took place in the 1990s. The second row in
the table shows the reduction in the debt/GDP ratio since the peak was achieved
(the peak ratio is shown in the rst row and the corresponding year is indicated
in the third row) and 2006, the pre-crisis year. Shaded areas in the second row
identify large debt reductions, those that led to a 20 percentage points reduction
of the debt-GDP ratio. These successful rollbacks can be explained by a rapid
growth potential because the country is still far from the technology frontier
or by adequate reforms concerning the budget process. The distance from the
technology frontier is approximated by the ratio of PPP-adjusted GDP per capita
of a country to that of the USA. Shaded areas in the fourth row correspond to
ratios of 60% or less, that is, they identify countries likely to have a signicant
catch-up potential. The last row indicates whether a budgetary reform has been
implemented and, if so, when. It also notes the existence of an IMF programme
at the time when the debt peaked.
The table conrms that, by and large, debts were not reduced in countries that
(1) were close to the technology frontier and (2) did not reform their budgetaryprocesses. Some countries that were close to the technology frontier still achieved
a large public debt reduction; these adopted reforms of their scal institutions
(Belgium, Canada, Denmark, Sweden). In some instances (Australia, Netherlands,
New Zealand, Spain), the institutional reforms followed debt stabilisation, thus
enshrining the measures that had been taken earlier and had been successful
enough to gain general acceptance. This suggests that the potential for high
growth alone is not a sufcient condition to cut public debts. Institutional
reforms are necessary to eliminate the decit bias.
42 See Von Hagen (2006a).

8/3/2019 Geneva13
http://slidepdf.com/reader/full/geneva13 80/162
58 Public Debts: Nuts, Bolts and Worries
T a b l e
4 . 3
D e b t r e d u c t i o n s
A u s t r a l i a
A u s t r i a
B e l g i u m
C a n a d a
C y p r u s
D e n m a r k
F i n l a n d
F r a n c e
H i g h e
s t d e b t ( % o
G D P )
3 1 . 4
6 8 . 4
1 3 4 . 1
1 0 1 . 7
7 0 . 2
7 2 . 4
5 7 . 7
6 6 . 4
R e d u c t i o n
2 1 . 6
6 . 3
4 6 . 8
3 1 . 5
5 . 6
3 1 . 4
1 8 . 0
2 . 8
Y e a r w
h e n d e b t p e a k e d
1 9 9 4
1 9 9 6
1 9 9 3
1 9 9 6
2 0 0 4
1 9 9 8
1 9 9 4
2 0 0 5
G D P /
c a p i t a
8 8
8 7
8 2
8 4
5 1
8 7
6 8
7 3
G r o w
t h
2 . 5
2 . 2
2 . 0
2 . 6
1 . 8
1 . 6
3 . 5
1 . 6
R e o r m
1 9 9 8
n o
m i d 9 0 s
m i d 9 0 s
1 9 9 8
1 9 9 1
n o
G e r m a n
y
G r e e c e
I r e l a n d
I t a l y
J a p a n
M e x i c o
N e t h e r l a n d s N
e w Z e a l a n d
H i g h e
s t d e b t ( % o
G D P )
6 8 . 0
1 0 3 . 7
9 4 . 5
1 2 1 . 8
1 9 1 . 6
7 8 . 1
9 6 . 5
7 6 . 0
R e d u c t i o n
0 . 4
6 . 6
6 9 . 6
1 5 . 3
0 . 3
3 9 . 8
4 9 . 1
5 6 . 1
Y e a r w
h e n d e b t p e a k e d
2 0 0 5
2 0 0 1
1 9 9 1
1 9 9 4
2 0 0 5
1 9 8 6
1 9 9 3
1 9 8 7
G D P /
c a p i t a
7 7
5 9
6 1
7 6
7 5
3 7
8 9
7 0
G r o w
t h
3 . 3
3 . 8
6 . 3
1 . 4
2 . 0
4 . 7
2 . 2
1 . 5
R e o r m
n o
n o
e a r l y 8 0 s
2 0 0 2
n o
I M F
1 9 9 4
1 9 9 4
N o r w a y
P o r t u g a l
S p a i n
S w e d e n
S w i t z e r l a n d
T u r k e y
U K
U S A
H i g h e
s t d e b t ( % o
G D P )
6 1 . 3
6 4 . 7
6 7 . 4
8 4 . 4
5 5 . 3
7 7 . 6
4 9 . 3
6 6 . 5
R e d u c t i o n
0 . 9
0 . 8
2 7 . 9
3 9 . 3
8 . 2
3 1 . 5
6 . 1
5 . 4
Y e a r w
h e n d e b t p e a k e d
1 9 9 3
2 0 0 5
1 9 9 6
1 9 9 6
1 9 9 8
2 0 0 1
1 9 9 7
1 9 9 5
G D P /
c a p i t a
1 1 9
5 0
6 3
7 9
9 6
2 2
7 8
1 0 0
G r o w
t h
2 . 6
1 . 1
2 . 7
3 . 1
1 . 3
5 . 5
0 . 9
2 . 2
R e o r m
2 0 0 1
n o
2 0 0 3
1 9 9 6
2 0 0 1
I M F
n o
n o
N o t e s :
D e b t r e d u c t i o n i s m e a s u r e d a s t h e c h
a n g e i n t h e d e b t / G D P r a t i o b e t w e e n t h e y e a r w h e n m a x i m u m w a s r e a c h e d
a n d 2 0 0 6 ; G D P p e r c a p i t a : r e l a t i v e t o t h e U S ( i n % )
i n t h e
d e b t p e a k y e a r ; g r o w t h i s m e a s u r e d o
v e r t h e 1 0 y e a r s s i n c e d e b t p e a k e d o r
a s m a l l e r n u m b e r o f y e a r s u n t i l 2 0 0 6 .
S o u r c e : P u b l i c d e b t s : H i s t o r i c a l d e b t d a t a b a
s e ,
I M F ; G D P p e r c a p i t a : T h e C o n f e r
e n c e B o a r d T o t a l E c o n o m y D a t a b a s e
, J a n u a r y 2 0 1 1 , h t t p : / / w w w . c o n f e r e n c e - b o a r d . o r g / d a t a /
e c o n o m
y d a t a b a s e / . Y e a r s o f r e f o r m t o t h e b u d g e t p r o c e s s a r e f r o m E c o n o m i c O u t l o o k 7 2 ,
O E C D ( 2 0 0 7 , p p 7 3 2 – 4
) c o m p l e t e d b y t h e a u t h o r s .

8/3/2019 Geneva13
http://slidepdf.com/reader/full/geneva13 81/162
Europe’s Public Debt Challenge 59
The implication is that Greece and Portugal, which still have some catch-up
potential, may hope to outgrow their public debts. Elsewhere this is unlikely to
be the case.
4.6.2 Spending cuts or tax increases?
According to Alesina and Perotti (1996), lasting debt stabilisations rely primarily
on spending cuts, not tax increases. The argument is that tax increases open up
room for more spending when cyclical conditions have improved. In Europe’s
case, it is often noted that given heavy tax burdens, further tax increases are
likely to worsen also large tax deadweight losses.
Looking at the Eurozone experience offers an interesting outlook on this issue.
Between 1999, the rst year of existence of the euro, and 2006, the last year
before the onset of the crisis, the overall primary budget balance – measured as
percent of GDP – of the Eurozone (dened as the 12 countries that started in 1999
or 2001) worsened by 1.1 percentage points, the result of tax cuts representing
1.3 percentage points and of spending cuts amounting to 0.2 percentage points.
More information is presented in Table 4.4, which compares budgetary
outcomes in the Eurozone and in the rest of the OECD. It shows that, in spite
of the Stability and Growth Pact, scal performance was worse in the Eurozone
than outside in the sense that fewer Eurozone countries managed to improve
their primary budget balances. Both among those that did and the others, the
proportion of countries achieving primary revenue increases was the same as in
the rest of the OECD. In contrast, the proportion of countries achieving spending
cuts was larger in the rest of the OECD. No Eurozone country achieved both
spending cuts and revenue increases at the same time.
Table 4.4 Evolution between 1999 and 2006 (percentage o countries in each group)
Eurozone OECD excluding Eurozone
Improvement o primary budget 29% 59%
Spending cuts 33% 41%
Revenue increases 25% 23%
Both 0% 14%Among countries where primary budget improved:
Spending cuts 67% 46%
Revenue increases 33% 31%
Both 0% 23%
Notes: Eurozone includes the 11 original member countries and Greece, which joined in 2001. The OECDcountries excluding the Eurozone includes Bulgaria, the Czech Republic, Denmark, Estonia, Cyprus, Latvia,Lithuania, Hungary, Malta, Poland, Romania, Slovenia, Slovakia, Sweden, the United Kingdom, Iceland,Norway, Switzerland, the United States, Japan, Canada and Australia.
Source: European Commission (AMECO online).

8/3/2019 Geneva13
http://slidepdf.com/reader/full/geneva13 82/162
60 Public Debts: Nuts, Bolts and Worries
Looking at the Eurozone, a large majority of the countries improving their
primary balances also achieved spending cuts. This supports the results of
Alesina and Perotti. Similarly, in the rest of the OECD, improvements in primary
balances were achieved mostly in countries that cut spending either combinedwith revenue increases or not.
These observations strengthen the argument that, in the Eurozone, spending
cuts are likely to be more helpful in meeting the debt challenge. This conclusion
is reinforced by the population ageing problem, which, as argued above, is
expected to add signicantly to public spending over the next decades.
The empirical observation that scal consolidations are generally more
successful if they are based on spending cuts begs the question why that is so.
Perotti et al (1998) extend Alesina and Perotti’s analysis and show that problems
with large decits and debts in OECD countries typically result from a lack of
control over some parts of government spending. In such situations, spending
cuts force the government to ‘attack the problem at the source’ (Perotti et al,
1998, p 16). Just nding additional revenues will cover the decit problem for
a while, but, without rectifying the underlying spending problem, new decits
will emerge. This brings us back to the role of scal institutions. In Chapter 2, we
have argued that countries with good budgetary institutions will nd it easier to
contain public sector decits and debt. By setting multiannual spending targets
in a contract framework or by delegating the power to set such targets to the
nance minister, governments will nd it easier to develop and implement a
spending-based strategy of scal consolidation. Thus, governments with good
budgetary institutions are more likely to achieve successful consolidations. This
conjecture is consistent with the empirical evidence presented in Von Hagen et
al (2001) for the EU countries in the 1980s and 1990s.
In addition, the choice between revenue and spending based consolidations
involves a difcult judgment regarding the benet of public services and transfers
against the deadweight loss of taxation. The empirical analysis in Afonso et al
(2003), for example, suggests that the efciency of public sector expenditures
is typically much lower for large governments (relative to GDP) than for small
governments, but these estimates are fairly rough. The issue can be addressed
indirectly by looking at revealed preferences, assuming that past actions reect
what governments and their voters wish.43 The evidence presented in Figure 4.6
for the OECD countries is that public spending, as a share in GDP, has tendedto decline between 1995 and 2011 where it was initially larger and to rise at
the opposite end of the spectrum. The mean towards which these countries
have tended to regress is about 45%. In 2011, only three countries exhibit a
spending ratio lower than 45% – Estonia (38%), Luxembourg (39%) and Spain
(42%). (The only non-European country above this threshold is New Zealand.)
All other countries are likely to wish to reduce the size of government. They need
institutional frameworks for their budgetary policies that enable them to do so.
43 In the more realistic view of the world presented in Chapter 2, governments are captured by interestgroups.

8/3/2019 Geneva13
http://slidepdf.com/reader/full/geneva13 83/162
Europe’s Public Debt Challenge 61
4.6.3 Contributions rom Monetary Policy
A unique feature of Europe is the fact that 17 independent countries share a
common currency. This characteristic has long been a source of puzzlement,
concern or even deep scepticism. The countries that created the euro in 1999 were
willing to give up formally monetary policy independence but not sovereignty
in scal policy matters. The seminal Delors Report recognised that a monetary
union requires that every member country respect strict scal discipline. How
to match this requirement with scal sovereignty has been identied as one of
the key challenges of the Eurozone from its inception. It has led to the adoption
of the Excessive Decit Procedure, which imposes an annual decit threshold(3% of GDP) and a debt threshold of 60% of GDP and allows for nes to be
levied on recalcitrant countries. In addition, the Stability and Growth Pact (SGP)
has committed Eurozone member states to even stronger discipline calling for
budgets to be close to balance or in surplus. To implement these commitments
and monitor compliance, a complex system of scal plans and reports has been
set up.
The sovereign debt crisis has conrmed the long-held view that the Stability
and Growth Pact is unlikely to be effective (Eichengreen and Wyplosz, 1997). It
has also conrmed the Delors Report’s insistence that scal indiscipline in some
countries represents a lethal danger for the union as a whole. At the time of thiswriting, the Eurozone is struggling with the crisis.
Figure 4.6 Public spending in the OECD: regressing to the mean
Note: The vertical axis displays the change in the spending/GDP ratio.
Source: Economic Outlook, OCED
y = -0.4507x + 19.755
R2
= 0.5489
-15
-10
-5
0
5
10
15
20 30 40 50 60 70
Public spending in 1995 (% of GDP)
C h a n g e
i n p
u b l i c
s p e n d i n g
1 9 9 5 - 2 0 1 1
8/3/2019 Geneva13
http://slidepdf.com/reader/full/geneva13 84/162
62 Public Debts: Nuts, Bolts and Worries
A striking feature of this sovereign debt crisis is that, so far at least, it has
been circumscribed to the Eurozone. One possible interpretation is that Eurozone
member countries cannot devalue away the contractionary effects of large decit
corrections. Among the other possible interpretations, is the role played by theECB and, more generally, the efforts by European national authorities to bail out
countries in difculty (Wyplosz, 2011a).
An important question is whether the ECB’s emergency purchases of distressed
sovereign debts is a signal that price stability might be traded off against other
pressing objectives, such as alleviating the debt burden of its member countries.
In designing its position on this issue, the ECB will undoubtedly keep in mind
that its mandate unambiguously identies price stability as its rst and foremost
objective. Yet, the ECB’s numerous interventions designed to stabilise sovereign
debt markets are widely seen as stretching its mandate. Hence the question:
will ination play a role in reducing the public debt burden? The conventional
wisdom is that the ECB will not willingly use the ination tax, and we agree even
though the logic behind this policy is not compelling, as discussed in Box 4.1.
Box 4.1 Inationary fnancing o large debts
In addition to providential rapid growth, there are three, and only three, ways
of bringing down public debts. The rst one is to run primary surpluses for
sufciently long. The second one is to default on all or part of the debt. The
last one is to let ination reduce the real debt value, assuming that the debt
is not indexed and of sufciently long maturity. In the end, the question is
who will pay: taxpayers in the rst case, creditors in the second case, citizens
that are not well protected against ination in the third case.
What does history tell us about this choice? Data available for the UK
since the early 19th century is interesting. The rst chart in Figure 4.7 shows
that it took about a century to bring the debt inherited from Napoleonic
wars from about 180% of GDP to 27% on the eve of World War I. The chart
shows the actual debt ratio and the ratio that would have been observed had
the price level been constant, which is what happened in fact. The second
chart does the same for the interwar period. The debt rose to nearly 200% at
the time of the Great Depression and never declined much until World War
II. Had the price level been constant it would have declined substantiallymore, but deation made things worse. The third chart shows that, after
World War II, it took about 40 years to reduce the debt from 270% of GDP
to about 50%, much faster than in the 19th century. The chart also shows
that the debt reduction would have been much smaller had the price level
remained constant. Indeed, from 1946 to 1974 the price level increased
fourfold. Ination played a major role.44 These historical examples show
that it takes considerable time to reduce large debts, and that ination can
accelerate the process.
44 The ination correction is very rudimentary as it ignores the effect on the interest rate. For abetter procedure – which requires information not available – see Buiter (1985), which providesa better interpretation of the post-World War II episode (and reaches the same conclusion).

8/3/2019 Geneva13
http://slidepdf.com/reader/full/geneva13 85/162
Europe’s Public Debt Challenge 63
The ECB will have to credibly clarify its position. Its continuous criticism of
scal indiscipline among member states and its frequent requests for a rigorous
enforcement of the Stability and Growth Pact merely indicate that it understands
the difculties of remaining true to its mandate. Its stern opposition to debt
restructuring during the rst phase of the crisis reects its fears about the stability
of the banking system and has revealed the vulnerability of a monetary policy
relying on loans to the banking system collateralised with government debt
as its primary instrument. Over the course of the crisis, the ECB has lowered
dramatically the quality of collaterals used in lending operations and embarked
on a large-scale bond purchasing programme to support the prices of Greek,Portuguese and Irish debt in order to avoid tensions in its operating system for
monetary policy. As a result, it is no longer entirely sure that (moderate) ination
will not be part of the story.
4.7 Conclusion
European debts were large before the economic and nancial crisis, they grew
quite sizeably during the crisis and the demographic transition is likely to
add another thick layer unless important changes to the pension and healthsystems are made. The seriousness of the situation has been brought home by
Figure 4.7 British public debt (% o GDP)
Note: Actual debt is the ratio of nominal debt to GDP (D/PY). Debt at constant price is caclulated bymultiplying the previous ratio with the price index.
Source: Debt: Abbas et al (2010); Price: O‘Donoghue and Goulding (2004)
0.0
50.0
100.0
150.0
200.0
250.0
1830 1840 1850 1860 1870 1880 1890 1900 1910
Debt Actual Debt (Constant price)
100.0
120.0
140.0
160.0
180.0
200.0
220.0
1918 1921 1924 1927 1930 1933 1936 1939
Debt Actual Debt (Constant price)
0.0
50.0
100.0
150.0
200.0
250.0
300.0
1946 1950 1954 1958 1962 1966 1970 1974
Debt Actual Debt (Constant price)

8/3/2019 Geneva13
http://slidepdf.com/reader/full/geneva13 86/162
64 Public Debts: Nuts, Bolts and Worries
the sovereign debt crisis, which has further shown the risk of contagion within
the Eurozone.
The diagnosis is beyond controversy and the prognosis is hardly in doubt
either. At the time of writing, the crisis has migrated from periphery to corecountries. Whatever the outcome, including plausible sovereign defaults, the
next thirty years cannot be a replay of the previous thirty years. With little hope
that fast economic growth will painlessly wash the problem away, the hitherto
trend increase of debt-to-GDP ratios will have be reversed. This requires the
adoption of effective budgetary arrangements, an issue that is examined in detail
in Chapter 6.

8/3/2019 Geneva13
http://slidepdf.com/reader/full/geneva13 87/162
65
5 Japan’s Fiscal Woes
By the numbers, Japan has the worst scal situation of any major country. This
chapter analyses the state of the scal problem, the economics and politics of
why things worsened, various alternatives for restoring scal soundness, and
prospects for reform, including a reform triggered by market forces. We conclude
that solving Japan’s scal problem requires a coordinated package to raise
productivity growth, end deation, and reorient spending toward productivity
growth such as R&D spending, along with tax reform to promote more efcient
resource allocation. Political governance reforms are also called for, including
reforms of the electoral system, of the regional structure of government, and
of budget procedures. The latter would include increased transparency through
a return to the budget-screening process and hard budget constraints for both
healthcare and pension systems, enforced by supermajority approval for increases
of funding.
5.2 The true state o Japanese nances
The budget debate in Japan is hobbled by many factors, but among the most
important is lack of accurate, timely data on the true state of nances. The debate
centres on the initial budget plan by the central government, referring to the
‘general account’ of the central government only (hereafter CGGA). For scal
year 2008, the last initial budget prior to the global nancial crisis, the CGGA
showed a total size of ¥83.1 trillion (see Table 5.1). On the spending side, social
insurance costs were listed as ¥21.8 trillion, and debt service at ¥20.2 trillion. On
the revenue side, taxes were listed at ¥53.6 trillion, and the nancing requirement
(bond issuance) at ¥25.3 trillion.While these gures are impeccably correct for what they show, the CGGA,
they are highly misleading as a guide to the true state of the Japanese public
sector budget. In fact, total spending in FY2008, properly measured, was ¥196.7
trillion, not ¥83.1. Total social benet spending was ¥104.0 trillion, not ¥21.8
trillion.

8/3/2019 Geneva13
http://slidepdf.com/reader/full/geneva13 88/162
66 Public Debts: Nuts, Bolts and Worries
Table 5.1 General account o the central government, initial budget, FY2008
Expenditure Revenue
Debt Service 20.2 Tax Revenue 53.6
Spending on basic fscal items 62.9 Other Revenue 4.2Social insurance costs 21.8 Bond Issuance Proceeds 25.3
Tax transers to localgovernment
15.6Article 4 Bonds (ConstructionBonds)
5.2
Other 25.5Special Issuance Bonds (DefcitBonds)
20.1
Total 83.1 Total 83.1
Note: This budget was rst presented in December 2007.
Source: Ministry of Finance, http://www.mof.go.jp/budget/budger_workow/budget/fy2008/seifuan20/yosan002. pdf
These immense discrepancies stem from several sources:
(a) Denition of government. The CGGA refers only to a subset of spendingby the central government. It omits local governments and socialinsurance funds. To judge government nances on the basis of theCGGA is equivalent to judging a company on the basis of partialaccounts for the parent company of a complex conglomerate.
(b) Accounting standards. The presentation of the CGGA is a mixture of operating, transfer, nancing and capital transactions. For example,
the social insurance costs of ¥21.8 trillion are, in fact, only the subsidiespaid to the social security fund by the central government from generaltax revenue.
(c) Off-budget items. The CGGA does not include the many ‘specialaccounts’ of the central government, much less similar accounts atlocal governments. This has become a serious distortion recently,because increased transfers from the special accounts to the CGGAare included in ‘other revenue’, even if these accounts oat bonds tosecure the funding for the transfers.45
(d) Supplementary budgets. Japan adopts a ‘supplementary budget’ virtuallyevery year, in the autumn. The purpose of such supplementary budgets
is to bring unexpected spending needs or unexpected revenue needsinto the budget; this is not an unreasonable approach. However, basingthe budget debate on comparison of initial budget in year t to initialbudget in year t – 1 necessarily distorts the debate about economicimpact.
So, what does the budget really look like? A comprehensive look for FY2008
situation is given in Tables 5.2 and 5.3. These gures are from the national
accounts, and refer to the ‘general government’, that is, the consolidated gures
for central government, local government and social insurance. The large
45 For example, in the FY2011 budget, ‘other revenue’ was ¥10.6 trillion, reecting ¥5.1 trillion of suchspecial dividends (sometimes known as ‘maizo-kin’ or ‘hidden treasures’).

8/3/2019 Geneva13
http://slidepdf.com/reader/full/geneva13 89/162
Japan’s Fiscal Woes 67
transfers among the different levels of government are excluded from the net
gures in this presentation.46
Table 5.2 Accounts o general government, consolidated, FY2008
Expenditures 196.7 Total receipts 196.7
Public capital Formation 15.0 Net taxes on production and imports 38.9
Final consumption expenditure 93.4 Taxes on production and imports 41.8
Social benefts in kind (eg medical) 34.3 less: Subsidies 2.9
Provision o non-mkt goods/services 18.5
Actual fnal consumption 40.6 Property income ex interest receipts 0.7
Social benefts in cash 61.4 Current taxes on income and wealth 43.4
Other current transers, net 8.4 Social contributions 57.5
Other current transers, gross 56.2 Other current transer receipts, net 1.6Intragovernment 47.8 Gross current transer receipts 49.4
Rent paid 0.3 Intragovernment 47.8
Interest payments 12.7 Interest receipts 7.7
Capital transers, net 3.6 Capital transers, net 14.5
Capital transers, gross 10.9 Gross capital transer receipts 21.8
Intragovernment 7.3 less: intragovernment amount 7.3
(Total non-fnancing receipts) (164.2)
Land purchases 2.0 Financing receipts 32.5
Source: Japan Cabinet Ofce, National Accounts Yearbook, 2010, p 261.
Some of the contrasts between the consolidated gures and the CGGA gures are
astonishing. For example, spending on social benets (including social benets
in kind, in cash, and net other transfers) is ¥104.0 trillion – not the ¥21.8 seen
in CGGA. Tax revenue (including taxes on production, imports, income, wealth,
and social contributions) is ¥139.8 trillion, not ¥53.6 trillion.
A different and more illuminating way to look at the scal accounts is to break
them into four functional categories, public good provision (eg defence, foreign
policy, education), social benets (pensions, medical, etc), interest payments,
and capital transactions. The results are interesting: the public goods activities
of the government – that is, the public goods and services that the governmentprovides to citizens, funded by general tax revenues – run a surplus, which
amounts to more than ¥10 trillion. Capital transactions also run a surplus, of
similar magnitude.
The balance on interest payments is negative, at about ¥5 trillion, or about
1% of GDP. The largest decit comes in the social benet balance, at more
than ¥46.5 trillion, or 9% of GDP. Taken together, these three items add to the
‘recurring balance’, the net amount that needs to be nanced, of ¥41.3 trillion.
46 For example, in FY2008, gross cash transfers at all levels of general government were ¥56.2 trillion, but
fully ¥47.8 trillion went to other levels of government. This gure is included as a reference line onboth expenditure and receipt sides of the presentation. It is presented the same way in the nationalaccounts.

8/3/2019 Geneva13
http://slidepdf.com/reader/full/geneva13 90/162
68 Public Debts: Nuts, Bolts and Worries
This nancing was provided by repayments of earlier lending by the government
(ie net capital transactions, an inow of ¥8.9 trillion) and by borrowing (mostly
bond issuance) of ¥32.5 trillion – the latter of which is equal to the overall
balance.Thus, it is fair to conclude that Japan runs a tight scal ship, except in the area
of social benets. In this area, unfortunately, expenditures far exceed receipts.
Of course, it is not necessarily wrong for the social benet function to run a
decit. However, social decisions need to be made on how big a decit to run. As
things stand now, virtually every other part of government – defence, education,
science, economic development, etc – is being starved in order to pay for social
benets that are underfunded.
Table 5.3 Business line breakdown o government transactions, FY2008
Operating balance 10.1Operating income 84.5
Operating expenditure 74.5
Social benet balance -46.5
Social system receipts 57.5
Social system payments 104
Interest balance -4.9
Receipts 7.7
Expenditure 12.7
Capital transactions balance 8.9
Capital transer receipts 14.5Captiral transer expenditure 3.6
Land purchase 2
Overall balance -32.5
Non-fnancing receipts 164.2
Expenditure 196.7
Source: Cabinet Ofce, Annual Report on National Account s, 2010, p 261, and Morgan Stanley calculations.
The history of Japanese scal accounts, using this functional breakdown, is shown
in Figure 5.1. The key point is the social balance, which hovered at a decit of
somewhat less than 5% of GDP until 1997. It attened a bit in the 2003–2007
period, but then resumed its expansion. This pattern occurred because of benetincreases, which have easily outrun contribution increases for the last 20 years
(Figure 5.2). Ageing of the population has contributed to this pattern, but much
more is at work. After all, ageing proceeded apace in the 1980–92 period, with no
increase in the social decit. This observation suggests that control over social
spending must play a key role in any scal consolidation programme. Such
control could come either in the numerator (ie holding down costs) of the ratio
or in the denominator (raising GDP) – an issue addressed below. Either way, there
is clearly a need for a hard budget constraint in social spending.
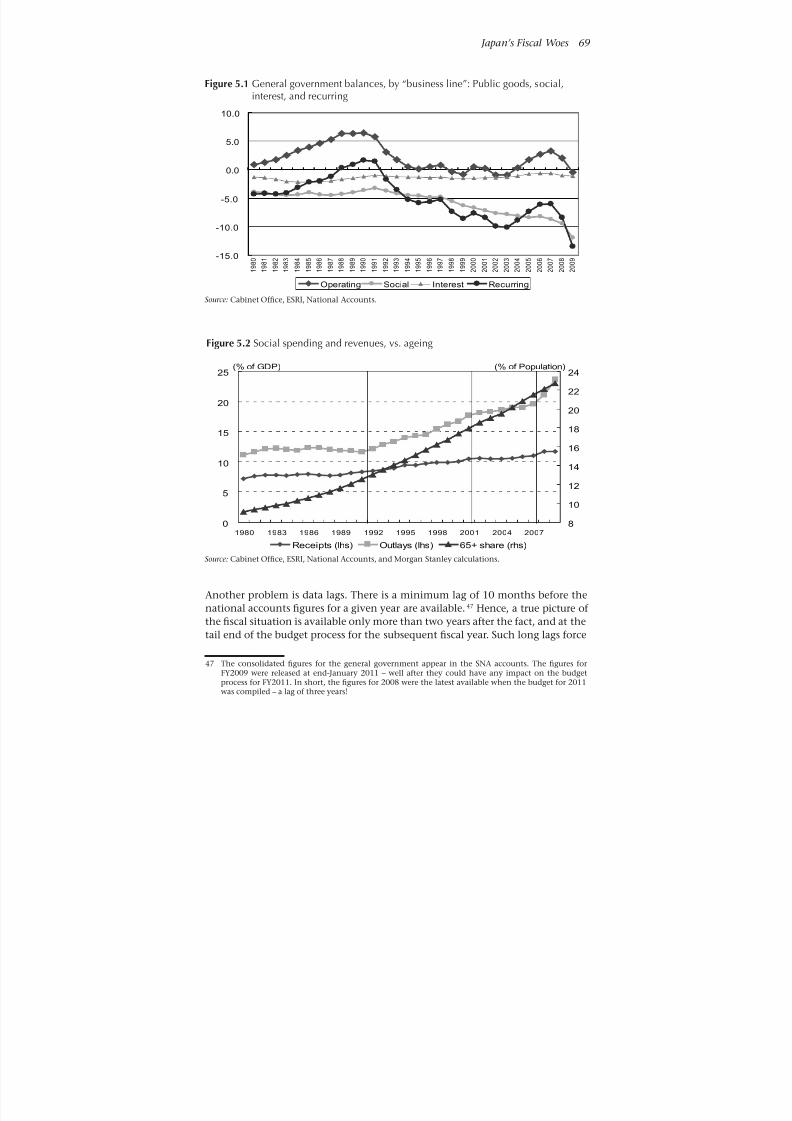
8/3/2019 Geneva13
http://slidepdf.com/reader/full/geneva13 91/162
Japan’s Fiscal Woes 69
Another problem is data lags. There is a minimum lag of 10 months before the
national accounts gures for a given year are available.47 Hence, a true picture of
the scal situation is available only more than two years after the fact, and at the
tail end of the budget process for the subsequent scal year. Such long lags force
47 The consolidated gures for the general government appear in the SNA accounts. The gures for
FY2009 were released at end-January 2011 – well after they could have any impact on the budgetprocess for FY2011. In short, the gures for 2008 were the latest available when the budget for 2011was compiled – a lag of three years!
Figure 5.1 General government balances, by “business line”: Public goods, social,interest, and recurring
Source: Cabinet Ofce, ESRI, National Accounts.
-15.0
-10.0
-5.0
0.0
5.0
10.0
1
9 8 0
1
9 8 1
1
9 8 2
1
9 8 3
1
9 8 4
1
9 8 5
1
9 8 6
1
9 8 7
1
9 8 8
1
9 8 9
1
9 9 0
1
9 9 1
1
9 9 2
1
9 9 3
1
9 9 4
1
9 9 5
1
9 9 6
1
9 9 7
1
9 9 8
1
9 9 9
2
0 0 0
2
0 0 1
2
0 0 2
2
0 0 3
2
0 0 4
2
0 0 5
2
0 0 6
2
0 0 7
2
0 0 8
2
0 0 9
Operating Social Interest Recurring
Figure 5.2 Social spending and revenues, vs. ageing
Source: Cabinet Ofce, ESRI, National Accounts, and Morgan Stanley calculations.
0
5
10
15
20
25
1980 1983 1986 1989 1992 1995 1998 2001 2004 2007
8
10
12
14
16
18
20
22
24
Receipts (lhs) Outlays (lhs) 65+ share (rhs)
(% of GDP) (% of Population)

8/3/2019 Geneva13
http://slidepdf.com/reader/full/geneva13 92/162
70 Public Debts: Nuts, Bolts and Worries
the debate into reliance on partial gures such as those of the Ministry of Finance
(MoF) initial budget.
This state of affairs raises an interesting riddle. On one hand, it has been
known for years that Japan will never solve the scal problem until there areaccurate,48 timely data on scal spending and revenue. Yet, very few steps have
been taken to correct the situation.49 If the problem is so glaringly obvious, why
has so little been done? The answer to this question is essentially a matter of
political economy and of budget procedures – precisely along the lines discussed
in the chapter on political economy. The major problems are the common pool
problem and the budget procedure problem.
5.3 Political economy o scal policy in Japan: The common
pool is very deepChapter 2 explains that a common pool problem arises when the marginal
benets from public spending are not aligned with the marginal costs of associated
funding. Interest groups that have stronger control over the outows from the
common pool (through spending policy) and to the coercive measures creating
inows into the common pool (ie the tax system) act perfectly rationally when
they vote taxes for others and benets for themselves. In Japan this process is
built into the electoral system in a way that has resulted in today’s scal problem.
This is essentially a question of who benets, who pays, and why.
A rough estimate of the age breakdown of transfer benets from public spending
is easy (Table 5.4). The issue comes down to a question of entitlements, which in
turn comes down to pension and medical payments. The largest share of these
payments naturally goes to the elderly. All pensions are assumed to accrue to
the elderly. Of medical costs, the share from the Old Age Medical Care system is
attributed 100% to the elderly. The other categories show different assumptions,
based on the nature of the system. (For example, we attribute 0% of medical costs
for the employee medical system to the elderly.50) For nursing care, we assume
100% of benets go to the elderly. One could adjust the percentages assumed in
the table somewhat; however, the overall result would not change: the elderly
48 See, for example, Tanaka Hideaki, ‘Makuro Zaisei Unei to Koukaikei Joho – Koukaikei no Yakuwari toGenkai’, PRI Discussion paper series, No. 05A-06, Japan Ministry of Finance, April 2005; Ministry of Finance, Fiscal System Council (Zaisei Seido Shingikai, ‘Kokaikei ni Kan suru Kihonteki Kangaekata’[Basic Approach to Public Accounting]), 30 June 2003.
49 Which is not to say that nothing has been done. Over the last few years, the Ministry of Finance hasworked with the Ministry of General Affairs (which oversees local government nances) to create acredible set of indicators to gauge the health of the 1,800 local governments around the country. MoFdid this in its capacity as lender and guarantor of the borrowing by local governments, a role knownas ‘lender responsibility’. This change was triggered in part by the non-performing loan problem in theprivate sector. When private banks were required to classify loans to companies on the basis of criteriameasuring strength of the borrowers, it seemed only rational for MoF to do the same. Hence, a set of similar criteria have been developed and implemented.
50 This system applies to employees of larger rms. When a claim is made, the employees pays 30% of the cost (20% for dependants of the employee), and 70% is paid by the insurance system. The gurein the table above covers the amounts paid by the system for these people. For example, when the
author recently purchased 2 months of blood pressure medication at a pharmacy, the overall cost was¥10,890. The author himself paid ¥3,270, and the system covered the remaining ¥7,620. The latter sumof ¥7,620 will show up in the ‘Employee Health Insurance Associations’ line item.

8/3/2019 Geneva13
http://slidepdf.com/reader/full/geneva13 93/162
Japan’s Fiscal Woes 71
account for ¥78 trillion of the total ¥95 trillion of social transfers. In short, the
elderly benet.
Table 5.4 Rough estimate o government transers or seniors, FY2008
Amount
(¥ trillion)% or seniors
Amount or
seniors
(¥ trillion)
Total 95.2 78.2
Medial 28.1 17.9
Medical (regular) 11.7 50% 5.9
Medical (old age) 10.5 100% 10.5
Employee health insuranceassociations
3.6 0% 0.0
National health insuranceassociation
2.3 67% 1.5
Pension 50.3 50.3
Private sector employees 43.0 100% 43.0
Public sector employees 7.3 100% 7.3
Nursing care 6.6 100% 6.6
Unemployment/accident insurance 2.3 0% 0.0
Other 8.0 3.4
Child allowances 1.0 0% 0.0
Ununded assistance 6.8 50% 3.4
Other 0.2 0% 0.0
Source: Japan Cabinet Ofce, Annual Report on National Accounts, 2010, p. 271.
Who pays? This is a complex question that must trace incidence of various taxes
by age categories, probably an impossible task. However, it is quite reasonable
to conclude that the elderly do not pay 49% of the total revenue burden – the
percentage implied by taking their estimated transfer benets (¥78.2 trillion) as a
share of total government revenue (¥164.2 trillion). After all, taxes on production,
imports and income fall on the working generation, for the most part, as do
social contributions. In short, the young pay.
These data conrm that the common pool problem is very substantial in Japan.The origin of this problem lies in the structure of the electoral system, which de
facto heavily overweights the votes of the elderly. This distortion arises due to
years of neglect of re-districting in the electoral system. Evidence is provided in
Figure 5.3. The gure plots the old/young population ratio (over 65 vs 20–39) of
each prefecture against the population per seat in each house (Upper and Lower
Houses) of the Diet. Both lines are downward sloping. This means that a larger

8/3/2019 Geneva13
http://slidepdf.com/reader/full/geneva13 94/162
72 Public Debts: Nuts, Bolts and Worries
share of the elderly is associated with a lower number of votes per seat. It is easy
for older population prefectures to get a seat in the Diet.51
In summary, the old are systematically over-represented in the electoral system.
The failure of election redistricting to reect population movement of the youngto the cities has biased the electoral system toward the old. In addition, older
people are highly mobilised on issues of concern to them, while younger people
are concerned about other issues, with diffuse preferences. In the end, therefore,
it is hard to be elected without the old. Thus, in a freakonomically rational way,
scal policy has been distorted so that the old benet and the young pay. So long
as the electoral system continues this structure, it will be hard to make the social
decisions to correct the scal decits. Economic growth is likely to suffer as well,
due to distorted incentives to work and invest.
51 The Upper House election of 2010 provided a perfect example, in the contrast of results in TokyoPrefecture and Tottori Prefecture. Tokyo has a population of about 12 million, and gets ve UpperHouse seats in each election. The system works in a ‘n-past the post’ system, so that the candidatesin Tokyo with the rst through fth most votes get the seats. In the last election, the sixth candidatereceived about 550,000 votes, but, being sixth, did not get a seat. In contrast, Tottori Prefecture has apopulation of about 600,000, and gets only one seat per Upper House election. Only the top vote-getter
wins a seat. In the last election, the winner received about 160,000 votes. The population structure inTokyo is young and that in Tottori is old. Thus, de facto, the young are disenfranchised by the currentsystem.
Figure 5.3 Old/young ratios vs. population/seat, by preecture
Source: Japan Cabinet Ofce for population data, Ministry of General Affairs for data of Diet seats, andMorgan Stanley research calculations.
100
200
300
400
500
600
0.70 0.90 1.10 1.30 1.50 1.70
Old/Young Ratio
V o
t e r s / s e a t
Upper House
UH Fitted
Lower House
LH Fitted

8/3/2019 Geneva13
http://slidepdf.com/reader/full/geneva13 95/162
Japan’s Fiscal Woes 73
5.4 The budget procedure problem
Looking at budget procedures, Chapter 2 distinguishes between the top-
down delegation approach and the bottom-up contracting approach.
52
In thedelegation approach, a top-down, single individual (notionally the nance
minister – sometimes a backroom politician telling the nance minister and the
rest of the ruling party what to do) sets the agenda, decides the allocations, and
enforces discipline. For this approach to work, there needs to be strong party
discipline and strong power of coercion versus individual party members. In the
contract approach, distributed power centres negotiate an agreement. For this
approach to work, there needs to be transparency of objectives, negotiations, a
public monitoring function, and discipline of transgressors. Note that the power
centres need not be groups of politicians only; bureaucratic, business, and labour
interest groups can be part of the process, to the extent that they support different
political groups and have enforcement power over politicians.
Those familiar with Japanese budget negotiations will have no trouble
characterising Japan’s system as closer to the contract approach. Unfortunately,
the contracts are unwritten, unenforceable and short-lived. A faint glimmer of
improvement occurred in the FY2011 negotiations for the initial budget of CGGA,
when Finance Minister Yoshihiko Noda set an overall spending limit loudly and
publicly, and forced adherence. He also set an overall nancing limit (¥44.3
trillion of new bond issuance), and forced adherence. However, the longevity
of these victories remains at question. When the accounting is so partial, it is
not clear that holding spending in an account that covers less than half of total
spending will in fact succeed in achieving actual discipline.
At a deeper level, the contract approach is hobbled in Japan by several
institutional problems. First is the non-philosophical basis of the two major
parties. For complex historical reasons, both major parties include factions with
diametrically opposed views on economic policy (eg big vs small government) –
and often on foreign policy as well. As leadership shifts among the factions in
each party, few will trust the credibility of any contract. The voters therefore do
not trust either major party to carry through on promises. Second, leadership of
both major parties is weak, reecting the balkanised factional structure. When
no one within a given party is strong enough to enforce an agreement with party
colleagues, other political parties are unlikely to agree to anything.Another problem is that transparency of budget decisions is virtually zero.
The basic budget is drawn up by ministries between August and December, and
a short period of re-negotiation occurs at the end of December, just when year-
end vacation season distracts public attention. The Diet and vested interests are
highly active through the entire process, but it is very hard for the general public
to see what is being discussed, who is inuencing the decisions, and even what
the nal outcome is.
Moreover, transparency is worsened by tradition. Common practice in Japan
prevents the bureaucracy from providing budget information or background
data to opposition parties. The logic for this approach is simple. The bureaucracy52 See Von Hagen (2004 and 2006b).

8/3/2019 Geneva13
http://slidepdf.com/reader/full/geneva13 96/162
74 Public Debts: Nuts, Bolts and Worries
works for the government, and the government is formed by the ruling party;
therefore, it would be a violation of discipline for the bureaucracy to provide
information to the opposition. Needless to say, this tradition makes it harder for
opposition parties to challenge government analysis of spending priorities.
5.5 Budget screenings: An attempt at process improvement
The change of government in 2009, when the Democratic Party of Japan (DPJ)
defeated the long-ruling Liberal Democratic Party (LDP), brought an attempt to
improve transparency, in the form of ‘budget screening’ ( jigyo shiwake). Essentially
a campaign of ‘name and shame’, the budget screening was a set of DPJ organised
committees, comprised of Diet members and private sector citizens,53 who
examined nearly 300 specic budget programmes, and made recommendations
on whether to kill, cut or keep. The committee meetings were held not only in
public, but were also broadcast, both by television and through webcasts. Public
interest in the process was immense – as was bureaucratic interest, since the old
rules for budget decision were now being challenged.
For each examined programme, there was a ve-stage process. First, the
bureaucrats in charge presented the content, the justication, and the impact of
the programme. Second, a Ministry of Finance inspector gave MoF’s assessment.
Third, the Diet members on each committee gave their views of the politics of
the needs being addressed. Fourth, the private sector members asked questions
and made comments. Finally, the private sector members wrote evaluations
on a single-sheet of paper, with recommendations on whether to kill, cut or
keep. While the DPJ did not commit to honouring the recommendations of the
committees, it did promise to give them adequate weight when formulating the
budget. In the end, the committees identied about ¥1 trillion of immediate
savings, with another ¥1–2 trillion of longer-term savings.
Although the budget screening exercise had a tinge of show trial and saved a
rather small amount, it did accomplish some important goals. First, it opened the
process of budget decisions to public scrutiny in a way never seen before. Second,
it put the regular participants in the budget process on notice that their decisions
could be examined in public, and therefore had to be justied on the basis of
logic and efciency.54 Third, it created intense public debate on many issues, suchas the national supercomputer project. That said, some weaknesses in the budget
screening process were also obvious. Five such weaknesses stand out.
First, screenings should be carried out with an overall objective. Because the
DPJ had not specied any growth strategy for the country, it was difcult for the
committee members to put spending in context.
53 One of the authors was a member of one of the original DPJ budget screening committees.54 For example, in the author’s committee, the members repeatedly asked whether the mandatory
calculations of cost/benet ratios for projects had been done. They usually had been. However, when
we asked how the cost/benet ratios were used in the nal decision on whether to implement a project,the answer was, ‘We do not use them.’ Prior to the budget screenings, the cost/benet calculations wereregarded as a nuisance. After the screenings, these calculations now have more weight.

8/3/2019 Geneva13
http://slidepdf.com/reader/full/geneva13 97/162
Japan’s Fiscal Woes 75
Second, because the entire process was televised, it gave mixed incentives to
the Diet member participants, that is, whether to use the committees to improve
budget discipline or to advance their name recognition in the public. In short,
the process included an invitation to populism.
55
Third, the qualications of the committee members did not always t the
complexity of the decisions at hand. Any adversarial process creates incentives for
participants to omit material information; hence, unless committee members are
familiar with the issue at hand, they can be easily manipulated or misinformed
– like trial juries.
Fourth, the choice of items to assess was not necessarily neutral. Because
the selection was made by the newly elected political party, there was a natural
tendency to examine the questionable projects of their predecessors most closely
and to ignore their own questionable projects.
Fifth, the process was also subject to manipulation by bureaucracies. When
a project that the bureaucracy had initially opposed was examined, the
bureaucracy could do an intentionally bad job of defending it, and thus trigger
a ‘kill’ decision.56
Another signal of success of the budget screening process was the immediate
use of exactly the same process by the LDP to attack spending priorities of the DPJ.
Very soon after the DPJ’s process ended, the LDP convened similar committees,57
and did budget screenings of the DPJ’s favourite programmes, such as the child
allowance system and the free-road toll proposal.
Will the budget screening initiative become a permanent feature of the Japanese
process? The signals so far are mixed. The DPJ did use the same process twice
more, once to examine public sector corporations and special accounts, and once
to examine regulatory rules that might be hindering growth. However, there were
no new budget screening sessions in preparation of the FY2011 budget. With the
high burden of dealing with the impact of the recent earthquake, tsunami and
radiation issues, it seems unlikely that this promising initiative will re-emerge
soon.
5.6 Taming the beast: The arithmetic o scal restructuring
Fiscal reform proposals in Japan have another common aw: they often do notreect simple arithmetic. For example, a common goal of scal reform plans
has been to stabilise the ratio of debt to GDP. In the same breath, the plans
also aim for a target of zero for the primary balance (compared to a decit for
2008 estimated by the OECD of 5.0%). These goals are contradictory. For the
debt ratio to be stabilised, the numerator and the denominator of the ratio must
grow at the same rate. This happens when the primary balance as a percentage
55 In contrast, the old system of negotiations among vested interests behind closed doors gave no role atall to public opinion, until decisions had largely been nalised.
56 There is a role here for legal scholars to look at such adversarial processes, and see how rules of evidence
and judgment could be introduced, in order to ensure fairness.57 The relevant author was also a member of the LDP’s budget screening committee. The process and the
rules were identical to those used by the DPJ, by design.
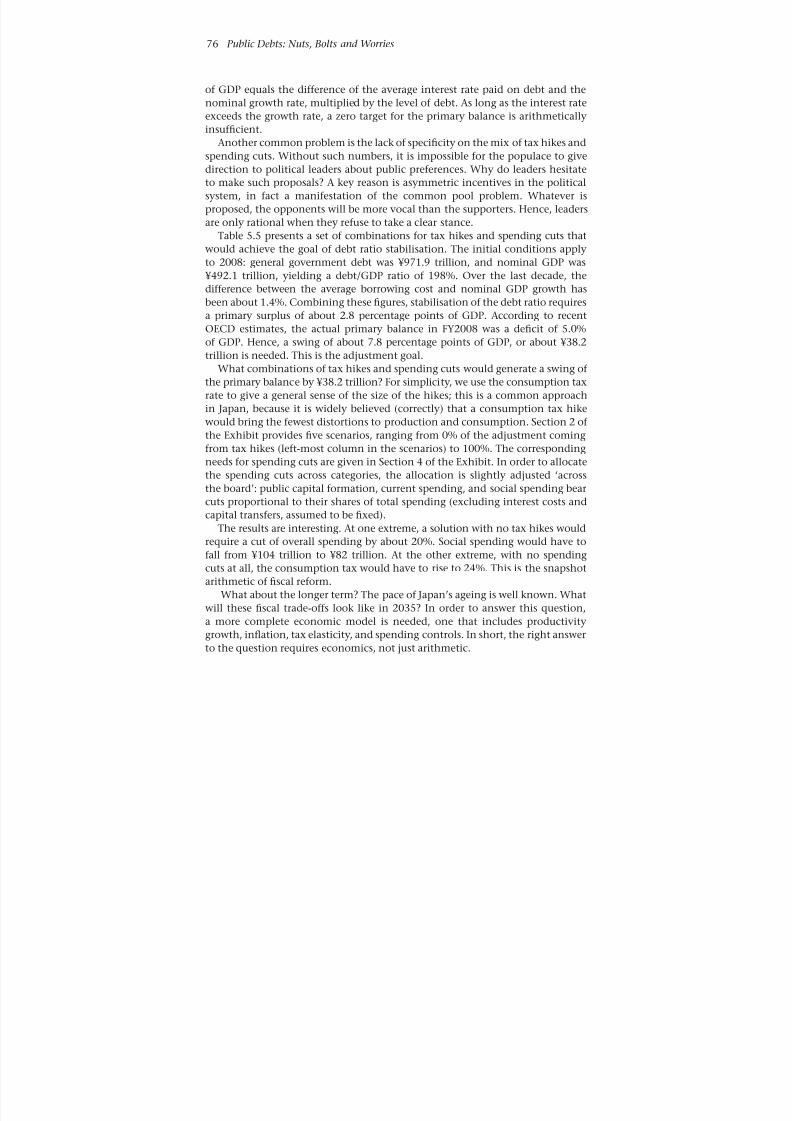
8/3/2019 Geneva13
http://slidepdf.com/reader/full/geneva13 98/162
76 Public Debts: Nuts, Bolts and Worries
of GDP equals the difference of the average interest rate paid on debt and the
nominal growth rate, multiplied by the level of debt. As long as the interest rate
exceeds the growth rate, a zero target for the primary balance is arithmetically
insufcient.Another common problem is the lack of specicity on the mix of tax hikes and
spending cuts. Without such numbers, it is impossible for the populace to give
direction to political leaders about public preferences. Why do leaders hesitate
to make such proposals? A key reason is asymmetric incentives in the political
system, in fact a manifestation of the common pool problem. Whatever is
proposed, the opponents will be more vocal than the supporters. Hence, leaders
are only rational when they refuse to take a clear stance.
Table 5.5 presents a set of combinations for tax hikes and spending cuts that
would achieve the goal of debt ratio stabilisation. The initial conditions apply
to 2008: general government debt was ¥971.9 trillion, and nominal GDP was
¥492.1 trillion, yielding a debt/GDP ratio of 198%. Over the last decade, the
difference between the average borrowing cost and nominal GDP growth has
been about 1.4%. Combining these gures, stabilisation of the debt ratio requires
a primary surplus of about 2.8 percentage points of GDP. According to recent
OECD estimates, the actual primary balance in FY2008 was a decit of 5.0%
of GDP. Hence, a swing of about 7.8 percentage points of GDP, or about ¥38.2
trillion is needed. This is the adjustment goal.
What combinations of tax hikes and spending cuts would generate a swing of
the primary balance by ¥38.2 trillion? For simplicity, we use the consumption tax
rate to give a general sense of the size of the hikes; this is a common approach
in Japan, because it is widely believed (correctly) that a consumption tax hike
would bring the fewest distortions to production and consumption. Section 2 of
the Exhibit provides ve scenarios, ranging from 0% of the adjustment coming
from tax hikes (left-most column in the scenarios) to 100%. The corresponding
needs for spending cuts are given in Section 4 of the Exhibit. In order to allocate
the spending cuts across categories, the allocation is slightly adjusted ‘across
the board’: public capital formation, current spending, and social spending bear
cuts proportional to their shares of total spending (excluding interest costs and
capital transfers, assumed to be xed).
The results are interesting. At one extreme, a solution with no tax hikes would
require a cut of overall spending by about 20%. Social spending would have tofall from ¥104 trillion to ¥82 trillion. At the other extreme, with no spending
cuts at all, the consumption tax would have to rise to 24%. This is the snapshot
arithmetic of scal reform.
What about the longer term? The pace of Japan’s ageing is well known. What
will these scal trade-offs look like in 2035? In order to answer this question,
a more complete economic model is needed, one that includes productivity
growth, ination, tax elasticity, and spending controls. In short, the right answer
to the question requires economics, not just arithmetic.

8/3/2019 Geneva13
http://slidepdf.com/reader/full/geneva13 99/162
Japan’s Fiscal Woes 77
T a b l e
5 . 5
G e n e r a l g o v e r n m e n t f s c a l c o n s o l i d a t i o n s c e n a r i o s : h a r d
c h o i c e s
I n i t i a l
C o n d i t i o n s
G e n e r a l g o v ' t d e b t l e v e l ( e n d F Y 2 0 0 8 )
9 7
2
N o m
i n a l G D P i n F Y 2 0 0 8
4 9
2
D e b t l e v e l ( a s % o
G D P )
1 9 8
%
R e q u i r e d a d j u s t m e n t o f t h e P r i m a r y B a l a n c e ,
b a s e d o n t h e p r i m a r y b a l a n c e e q u a
t i o n ,
P B / Y >
( r - g ) [ D / Y ]
r - g a
s s u m p t i o n
1 . 4
%
R e q u i r e d P B / Y
2 . 8
%
R e q u i r e d P B ( ¥ t r l )
1 3
. 6
A c t u
a l P B / Y ( F Y 2 0 0 8 , O E C D )
- 5 . 0
%
A c t u
a l P B ( ¥ t r l )
- 2 4
. 6
R e q u i r e d a d j u s t m e n t o P B ( ¥ t r l )
3 8
. 2
T a x h i k e a s s u m p t i o n
% o
a d j u s t m e n t r o m t a x h i k e
0 %
2 5 %
5 0 %
7 5 %
1 0 0 %
C o n s u m p t i o n t a x h i k e a m o u n t ( ¥ t r l )
0 . 0
9 . 6
1 9 . 1
2 8 . 7
3 8 . 2
C o n s u m p t i o n t a x r e v e n u e ( l e v e l )
1 0 . 1
1 0 . 1
1 9 . 6
2 9 . 2
3 8 . 7
4 8 . 3
T a x r a t e
5 . 0 %
5 . 0 %
9 . 8 %
1 4 . 6 %
1 9 . 4 %
2 4 . 1 %
S p e n d
i n g s c e n a r i o s
% o
a
d j u s t m e n t r o m s p e n d i n g c u t
F Y 2 0 0 8
C u t
1 0 0 %
7 5 %
5 0 %
2 5 %
0 %
S p e n
d i n g l e v e l s
l e v e l s
r a t i o s
3 8 . 2
2 8 . 7
1 9 . 1
9 . 6
0 . 0
T o t a l s p e n d i n g l e v e l
1 9 6 . 7
1 0 0 . 0 %
1 5 8 . 5
1 6 8 . 1
1 7 7 . 6
1 8 7 . 2
1 9 6 . 7
P u b l i c c a p i t a l o r m a t i o n
1 5 . 0
8 . 4 %
1 1 . 8
1 2 . 6
1 3 . 4
1 4 . 2
1 5 . 0
C u r r
e n t s p e n d i n g
5 9 . 4
3 3 . 3 %
4 6 . 7
4 9 . 9
5 3 . 1
5 6 . 3
5 9 . 4
S o c i a l s p e n d i n g a n d t r a n s e r s
1 0 4 . 0
5 8 . 3 %
8 1 . 7
8 7 . 3
9 2 . 9
9 8 . 4
1 0 4 . 0
I n t e r
e s t p a y m e n t s
1 2 . 7
0 . 0 %
1 2 . 7
1 2 . 7
1 2 . 7
1 2 . 7
1 2 . 7
C a p i t a l t r a n s e r s
5 . 6
0 . 0 %
5 . 6
5 . 6
5 . 6
5 . 6
5 . 6
P e r c e n t c h a n g e s v s . 2 0 0 8
T o t a l s p e n d i n g
- 1 9 . 4 %
- 1 4 . 6 %
- 9 . 7 %
- 4 . 9 %
0 . 0 %
P u b l i c c a p i t a l o r m a t i o n
- 2 1 . 4 %
- 1 6 . 1 %
- 1 0 . 7 %
- 5 . 4 %
0 . 0 %
C u r r
e n t s p e n d i n g
- 2 1 . 4 %
- 1 6 . 1 %
- 1 0 . 7 %
- 5 . 4 %
0 . 0 %
S o c i a l s p e n d i n g a n d t r a n s e r s
- 2 1 . 4 %
- 1 6 . 1 %
- 1 0 . 7 %
- 5 . 4 %
0 . 0 %
S o u r c e : J a p a n C a b i n e t O f c e , A n n u a l R e p o r t
o n N a t i o n a l A c c o u n t s , a n d M o r g a n S
t a n l e y c a l c u l a t i o n s .

8/3/2019 Geneva13
http://slidepdf.com/reader/full/geneva13 100/162
78 Public Debts: Nuts, Bolts and Worries
5.7 The economics o scal reorm
The main problem with the arithmetic approach is a hidden assumption, that
the economy would remain stable in the face of any of the tax-hike/spendingcut combinations. Even the most ardent supply-sider or Ricardian equivalence
advocate would struggle to justify such an assertion.58 Even if true in the long
run, it could not be true in the short run, and thus would have problems of
political sustainability (Berkmen, 2011).59
This observation implies that any scal reform plan will be contractionary,
whether done through tax hikes or spending cuts. Hence, in order to stabilise
the economy, alternative sources of demand must be found, while the scal
consolidation is continuing. There are only two alternatives, foreign demand
and domestic private demand. Thus, any successful scal plan must included
measures to enhance productivity and competitiveness and/or raise domestic
private demand.
For foreign demand, exchange rate policy is an obvious choice – at least for
a single country. However, all of the major industrial countries now face serious
scal problems. Thus, all would have to devalue versus the emerging countries,
since they cannot all devalue against each other. To an extent therefore, G20
deliberations on exchange rates must be a part of the scal reform plans of the
industrial countries. Whether the emerging countries would agree remains an
open question.
This is why enhancing domestic private demand – without spending more
money – is a key part of any scal reform strategy. 60 Reallocation of spending
toward R&D is one alternative. (Of course, such a reallocation would make the
cuts in social spending all the greater.) Alternatively, regulatory policies may
provide new opportunities for growth. It is clearly important to link the scal
and growth issues.
5.8 A growth-model approach to scal reorm
How much productivity growth is needed to pay for the aged? How can
spending control be implemented in such a model, in order to make it politically
sustainable? What levels of ination and benet adjustments are possible andplausible? To explore these issues, we compute the growth of productivity needed
to keep the share of transfers to seniors constant as a share of GDP, under the two
‘freeze’ scenarios described above.
58 In a recent conversation, a top ofcial (political appointee) at the Ministry of Finance expressed theview that tax hikes would actually stimulate the economy. The idea was that tax hikes would spreadsuch a relief about the future of the social security system going forward that older citizens wouldspend much more freely, and generate a net improvement in the economy.
59 For an econometric model of this matter, see Berkmen (2011).60 There is an ambiguity about whether to call such policies Keynesian or supply side. For example, a
regulatory change that increases investment demand – such as the deregulation of cell phone handset
ownership in the mid-1990s – could be called a supply-side policy. However, a key impact of thissupply-side policy was an explosion of business investment demand, as telecom companies built outtheir networks.

8/3/2019 Geneva13
http://slidepdf.com/reader/full/geneva13 101/162
Japan’s Fiscal Woes 79
The structure of the model is as follows. Real GDP is determined by
demographics and assumptions (which we use to construct scenarios) on
productivity growth. Computing nominal GDP requires assumptions about
the path of the GDP deator: we foresee a gradual move from deation nowto a target level of ination in 2015, after which the target level of ination is
maintained. Regarding scal policy, we assume that the elasticity of tax revenue
relative to nominal GDP is 1.3x to derive total revenue.
The spending side is more complicated, in light of the politically difcult
decisions to be taken. Because ageing is the key driver of scal spending, we
separate total scal spending into the portion used for the elderly and the portion
used for others. For the elderly, we posit an ‘adjustment period’ from now to
2017, and then a normalisation period. The growth of nominal spending per
capita on the elderly is the control variable. Obviously, the difference between
these nominal spending paths and the course of the GDP deator determines
whether the real value of per capita benets for the elderly will rise or fall. For
the non-elderly, we proceed in a similar way, but with different assumptions
about the growth rates for nominal spending during the adjustment period
and thereafter. A key determinant of the ‘quality’ of scal policy is the balance
between the real spending implied for the elderly and the non-elderly. In some
scenarios, we assume that a reallocation of spending toward the non-elderly will
raise the growth rate of productivity.
Finally, concerning nancial conditions, the average cost of borrowing for the
government is the weighted average of its own history and the current ination
rate (the weights are 0.75 and 0.25, respectively). Total interest payments are then
determined by the previous year’s debt stock and this average cost of borrowing.
This cost of debt is then added to the spending on the elderly and on the non-
elderly to determine total scal spending for a given year.
Results for different scenarios are shown in Table 5.6. The results are meant to
illustrate some natural policy measures and therefore to map out plausible actions.
The baseline is reected in the ‘Do Nothing’ scenario. This scenario leaves annual
productivity growth at the recent average of 1%, and price change at the recent
average of –1.0%, while freezing nominal spending per capita (on both elderly
and non-elderly) at the current levels. Given demographics (and assuming that
the decits are somehow nanced!), this baseline shows total spending at 49.9%
of GDP in 2035, compared to 33.1% in 2008. The debt/GDP ratio rises to 685%of GDP – which suggests that the scenario is not sustainable. The other scenarios
show how much would have to be done, instrument by instrument, to bring the
overall decit to around 0% of GDP by 2035.

8/3/2019 Geneva13
http://slidepdf.com/reader/full/geneva13 102/162
80 Public Debts: Nuts, Bolts and Worries
Table 5.6 Macro/fscal scenarios in a growth model: values or 2035
Do nothing Tax hikesProductivity
growthInation
Spendingcuts
Productivity growth 1.0% 1.0% 2.6% 1.0% 1.0%GDP deator rise -1.0% -1.0% -1.0% 2.8% -1.0%
Nominal spending growth 0.0% 0.0% 0.0% 0.0% -2.5%
Defcit/GDP, 2035 21.0% 0.0% -0.7% 0.3% -0.2%
Debt/GDP, 2035 685.1% 509.2% 267.2% 298.7% 398.1%
Govt. spending/GDP, 2035 49.9% 48.4% 32.9% 37.8% 29.0%
Real GDP/capita(2000 ¥ million), 2035
5.40 5.40 8.12 5.40 5.40
Real spending/eldery(2000 ¥ million), 2035
3.89 3.89 3.89 1.97 2.07
Real spending/non-eldery
(2000 ¥ million), 20351.20 1.20 1.20 0.61 0.64
Source: Morgan Stanley calculations.
Tax hikes, if used alone, would have to raise the tax-take to 48.4% of GDP
(the discrepancy compared to the do-nothing case due to interest costs). This
compares with about 28% of GDP in FY2008. It is hard to see how productivity
growth would remain at 1%, in the face of a tax hike of 20 percentage points of
GDP.
Productivity growth is the most attractive alternative. By raising productivity
growth from 1% in the baseline to 2.6%, the debt/GDP ratio peaks at about 280%
in the early 2020s, and declines modestly thereafter. Real spending per capita
is maintained easily because productivity is so much higher; indeed, output
per worker rises to ¥8.12 million in 2035, compared to ¥5.40 in the baseline.
The problem with this scenario is how to achieve such a huge improvement of
productivity growth.
Ination could also eliminate decits and stabilise the debt/GDP ratio, but
at a major social cost. Real spending per capita falls by nearly 50% – because
nominal spending is held down while ination rises. This comparison suggests
that political sustainability of the ‘ination only’ approach would be low. The
mix of productivity growth and ination clearly matters, for a given level of
nominal GDP growth.61 Moreover, in the real world, there would be a problemwith indexation. Pensions and medical spending tend to be more indexed to
ination than other types of spending. Hence, the real cuts to the other types
of spending – which are more likely to enhance productivity growth – would be
larger. In short, the negative impact of ination on productivity growth might
also be problematic.
Spending cuts are the nal alternative. As with ination, the implications for
welfare are dire. Annual per capita spending cuts of about 2.5% would be needed.
61 That is, for a given sum of the productivity growth rate and the ination rate, a higher growth for
productivity generates higher welfare. This is because the scal adjustment in the case of higherination comes from the gap between capped nominal growth of spending on the elderly and thegeneral ination rate.

8/3/2019 Geneva13
http://slidepdf.com/reader/full/geneva13 103/162
Japan’s Fiscal Woes 81
Even with a 1% drop of prices every year, the impact on welfare would be huge.
Moreover, the debt/GDP ratio in 2035 would be nearly 400%.
The qualitative conclusions from these scenarios are: (a) enhanced productivity
growth is by far the most attractive approach to scal reform; (b) shortfallsin productivity growth would have to be lled with policies that would cause
signicant loss of welfare.
5.9 Prospects or scal reorm
The causes of Japan’s scal predicament are deeply entrenched in the Japanese
scal, economic and political system. In light of this depth, is there any hope
for improvement? Two aspects seem unpromising. There has been little public
activity on the issue of reform of the public accounting system, although progress
is allegedly in the works.62 Moreover, the speed of reporting of scal accounts
remains hostage to the legislative schedules of regional governments.63 Moreover,
the statistical agency tasked with creating the national accounts remains deeply
understaffed. With emergency priorities now shifted in the light of the recent
natural disasters, it seems unlikely that the accounting and reporting issues in
the scal realm will be addressed soon.
The same goes for the growth agenda. Since the end of the Koizumi
government, growth strategy has been mostly an afterthought. The DPJ has
produced two major documents on the issue, neither of which has had high
priority in implementation or in the policy debate. Moreover, the second Kan
Administration has tilted strongly toward tax hikes as the preferred method of
scal decit reduction, with virtually no reference to the impact such hikes would
have on growth. The inuence of inuence of such hyper-Ricardians among top
policymakers is a source of concern.
There is good news, however, on the third aspect, electoral reform. On 23
March 2011, the Supreme Court ruled that the current system for allocating Lower
House seats among the prefectures is unconstitutional. In the Court decision,
there were several references to the need for allocation of seats proportional
to the population of prefectures – a ruling that will force the Diet to enact a
system64 very close to one-person-one-vote. In light of the Court decision, groups
in both parties are beginning to work on a new system. Unless the new system isfunctional by September 2013, expiration of the term of the current Lower House,
the election might be ruled invalid by the Court, if a suit were to challenge the
result. Such a suit would be inevitable, in light of the activity of civic groups who
have brought such suits for the last 40 years.65
62 This statement is based on a recent conversation with a Ministry of Finance ofcial.63 Final accounts cannot be released by local governments until approved by the local legislatures, which
meet infrequently.64 The form of the election system for both houses of the Diet is decided by legislation, rather than by the
constitution, Indeed, Article 47 of the Constitution of Japan says, ‘Electoral districts, method of votingand other matters pertaining to the method of election of members of both Houses shall be xed by
law.’65 For a description of what is likely to happen to allocation of seats in the Lower House in the wake of
the Supreme Court ruling, see Feldman (2011).

8/3/2019 Geneva13
http://slidepdf.com/reader/full/geneva13 104/162
82 Public Debts: Nuts, Bolts and Worries
There is more good news with respect to the Upper House, where the voter
disparities are even larger than in the Lower House. Civic groups have challenged
the 2010 Upper House election in all 15 regional High Courts, and have won
all 15 cases. These cases will now be appealed to the Supreme Court. It seemshighly unlikely that the Supreme Court would overturn the decisions of all 15 of
the regional High Courts. There is no clarity on the timing of a Supreme Court
decision; however, the next Upper House election must occur by summer 2013.
Hence, the court must rule relatively soon, in order for the Diet to enact and
implement a new system.66
5.10 Defation and scal reorm
Another common view is that markets will force scal reform, as the scal
indicators worsen. Various observers use various metrics to put a time-scale on
such an event. Some view the end of the Japanese current account surplus as the
trigger for a bond market crisis; once Japan has to rely on foreign nancing for
decits, so the argument goes, JGB yields will surge. There are several problems
with this idea, however.
First, a current account decit is neither a necessary nor a sufcient condition
for a bond market crisis. A country with a current account surplus could suffer
such a crisis if domestic investors shift their savings abroad. (This seems highly
unlikely in Japan, despite a great deal of foreign investment, in light of the home
bias of Japanese households.)
Another issue is when the current account balance might turn to a decit.
Table 5.7 shows a simplistic calculation, which extends the 2003–10 trend of the
trade balance, setting the income and services balances at recent levels. It takes
until 2023 for the current balance to turn negative. An alternative argument may
be that the income balance is largely reinvested in foreign assets (eg reinvestment
of Treasury bond coupons in new Treasury bonds). If this is the case, the key
point is when the trade surplus goes into the red. This date is 2015.
One can approach the issue from the savings side as well. The size of private
sector savings and their sustainability are questions. Figure 5.4 provides the
answer. Household savings hit a trough of about 5.3% of GDP in FY2007, and
rose with the nancial crisis of 2008. Of the rise to 6.3% in FY2008, about 80%came from higher savings (numerator), and about 20% from the drop of GDP
(denominator). In the meantime, household investment fell further, due to the
recession. These trends continued in FY2009, and for now, the household sector
has a savings surplus of about 4.4% of GDP.
66 For details on the issue involving the Upper House, and on the policy impact, see Feldman et al (2010)and Feldman (2010a, 2010b).
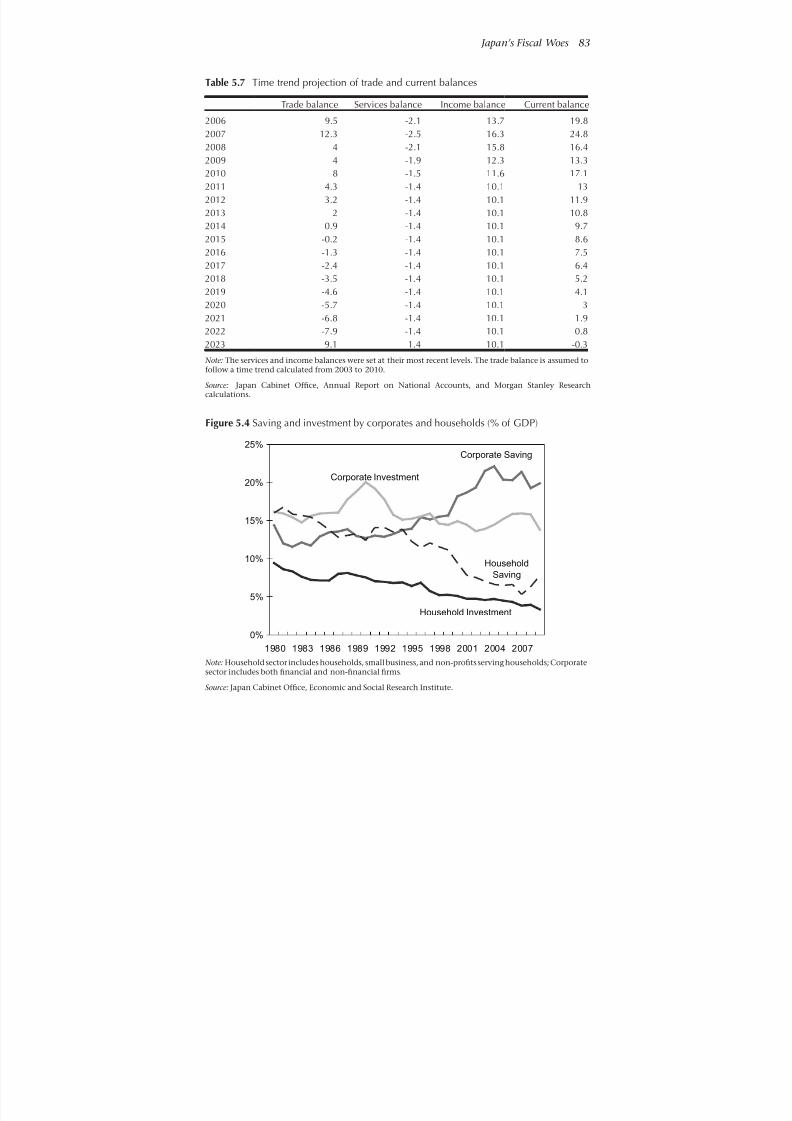
8/3/2019 Geneva13
http://slidepdf.com/reader/full/geneva13 105/162
Japan’s Fiscal Woes 83
Table 5.7 Time trend projection o trade and current balances
Trade balance Services balance Income balance Current balance
2006 9.5 -2.1 13.7 19.8
2007 12.3 -2.5 16.3 24.82008 4 -2.1 15.8 16.4
2009 4 -1.9 12.3 13.3
2010 8 -1.5 11.6 17.1
2011 4.3 -1.4 10.1 13
2012 3.2 -1.4 10.1 11.9
2013 2 -1.4 10.1 10.8
2014 0.9 -1.4 10.1 9.7
2015 -0.2 -1.4 10.1 8.6
2016 -1.3 -1.4 10.1 7.5
2017 -2.4 -1.4 10.1 6.42018 -3.5 -1.4 10.1 5.2
2019 -4.6 -1.4 10.1 4.1
2020 -5.7 -1.4 10.1 3
2021 -6.8 -1.4 10.1 1.9
2022 -7.9 -1.4 10.1 0.8
2023 -9.1 -1.4 10.1 -0.3
Note: The services and income balances were set at their most recent levels. The trade balance is assumed tofollow a time trend calculated from 2003 to 2010.
Source: Japan Cabinet Ofce, Annual Report on National Accounts, and Morgan Stanley Researchcalculations.
Figure 5.4 Saving and investment by corporates and households (% o GDP)
Note: Household sector includes households, small business, and non-prots serving households; Corporate
sector includes both nancial and non-nancial rms.Source: Japan Cabinet Ofce, Economic and Social Research Institute.
0%
5%
10%
15%
20%
25%
1980 1983 1986 1989 1992 1995 1998 2001 2004 2007
Corporate Saving
Corporate Investment
Household
Saving
Household Investment

8/3/2019 Geneva13
http://slidepdf.com/reader/full/geneva13 106/162
84 Public Debts: Nuts, Bolts and Worries
The corporate sector turned into a net saver in FY1998. In recent years, corporate
saving has fallen. Until 2007, the recovery in business investment has reduced
the net savings of the corporate sector, but the global recession has changed that.
In FY2009, the corporate sector had net saving of about 6% of GDP.These data suggest that deation has been crucial in the stability of funding
for the Japanese scal decits. So long as Japan remains in deation, the desire of
the private sector to borrow and invest at home will be subdued. Low domestic
investment has left sufcient private sector savings to fund the scal decits and
to fund overseas investment by Japanese entities (ie the counterpart of the current
account surplus). The question, therefore, is what happens when deation ends.
There are two diametrically opposed views.
The conservative view is that an end to deation would bring scal collapse.
The reason is that ination would bring automatic increases in bond yields,
and render the budget untenable. Higher yields would cause a bond market
panic, and make the situation worse. Moreover, the conservatives believe that
tax revenues are low (in the CGGA, only about ¥40 trillion in FY2011) and the
tax elasticity is small so that even higher nominal GDP growth would leave the
decits wider. Once yields start increasing, spending cuts and tax hikes could not
be implemented fast enough to stop such a panic. Thus, claim the conservatives,
deation is better than the alternative. A milder version of this view is that
ending deation is alright, as long as it ends slowly. In contrast, the growth camp
believes that yields will not increase one for one with ination. Moreover, the
growth camp is optimistic about the tax elasticity. In their view, growth is the
only way to end the scal decits. Any increase of bond yields would be mild,
relative to the rise of revenue, in their view.
The key point of contention boils down to the relative impacts of higher
ination on tax revenue and average interest costs. If the elasticity of tax revenue
is high, relative to the elasticity of average interest costs, then ination will lower
the scal decit. If not, then ination will worsen the scal decit. Given the
importance of this point, it is all the more crucial to have a rm understanding
of the actual levels of scal spending and revenue, using the general government
denition.
In a private communication, a senior ofcial at the Bank of Japan (BoJ)
indicated that the debt cost elasticity was 1.0, that the debt/GDP ratio was
200%, that tax elasticity was low, and that the tax base was ¥40 trillion (that isonly the amount shown in the CGGA, as indicated in Section 5.2 above). With
this set of assumptions, it is no wonder that the BoJ is reluctant to pursue an
ination policy. In contrast, our calculations suggest that the tax elasticity is
about 1.3 and that the average debt cost elasticity is about 0.25 in the short run
(but 1.0 in the long run). The tax base is about ¥140 trillion, in light of social
security contributions and other sources of revenue. Our calculations suggest
that ination will help improve the scal situation, but cannot do so (at least not
plausibly and sustainably) alone.
At the moment, the conservatives are in control. So long as this is the case, no
attempt will be made to inate the economy, even following the tragedy of therecent earthquake. Quite to the contrary, just after the quake hit, the leader of

8/3/2019 Geneva13
http://slidepdf.com/reader/full/geneva13 107/162
Japan’s Fiscal Woes 85
the opposition LDP advocated tax hikes as a way to pay for reconstruction, along
with spending cuts. Of course, some members of both political parties are pro-
ination.67 However, these groups are a minority in both major parties.
Until there is a realignment of political parties that gives voters a choicebetween pro-and anti-deation camps, those advocating peaceful coexistence
with deation are likely to remain in power. The reform of the electoral
districting system will shift seats toward the cities, and could trigger such a party
realignment. However, this is merely speculative. Knowing this, the bond market
is likely to remain stable.
If anti-deationary and/or productivity growth policies were adopted, then
the bond market will notice, but need not collapse. Indeed, if the tax elasticity
optimists are right, the end of deation could reduce scal decits. Moreover,
if anti-deation policies are accompanied by policies to enhance productivity
growth, then Japan’s scal problem would be well under control.
67 For example, the DPJ’s Anti-Deation League (Defure Dakkyaku Giren) boasts 150 Diet members, outof a total of 412. This group has been ignored by the DPJ party leadership.

8/3/2019 Geneva13
http://slidepdf.com/reader/full/geneva13 108/162
86 Public Debts: Nuts, Bolts and Worries
Appendix: The Tohoku earthquake and scal policy
At 2:46pm on 11 March 2011, an earthquake of magnitude 9.0 occurred
approximately 70km off the coast of northeast Japan. The subsequent tidalwave (tsunami) was extremely destructive, reaching as far as 10 km inland in
Japan, and leaving an estimated 23,000 dead and missing. The tsunami triggered
meltdowns at the Fukushima nuclear power plant complex, which in turn will
trigger immense costs, both for indemnities and reconstruction. The total cost
from the earthquake, tsunami and nuclear accident is expected to run into many
trillions of yen.
There are two aspects of the scal situation impacted by these costs. The rst
is the short- to medium-term issues of scal costs and nancing of recovery. The
second is the long-term question of how Japan, which heretofore had put nuclear
power at the centre of its energy strategy, will nd and fund alternatives in the
face of public reaction to the nuclear accident.
Recovery Costs and Financing Costs
Sato et al (2011) simulate the impact of different movements of the yield curve
on JGB yields and debt service, using the assumption that nominal GDP growth
does not change from the baseline case. The crucial variable in their approach is
the yield curve. In the base case, which assumes that the current structure of the
yield curve persists, the debt/GDP ratio peaks at about 250% of GDP (Table 5.8).
In their pessimistic case, the yield on the 10-year JGB rises by one percentage
point, with corresponding rises in the rest of the curve, adjusted for maturity and
monetary policy impact. Under these assumptions, the peak of the debt/GDP
ratio is delayed by about 10 years, and the peak level of debt rises by about 40%
of GDP. In their super-pessimistic scenario, there is a 3 percentage point rise in 10
year interest rates along with a steepening of the 2–10 year curve and a attening
of the 10–40 year curve. Even with the assumption that the consumption tax rises
one percentage point each year until it reaches 10% (with the heroic assumption
of no impact on GDP from the tax hikes), the results are predictably dire. The
debt/GDP ratio spirals out of control.
Table 5.8 Interest rate assumptions or simulations
2yr 5yr 10yr 20yr 30yr 40yr
Base case 0.20 0.51 1.24 2.03 2.17 2.34
Pessimistic case 0.45 1.01 2.24 2.78 2.92 3.09
Super pessimistic case 1.00 2.00 4.24 4.78 4.92 5.09
Source: Morgan Stanley research.
Thus, the impact of the quake on nancing costs depends very heavily on
whether investors retain condence in the ability of the government to deal
with the challenges. If so, then yields need not rise much, and the debt situationremains under control. If not, then a debt spiral is possible.

8/3/2019 Geneva13
http://slidepdf.com/reader/full/geneva13 109/162
Japan’s Fiscal Woes 87
The energy issue
An even more profound issue concerns energy policy. A number of countries
around the globe are rethinking their policies on nuclear power. Heretofore,
resource-poor Japan has viewed nuclear power as a key element of its energystrategy. Even though the Japanese public has reacted less strongly to the
Fukushima accidents than in some European countries, it will remain difcult
to build new nuclear facilities in Japan for some time to come. Moreover, once a
more comprehensive costing of nuclear power is calculated, the entire structure
of energy policy may have to change. This issue is compounded by the need to
reduce usage of fossil fuels, in light of global warming.
The situation for Japan is illustrated in Figure 5.5. Demand is assumed to follow
population, keeping the current level of primary energy use per capita constant.
As a result, total demand for energy declines along with the falling population.
The supply side distinguishes three sources of primary energy: fossil fuels,
nuclear and renewables. We set the policy goal of eliminating the use of fossil
fuels by 2060. (In light of likely fossil fuel shortages, the price of such fuels could
become prohibitive in this time frame.) In addition, in line with the recent goal
stated by Prime Minsiter Kan, that Japan should become nuclear-free, we allow
nuclear power to wane over the same time frame. To replace the fossil fuels and
nuclear power, a growth rate of renewable supply of 5.8% is required to balance
demand and supply in 2060.
Figure 5.5 Energy supply and demand scenario, 2007–75
Source: Morgan Stanley calculations.
0
100
200
300
400
500
600
2007 2013 2019 2025 2031 2037 2043 2049 2055 2061 2067 2073
Total Demand Nukes Fossils Renewables
(Bln bbl)

8/3/2019 Geneva13
http://slidepdf.com/reader/full/geneva13 110/162
88 Public Debts: Nuts, Bolts and Worries
The scal issue is what the government must do in order to support a 5.8%
annual growth rate for renewables. A major R&D budget in all aspects of energy
supply and demand (new supply sources, efcient power distribution, energy
conservation) would be needed. This in turn will require that scal resources bereallocated away from social programmes and toward energy programmes, in
a way that balances the needs of the current generation for social services and
those of future generations for a sustainable power supply. The earthquake and
the aftermath thus make it all the more important to raise productivity, to end
deation, to reallocate spending, and to reform decision-making rules.
8/3/2019 Geneva13
http://slidepdf.com/reader/full/geneva13 111/162
89
6 Recommendations
Europe, the United States and Japan all confront serious medium-term scal
challenges. While the immediacy and exact nature of those problems differ, as
we have seen in this report, they have in common that, on current policies,
these economies’ public debts are unsustainable. Not only has the burden of
debt grown enormously in recent years, but substantial primary decits remain
and policy adjustments so far have been insufcient. And all three economies
face the prospect of very signicant age-related increases in public spending
going forward, implying that further adjustments will be needed beyond those
necessary to achieve medium-term stability of debt to GDP ratios.
It is conventional to follow such observations with recommendations
that governments cut back on expenditure and raise additional revenue in
some proportion, now and/or in the future. We will, of course, have our own
recommendations along these lines for all three economies. But, in addition,
we will emphasise two overarching principles around which any strategy for
restoring public debts to sustainable levels should be organised.
The rst one is that the debt-to-GDP ratio has not just a numerator but a
denominator. The least painful way of reducing that ratio, in other words, is
by growing the denominator. Put another way, any strategy for shrinking the
numerator through a combination of spending cuts and tax increases will not
make the debt sustainable insofar as it also shrinks the denominator. This is
an issue in the United States, where much of the controversy over the recent
agreement to raise the debt ceiling revolves around the question of whether the
debt deal will do more to help or hinder growth. It is an issue in Europe, where
sharp cutbacks in public spending in the UK and southern Europe have depressed
growth, and where a long-lasting series of increases in tax rates caused a decade
and a half of depressed growth in Germany without solving the underlying scalproblems (see Strauch and Von Hagen, 1999). It is an issue in Japan, where the
rise in the debt ratio to levels that are exceptionally high even by comparison
with the US and Europe reects in large part the economy’s inability to break out
of its low-growth trap. It follows that in all three cases strategies for reducing the
rate of increase of the debt must also be strategies for boosting the medium-term
rate of growth if they are to succeed in putting the debt burden on a sustainable
footing.68
68 Another way of raising the denominator is, of course, through ination. Although moderate ination
can in principle play a role in eroding the debt/GDP ratio in circumstances where debt is reasonablylong term, it is clearly not a desirable approach to solving the problem, as it has adverse efciency anddistributional effects.

8/3/2019 Geneva13
http://slidepdf.com/reader/full/geneva13 112/162
90 Public Debts: Nuts, Bolts and Worries
Second, good intentions are not enough; also necessary are good institutions.
Chronic decits, as we have seen, reect the common-pool problem that
characterizes public-nance decisions. Those who benet from specic forms
of public spending, including tax expenditures, are not in general the sameindividuals or groups who pay for them, either now or, as is the case when debt is
incurred, in the future. The beneciaries therefore do not internalise all the costs
of that current spending. Appropriate institutional arrangements are therefore
needed to correct this quasi-market failure. For the economist to simply identify
the utility-loss-minimizing set of public spending cuts and revenue increases and
to imagine that they will be implemented is equivalent to assuming the existence
of a benign scal dictator, something that is mythical in a modern democratic
political setting. What is necessary, rather, is an institutional mechanism to align
incentives. The precise nature of the institutional mechanism in question will
depend on the precise nature of the political setting. What is needed therefore is
institutional reform where prevailing institutions do not meet the needs created
by the political setting, and political (electoral) reform where the political system
creates problems for the operation of prevailing scal institutions.
6.1 Institutional reorms
As discussed in Chapter 2, budgeting institutions appropriately designed to
address the common-pool problem differ from country to country. Depending
on the electoral system, the degree of electoral competition and the resulting
make-up of governments, some countries must rely on the delegation approach
while others need to develop the contract approach to the budget process. The
eurozone has the additional problem of powerful cross-border spillovers of
national scal outcomes. Insofar as there is the possibility that scal problems in
one member state will be met by bailouts or monetary accommodation, the costs
of which fall in part on the residents of other member states, this introduces an
additional, potentially more severe common pool problem.
Countries with parliamentary governments, proportional representation
electoral systems, large electoral districts, and a high degree of electoral
competition tend to have coalition governments with frequent changes in the
party composition of the governing coalition, and a relatively large ideologicaldistance between the parties in the government. These countries need to develop
effective contracts-based scal institutions in order to contain debt and decit
problems.
Countries with parliamentary governments, rst-past-the-post electoral
systems, and small district magnitudes will tend to have majoritarian governments
and therefore less need to start the budget process with upfront negotiations
among different factions of the government. They can most effectively address
the decit-bias problem through a delegation approach which assigns signicant
powers to the nance minister, who typically is not bound by particular spending
interests as much as the spending ministers.

8/3/2019 Geneva13
http://slidepdf.com/reader/full/geneva13 113/162
Recommendations 91
Presidential countries, in which power is shared between the executive and
legislative branches of government, present particular challenges, especially
when different political parties control the different branches of government.
In these cases, negotiated budget agreements are needed, analogous to thosein parliamentary coalitions. However, unlike parliamentary coalitions, where
the failure to establish and abide by negotiated agreements is penalised by the
government falling, presidential systems generally lack any mechanism to force
these agreements to be reached. Presidential countries therefore have a tendency
toward inaction, making it difcult for scal adjustments to occur when
decits arise. In such countries, it is particularly important to have a prominent
organisation free of political interference to make budget projections so that
public opinion can be marshalled to encourage action. In addition, institutional
features that raise the costs of inaction can be helpful in offsetting the bias toward
inertia.
Table 6.1 divides the budget process into several phases – the drafting phase of
the budget law, which in most countries happens within the executive branch of
the government, the legislative phase, in which the budget law is passed through
the legislature, and the implementation phase, during which the executive is
responsible again. The table also shows the main steps involved in each phase.
Table 6.1 The budget process in European countries
Budget process Contracts Delegation
Drating phase
Initial economic and revenueorecast
Independent orecastinginstitution
Ministry o Finance (MF)
Targets or major aggregates
Derived rom multiannualprogramme negotiated amongall ministries and partyleaders
Set by MF
Compilation o budget dratBids submitted by lineministries, MF checks orconsistency with targets
Bids negotiated betweenline ministries and MF
Reconciliation o conictsNegotiations among partyleaders
MF with PM
Legislative phase Strong inormation rights Weak inormation rightsAmendments weaklyrestricted.
Amendments stronglyrestricted
Final approval Legislature Executive
Implementation phaseSpending approved and cashow controlled by MF
Spending approved andcash ow controlled by MF
Scope or changes Require cabinet approval Require MF approval
Reaction to unoreseendevelopments
Detailed rules and/or cabinetapproval
MF discretion

8/3/2019 Geneva13
http://slidepdf.com/reader/full/geneva13 114/162
92 Public Debts: Nuts, Bolts and Worries
6.1.1 The budget process in parliamentary governments with contracts
Fiscal contracts address the common pool problem by a common agreement on
the budget among the partners of a coalition. The budget process starts with
negotiations in which the main budget parameters are xed for the remainderof the process, typically numerical spending ceilings for the main line ministries
and budget aggregates. These parameters must be specic enough to express the
government’s willingness to address spending cuts in politically sensitive areas.
These negotiations involve all cabinet members and often also the leaders of the
coalition parties. Once the targets have been set, it is understood that deviations
from them during the scal year in the interest of one of the coalition partners
will be punished by the withdrawal of other parties from the coalition, causing
the government to fall. To emphasise their political weight, some governments
have the legislature pass a pre-budget law xing the main budgetary targets for
the next year. During the compilation of the budget law, any conicts that arise
are ultimately resolved by negotiations in the entire cabinet.
The annual budget targets should be derived from multiyear scal programmes
set out in the coalition agreement. They must be based on reliable macroeconomic
projections, which gives the economic and revenue forecasts for the budget year
special strategic importance. To assure the transparency and accuracy of these
forecasts, governments can outsource them to independent forecasting agencies.69
During the legislative phase, the parties in the legislature examine the budget
draft and assure its consistency with the coalition agreement. Information
rights of the legislature are strong and the scope of amendments that members
of parliament can propose is large. In the implementation phase, making scal
contracts work requires that the nance ministry be able to effectively monitor
the spending ministries during the budget year and assure that the targets are
kept. Tight control over cash ows is a necessary requirement for this. Often,
scal contracts come with rules spelling out what the government will do under
unforeseen circumstances, that is, how unexpected revenue shortfalls will be
handled or what will be done with unexpected revenue surpluses. Changes in the
budget during the year, which are not covered by such rules, require the consent
of the entire cabinet.
The European experience of the past 20 years has shown that scal contracts
can be strengthened considerably by scal rules, which are typically in theform of numerical limits for government debt or decits based on special or
constitutional law. Such rules can anchor the multiannual scal programme on
which the annual scal contracts are based and they give additional political
and legal weight to the scal targets. More specically, countries with political
environments favouring scal contracts have often used the SGP framework to
develop and strengthen scal contracts at the national level (Von Hagen, 2006b).
69 Jonung and Larch (2008), von Hagen (2011).

8/3/2019 Geneva13
http://slidepdf.com/reader/full/geneva13 115/162
Recommendations 93
6.1.2 The budget process in parliamentary governments with delegation
The delegation approach addresses the common pool problem by vesting the
nance minister with strong agenda-setting powers over the spending ministers,
that is, the nance minister can unilaterally or jointly with the prime minister setthe main parameters of the annual budget. Economic and revenue forecasts are
the responsibility of the nance minister, who also has the authority to resolve
conicts arising during the compilation of the budget draft. In the legislative
phase, the executive has strong agenda-setting powers over the legislature, which
is restricted in its information rights and the scope of amendments it can make
to the executive budget proposal. During the implementation phase, the nance
minister must have the power to execute the budget tightly by controlling cash
ows and approving all expenditures during the year, thereby assuring that no
deviation from the original budget occurs. In this model, the commitment power
is provided by the relative independence of the nance minister from political
spending interests. The stamina required for good-quality consolidations is
provided by the stability of the nance minister’s position in the government.
There is much less of a role for multiannual scal programmes and scal rules
in this model. This is because the delegation model lacks the enforcement
power that the contract approach provides for coalition agreements and rules.
Strong nance ministers can decide to deviate from a multiannual programme
or rule without having to fear political punishment. This is consistent with the
European experience of the past 20 years, which indicates that the SGP had little
binding power in countries with political environments favouring the delegation
approach (Von Hagen, 2006). Multiyear scal programmes and scal rules may be
useful under the delegation approach to improve transparency and guide public
expectations, but their inuence on the actual conduct of budgetary policies
remains quite limited.
6.1.3 The budget process in the US presidential system
The contract approach that is required in the US presidential system is different
from that in the European parliamentary systems. In the US, the annual budget
process begins in late January or early February with the president’s submission
of a budget to Congress and the Congressional Budget Ofce’s publication of
baseline budget projections. The extent to which the president’s budget proposalbecomes the basis for the Congressional appropriations legislation depends on
the relationship between the president and Congress. Next the House and the
Senate pass budget resolutions specifying total discretionary spending levels and
making suballocations to the appropriations subcommittees in each chamber.
When the system is working well, the respective suballocations are the same in
the House and the Senate, eliminating the need to make cross subcommittee
adjustments at the end of the process when the House and Senate appropriations
bills are reconciled. In theory, the one dozen appropriation bills produced by
the subcommittees are enacted separately before the 1 October start of the next
scal year. During the past decade, however, the full appropriations process hasnever been completed in time for the start of the scal year. Instead, one or

8/3/2019 Geneva13
http://slidepdf.com/reader/full/geneva13 116/162
94 Public Debts: Nuts, Bolts and Worries
more continuing resolutions are enacted, allowing the government to continue
operations at the prior year’s spending levels until the budget process completes.
Then an omnibus appropriations bill, combining most or all of the individual
appropriations bills, is passed by Congress and signed by the president.In this setting, the contracts approach requires three agreements, one between
the president and the leaders of the House and Senate, a second between the
speaker of the House and a majority of House members, and a third between
the Senate majority leader and a majority (or in some cases 60%) of Senate
members.70 The rst agreement is necessary in order to reconcile the separate
versions of the budget legislation that emerge from the House and the Senate and
to obtain assurance that the president will sign rather than veto the legislation
that Congress produces. The second and third agreements are necessary because
there is much less party discipline in the US Congress than there is in European
parliaments. In the US, Congress does not fall if the speaker of the House or
Senate majority leader loses a vote. So party members have more freedom to vote
against their party leadership. In addition, members of Congress are elected more
as individuals and less as party members than is typical in parliamentary systems.
The budget process described above applies to discretionary spending. Fiscal
consolidations involve changes to mandatory spending and revenue as well.
These happen on an ad hoc basis, but require the same three-agreement structure
to become law.
Table 6.2 shows predicted and actual institutions for different European
countries, the eurozone, the United States and Japan. Here, we dene scal rules
as numerical limits on government debt or budgetary aggregates legislated by the
constitution or special law and addressing the central or general government.
The predictions regarding the type of budget process are based on the countries’
electoral systems and the competitiveness of their electoral processes, in line
with the arguments presented in Chapter 2. The classication of their actual
budgetary institutions is based on recent literature. Note that we only indicate
the type of budgetary institutions, not their quality. The table shows that, by and
large, the predictions are borne out by actual observations quite well. Finally, the
table also indicates where special institutions like scal councils exist.
70 From this perspective, such a contract would be similar to scal contracts under minority governmentswhich are relatively frequent in Scandinavian countries. See Hallerberg et al (2008).

8/3/2019 Geneva13
http://slidepdf.com/reader/full/geneva13 117/162
Recommendations 95
Table 6.2 Actual and predicted budgetary institutions
Rule Institution Predicted type Actual type
Belgium NoHigh Council o
Finances
Contract Contract
Bulgaria Contract Contract
Czech Republic No Delegation Contract
Denmark No Contract Contract
Germany Golden ruleAdvisorycommittees
Delegation/ contract
Delegation
Estonia No Contract Contract
IrelandExpenditureceiling
Contract Delegation
Greece No Delegation Delegation
Spain Budget balance Delegation Delegation
France No Delegation Delegation
Italy No Delegation Delegation
Cyprus
Latvia Golden rule Contract Contract
Lithuania Debt rule Contract Contract
Luxembourg No Contract Contract
Hungary No Fiscal committee Delegation Delegation
Malta
Netherlands NoIndependentorecasting
institution
Contract Contract
Austria Budget balance Fiscal committee Contract Delegation
Poland Debt rule Contract Contract
Portugal No Delegation Delegation
Romania Fiscal committee Contract Contract
Slovenia No Fiscal committee Contract Contract
Slovakia No Contract Contract
Finland No Contract Contract
Sweden Yes Fiscal committee Contract Delegation
United Kingdom Golden rule Fiscal committee Delegation Delegation
Euro area Yes None Contract Contract
USANominal debtceiling
CongressionalBudget Ofce
contractAd hocagreements
Japan No Contract None
Sources: Hallerberg et al (2009), Yläoutinen, Sami, Development and Functioning of Fiscal Frameworks inthe Central and Eastern European Countries. Phd Dissertation, University of Jyväskyla, 2005, EuropeanCommission DG ECFIN, Public Finances in EMU, 2006, Part III Annex, pp. 162–4.

8/3/2019 Geneva13
http://slidepdf.com/reader/full/geneva13 118/162
96 Public Debts: Nuts, Bolts and Worries
6.2 European countries
The Maastricht Treaty requires EU governments to adopt national budgetary
institutions that enable them to keep their commitment to sustainable publicnances. While Table 6.1 indicates that European countries have generally moved
in the right direction regarding type of budgetary process, empirical research
suggests that large differences in the quality of budgetary institutions remain and
that there is much scope for improvement (Hallerberg et al, 2008). The Appendix
examines a few cases, some successful, some not. We recommend that countries
recognise the institutional approach that best ts their political environments
and introduce reforms at the national level to improve them signicantly.
Furthermore, we recommend the creation of scal councils in all EU countries.
Such councils can improve scal discipline by commenting publicly on the quality
of a government’s actual and planned policies, thereby creating more democratic
accountability. In a setting of scal contracts, scal councils can play an important
role judging the quality of the scal contract, its consistency with longer-term
scal objectives, and the quality of its implementation. They can also improve the
political feasibility of spending cuts by explaining their necessity and expected
effects from a non-partisan perspective. In a setting of delegation, scal councils
can play an important role of holding the nance minister accountable for how
he uses his agenda-setting powers and by commenting on the consistency of the
government’s policies with longer-term scal objectives and the effectiveness of
the government’s coping with longer-term scal challenges such as ageing or the
necessity to reduce public debts.
To play such a role, scal councils must be clearly independent from the
governments. They should be appointed by the national parliament rather than
the executive and their mandates should not be overly restrictive, allowing them
to address specic issues and make specic proposals. Fiscal councils should be
given sufcient access to data and information, for example by being able to
call on the central banks’ economics departments for support. Governments
should not have the possibility to dismantle the scal councils nor to deprive
them of their resources. The council members should be individuals with proven
(international) experience with scal policy or strong international academic
reputation.
6.3 The Eurozone
Then there is the common pool problem facing the eurozone as a whole.
Problems of scal sustainability in one eurozone country can impose costs on
residents of other eurozone countries through a number of distinct channels.
They can be managed through cross-border transfers (‘bailouts’), as has been
the case in the recent past, or monetary accommodation, which the ECB has
begun by engaging in since May 2010 via large-scale purchases of government
bonds of scally weak countries. The Stability and Growth Pact resembles thekind of scal contract national coalition governments have used successfully to

8/3/2019 Geneva13
http://slidepdf.com/reader/full/geneva13 119/162
Recommendations 97
strengthen scal discipline. However, it lacks the enforcement mechanism that
is necessary to make scal contracts effective at the national level. Neither the
European Commission, which has been degraded to a mere record keeper for the
national Stability and Growth Programmes, nor the European Council have thepolitical power nor the determination it takes to enforce the scal contract at the
EMU level.
The reformed Stability and Growth Pact is meant to achieve better enforcement
through changes in decision-making rules. Previously, decisions to impose nes
on countries found in violation of the Pact were taken by a majority of eurozone
member countries. Earlier this year a new proposal was considered that would
allow sanctions imposed by the European Commission to come into effect unless
there was a majority of votes against the sanctions (this is the so-called reverse
majority rule). But there is little reason to believe that this reform will lead to
a more efcient arrangement. The Commission relies on the good will of the
member states’ governments in a host of other areas and will avoid as much
as possible making contentious proposals. Furthermore, at the end of the day,
neither the European Commission nor the European Council has the power to
enforce decisions against the resistance of a member state, for the simple reason
that the member states remain sovereign in scal matters.
If member states are to retain scal policy sovereignty, the solution must be
rst and foremost sought at the national level. Since one size will not t all, these
solutions cannot be identical.
We suggest therefore that every eurozone member country adopt a
combination of rules and institutional arrangements appropriate to its own
political circumstances. This implies the acknowledgment that the one-size-ts-
all approach, which has dominated the scal framework of the eurozone so far, is
inappropriate. The SGP framework rests on the assumption that multiyear scal
contracts work in all member states. This is clearly not true. At the same time,
as previously noted, much can be learned from existing rules and arrangements
in place in a number of countries, in Europe and elsewhere. The collective
interest can be served by providing compelling incentives for eurozone member
countries to adopt and respect budgetary arrangements that are adequate given
the parameters of their political and electoral systems.
This could be done as follows. The European Commission would evaluate
existing or planned national arrangements and approve those that are likelyto be effective in dealing with the decit bias. Countries that fail to pass this
requirement, or countries that breach their own arrangements, would face a
serious disadvantage: their debt instruments would not be accepted as collateral
by the European Central Bank in money market operations. As a result, public
debt would be more expensive. With full reinstatement of the no-bailout clause,
these countries would soon nd it in their interest to comply.

8/3/2019 Geneva13
http://slidepdf.com/reader/full/geneva13 120/162
98 Public Debts: Nuts, Bolts and Worries
6.4 The United States
As a presidential country with a frequently divided government, the US and
its ‘checks and balances’ system has a bias toward inertia that in theory shouldmake it difcult to address scal imbalances. Yet, the US political system has
historically performed quite well in correcting scal imbalances. Major decit-
reducing legislation was enacted in 1983, 1990, 1993 and 1997. In part because
of these policy actions, the federal debt to GDP ratio fell from 49% in 1993 to
33% in 2001. Three questions arise from these observations. First, why has the
US system been so successful? Second, should we expect this success to continue?
Third, are there institutional changes that could increase the likelihood of success
going forward?
It is impossible to give a denitive answer to the question of why the US
political system has done better in addressing scal imbalances than might
have been predicted. A plausible answer is that voters are not focused solely
on minimising their tax payments and maximising the government spending
they receive. Voters also care deeply about the health of the economy. If scal
imbalances are perceived to threaten the health of the economy, voters will
reward elected ofcials who correct those imbalances. Voters also reward political
leaders whom they perceive as ‘doing what’s right for the country’. Thus, the
common pool problem is only one aspect of what drives the politics of scal
policy in the US.
Will the US political system continue to be capable of scal adjustments? Most
likely, the answer is yes. Although the US Congress is steadily becoming more
polarised, this is simply a continuation of a trend that began around 1970 (Poole,
2005). The increase in polarisation between 1970 and 1990 did not prevent the
budget deals of the 1990s. While the recent debt limit debate was contentious
and failed to result in a comprehensive scal plan, similar contentiousness and
false starts preceded the budget deals of the 1990s. So long as a policy adjustment
of 1–2% of GDP occurs every 3–4 years, debt to GDP will be stabilised. Thus, the
political system can fail to reach the necessary agreements in most years, and still
function well enough to produce scal sustainability.
Despite the past success of US institutions, it is worth considering whether they
could be made stronger. Since the 1980s, the favoured approach to overcoming
inertia has been to negotiate decit reduction packages in multiple stages. First,legislation is passed establishing multiyear targets for the amount of decit
reduction to be achieved and the consequences, typically across the board cuts
in spending, if subsequent legislation is not passed to achieve the targets. Then
decisions are made about the specic policies needed to reach the targets.
The recently passed debt limit legislation follows this pattern. It sets caps on
discretionary spending for every year through 2021, reducing 10-year spending
by $900 billion relative to the baseline. However, it does not specify any of the
specic spending reductions necessary to reduce spending to the target levels. It
also requires Congress to pass legislation by 15 January 2012 reducing the decit
by a further $1.2 trillion over 10 years. If Congress fails to produce $1.2 trillion insavings, automatic spending cuts go into effect beginning in 2013 to achieve the

8/3/2019 Geneva13
http://slidepdf.com/reader/full/geneva13 121/162
Recommendations 99
$1.2 trillion in savings. Many programmes, including Social Security, Medicaid
and certain programmes beneting low-income populations are exempt from the
automatic cuts. Cuts to Medicare are capped at 2%.
The appeal of this approach is two-fold. First, by obtaining agreement in twostages – rst on the amount of decit reduction to achieve and only later on
specic revenue increases and spending cuts – it may make reaching a consensus
on the specic policy changes easier. Second, by specifying automatic cuts if
no agreement is reached – cuts explicitly designed to be unappealing to both
Democrats and Republicans – it raises the cost to the president and Congress of
failing to come to an agreement.
As was discussed in Chapter 3, these sorts of procedures have had mixed success
in the past, especially when the required adjustments have been large. Congress
can simply decide at a later date to pass a new law overriding them. The most
likely scenario for the coming year is that Democrats and Republicans will fail to
reach agreement on specic tax increases and spending cuts by the deadline of
15 January 2012. Then, after the November presidential election, the conuence
of the start of a presidential term, the imminent (31 December) expiration of
the 2001/2003 tax cuts, and the desire to avoid the automatic spending cuts will
produce decisions about the specic policy changes necessary to stabilise debt to
GDP over the medium term.
It is also possible that an agreement will be reached by January. But given the
zero-sum-game nature of the upcoming elections, an agreement would require
Democrats and Republicans to simultaneously believe the legislation was to their
respective advantages. While there are sometimes cases in which incumbents of
both parties come together in such a way that helps all incumbents, regardless of
party, relative to challengers, this seems unlikely to be the dynamic for the 2012
election cycle.
It is common for elected ofcials to propose balanced budget amendments to
the US constitution. These proposals are usually not serious ones. They are simply
a way for the politician to tell voters that he or she dislikes decits, without
having to propose the unpopular tax increases or spending cuts necessary to
actually improve the scal outlook.
Most of the Congressional proposals for balanced budget amendments have
been poorly designed. They typically require balanced budgets in each year,
regardless of the state of the economy. One recent version would require two-thirds supermajorities in both the House and Senate to raise any taxes – making
decit reduction more difcult. Another recent version would cap annual federal
spending at 18% of GDP, a level that is several percentage points below the
spending levels in any serious budget plan.
But given that any legislated decit reduction procedure can be negated by
subsequent legislation, it is worth considering whether it would be possible to
design a serious constitutional amendment that would help overcome inertia in
closing scal imbalances. Such an amendment would need to establish targets for
scal balance (the German balanced budget amendment restricts federal decits
to 0.35% of GDP). To avoid exacerbating economic downturns, it would need tomake provisions to allow for countercyclical scal policies, while simultaneously
8/3/2019 Geneva13
http://slidepdf.com/reader/full/geneva13 122/162
100 Public Debts: Nuts, Bolts and Worries
avoiding a situation in which economic conditions are inappropriately appealed
to as an excuse to ignore the budget targets. To avoid having scal policy decisions
constantly being litigated in court, it would need to have clear consequences
for what happens if targets are missed (for example automatic proportionateincreases in all tax rates and automatic proportionate reductions in all spending).
Finally, because it is impossible to foresee all eventualities, it should be possible
to wave the requirements of the amendment with a Congressional supermajority.
Whether it is possible to design an amendment of this sort whose benets
outweigh the costs of lost economic policy exibility is an open question. We
have seen in the recent debt limit negotiations that articial attempts to force
action can be destabilising.
Regardless, no such amendment is imminent. The process for amending the
US Constitution is difcult. It requires a bill to pass both houses of Congress by
a two-thirds majority. Then the amendment must be ratied by three-fourths of
the states. The most recent Constitutional amendment took 202 years from the
time it was initially proposed to the time it achieved ratication by the states.
The second most recent amendment was in 1971. Thus, meaningful progress in
improving US budget institutions is more likely to come through improving the
enforcement mechanisms for multiyear budget agreements in such a way as to
increase the probability that the agreed upon targets hold.
Recently the Peterson-Pew Commission and the Obama Administration
have made useful recommendations for such improvements.71 For example, to
minimise the chance that overly aggressive targets get ignored or overridden,
the Peterson-Pew Commission recommends capping the automatic adjustment
at 1% of GDP per year. The Obama Administration suggests specifying the scal
targets based on debt to GDP levels so that if decit targets are missed in a single
year, the following year’s adjustments will have to increase by enough to stay on
the agreed upon path.
The US political system’s bias toward inaction raises particular challenges for
mandatory spending programmes where spending is determined by a prior law
and not appropriated annually. In the US, most of the large social insurance
programmes are on autopilot. Thus spending on Social Security retirement
benets and Medicare health benets are increasing signicantly as a share of
GDP based on eligibility rules set many years in the past. Given the popularity
of these programmes and the status quo bias of the political system, reformsare very hard to enact. This inertia could be overcome in one of two ways. The
rst would be to subject these programmes to annual appropriations so that
there would be an annual opportunity to trade off spending on social insurance
programmes against spending on other priorities. However, such a process
might result in higher spending on these popular programmes rather than
lower spending. Moreover, it would make benet levels less predictable, raising
economic uncertainty for vulnerable populations.
A second way to overcome this inertia would be to make the programmes
completely self-nancing and to institute trigger mechanism to ensure that
71 Peterson-Pew Commission, Getting Back in the Black, November 2010 and The White House, ‘ThePresident’s Framework for Shared Prosperity and Shared Fiscal Responsibility’, 13 April 2011.

8/3/2019 Geneva13
http://slidepdf.com/reader/full/geneva13 123/162
Recommendations 101
spending and revenues remain equal. Sweden’s Social Security system includes a
‘braking mechanism’ designed to keep benets in line with the payroll tax base
(Auerbach and Lee, 2009). In the US, proposals have been made to index Social
Security benets to longevity.Proposals have also been made to fund Medicare and Medicaid via a dedicated
revenue source like a VAT. If that were done, spending on Medicare and Medicaid
could be limited to the revenue raised by the VAT, thereby requiring Congress to
actively decide to raise VAT tax rates any time government health care spending
rose relative to GDP.
One place where the US institutions do not need improvement is in providing
independent economic and budget estimates and analysis. The Congressional
Budget Ofce is widely seen as non-partisan and as producing authoritative
estimates of both the short-run and long-run budget outlook and of proposals
being considered by Congress. The independent actuaries of the Social Security
and Medicare systems are also widely respected. Moreover, because the executive
branch maintains its own revenue and budget analysis capacity at the Treasury
and the Ofce of Management and Budget, there is a healthy dialogue among
the civil servants at the various agencies that leads to more accurate modelling.
While the scal councils in Europe sometimes make policy recommendations,
the US is well served by a system in which the Congressional Budget Ofce
refrains from making policy recommendations, thereby preserving its reputation
for independence. The active Washington think tank community often forms
bipartisan commissions of experts that make recommendations similar to those
that the more activist scal councils in Europe make.
6.5 Japan
So long as the houses of the Japanese Diet contain both rst-past-the-post and
proportional electoral sections,72 Japan can have neither a pure delegation nor
a pure contracts system. At present, the system is more skewed toward the
proportional system, even though the allocation of seats is not truly proportional
(see Chapter 5 for details). Therefore, Japan should concentrate on improving
the quality of the contracts, which, at the moment, are unwritten, unenforceable
and short-lived. Ideas might include both a priori and ex post checks. The formerwould include mandatory scoring and publishing of political party platforms, by
an independent agency.73 The latter would include scorecards on bills enacted by
the Diet, so that the public could gauge the actual scal impact. Improved media
scrutiny would also help; standards for expertise in nancial journalism should
be raised, by a private sector self-regulatory body.
72 Japan’s Lower House is a hybrid. Of the 480 Lower House seats, 300 are selected in a ‘rst past the post’system, as in the US. The remainder come from 11 blocs, similar to ‘large district proportional’ systemsin Europe. The Upper House is also a hybrid, but more tilted toward proportional allocation. In theUpper House, 196 members are elected from medium-sized districts, with each prefecture being onedistrict. There is an ‘n-th past the post’ system, where n depends on the population of the prefecture.
The remaining 96 seats are selected from a nationwide constituency, on the basis of a party list system.73 The Dutch CPB (discussed in the Appendix to this chapter) and the Congressional Budget Ofce in the
US are examples of such institutions.
8/3/2019 Geneva13
http://slidepdf.com/reader/full/geneva13 124/162
102 Public Debts: Nuts, Bolts and Worries
A key reform would be to end the skew in Diet representation toward the
elderly. This requires at least a move to a one-person-one-vote redistricting for
both Houses of the Diet. For example, in the 300 seats subject to the ‘rst past
the post’ system in the Lower House, a shift to one-person-one-vote would takeabout 20 seats away from the most rural districts and add all to the most urban
ones. It would be easier to achieve fair seat distribution with larger election
districts, for example by moving away from prefectures and toward states (there
would be 9 to 13 such states, according to plans proposed so far). Already, an 11
block system exists for the proportional part of the Lower House, and seats are
allocated on the basis of voting population only. This reduces the number of dead
votes, and produces a Diet more reective of the population.74 Special attention
would have to be paid to avoid gerrymandering of smaller election districts (if
any) inside states, in order to avoid the polarisation that gerrymandering in the
US has brought. Such changes would end the overrepresentation of the elderly
because the latter live more densely in rural areas, which the current system over-
represents.
Another important reform would be to reduce the number of representatives,
in both the national Diet and in local assemblies. The large number of
representatives forces attention of each on relatively small groups of supporters,
and thus tilts representation toward parochial interests. A reduction in the
number of representatives could be accomplished in several ways. For the national
Diet, simply reducing the number of seats might be easiest. Eliminating the
proportional section of the Lower House would shrink that House substantially,
and would add an element of ‘delegation model’ to budget debate. The Upper
House could be reduced to as few as 67 seats (in a system with 11 blocks) with
no loss of one-person-one-vote equality. Alternatively, the Upper House could be
reduced to a two-seat, ‘double presidency’, without changing the constitution.75
In this variant, there would be a single national constituency, and the top vote-
getter would win. Such an Upper House, although legally permitted to initiate
non-budget legislation, would largely serve as a check on the Lower House,
in order to ensure that the parochial interests do not overwhelm the national
interest.
74 In the Lower House, the 300 seats are currently allocated according to a formula. Each prefecture getsone seat to start, and the remaining 253 are allocated according to population. Thus, even the smallestprefecture gets two seats. This formula is the reason for the deviation from one-person-one-vote inthe Lower House. On 23 March 2011, the Supreme Court ruled this formula to be unconstitutional,and the Diet faces the requirement to change to a formula based solely on population. In the UpperHouse, there is a single, nationwide district for 96 seats – which obviously have no issue with electiondistrict in equalities. However, the remaining 146 seats are allocated among the prefectures, witheach prefecture getting a minimum of two seats; the remaining 52 are allocated roughly according topopulation. The deviation from one-person-one-vote in the Upper House, therefore, is far greater thanin the Lower House. In recent court cases challenging the Upper House system, all 15 of the regionalHigh Courts have ruled that the current Upper House system is unconstitutional. The Supreme Courthas yet to rule on the most recent cases.
75 The relevant articles of the Constitution are: Article 43 (2): ‘The number of the members of each Houseshall be xed by law.’ Article 46: ‘The term of ofce of members of the House of Councillors shall be
six years, and election for half the members shall take place every three years’; Article 47: ‘Electoraldistricts, method of voting and other matters pertaining to the method of election of members of bothHouses shall be xed by law.’

8/3/2019 Geneva13
http://slidepdf.com/reader/full/geneva13 125/162
Recommendations 103
At the prefectural and city level, the easiest way to reduce seats would be
a reduction in the number of local governments. This could occur by further
reduction in the number of municipalities, and/or by reducing the number of
levels of government. A reduction in the number of levels of government wouldalso facilitate a long-sought goal, decentralisation of government. With a shift
from 47 prefectures to a small number (most proposals vary between 9 and 13)
of states, it would be easier to divide tasks and easier to develop e-government
applications.
Some other reforms in the voting system might help. For example, young
voters in Japan have even lower turnout ratios than those in other industrial
countries. Hence, a system, such as that in Australia, that obligates voters to
vote, might generate more representative outcomes. Such a system would also
reduce the power of parties with well-organised support groups, which tend to
gain votes by ensuring that their own votes show up. Alternatively, one might
prohibit any group with ties to a political party from facilitating voter turnout.
There are also two older ideas that should be revived. First, the budget-screening
exercise of 2009–10 should be revived, in order to keep the pressure of public
scrutiny on spending items. Ex post scrutiny, with sanctions, must also increase,
in order to strengthen incentives for achieving goals within budget limits.
First, the budget-screening exercise of 2009–10 should be revived. The initial
exercise (see detailed discussion above) was only partially successful, in light
of the small level of spending actually cut. However, budget screening sessions
attracted intense attention, and changed the incentives for both politicians and
bureaucrats; the fear of public scrutiny is a powerful motivator. There are also
a number of accounting improvements that would improve public scrutiny.
Examples include shift of public sector accounting to private sector principles
and concepts, and shortening of the lags between the end of a scal accounting
period and availability of accounts.
Finally, there needs to be much more top-down discipline in setting budget
content and execution. The quickest approach would be to revive the Council
on Economic and Fiscal Policy (CEFP). This council, which has legal power to
set budget priorities, began with the government administrative reforms under
PM Hashimoto, and was used very effectively by PM Koizumi. The current
government, however, abandoned use of the CEFP, preferring to seek a ‘National
Strategy Council’ (NSC), with a broader mandate and with powers of mandatoryenforcement over line-ministries. The latter proposal never passed the Diet, but
the CEFP has not been revived. Hence, the government is relying on ad hoc
committees for coordination. The consequence has been a major loss of ability
to coordinate. An NSC may be better in concept than the CEFP, but the lack of
either has been debilitating.
In formation of a policy-oversight council, such as the CEFP or an NSC, it is
important for there to be private sector representatives, appointed by the PM,
in order to create some distance between the debate in the council and political
distortions. Such a group could implement the recommendations of a scal
council, or even act itself as such a council.

8/3/2019 Geneva13
http://slidepdf.com/reader/full/geneva13 126/162
104 Public Debts: Nuts, Bolts and Worries
6.6 Pro-growth policies
Our second basic principle for sustainable scal consolidation, recall, is that
sustainable initiatives must be pro-growth. We consider the agenda for the US,Europe and Japan in this light.
6.6.1 The United States
Between 1979 and 2007, US real GDP per capita increased by 67%, a reasonably
healthy 1.9% annual rate. The US growth rate over this period compares
favourably to the growth rate of large continental European countries such as
France, Germany and Italy and was similar to high growth countries such as the
UK, the Netherlands, Finland and Sweden. The US economy has greater product
market competition and more exible labour markets than most European
economies, which may be part of the explanation for the relatively high growth
rates (Aghion and Howitt, 2006).
Looking forward, the US faces four challenges in sustaining high rates of
growth. First, if the current high unemployment rates are allowed to persist for
an extended period of time, potential GDP may be permanently lowered, as
the human capital of jobless individuals depreciates. Okun’s law implies that
in order to bring the unemployment rate down by one percentage point, GDP
must grow 2% above trend for a year. With US trend growth of about 2.5%, the
economy needs to grow at 4.5% for 2 years to bring the unemployment rate,
currently above 9%, down below 7%. But with US policymakers paralysed by fear
of decits, it is unlikely that the scal stimulus necessary to bring unemployment
down will be enacted. Growth will likely suffer.
Second, spending cuts may reduce growth-enhancing government
investments. It is clear that the US scal imbalance is going to lead to a reduction
in government spending. So far, cuts are planned for discretionary programmes,
but not for social insurance programmes. This pattern, along with the anti-tax
climate, raises the risk that the country will forego growth enhancing public
investments in research and development, infrastructure, and education in order
to continue to sustain retiree benet levels and low tax rates.
Third, growth rates may be limited if the country’s human capital policies fail
to improve. Until the 1980s, the US led the world in college completion rates.The US is now 12th as its rate has levelled off while that of other countries has
continued to climb. While college enrolment continues to grow, many who enrol
in college in the US fail to complete their studies. Moreover, many of the fastest
growing demographic groups are ones who have traditionally had low college
completion rates, adding to the challenge of increasing these rates over time.
There are also concerns that the large US nancial sector attracts too much of
the country’s top talent, diverting individuals from careers where they might
otherwise have made technological innovations that raise living standards.
Finally, starting in the1960s, the US switched to a family unication based
immigration policy that has increased the share of immigrants who have loweducation levels.

8/3/2019 Geneva13
http://slidepdf.com/reader/full/geneva13 127/162
Recommendations 105
Fourth, increasing income inequality could threaten future growth rates.
While US national income has grown rapidly over the past three decades, most
Americans did not experience a growth in their standard of living nearly as large as
the aggregate increase. The reason for this is that incomes in the US have becomemuch more concentrated at the top. For example, the share of income accruing
to the top 1% of taxpayers increased from 8% to 18% over this time period
(Piketty and Saez, 2003). For a country like the US that is at the technological
frontier, future growth rates will depend heavily on the amount of technological
innovation that it produces. Recent growth theories suggest that because of
imperfect capital markets, rising inequality can hinder innovation (Aghion et
al, 1999). In particular, if low and middle income individuals have high-return
investment opportunities but lack the resources to make investments, then the
economy will lose the ability to benet from those investment opportunities. If
these theories are correct, US growth rates may lag.
6.6.2 Europe
Growth has been slow in most eurozone countries. Corrected for purchasing
power, GDP per capita in the most advanced economies has been 10–25% below
the US level over the last decades. The gap has not been closed; if anything it
tended to increase before the crisis. Closing that gap can be a source of higher
growth for a number of years.
Part of the problem comes from fewer hours worked on average per person.
Shorter work weeks and longer paid vacations explain part of the difference, as
does lower female labour participation in some – but not all – European countries.
These features reect social preferences, which are unlikely to change any time
soon, except perhaps for female participation. Another part of the explanation
is early retirement, which as explained in Chapter 4 is also likely to put national
budgets under threat as the result of population ageing. Delaying retirement,
as some countries have already done, therefore carries a double bonus: better
public nances and faster growth. This would improve both the numerator and
the numerator of the debt-to-GDP ratio in countries where reforms have been
insufcient or inadequate.
Yet, another solution is to give older people the choice of how long they wish
to participate in the work force. This should include possibilities to earn incomesthat supplement pensions and the design of career paths allowing people to keep
working while reducing the physical and stress burdens of their jobs.
The lower productivity of European countries is also explained by a maze of
market-unfriendly regulation, both in labour markets and in product markets,
and in many cases, by large, relatively low-productivity public sectors. These
aspects, which again vastly vary in scope and nature across countries, are one
aspect of the common pool problem emphasised in Chapter 2. When many
groups are protected in various ways, and each exacts costs on all others, reforms
are politically difcult, especially given that these groups add up to a majority of
the population. Scaling down these inefciencies may prove even more difcultthan adopting scal rules and institutions.
8/3/2019 Geneva13
http://slidepdf.com/reader/full/geneva13 128/162
106 Public Debts: Nuts, Bolts and Worries
It follows that spending ceilings may be a useful complement to debt and
decit rules in European countries. If these ceilings imply a reduction of the share
of GDP devoted to public spending, over time they may force governments to
make hard choices. The familiar risk, however, is that the spending ceilings maybe jettisoned when a plurality of interest groups feel threatened.
In addition, growth could be boosted in practice by tax systems and personal
bankruptcy regulations designed to encourage rather than discourage risk taking.
Governments should not try to subsidise research and development in specic
areas, given that the public sector has no comparative advantage in identifying
which areas promise success and which do not. But tax systems can be designed
to assume a portion of the extraordinary income risk faced by entrepreneurs and
in that way to help to foster a growth-friendly environment.
Modern economic growth is based on the development of new and better
products and technologies rather than on making ever more of the same old
stuff. Innovation requires risk taking. The willingness to take risk being a matter
of preference, part of the explanation for why the United States has been more
innovative than Europe may be greater risk aversion of Europeans. While there
may be something to this point, the capacity to take risk is equally important.
US nancial markets have provided nancing for innovative activities to a much
larger extent than their European counterparts. Improving the ability of European
nancial markets to provide venture capital and other forms of nancing for
start-ups and the development of new products and technologies would improve
growth in Europe.
6.6.3 Japan
Fiscal reconstruction in Japan cannot be viewed as simply a matter of cutting
spending or raising taxes. Rather, the entire set of issues surrounding economic
growth is involved. Put bluntly, the best way to lower the debt/GDP ratio is by
raising the denominator. This can be accomplished most effectively by policies
to raise productivity and end deation. Both spending and taxation policies
should also be oriented toward these goals. Moreover, public sector workers, both
politicians and bureaucrats, need to be given incentives that make adoption of
rational scal policy consistent with self-interest.
That said, a key category of reforms applies to spending and taxation. Thesereforms cover healthcare and pensions, along with focusing incentives in the tax
system toward growth. In healthcare, a binding budget constraint on spending is
needed, especially in light of the sharp increase of the elderly over the next decade.
It would be effective to set an upper limit of taxation to support healthcare (eg as
a share of GDP). Healthcare spending would be funded within this limit, with no
further scal resources. Should the funding prove inadequate at a given level of
spending, then a national vote on raising the taxation limit would be triggered.
In order to offset the bias toward spending that emanates from the common pool
problem, a supermajority should be required to authorise higher taxes. In the
case of a national referendum, the required supermajority should be set inverselyproportional to the share of the elderly in the population – thus guaranteeing
8/3/2019 Geneva13
http://slidepdf.com/reader/full/geneva13 129/162
Recommendations 107
that the young also support the tax hike. In the case of a national Diet vote, the
supermajority needed would have to be large enough to offset the spending bias
in the electoral system. Quite importantly, any revisions to the system should
also require a supermajority.Another key aspect in healthcare is the need to apply IT more effectively. The
rst application would be a nationwide system of electronic medical records, with
a unied disease classication system, for use in deciding which treatments to be
covered by national health insurance. Hospitals and clinics not using this system
would not be eligible for payments by the national healthcare system. In addition,
a unied billing and payments system could greatly reduce administrative costs.
In the area of pensions, a hard budget constraint would also be helpful. This
will become more important, because the increased share of the elderly in the
population increases the spending bias arising from the common pool problem.
As with healthcare spending, a xed percentage of GDP could be established
as an upper limit of taxes dedicated to support of the pension system. Should
this amount prove inadequate, a supermajority would be required to raise tax
revenue for pensions; otherwise, pension payments would have to be cut.
A number of improvements to pension fairness would also increase economic
efciency. First, the retirement age should be indexed to aggregate longevity.
Moreover, the pension system should enhance incentives for older workers to
remain in the workforce. (Labour market rules to allow more wage exibility and
job change also could contribute to easing the pension problem.) In addition,
there should be means testing for national pensions. The transparency of pension
contributions and payouts also needs improvement, so that pensions become
actuarially fair. Finally, the cost-of-living adjustment system needs to offset both
ination and deation, with a price index tied to national productivity (eg the
GDP deator), not the consumer price index. A one-time, downward correction
of pensions for past deation would also be advisable.
Tax reform should be oriented toward enhancing productivity growth. This
means encouraging work and risk-taking. The corporate income tax cut should
be cut to levels that make Japan competitive with other nations, for example
to about 20% (from the current 40%). Double taxation of dividends should be
ended, and capital gains taxes should be abolished. In contrast, inheritance taxes
should be restructured to encourage spending prior to the end of life. (Excess
medical costs might also be recovered from remaining assets.) Marginal incometax rates should also be lowered, to encourage labour supply and skill-acquisition.
These changes would be paid for by expansion of non-distortionary taxes, such
as the consumption tax, along with some contribution from higher taxes on
alcohol and tobacco. In addition, in order to induce competition among local
governments, some local autonomy should be granted for income, property
and consumption taxes – provided that central government transfers to local
governments were adjusted accordingly. Finally, a national taxpayer ID number
should be introduced immediately, in order to enhance honesty, fairness and
efciency.
Consider next the problem of population ageing. As society ages, the labourparticipation rate inevitably falls; hence, raising productivity is the only way to

8/3/2019 Geneva13
http://slidepdf.com/reader/full/geneva13 130/162
108 Public Debts: Nuts, Bolts and Worries
maintain the standard of living.76 There are a number of ways to raise productivity,
but the most important is advancement of science and technology. Both energy
policy (in view of the nuclear power problems after the Fukushima accident)
and bio-tech (in view of medical needs of an ageing population) will be crucial.Increasing the number of scientists who can ll the need for increased R&D will
be the key challenge for the educational system, along with deregulation that
focuses applied science to commercial activities. Better communication with
foreign scientic communities is crucial as well, and hence the recommendation
for increased foreign study requirements in universities, increased scientic
exchanges, and expanded e-education.
The second macro subcategory is monetary policy. The extreme independence
of the Bank of Japan from political and policy debate has been a key determinant
of the slow and grudging response to deation, a more focused approach to
ination targeting could play a key role in Japan. However, the institutional
framework needs to change. Already, the BoJ has its own soft ination target
(called ‘an understanding of price stability’) of 0–2% for the overall consumer
price index. However, this target has no teeth. Deviations from the target entail
no consequences for the BoJ or the government. Moreover, the well-known
distortions in the CPI are ignored. Thus, as a way to improve nominal GDP
growth and to improve tax revenue, there should be a shift toward government-
imposed ination target of 1–3% for the GDP deator. Should this target be
missed, the Diet should have the option to replace the management of the BoJ
and the Monetary Policy Board.
The microeconomic side of the Japanese economy would benet from
a number of structural reforms, and thus could aid growth of tax revenue.
Agricultural reforms could increase land usage and promote more exports of farm
products. Several corporate governance reforms could help reallocate capital.
A requirement for independent outside directors and limits on equity cross-
holdings are two important ones. In addition, stockholders need to take their
responsibilities more seriously – those who fail to vote their shares should be
subject to dividend reductions. In the tax area, M&A has been discouraged by the
need to revalue assets and pay capital gains taxes; deferral of taxation on merger
activity could enhance capital and labour-use efciency.
In labour markets, both mobility and the incentive to acquire new skills
have been hampered by the legal vestiges of the life-time employment system.The status difference between regular workers and irregular workers should be
abolished. There needs to be clarity on severance pay rules, along with links
of executive compensation to corporate performance indicators, such as RoA,
RoE and employment. Both immigration policy and family support policies (eg
daycare, nursing care) need to encourage more labour market entry.
Enhancements in the area of public works spending are also needed. For
example, air-rail links at major airports are poor, especially compared to Asian
competitor hubs. A major restructuring of the airport system is also needed.
76 Consider the equation: Y / P = (Y / L)*( L/ P ), where Y is output, P is population, and L is labour. Theequation has a key implication: In the face of ageing, which lowers L/ P , the only way to maintain thestandard of living (Y / P ) is to raise productivity (Y / L).

8/3/2019 Geneva13
http://slidepdf.com/reader/full/geneva13 131/162
Recommendations 109
Concerning procedures, the selection of projects must be systematically based
on transparent criteria, such as RoI, along with much-improved disclosure and
double-checking of RoI forecasts. Revival of the budget-screening process would
enhance such process improvements.
6.7 Conclusion
Recent discussions of debt sustainability and scal consolidation have been
motivated by a sense of crisis: do something, anything, to put public debts back on
a sustainable footing because the markets are impatient and time is short. While
not denying the need for immediate measures to address immediate problems,
we have taken a step back in this report and consciously attempted to view the
public debt situation from a longer-term perspective. Even if the immediate
scal challenges confronting the advanced countries are successfully addressed,
further challenges will emerge in the future as populations age and interest rates
rise back toward more normal levels. Rather than remaining permanently in
crisis-management mode, there is value, we would argue, to stepping back from
current events and asking what should be done in terms of creating a broader
environment conducive to ensuring that public debts remain on a sustainable
footing.
We have argued that efforts along these lines should emphasise two
objectives: strengthening institutional arrangements useful for solving the
common pool problem intrinsic to decision making in the public sector, and
sustaining economic growth so as to work on the denominator of the debt/GDP
ratio. In doing so, it is important to acknowledge that one-size-ts-all advice
is not useful. Institutional reforms appropriate for countries with proportional
representation electoral systems, large electoral districts, and a high degree of
electoral competition that tend to result in coalition governments are unlikely
to work in countries with rst-past-the-post electoral systems and small district
magnitudes conducive to majoritarian governments. Institutions that work well
in countries with parliamentary systems are unlikely to be effective in countries
with presidential systems. Arrangements that work where party discipline is
strong are unlikely to work where it is weak.
Similarly, consolidation strategies that emphasise cutting spending are obviouslyappropriate where current spending is dangerously high but less obviously so
where the problem is on the revenue and entitlement sides and where spending
cuts will fall disproportionately on programmes, including support for research
and development, education and infrastructure, that shape the economy’s ability
to grow. This is a reminder that the two tasks – strengthening the institutional
arrangements through which scal policy is made and more effectively fostering
economic growth – affect one another. Ideally, policymakers will be aware of this
interdependence and pursue their two objectives in a consistent way.

8/3/2019 Geneva13
http://slidepdf.com/reader/full/geneva13 132/162
110 Public Debts: Nuts, Bolts and Worries
Appendix: Examples o successul and unsuccessul institutions
Successul institutions
The Netherlands
77
Perhaps the clearer example of an effective and well-adapted framework can be
found in the Netherlands. For a long time, the decit bias has been present in
this country. Following the adoption of a new framework in the early 1990s, the
public debt, long higher than the average of the rest of the eurozone countries,
started to decline, as shown in Figure 6.1. Even the uptick during the economic
and nancial crisis cannot be interpreted as a relapse into scal indiscipline; it
mostly reects the need to recapitalise a couple of large banks that failed during
the subprime crisis.
The Dutch contracting process fully reects the nature of Dutch politics and
involves both rules and an original institution, the Central Planning Bureau
(CPB).78 Proportional representation in a parliamentary system means that
government is always a coalition of parties. The proper response is the contract
approach. The Dutch arrangement effectively promotes explicit and transparent
contracts. It all starts during the election. Competing political parties provide the
CPB with their economic programmes, which allows the Bureau to evaluate their
budgetary implications. These impartial and highly visible evaluations force the
political parties to be careful with their electoral promises, an important step to
contain the common pool problem.
Following the elections, the winning coalition works out an explicit scal
policy contract that is binding until the next election. The CPB provides
estimates of the budget over the duration of the legislature, based on its own
macroeconomic forecasts. This document becomes the harbinger of scal policy.
A key element is the required adoption of medium-term spending ceilings, for
each ministry. There is no standard – and arbitrary – mandatory number but,
given that governments always involve several parties, the practice has a clear
moderating impact. There is a little bit of exibility (1%) for shifting spending
from one year to the next but ‘growth bonuses’ are not usable later. Taxes become
the main macroeconomic instrument, under the scrutiny of the CPB, which
evaluates debt sustainability. The resulting tendency for procyclical policies is of
limited importance for a small and very open economy.
The CPB is also involved in the annual budgetary cycles. The Finance Ministryrelies on the Bureau to evaluate each budget early at the preparation stage and
when the budget is nalised. This removes the possibility for the government to
use overly optimistic macroeconomic forecasts and costing calculations.
77 A detailed description can be found in Bos (2007).78 As its formal name suggests, the CPB was created in the early postwar period (it now calls itself Bureau
of Economic Analysis but retains its acronym CPB). It was initially designed to work on economicplanning at a time of scarcity. Its rst Director, Nobel Prize laureate Jan Tinbergen, gave the CPB
prominence and credibility. Although it is formally part of the Ministry of Economic Affairs, the CPBenjoys de facto independence, partly because of its various supervisory boards, and partly because of its history and positioning in Dutch society.

8/3/2019 Geneva13
http://slidepdf.com/reader/full/geneva13 133/162
Recommendations 111
Switzerland
As the relentless increase in public indebtedness throughout the 1990s indicates,
Switzerland too was suffering from a decit bias. This led to the adoption in 2000
of a constitutional scal rule that came into effect in 2003.
79
Figure 6.2 showsthat the rule has resulted in a sharp reversal of the debt trend. This reversal is
particularly spectacular as it has continued throughout the crisis.
The debt brake is a rule, which requires that the overall federal budget be
balanced over the cycle. To that effect, any budget imbalance, whether positive or
negative, is credited into a control account. If the cumulated amount is negative,
it must be brought to balance ‘over the next few years’. No requirement applies
when the cumulated amount is positive. This clever arrangement implies that,
over time and at the government’s discretion, decits must be compensated for
by surpluses. The stipulation is exible enough not to put the government in apro-cyclical straightjacket. It could lead to prolonged slippages, though, but this
is unlikely in a country committed to the rule of law. During the crisis, the debt
brake gured prominently in policy debates and quite clearly shaped the policy
response. As in the Netherlands, procyclical policies may carry limited importance
given the relatively small size and large openness of the Swiss economy.
Any binding rule stands to become harmful in special unforeseen
circumstances. This is why the debt brake includes an escape clause. In case of
exceptional circumstances (deep recession, natural disasters and the like) the
implied spending ceiling can be raised but this requires a qualied majority
79 The constitutional rule adopted by Germany in 2009, which is due to be fully implemented in 2016, isclosely patterned after the Swiss ‘debt brake’.
Figure 6.1 Public debts in The Netherlands and the Euro area (% o GDP)
Source: AMECO, European Commission
Netherlands Euro area
110
100
90
80
70
60
50
40
30
20
1960 1965 1970 1985 2000 20102005199519901975 1980

8/3/2019 Geneva13
http://slidepdf.com/reader/full/geneva13 134/162
112 Public Debts: Nuts, Bolts and Worries
(three-fths) in both chambers. An amendment stipulates that any such slippage
must be added to the control account and therefore compensated by surpluses
once the situation returns to normal.
The success of the Swiss debt brake (so far) derives from the simplicity andexibility of the rule. It has not been severely tested yet, however. In particular, it
remains to be seen what would happen should a negative balance in the control
account not be corrected ‘over the next few years’. Presumably, the case could be
sent to the Higher Court.
Unsuccessul institutions (so ar)
The UK: Old and new institutions
Following the election of the Tony Blair government, the Chancellor of the
Exchequer, Gordon Brown, adopted the Code for Fiscal Stability. The Code was
consulted on and then formally established through the Finance Act 1998, it
set out a new scal policy framework aimed at promoting a ‘commonsense and
accountable approach to managing the public nances in the long-term interests
of Britain’. The Code pledged transparency, stability, responsibility, fairness and
efciency in the setting of scal policy and the management of public nances.
Although it was not set formally in legislation or the Code, Gordon Brown
stipulated a ‘golden rule’ to which UK scal policy would adhere; requiring that
the current budget be balanced over the business cycle. He also implemented the
‘sustainable investment rule’, that public sector net debt would be maintained
at a prudent level (which came to be 40% of GDP). The UK Treasury (and the
Chancellor of the Exchequer himself) retained responsibility for the economic
and public nances forecast against which achievement of its scal rules were
judged. Furthermore, there was no enforcement mechanism in the event that
rules were breached and the Chancellor retained discretion to change the scal
rules at each Budget, should he wish to do so.
Figure 6.3 suggests that the Code was not awless. The budget improved
considerably after 1998 as the Blair government adhered to inherited spending
plans. But the budget decit worsened from 2001–2 as Chancellor Brown began
increasing public expenditure, particularly on health. The budget remained in
negative territory, with the UK running a structural decit, until the plunge
provoked (and justied) by the nancial crisis.According to Table 6.1, the UK is a delegation country. Strengthening the hand
of the nance minister is therefore a well-adapted solution to the decit bias.80
The Code illustrates our view that scal discipline needs to rely upon either
formal numerical rules, or powerful scal procedures – hopefully involving an
independent council – or preferably both. The Code for Fiscal Stability included
none of these crucial elements.
Soon after the election in 2010 of the Cameron government, the Chancellor,
George Osborne, created the independent Ofce for Budget Responsibility
(OBR). The main duty of the OBR, set out in primary legislation in the Budget
80 Over the 33 years from 1960 to 1999, the British budget has been in decit for 33 years, with relativelysmall surpluses and on average larger decits.

8/3/2019 Geneva13
http://slidepdf.com/reader/full/geneva13 135/162
Recommendations 113
Responsibility and National Audit Act 2011, is ‘to examine and report on the
sustainability of the public nances’. The OBR produces the UK’s ofcial
economic and scal forecast on which the government sets policy. These
forecasts are produced by the OBR itself independently of the government. TheOBR is also given an ofcial watchdog role. In particular, it formally assesses the
government’s progress against its own announced scal targets (of a cyclically
adjusted budget surplus and a declining debt to GDP ratio by the end of the ve-
year forecast horizon).
The new institution again matches the delegation nature of the British
political system, but is a historic break with the past and increases independence,
credibility and transparency. The OBR is embedded in primary legislation and
has a formal Memorandum of Understanding with the UK Treasury and othergovernment departments to govern working relationships and the OBR’s full
access to government data and forecasting resources. Furthermore, to support
the OBR’s independence, the OBR is located away from the UK Treasury, and
staff that were initially seconded to the OBR from the Treasury have now been
transferred permanently and answer only to the Chairman of the OBR, Robert
Chote.
The UK’s scal rules are now required by primary legislation and set out
formally in the Charter for Budget Responsibility (the successor document to
the old Code). Furthermore, the government has to amend the Charter – which
requires a majority vote in Parliament – in order to change its scal rules.
Figure 6.2 Public debt in Switzerland (% o GDP)
Source: Economic Outlook, OECD
30
40
50
60
1 99 0 1 99 2 1 99 4 1 99 6 1 99 8 2 00 0 2 00 2 2 00 4 2 00 6 2 00 8 2 01 0

8/3/2019 Geneva13
http://slidepdf.com/reader/full/geneva13 136/162
114 Public Debts: Nuts, Bolts and Worries
With the passage of primary legislation, the creation of the OBR and the new
Charter, the UK’s scal policy framework has been improved but still has some
weaknesses. There is still the absence of an enforcement mechanism for the
government’s scal rules. Although the Chancellor is now required to explain toParliament if the OBR judges that the government is no longer on course to meet
its rules, there is no automatic adjustment mechanism and the Chancellor may
rather change the rules than adjust scal policy. It remains early days for the UK’s
new scal framework.
The new institution again matches the delegation nature of the British political
system. Indeed, like the Dutch CPB, the OBR is embedded into the UK Treasury, so
that its role is to reinforce the credibility of the work that is conducted there. Still,
it has weaknesses. It depends entirely on the Treasury for data and for much of its
analytical work. While its Board includes individuals with impeccable credentials,
it lacks the independent staff and resources that provide true independence. Inaddition, there still is no formal numerical rule. While the government now has
to state publicly and formally its medium targets, the targets can be changed or
‘adjusted’ when circumstances change. Both shortcomings could be alleviated
by a practice seen as truly independent in the OBR’s early years, following classic
British-style common law tradition, but this remains to be seen. Surely, more
independence and formal rules could be added.
France
The last year when the French budget was balanced was 1974. The public debt
has been increasing relative to GDP ever since. Public opinion has never attached
great attention to the lack of discipline of its various governments, focusinginstead on the classic common pool practice of requesting more public spending
Figure 6.3 Budget defcit in the UK (% o GDP)
Source: AMECO, European Commission.
-12
-10
-8
-6
-4
-2
0
2
4
6
1990199219941996 19982000200220042006200820102012
Actual budget Structural budget

8/3/2019 Geneva13
http://slidepdf.com/reader/full/geneva13 137/162
Recommendations 115
and more transfers while disapproving of tax increases. ‘Austerity’ is a word that
guarantees electoral loss.
Policymakers have long been aware that the public debt has not been stabilised.
Numerous commissions have been appointed and each has produced reportsconrming the lack of discipline and making proposals for reform. As a result, a
number of steps have been taken to constrain the budget preparation process. But
these steps have not gone as far as establishing a rule or an independent watchdog.
France has a mixed presidential-parliamentarian regime: it is presidential when
the presidency and the Assembly (the lower chamber) are controlled by the same
party, it is parliamentarian in the opposite case. The majority is always dominated
by a single party, which suggests that France is a delegation country. Indeed, the
nance minister has large agenda-setting power, but this power is shared with
the president or parliament according to the prevailing regime.
Two arrangements, the LOLF ( Loi Organique des Lois de Finance) and the RGPP
( Revision Générale des Politiques Publiques), entered into force in 2006 and 2007,
respectively. Their objective, however, is less scal discipline than effectiveness
of public spending. Importantly, the LOLF brings together a series of disparate
budgets – mainly state and welfare – that used to be treated separately. Indeed,
until then, these budgets were treated completely separately, with the result that
decits were cumulated without policymakers being forced to take a view of
the aggregate public decits. It still is the case that the Parliament votes on two
legally distinct budgets (central government and welfare) but the LOLF requires
that the overall budget be explicitly acknowledged.
In 2008, a constitutional amendment established the requirement that the
overall budget be brought to balance. This has led to three-year budget programmes
( Loi de Programmation des Finances Publiques, LPFP), which are required to display
a path toward balance. The procedure also requires the nance minister to set
ceilings for annual spending and oors for planned annual tax revenues, and the
Parliament cannot override the government.
In practice, however, the government can appeal informally to special
circumstances and deviate from the pre-specied path. In addition, numerous
loopholes exist and they are being actively exploited.81 The rst implementation
of the LPFP is a case in point. Figure 6.4 shows the evolution of the debt as
specied by the law adopted in 2008 for the three-year period 2009–11. Noting
the high level of uncertainty created by the crisis, the government remainedvery cautious and merely aimed at stabilising the debt to GDP ratio. Even so, the
actual implementation led to a17 percentage point increase in the ratio.
In practice, the LPFP failed to affect even the public debate, which merely
payed lip service to the constitutional request. There are good reasons for that.
First, the law requires a three-year path toward equilibrium but sets no horizon
for achieving it. Second, the Higher Court (Cours Constitutionnelle), which
theoretically could censure the government, has a history of considering the
budget as an instrument rather than the object of any legal commitment. Third,
while such departures must in principle be corrected ‘over the next few years’, the
81 As in many countries, ‘tax expenditures’ – tax advantages offered to specic interest groups – haveincreased considerably.

8/3/2019 Geneva13
http://slidepdf.com/reader/full/geneva13 138/162
116 Public Debts: Nuts, Bolts and Worries
horizon is not specied. Fourth, the LPFP concerns the budget law, not the budget
execution. The relevant court (Cours des Comptes) publishes a report several
months after the annual budget has been closed, letting all bygones be bygones.
Fifth, various budgetary laws accumulated over the years have created a maze of rules so opaque that only few people – budget policy insiders – understand them.
This strengthens the common pool problem. Finally, the nance minister could
use its power to constrain the process but, historically, it has never stood up to
the president and to the parliament.
In conclusion, the constitutional budget requirement is a statement of
intention with no rule, no binding constraint, and no enforcement mechanism.
The existing watchdogs are courts with limited economic expertise and a long
tradition of avoiding any confrontation with the government on macroeconomic
matters.
Figure 6.4 Gross public debt in France (% o GDP)
Source: Ministère du Budget, France and AMECO, European Commission
60
65
70
75
80
85
90
2008 2009 2010 2011
Actual LPFP

8/3/2019 Geneva13
http://slidepdf.com/reader/full/geneva13 139/162
117
Discussion
Presentation o the country chapters
Ted Truman, Peterson Institute of International Economics, Washington
Ted Truman started by noting the importance of the topic and by stating that
he particularly appreciated the Geneva Report’s wealth of information, the
combination of a retrospective look into the causes of the current state of the
world and the forward-looking projections, the focus on institutions and the
associated political economy issues, and the discussion of particularities of each
country. He shared the view of the authors that the 90% debt/GDP threshold that
is believed to be critical for debt distress is too simplistic and added that the three
cases presented face different degrees of urgency. He also referred to a recent IMF
study on ageing.
He was not convinced that the common pool hypothesis was at the key
explanation of why democracies generate excessive debt levels. The common
pool hypothesis can explain decisions made at the margin, while most of the
tax and expenditure decisions are intra-marginal. Also, the common-pool
framework leaves out the role of scal policy in macroeconomic stabilisation and
the associated decision-making process. Observing that economists’ opinions on
the issue remain divided, he wondered how this framework performs historically.
On the issue of urgency, he argued that one should not focus solely on the
demographic time bombs, but also on policies, in particular monetary, regulatory
and structural policies. He observed that international interactions matter, in
particular the potential advantages or disadvantages of moving rst or last. Also,
he stressed the potential relevance of countries outside the G3 for the analysis,for example their investment and savings rates.
Commenting on the US case, he appreciated the historical dimension and
agreed with the basic message that a solution will be eventually found but that
there is considerable uncertainty about the choice of policy instruments and
about timing. Yet, there is a scope for a balanced approach that would target both
revenues and expenditures. He also believed that some institutional innovations
are needed but thought that markets are not fooled by the current weaknesses
such as the temporary programmes. Regarding timing, he reminded the audience
that the last scal consolidation in the US took a decade to accomplish. This
suggests that it makes sense to wait until after the 2012 presidential election sothat it can be fought over scal issues.
8/3/2019 Geneva13
http://slidepdf.com/reader/full/geneva13 140/162
118 Public Debts: Nuts, Bolts and Worries
On the other cases, Ted Truman expressed doubts about scal dominance in
Europe. He next wondered whether Japan is more or less exposed to a debt crisis
than other countries. The conventional argument is that the Japanese are less
exposed because they owe their debt to themselves. However, he saw a tensionthere between people who repay the debt and those that are on the receiving
end. Similarly, he was not convinced of disproportional benets for seniors. In
his view, the payments to seniors are a part of a social contract and the seniors
think that they paid for their benets in advance. In that respect, it would be
useful to know exactly how much they contributed to the system and how it
compares to the promised benets.
Benoit Coeuré, Ministère de l’Economie et des Finances, Paris
Focused on the EU, Benoit Coeuré praised the framework adopted by the Geneva
Report and acknowledged the importance of focusing on institutions and
implementation. He distinguished two types of issues: How did we get into the
present situation and the associated threats? And how do we move back to a
sustainable path, and what is needed to succeed in that effort?
Agreeing that public nances in the Eurozone are in an unpleasant situation, he
observed that the latest data reveals that the decits in many countries decreased
much more quickly than had been expected. Concerning the ‘business-as-usual’
scenarios presented in the report, he thought that the exercise was a little bit
too forward-looking. More effort must be devoted to detect persistence in scal
patterns because it is difcult to change the way governments are working,
especially in large countries. Resistance to change comes from entrenched social
preferences, bureaucratic habits, rent-seeking etc. For example, in France the high
level of debt before the crisis was not caused by ageing but by increases in social
transfers. As a result, if one wants to foresee how current trends can be reversed
in the future, it is important to understand why high growth of social spending
has been supported in the past. There are various potential explanations: the
need to compensate the losers from globalisation, a call for more redistribution
as a reaction to rising inequalities, or an increasingly fragmented society laying
the ground for attrition wars and delayed scal adjustment.
More attention should also be paid to short-term developments beyond long-
term trends such as ageing, he said, because the initial position is important, in
particular the discrepancy between the cyclically adjusted and the debt-stabilisingdecit. The most crucial task is to map the initial dynamics. To illustrate how
this should be done, he referred the audience to the European Commission’s S2
indicator (sustainability gap) that is composed of two parts: the initial dynamics
and the long-term trends.
Benoit Coeuré next commented on institutions. He felt that the authors of the
report underestimate the reforms of the European governance currently under
way. He disagreed in particular on the presumed inefciency of reforms of the
Stability and Growth Pact (SGP) in strengthening enforcement at the national
level. The package currently under discussion by the European Parliament
contains a directive on minimal requirements on national scal frameworks.The package sets a common framework for scal policies in the Eurozone

8/3/2019 Geneva13
http://slidepdf.com/reader/full/geneva13 141/162
Discussion 119
countries with a path for debt-reduction, budget balance targets, and multiyear
numerical rules for spending and tax levels. In addition to annual budgets that
will be discussed by the national parliaments, a stability programme will be
discussed at the European level. This framework is already implemented or underimplementation in some countries. In his view, this new system is an important
step as it brings more complementarities between national and EU rules, and it
assures time-consistency by the introduction of compulsory multiyear planning.
He disagreed with the authors on the notion that growth will not solve the
debt problem. He was sympathetic to the idea that growth should not be an
excuse for a lack of scal efforts, but without raising the level of potential growth
Europe cannot get on a sustainable path, no matter what type of scal rules will
be implemented. So, according to Benoit Coeuré, there is also a need for pro-
growth institutions, which is discussed neither in the report nor at the European
level.
He felt that the issues of monetary policy dominance should be discussed
more in the case of the USA than in the case of the Eurozone. First, the Eurozone
is the only region where monetary dominance is established in the Constitution.
Second, the security purchase programme implemented by the ECB is too limited
to create a signicant risk of ination. Still, even though there is no risk to
monetary dominance at the moment, he warned that scal dominance might
creep in through the mandate given to the central bank on nancial stability.
Benoit Coeuré concluded that there was a need to develop more further the
consequences of a scal crisis to be able to better imagine what would happen
if we do not do anything. He felt it was important to explain how disruptive
sovereign defaults are, to warn against the risk of monetisation, and to highlight
the threat of disappearance of safe nancial assets. Fifteen years ago, people
discussed what would happen if there was no public debt and the nancial
markets would have to live without safe assets. Now that there is too much public
debt, we face uncertainty regarding the safety of some of these debts.
Kazumasa Iwata, Institute of Economic and Social Research, Tokyo
Kazumasa Iwata focused on the case of Japan. He highlighted intergenerational
inequality in the social security system, which is unusually large given the
otherwise relative small scale of government in Japan. Focusing on the proposed
solution, he rst dealt with the issue of productivity. The Japanese government
produces two versions of medium-term scal projections, which differ by theassumptions they make regarding productivity growth. Even under the more
optimistic assumptions, the primary budget is projected to be in decit but
the outcome is very sensitive to assumptions. A 1% difference in forecasted
productivity growth over the next 10 years produces a 30% difference in the
debt-to-GDP ratio. This means that if Japan succeeds in raising productivity
growth by 1%, the scal benets will be signicant.
Turning to the Geneva Report’s proposal to raise the consumption tax,
Kazumasare Iwata presented projections by the Institute of Economic and Social
Research. Assuming a 5% increase in consumption tax and 0.9% productivity
growth (compared to the 1.9% optimistic scenario of the government), theprimary budget still remains in decit, mainly due to the negative impact of

8/3/2019 Geneva13
http://slidepdf.com/reader/full/geneva13 142/162
120 Public Debts: Nuts, Bolts and Worries
the consumption tax on output. He also noted that the consumption tax would
generate only a one-time increase in consumer prices; therefore it would not help
with ending deation. He suggested a different way to both end deation and
decrease the intergenerational inequality: introduce a tax-nanced basic publicpension system along with a funded scheme as a second pillar.
He added that in theory, scal policy can substitute for monetary policy, for
example by enacting an interest rate tax credit, which is equivalent to decreasing
the interest rate. In order to shift the tax burden away from labour and toward
consumption, one can combine consumption tax increases together with wage
tax reductions.
David Ramsden, HM Treasury, London
David Ramsden focused on the UK, drawing on his experience on crisis response
and consolidation. As a scal policymaker, he liked the institutional approach,
which resonated well with the UK experience. The report correctly argues that
there is no one-size-ts-all when it comes to stabilisation policies or institutional
constructions. Unlike the authors, however, he was optimistic about the potential
of supply-side policies to have a benecial impact. He also thought that the report
was too critical of quantication. He did not think that the rules of thumb, such
as the 90% debt-GDP ratio, always apply but they can serve as a stabilisation
objective. In addition, clear rules or rules of thumb help to focus the minds
of policymakers, offering a reference for comparisons with previous historical
episodes and with other countries. He also advocated the use of IMF data and
especially the IMF Fiscal Sustainability Risk Map for Advanced Economies, in fact
quite close to the Geneva Report’s focus on policy implementation.
David Ramsden agged three types of risks. First, he was concerned with the
health of the nancial sector. When the banking sector is large, the riskiness of
banks’ assets contributes signicantly to sovereign risk. Indeed, in 2010 countries
with large nancial sectors tended to post large primary structural decits.
Second, demographics constitute a long-term challenge because of uncertainties
in estimating the scope of the associated risks. For instance, estimates of
future health care spending in the UK are very sensitive to assumptions about
technological changes. In this kind of situation, he argued, an independent scal
council can make a sizeable contribution in publishing reports on sustainability.
The third risk concerns macroeconomic uncertainty. According to the IMF, a clearscal strategy can reduce uncertainty and hence support condence. In order to
deal with the tail risk of a very nasty scal outcome, the UK has already started
scal consolidation. Although in the short term, the consolidation seems to have
an adverse impact on growth, one has to consider the counterfactual. Here again
scal councils would have a role to play in setting gures that can serve as a basis
for decision making, for example by estimating cyclically adjusted budgets or by
showing the cost of ination for the public sector in order to mitigate fears of
monetisation.

8/3/2019 Geneva13
http://slidepdf.com/reader/full/geneva13 143/162
Discussion 121
General Discussion
Jean Pisani-Ferry, Director, Bruegel, Brussels
Jean Pisani-Ferry wanted to distinguish some implicit assumptions that the reportmakes among countries. It assumes that, in the USA, the nancial crisis had a
major cyclical component while in Europe the shock was more structural and that
the output is lost forever. Is that certain? Also, looking to the future by assuming
that policy is constant can be misleading, when it is in fact unsustainable.
Akira Kohsaka, Professor, School of International Studies, Kwansei Gakuin University,
Hyogo
Commenting on Japan, Akira Kosaka felt that Chapter 5 overemphasised the lack
of transparency in Japanese budget gures, while Japan is really not an exception.
He also noted that decision rules that impose a medium-term constraint on
policy cannot be easily changed. Finally, he agreed on the importance of ending
deation. Japan has gone through 10-year cycles of scal consolidation: in the
1980s, scal consolidation was successful in Japan, in contrast with most other
OECD countries. Then, in the 1990s, the situation turned around and Japan’s scal
situation deteriorated signicantly. In the 2000s Japan was again unsuccessful in
consolidating its public nances. Hence, the lost decade turned out to stretch to
two lost decades. Ending deation should be taken as the top priority. Reacting
to Kazumasa Iwata’s proposed tax reforms, Akira Kohsaka suggested that easy
money can also be a part of the solution, for example the Bank of Japan could
purchase government bonds.
Alexander Swoboda, Emeritus Professor of Economics, The Graduate Institute of
International and Development Studies, Geneva
Alexander Swoboda thought that, indeed, more should be said about the
possibility of reducing the stock of debt through ination. Even though in
the case of Japan, this does not come naturally to mind because of persistent
deation, for the other two cases, the USA and the EU, this prospect should
be more seriously discussed. This would raise serious questions of international
coordination. Within the G20, for example, China has been reacting to the
depreciation of the dollar. He also indicated that he remained unconvinced by
the ‘no-size-ts-all’ view as too easy a criticism of some policies. For him, the realquestion is to nd a general rule or policy that would be acceptable by individual
countries.
Angel Ubide, Director of Global Economics, Tudor Investment Corporation,
Washington DC
Angel Ubide wanted to hear more on why we should be worried by high public
debts. The markets focus on countries with high levels of debt when accompanied
by current account decits. It is not just a question of the size of the debt, but
who owns the debt and how it is nanced matters. He claimed that if we cannot
explain why Japan has not had a crisis already, we need not worry by debtincreases in other countries.

8/3/2019 Geneva13
http://slidepdf.com/reader/full/geneva13 144/162
122 Public Debts: Nuts, Bolts and Worries
Ignazio Visco, Member of the Governing Board and Deputy Director General, Banca
d’Italia, Roma
Ignazio Visco agreed that more attention should be given to the differences innet foreign positions. He also mentioned the extreme home bias of Japanese
investors, who hold 90% of the Japanese public debt. The question is how
important is this fact and what would need to happen to change it, especially
since most crises happen when people try to move capital abroad.
Robert Feldman, Managing Director, Morgan Stanley, Tokyo
Robert Feldman disagreed with Akira Kosaka who asserted that the lack of
transparency of Japanese public accounts was in line with what can be found
in other developed countries. At any rate, the lack of transparency in other
countries should not be an excuse for Japan. He also took exception with the
view that political institutions cannot be changed. This is simply a question of
political will. On the other hand, he agreed on the need to end deation.
Concerning the channels through which a more aggressive policy by the Bank
of Japan might operate, he mentioned the foreign exchange rate, land prices and
asset prices in general, as well as investment spending. He was amazed that there
was no debate on the real interest rate: if the Bank of Japan succeeds in increasing
ination, the real interest rate will go down which would stimulate investment
and productivity growth.
On the issue of inating the debt away, he quoted Reinhart and Rogoff (2009):
why do the young people not rise up, generate ination and take the wealth from
the old generation? In his view, ination is politically the easiest (and probably
fairest) way to reduce the public debt, since it is politically very hard to raise taxes
or cut spending. He also indicated that he was sceptical about the fairness of the
‘social contract’ because it is in fact the currently old generation that voted on
benets that need to be paid by people that were not involved in the decision-
making process. It was not society that made promises to the old generation,
they made those promises to themselves.
Finally, he commented on the home bias question and on the prospects of a
bond market crisis in Japan. He warned against mixing up stocks and ows. The
stock view is that 90% of bonds are owned at home, largely because investing
abroad is perceived to be dangerous. Looking at ows, however, he noted thatsavings are likely to diminish while investment will not decrease by as much,
in part because of the earthquake. In the end, there will not be enough money
to fund the larger decits over time and the Bank of Japan will end up printing
money. He also pointed out that there already were a couple of small crises that
got contained in the end, for example in the autumn of 2009. If the debt increases
further, it will get to a level where such tax revenues will not be sufcient to cover
the interest payments.
Eric Chaney, Chief Economist, AXA, Paris
Eric Chaney picked up the issue of monetary dominance. In 1946 the US debtwas 122% of GDP. Ten years later it was down at 60%. While many would say

8/3/2019 Geneva13
http://slidepdf.com/reader/full/geneva13 145/162
Discussion 123
that the debt decreased so rapidly because of high ination, the real story is much
more about strong GDP growth (4% GDP growth, 3.5% ination). It is often said
that high ination will not be effective in resolving indebtedness unless it is a
surprise. However, ination will reduce the initial stock of debt because interestrates are xed (at least in the USA). Hence, with a look at the fact that the Fed
does not have an ination target, the question is whether the USA could not try
a different mix this time, for example 4% ination and 3% GDP growth.
About Japan, Eric Chaney felt that market feedback is an important part of the
story. Even though market discipline did not work in Europe, it might come back
through some structural changes. In the case of the USA, he was sympathetic
with the thesis that it was the imbalance between supply and demand of reserve
assets that was responsible for low interest rates before the crisis. But now, China
has decided to change policy and focus more on domestic demand. As a result,
in the rst quarter of 2011 China was running a current account decit. This is
an example of structural changes that can lead to higher interest rates and that
would amplify the policy reaction.
All in all, market discipline is extremely useful. In the case of Europe, without
a good crisis, there would be no reform of governance in the Eurozone. He
suggested that it is also needed to talk about debt restructuring. This could
awaken market discipline and send a shock wave not only through the Eurozone
but also to other OECD countries such as the UK.
Amlan Roy, Managing Director, Credit Suisse (Securities) Europe Limited
Amlan Roy quoted his own projections showing that the current account in Japan
will go negative much earlier because of adverse demographics. On the topic
of transparency and implicit liabilities, he mentioned that the present value of
decit from US state pension plans not accounted for stands at $5 trillion. The
US government is allowing discounting future liabilities at the rate of 8% while
none of the plans is making returns higher than 1%. Implicit liabilities in health
programmes provide another example of huge implicit liabilities.
Richard Portes, Professor of Economics, London Business School; President, CEPR,
London
Richard Portes disagreed with the framework of the report. In his view, there are
two long-run scal issues: health care and pensions. The demographic problemneeds to be solved by reforming the labour market. If the retirement age does
not increase in line with life expectancy, then the living standards of the retired
people have to fall relative to those who work. Alternatively, those who work
have to make higher transfers to those who do not work. In this case, scal policy
is irrelevant: the key is to make people work longer. The share of working people
in the population determines the overall size of the intergenerational transfer.
From this point of view, it is mainly a labour market problem, not a scal one.
Dino Kos, Managing Director, Hamiltonian Associates Ltd., New York
Dino Kos suggested looking at the example of Canada. In the early 1990s Canadawas regarded as a hopeless case. Yet, thanks to tough decisions and with some luck

8/3/2019 Geneva13
http://slidepdf.com/reader/full/geneva13 146/162
124 Public Debts: Nuts, Bolts and Worries
they managed to improve their scal situation. He also agreed that it is important
not to overlook implicit liabilities. If focus is centred solely on the public debt,
politicians will move everything out of the balance sheet. For example, in 1968
the Johnson administration privatised Fannie Mae exactly in order to get it off the public sector balance sheet.
Luigi Buttiglione, Head of Global Strategy, Brevan Howard Investment Products
Limited, Geneva
According to Luigi Buttiglione, the Eurozone is facing a joint problem of
competiveness and debt stabilisation. The countries that want to regain
competitiveness within the Eurozone need deation. On the other hand, with
debt stabilisation it is ination that would help.
Thomas Jordan, Vice Chairman of the Governing Board, Swiss National Bank, Bern
Concerning the topic of scal versus monetary dominance, Thomas Jordan
agreed that generating ination was not a good idea. However, what matters
is not what central bankers think but what politicians decide. Although at the
moment we have monetary dominance, this should not be taken for granted. If
debt levels keep increasing, the situation might change completely. Regarding
scal stabilisation in the USA, he observed that it has been previously mentioned
that the correction should come both from the spending and the tax side.
Now, however, it is often asserted that the correction should come mainly from
spending cuts because the US tax system is too distortionary.
Laurence Boone, Chief Economist, Barclays Capital, Paris
Laurence Boone asked how the Eurozone can grow with such a high level of debt.
She also wondered what will happen if the adjustment strategy fails. Restructuring
the Greek debt would be an example of such a failure and she was wondering
how the Eurozone would deal with it.
Jacques Delpla, Economist, Conseil d’analyse economique, Paris
While the report emphasised the supply side of the public debt, Jacques Delpla felt
that more attention should be paid to the demand side, that is, reactions of the
market. Another important aspect to consider is that the fact that the European
Stability Mechanism (ESM) will be a senior creditor will send an important signalto investors on what would happen in case of restructuring. This is why interest
rates cannot be taken as xed; they will play an even larger role in the future.
Jeffrey Liebman, Professor of Public Policy, Harvard University, Cambridge, MA
Jeffrey Liebman sought to explain pessimism about potential growth compared
to past experience. While productivity growth is likely to be the same as in
the past, the important factor that distinguished the current situation is that
labour force growth is going to be slower because of the demographics. He also
commented on the tax versus spending split of scal stabilisation. Currently, the
USA is on a trajectory with increasing spending as a share of GDP. Some peoplesee this as a proof of expanding government, while it is only a predictable effect

8/3/2019 Geneva13
http://slidepdf.com/reader/full/geneva13 147/162
Discussion 125
of the ageing of the society. As a consequence, there is no easy spending splurge
that can be reversed; reducing spending would mean reducing entitlements of
the old generation. It is politically feasible to cut pension spending or to stem the
increase in health care costs, but that cannot be done earlier than in 3–5 years.Thus, if one is committed to acting fast, it is the revenues that must be increased.
In the longer run, government spending depends on how much state-of-the-art
health care the USA wants to consume. Most of the research suggests that the
benets of spending on health care still exceed the costs. This means that when
cutting expenditures one would need to focus on low-value health care spending.
Charles Wyplosz, Professor of International Economics, The Graduate Institute of
International and Development Studies; Director, ICMB, Geneva
Charles Wyplosz acknowledged that the report does not take into account
the demand side of the government bond market. The reason is a conscious
choice not to be driven by the debt crises, which is the object of much work
elsewhere. He next indicated that he had serious doubts about the usefulness
of debt sustainability measures. For example, the Portuguese debt was deemed
sustainable 6 months ago, then it increased by a negligible amount and suddenly
the markets decided it is not sustainable. Sustainability, he claimed, cannot be
measured; instead it is driven by market sentiment.
On the topic of supply-side policies and growth, he noted that raising real GDP
growth by 1% can make a huge difference. However, implementing supply-side
policies is politically as difcult as dealing with budget decits because generally
they both affect the same groups of people.
On whether we should focus only on public debt in an environment when a
part of the private debt can become public in a crisis, he observed that uncertainty
about the size of this phenomenon is substantial. The risk is that people take
seriously numbers based on arbitrary assumptions.
Finally, he pointed to the fact that the popular message from charts showing
past trajectories of labour cost within the Eurozone assume that 1999 – the year
when the euro was launched – was a year when real exchange rates were in
equilibrium. Other normalisation assumptions provide a different impression.
In addition, it is not necessarily true that competitiveness needs to be regained
by deation. In fact, the countries that have competitiveness problems are those
with very little productivity growth in the past and, therefore, some growthpotential in the future.
The Political Economy o Fiscal Consolidation (Chapter 2)
Stefan Gerlach, Managing Director, Institute for Monetary and Financial Stability,
House of Finance, Goethe University of Frankfurt
Stefan Gerlach congratulated the authors on writing a clear and informative
chapter that reviews the important lessons. He underlined the importance of
scal rules and decit-limiting restricting laws in general. Looking at the problemof increasing or continuously high decits through the lens of the political

8/3/2019 Geneva13
http://slidepdf.com/reader/full/geneva13 148/162
126 Public Debts: Nuts, Bolts and Worries
system and the game theory of politics is clearly appropriate. On the other hand,
the question why scal rules are ineffective in some countries is not explicitly
analysed. The main issue is that enforcement, which distorts the picture of
effective scal rules, is simply inherent to certain forms of governance. Headmitted that there might be a lack of counterfactuals to make a strong argument
about enforcement.
Stefan Gerlach also agreed with the view that large decits reect structural
problems, which, more often than not, stem directly from the way politics is
institutionalised. He wondered whether there would also be a strong correlation
between large decits and alternative, more general indicators of government-
like transparency or corruption. He has found such a strong correlation in his
own research. He further suggested that history could yield further insight. Does
a large debt in the past mean a large debt at present? Would the same approach
allow the same conclusions in the context of the Gold Standard? Again, he was
of the opinion that there is a strong correlation in both cases. In conclusion he
said that the report does well to not try and answer the question of how to tax,
but how to change the institutional framework.
Steven Cecchetti, Economic Adviser, Bank for International Settlements
Steven Cecchetti presented some of his own ndings, based on the comparison
of decit and debt forecasts up to 2040 with different policies implemented along
the way. The lessons from this work are reasonably reassuring. First, switching
to forward-looking budgeting processes, including multiyear budgeting, can
have an immediate and important impact. Second, poor communication and
lack of transparency often cause problems. Facing the common pool problem,
democratically elected government ofcials and representatives can improve the
dialogue with voters to transparently present the effects of policies and laws that
they stand for. Third, countries that have created important reserve funds have
performed much better in balancing budgets in the long run and in reacting to
crises (eg Chile). Fourth, in most countries there is a dearth of economic research
on long-term aspects of decits and debt. Governments stand to benet from
knowing more and better, not in general terms – such as rules – but on how their
own economy and political systems operate.
He then asked whether scal rules can really work. Noting that the introduction
of scal rules is politically challenging, he thought that the Geneva Reportcould be of great help to make the issues at stake better understood. But he also
pointed out that scal rules are not sufcient as such and that implementation
is more complex than the presentation of the concept suggests. For scal rules
to work there needs to be at least an independent agency that reviews their
success and implementation, forecasts must be realistic and independently
produced, communication should be clear and based on maximum disclosure,
and independent research must be developed. Fiscal policy is at least as complex
as monetary policy and yet research seems to have been neglected so far. He
concluded that this report is a step in the right direction, a welcome effort to shift
the focus to a certain degree.

8/3/2019 Geneva13
http://slidepdf.com/reader/full/geneva13 149/162
Discussion 127
Lars Nyberg, Deputy Governor, Sveriges Riksbank
Lars Nyberg presented the experience of Sweden, a country that has achieved
over the past years a good track record in terms of managing scal policy and
debt, unlike most of the countries analysed. He said that governments seem tohave short memories though. He recalled that for several centuries everyone said
they would never again bring themselves into a situation, where the incentives
favour spending much more than saving.
When Sweden had a problem of rising debt in 1992, it devalued. Growth was
fuelled by exports, which helped signicantly. Yet, it took until about 1998 for
public nances to be brought back into order. The strategy has been carefully
discussed, around the principle that ‘He who is in debt is not free’. Sweden now
has adopted an expenditure ceiling, a key part of the effort to reduce decit
spending. There is also a goal to achieve a budget surplus of at least 1% per year.
In addition, regional budgets must be balanced. Parliament decides on budgets
3 years ahead, and they cannot be altered any more after that. This ensures that
spending focuses on long-term needs, rather than short-term interests. Loopholes
exist, especially in the details, but this has not caused large problems so far. One
reason why the system has remained stable is that buffers were introduced to
balance budgets in times of need. The main buffer is the 1% surplus target. In
addition to planning budgets three years ahead, and setting them in stone,
parliamentarians are also required to propose plans for nancing any project that
they wish to introduce. The experience is that it is particularly difcult to stick to
the plan when things are going well, when pressure grows to increase spending
on health care or education.
Hans-Jörg Rudloff, Chairman, Barclays Capital
Giving his personal opinion as a practitioner, Hans-Jörg Rudloff started by
asking: ‘How will we continue to nance all this debt?’ He said that the markets
– banks, insurance companies, asset managers and more – have massively failed
to give the right signals when it became clear that there was a big problem with
sovereign debts. They should have said that they would no longer accept the
piling up of debt to the extent reached in the European Union. The yield curve
across the European Union was essentially at before the start of the nancial
crisis. That is extraordinary. The market did not just fail to send the right signal,
they sent the wrong one.When Greece was found to be in crisis (Sunday 9 May 2010), it still needed
money. They got it on Tuesday, 11 May 2010. This is another example of a wrong
signal, namely that the nancial markets would continue to nance public debt,
even for Greece, and even after it became clear that the government could no
longer service its debt. Huge short positions had been built up at this point.
Obviously, market participants knew what would happen. They even knew who
held the short positions. Unfortunately the banks would not do themselves a
favour by making their actions more transparent, which is why it was hard for
counterparties to understand what was going on.
Now all relevant parties know that some Eurozone countries will need torenance their debt soon. The amounts of money in question are large, and
8/3/2019 Geneva13
http://slidepdf.com/reader/full/geneva13 150/162
128 Public Debts: Nuts, Bolts and Worries
they will have to be rolled over at some point or another. If governments fail
to act now, things will only get worse, he said. He also pointed out that there is
no functioning mechanism to address the issue because adequate institutions
are missing. In his view, governments are still far from being in a position tohandle what may be coming. He also said that, in general, we are far from having
reached a system that could function in a crisis, especially because restructuring
is not an attractive option, not least for practical reasons.
General Discussion
Hans Genberg, Assistant Director, Independent Evaluation Ofce of the IMF
Hans Genberg highlighted the importance of independent forecasts for GDP,
because governments have an incentive to produce optimistic forecasts of GDP
growth, in order to be able to spend more. He questioned the approach of viewing
the issue of large debts only as a result of institutions. He noted that it could
also be a question of mentality. To underline the statement he pointed out that
Greece already had the highest debt to GDP ratio under the gold standard. Given
that background, can we even change institutions?
Richard Portes, Porfessor of Economics, London Business School and President of
CEPR
Richard Portes suggested that the effectiveness of scal councils could be
overestimated. Reacting to calls for independent forecasts, he pointed out that
it has become more difcult to forecast GDP growth. The condence intervals
of forecasts have grown over the past years, so it would be unwise to delegate
such a complex task to a scal council. Independent forecasts should come from
the private sector consensus forecast to limit reputation loss and to increase
accuracy. He added that it would be difcult to safeguard the independence of
such institutions, particularly because cooperation with government and civil
servants is one of the goals.
Ivan Adamovich, Member of Executive Management, Wegelin & Co.
Ivan Adamovich thought that the estimates of implicit debts presented in
Chapters 3 to 5 were moderate compared to other forecasts. Concerning
retirement benets, he observed that there is simply no one with a strong interestin undertaking fundamental medium-term reforms. Do we have to accept that
reforms are simply achieved because of good luck? The serious issue, he suggested,
is not how to do the best reforms but how to start reforms. He suggested that
the Geneva Report should also take into account that investors are now moving
away from public debts.
Jean-Pierre Landau, Deputy Director, Banque de France
Responding to Ivan Adamovich, Jean-Pierre Landau asked where investors who
move away from government bonds go to. Corporate bonds is one option, but
is the market deep enough? Safer? What are the alternative investment vehicles?He remarked that these are essential questions.

8/3/2019 Geneva13
http://slidepdf.com/reader/full/geneva13 151/162
Discussion 129
Jaques Delpla, Economist, Conseil d’Analyse Economique
Jaques Delpla thought that incentives should play a larger role in possible
solutions. The Geneva Report spends a lot of time looking for rst best solutionsbut what about more realistic second best strategies? How could that look? In
France, for example, there will not be a majority for a scal rule.
Edwin Truman, Senior Fellow, Peterson Institute for International Economics
Edwin Truman reminded the audience that we have had a common pool
problem for centuries. Almost everything that is recommended as a solution in
the report, or presented by Steven Cecchetti, has been tried out or done. This
does not necessarily mean that previous actions were failures, but it might mean
that we have to go through the same cycle again and again, maybe every 15 or
20 or 50 years. This could simply mean that institutions and processes erode over
time. The efforts are not fruitless, but the phenomenon is a typical characteristic
of the political economy. Presenting the issue in this light might be helpful, he
suggested.
Jürgen Von Hagen , Professor of Economics, Bonn University
ürgen Von Hagen answered some of the questions. First he pointed out that
institutional reforms happen in periods of crisis. This is when institutions are
reformed and improved. Is it the new institution that does the consolidation,
or rather the consensus that something needs to be done? He argued that it is a
mixture of both. However, it is the institutions that help make the memory of
the crises stick in the years afterwards and that is when they become important.
As for Europe, he said that the common currency is the main reason for the
European Union to deal with the issue. The common currency means that the
countries can no longer independently react to adverse shocks. He mentioned
the example of France’s move from the Fourth to the Fifth Republic, when a
scal crisis led to important institutional reforms. Denmark, the Netherlands,
and Sweden also enacted reforms that proved to be successful and sustainable.
He also reacted to the comment that France had no interest in a scal rule. He
said that a scal rule in France would be silly, because France is not a contractual
system. This is one of the central points of Chapter 2; scal rules and reform in
general have to t the system of the country where it should be applied.As for forecast, he observed that the problem is not accuracy but bias, and
here again political institutions matter. Consistently biased forecasts of GDP,
where the forecast of GDP growth is biased downwards and expenditures
upwards, is typical of a contract country, because a coalition is in a much better
position when it rewrites the contract if there is a surplus rather than a decit.
In a delegation country, we observe the exact opposite, and that is where an
independent forecast should play a big role.
Jeffrey Liebman, Professor of Public Policy, Harvard University
Jeffrey Liebman stated that, in the USA, the forecasts of the CBO have performedwell. They provide a good basis for the debate on adjustments that have to be

8/3/2019 Geneva13
http://slidepdf.com/reader/full/geneva13 152/162
130 Public Debts: Nuts, Bolts and Worries
done. Of course the components of an adjustment still need to be discussed. He
also underlined that the process of setting up institutions that can address the
issue takes several years.
Charles Wyplosz, Professor of International Economics, the Graduate Institute of
International and Development Studies and Director, ICMB, CEPR
Charles Wyplosz picked up the issue of incentive. The key idea of the report is
that if you can internalise the incentives you no longer have a common pool
problem. Responding to Stefan Gerlach, he cited works that show that the
common pool problem tends to be stronger the more heterogeneous a population
is. It is therefore quite probable that there are long-lasting differences between
countries. This is not in contradiction with the theory.
Robert Feldman, Managing Director, Morgan Stanley MUFG
Robert Feldman quoted the Crisis-Response-Improvement-Complacency (CRIC)
model that he has been using for the past 15 years in Japan. The model is very
easy to grasp. On the horizontal axis you have growth of the stock market; on
the vertical axis, you have the extent of reform currently undertaken. An upward
sloping line represents the notion that the more reforms are undertaken, the
better the economy will perform. The political side is captured by a downward
sloping line: the better the economy performs, the less incentive there is to push
for reform. This suggests that crisis is necessary for reform, as observed by Jürgen
Von Hagen. It also indicates that the response to the crisis is more effective where
solutions are readily available. The question that the report explores is how to
reform the process of reform. He then supported the view that using a weighted
average of private forecasts would make sense. On the use of incentives, he
mentioned civil servants’ contract in Singapore as a good example.
Alexander Swoboda, Emeritus Professor of Economics, Graduate Institute of
International and Development Studies
Alexander Swoboda saw an additional dimension to the role of growth and crises
in shaping incentives for reform, namely whether the crisis is international or
national. The response to the crisis should be very different in each case. Drawing
on the case of Switzerland, he noted that forecasts have been rather conservative
recently. This observation made him think that a country’s performance indealing with its public debt follows a historical average.
David Ramsden, Chief Economic Advisor, Head of Government Economic Service, HM
Treasury
David Ramsden emphasised that he did not see scal councils as a ‘magic
bullet’ that solves everything. He would like the report to go further in assessing
scal councils, especially when dealing with forecasts. He suggests that scal
councils should do scenario analysis in addition to looking at central forecasts.
He underlined again the importance of independence of these councils. His
last comment was that the report should try to push into normative space andoutline applicable concepts more concretely.

8/3/2019 Geneva13
http://slidepdf.com/reader/full/geneva13 153/162
Discussion 131
Jean Pisani-Ferry, Director, Bruegel, Brussels
Jean Pisani-Ferry introduced the distinction between economic and scal forecasts.
For economic forecasts the private sector does well and these forecasts can be
useful. However, for scal forecasts, the government has a huge informationaladvantage, which should not be forgotten.
Mark Carey, Senior Adviser, Federal Reserve Board
Mark Carey also commented on the question of how incentives could be
integrated explicitly in the report. He states that in the common pool problem,
the problem comes from the voters. How to change their incentives? He went
on to ask whether it could be envisaged that pension payments would be linked
to some measure of debt sustainability over a dened period of time in the
past? Working out how to dene debt sustainability is another question, but
he mentioned looking at interest rate spreads and the debt-to-GDP ratio as two
crude examples of what he had in mind.
Daniele Franco, Head of Department, Structural Economic Analysis, Banca d’Italia
Daniele Franco asked if the German constitutional rule, should it fail, could not
only be useless but also harmful because it would be focusing attention on the
wrong solution. He also added a note of caution to the idea of scal councils. He
said that in problematic countries with high debt, one needs a lot of information
on the debt itself, which might not even be available to the government. How
could this problem be addressed?
Jeffrey Liebman, Professor of Public Policy, Harvard University
Jeffrey Liebman did not see it as necessary to use forecasts from private sources.
Private budget forecasts typically do not cover a period of more than 18 months
ahead. While the consensus forecast from the private sector is a good idea for the
short term, for the long term other forecasts are needed.
Jürgen Von Hagen , Professor of Economics, Bonn University
Responding to Daniele Franco’s question, Jürgen Von Hagen said that German
state governments will not comply as the largest state does not comply. The reason
is that state incentives to balance budgets are very small. The federal government,
Jürgen Von Hagen added, will comply, but for the wrong reasons. Due to the newrule, all governments are required to have balanced budgets after 2019, except
for the federal government. However, the federal government can borrow in the
name of state governments, which he believes is likely to happen. He added that
the federal government already shares a lot of responsibility related to social
policies with state and even municipal governments, effectively mandating local
governments to increase spending on its behalf. This contributed to balanced
federal budgets over the past years. It has also created more pressure on the states.
In his view, this leads state governments to ask the federal government to borrow
on their behalf, which would then defeat the purpose of the debt break.

8/3/2019 Geneva13
http://slidepdf.com/reader/full/geneva13 154/162
132 Public Debts: Nuts, Bolts and Worries
Charles Wyplosz, Professor of International Economics, the Graduate Institute of
International and Development Studies and Director, ICMB, CEPR
Charles Wyplosz responded to Mark Carey’s suggestion of focusing on voters.
He wondered whether this idea might be extended, possibly generalised. Whyshould pensions only be made contingent on debt sustainability, why not roads
or anything else? The logic is that the whole budgetary process be linked to
public indebtedness.
Mark Carey, Senior Adviser, Federal Reserve Board
Mark Carey answered by saying that the key could be indexing scal policy
to something long term. Ideally to something that concerns people over their
whole life.

8/3/2019 Geneva13
http://slidepdf.com/reader/full/geneva13 155/162
133
Reerences
Abbas, S A, Belhocine, N, ElGanainy, A and Horton, M (2010), ‘A Historical Public
Debt Database’, IMF Working Paper 10/245.
Afonso, A, Schuknecht, L and Tanzi, V (2003), ‘Public Sector Efciency: An
International Comparison’, ECB Working Paper 242.
Aghion, P, Caroli, E and Garcia-Penalosa, C (1999), ‘Inequality and Economic
Growth: The Perspective of the New Growth Theories’, Journal of Economic
Literature, 37, pp 1615–60.
Aghion, P and Howitt, P (2006), ‘Appropriate Growth Policy: A Unifying
Framework’, Journal of the European Economic Association 4 (April–May 2006),
pp 269–314.
Alesina, A, Baqir, R and Easterley, W (1997), Public Goods and Ethnic Divisions.
NBER Working Paper No. 6009.
Alesina, A, Hausman, R, Hommes, R and Stein, E (1999), ‘Budget Institutions and
Fiscal Performance in Latin America’, Journal of Development Economics 59, pp
253–73.
Alesina, A and Perotti, R (1996), ‘Fiscal Discipline and the Budget Process’,
American Economic Review, Papers and Proceedings, pp 401–7.
Alesina, A, Perrotti, R and Tavares, J (1998), ‘The Political Economy of Fiscal
Adjustments’, Brookings Papers on Economic Activity 1, pp 197–266.
Alm, J and Skidmore, M (1999), ‘Why Do Tax and Expenditure Limitations Pass
in State Elections?’ Public Finance Review 27, pp 481–510.
Alt, J E and Dreyer-Lassen, D (2006), ‘Fiscal Transparency, Political parties and
Debt in OECD Countries’, European Economic Review 50, pp 1403–39.
Annett, A (2000), ‘Social Fractionalization, Political Instability, and the Size of
Government’, IMF Working Paper 00/82.
Annett, A (2005), ‘Enforcement and the Stability and Growth Pact: How FiscalPolicy Did and Didn’t Change under Europe’s Fiscal Framework’, Working
Paper, European Department, IMF September.
Annett, A, Decressin, J and Deppler M (2005), ‘Reforming the Stability and
Growth Pact’, IMF Policy Discussion Paper 05/2, Washington DC.
Auerbach, A, Gale, W and Orszag, P (2006), ‘The Budget: Plus Ca Change, Plus
C’est la Même Chose’, Tax Notes, 17 April.
Auerbach, A, Gale, W, Orszag, P and Potter, S (2003), ‘Budget Blues: The Fiscal
Outlook and Options for Reform’, in H Aaron, J Lindsey and P Nivola (eds),
Agenda for the Nation, pp 109–43.
Auerbach, A J and Lee, R (2009), ‘Notional Dened Contribution Pension Systemsin a Stochastic Context: Design and Stability’, in J R Brown, J B Liebman
8/3/2019 Geneva13
http://slidepdf.com/reader/full/geneva13 156/162
134 Public Debts: Nuts, Bolts and Worries
and D A Wise (eds), Social Security Policy in a Changing Environment , Chicago,
University of Chicago Press.
Ball, L. (1997), ‘A Proposal for the Next Macroeconomic Reform.’Victoria Economic
Commentaries March, pp 1-7.Berkmen, S P (2011), ‘The Impact of Fiscal Consolidation and Structural Reforms
on Growth in Japan’, Working Paper No. WP/11/13, IMF.
Blinder, A (1997), ‘Is Government too Political?’ Foreign Affairs 76, pp 115–26.
Bos, F (2007) ‘The Dutch Fiscal Framework History, Current Practice and the Role
of the CPB’, CPB Document No.150, CPB Netherlands Bureau for Economic
Analysis.
Buiter, W (1985), ‘A Guide to Public Sector Debt and Decits’, Economic Policy 1,
pp 15–79.
Buiter, W (2003), ‘Ten Commandments for a Fiscal Rule in the EMU’, Oxford
Review of Economic Policy , 19(5), pp 84–99.
Canova, C and Pappa, E (2005), Does it Cost to Be Virtuous?, NBER Working
Paper No. 11065.
Careaga, M and Weingast, B R (2000), ‘The Fiscal Pact with the Devil: A Positive
Approach to Fiscal Federalism, Revenue Sharing, and Good Governance’,
Working Paper, Stanford University.
Cecchetti, S, Mohanty, M S and Zampolli, F (2010), ‘The Future of Public Debt:
Prospects and Implications’, BIS Working Paper No. 300 (March).
Congressional Budget Ofce (2001), The Economic and Budget Outlook, FY
2001–11.
Congressional Budget Ofce (2011), The Economic and Budget Outlook, FY
2011–21.
Cutler, D (2010), ‘How Health Care Reform Must Bend the Cost Curve’, Health
Affairs 29 (6), pp 1131–35.
Cutler, D, Rosen, A and Vijan, S (2006), ‘The Value of Medical Spending in the
United States, 1960–2000’, New England Journal of Medicine 355, pp 920–27.
Daban, T, Detragiache, E, Milesi-Ferretti, G M and Symansky, S (2001), ‘Rules-
based Fiscal Policy and the Fiscal Framework in France, Germany, Italy, and
Spain’, mimeo, IMF, Washington DC.
Debrun, X, Hauner, D and Kumar, M S (2009), ‘Independent Fiscal Agencies’,
Journal of Economic Surveys 23(1), pp 48–81.
Debrun, X and Kumar, M S (2007) ‘Fiscal Rules, Fiscal Councils and All That:Commitment Devices, Signaling Tools or Smokescreens?’ in Banca d’Italia
(eds.) Fiscal Policy: Current Issues and Challenges, pp 479–512.
Debt Reduction Task Force (2010), Restoring America’s Future: Reviving the Economy,
Cutting Spending and Debt, and Creating a Simple, Pro-Growth Tax System,
(Bipartisan Policy Center, Washington, DC).
Dore, O, and Masson, P R (2002), ‘Experience with Budgetary Convergence in the
WAEMU’, Working Paper 02/108, Washington DC, IMF.
Dornbusch, R and Draghi, M (1990), Public Debt Management: Theory and History ,
Cambridge, Cambridge University Press.
Economic Policy Committee (2001), ‘Budgetary Challenges Posed by AgeingPopulations’, EPC/ECFIN/655/01-EN.

8/3/2019 Geneva13
http://slidepdf.com/reader/full/geneva13 157/162
References 135
Eichengreen, B, Hausmann, R and Von Hagen, J (1999), ‘Reforming Budgetary
Institutions in Latin America: The Case for a National Fiscal Council’, Open
Economies Review10, pp 415–42.
Eichengreen, B and Von Hagen, J (1996), ‘Fiscal Policy and Monetary Union:Federalism, Fiscal Restrictions, and the No-Bailout Rule’, in H Siebert (ed),
Monetary Policy in an Integrated World Economy, Tübingen, JCB Mohr.
Eichengreen, Barry and Charles Wyplosz (1997) ‘The Stability Pact: Minor
Nuisance, Major Diversion?’, Economic Policy 26, p.65-114.
Elmendorf, D (2011), Testimony before the Senate Budget Committee, 27 January.
Elmendorf, D, Liebman, J, and Wilcox, D (2002), ‘Fiscal Policy and Social Security
Policy During the 1990s’, in J Frankel and P Orszag (eds), American Economic
Policy in the 1990s, Cambridge, MIT Press.
Emmerson, C, and Frayne, C (2002), ‘The Government’s Fiscal Rules’, Institute for
Fiscal Studies Brieng Notes 16 (July).
Engelberg Center for Health Care Reform (2009), Bending the Curve through Health
Reform Implementation .
European Commission (2006), ‘Public Finances in EMU’, European Economy 3.
European Commission (2008), ‘Ageing Report – Underlying Assumptions and
Projection Methodologies’, European Economy 7.
European Commission (2009), ‘Ageing Report’, European Economy 2.
European Commission (2010a), ‘Public Finances in EMU, 2010’, European
Economy 4.
European Commission (2010b), ‘Progress and Key Challenges in the Delivery of
Adequate and Sustainable Pensions in Europe’, European Economy Occasional
Paper 71.
Fatas, A and Mihov, I (2003), ‘The Case for Restricting Fiscal Policy Discretion’,
Quarterly Journal of Economics 118, pp 1419–48.
Fatas, A and Mihov, I (2004), ‘The Macroeconomic Effects of Fiscal Rules in the
U.S. States’, mimeo, INSEAD.
Fatas, A, Von Hagen, J, Hughes-Hallett, A, Strauch, R R and Sibert, A (2003),
Stability and Growth in Europe: Towards a Better Pact, London, CEPR.
Feldman, R (2010a), ‘Revolution: Radical Revamp of Upper House Election
System Proposed by DPJ’, Morgan Stanley, 13 December.
Feldman, R (2010b), ‘Revolution Update: A Step Forward toward Upper House
Reform’, Morgan Stanley, 27 December.Feldman, R (2011), ‘Supreme Court Mandates Electoral Reform, Major Pro-
Growth Impact Likely’, Morgan Stanley.
Feldman, R, et al . (2010), ‘Deation: Will America and Europe Follow Japan’,
Morgan Stanley, 6 September.
Feldstein, M (2010), ‘Preventing a National Debt Explosion’, in J Brown (ed), Tax
Policy and the Economy , vol. 25.
Garber, A M, and Skinner, J. (2008), ‘Is American Health Care Uniquely Inefcient?’
Journal of Economic Perspectives, 22, pp 27–50.
Giavazzi, F and Spaventa, L (1988), High Public Debt: The Italian Experience,
Cambridge, Cambridge University Press.

8/3/2019 Geneva13
http://slidepdf.com/reader/full/geneva13 158/162
136 Public Debts: Nuts, Bolts and Worries
Gleich, H (2002), ‘The Evolution of Budget Institutions in Central and Eastern
European Countries’, PhD dissertation, University of Bonn.
Gruen, N (1997), ‘Making Fiscal Policy Flexibly Independent of Government’,
Agenda 4, pp 297–307.Guichard, S, Kennedy, M, Wurzel, E and Andre, C (2007), ‘What Promotes Fiscal
Consolidation: OECD Country Experiences’, OECD Economics Department
Working Papers 553, OECD Publishing.
Hall, R and Jones, C (2007), ‘The Value of Life and the Rise in Health Spending’,
Quarterly Journal of Economics, 122(1), pp 39–72.
Hallerberg, M and Von Hagen, J (1999), ‘Electoral Institutions, Cabinet
Negotiations, and Budget Decits in the EU’, in J Poterba, and J Von Hagen
(eds), Fiscal Institutions and Fiscal Performance, Chicago, University of Chicago
Press.
Hallerberg, M, Strauch, R R and Von Hagen, J (2001), The Use and Effectiveness
of Fiscal Norms and Rules in the EU, Research Report to the Dutch Ministry of
Finance, The Hague.
Hallerberg, M, Strauch, R R and Von Hagen, J (2007), ‘The Design of Fiscal Rules
and Forms of Governance in European Union Countries’, European Journal of
Political Economy 23(2), pp 338–59.
Hallerberg, M, Strauch, R R and Von Hagen, J (2009), Fiscal Governance in Europe,
Cambridge, Cambridge University Press.
Hemming, R, and Kell, M (2001), ‘Promoting Fiscal Responsibility – Transparency,
Rules, and Independent Fiscal Authorities’, paper presented at the Banca
D’Italia Third Workshop on Fiscal Rules, Perugia, 1–3 February.
Holtz-Eakin, D and Ramlet, M (2010), ‘Health Care Reform Is Likely to Widen
Federal Budget Decits, Not Reduce Them’, Health Affairs, 29, pp 1136–41.
IMF (2009), ‘Fiscal Rules – Anchoring Expectations for Sustainable Public
Finances’, Fiscal Affairs Department.
Irons, J and Bevins, J (2010), ‘Government Debt and Economic Growth’,
Economic Policy Institute Brieng Paper No. 271 (July).
Jonung, L and Larch, M (2006), ‘Improving Fiscal Policy in the EU: The Case for
Independent Forecasts’, Economic Policy 21, pp 491–534.
Kennedy, S and Robbins, J (2001), ‘The Role of Fiscal Rules in Determining Fiscal
Performance’, Department of Finance Working Paper 2001–16, Ottawa.
Khemani, S (2007), ‘Does Delegation of Fiscal Policy to an Independent AgencyMake a Difference? Evidence from Intergovernmental Transfers in India’,
Journal of Development Economics 82, pp 464–84.
Kiewiet, D R and Szakaly, K (1996), ‘Constitutional Limits on Borrowing:
An Analysis of State Bonded Indebtedness’, Journal of Law, Economics and
Organization 12, pp 62–97.
Kontopoulos, Y and Perotti, R (1999), ‘Government Fragmentation and Fiscal
Policy Outcomes: Evidence from OECD Countries’, in J Poterba and J Von
Hagen (eds), Fiscal Institutions and Fiscal Performance, Chicago, Chicago
University Press.
Kopits, G (2001), ‘Useful Policy Framework or Unnecessary Ornament?’ IMFWorking Paper No. 145.

8/3/2019 Geneva13
http://slidepdf.com/reader/full/geneva13 159/162
References 137
Kopits, G and Craig, J (1998), Transparency in Government Operations. IMF
Occasional Paper No. 158.
Kopits, G and Symansky, S (1998), Fiscal Policy Rules, IMF Occasional Paper No.
162.Lao-Araya, K (1997), ‘The Effect of Budget Structure on Fiscal Performance: A
Study of Selected Asian Countries’, IMF Working Paper , Washington DC.
Leeper, E (2009), ‘Anchoring Fiscal Expectations’, Reserve Bank of New Zealand
Bulletin 72(3), pp 17–42.
Leith, C and Wren-Lewis, S (2005), ‘Fiscal Stabilization Policy and Fiscal
Institutions’, Oxford Review of Economic Policy 21, pp 584–97.
Milesi-Ferretti, G M (2004), ‘Good, Bad, or Ugly? On the Effects of Fiscal Rules
with Creative Accounting’, Journal of Public Economics 88 pp 377–94.
Millar, J (1997), ‘The Effect of Budget Rules on Fiscal Performance and
Macroeconomic Stabilization’, Bank of Canada Working Paper 97-15.
Mills, P and Quinet, A (2002), ‘The Case for Spending Rules’, Banca d’Italia
Workshop on Fiscal Rules, http://www.bancaditalia.it/studiricerche/convegni/ atti/sc_rules/session2/319-330_mills_and_quinet.pdf
National Commission on Fiscal Responsibility and Reform (2010), The Moment
of Truth: Report of the National Commission on Fiscal Responsibility and Reform .
O’Donoghue, J and Goulding, L (2004), ‘Ination since 1750’, Economic Trends
604, pp 38–46.
Ofce of Management and Budget (2010), Budget of the United States
Government, Fiscal Year 2011.
Peach, R (2001), ‘The Evolution of the Federal Budget and Fiscal Rules’, paper
presented at the Banca D’Italia, Third Workshop on Fiscal Rules, Perugia, 1–3
February.
Perotti, R, Strauch, R R and Von Hagen, J (1998), Sustainability of Public Finances,
London, CEPR.
Persson, M, Persson, T and Svensson, L E O (1987), ‘Time Consistency of Fiscal
and Monetary Policy’, Econometrica 55(6), pp 1419–31.
Piketty, T and Saez, E (2003), ‘Income Inequality in the United States, 1913–1998’
Quarterly Journal of Economics, 118(1), pp 1–39.
Poole, K T (2005) ‘The Decline and Rise of Party Polarization in Congress During
the Twentieth Century,’ Extensions (Carl Albert Congressional Research and
Studies Center, University of Oklahoma), Fall 2005, pp 1-6.Poterba, J, and Von Hagen, J (eds) (1999), Fiscal Institutions and Fiscal Performance,
Chicago, University of Chicago Press.
Reinhardt, U (2008), ‘Why Does U.S. Health Care Cost So Much?’ Economix, 14
November.
Reinhart C and Rogoff, K (2009), This Time is Different, Princeton University
Press.
Reinhart, C and Rogoff, K (2010), ‘Growth in a Time of Debt’, American Economic
Association Papers and Proceedings (May).
Rodden, J, Eskeland, G and Litvack, J (2003), Fiscal Decentralization and the
Challenge of Hard Budget Constraints, Cambridge MA, MIT Press.

8/3/2019 Geneva13
http://slidepdf.com/reader/full/geneva13 160/162
138 Public Debts: Nuts, Bolts and Worries
Roubini, N and Sachs, J D (1989), ‘Political and Economic Determinants of
Budget Decits in the Industrial Democracies’, European Economic Review 33,
pp 903–38.
Rueben, K (1997), ‘Tax Limitations and Government Growth: The Effect of State Tax and Expenditure Limits on State and Local Government’, mimeo,
California Institute of Public Policy.
Sato, T, Yamaguchi, T and Ohashi, M (2011), ‘Rebutting Post-Quake Fiscal Alarm:
Keep Concerns in Check but Fiscal Balance Commitment Is Key’, Morgan
Stanley, Tokyo.
Schadler, S (2005), ‘Enhancing the Credibility of Fiscal Policy – The Role of Fiscal
Responsibility Laws and Fiscal Councils’, Remarks at the Belgian Constituency
Meeting Istanbul, 10 June, mimeo, European Department, IMF.
Shadbegian, R J (1996), ‘Do Tax and Expenditure Limits Affect the Size and
Growth of State Government?’ Contemporary Economi Policy 14, pp 22–35.
Strauch, R R (1998), ‘Budget Processes and Fiscal Discipline: Evidence from the
US States’, Working Paper, Zentrum für Europäische Integrationsforschung
Bonn.
Strauch, R R and Von Hagen, J (1999), ‘Tumbling Giant: Germany’s Experience
with the Maastricht Criteria’, in D Cobham and G Zis (eds), From EMS to EMU ,
London, Macmillan.
Ter-Minassian, T (2002), ‘Institutional Reforms for Fiscal Sustainability with
Special Reference to Latin America’, Presentation Note, IMF Fiscal Affairs
Department, January.
Velasco, A (1999), ‘Debts and Decits with Fragmented Fiscal Policymaking’,
in J Poterba and J Von Hagen (eds), Fiscal Institutions and Fiscal Performance,
Chicago, University of Chicago Press.
Von Hagen, J (1991), ‘A Note on the Empirical Effectiveness of Formal Fiscal
Restraints’, Journal of Public Economics 44, pp 199–210.
Von Hagen, J (1992), ‘Budgeting Procedures and Fiscal Performance in the
European Communities’, Economic Papers 96.
Von Hagen, J (2004), ‘Political Economy of Fiscal Institutions’, ZEI, University of
Bonn.
Von Hagen, J (2006a), ‘Fiscal Consolidation and Growth’, unpublished, University
of Bonn.
Von Hagen, J (2006b), ‘Fiscal Rules and Fiscal Performance in the EU and Japan’, Monetary and Economic Studies 14, pp 25–60.
Von Hagen, J (2010), ‘The Scope and Limits of Fiscal Councils’, mimeo, University
of Bonn.
Von Hagen, J, Bordignon, M, Grewal, B, Peterson, P and Seitz, H (2000), ‘Subnational
Government Bailouts in OECD Countries: Four Case Studies’, Interamerican
Development Bank Research Network Working Paper R-399. Washington DC,
http://idbdocs.iadb.org/wsdocs/getdocument.aspx?docnum=788028.
Von Hagen, J and Harden, I (1994a), ‘Budget Processes and Commitment to Fiscal
Discipline.’ European Economic Review 39, pp 771–9.
Von Hagen, J and Harden, I (1994b), ‘National Budget Processes and FiscalPerformance’, European Economy, Reports and Studies 3, pp 315–418.

8/3/2019 Geneva13
http://slidepdf.com/reader/full/geneva13 161/162
References 139
Von Hagen, J and Harden, I (1996), ‘Budget Processes and Commitment to Fiscal
Discipline’, IMF Working Paper.
Von Hagen, J, Hughes-Hallett, A and Strauch, R (2001), ‘Budgetary Consolidation
in EMU’, European Economy Economic Papers, No. 148, Brussels, EuropeanCommission.
Von Hagen, J and Wolff, G (2006), ‘What Do Decits Tell Us About Debt?
Empirical Evidence on Creative Accounting With Fiscal Rules in the EU’,
Journal of Banking and Finance 30, pp 3259–79.
Weaver, R K (1986), ‘The Politics of Blame Avoidance’, Journal of Public Policy 6,
pp 371–98.
Weingast, B R, Shepsle, K A and Johnsen, C (1981), ‘The Political Economy of
Benets and Costs: A Neoclassical Approach to Distributive Politics’, Journal
of Political Economy 89(41), pp 642–64.
Wildasin, D (1997), ‘Externalities and Bail-outs: Hard and Soft Budget Constraints
in Intergovernmental Fiscal Relations’, World Bank Working Paper,
Washington DC.
Wren-Lewis, S (1996), ‘Avoiding Fiscal Fudge’, The New Economy 3, pp 128–32.
Wren-Lewis, S. (2002), ‘Fiscal Policy, Ination, and Stabilization in EMU.’ mimeo,
University of Exeter.
Wyplosz, C (2002), ‘Fiscal Discipline in EMU: Rules or Institutions?’ mimeo,
Graduate Institute for International Studies, Geneva.
Wyplosz, C (2005), ‘Fiscal Policy: Institutions versus Rules’, National Institute
Economic Review 191, January, pp 61–78.
Wyplosz, C (2008), ‘Fiscal Policy Councils: Unlovable or Just Unloved?’ Swedish
Economic Policy Review 15, pp 173–92.
Wyplosz, C (2011a), ‘Why is the Debt Crisis Spreading through the Euro Area?’,
paper presented at the Bernacer Conference, Madrid, 1 June.
Wyplosz, C (2011b), ‘Fiscal Rules’, unpublished paper, The Graduate Institute,
Geneva.
Wyplosz, C and Krogstrup, S (2010), ‘A Common Pool Theory of Supranational
Decit Ceilings’, European Economic Review 54(2), pp 269–78.
Yläoutinen, S (2004), ‘The Role of Electoral and Party Systems in the Development
of Fiscal Institutions in Central and East European Countries’, PhD dissertation,
mimeo, University of Jyväskylä.

8/3/2019 Geneva13
http://slidepdf.com/reader/full/geneva13 162/162