genome-wide association studies of anthracnose and...
TRANSCRIPT

RESEARCH ARTICLE
Genome-Wide Association Studies ofAnthracnose and Angular Leaf SpotResistance in Common Bean (Phaseolusvulgaris L.)Juliana Morini Küpper Cardoso Perseguini1,2*, Paula Rodrigues Oblessuc3, João RicardoBachega Feijó Rosa4, Kleber Alves Gomes2, Alisson Fernando Chiorato5, Sérgio AugustoMorais Carbonell5, Antonio Augusto Franco Garcia4, Rosana Pereira Vianello6, LucianaLasry Benchimol-Reis2
1 Universidade Tecnológica Federal do Paraná (UTFPR), Dois Vizinhos, Paraná, Brasil, 2 Centro deRecursos Genéticos Vegetais, Instituto Agronômico de Campinas (IAC), Campinas, São Paulo, Brazil,3 Laboratório Nacional de Biociências (LNBio), Campinas, São Paulo, Brazil, 4 Departamento de Genética,Escola Superior de Agricultura Luiz de Queiroz/Universidade de São Paulo (ESALQ/USP), Piracicaba, SãoPaulo, Brazil, 5 Centro de Grãos e Fibras, Instituto Agronômico de Campinas (IAC), Campinas, São Paulo,Brazil, 6 Empresa Brasileira de Pesquisa Agropecuária, Centro Nacional de Pesquisa de Arroz e Feijão,Goiania, Goiás, Brazil
AbstractThe common bean (Phaseolus vulgaris L.) is the world’s most important legume for human
consumption. Anthracnose (ANT; Colletotrichum lindemuthianum) and angular leaf spot
(ALS; Pseudocercospora griseola) are complex diseases that cause major yield losses in
common bean. Depending on the cultivar and environmental conditions, anthracnose and
angular leaf spot infections can reduce crop yield drastically. This study aimed to estimate
linkage disequilibrium levels and identify quantitative resistance loci (QRL) controlling resis-
tance to both ANT and ALS diseases of 180 accessions of common bean using genome-
wide association analysis. A randomized complete block design with four replicates was
performed for the ANT and ALS experiments, with four plants per genotype in each repli-
cate. Association mapping analyses were performed for ANT and ALS using a mixed linear
model approach implemented in TASSEL. A total of 17 and 11 significant statistically asso-
ciations involving SSRs were detected for ANT and ALS resistance loci, respectively. Using
SNPs, 21 and 17 significant statistically associations were obtained for ANT and angular
ALS, respectively, providing more associations with this marker. The SSR-IAC167 and
PvM95 markers, both located on chromosome Pv03, and the SNP scaffold00021_89379,
were associated with both diseases. The other markers were distributed across the entire
common bean genome, with chromosomes Pv03 and Pv08 showing the greatest number of
loci associated with ANT resistance. The chromosome Pv04 was the most saturated one,
with six markers associated with ALS resistance. The telomeric region of this chromosome
showed four markers located between approximately 2.5 Mb and 4.4 Mb. Our results dem-
onstrate the great potential of genome-wide association studies to identify QRLs related to
PLOSONE | DOI:10.1371/journal.pone.0150506 March 1, 2016 1 / 19
OPEN ACCESS
Citation: Perseguini JMKC, Oblessuc PR, RosaJRBF, Gomes KA, Chiorato AF, Carbonell SAM, et al.(2016) Genome-Wide Association Studies ofAnthracnose and Angular Leaf Spot Resistance inCommon Bean (Phaseolus vulgaris L.). PLoS ONE11(3): e0150506. doi:10.1371/journal.pone.0150506
Editor: Swarup Kumar Parida, National Institute ofPlant Genome Research (NIPGR), INDIA
Received: July 16, 2015
Accepted: February 14, 2016
Published: March 1, 2016
Copyright: © 2016 Perseguini et al. This is an openaccess article distributed under the terms of theCreative Commons Attribution License, which permitsunrestricted use, distribution, and reproduction in anymedium, provided the original author and source arecredited.
Data Availability Statement: All relevant data arewithin the paper and its Supporting Information files.
Funding: This research was supported by grantsfrom São Paulo Research Foundation (FAPESP)(process numbers 2009/05284-1 LLB-R and 2009/02502-8 - JMKCP) and CNPq (process number477239/2010-2 - LLB-R).
Competing Interests: The authors have declaredthat no competing interests exist.

ANT and ALS in common bean. The results indicate a quantitative and complex inheritance
pattern for both diseases in common bean. Our findings will contribute to more effective
screening of elite germplasm to find resistance alleles for marker-assisted selection in
breeding programs.
IntroductionCommon bean (Phaseolus vulgaris L.) is an annual legume crop with a relatively small genomeof 473 Mb [1]. It is the most important grain legume for direct human consumption [2,3]. Drybeans provide a major source of quality protein, which is high in lysine and therefore comple-ments most cereals. In addition, beans are high in carbohydrates, fiber, and minerals (calcium,potassium, phosphorus iron, zinc and magnesium) [4].
Anthracnose (ANT) and Angular Leaf Spot (ALS) are two important diseases that have thegreatest impact on crop yield reduction. Yield losses caused by the ANT pathogen areextremely high in common bean, reaching up to 100% [5]. Anthracnose is caused by the spe-cialized hemibiotrophic fungus Colletotrichum lindemuthianum (Sacc. and Magnus), whichco-evolved with common bean into Andean and Mesoamerican races [6,7]. ALS leads to croplosses of up to 80% and is found in more than 60 countries worldwide [8,9]. This disease iscaused by the hemibiotrophic fungus Pseudocercospora griseola (Sacc.) Crous & Braun (sin.Phaeoisariopsis griseola (Sacc.) Ferraris) [10], and can be identified by angular necrotic spotson plant leaves and pods [11].
Bi-parental populations used for QRL mapping accumulate a limited number of recombina-tion events, typically leading to low mapping resolution or poor estimation of marker effects[12,13]. In this case, recombination has not had sufficient time to shuffle the genome intosmall fragments, and quantitative trait loci (QTL) are generally localized to large chromosomalregions of 10 to 20 centiMorgan [14].
Genome-wide association studies (GWAS) or association mapping (AM) and linkage dis-equilibrium (LD) offer high resolution through historical recombination accumulated in natu-ral populations and collections of landraces, breeding materials, and varieties [15]. Byexploiting broader genetic diversity, GWAS offers several advantages over linkage mapping,such as mapping resolution, allele number, time saved in establishing marker-trait associations,and application in breeding programs [16]. The strength of the correlation between two mark-ers is a function of the distance between them: the closer two markers are, the stronger the LD.The resolution with which a QRL can be mapped is a function of how quickly LD decays overdistance. Selfing reduces opportunities for recombination; thus, in self-pollinating species suchas rice (Oryza Sativa), LD may extend to 100 Kb or more [17]. In general, high LD is expectedbetween tightly linked loci, since the mutation should have eliminated LD between loci that arenot in close proximity to one another [18,19]. In common bean, little information is availableon the extent of LD [20,21,22].
The Common Bean Germplasm Bank of the Agronomic Institute (IAC, Campinas, S.P. Bra-zil) holds more than 1800 accessions representing the two principal centers of origin (Andeanand Mesoamerican) of the species as well as ecotypes from different South American countriesand a large number of lines from both Brazilian and international genetic breeding programs,most of which were obtained by germplasm interchange [23]. Some factors should be consid-ered for the improvement association mapping, one of which is the selection of a group of indi-viduals from the original germplasm collection with coverage of a high level of genetic diversity
Genome-Wide Association Studies of Anthracnose and Angular Leaf Spot
PLOS ONE | DOI:10.1371/journal.pone.0150506 March 1, 2016 2 / 19

[24]. In a previous study [25], evaluated the diversity level and genetic organization presentamong 500 accessions from the Common Bean Germplasm Bank of the IAC and selected 180accessions that represented the variability of the entire collection in order to use this panel forassociation mapping studies.
Some points in association mapping there are to consider: (1) selection of a germplasm col-lection with high level of genetic diversity; (2) recording or measuring the phenotypic charac-teristics of the selected population groups; (3) genotyping the individuals with availablemolecular markers; (4) quantification of the LD extent of the genome of a chosen populationusing molecular markers; (5) assessment of the level of genetic differentiation among groupswithin the sampled individuals and the coefficient of relatedness between pairs of individualswithin a sample; and (6) taking the information gained through the quantification of LD andpopulation structure into account for the correlation of phenotypic and genotypic/haplotypicdata with the application of an appropriate statistical approach that reveals “marker tags” posi-tioned within close proximity of the targeted trait of interest [26].
Several groups have performed AM studies for common bean [27,28,29], but none havefocused on ANT and ALS resistance. Based on several linkage analysis studies, we havereported previously important resistance candidate genes in common bean [30,31,32,33].However, to complement our initial findings and further understand the ANT and ALS plantdisease interactions in common bean, the aims of this study were to (i) estimate the linkage dis-equilibrium (LD) in common bean; and (ii) identify QRLs associated with resistance to ANTand ALS using SSR and SNP data.
Materials and Methods
Plant material and DNA extractionOne hundred and eighty accessions previously identified and evaluated [25] from the commonbean germplasm bank of the Agronomic Institute (IAC, Campinas, São Paulo, Brazil) wereused in this work, with 24 genotypes are of Andean origin and 156 are of Mesoamerican origin.These genotypes displayed variance in many agronomic traits related to resistance to majorcommon bean diseases (anthracnose, angular leaf spot, rust, fusarium wilt, bacterial blight, andgold mosaic virus), drought tolerance, as well as differences in grain size and tegument color.In summary, among the 180 accessions [25], 75 were chosen due to their great economicimportance to the Brazilian common bean breeding program, as they include commercial vari-eties with carioca tegument, widely cultivated in at the state of São Paulo (Brazil), under theleadership of the Agronomic Institute (IAC). Total genomic DNA (gDNA) was extracted fromlyophilized young leaf tissues using the CTAB method.
Simple sequence repeat (SSR) marker analysisA total of 103 microsatellites (SSRs) were amplified. From these, 45 were EST-SSRs (EST—Expressed sequence tag) [34], while the others were genomic-SSRs [35]. Polymerase chainreaction (PCR) amplifications were performed in a 25 μL final volume containing 50 ng DNAtemplate, 1× buffer, 0.2 μM forward primer, 0.2 μM reverse primer, 100 μM dNTP, 2.0 mMMgCl2, 10 mM Tris-HCl (pH 8,0), 50 mM KCl, and 0.5 U of TaqDNA polymerase. The follow-ing conditions were used for amplification: 1 min at 94°C, 30 cycles of 1 min at 94°C, 1 min atthe specific annealing temperature for each SSR, and 1 min at 72°C, with a final extension of 5min at 72°C. The PCR products were checked on a 3% agarose gel and separated using 6% sil-ver-stained polyacrylamide.
Allele sizes were scored in base pairs (bp) by visual comparison with a 10-bp DNA ladder(Invitrogen), and the value was converted to gene and genotypic frequencies. After the binary
Genome-Wide Association Studies of Anthracnose and Angular Leaf Spot
PLOS ONE | DOI:10.1371/journal.pone.0150506 March 1, 2016 3 / 19

allele scoring (1 or 0) was completed, genotyping was performed using the allele number indecreasing order; that is, alleles with greater size received the highest numbers. In the case ofdiploids such as common bean, homozygous bands with heterozygous genotypes were scoredtwice.
Single-nucleotide polymorphism (SNP) marker analysisSNP genotyping was conducted using the technology Vera Code1 BeadXpress platform (Illu-mina) at the Biotechnology Laboratory of Embrapa (Goiania, GO, Brazil). A set of 384 SNPmarkers, validated by a previously identified Prelim file (https://icom.illumina.com/Custom/UploadOpaPrelim/) for Phaseolus vulgaris [36], a derivative of polymorphisms between strainsBAT477 and Pérola of Mesoamerican origins, was selected to compose the Oligo Pool Assay(OPA) SNP marker panel. Three oligonucleotides were used for each of the variants of thesame SNP and the third specific-locus binding to the 30 region of the DNA fragment containingthe target SNP, generating a unique allele-specific fragment. Subsequently, this fragment wasamplified using Taq DNA polymerase enzyme Titanium (Clontech1) and complementaryprimers labeled with Cy3 and Cy5 fluorophores. Genotyping was performed using GenomeStudio software version 1.8.4 (Illumina, EUA) using Call Rate values ranging from 0.80 to 0.90and GenTrain� 0.26 for SNP grouping. Automated analyses were performed to cluster theSNP alleles of each line, based on signal intensities of Cy3 and Cy5 fluorophores. Groups wereadjusted manually by determining the best clusters based on parental profiles.
Linkage disequilibrium (LD) analysisFisher’s exact tests [37] were performed for each possible pair of markers from the 103 SSRs.To avoid false positives due to multiple tests (i.e., markers in linkage equilibrium or non-causa-tive associations), Bonferroni [38] and False Discovery Rate (FDR) [39] corrections wereapplied. FDR was applied in addition to Bonferroni because the latter is a very conservativemethod for type I error control. Furthermore, to determine the suitable marker density resolu-tion for association mapping, we also analyzed the extent of LD against the genetic distanceconsidering only Fisher’s exact test results between the mapped and linked SSRs, based on twopreviously published genetic linkage maps for common bean [35,40]. All the analyses were per-formed using R software (R Development Core Team 2014).
For 384 SNPs, pairwise tests for LD levels were performed using r2 [41], which was pro-posed in the context of biallelic loci. Initially, LD was estimated for each chromosome sepa-rately, and then a heat map for each one was generated to view LD patterns. Subsequently, theLD obtained for all associations involving linked SNPs from the different common bean chro-mosomes was plotted against the genetic distance. With these associations, it was possible toadjust a non-linear model for LD decay. All the analyses were performed using the packagesynbreed [42] available in R software (R Development Core Team 2014).
Phenotypic analyses of anthracnose and angular leaf spotFor the ANT phenotype the seeds of 180 common bean accessions were germinated on germi-nation paper in a growth chamber at 25°C with a 12-hours photoperiod for 3 days. Four seed-lings per accession were transplanted to boxes containing autoclaved vermiculite (Plantmax1)as substrate, constituting an experimental plot. Four different accessions were grown per box.The experimental design was carried out in randomized complete blocks with four replicates.Plants were inoculated 7 days after transplanting, where each experiment consisted in a singlerace of C. lindemuthianum inoculation (race 04). The experimental design was carried out inrandomized complete blocks with four replicates.
Genome-Wide Association Studies of Anthracnose and Angular Leaf Spot
PLOS ONE | DOI:10.1371/journal.pone.0150506 March 1, 2016 4 / 19
Monosporic cultures of C. lindemuthianum were grown on PDA media (200 g L–1 potato,30 g L–1 dextrose and 30 g L–1 agar), and conidia were collected in water suspension using aglass spreader. Plants were sprayed with spore suspension (106 spores mL–1) using a DeVilBissapparatus (Fanem). Immediately after inoculation, plants were kept for 48 hours under 95–100% relative humidity at 23°C and a 12-hour photoperiod. Disease severity was evaluated 7 to10 days post-inoculation using a diagrammatic scale proposed by Pastor-Corrales et al., inwhich 1–3 denotes resistant, 4–6 intermediate, and 7–9 susceptible [6].
For the ALS phenotype the seeds were sown in plastic boxes (29.5 cm × 46.5 cm × 12.5 cm)containing Dystrophic Red Latosol type soil, fertilized with NPK 04-14-08 (400 kg/ha), eachwith four accessions sown in rows at a distance of approximately 4 cm, containing four plantsper row. The experimental design was carried out in randomized complete blocks with fourreplicates. Plants were inoculated when they reached the V3 development stage (first expandedtrifoliate), 2 to 3 weeks after planting, by spraying both leaf surfaces with a 104 conidia/mL sus-pension prepared from P. griseolamonosporic colonies grown in V8 medium [43]. The isolateused (14259–2) was classified into the 0–39 race based on the response of the differential culti-vars according to Pastor-Corrales et al. [6].
After inoculation, the accessions were held for 48 hours at a temperature between 22°C to24°C, relative humidity between 95–100%, and a photoperiod of 12 hours [43]. After thisperiod, plants were transferred to the greenhouse. The evaluation of severity was made 17 daysafter inoculation.
The race 04 of C. lindemuthianum was used in this study because it previously detectedANT QTLs in greenhouse conditions [32], and the race 0–39 of P. griseola was also previouslyassociated to ALS QTLs [30,31].
The phenotypic data obtained for each disease (ANT and ALS), based on the 9-point scaleof severity, were analyzed according to the following statistical model:
Yijk ¼ mþ bi þ gj þ rkðijÞ þ εij:
where yijk corresponds to the level of ANT or ALS severity; μ μis the general average; bi is thefixed effect of the block i; gj is the random effect associated with accession j; rk(ij) is the randomeffect associated with the replicate k nested within genotype j and block i; and εij is the randomresidual term. The analyses were performed using the nlme package, available in R software (RDevelopment Core Team 2014).
The presence of heterogeneous genetic variances and genetic covariances and correlationsbetween the observations were investigated in the phenotypic analyses. We tested differentmixed models for the genetic-effects matrix considering the interaction between the genotypesand the blocks or replicates, using the Akaike information criterion (AIC) [44] and Bayesianinformation criterion (BIC) [45] to compare and select the best models. The predicted meansof the genotypes were obtained from the most likely models for ANT and ALS and used forassociation mapping analyses.
Genomemapping and functional annotationMolecular markers associated with ANT and ALS resistance were aligned to the common beangenome [1] using the native nucleotide basic local alignment search tool (BLASTn) and defaultalgorithm parameters (threshold E-value< 1 × 10⁻¹⁰) from Phytozome version 1.0 (http://www.phytozome.net/). Putative candidate genes involved in the resistance of common bean tothese diseases were identified from the genome localization of the markers. GO annotations forputative functions of the genes were obtained by comparison to GeneOntology (GO, http://www.geneontology.org/) using Blast2GO program [46]. The annotations were separated for
Genome-Wide Association Studies of Anthracnose and Angular Leaf Spot
PLOS ONE | DOI:10.1371/journal.pone.0150506 March 1, 2016 5 / 19
each marker and the corresponding disease. The KEGG pathway annotations were obtained byaligning sequences to the KEGG database comparing to the protein sequences of Kyoto Ency-clopedia of Genes and Genomes (KEGG, http://www.genome.jp/) [47]. To predict gene struc-ture and marker locations into the gene, these markers were alignedwith phytozome annotatedgenomic sequence (http://www.phytozome.net/).
Association mapping analysesMarker’s sequences available on NCBI (http://www.ncbi.nlm.nih.gov/) or PhaseolusGenes(http://phaseolusgenes.bioinformatics.ucdavis.edu/) databases were used to localize the SSRsand SNPs in the P. vulgaris chromosomes using the native Phytozome’s BLAST and defaultalgorithm parameters (http://www.phytozome.net/). The criteria used to assign putative chro-mosomes to the markers included E-values� 1 × 10⁻¹⁵ and a minimum identity of 70%between query and database sequences.
Association mapping analyses were carried out using TASSEL version 2.01 software forSSRs and TASSEL version 5.0 for SNPs (http://www.maizegenetics.net/index.php?option=com_content&task=view&id=89&Itemid=119).
Mixed linear model (MLM) analyses were performed considering the estimated kinshipmatrix (K), calculated using SPAGeDi software [48], as random effects and the populationstructure matrix (Q), previously inferred by STRUCTURE software [49] in Perseguini et al.using SSRs, as part of the fixed effects [25]. The population structure consisted of a Q matrixthat describes the percent subpopulation parentage for each line in the analysis. Clusterprobabilities of K = 4 for SSRs and K = 3 for SNPs (results not shown) were used for theanalyses.
Results
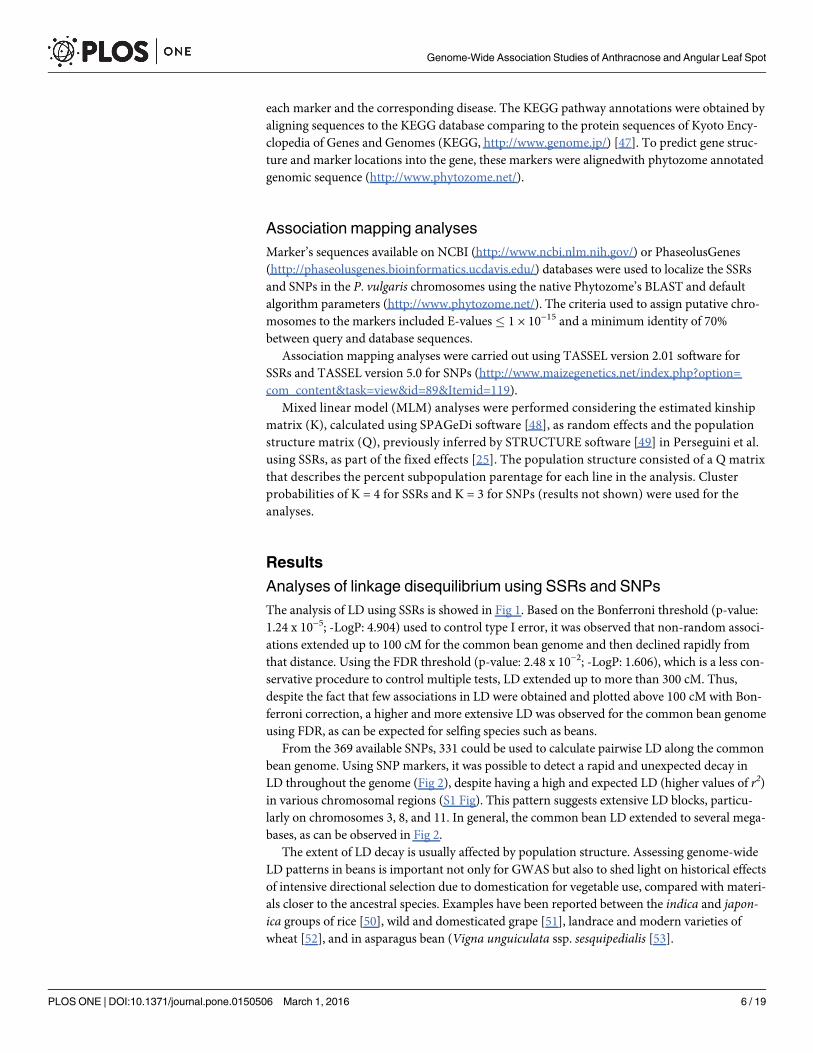
Analyses of linkage disequilibrium using SSRs and SNPsThe analysis of LD using SSRs is showed in Fig 1. Based on the Bonferroni threshold (p-value:1.24 x 10⁻⁵; -LogP: 4.904) used to control type I error, it was observed that non-random associ-ations extended up to 100 cM for the common bean genome and then declined rapidly fromthat distance. Using the FDR threshold (p-value: 2.48 x 10⁻²; -LogP: 1.606), which is a less con-servative procedure to control multiple tests, LD extended up to more than 300 cM. Thus,despite the fact that few associations in LD were obtained and plotted above 100 cM with Bon-ferroni correction, a higher and more extensive LD was observed for the common bean genomeusing FDR, as can be expected for selfing species such as beans.
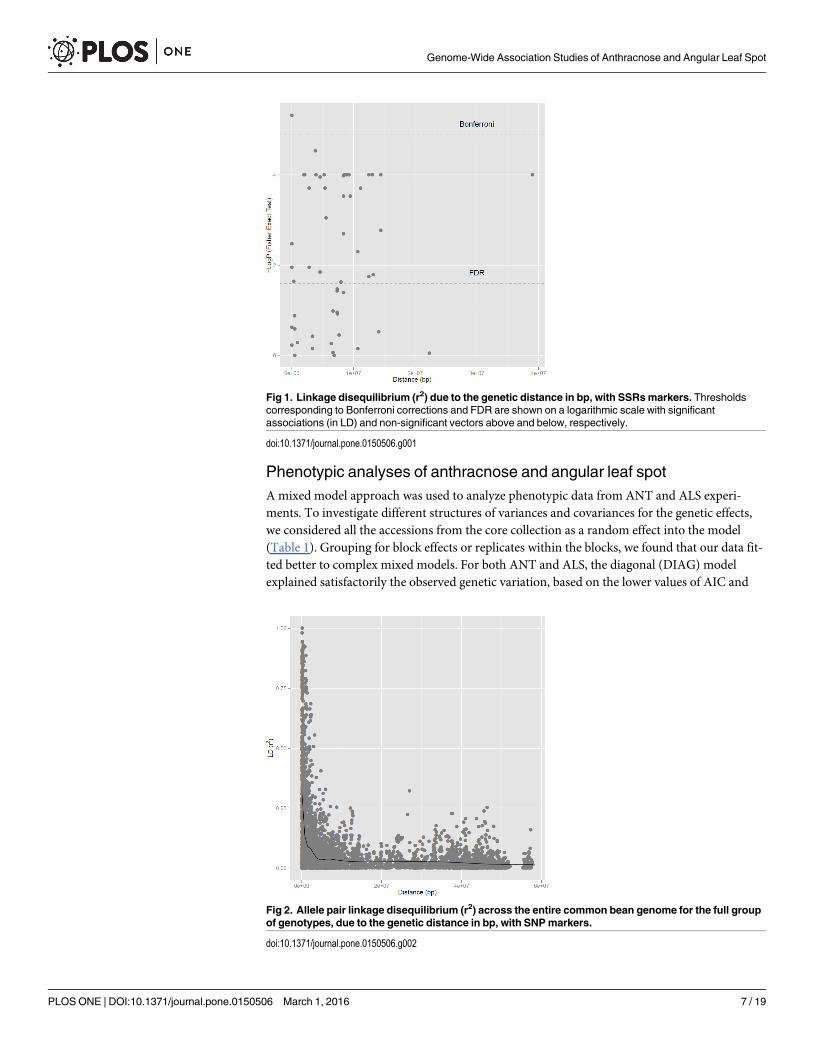
From the 369 available SNPs, 331 could be used to calculate pairwise LD along the commonbean genome. Using SNP markers, it was possible to detect a rapid and unexpected decay inLD throughout the genome (Fig 2), despite having a high and expected LD (higher values of r2)in various chromosomal regions (S1 Fig). This pattern suggests extensive LD blocks, particu-larly on chromosomes 3, 8, and 11. In general, the common bean LD extended to several mega-bases, as can be observed in Fig 2.
The extent of LD decay is usually affected by population structure. Assessing genome-wideLD patterns in beans is important not only for GWAS but also to shed light on historical effectsof intensive directional selection due to domestication for vegetable use, compared with materi-als closer to the ancestral species. Examples have been reported between the indica and japon-ica groups of rice [50], wild and domesticated grape [51], landrace and modern varieties ofwheat [52], and in asparagus bean (Vigna unguiculata ssp. sesquipedialis [53].
Genome-Wide Association Studies of Anthracnose and Angular Leaf Spot
PLOS ONE | DOI:10.1371/journal.pone.0150506 March 1, 2016 6 / 19
Phenotypic analyses of anthracnose and angular leaf spotAmixed model approach was used to analyze phenotypic data from ANT and ALS experi-ments. To investigate different structures of variances and covariances for the genetic effects,we considered all the accessions from the core collection as a random effect into the model(Table 1). Grouping for block effects or replicates within the blocks, we found that our data fit-ted better to complex mixed models. For both ANT and ALS, the diagonal (DIAG) modelexplained satisfactorily the observed genetic variation, based on the lower values of AIC and
Fig 1. Linkage disequilibrium (r2) due to the genetic distance in bp, with SSRsmarkers. Thresholdscorresponding to Bonferroni corrections and FDR are shown on a logarithmic scale with significantassociations (in LD) and non-significant vectors above and below, respectively.
doi:10.1371/journal.pone.0150506.g001
Fig 2. Allele pair linkage disequilibrium (r2) across the entire common bean genome for the full groupof genotypes, due to the genetic distance in bp, with SNPmarkers.
doi:10.1371/journal.pone.0150506.g002
Genome-Wide Association Studies of Anthracnose and Angular Leaf Spot
PLOS ONE | DOI:10.1371/journal.pone.0150506 March 1, 2016 7 / 19

BIC criteria. This model considers the presence of heterogeneous genetic variances and absenceof genetic covariances and correlations between observations for each level of the accessions.
Association mapping using SSRs and SNPsOf the 103 SSRs used in this study, 17 (16.5%) were associated with ANT (race 4) disease, ofwhich three, PvM153 (Pv02), SSR-IAC254 (Pv08), and PvM98 (Pv11), were the most signifi-cant (P� 0.001; Table 2). Statistically significant associations involving SSRs were observed forANT in seven out of eleven chromosomes of the common bean (Table 2). For SNP markers, atotal of 21 markers (6.3%) were associated with ANT disease (Table 2; S2 Fig). The SNP scaf-fold00024_916410 (Pv01), scaffold00060_874577 (Pv04), scaffold00021_89379 (Pv07), andsacaffold00034_860044 (Pv08) showed significant (P� 0.001) associations with the trait. TheSNP scaffold00021_89379 showed the most significant association to ANT, explaining 10.7%of the phenotypic variation (Table 2).
A total of 11 SSRs (10.6%; Table 3) were associated with ALS (race 0–39) disease, of whichtwo, PvM97 (Pv01) and PvM62 (Pv05), were the most significant (P� 0.01; Table 3). A total of17 associations (5.1%) involving SNPs were associated with ALS disease (Table 3; S2 Fig), andthe SNP scaffold00019_566327 (Pv11) showed the highest significance (P� 0.01). The markerSSR-IAC66 (Pv04) was most significantly associated with ALS, explaining 16.66% of the phe-notypic variation (Table 3).
The markers SSR-IAC167 and PvM95, both located on chromosome Pv03, and the SNPscaffold00021_89379, were associated with both diseases, suggesting a possible pleiotropiceffect.
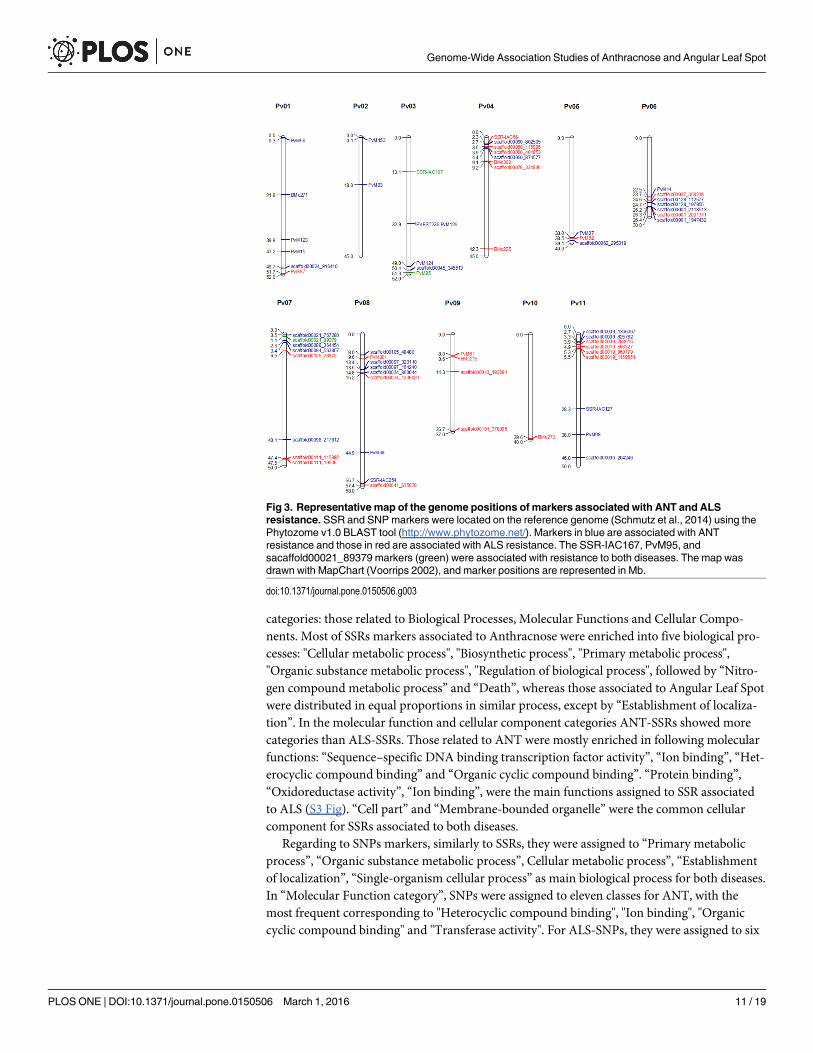
SSRs, SNPs, and genes associated with anthracnose and angular leafspot resistanceThe SSR and SNP markers found to be associated with both ANT (Table 2) and ALS (Table 3)resistance were physically located on the recently released common bean genome sequence [1].All 64 markers were mapped to within a certain region on the common bean genome (E-value�4 x 10−50). In general, the markers were distributed across the entire common bean genome,with chromosomes Pv03 and Pv08 showing the greatest number of loci associated with ANTresistance. The chromosome Pv04 was the most saturated one, with six markers associated to
Table 1. Different structures of variances and covariances for the genetic-effects matrix related to the blocks (GBlock) and replicates within thegenotypes and blocks (GRep). Blocks and replicates are both used as grouping factor for each level of the random genotypes.
Matrix Model Parameter Number ALS ANT
AIC BIC AIC BIC
G¼GBlock ID 18 7,487.418 7,585.160 10,585.690 10,688.410
DIAG 21 7,475.074 7,589.106 10,335.400 10,455.230
CS 19 7,488.833 7,592.005 10,445.970 10,554.380
UNST 27 NC NC NC NC
G¼GRep ID 18 7,474.923 7,572.665 10,331.630 10,434.340
DIAG 34 7,318.306 7,502.930 10,313.830 NC
CS 19 7,476.923 7,580.096 10,331.400 10,439.810
UNST – NC NC NC NC
G: random genetic-effects matrix; ID: Identity; DIAG: Diagonal; CS: Compound Symmetry; UNST: Unstructured; NC: No Convergence. The selected
model for both ALS and ANT diseases is indicated by the value in bold, which correspond to AIC and BIC criteria for the first and only AIC for the latter.
doi:10.1371/journal.pone.0150506.t001
Genome-Wide Association Studies of Anthracnose and Angular Leaf Spot
PLOS ONE | DOI:10.1371/journal.pone.0150506 March 1, 2016 8 / 19

ALS resistance (Tables 2 and 3). The telomeric region of this chromosome showed four mark-ers located between approximately 2.5 Mb and 4.4 Mb (Fig 3).
Taking into account both ALS and ANT, chromosomes Pv03 and Pv11 portrayed the largernumber of loci (nine) involved in the immune response to both diseases (Fig 3; S1 and S2Tables). Telomeres also appeared to be enriched for disease-associated loci in chromosomes
Table 2. Associations between SSR and SNPmarker loci and Anthracnose (race 4) severity determined by unified mixed linear models (MLM).
Marker Chromosome (Pv) p- valuea R2_ markerb R2_ marker (%)
PvM56 1 0.0101* 0.0359 3.59
PvM123 1 0.0235* 0.0244 2.44
PvM15 1 0.0042** 0.0539 5.39
BMc271 1 0.0367* 0.0236 2.36
scaffold00024_916410 1 0.00076488*** 0.07697 7.697
PvM93 2 0.0163* 0.0435 4.35
PvM153 2 0.000040712*** 0.0877 8.77
PvM126 3 0.002** 0.0661 6.61
SSR-IAC167 3 0.0084** 0.047 4.7
PvM95 3 0.0195* 0.0283 2.83
PvM124 3 0.0482* 0.0209 2.09
PVEST236 3 0.0366* 0.0544 5.44
scaffold00045_345513 3 0.00114** 0.09041 9.041
scaffold00060_874577 4 0.00052705*** 0.08115 8.115
scaffold00090_802505 4 0.00121** 0.08733 8.733
PvM07 5 0.031* 0.0502 5.02
scaffold00062_295319 5 0.04492* 0.04494 4.494
PvM14 6 0.0271* 0.0446 4.46
scaffold00001_1947432 6 0.04529* 0.03401 3.401
scaffold00128_112577 6 0.03906* 0.03603 3.603
scaffold00128_197955 6 0.0043** 0.07229 7.229
scaffold00001_2118513 6 0.04286* 0.04503 4.503
scaffold00021_89379 7 0.00058202*** 0.10781 10.781
scaffold00088_364454 7 0.01903* 0.05802 5.802
scaffold00021_767280 7 0.03442* 0.03785 3.785
scaffold00094_563857 7 0.01938* 0.04311 4.311
scaffold00098_217812 7 0.0138* 0.03323 3.323
SSR-IAC254 8 0.00097355*** 0.0564 5.64
PvM68 8 0.0247* 0.0153 1.53
scaffold00105_48480 8 0.04527* 0.03448 3.448
scaffold00034_860044 8 0.00043065*** 0.09668 9.668
scaffold00097_323110 8 0.03266* 0.03752 3.752
scaffold00097_164240 8 0.03657* 0.03631 3.631
PvM98 11 0.00078543*** 0.066 6.6
SSR-IAC127 11 0.019* 0.0269 2.69
scaffold00009_1366067 11 0.02796* 0.04973 4.973
scaffold00009_825782 11 0.01282* 0.04752 4.752
scaffold00096_204246 11 0.04505* 0.04573 4.573
a *, p � 0.05; ** p � 0.01; *** p � 0.001.b R2_ marker = The fraction of the total variation explained by the marker after fitting the other model effects.
doi:10.1371/journal.pone.0150506.t002
Genome-Wide Association Studies of Anthracnose and Angular Leaf Spot
PLOS ONE | DOI:10.1371/journal.pone.0150506 March 1, 2016 9 / 19

Pv06 (22.5 Mb to 26.4 Mb; seven markers), Pv07 (0.5 Mb to 3.4 Mb; four markers), and Pv11(2.7 Mb to 5.5 Mb; six markers) (Fig 3).
The predicted candidate gene locations in the genome for each marker were identified usingthe reference common bean genome sequence [1]. A total of five markers were mapped oncommon bean genome regions with no expressed genes, based on the Phytozome RNA-seqand EST database [1]. In total, 57 genes were identified. Different functions could be assignedto the genes where the markers were located, including five involved with transcription factors,12 of unknown functions, four kinases, and one with malectin-tyrosine kinase (S1 and S2Tables).
Gene Ontology (GO) enrichment analysis was performed for all candidate genes to investi-gate whether the loci associated with ANT and ALS resistance corresponded to genes involvedin known pathways. GO accessions, allowed them to be grouped into three functional
Table 3. Associations between SSR and SNPmarker loci and angular leaf spot (race 0–39) severity determined by unified mixed linear models(MLM).
Marker Chromosome (Pv) p- valuea R2_ markerb R2_ marker (%)
PvM97 1 0.0041** 0.0407 4.07
SSR-IAC167 3 0.0296* 0.041 4.10
PvM95 3 0.0228* 0.0276 2,76
BMc215 3 0.0447* 0.0218 2.18
SSR-IAC66 4 0.0198* 0.1666 16.66
BMc300 4 0.0169* 0.0327 3.27
BMc225 4 0.0173* 0.0661 6.61
scaffold00060_115096 4 0.0383* 0.03826 3.826
scaffold00060_401853 4 0.04706* 0.04779 4.779
scaffold00076_331846 4 0.04686* 0.02331 2.331
PvM62 5 0.0086** 0.0387 3.87
scaffold00037_358238 6 0.02852* 0.0536 5.36
scaffold00001_2031371 6 0.04272* 0.03811 3.811
scaffold00021_89379 7 0.04195* 0.05666 5.666
scaffold00111_115892 7 0.01048* 0.05333 5.333
scaffold00126_28972 7 0.0329* 0.04073 4.073
scaffold00111_19536 7 0.03029* 0.02764 2.764
PvM01 8 0.0219* 0.115 11.5
scaffold00034_1236020 8 0.02152* 0.04523 4.523
scaffold00041_635678 8 0.04989* 0.04717 4.717
PvM61 9 0.0121* 0.0356 3.56
scaffold00043_193294 9 0.03672* 0.05087 5.087
scaffold00101_378095 9 0.04128* 0.03813 3.813
BMc273 10 0.0197* 0.06 6.00
scaffold00019_1159551 11 0.04345* 0.03716 3.716
scaffold00019_566327 11 0.00194** 0.08497 8.497
scaffold00019_960179 11 0.01919* 0.05845 5.845
scaffold00009_208616 11 0.02388* 0.05398 5.398
a *, p � 0.05
** p � 0.01
***p � 0.001.b R2_ marker = The fraction of the total variation explained by the marker after fitting the other model effects.
doi:10.1371/journal.pone.0150506.t003
Genome-Wide Association Studies of Anthracnose and Angular Leaf Spot
PLOS ONE | DOI:10.1371/journal.pone.0150506 March 1, 2016 10 / 19
categories: those related to Biological Processes, Molecular Functions and Cellular Compo-nents. Most of SSRs markers associated to Anthracnose were enriched into five biological pro-cesses: "Cellular metabolic process", "Biosynthetic process", "Primary metabolic process","Organic substance metabolic process", "Regulation of biological process", followed by “Nitro-gen compound metabolic process” and “Death”, whereas those associated to Angular Leaf Spotwere distributed in equal proportions in similar process, except by “Establishment of localiza-tion”. In the molecular function and cellular component categories ANT-SSRs showed morecategories than ALS-SSRs. Those related to ANT were mostly enriched in following molecularfunctions: “Sequence–specific DNA binding transcription factor activity”, “Ion binding”, “Het-erocyclic compound binding” and “Organic cyclic compound binding”. “Protein binding”,“Oxidoreductase activity”, “Ion binding”, were the main functions assigned to SSR associatedto ALS (S3 Fig). “Cell part” and “Membrane-bounded organelle” were the common cellularcomponent for SSRs associated to both diseases.
Regarding to SNPs markers, similarly to SSRs, they were assigned to “Primary metabolicprocess”, “Organic substance metabolic process”, Cellular metabolic process”, “Establishmentof localization”, “Single-organism cellular process” as main biological process for both diseases.In “Molecular Function category”, SNPs were assigned to eleven classes for ANT, with themost frequent corresponding to "Heterocyclic compound binding", "Ion binding", "Organiccyclic compound binding" and "Transferase activity". For ALS-SNPs, they were assigned to six
Fig 3. Representative map of the genome positions of markers associated with ANT and ALSresistance. SSR and SNPmarkers were located on the reference genome (Schmutz et al., 2014) using thePhytozome v1.0 BLAST tool (http://www.phytozome.net/). Markers in blue are associated with ANTresistance and those in red are associated with ALS resistance. The SSR-IAC167, PvM95, andsacaffold00021_89379 markers (green) were associated with resistance to both diseases. The map wasdrawn with MapChart (Voorrips 2002), and marker positions are represented in Mb.
doi:10.1371/journal.pone.0150506.g003
Genome-Wide Association Studies of Anthracnose and Angular Leaf Spot
PLOS ONE | DOI:10.1371/journal.pone.0150506 March 1, 2016 11 / 19
classes, highlighting "Hydrolase activity”. It is interesting to note that only ANT-SNPs wereassigned to “Cellular Component”, such as “Membrane part” and “Cell part” and no “Cell com-ponent” was found related to ALS-SNPs. In addition, markers linked to genes involved in bio-logical process such as “methylation”, “biosynthetic process” and “programed cell death” areinteresting to consider because they it may be involved in roles of stress response (S3 Fig).
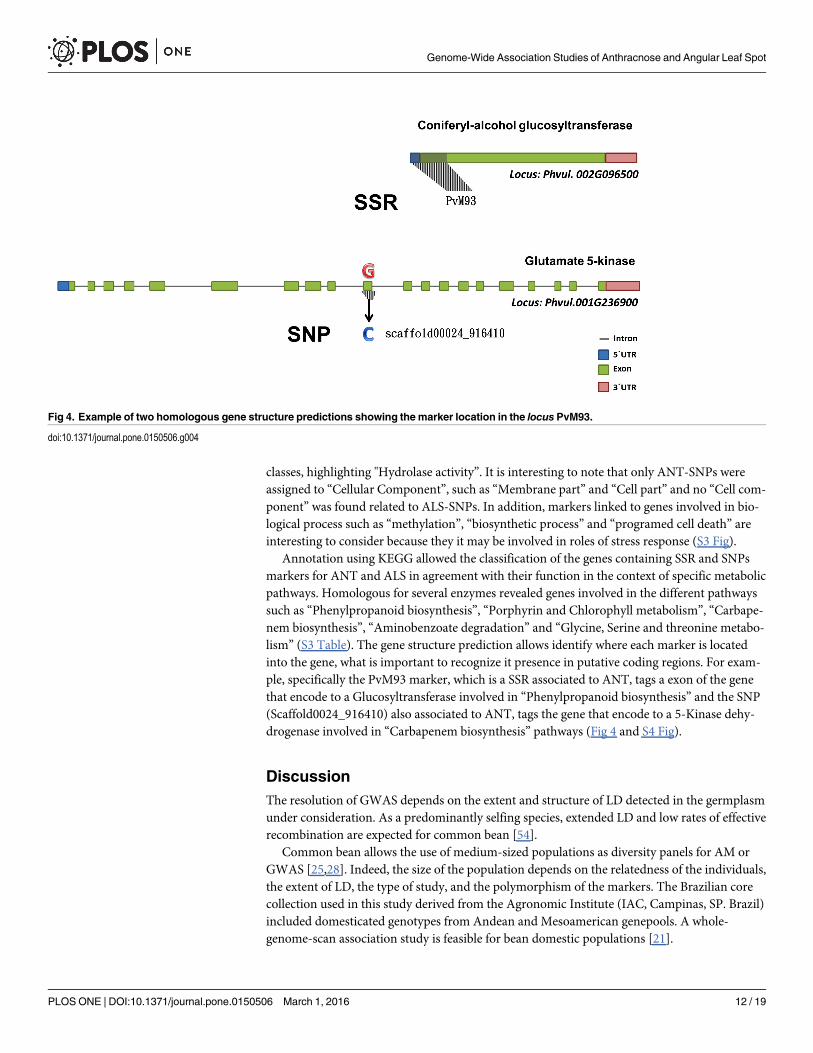
Annotation using KEGG allowed the classification of the genes containing SSR and SNPsmarkers for ANT and ALS in agreement with their function in the context of specific metabolicpathways. Homologous for several enzymes revealed genes involved in the different pathwayssuch as “Phenylpropanoid biosynthesis”, “Porphyrin and Chlorophyll metabolism”, “Carbape-nem biosynthesis”, “Aminobenzoate degradation” and “Glycine, Serine and threonine metabo-lism” (S3 Table). The gene structure prediction allows identify where each marker is locatedinto the gene, what is important to recognize it presence in putative coding regions. For exam-ple, specifically the PvM93 marker, which is a SSR associated to ANT, tags a exon of the genethat encode to a Glucosyltransferase involved in “Phenylpropanoid biosynthesis” and the SNP(Scaffold0024_916410) also associated to ANT, tags the gene that encode to a 5-Kinase dehy-drogenase involved in “Carbapenem biosynthesis” pathways (Fig 4 and S4 Fig).
DiscussionThe resolution of GWAS depends on the extent and structure of LD detected in the germplasmunder consideration. As a predominantly selfing species, extended LD and low rates of effectiverecombination are expected for common bean [54].
Common bean allows the use of medium-sized populations as diversity panels for AM orGWAS [25,28]. Indeed, the size of the population depends on the relatedness of the individuals,the extent of LD, the type of study, and the polymorphism of the markers. The Brazilian corecollection used in this study derived from the Agronomic Institute (IAC, Campinas, SP. Brazil)included domesticated genotypes from Andean and Mesoamerican genepools. A whole-genome-scan association study is feasible for bean domestic populations [21].
Fig 4. Example of two homologous gene structure predictions showing the marker location in the locus PvM93.
doi:10.1371/journal.pone.0150506.g004
Genome-Wide Association Studies of Anthracnose and Angular Leaf Spot
PLOS ONE | DOI:10.1371/journal.pone.0150506 March 1, 2016 12 / 19
Population mating systems could have a strong influence on LD patterns in the commonbean. Generally, there is a lower decline of LD in selfing species compared to out-breeding spe-cies [55], which could be partially explained by the reduced recombination events or selectioneffects in selfing species [16]. In this sense, LD tends to remain over tens to hundreds of kilo-bases in predominantly selfing species, such as rice, soybean, or common bean, showing thatpopulation mating could explain the high proportions of LD we detected. Therefore, the largeextent of LD observed in this study with SSRs is in accordance with what has been previouslyreported for the common bean [20,21,22].
The rapid LD decay obtained with SNP markers was not expected. This could be attributedto the fact that these SNPs were developed from sequences that are related to water stress [36]and located within specific regions that are not randomly distributed across the bean genome.
Although LD is generally high in common bean breeding lines, there are some regionswhere the LD is much reduced, highlighting the importance of estimating LD in the core col-lection of distributed loci throughout the genome [26].
GWAS is an important tool for gene tagging in crops both for simple traits under additivegenetic scenarios, as well as for the dissection of more complex genetic architectures. Theadvantage of GWAS for QRL discovery over traditional QRL-mapping in biparental crosses isprimarily due to (1) the availability of broader genetic variations with wider background formarker-trait correlations (i.e., many alleles evaluated simultaneously), (2) the likelihood ofhigher resolution mapping because of the utilization of the majority of recombination eventsfrom a large number of meioses throughout the germplasm development history, (3) the possi-bility of exploiting historically measured trait data for associations, and (4) no need for thedevelopment of expensive and biparental populations that makes this approach time-savingand cost-effective [26].
According to Ferreira et al., in 2013 20 resistance genes (named Co) that condition specificisolates or races of ANT pathogenic on common bean were reported to date [56]. The authorsrelated that the resistance of ANT has been mapped to seven of 11 common bean chromo-somes (Pv01; Pv02; Pv03; Pv04; Pv07; Pv08 and Pv11). Recently, Campa et al. in 2014 foundnew locations for the ANT resistance gene in Pv09 [57].
Most identified ANT resistance genes have been located in the genetic map of common bean:genes Co-1, Co-x, and Co-w were mapped to chromosome Pv01 [58,59,60]; Co-u was located toPv02 [58]; Co-13 to Pv03 [61]; Co-2 to Pv11 [62]; Co-3, Co-9, Co-y, Co-z, and Co-10 to Pv04[59,63,64,65,66,67]; Co-4 to Pv08 [59]; and Co-5, Co-6, and Co-v to Pv07 [68,69]. Partial ANTresistance to races 23 and 1545 on Pv5 was previously reported by Gonzalez et al. in 2015 [70].However, until now, no resistance locus to ANT has been found on chromosome Pv06. In fact,the ANT resistance system in common bean has been classically investigated by analyzing a lim-ited number of isolates or races in different segregating populations [57]. Using GWAS, a broaderrange of genetic variation may be explored, not restricted to a bi parental source. Exploring thegenetic architecture of the ANT response in common beans, Oblessuc et al. in 2014 reported amore quantitative response to ANT resistance (race 4), reinforcing the importance of unveilingminor effect alleles that may contribute to durable resistance [32]. Two markers were associatedwith resistance to ANT on chromosome Pv05 (PvM07 and scaffld00062_295319) and five mark-ers on chromosome Pv06 (PvM14, scaffold00128_112577, scaffold00128_197955, scaf-fold00001_2118513 and scaffold0001_1947432), revealing new QRLs for ANT resistance.
The PvM07 marker was linked to putative genes related to disease resistance (Zinc fingerproteins) (S1 Table). Zinc fingers proteins are members of a super family involved in resistanceand regulatory mechanisms for various biotic stresses [71,72]. The presence of zinc fingerDNA binding domains in nucleotide binding site-leucine rich repeats (NBS-LRR) determinesthe regulatory function of this protein in stress conditions [73]. Most plant disease resistance R
Genome-Wide Association Studies of Anthracnose and Angular Leaf Spot
PLOS ONE | DOI:10.1371/journal.pone.0150506 March 1, 2016 13 / 19
proteins contain a series of NBS-LRRs. The LRRs of a wide variety of proteins from manyorganisms serve as protein interaction platforms, and as regulatory modules of protein activa-tion. Genetically, the LRRs of plant R proteins are determinants of response specificity, andtheir action can lead to plant cell death in the form of the familiar hypersensitive response(HR) [74].
In chromosome Pv02, the PvM13 marker (Fig 3) was co-localized with QRL ANT02.4UC[32]. Three SNPs (scaffold00097_323110, scaffold00097_164240, and scaffold00034_860044;Fig 3) were co-localized with QRL ANT08.2UC [32]. The QRL ANT11.1UC observed inresponse to ANT race 4 was also positioned on the distal part of chromosome Pv11 [32]. ThePvM98 marker was co-localized with this QRL.
Two markers in Pv01 (scaffold00024_916410 and PvM97; Fig 3) were localized in a positioncorresponding to the Co-1 resistance cluster. This resistance cluster was reported recently byCampa et al. in 2014, who found the genes Co-173-x and Co-165-x correspond to the resistancecluster against the ANT races 73 and 65, respectively [57].
Both scaffold00060_115096 and scaffold00060_401853 markers (Fig 3) were associatedwith ALS on chromosome Pv04. These two markers were localized in a position correspondingto Co-10, Phg-ON, and Ur-14 resistance clusters. These three genes appear very important forcommon bean breeding programs, as indicated by previous studies [63,75].
The ALS resistance was associated with nine of 11 common bean chromosomes (Pv01,Pv02, Pv03, Pv04, Pv05, Pv07, Pv08, Pv09, and Pv10) [76]. Until now, no ALS resistance QRLhas been found on chromosome Pv06 (Fig 3). Two markers were associated with resistance toALS on Pv06: scaffold00037_358238 and scaffold0001_2031371.
Oblessuc et al. in 2012 identified seven QRLs associated with ALS resistance to race 0–39[30]. Comparing the former results with the associations detected herein, it is possible to verifysimilar regions for ALS resistance. On Pv03, the PvM124, scaffold00045_345513, and PvM95markers (Fig 3) were co-localized near the QRL ALS3.1UC [30]. The PvM95 marker was associ-ated with both diseases, while two other markers mapped on this genomic region were assignedspecifically to ANT resistance.
On Pv04, BMc225 (Fig 3) was co-localized with QRL ALS4.2GS, UC [30], associated withALS resistance to race 0–39. Keller et al. in 2015 reported a major QRL on Pv04, around 43.7Mb, explaining 75.3% of the phenotypic variance to an Andean race (31–0) [76]. BMc225 waslocated at 42.28 Mb on Pv05, the same genomic region of the Pv-atgc002 marker, linked withALS4.1GS,UC. The QTL5.2UC was co-localized to PvM07, PvM62, and scaffold00062_295319,as they were in the same genomic region of Pv05 that corresponded to this QRL region.
The discovery of gene clusters not only conditioning ANT resistance but linked to othergene clusters conditioning resistance to other pathogens such as ALS, bean rust, bean commonmosaic virus, and halo blight has been reported [56]. In our study, new gene clusters wererevealed for ANT and ALS resistance, preferentially localized on chromosome telomeres. Theend of linkage group B4 was reported to have a high density of resistance genes and RGAs. Amajor-effect QRL against strain 45 (for leaf, stem, and petiole ANT resistance) and a reverse-effect QRL (i.e., coming from the susceptible Andean JaloEEP558 parent) for leaf ANT resis-tance against strain A7 were also located in this region [77].
Moreover, functional annotation analyses of markers from homologous sequence providedclues to the molecular bases of putatives responses to stress. In the present study, many GOterms and pathways relevant were identified, like phenylpropanoids, which are a group ofplant secondary metabolites derived from phenylalanine, probably having a wide variety offunctions as structural and signaling molecules [78]. Phenylalanine is first converted to cin-namic acid by deamination. It is followed by hydroxylation and frequent methylation to gener-ate coumaric acid and other acids with a phenylpropane (C6-C3) unit. Reduction of the CoA-
Genome-Wide Association Studies of Anthracnose and Angular Leaf Spot
PLOS ONE | DOI:10.1371/journal.pone.0150506 March 1, 2016 14 / 19

activated carboxyl groups of these acids results in the corresponding aldehydes and alcohols.The alcohols are called monolignols, the starting compounds for biosynthesis of lignin. Obvi-ously, this is important to understanding biochemical bases of regulatory mechanisms inducedby hormones in the processes of organogenesis or defense.
Although the genetic basis of durable resistance in plants is not fully understood [79], it isfrequently presumed that quantitative resistance, conditioned by “minor” genes and supposedto act in a race-nonspecific manner, would provide durable resistance [80]. As pointed out byOblessuc et al. positive QRL alleles for ANT and ALS resistance were identified using a recom-binant inbred line (RIL) bi-parental population (IAC-UNA x CAL-143) [30,31,32,35]. Newassociations have been detected in this report using a GWAS approach. GWAS may provide ahigher mapping resolution and the possibility to study various regions of the genome simulta-neously, since it is based on germplasm collections with minimal genetic structure, preferen-tially a set of useful accessions for single or multiple traits of interest for breeding programs[54]. The putative genes identified in these regions may be potentially involved in the resistanceresponse. Minor and major effect QRL revealed by this study may play a role in achieving amore comprehensive knowledge of the host-pathogen interactions of Colletotrichum linde-muthianum and Pseudocercospora griseola. Through cloning and characterizing candidategenes underlying resistance mechanisms in major QRL, the pathways involved in the race-spe-cific and defense response to anthracnose and angular leaf spot infection of common beans canbe further elucidated and understood.
Supporting InformationS1 Fig. Linkage disequilibrium (r2) of SNP pairs in each of the 11 chromosomes of Phaseo-lus vulgaris L., due to the genetic distance in Mb.(TIF)
S2 Fig. Manhattan plots for both diseases. (A) Anthracnose–ANT, (B) Angular leaf spot–ALS. P values are shown on a log10 scale. Markers are considered significant when P� 0.05.Axis x corresponds to the number of chromosomes in common bean.(TIF)
S3 Fig. BLAST2GO annotation of genes containing SSR and SNP markers for Anthracnoseand Angular Leaf Spot resistance: Biological Process (BP); Molecular Function (MF); Cel-lular Component (CC). In parenthesis, there are the numbers of genes of each category.(TIF)
S4 Fig. Phenylpropanoid biosynthesis pathway (map 00940). The blue boxes are for KEGGECs that have homologies to Phaseolus vulgaris sequence target by PvM93.(TIF)
S1 Table. Genomic analysis of molecular markers associated with anthracnose resistance incommon bean according to the Phytozome database v1.0.(DOCX)
S2 Table. Genomic analysis of molecular markers associated with angular leaf spot resis-tance in common bean according to the Phytozome database v1.0.(DOCX)
S3 Table. Markers that tag with enzymatic functions putatively related to “stress” or“defense”.(DOCX)
Genome-Wide Association Studies of Anthracnose and Angular Leaf Spot
PLOS ONE | DOI:10.1371/journal.pone.0150506 March 1, 2016 15 / 19

AcknowledgmentsThis research was supported by grants from São Paulo Research Foundation (FAPESP) (pro-cess numbers 2009/05284-1 and 2009/02502-8) and CNPq (process number 477239/2010-2).
Author ContributionsConceived and designed the experiments: JMKCP LLB-R. Performed the experiments: JMKCPAFC LLB-R. Analyzed the data: JMKCP PRO JRBFR KAG AAFG. Contributed reagents/mate-rials/analysis tools: AFC SAMC RPV. Wrote the paper: JMKCP.
References1. Schmutz J, McClean PE, Mamide S, Wu GA, Cannon SB, Grimwood J, et al. (2014) A reference
genome for common bean and genome-wide analysis of dual domestications. Nat Genet 46: 707–713.doi: 10.1038/ng.3008 PMID: 24908249
2. BroughtonWJ, Hernández G, Blair MW, Beebe S (2003) Beans (Phaseolus spp.)–model food legumes.Plant Soil 252: 55–128. doi: 10.1023/A:1024146710611
3. Gepts P, Aragão FJL, de Barros E, Blair MW, Brondani R, Broughton W (2008) Phaseolus beans, amajor source of dietary protein and micronutrients. In: Moore PH, Ming R (eds) Genomics of tropicalcrop molecular markers linked to angular leaf spot resistance genes in common beans accessionsG10909. Mol Breed 28: 57–71.
4. Azarpazhooh E, Boye JI (2012) "Dry bean composition and effect of processing on protein, carbohy-drates, fiber and minor constituents.",—Common Beans and Pulses: Production, Processing, andNutrition, JohnWiley & Sons, Ltd., 2012.
5. Pastor-Corrales MA, Tu JC (1989) Anthracnose. p. 77–104. In Pastor-Corrales MA, Schwartz HH (ed.)Bean production problems in the tropics. 2nd ed. CIAT, Cali, Colombia.
6. Pastor-Corrales MA, Jará CE (1995) La evoluciòn de Phaseolus vulgaris con el frijol comum en AmericaLatina. Fitopatologia Colombiana 19: 15–24.
7. Melotto M, Balardin RS, Kelly JD (2000) Host-pathogen interaction and variability of Colletotrichum lin-demuthianum. In: Prusky D, Freeman S, Dickman MB (eds)Colletotrichum host specificity, pathology,and host-pathogen interaction. APS Press, St Paul, pp 346–361.
8. Stenglein S, Ploper LD, Vizgarra O, Balatti P (2003) Angular leaf spot: a disease caused by the fungusPhaeoisariopsis griseola (Sacc.) Ferraris o n Phaseolus vulgaris L. Adv Appl Microbiol 52: 209–243.doi: 10.1016/S0065-2164(03)01009-8 PMID: 12964246
9. Miklas PN, Kelly J, Beebe SE, Blair MW (2006) Common bean breeding for resistance against bioticand abiotic stresses: from classical to MAS breeding. Euphytica 147: 105–131. doi: 10.1007/s10681-006-4600-5
10. Crous PW, Liebenberg MM, Braun U, Groenewald JZ (2006) Re-evaluating the taxonomic status ofPhaeoisariopsis griseola, the causal agent of angular leaf spot of bean. Stud Mycol 55: 163–173.PMID: 18490977
11. Allorent D, Savary S (2005) Epidemiological characteristics of angular leaf spot of bean: a systemsanalysis. Eur J Plant Pathol 113: 329–341.
12. Zhu Q, Zheng X, Luo J, Gaut BS, Song E (2007) Multilocus analysis of nucleotide variation ofOryzasativa and its wild relatives: severe bottleneck during domestication of rice. Mol Biol Evol 24: 875–888.PMID: 17218640
13. Huang X, Han B (2014) Natural Variations and Genome-Wide Association Studies in Crop Plants.Annual Rev of Plant Biol 65: 531–551.
14. Myles S, Peiffer J, Brown PJ, Ersoz ES, Zhang Z, Costich DE, et al. (2009) Association mapping: Criti-cal considerations shift from genotyping to experimental design. The Plant Cell 21: 2194–2202. doi:10.1105/tpc.109.068437 PMID: 19654263
15. Nordborg M, Tavaré S (2002) Linkage disequilibrium: what history has to tell us. Trends Genet 18: 83–90. PMID: 11818140
16. Flint-Garcia SA, Thornsberry JM, Buckler ES (2003) Structure of linkage disequilibrium in plants. AnnuRev Plant Bio. 54: 357–374.
17. Garris AJ, Tai TH, Coburn J, Kresovich S, McCouch S (2005) Genetic structure and diversity inOryzasativa L. Genetics 169: 1631–1638. PMID: 15654106
Genome-Wide Association Studies of Anthracnose and Angular Leaf Spot
PLOS ONE | DOI:10.1371/journal.pone.0150506 March 1, 2016 16 / 19

18. Breseghello F, Sorrells ME (2006a) Association analysis as a strategy for improvement of quantitativetraits in plants. Crop Sci. 46: 1323–1330.
19. Breseghello F, Sorrells ME (2006b) Association mapping of kernel size and milling quality in wheat (Tri-ticum aestivum L.) cultivars. Genetics 172: 1165–1177.
20. Kwak M, Gepts P (2009) Structure of genetic diversity in the two major gene pools of common bean(Phaseolus vulgaris L, Fabaceae). Theor App Gen 118: 979–992.
21. Rossi M, Bitocchi E, Bellucci E, Nanni L, Rau D, Attene G, et al. (2009) Linkage disequilibrium and pop-ulation structure in wild and domesticated populations of Phaseolus vulgaris L. Evol Appl 1–19.
22. Blair MW, Prieto S, Díaz LM, Buendía HF, Cardona C (2010) Linkage disequilibrium at the APA insecti-cidal seed protein locus of common bean (Phaseolus vulgaris L.). BMC Plant Biol 10: 79. doi: 10.1186/1471-2229-10-79 PMID: 20429910
23. Chiorato AF, Carbonell SAM, Dias LAS, Moura RR, Chiavegato MB, Carlos Augusto Colombo CA(2006) Identification of common bean (Phaseolus vulgaris) duplicates using agromorphological andmolecular data. Genetics and Molecular Biology 29:105–111.
24. Oliveira MF, Nelson RL, Geraldi IO, Cruz CD, De Toledo JFF (2010) Establishing a soybean germ-plasm core collection. Field Crops Research 119: 277–289.
25. Perseguini JMKC, Silva GMB, Rosa JRBF, Gazaffi R, Marçal JF, Carbonell SAM, et al. (2015) Develop-ing a common bean core collection suitable for association mapping studies. Genetics Molec Biol 38:67–78.
26. Abdurakhmonov IY, Abdukarimov A (2008) Application of association mapping to understanding thegenetic diversity of plant germplasm resources. Int. J. Plant Genomics 574927 doi: 10.1155/2008/574927 PMID: 18551188
27. Shi C, Navabi A, Yu K (2011) Association mapping of common bacterial blight resistance QTL inOntario bean breeding populations. BMC Plant Biol 11:52. doi: 10.1186/1471-2229-11-52 PMID:21435233
28. Galeano CH, Cortés JA, Fernández AC, Soler A, Franco-Herrera N, Makunde G, et al. (2012) Gene-based single nucleotide polymorphism markers for genetic and association mapping in common bean.BMCGenetics 13: 48. doi: 10.1186/1471-2156-13-48 PMID: 22734675
29. Nemli S, Asciogul TK, Kaya HB, Kahtaman A, Esiyok D, Tanyolac B (2014) Association mapping of fiveagronomic traits in the common bean (Phaseolus vulgaris L.). Journal of the Sci of Food and Agric 94(15) doi: 10.1002/jsfa.6664
30. Oblessuc PR, Baroni RM, Garcia AAF, Chioratto AF, Carbonell SAM, Camargo LEA, et al. (2012) Map-ping of angular leaf spot resistance QTL in common bean (Phaseolus vulgaris L.) under different envi-ronments. BMCGenetics 13: 50. doi: 10.1186/1471-2156-13-50 PMID: 22738188
31. Oblessuc PR, Perseguini JMKC, Baroni RM, Chiorato AF, Carbonell SAM, Mondego JMC, et al. (2013)Increasing the density of markers around a major QTL controlling resistance to angular leaf spot in com-mon bean. Theor Appl Genet. doi: 10.1007/s00122-013-2146-1
32. Oblessuc PR, Baroni RM, Pereira GS, Chioratto AF, Carbonell SAM, Briñez B, et al. (2014) Quantitativeanalysis of race-specific resistance to Colletotrichum lindemuthianum in common bean. MolecularBreeding 34: 1313–1329.
33. Oblessuc PR, Matiolli CC, Chiorato AF, Benchimol-Reis LL, Melotto M (2015) Common bean reactionto angular leaf spot comprises transcriptional modulation of genes in the ALS10.1 QTL. Front Plant Sci6: 152. doi: 10.3389/fpls.2015.00152 PMID: 25815001
34. Hanai LL, Campos T, Camargo LEA, Benchimol LL, Souza AP, Melotto M, et al. (2007) Development,characterization, and comparative analysis of polymorphism at common bean-SSR loci isolated fromgenic and genomic sources. Genome 50: 266–277. PMID: 17502900
35. Campos T, Oblessuc PR, Sforça DA, Cardoso JMK, Baroni RM, Sousa ACB, et al. (2011) Inheritanceof growth habit detected by genetic linkage analysis using microsatellites in the common bean (Phaseo-lus vulgaris L.). Mol Breed 27: 549–560.
36. Vianello RP. QTL for drought tolerance in a Mesoamerican common bean (Phaseolus vulgaris L.) popu-lation Bat477 x Pérola. In press.
37. Fisher RA (1935) The logic of inductive inference. Journal of the Royal Statistical Society 98: 39–54.
38. Weir BS (1996) Genetic Data Analysis II. Sinauer Associates, Sunderland, MA.
39. Benjamini Y, Hochberg Y (1995) Controlling the false discovery rate: a practical and powerful approachto multiple testing. Journal of the Royal Statistical Society 57: 289–300.
40. Hanai LL, Santini L, Camargo LEA, Fungaro MHP, Gepts P, Tsai SM, et al. (2010) Extension of thecore map of common bean with EST-SSR, RGA, AFLP, and putative functional markers. Mol Breeding25: 25–45.
Genome-Wide Association Studies of Anthracnose and Angular Leaf Spot
PLOS ONE | DOI:10.1371/journal.pone.0150506 March 1, 2016 17 / 19

41. Hill WG, Robertson A (1966) The effect of linkage on limits to artificial selection. Genet Res 8: 269–294. PMID: 5980116
42. Wimmer V, Albrecht T, Auinger H, Schön C (2011) Synbreed: a framework for the analysis of genomicprediction data using R. Bioinformatics 28: 2086–2087.
43. Monda EO, Sanders FE, Hick A (2001) Infection and colonization of bean leaf by Phaeoisariopsis gri-seola. Plant Pathol 50: 103–110.
44. Akaike H (1974) A new look at the statistical model identification. IEEE Trans Aut Control 19: 716–723.
45. Schwarz G (1978) Estimating the dimension of a model. Annals of Statistics 6: 461–464.
46. Conesa A, Götz S, García-Gómez JM, Terol J, Talón M, Robles M (2005) Blast2GO: a universal tool forannotation, visualization and analysis in functional genomics research. Bioinformatics 21: 3674–3676.PMID: 16081474
47. Altermann E, Klaenhammer TR (2005) PathwayVoyager: pathway mapping using Kyoto Encyclopediaof Genes and Genomes (KEGG) database. BMCGenomics 6:60. PMID: 15869710
48. Hardy OJ, Vekemans X (2002) SPAGeDi: a versatile computer program to analyse spatial geneticstructure at the individual or population levels. Mol Ecol Notes 618–620.
49. Pritchard JK, Stephens P, Donnelly P (2000) Inference of population structure using multilocus geno-type data. Genetics 155: 945–959. PMID: 10835412
50. Mather KA, Caicedo AL, Polato NR, Olsen KM, McCouch S, Purugganan MD (2007) The extent of link-age disequilibrium in rice (Oryza sativa L.). Genetics 177: 2223–2232. PMID: 17947413
51. Barnaud A, Laucou V, This P, Lacombe T, Doligez A (2010) Linkage disequilibrium in wild Frenchgrapevine, Vitis vinifera L. subsp. Silvestris. Heredity 104: 431–437. doi: 10.1038/hdy.2009.143 PMID:19844269
52. Hao C, Wang L, Ge H, Dong Y, Zhang X (2011) Genetic diversity and linkage disequilibrium in Chinesebread wheat (Triticum aestivum L.) revealed by SSRmarkers. PLoS ONE 6(2): e17279. doi: 10.1371/journal.pone.0017279 PMID: 21365016
53. Xu P, Wang B, Luo J, Liu Y, Ehlers JD, Close TJ, et al. (2012) Genome wide linkage disequilibrium inChinese asparagus bean (Vigna unguiculata ssp. sesquipedialis) germplasm: implications for domesti-cation history and genome wide association studies. Heredity 109: 34–40. doi: 10.1038/hdy.2012.8PMID: 22378357
54. Korte A, Ashley F (2013) The advantages and limitations of trait analysis with GWAS: a review. PlantMethods 9:29. doi: 10.1186/1746-4811-9-29 PMID: 23876160
55. Nordborg M (2000) Linkage disequilibrium, gene trees and selfing: an ancestral recombination graphwith partial self-fertilization. Genetics 154: 923–929. PMID: 10655241
56. Ferreira JJ, Campa A, Kelly JD (2013) “Organization of genes conferring resistance to anthracnose incommon bean,” in Translational Genomic for Crop Breeding: Biotic Stress, eds Varshney R. K. andTuberosa R. ( Chichester: JohnWiley & Sons), 151–182. doi: 10.1002/9781118728475.ch9
57. Campa A, Rodríguez-Suárez C, Giraldez R, Ferreira JJ (2014) Genetic analysis of the response toelevenColletotrichum lindemuthianum races in a RIL population of common bean (Phaseolus vulgarisL.). BMC Plant Biol 14: 115. doi: 10.1186/1471-2229-14-115 PMID: 24779442
58. Geffroy V, Sevignac M, Billant P, Dron M, Langin T (2008) Resistance to Colletotrichum lindemuthia-num in Phaseolus vulgaris: a case study for mapping two independent genes. Theor Appl Genet 116:407–415. PMID: 18060540
59. Rodríguez-Suárez C, Méndez-Vigo B, Pañeda A, Ferreira JJ, Giraldez R (2007) A genetic linkage mapof Phaseolus vulgaris L. and localization of genes for specific resistance to six races of anthracnose(Colletotrichum lindemuthianum). Theor Appl Genet 114: 713–722. PMID: 17186216
60. Richard MMS, Pflieger S, Sévignac M, Thareau V, Blanchet S, Li Y, et al. (2014) Fine mapping of Co-x,an anthracnose resistance gene to a highly virulent strain ofColletotrichum lindemuthianum in commonbean. Theor Appl Genet 127: 1653–1666. doi: 10.1007/s00122-014-2328-5 PMID: 24859268
61. Lacanallo GF, Gonçalves-Vidigal MC, Vidigal Filho PS, Kami J, Gonela A (2010) Mapping of an Andeangene for resistance to anthracnose in the landrace Jalo Listras Pretas. Annu Rept Bean Improv Coop53: 95–96.
62. Adam-Blondon AF, Sévignac M, Dron M, Bannerot H (1994) A genetic map of common bean to localizespecific resistance genes against anthracnose. Genome 37: 915–924. PMID: 7828839
63. Alzate-Marin AL, Costa MR, Arruda KM, Gonçalves de Barros E, Alves Moreira M (2003) Characteriza-tion of the anthracnose resistance gene present in Ouro Negro (Honduras 35) common bean cultivar.Euphytica 133: 165–169.
64. Geffroy V, Sicard D, de Oliveira JCF, Sévignac M, Cohen S, Gepts P, et al. (1999) Identification of anancestral resistance gene cluster involved in the coevolution process between Phaseolus vulgaris and
Genome-Wide Association Studies of Anthracnose and Angular Leaf Spot
PLOS ONE | DOI:10.1371/journal.pone.0150506 March 1, 2016 18 / 19

its fungal pathogenColletotrichum lindemuthianum. Mol Plant-Microbe Interact 12: 774–784. PMID:10494630
65. Gonçalves-Vidigal MC, Cruz AS, Lacanallo GF, Vidigal Filho PS, Sousa LL, Pacheco CMNA, et al.(2013) Co-segregation analysis and mapping of the anthracnose Co-10 and angular leaf spot Phg-ONdisease-resistance genes in the common bean cultivar Ouro Negro. Theor Appl Genet 126: 2245–255.http://www.biomedcentral.com/sfx_links?ui=1471-2229-14-115&bibl=B24 doi: 10.1007/s00122-013-2131-8 PMID: 23760652
66. Méndez-Vigo B, Rodríguez-Suárez C, Pañeda A, Ferreira JJ, Giraldez R (2005) Molecular markersand allelic relationships of anthracnose resistance gene cluster B4 in common bean. Euphytica 141:237–245.
67. Rodríguez-Suárez C, Ferreira JJ, Campa A, Pañeda A, Giraldez R (2008) Molecular mapping andintra-cluster recombination between anthracnose race-specific resistance genes in the common beandifferential cultivars Mexico 222 andWidusa. Theor Appl Genet 116: 807–814. doi: 10.1007/s00122-008-0714-6 PMID: 18210079
68. Campa A, Giraldez R, Ferreira JJ (2009) Genetic dissection of the resistance to nine anthracnoseraces in the common bean differential cultivars MDRK and TU. Theor Appl Genet 119: 1–11. doi: 10.1007/s00122-009-1011-8 PMID: 19319502
69. Geffroy V, Creusot F, Falquet J, Sévignac M, Adam-Blondon A- F, Gepts P, et al. (1998) A family ofLRR sequences at theCo-2 locus for anthracnose resistance in Phaseolus vulgaris and its potentialuse in markerassisted selection. Theor Appl Genet 96: 494–502. doi: 10.1007/s001220050766 PMID:24710889
70. González AM, Yuste-Lisbona FJ, Rodiño AP, De Ron AM, Capel C, García-Alcázar M, et al. (2015)Uncovering the genetic architecture ofColletotrichum lindemuthianum resistance through QTL map-ping and epistatic interaction analysis in common bean. Front. Plant Sci. 6:141. doi: 10.3389/fpls.2015.00141 PMID: 25852706
71. Feurtado JA, Huang D, Wicki-Stordeur L, Hemstock LE, Potentier MS, et al. (2011) The ArabidopsisC2H2 zinc finger Indeterminate Domain1/Enhydrous promotes the transition to germination by regulat-ing light and hormonal signaling during seed maturation. The Plant Cell 23: 1772–1794. doi: 10.1105/tpc.111.085134 PMID: 21571950
72. Giri J, Vij S, Dansana PK, Tyagi AK (2011) Rice A20/AN1 zinc-finger containing stress-associated pro-teins (SAP1/11) and a receptor-like cytoplasmic kinase (OsRLCK253) interact via A20 zinc-finger andconfer abiotic stress tolerance in transgenic Arabidopsis plants. New Phytologist 191: 721–732. doi:10.1111/j.1469-8137.2011.03740.x PMID: 21534973
73. Zhu H, Cannon AB, Young ND, Cook DR (2002) Phylogeny and Genomic Organization of the TIR andNon-TIR NBS-LRR Resistance Gene family inMedicago truncatula. The American Phyttop Soc 15:529–539.
74. Belkhadir Y, Subramaniam R, Dangl JL (2004) Plant disease resistance protein signaling: NBS-LRRproteins and their partners. Current Opinion in Plant Biology 4: 391–399.
75. Gonçalves-Vidigal MC, Cruz AS, Lacanallo GF, Vidigal-Filho PS, Sousa LL, Pacheco CMNA, et al.(2013) Co-segregation analysis and mapping of the anthracnose Co-10 and angular leaf spot Phg-ONdisease-resistance genes in the common bean cultivar Ouro Negro. Theor Appl Genet 126: 2245–2255. doi: 10.1007/s00122-013-2131-8 PMID: 23760652
76. Keller B, Manzanares C, Jara C, Lobaton JD, Studer B, Raatz B (2015) Fine-mapping of a major QTLcontrolling angular leaf spot resistance in common bean (Phaseolus vulgaris L.). Theor and Appl Genet-ics 128: 813–826.
77. Geffroy V, Sevignac M, de Oliveira JCF, Fouilloux G, Skroch P, Thoquet P, et al. (2000) Inheritance ofpartial resistance againstColletotrichum lindemuthianum in Phaseolus vulgaris and co-localization ofquantitative trait loci with genes involved in specific resistance. Mol Plant Microbe Interact 13: 287–296. PMID: 10707354
78. Nair RB, Bastress KL, Ruegger MO, Denault JW, Chapple C (2004) The Arabidopsis thalianaREDUCED EPIDERMAL FLUORESCENCE1 gene encodes an aldehyde dehydrogenase involved inferulic acid and sinapic acid biosynthesis.Plant Cell 16: 544–54. PMID: 14729911
79. Johnson R (1981) Durable resistance: Definition of genetic control and attainment in plant breeding.Phytopathology 71: 567–568.
80. Vanderplank JE (1968) Disease Resistance in Plants. Academic Press, New York.
Genome-Wide Association Studies of Anthracnose and Angular Leaf Spot
PLOS ONE | DOI:10.1371/journal.pone.0150506 March 1, 2016 19 / 19