geological society of america memoirs - usgs · sist of two layers. mintrop (1949b) considered...
TRANSCRIPT
Geological Society of America Memoirs
doi: 10.1130/2012.2208(04) 2012;208;59-69Geological Society of America Memoirs
1950)−CHAPTER 4 The 1940s (1940
Email alerting servicescite this article
to receive free e-mail alerts when new articleswww.gsapubs.org/cgi/alertsclick
SubscribeAmerica Memoirs
to subscribe to Geological Society ofwww.gsapubs.org/subscriptions/click
Permission request to contact GSAhttp://www.geosociety.org/pubs/copyrt.htm#gsaclick
viewpoint. Opinions presented in this publication do not reflect official positions of the Society.positions by scientists worldwide, regardless of their race, citizenship, gender, religion, or politicalarticle's full citation. GSA provides this and other forums for the presentation of diverse opinions and articles on their own or their organization's Web site providing the posting includes a reference to thescience. This file may not be posted to any Web site, but authors may post the abstracts only of their unlimited copies of items in GSA's journals for noncommercial use in classrooms to further education andto use a single figure, a single table, and/or a brief paragraph of text in subsequent works and to make
GSA,employment. Individual scientists are hereby granted permission, without fees or further requests to Copyright not claimed on content prepared wholly by U.S. government employees within scope of their
Notes
© 2012 Geological Society of America
on April 11, 2013memoirs.gsapubs.orgDownloaded from

4.1. THE LATE 1940S IN CENTRAL EUROPE
Controlled-source seismology investigations of the Earth’s crust and the fi rst international cooperations started effectively after 1945. In the fi rst edition of Volume VII of Physics of the Earth (edited by B. Gutenberg) on the internal constitution of the Earth in 1939, J.B. Macelwane summarized essentially the seismic studies up to 1939 on velocities for the outer sur-face layers of the Earth, i.e., for sediments and crustal crys-talline rocks, obtained from quarry blast and near earthquake recordings between 1900 and 1939. In the second edition of this volume in 1951 (Macelwane, 1951), he added some results obtained between 1940 and 1949, in particular results from the seismic profi les using the military explosions in Germany, Heligo land in 1947 (Schulze, 1947; British National Committee for Geodesy and Geophysics, 1948; Reich et al., 1951; Mintrop , 1949b), and Haslach (Black Forest, Southwest Germany) in 1948 (Reich et al., 1948; Rothé et al., 1948; Förtsch, 1951) and from some early explosion studies of Tuve et al. (1948) in the United States.
By the early 1950s, the overall picture of the crust had al-ready been established. Reinhardt (1954), in his review of crustal investigations up to 1954, plotted the basic scheme (Fig. 4.1-01). Beneath a layer of sediments, the Earth was divided into an upper crust of granitic composition and a lower crust consisting of gab-broic rocks, underlain by a peridotitic mantle layer, the top of which was determined by the Mohorovičić discontinuity.
Based on the pre-war investigations by Wiechert, Angen-heister, and others, such investigations would eventually be contin ued, after the Second World War had ended. Former friend-ships between scientists in Britain, France, and Germany could be renewed and so, only one year after the war, the fi rst inter-national scientifi c cooperations were organized. The very fi rst crustal investigations in central Europe were enabled by using large explosions undertaken by the British and French armies, particularly in Germany, to destroy great quantities of ammuni-tions, fortifi cations, and other military objects.
A large explosion of ammunition in 1944 near Burton-on-Trent in England was recorded by many earthquake stations in Europe (Jeffreys, 1947). In 1946, surface detonations of large ammunition reserves were carried out near Soltau in the North German Plain and recorded up to 50 km away (Schulze and Förtsch, 1950; Willmore, 1949). The recorded traveltimes re-sulted in upper crustal velocities being determined between 5.8 and 6.6 km/s. Of particular interest were the azimuth-dependent variations, evidently caused by salt domes. Other ammunition
reserves were detonated in 1946 in Danish waters (Lehmann, 1948). Near Kahla in Thuringia, an underground factory was de-molished and the explosions were recorded up to 438 km away (Sponheuer and Gerecke, 1949). The interpretation of the seis-mograms resulted in a layer with 6.35 km/s velocity being in-terpreted at 9 km depth. Pn arrivals, however, were not recorded.
The very fi rst nuclear explosions in North America, which were recorded by earthquake stations in North America, also have to be mentioned in this context. However, as their origin time had not been announced in advance, the recordings did not supply any new information on the Earth’s crustal and upper mantle structure.
The greatest impact on crustal studies at this time was created by the large explosions on Heligoland in 1947 and in the Black Forest in 1948.
In 1947, 4000 metric tons of explosives were detonated in-stantaneously in fortifi cations on the island of Heligoland in the North Sea off northern Germany (Charlier, 1947; Willmore, 1949; Engelhard, 1998). This explosion was located 50 m underground.
59
� CHAPTER 4 �
The 1940s (1940–1950)
Figure 4.1-01. Schematic division of the Earth’s crust due to seismic measurements (from Reinhardt, 1954, fi g. 1). [Freiberger Forschungs-hefte, C15, p. 9–91. Reproduced by permission of TU Freiberg, Germany .]
on April 11, 2013memoirs.gsapubs.orgDownloaded from

The explosion on the island of Heligoland (Fig. 4.1-02) is the factual beginning of controlled-source seismology in Germany (Schulze, 1974). The use of the explosion on Heligoland for sci-ence was enabled by British geophysicists with good army con-tacts. Engelhard (1998) reviewed this event and its consequences for explosion seismology in Germany. Twenty-four recording stations were arranged along three profi les throughout north-ern Germany, the recordings being organized by the Geophysi-cal Institute of Goettingen and the State Geological Survey at Hannover . The longest profi le extended for more than 300 km and ran through the troop training area of Soltau and farther toward Goettingen. Another profi le ran into Schleswig-Holstein across the magnetic high of Husum.
In southwestern Germany in 1948, an underground ammuni-tion factory near Haslach in the Black Forest was destroyed by several very large explosions. The pre-war friendship of E. Peter-schmitt (Strasbourg) and W. Hiller (Stuttgart) enabled the use of these subsurface explosions for science and recording along two lines, one toward the WNW across the Rhine valley toward Stras-bourg and one toward the ESE into Bavaria (Fig. 4.1-03).
Both the Heligoland and the Haslach explosions were re-corded mainly by mechanical seismometers with mechanical-optical and mechanical-electrical-optical recording systems on photographic paper. The mechanical-optical system (system of Schulze and Förtsch), for example, had seismometers (Fig. 4.1-04) with an eigenperiod of 1/6 s, an amplifi cation of 1:25,000 for 1 m light path, air damping (could be modifi ed), 1 kg mass, and a total weight of 4.5 kg (Reinhardt, 1954). Effectively a 40,000-fold amplifi cation was reached (Reich et al., 1948). The mechan-ical-electrical-optical instruments operated with induction and worked usually with electronic amplifi cation which increased the sensitivity but caused complications when amplitudes and/or fre-quencies were evaluated.
The interpretation of the Heligoland and the Haslach explo-sions resulted in representative models of crustal structure for Central Europe. From the Heligoland observations (Reich et al., 1951; Schulze and Förtsch, 1950; Willmore, 1949) a depth of 26–30 km was derived for the Mohorovičić discontinuity under northern Germany. The internal crustal structure, however, was interpreted differently by the various authors. Reich et al. (1951) and Schulze and Förtsch (1950) favored two crustal layers under neath the sedimentary cover: a granitic upper crust with 5.34 km/s velocity and an essentially thicker gabbroic lower crust, the velocity of which varied from model to model between 6.19 and 6.60 km/s. Willmore (1949) favored a one-layer crustal model, but also discussed the possibility that the crust may con-
Figure 4.1-02. Seismograms of the Heligoland-explosions of 1947 recorded on a N-S line through Germany (HE-l60), compiled by P. Friese and J. Ansorge (from Giese et al., 1976, map 2, fi g. 58, reproduced after Ansorge et al., 1979a, fi g. 6). [In Giese, P., Prodehl, C., and Stein, A., eds., Explosion seismology in central Europe—data and results: Berlin-Heidelberg-New York, Springer, 429 p. Reproduced with kind permission of Springer Science+Business Media.]
Figure 4.1-03. Seismograms of the Haslach explosion of 1948 (HA-120), recorded on an ESE profi le (from Giese et al., 1976, Map 3 fi g. 60). [In Giese, P., Prodehl, C., and Stein, A., eds., Explosion seis-mology in central Europe—data and results: Berlin-Heidelberg-New York, Springer, 429 p. Reproduced with kind permission of Springer Science+Business Media.]
60 Chapter 4
on April 11, 2013memoirs.gsapubs.orgDownloaded from

sist of two layers. Mintrop (1949b) considered later arrivals on stations close to Heligoland as possible deep refl ections from layers in the upper mantle.
The interpretation of the observations of the Haslach-explosion gave better results than the Heligoland measurements (Reich et al., 1948; Rothé et al., 1948; Rothé and Peterschmitt, 1950; Förtsch, 1951). A 16–21-km-thick granitic upper crust
with veloci ties of 5.9–6.0 km/s is underlain by a 10–12-km-thick gabbroic lower crust with 6.55 km/s velocity, and the Moho is between 30 and 33 km deep. The Pn phase resulted in uppermost mantle velocities of 8.15–8.34 km/s. The nine seismograms, recorded on the profi le from Haslach toward the east-southeast (Haslach-120, Fig. 4.1-03), clearly showed the PMP-refl ection and are among the fi rst of many worldwide examples demon-strating that the Mohorovičić-discontinuity, the Moho, is a fi rst-order boundary between Earth’s crust and mantle under many regions of the Earth. At that time, however, this phase was not recognized as a wide-angle refl ection, but was interpreted as a refracted wave from which the depth to the Conrad-discontinuity was derived. The model of Rothé and Peterschmitt (1950) showed the division of the crust (Fig. 4.1-05) into a granitic layer reaching to a depth of 15–20 km and a basaltic layer of ~10 km thickness, and a crustal thinning from 31 to 32 km under most of SW Germany to 28 km under the Black Forest and 25 km under the Rhinegraben. The Haslach profi le into Bavaria further-more led to the detection of a new discontinuity which later in the literature was named the “Förtsch-discontinuity,” a boundary between upper and middle crust at ~10 km depth (Förtsch, 1951). It was also identifi ed later in a statistical evaluation of commer-cial deep-seismic refl ection seismograms recorded throughout Southern Germany (Liebscher , 1962, 1964), but was not regu-larly observed elsewhere. It was later identifi ed as the top of a low-velocity zone in the upper crust (Giese, 1968a; Landisman and Mueller, 1966; Mueller and Landisman, 1966).
4.2. CRUSTAL STUDY ACTIVITIES IN THE 1940S OUTSIDE CENTRAL EUROPE
4.2.1. Soviet Union
Early crustal studies in the 1940s had also been undertaken in other parts of the world, partly even during World War II. In 1950 Twaltwadzse reported on a series of very large explo-sions amounting up to 220,000 kg. They had occurred between 1941 and 1945 in the Soviet Republic of Georgia. Twaltwadzse (1950) assumed that the 20-km-thick granitic upper layer with
Figure 4.1-04. Mechanical seismometer of Goettingen (from Rein-hardt, 1954, fi g. 7) for long-range recording after Schulze and Förtsch (1950). Top: Scheme of seismometer: 1—mirror, 2—mass, 3—damp-ing (3a—cross section of damping), 4—plate spring. Bottom: Seis-mometer closed (right) and opened (left). [Freiberger Forschungshefte, C15, p. 9–91. Reproduced by permission of TU Freiberg, Germany.]
Figure 4.1-05. Seismic-refraction cross section for the ESE-profi le from Haslach (after Rothé and Peterschmitt, 1950, fig. 14) (reproduced in Giese et al., 1976, p. 315: fi g. 2 of Prodehl et al, 1976a). [In Giese, P., Prodehl, C., and Stein, A., eds., Explosion seismology in central Europe—data and results: Berlin-Heidelberg-New York, Springer, 429 p. Reproduced with kind permission of Springer Science+Business Media.]
The 1940s (1940–1950) 61
on April 11, 2013memoirs.gsapubs.orgDownloaded from

a velocity of 5.6 km included solidifi ed sediments in its upper part, the physical properties of which are close to those of granite. The exis tence of a basaltic intermediate layer was also reported, but its lower boundary could not be determined from seismic-refraction data. However, deep refl ections indicated a depth to Moho of 48 km. A similar crustal structure was also assumed for other parts of the Caucasus.
Based on the experiments by Gamburtsev and co-workers in 1938–1941 on the European platform of the former USSR in 1938–1941 and on the Aspheron peninsula in 1944, mentioned in Chapter 3, and theoretical work by Riznichenko and Gamburtsev and co-workers during the 1940s, the method of “deep seismic sounding” was developed (for details and references see Stein-hart, 1961, Appendix A5-1). A specialty of this method was the use of continuous profi le sections of 10–20 km with close geo-phone spacing, alternating with gaps of 10–30 km.
The deep seismic sounding method was applied in 1949–1950 to investigate the crustal structure under the northern Tien-Shan region (Gamburtsev, 1952). Underwater explosions in the lakes Issyk-Kul and Kara-Kul served as energy sources. As seismic re-fl ection measurements had not given satisfying results, modifi ed refraction instrumentation of the prospecting industry with 0.1 s eigenperiod and increased sensitivity were used to record seis-mic energy at offsets up to 400 km. Along the profi le, specially selected 20–25-km-long stretches were very densely occupied with seismometers. The measurements resulted in the interpreta-tion of a 10–15-km-thick granitic layer which was underlain by a 30–40-km-thick basaltic layer. It was noted in particular that both discontinuities deepened considerably toward the south in the di-rection of the Kirgisian mountains—an indication of a crustal root?
4.2.2. North America
In Canada, rock bursts occurring between 1938 and 1945 in the mining area near Kirkland Lake, Ontario, were used for the fi rst time for crustal structure studies. Some events were recorded by observatories up to 1000 km distance. The timing of the events was successfully achieved by a geophone set up inside the mine. The interpretation (Hodgson, 1942, 1947) resulted in the inter-pretation of a depth to Moho of 36 km.
The Canadian investigations of rock bursts in the early 1940s were continued in 1947–1951. In addition, some large explosions in this area were included. Two recording stations were moved regularly to new positions so that fi nally a complete refraction profi le of 174 km length resulted. The data were in-terpreted by a one-layer 36-km-thick crust with a mean velocity of 6.1 km/s, overlying a mantle with 8.18 km/s velocity. The observed wide-angle refl ections indicated that the Moho was a fi rst-order discontinuity. Some later arrivals were recorded from some of the explosions and resulted in a velocity of 7.1 km/s giving hints on the possible existence of an intracrustal disconti-nuity (Hodgson, 1953).
In the United States, a large explosion of ammunition oc-curred in 1944 near Port Chicago in California. From records in
North America, a velocity of 7.72 km/s was derived, but a depth of only 14 km was deduced (Byerly, 1946). Also recorded in North America were the fi rst nuclear tests: on 16 July 1945 the fi rst test was undertaken in New Mexico (Gutenberg, 1946), a second test followed on the Bikini Island in the Pacifi c on 24 July 1946 (Gutenberg and Richter, 1946). As the origin times of the detonations were not known, new knowledge on crustal structure was not achieved, however.
Immediately after World War II the Carnegie Institution of Washington undertook a major fi eld program to study the Earth’s crust with controlled explosions. In the fi rst years of 1946–1949 optical-mechanical-electrical mobile fi eld stations were devel-oped which were capable of detecting ground motions of the order of 10–8 at 4–10 Hz. The detectors used had a resonant fre-quency of 2 Hz (Steinhart, 1961, see Appendix A5-1).
In the Appalachians, large quarry blasts and shots fi red in water in Chesapeake Bay were recorded up to 350 km away (Tuve et al., 1948, Tuve and Tatel, 1950a). From the time-distance curves of the refraction observations Tuve et al. (1948) derived the following model for the region around Washing-ton, D.C.: 0–10 km—6.0–6.17 km/s, 10–24 km—6.7 km/s, 24–42 km—7.05 km/s, 42 km and below—8.15 km/s. When interpreting the data, strong secondary arrivals were detected in the ranges predicted for critical refl ections from the Moho and from depths of 90–120 km. The results were consistent with the refraction model, but it also was noted that several models could be deduced that were consistent with the data (Steinhart, 1961). Junger (1951) reported on deep seismic refl ections from the basement obtained during commercial seismic prospecting work in Big Horn County, Montana. During experimental seis-mic work by Shell Company, a number of deep refl ections from 7.0 to 8.5 seconds were observed. The refl ecting surfaces were fl at and were interpreted to come from inside the basement at depths of 18–21 km.
At subsequent recordings of several large shots in Tennes-see, seismograms were obtained at distances out to 1200 km at several azimuths, but the arrivals disagreed in different areas by as much as 1 second, indicating some real difference in crustal structure along the various paths. As more measurements were made, Tuve and Tatel (1950a) began to doubt the interpretation of a simply layered crust. They also were concerned about the explanation of “reverberations” on seismic records and the lack of coherence in waves over distances of a few kilometers, leading to new experiments in the 1950s (Steinhart, 1961).
A discussion on the nature of the Pg wave had already started in the early 1940s. In two publications of 1943, Guten-berg (1943a, 1943b) had compared observations of near-earthquakes and quarry blasts in southern California and had concluded that the velocities of 5.5–5.6 km for P1-waves from earthquakes should not be compared with the 6 km/s-velocity from quarry blasts, because earthquake waves which were gen-erated at greater depths were not infl uenced by relatively thin sediments on top of the basement. Leet (1946), however, con-cluded that arrivals with 6 km/s would be strongly limited in
62 Chapter 4
on April 11, 2013memoirs.gsapubs.orgDownloaded from

their distance range, as the sediments were not very thick and their properties would substantially change locally. Rather he suggested that another phase with 5.9–6.1 km/s determined by Gutenberg and named Pg would better fi t with the quarry blast observations. In 1949, the Carnegie Institution of Washington conducted experiments in southern California in an attempt to resolve the apparent discrepancies in the velocities reported for P1 from earthquakes and from blasts. It could be shown that in fact the traveltimes coincided within the experimental error (Tuve and Tatel, 1950b, Steinhart, 1961).
4.2.3. South Africa
In South Africa, very early seismic investigations were carried out in the mid to late 1940s (Gane et al., 1946; Willmore et al., 1952). These experiments were enabled by the fact that frequent earth tremors occur in the Witwatersrand gold mining area. The fi rst investigation by Gane et al. (1946) had made it clear that many of the tremors were large enough and occurred often enough (about two tremors per working day) to permit ob-servations at relatively large distances (up to 400 km) to be made in a relatively short time using sensitive mobile equipment. This experience was used by Willmore et al. (1952) for more extended seismic fi eld surveys in 1948 and 1949 with recording distances up to 500 km. The data received amounted to ~200 seismograms. Two simple models of crustal structure were deduced assuming fl at layering. The fi rst model contained two layers: underneath the Witwatersrand system with 5.65 km/s velocity and 4.5 km thickness the so-called crustal layer 1 of 6.09 km/s P-velocity overlies the mantle with 8.27 km/s Pn velocity, the Moho depth being ~36 km. The second model took into account that a phase corresponding to an intermediate layer is evident and thus con-tained two crustal layers 1 and 2 underlying the Witwatersrand system giving a Moho depth of ~39 km.
4.3. SEISMIC-REFRACTION WORK AT SEA
During World War II, the techniques of seismic measure-ments at sea were further developed so that after 1945 the experi-ments could be extended from shallow coastal waters into the deep ocean basins.
As the method to place geophones on the sea bed, which had been common in the 1930s, restricted the investigations to less than 100 fathoms water depth, after 1945 the hydrophone came into use as sensor for seismic waves. Some of the earliest seismic investigations in the deep ocean were carried out with a single hydrophone suspended from a stationary or slowly drifting vessel (Hersey, 1963; Hersey and Ewing, 1949). Small TNT charges were fi red at depths of 1–100 m and a hydrophone suspended 50–300 m below the ship detected echoes from the seabed and refl ectors below (Fig. 4.3-01). After amplifi cation and fi ltering, the hydrophone signals were photographed on an oscilloscope.
The seismic data obtained in the late 1930s were now, after WWII, supplemented by new expeditions, in particular in the
northern Atlantic Ocean in 1948 and 1949 (e.g., Drake et al., 1952; Ewing et al., 1950, 1954; Gaskell and Swallow, 1951; Hersey et al., 1952; Hill, 1952; Katz et al., 1953). In general, the seismic-refraction method was applied. Results of these investi-gations were published since 1949.
Reinhardt (1954, Appendix A4-1) has summarized coordi-nates, dates, references, some technical details, and main results of selected early offshore experiments in Table VII.
For the work at sea, the seismic refraction method was used at that time. In contrast to land seismics, at sea the shotpoint moved and the recording station remained at a fi xed position. Offi cer et al. (1952) and Hersey et al. (1952) have described the techniques in some detail. Usually two ships were used. One ship would heave to and put the hydrophones over the side. The other ship would proceed away from the fi rst ship and fi re 6–20 shots to make up half of the reversed profi le. The size of the shots varied from 0.5 to 5 kg for the close shots, fi red at 5–15 min intervals, to 25–150 kg for the more distant ones, fi red at 30–60 min intervals. The ships were equipped with hydrophones, which were lowered some tens of meters below the effective depth of ocean swell, but usually not exceeding 45 m (Ewing et al., 1950; Galperin and Kosminskaya, 1958; Shor, 1963). The hydrophones had a low-frequency response down to 5 Hz. They detected the seismic signal and fed it into a fi ve-channel amplifi er, each channel of which could be fi ltered in any required manner. Each channel was provided with two output stages at different dynamic levels for recording weak and strong signals on the same record. The amplifi er outputs fed a bank of galvanometers, the defl ections of which were recorded on photographic paper. One channel was used to record the direct water wave and the bottom-refl ected waves. Another galvanometer was connected to a radio receiver to record the shot instant markers from the other ship and one
Figure 4.3-01. Sound paths between explosion and hydrophone (from Hersey et al., 1952, fi g. 5). [Bulletin of the Geological Society of America, v. 42, p. 291–306. Reproduced by permission of the Geo-logical Society of America.]
The 1940s (1940–1950) 63
on April 11, 2013memoirs.gsapubs.orgDownloaded from
galvanometer fi nally was connected to a break circuit chronom-eter to give the time scale.
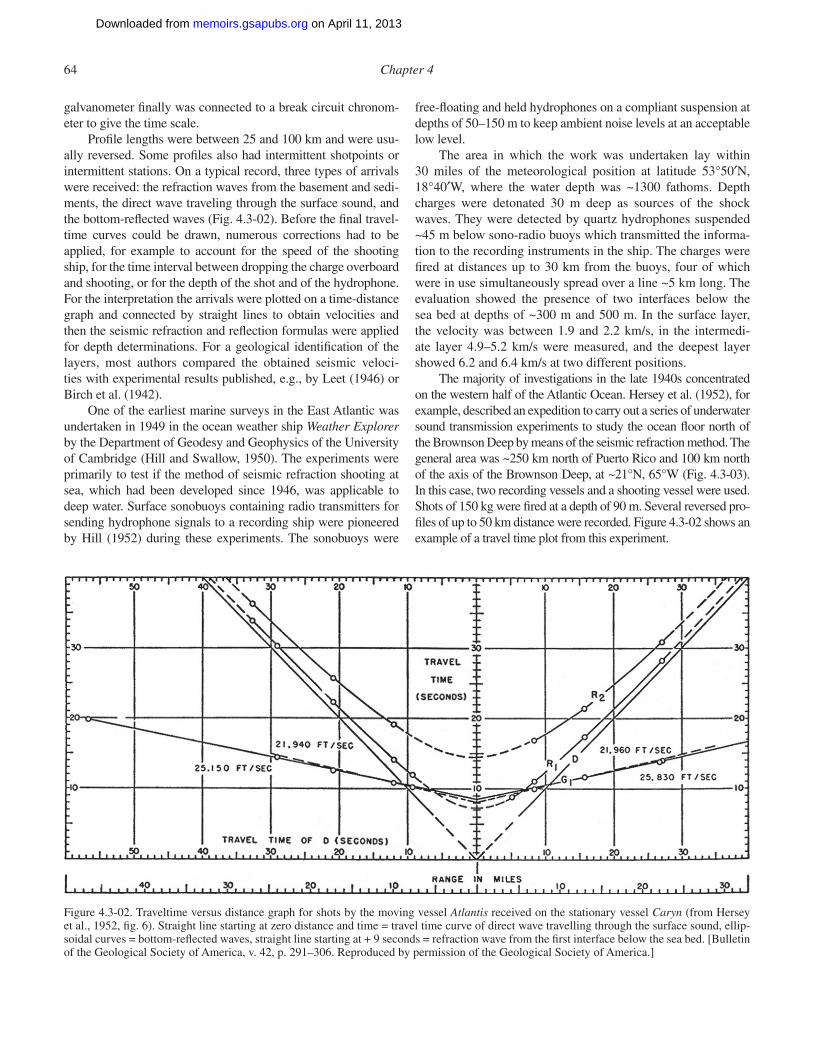
Profi le lengths were between 25 and 100 km and were usu-ally reversed. Some profi les also had intermittent shotpoints or intermittent stations. On a typical record, three types of arrivals were received: the refraction waves from the basement and sedi-ments, the direct wave traveling through the surface sound, and the bottom-refl ected waves (Fig. 4.3-02). Before the fi nal travel-time curves could be drawn, numerous corrections had to be applied , for example to account for the speed of the shooting ship, for the time interval between dropping the charge overboard and shooting, or for the depth of the shot and of the hydrophone. For the interpretation the arrivals were plotted on a time-distance graph and connected by straight lines to obtain velocities and then the seismic refraction and refl ection formulas were applied for depth determinations. For a geological identifi cation of the layers, most authors compared the obtained seismic veloci-ties with experimental results published, e.g., by Leet (1946) or Birch et al. (1942).
One of the earliest marine surveys in the East Atlantic was undertaken in 1949 in the ocean weather ship Weather Explorer by the Department of Geodesy and Geophysics of the University of Cambridge (Hill and Swallow, 1950). The experiments were primarily to test if the method of seismic refraction shooting at sea, which had been developed since 1946, was applicable to deep water. Surface sonobuoys containing radio transmitters for sending hydrophone signals to a recording ship were pioneered by Hill (1952) during these experiments. The sonobuoys were
free-fl oating and held hydrophones on a compliant suspension at depths of 50–150 m to keep ambient noise levels at an acceptable low level.
The area in which the work was undertaken lay within 30 miles of the meteorological position at latitude 53°50′N, 18°40′W, where the water depth was ~1300 fathoms. Depth charges were detonated 30 m deep as sources of the shock waves. They were detected by quartz hydrophones suspended ~45 m below sono-radio buoys which transmitted the informa-tion to the recording instruments in the ship. The charges were fi red at distances up to 30 km from the buoys, four of which were in use simultaneously spread over a line ~5 km long. The evaluation showed the presence of two inter faces below the sea bed at depths of ~300 m and 500 m. In the surface layer, the velocity was between 1.9 and 2.2 km/s, in the intermedi-ate layer 4.9–5.2 km/s were measured, and the deepest layer showed 6.2 and 6.4 km/s at two different positions.
The majority of investigations in the late 1940s concentrated on the western half of the Atlantic Ocean. Hersey et al. (1952), for example, described an expedition to carry out a series of under water sound transmission experiments to study the ocean fl oor north of the Brownson Deep by means of the seismic refraction method. The general area was ~250 km north of Puerto Rico and 100 km north of the axis of the Brownson Deep, at ~21°N, 65°W (Fig. 4.3-03). In this case, two recording vessels and a shooting vessel were used. Shots of 150 kg were fi red at a depth of 90 m. Several reversed pro-fi les of up to 50 km distance were recorded. Figure 4.3-02 shows an example of a travel time plot from this experiment.
Figure 4.3-02. Traveltime versus distance graph for shots by the moving vessel Atlantis received on the stationary vessel Caryn (from Hersey et al., 1952, fi g. 6). Straight line starting at zero distance and time = travel time curve of direct wave travelling through the surface sound, ellip-soidal curves = bottom-refl ected waves, straight line starting at + 9 seconds = refraction wave from the fi rst interface below the sea bed. [Bulletin of the Geological Society of America, v. 42, p. 291–306. Reproduced by permission of the Geological Society of America.]
64 Chapter 4
on April 11, 2013memoirs.gsapubs.orgDownloaded from

Also in the North American basin, northwest and south of Bermuda, Ewing et al. (1952) recorded six reversed seismic refraction profi les of 60–100 km length. Five of these profi les were long enough to record Pn arrivals. Ewing et al. regarded these profi les as typical for the western North Atlantic. For the sedimentary layer, an average thickness of 1.2 km and a veloc-ity of 1.4 km/s were determined; for an intermediate basement layer, a velocity of 6.4 km/s and a thickness of 4.4 km was found, and a velocity of 7.9 km/s started at a depth of 10.3 km below sea level.
Drake et al. (1952) reported on seismic refraction measure-ments in the Gulf of Maine in 1948 and 1952 as part of a pro-gram to investigate the continental margin. During these voyages, they observed sections along the coast of Maine, but they also recorded seismic data along a section from Cape Ann, Massachu-setts, to Yarmouth, Nova Scotia. Basement rocks with velocities of 4.95–5.4 km/s pinched out rapidly away from the shore on all sections, and sub-basement rocks with velocities of 5.7–6.3 km/s were found to underlie the entire Gulf of Maine.
In 1949, another marine seismic research project was carried out by Katz et al. (1953) in the Gulf of Maine. A partially reversed refraction profi le was shot across the northern Gulf from a point east of Portland eastward beyond Matinicus rock (Fig. 4.3-04). Three portable seismographs were set up at Falmouth near Port-land, Maine, on Mount Desert Island, Maine, and at Crowell, Nova Scotia, which recorded shots from 30 positions. The most distant station—Crowell, Nova Scotia—was too far to the east to obtain clear ground arrivals from most of the shots, and an engine failure of the ship stopped the shooting operation beyond shot 30. The distance ranges successfully covered were 36–131 km for Falmouth, 63–158 km for Mount Desert Island, and 116–158 km for Crowell. Interpretation using the standard method, slightly
modifi ed for interpreting reversed profi les, found a surface layer at 5.1 km depth east of Falmouth with an unreversed velocity of 5.3 km/s thinning toward east over a distance of 50 km. The underlying material had a velocity of 6.25 km/s (partly reversed), with the interface between the two layers sloping upwards to the east at ~3°.
Moho was not always detected by these marine experiments, but in some areas, velocities between 7 and 7.6 km/s were found, interpreted as a transition zone between basaltic lower crust and peridotitic upper mantle. In the area around the Bermuda islands, a depth range of 8–12 km was reported for the Moho (Ewing et al., 1952; Hersey et al., 1952).
Offshore investigations were also undertaken in the Pacifi c off California since 1948 (Raitt, 1949). Since 1948, seismic-refraction studies of the Pacifi c Ocean were made in a region extending from San Diego to the Marshall Islands and south al-most to the Tropic of Capricorn (Raitt, 1956). The investigations included three different regions: the deep Pacifi c basin proper, atolls and islands, and the continental margin of North America and continued into the early 1950s.
Along the continental shelf, the velocity in the basement in-creased from 4.5 to 6.3 km/s with increasing distance from the coast. In the ocean basin proper, west of San Diego, underneath thin sediments the thickness of the basement was determined to be 5 km and the velocity 6.5 km/s. At the crust-mantle bound-ary, the Moho, at 9 km depth below sea level, a sudden velocity increase to 8 km/s was determined.
The experiments also included seismic-refl ection shoot-ing with 5 kg TNT charges. The charges were fi red a few feet (~1–2 m) below the surface of the sea and the low-frequency re-fl ections from the bottom were received on a hydrophone hung below the ship. Among many confusing sub-bottom echoes was
Figure 4.3-03. Location of seismic-refrac-tion profi les shot in 1949 in the area of the Brownson Deep north of Jamaica (from Hersey et al., 1952, fi g. 1). [Bul-letin of the Geological Society of Amer-ica, v. 42, p. 291–306. Reproduced by permission of the Geological Society of America.]
The 1940s (1940–1950) 65
on April 11, 2013memoirs.gsapubs.orgDownloaded from

one persistent refl ection from a horizon at a depth of ~600 m below the sea bed (Hill and Swallow, 1950).
The seismic-refl ection techniques proved diffi cult in the be-ginning. Many hundreds of single-hydrophone observations re-vealed refl ecting horizons at depths greater than 1 km below the ocean fl oor. However, the echoes between widely spaced stations could not unambiguously be correlated.
4.4. STATE OF THE ART AT THE BEGINNING OF THE 1950S
The philosophy on how to obtain the structure of the crust is based on the assumption that the Earth is divided into more or less fl at layers of rocks of different physical properties and that the propagation of seismic waves follows the laws known from optics. This implies that waves are refl ected and that beyond the critical distance, head waves develop which follow the disconti-nuities and produce arrivals aligning on straight lines in a time-distance graph. Thus the methodology to interpret seismograms
in the late 1940s to the mid 1960s was to pick arrivals from the seismograms, to plot them into a time-distance graph, and to cor-relate those arrivals which were identifi ed and assumed to belong to the same phase. Those arrivals were then connected by a num-ber of straight lines with gradients interpreted as the velocity of the corresponding head waves (see, e.g., Fig. 5.2-02).
For a geological identifi cation of the layers, most authors compared the obtained seismic velocities with experimental re-sults published, e.g., by Leet (1946) or in a handbook edited by Birch et al. (1942). In this handbook, various authors had com-piled tables summarizing laboratory measurements of densities, velocities, and other physical properties of minerals and rock samples from all over the world under varying pressure and tem-perature conditions. Amongst others, the information collected by Leet and Birch (1942) on seismic velocities and summarized in tables were of particular importance.
Gutenberg (1951b) summarized what was known on the crustal structure by the end of the 1940s. He concluded that the relatively large phase P in records of nearby earthquakes, which
Figure 4.3-04. Seismic-refraction profi le across the Gulf of Maine with fi xed recording stations on land and a moving shotpoint at sea (from Katz et al., 1953, fi g. 1). [Bulletin of the Geological Society of America, v. 64, p. 249–251. Repro-duced by permission of the Geological Society of America.]
66 Chapter 4
on April 11, 2013memoirs.gsapubs.orgDownloaded from

Figure 4.4-01. Average velocities of longitudinal and of transverse waves in the Earth’s crust based on explosion records (from Gutenberg, 1955, fi g. 1). [Geological Society of America Special Paper 62, p. 19–34. Reproduced by permission of the Geological Society of America.]
TABLE 4.4-01. VELOCITIES OF LONGITUDINAL WAVES IN CONTINENTAL AREAS FROM ARTIFICIAL EXPLOSIONS (FROM GUTENBERG, 1951B, TABLE 1)
ecnerefeRnoigeRDepth(km)
Velocity(km/s)
Depth(km)
Velocity(km/s)
Depth(km)
Velocity(km/s)
Northern Germany Wiechert (1926) 0–? 5.98Northern Germany Brockamp (1931b) 0–8 5.9 8–? 6.7Helgoland Willmore (1949)
81.87259.572–7AB 6–14 5.57 14–30 6.5 30 8.18
Helgoland Schulze and Förtsch (1950) 6–11 5.34 11–27 6.2–6.6 27 8.19Black Forest Reich et al. (1948) 0–21 5.9–6.0 21–31 6.55 31 8.2Black Forest Rothé and Peterschmitt (1950) 2–20 5.97 20–30 6.54 30 8.15Canadian Shield Hodgson (1947) 0–17 6.15 17–36 6.45 36 8.20
8320.632–0)6391(teeLdnalgnEweN51.8241.7–7.624–017.6–0.601–0)8491(evuT.C.D,notgnihsaW
Southern California Wood and Richter (1931) 0–? 6.0Corona, California Gutenberg (1951a) 0–6 5.7–6.0 10–? 6.5–7 40± 8.1–8.2Corona, California Tuve and Tatel (1950b) 3–14 6.3 14–? 6.8
The 1940s (1940–1950) 67
on April 11, 2013memoirs.gsapubs.orgDownloaded from

hitherto was assumed to be the direct longitudinal wave and corresponded with its velocity of 5.6 km/s to the granitic layer, could not be reconciled with observations of the longitudinal waves from blasts. He stated that the velocity of longitudinal waves below the sediments was likely to be 6 km/s and increases to 6.5 km/s at depths of ~10 km. At greater depths between 10 and 15 km, this velocity might decrease, which was to be ex-pected in rocks with considerable amounts of quartz, based on laboratory experiments (Birch et al., 1942). At the bottom of a deeper layer with higher velocity (7.0–7.5 km/s), he expected the Mohorovičić discontinuity at a depth of 30–40 km, but deeper under some mountain chains, forming the boundary between the simatic lower crust and the ultrabasic material below with P-wave velocities of 8.2 km/s. In a table (Table 4.4-01) he sum-marized the velocities for P-waves in continental areas from arti-fi cial explosions, which corresponds to his results published in 1955 and shown in Figure 4.4-01.
Gutenberg (1951b) also pointed out that there seemed to be a greater difference between the structure of the Pacifi c Ocean and the surrounding continental areas than between the bottom of the Atlantic or Indian Oceans and their surrounding shelves and continents. In the Pacifi c, he assumed a crustal thickness of only a few kilometers, while under the Atlantic Ocean, and probably also under the Indian Ocean, he saw a more gradual transition from the continent to the basins and the Mohorovičić
Figure 4.4-02. Location map of large explosion-seismic studies of the Earth’s crust (from Reinhardt, 1954, fi g. 3). [Freiberger Forschungshefte, C15, p. 9–91. Reproduced by permission of TU Freiberg, Germany.]
TABLE 4.4-02. LOCATIONS OF LARGE EXPLOSION-SEISMIC STUDIES OF THE EARTH’S CRUST AS SHOWN IN FIGURES 4.4-02 AND 4.4-03
noitacoL.oN 1 Oppau, Haslach, Southern Germany, Blaubeuren 2 Göttingen, Kahla (central Germany) 3 La Courtine (France) 4 Burton-on-Trent (England) 5 Soltau, Heligoland (Northern Germany) 6 Denmark 7 Southern California 8 Richmond, Port Chicago (Northern California) 9 New England10 Kirkland Lake (Eastern Canada)11 New Mexico12 Bikini13 Big Horn County, Montana14 Pennsylvania, Appalachians15 Northeastern Japan16 Western Transvaal (South Africa)17 Soviet Republic of Georgia 18 Tien-Shan (USSR)19 Californian coast (East Pacifi c)20 Gulf of Maine21 NW Bermuda, North American Basin (western Atlantic)22 N Brownson Deep (western Atlantic)23 Eastern Atlantic24–26 Atlantic (Martinique, Bermuda), (western Atlantic)27–31 Northern Atlantic (western Atlantic)32 Bermuda (western Atlantic)33–43 Pacifi c (central Pacifi c, western Pacifi c)44 Newfoundland
68 Chapter 4
on April 11, 2013memoirs.gsapubs.orgDownloaded from
discontinuity at greater depths than under the Pacifi c but much shallower than under continents.
In 1954, a symposium was held at Columbia University (“The Crust of the Earth”) where results of earthquake and explosion-seismic studies achieved until 1954 were presented (Poldervaart , 1955). Gutenberg (1955) summarized the velocity values published from earthquake observations from 1948 to 1954 and the corresponding depths for the Conrad and Mohorovičić discontinuities. In addition, he summarized sepa-rately apparent wave velocities and depth values obtained from blasts and rock bursts, including some early results from deep ocean basins (Fig. 4.4-01).
Ewing and Press (1955) pointed to the essential difference between oceanic and continental crust, with the silicic crust under ocean basins being no more than one fi fth of that under conti-nents. They also saw a remarkable unity of results reported for the oceanic crust: It is a layer of mafi c rocks somewhat less than 5 km thick with P-wave velocity of 6.4–6.9 km/s. The Moho is at
10–11 km beneath the sea surface and is underlain by ultra mafi c rocks with 7.9–8.2 km/s P-wave velocities. They also pointed out that the crust under the Gulf of Mexico, the Caribbean, and the Mediterranean resembles the oceanic type rather than the conti-nental type.
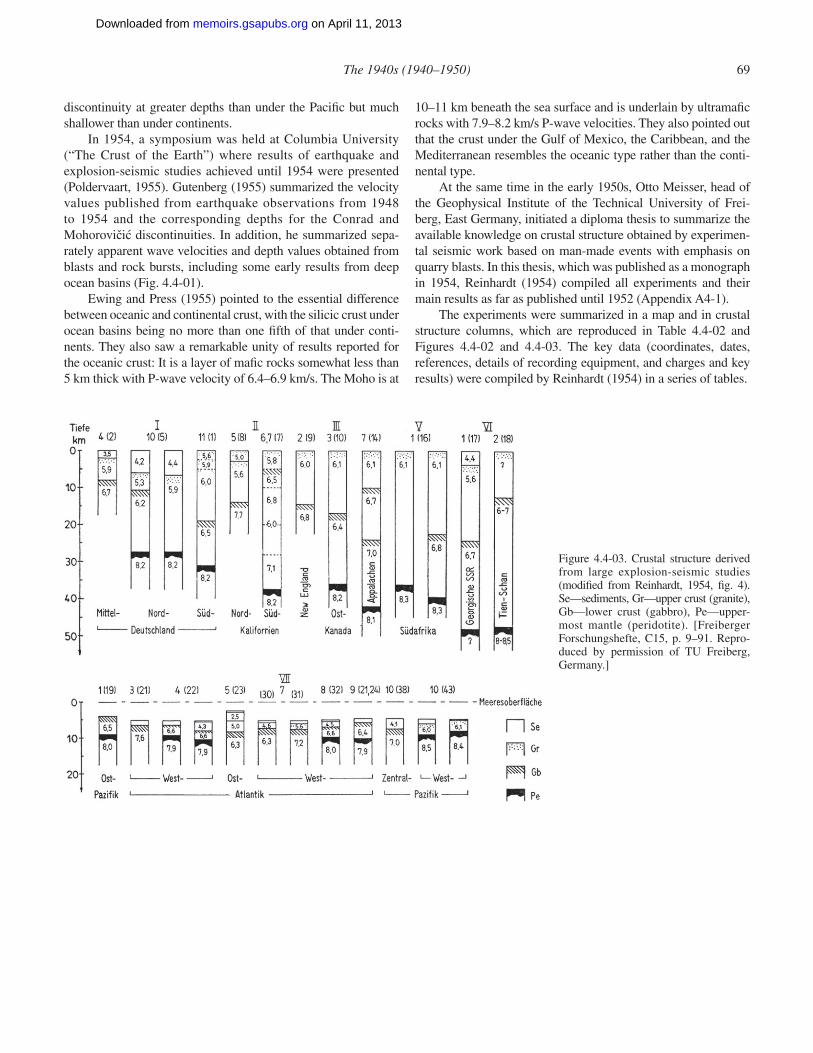
At the same time in the early 1950s, Otto Meisser, head of the Geophysical Institute of the Technical University of Frei-berg, East Germany, initiated a diploma thesis to summarize the available knowledge on crustal structure obtained by experimen-tal seismic work based on man-made events with emphasis on quarry blasts. In this thesis, which was published as a monograph in 1954, Reinhardt (1954) compiled all experiments and their main results as far as published until 1952 (Appendix A4-1).
The experiments were summarized in a map and in crustal structure columns, which are reproduced in Table 4.4-02 and Figures 4.4-02 and 4.4-03. The key data (coordinates, dates, references, details of recording equipment, and charges and key results ) were compiled by Reinhardt (1954) in a series of tables.
Figure 4.4-03. Crustal structure derived from large explosion-seismic studies (modifi ed from Reinhardt, 1954, fi g. 4). Se—sediments, Gr—upper crust (granite ), Gb—lower crust (gabbro), Pe—upper-most mantle (peridotite). [Freiberger Forschungshefte, C15, p. 9–91. Repro-duced by permission of TU Freiberg, Germany.]
The 1940s (1940–1950) 69
on April 11, 2013memoirs.gsapubs.orgDownloaded from
