geometric manipulation method for evaluation of …
TRANSCRIPT

INTERNATIONAL CONFERENCE ON ENGINEERING DESIGN, ICED11 15 - 18 AUGUST 2011, TECHNICAL UNIVERSITY OF DENMARK
GEOMETRIC MANIPULATION METHOD FOR EVALUATION OF AESTHETIC QUALITY IN EARLY DESIGN PHASES T. Stoll1, A. Stockinger1 and S. Wartzack(1) Chair of Engineering Design, University of Erlangen-Nuremberg
1
ABSTRACT Whenever products are manufactured there are deviations from the ideal geometry defined in the CAD-system. In this contribution a prototype is presented which allows a user to set up non-ideal visualizations of slightly deformed parts easily and quickly. The method can be used in the early stages of product development to ensure that aesthetic quality is taken into account before a real product has been manufactured. Very important key criteria for the appearance of several products, e.g. automotive car bodies or consumer products are gap and flush measurements. Therefore the developed method allows an intuitive and fast way to generate visualizations which can be used in design reviews. By using efficient data structures for the calculation of the deformation it is possible to change the shape of objects interactively during the design review itself. A case study has been performed to show that it’s possible to generate simulations which are close to the output of manufacturing simulations.
Keywords: visualization, aesthetic quality, manufacturing simulation, deviations, tolerances
1. INTRODUCTION The aesthetic quality of products is of great importance in many areas. Changes to already manufactured products are very costly. Therefore it is crucial that the assurance of optical quality of a product is integrated in the product development process as early as possible. Tolerance analysis methods are used to predict the impact of deviations on several key criteria of a product before it has been produced. To reduce the computational difficulty of calculating these values, the effect of each tolerance is reduced to a single value which can vary according to a specified distribution curve. This prohibits a direct visualisation of geometry resulting from the tolerance definition [1]. In this paper a method is presented which enables a user to generate non-ideal assemblies with different gap and flush measurements. The results using this method on a case study are compared to an assembly built of parts resulting from manufacturing simulation. The main goals of the method are to provide an intuitive and easy to use tool, which can be applied as early as possible in the product development process. The most important aesthetic quality targets of some products (e.g. cars) are gap and flush measurements between parts lying close together. The term “gap” corresponds to the smallest distance between two parts, while “flush” is defined as the distance in orthogonal direction, see Figure 1.
gap flush
Figure 1: Definition of gap and flush
The term “gap line” refers to a line along the gap, see Figure 2. The gap direction at each point can be calculated by finding the closest point on surrounding parts. The flush direction is afterwards obtained by the cross product of the gap direction and the tangent of the gap line.

Figure 2: a gap line between two parts
2. RELATED WORK There are some other tools which enable the visualization of non-ideal gap and flush measurements. In Aesthetica [2] the user can manually define gap and flush direction at arbitrary points around the gap. On each of these points a new value for gap and flush can be set. The software then automatically translates and rotates each part so that the resulting gap and flush values are as close as possible to the previously specified values. The parts which are allowed to be moved can be selected. Additionally there is the possibility to change the shape of the objects by a method which can be calculated fast, and enables to generate non-ideal parts which are close to finite element simulations [15]. The needed triangle meshes can be generated with user controlled resolution. Another method called “DefoVis” [3] was presented by UNGEMACH. It allows the user to define how much a part should be deformed at certain measurement points. For the part which has to be deformed a finite element simulation is performed. The generated stiffness matrix is then used to generate a response surface model [4] which can calculate the deformations of each point of the triangular mesh of the part which is visualized. Once the response surface model is generated the deformations can be calculated interactively for different deformations at the defined measurement points specified at the beginning. The used finite element simulation takes a certain amount of time and requires the availability of material properties. If they are available “DefoVis” is a reasonable choice. “DefoVis” is implemented a commercial tolerance analysis tool 3DCS (DCS Inc.). If no finite element simulation is available the user of 3DCS has the possibility to utilize the “influence sphere method”. There he can set a radius around the points were the deformations are defined. Inside this radius all coordinates of the triangle points of the mesh are changed. This is a simplified version of the method presented in [5]. It is often difficult to set the values for the radius. If it’s too small very many points have to be defined, if it is too big there may be deformations at other gap lines in proximity to the point.
3. DEFINITION OF GAP LINE To generate a visualization of non-ideal assemblies, we have chosen triangular meshes for representation of the parts and assemblies. This is the basis for an interactive manipulation of the nominal geometry. Also visualization is benefited because no remeshing of the internal geometry representation is required in contrast to other approaches like NURBS. The user at first has to specify how the different parts should be deformed. As the software should be used while a design review takes place, the definition of the gap line should be as easy as possible. Therefore a method has been designed, which only requires the user to choose the part, and the start- and endpoint of the gap line he wants to specify (see Figure 3). The resulting gap line is calculated by a modified DIJKSTRA algorithm. To utilize the algorithm each part has to consist of a uniform and linked triangle mesh without T-vertices. To ensure a high visualization quality the error of tessellation has to be controlled. Moreover the maximum length of the edges has to be constrained, because flat surfaces tend to be meshes with a few, big triangles only. This results in disadvantages for the chosen algorithm which leads to bad

visualization quality. In our approach this can easily be achieved by using a mesher which allows the definition of both values [16].
Figure 3: a gap line specified by a start- and endpoint
DIJKSTRA’S algorithm finds the shortest path along the edges of a graph between two vertices of the graph [6]. In our case the graph is represented by the triangle mesh of the part. Generally the euclidean distance between the start- and endpoint of an edge is used as a weighting for the DIJKSTRA algorithm. As the gap line is not identical with the shortest path the weighting of each edge is calculated differently in our approach.
Figure 4: undesirable branch offs in 90 degree angles along the gap line
Despite the length of the path it’s important that the gap line is smooth and that the distances from the points of the gap line to the surrounding parts are about the same. As the gap line may have different gap values at the start- and endpoints, the gap sizes may vary along the gap line, but the differences of two points of the gap line lying close together should be as small as possible. Figure 4 shows some undesirable branch offs in 90 degree angles along the gap line. But it is very important that the gap line is smooth, as the flush direction is calculated by the cross product of the tangent of the gap line and the gap direction. If the line is not smooth artifacts will occur at the areas where the discontinuities appear, as the flush direction is wrongly calculated at these points.

Figure 5: calculation of the weight of an edge
To assure that the gap line fulfils the defined requirements there are different weighting functions (it is assumed that the vectors pv and pn
• length of edge: are normalized):
( ) nnn pppl *= • angle between edge and predecessor:
( ) ( )arccos *n v np p pα = • distance to the next part:
( ) ( ) ( )( )ann PdistPdistpd −= The defined functions had to be put together by mathematical operators to calculate the weight of an edge. Experiments with different factors and operators have shown that it’s best to add all functions. The distance function d should be multiplied by a rather large factor before it is added to the remaining two other functions. Multiplication of the functions does work in most cases, too. But there are problems if there are rather short edges with an angle between the edge and its predecessor close to 90 degrees. In that case the gap line will have 90 degree angles at some points, which have to be avoided since the flush direction will be calculated wrong in that case. The used weighting function for the gap lines detected in Figure 6 was l+α+50*d. This weighting function – obtained by testing several critical gap lines and functions – is implemented in the code and cannot be changed by the user. In all test cases the determined function was suitable and showed reproducible results. If necessary, the possibility to change the weighting function by the user could be implemented in future. With the developed method it is possible to calculate the gap line automatically simply by choosing the start- and endpoint of the desired gap line. If an additional gap line has to be defined while a discussion or design review takes place, the new line can be generated in a few seconds.
Pv Pa
Pn
pv
pn
( )adist P
( )ndist P

Figure 6: detected gap lines on a front car body with the developed algorithm
4. CALCULATION OF THE DEFORMATION After the gap line is detected the parts have to be deformed. At first the developed algorithm is shown with a single gap line. Thereafter it is explained how the method can be adjusted so that multiple gap lines can be deformed. Then it is explained how pre-computations can be used to speed up the algorithm so that the deformation can be performed interactively.
4.1 Calculation of the deformation for one gap line To deform the part the coordinates of the points of the triangle mesh are changed. Figure 7 shows exemplarily how the changes are computed for one point p. It is assumed that the gapline from the startpoint S to the endpoint E is already calculated with the algorithm presented in section 3. The user also has specified to what extent the gap and flush should be changed at startpoint S and endpoint E.
Figure 7: Calculating the deformation at a point on the triangle mesh
At first the nearest point n on the gap line is calculated. Then the surrounding vertices f1 and f2 on the gap line are determined, and the gap and flush directions (s1 and s2) are calculated at these two vertices. To get the amount of deformation in gap and flush direction at the vertices f1 and f2, the values the user specified for the start- and endpoint are interpolated linearly. The resulting values are multiplied by the normalized gap and flush directions at each of the vertices. To calculate the deformation at each vertex the deformation in gap and flush direction are added. To get the final deformation of the point p the calculated vectors at f1 and f2 are interpolated linearly (the distance between f1 and n is used as interpolation value). As the deformation should only be applied to points lying in proximity to the gap line the amount of deformation is reduced after a user specified distance to the gap line (called first border for the rest of the paper). At a second border the points are not
S E
f2
n
p
f1
s1 s2
k
kn
s

deformed. The reduction between the first and second border is calculated by a polynomial interpolation function (see Formula 1).
23 32)( xxxf +−= (1) The first and second border can be set by the user according to the desired range of the deformation. If the size of the edges of the mesh is inadequate the deformation will not appear smooth because the vertices are manipulated and the edges remain straight. In order to obtain a smooth appearance the distance between first and second border has to be at least 5 times the maximum edge length. With the presented algorithm it is possible to change the appearance of arbitrary gap lines fast and intuitively. As an example a curved gap line between a lamp and a fender has been changed, see Figure 8.
Figure 8: a deformed gap between a lamp and a fender
4.2 Calculation of the deformation for multiple gap lines In most cases the gaps which have to be surveyed lie close together, so there must be the possibility to change the shape of gap lines which lie in proximity. If there are two gap lines lying close together, there are different cases how the lines should be deformed, see Figure 9.
Figure 9: different cases if more than one gap line is defined at a single part
gap line
2nd case 1st case
triangle point closest point
3rd case
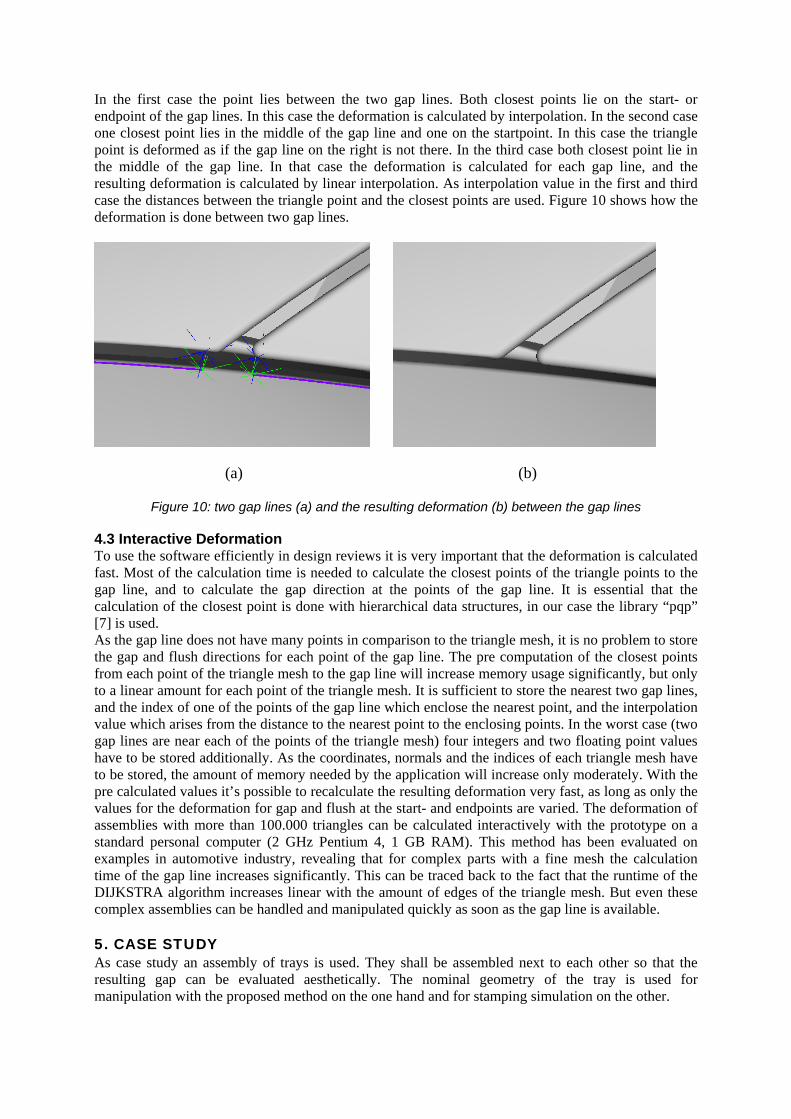
In the first case the point lies between the two gap lines. Both closest points lie on the start- or endpoint of the gap lines. In this case the deformation is calculated by interpolation. In the second case one closest point lies in the middle of the gap line and one on the startpoint. In this case the triangle point is deformed as if the gap line on the right is not there. In the third case both closest point lie in the middle of the gap line. In that case the deformation is calculated for each gap line, and the resulting deformation is calculated by linear interpolation. As interpolation value in the first and third case the distances between the triangle point and the closest points are used. Figure 10 shows how the deformation is done between two gap lines.
(a) (b)
Figure 10: two gap lines (a) and the resulting deformation (b) between the gap lines
4.3 Interactive Deformation To use the software efficiently in design reviews it is very important that the deformation is calculated fast. Most of the calculation time is needed to calculate the closest points of the triangle points to the gap line, and to calculate the gap direction at the points of the gap line. It is essential that the calculation of the closest point is done with hierarchical data structures, in our case the library “pqp” [7] is used. As the gap line does not have many points in comparison to the triangle mesh, it is no problem to store the gap and flush directions for each point of the gap line. The pre computation of the closest points from each point of the triangle mesh to the gap line will increase memory usage significantly, but only to a linear amount for each point of the triangle mesh. It is sufficient to store the nearest two gap lines, and the index of one of the points of the gap line which enclose the nearest point, and the interpolation value which arises from the distance to the nearest point to the enclosing points. In the worst case (two gap lines are near each of the points of the triangle mesh) four integers and two floating point values have to be stored additionally. As the coordinates, normals and the indices of each triangle mesh have to be stored, the amount of memory needed by the application will increase only moderately. With the pre calculated values it’s possible to recalculate the resulting deformation very fast, as long as only the values for the deformation for gap and flush at the start- and endpoints are varied. The deformation of assemblies with more than 100.000 triangles can be calculated interactively with the prototype on a standard personal computer (2 GHz Pentium 4, 1 GB RAM). This method has been evaluated on examples in automotive industry, revealing that for complex parts with a fine mesh the calculation time of the gap line increases significantly. This can be traced back to the fact that the runtime of the DIJKSTRA algorithm increases linear with the amount of edges of the triangle mesh. But even these complex assemblies can be handled and manipulated quickly as soon as the gap line is available.
5. CASE STUDY As case study an assembly of trays is used. They shall be assembled next to each other so that the resulting gap can be evaluated aesthetically. The nominal geometry of the tray is used for manipulation with the proposed method on the one hand and for stamping simulation on the other.

5.1 Manufacturing SImulation Whereas tolerancing tools are used to obtain information on the effect of geometric deviations by estimations, there is the possibility to obtain a quite realistic behaviour using manufacturing simulation. Considering an automotive car body or a consumer product (white goods) a series of manufacturing processes and steps are involved. Assuming that for example the moulding or stamping processes are the ones that contribute significantly to the geometric deviations in the final product these have to be virtually simulated. In this paper the sheet metal forming process is chosen because of the following reasons: • availability of powerful simulation tools employing accurate material models and taking
multistage process steps into account (gravity, holding, stamping, trimming, springback) [8], [9], • highly geometry-dependent process and so, • non- or hardly-tabulariseable geometric deviations like springback [10] and thickness
distributions [9], • range of simulated deviations is in similar magnitude as tolerances of sheet metal parts [9], • wide use in automotive industry for parts in car body assemblies [10]. The use of simulation software allows a virtual analysis of the metal forming process. Stamping is a process which is liable for a multitude of influences. In order to obtain reliable results it is required that FE-based software allows the regard of pivotal parameters of the process. These parameters can be split up into sections material, workpiece and process parameters. The simulation is performed employing explicit and implicit FE-simulation runs to obtain feasibility and springback characteristics. Unfortunately these calculations are numerically expensive, so that the designers usually do not have this information available at an early phase in the product development process. Therefore the proposed approach to dynamically modify the geometry (changing gap and flush) seems to be a reasonable way to support designers and engineers. So they are enabled to find a good aesthetic product design. But it is examined in this paper in detail if the obtained geometries from the geometry manipulation method meet the deviation characteristics of the stamped parts. Therefore assembly geometries of manipulated on the one hand and stamped parts on the other hand are compared. To virtually predict the feasibility and geometric deviations for a single part a simulation model is set up. The geometry and stamping procedure for this case study are taken from and according to [8]. As calculation tool PAM STAMP 2G is chosen, because of its ease of use and its possibility to access a plenty of numeric, process, material and work piece parameters. The simulation model is set up with rigid tooling which consists of punch, blank holder, die, guides and drawbeads. The blank and the tooling are meshed with finite elements. The process consists of a gravity step, a holding phase and a stamping step, in which the blank is deformed and a further step, in which the springback of the blank is calculated. This calculation depends a lot on a series of parameters like work piece, material and process parameters on the feasibility of the part as shown in [11], [12], and the geometric variations as shown in [13], [14] as well. To keep this case study simple no stochastic evaluation like in [14] is performed but the mean values of the crucial parameters are used for stamping simulation. The result of the stamping process is shown in Figure 11.

Figure 11: case study geometry of the stamped part with deviations calculated by the manufacturing simulation
5.2 Gap and Flush Deformation for the case study The main difference which leads to different gap and flush sizes is the deformation at the long right side (Figure 11). It is possible to generate quite similar parts with the developed prototype by selecting the upper right and left point of the tray shown in Figure 12 and selecting zero deviation for gap and flush at the lower point, and 3 mm for gap and 4 mm for flush at the upper point. Without further adoption of the method it is not possible to simulate small details calculated by the manufacturing simulation (e.g. the small red area with high deviation near the upper right corner). However, the coarse deviations can be modeled very fast with the tool (Figure 13), and enables the definition of aesthetic key criteria early in the design process. In the very early phases of the product development it is very important that precise quality targets are known. In the case of aesthetic quality requirements it is possible to generate different visualizations with the proposed method by varying the values for gap and flush measurements slightly. Therefore the method helps to determine meaningful upper and lower boundaries for important quality targets efficiently.
Figure 12: definition of the gap line of the tray with start- and endpoint (green) and closest
point on surrounding geometry (blue)

(a) (b)
(c) (d) Figure 13: visualizations of ideal (a, c) and deformed tray with different gap (b) and flush (d)
measurements
7. CONCLUSION A method has been presented which enables a user to set up visualizations of non-ideal geometry with different gap and flush measurements. The software can be used intuitively, and visualizations can be generated very fast. It is possible to utilize it while a design review takes place. As long as the geometry of the visible parts is available as a fine and accurate triangle mesh no further data preparation has to be made. Compared to the DefoVis method no time-consuming modelling and computationally expensive Finite-Element-calculations are required. Therefore no material information is needed using our approach. But on the other hand the elastic behaviour is omitted in our case. Compared to Aesthetica [2] the gap line and the directions of gap and flush measurements are calculated almost automatically. The user only has to specify start- and endpoints of the gap lines that should be changed. The user does not need to set datum reference points and loads at the mounting points. The method can be used quickly during design reviews in the early phases of the product development process. Quality issues can be discussed, even if a plenty of information (e.g. manufacturing processes or material information) is missing. The generated nonideal parts are only an approximation disregarding physical effects. The variation of geometry affects only the selected area around the gap line, which is a requirement demanded by the users (i.e. designers and tolerance planning specialists), since there is often a lack of information and many uncertainties in the early phases of product development. Moreover the method enhances the communication between tolerance specialists, product developers and designers and thus allows a more robust definition of critical gap and flush measurements early in the product development process. To assure that the method can be used for different products a case
8mm 5mm
4mm 0mm

study with a tray has been performed. In the case study it is shown that the coarse properties of the non-ideal assembly resulting from stamping can be visualized with the prototype.
REFERENCES [1] Hong, Y. S.; Chang, T.-C.: A comprehensive review of tolerancing research. International
Journal of Production Research Vol. 40, No. 11, 2002, pp. 2425 - 2459. [2] Maxfield, J.; Dew, P.; Zhao, J.; Juster, N.; Fitchie, M.: A Virtual Environment for Aesthetic
Quality Assessment of Flexible Assemblies in the Automotive Design Process. In: SAE 2002 World Congress, Detroit: Society of Automotive Engineers, Inc., 2002, pp. 209 - 217.
[3] Ungemach, G.; Mantwill, F.; Rund, M.: Visualisation of Component Deformation for Virtual Quality Assessment. ATZ, Volume 110, No. 6, 2008, pp. 76 - 79.
[4] Myers, R.H.; Montgomery, D.C.: Response Surface Methodology: Process and Product Optimization Using Designed Experiments, New York: Jon Whiley & Sons, Inc., 1995
[5] Stoll, T.; Paetzold, K.: Gap and Flush Visualization of Virtual Nonideal Prototypes. In: Proceedings of the 10th International Design Conference, Dubrovnic: Design Society, 2008, pp. 681 - 688.
[6] Dijkstra, E.W.: A note on two Problems in Connexion with Graphs, Numerische Mathematik 1, pp. 269-271, 1959.
[7] Larsen, E.; Gottschalk, S.; Lin, M.C.; Manocha, D.: Fast Proximity Queries with Swept Sphere Volumes, Proc. IEEE Int. Conf. Robot. Autom., 2000, pp. 3719-3726.
[8] N.N., 2007: User’s Guide - PAM-STAMP 2G 2007, Version Mai 2007, ESI Group, 2007. [9] Jansson, T., et. al., 2007: Reliability analysis of a sheet metal forming process using Monte Carlo
analysis and metamodels, J. Mater. Process.Tech. (2007), doi 10.1016/j.jmatprotec.200709.005.
[10] Roll, K.; et. al., 2005: Possibilities and Strategies for Simulations and Compensation for Springback. Numi Sheet 2005. Bd. 778 (2005), S. 295–302
[11] Gödel, V.; Annen, C.; Merklein, M.: Material Modeling for Stochastic Simulation. In: Proceedings of the 50th IDDRG conference 2010 (International Deep-Drawing Research Group). Graz: o.V., 2010, S. 1 - 10.
[12] Annen, C.; Pillatsch, P.; Hora, P.: Metamodelling based Planning and Control of Sheet Metal Forming Processes. In: Proceedings of the 50th IDDRG conference 2010 (International Deep-Drawing Research Group). Graz: o.V., 2010, S. 799 - 808.
[13] Stockinger, A.; Meerkamm, H.: Concept for the Integration of Manufacturing Simulations into Tolerance Analysis. 11th CIRP International Conference on Computer Aided Tolerancing, Annecy, 2009. S. 1 - 7.
[14] Stockinger, A.; Wittmann, S.; Martinek, M.; Meerkamm, H.; Wartzack, S.: Virtual Assembly Analysis: Standard Tolerance Analysis Compared to Manufacturing Simulation and Relative Positioning. In: Marjanovic D., Štorga M., Pavkovic N., Bojcetic N. (Hrsg.): Proceedings of the 11th International Design Conference DESIGN 2010, Dubrovnik: 2010, S. 1421 - 1430.
[15] Scheck, H.-J.: The Force Density Method for Form Finding and Computation of General Networks. Computer Methods in Applied Mechanics and Engineering. Amsterdam, Bd. 3 (1974), S. 115 / 134
[16] Sussner, G.: Methoden zur Erzeugung und Darstellung von tessellierten Daten im Kontext der interaktiven virtuellen Qualitätskontrolle in der Fahrzeugentwicklung. PhD thesis University of Erlangen-Nuremberg.

Contact: Dr.-Ing. A. Stockinger Chair of Engineering Design Friedrich-Alexander University of Erlangen-Nuremberg Martensstr. 9 D-91058 Erlangen Germany Phone +49 (0)9131/85-23217 Fax +49 (0)9131/85-23223 E-mail [email protected] URL www.mfk.uni-erlangen.de
Researcher T. Stoll is a scientific employee at the chair of Engineering Design of the University of Erlangen-Nuremberg. He works in the computer aided tolerancing group of the chair, his special research interest is in the generation of specifications for gap and flush measurements early in the product development process.
Researcher A. Stockinger is team leader at the Chair of Engineering Design of University of Erlangen-Nuremberg. He studied mechanical engineering in Erlangen and received his PhD in the field of computer aided tolerancing and robust design. He also works in the computer aided tolerancing group of the chair. His special research interest is in the fields of numeric methods for tolerance analysis and tolerance optimisation.
Prof. Dr.-Ing. Sandro Wartzack is head of the Chair of Engineering Design at the Friedrich-Alexander-University of Erlangen-Nuremberg, where he also received his PhD in 2000 and studied mechanical engineering some years before. After finalization of his PhD Study he was employed in an international automotive supplier company as director of virtual product development. Currently, he is member of the Design Society, honorary member of TechNet Alliance, member of Berliner Kreis, member of VDI, member of the scientific committee of ICED, DESIGN Conference and CIRP Conference on Computer Aided Tolerancing, expert advisory board member of the conference 'plastics+simulation', Editor of the Symposium DFX, as well as SIG Leader of the SIG 'Decision Making' in the Design Society.