geomorphological study of atagad basin, chamoli district, … · this study has been carried out to...
TRANSCRIPT

INTERNATIONAL JOURNAL OF GEOMATICS AND GEOSCIENCES
Volume 2, No 2, 2011
© Copyright 2010 All rights reserved Integrated Publishing services
Research article ISSN 0976 – 4380
Submitted on September 2011 published on November 2011 595
Geomorphological study of Atagad Basin, Chamoli District, Uttarakhand:
GIS and Remote Sensing approaches Khanduri Kamlesh
1, Kumar Satyendra
2
1- D.Phil Research Scholar, Dpt. of Geography, HNBGU, JRF, FSI, Dehradun, India
2- Technical Associate, JRF, Forest Survey of India (FSI), Dehradun, India
ABSTRACT
Geomorphology is the science of evolution of landforms in terms of its lithology, structure,
basin geometry and other morphometric factors. The main object is to map the land system
into further various Landform unit and features through geomorphic approach in Atagad
Basin. This study has been carried out to create the geomorphologic parts of Atagad
Catchment. Geomorphologic maps were prepared using Satellite images (Landsat ETM+,TM,
MSS ,SRTM )and digital SOI topographic sheet of the region; this was further updated
during post field work. Digital Elevation Model (DEM) generation based on topographical
sheet was prepared for creating relief map, slope map and erosion intensity zone as well as
drainage map with the help of topographic sheets, the generation of various thematic layers
has also been developed. Land Use/Cover over the study area has been analyzed for the time
periods of 2008. Various theme maps (erosion intensity, LST) were generated for GIS study
analysis is done to analyze the instability and morphology of the catchment area.
Keywords: DEM, Geomorphology, GIS& Remote Sensing, LST, Land use.
1. Introduction
The Atagad basin is one of the important valleys of Chamoli district. It has an area of 118sq.
km. Attagad The area presents an undulating and rugged terrain with highly mountainous,
precipitous ridges interspaced by deep gorge and Valley.
Area km2 Surface area (3D) km
2 Km
3
119.0 209.2 108.1
Geomorphologically the area is in a young stage and the erosion is comparatively rapid. The
slopes are steep and unstable. Attagad is the main River which crosses the area. Attagad is a
tributary of River Pindar, which is a major tributary of River Alaknanda. Attagad River flows
down from a height of 3119 meters through Malla Chandpur Reserve Forest and joins Pindar
at Simli. Upto the diversion site the length of River is 18.70 km. Attagad is a perennial rain
fed stream. The drainage is basically dendritic to sub dendritic and sub parallel. The River
bed is full of large boulders. The rocks of the area are represented by Garhwal Group, which
forms the major part of the lesser Himalaya. It is represented by low grade metasediments
consisting of quartzite with penecontemporaneous metavolcanics and carbonate rocks.
2. Study Area
The Atagad basin which is one of the important basin of Chamoli district,Uttarakhand . It has
an area of 119sq. km., approximately extending from 30o 5’ 28” to 30
o 13’ 45” N latitude and
79o
6’ 27” to 79o
15’ 40” E longitude.
Geomorphological study of Atagad Basin, Chamoli District, Uttarakhand: GIS and Remote Sensing
approaches
Khanduri Kamlesh
International Journal of Geomatics and Geosciences
Volume 2 Issue 2, 2011 596
Satellites Data
Landsat(ETM,TM,MSS)&SRTM
Topographic Sheets Geometric Correction
Subset Catchment Area Prepare Landuse Cover
Map
Create DEM
Relief Map Slope Map Aspect Map 3D Map
Flow Chart of Methodology
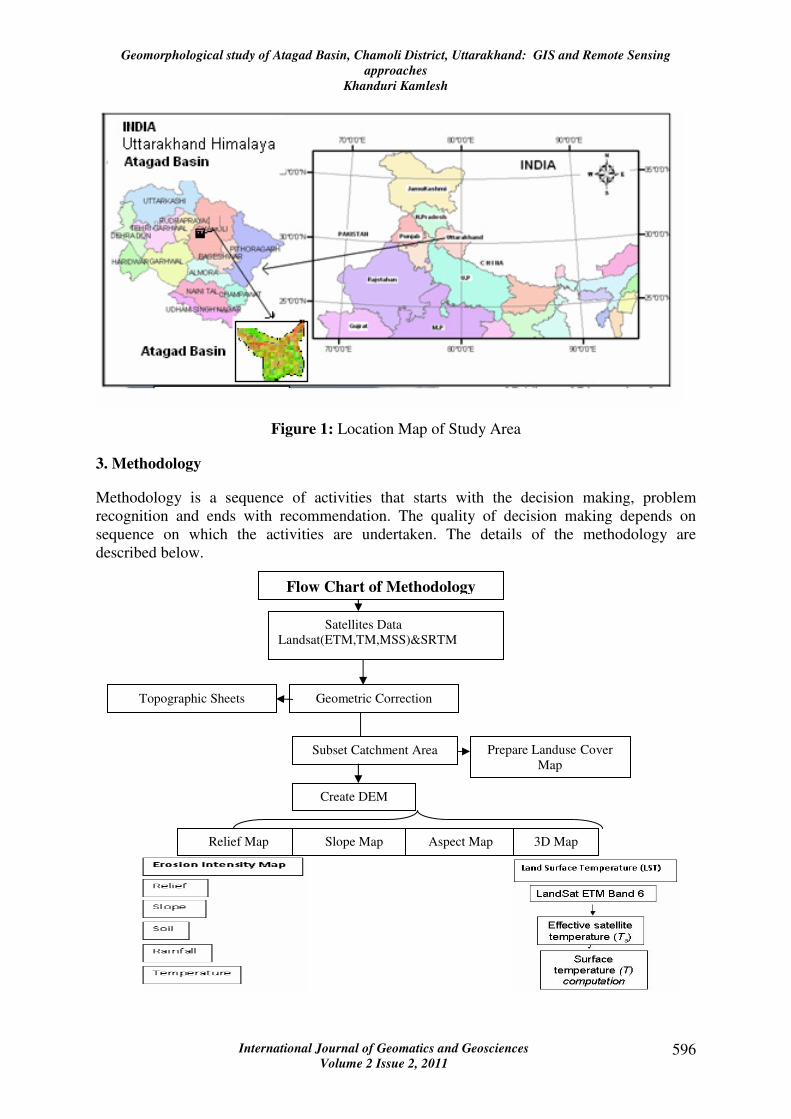
Figure 1: Location Map of Study Area
3. Methodology
Methodology is a sequence of activities that starts with the decision making, problem
recognition and ends with recommendation. The quality of decision making depends on
sequence on which the activities are undertaken. The details of the methodology are
described below.
Geomorphological study of Atagad Basin, Chamoli District, Uttarakhand: GIS and Remote Sensing
approaches
Khanduri Kamlesh
International Journal of Geomatics and Geosciences
Volume 2 Issue 2, 2011 597
4. Results & Discussions
This study Based on a brief reconnaissance survey with added information from previous
research in the study area, a classification scheme was developed for the study area after
Anderson et al., (1967). The classification scheme developed gives a broad classification
where the land use, LST and DEM were identified by a single digit. The results are presented
in form of maps, charts and statistical tables.
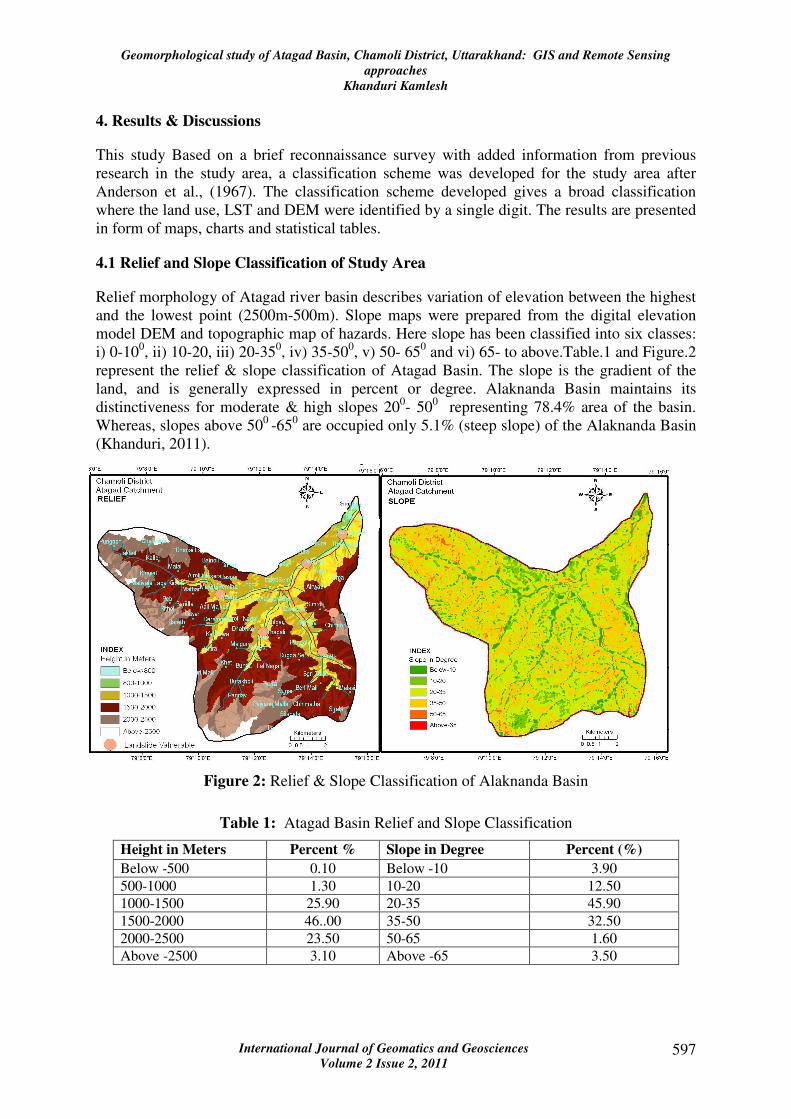
4.1 Relief and Slope Classification of Study Area
Relief morphology of Atagad river basin describes variation of elevation between the highest
and the lowest point (2500m-500m). Slope maps were prepared from the digital elevation
model DEM and topographic map of hazards. Here slope has been classified into six classes:
i) 0-100, ii) 10-20, iii) 20-35
0, iv) 35-50
0, v) 50- 65
0 and vi) 65- to above.Table.1 and Figure.2
represent the relief & slope classification of Atagad Basin. The slope is the gradient of the
land, and is generally expressed in percent or degree. Alaknanda Basin maintains its
distinctiveness for moderate & high slopes 200- 50
0 representing 78.4% area of the basin.
Whereas, slopes above 500
-650 are occupied only 5.1% (steep slope) of the Alaknanda Basin
(Khanduri, 2011).
Figure 2: Relief & Slope Classification of Alaknanda Basin
Table 1: Atagad Basin Relief and Slope Classification
Height in Meters Percent % Slope in Degree Percent (%)
Below -500 0.10 Below -10 3.90
500-1000 1.30 10-20 12.50
1000-1500 25.90 20-35 45.90
1500-2000 46..00 35-50 32.50
2000-2500 23.50 50-65 1.60
Above -2500 3.10 Above -65 3.50

Geomorphological study of Atagad Basin, Chamoli District, Uttarakhand: GIS and Remote Sensing
approaches
Khanduri Kamlesh
International Journal of Geomatics and Geosciences
Volume 2 Issue 2, 2011 598
4.2 Land Surface Temperature (LST) Classification
The classified Landsat TM(Thematic Layer) imagery of October 1990-2005 indicates an
obvious gradual thermal change or LST . Wasteland and vacant land have also highest LST
(220C-24
0C) . The vegetation covers area, water bodies and cultivated land have the least
with (140C-22
0C). Temperature increased by 1.02
0 during these 15 years period (1990-2005).
Table.2 and Figure.3 depicts the Land Surface temperature (LST) change for the year 1990-
2005 in Atagad Catchment area.
Table 2: Land Surface Temperature Classification for the Year (1990-2005)
Class of
Temp.(C0)
Atagad Temp.1990 (%) Atagad Temp. 2005(%)
Below-10 20.41 1.4
10-20 34.17 43.92
15-20 26.79 31.63
20-25 17.17 19.63
Above-25 1.45 3.79
Figure 3: Landsurface Temperature Classification of Alaknanda Basin
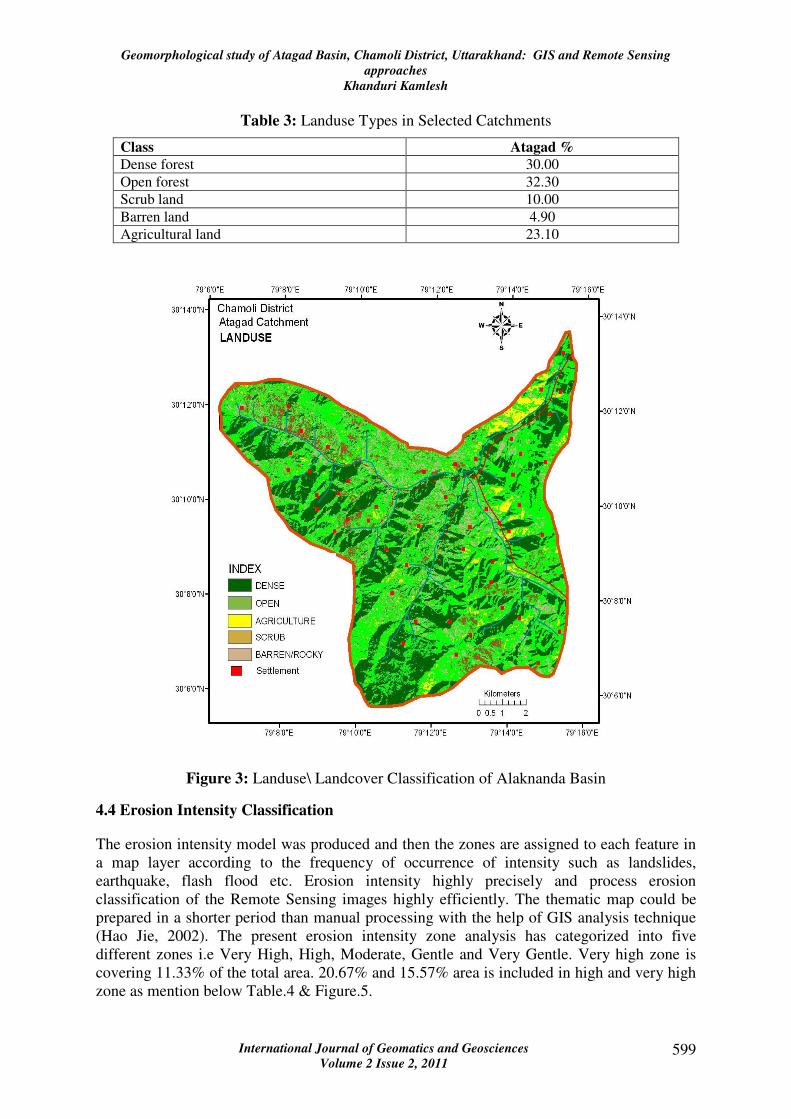
4.3 Landuse & Landcover Classification
Land use and land cover mapping of Atagad has been carried out standard methods of
analysis of remotely sensed data and followed by ground truth collection and interpretation of
satellite data. Land use planning (LUP) approach needs more and more data integration,
multi-disciplinary and complex analysis, and need faster or more precise information for the
participants in the LUP approaches. Here Land use and land cover mapping are given below
in Table. 3 & Figure.4.
Geomorphological study of Atagad Basin, Chamoli District, Uttarakhand: GIS and Remote Sensing
approaches
Khanduri Kamlesh
International Journal of Geomatics and Geosciences
Volume 2 Issue 2, 2011 599
Table 3: Landuse Types in Selected Catchments
Class Atagad %
Dense forest 30.00
Open forest 32.30
Scrub land 10.00
Barren land 4.90
Agricultural land 23.10
Figure 3: Landuse\ Landcover Classification of Alaknanda Basin
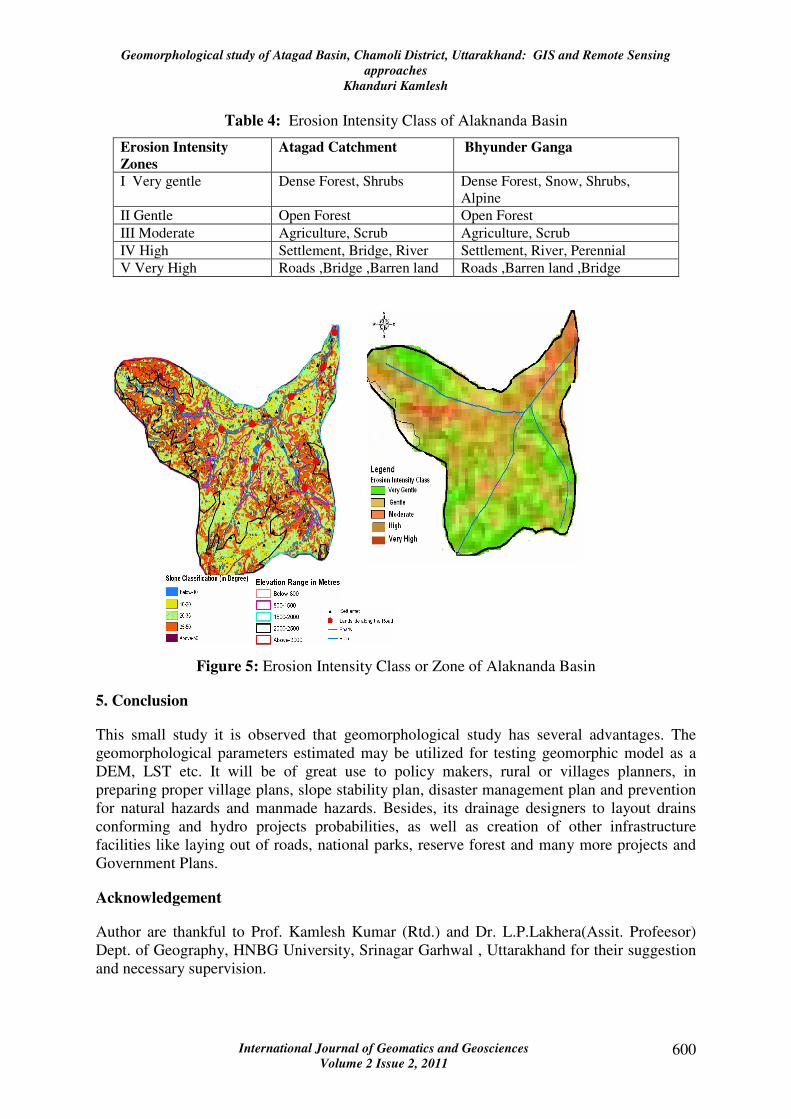
4.4 Erosion Intensity Classification
The erosion intensity model was produced and then the zones are assigned to each feature in
a map layer according to the frequency of occurrence of intensity such as landslides,
earthquake, flash flood etc. Erosion intensity highly precisely and process erosion
classification of the Remote Sensing images highly efficiently. The thematic map could be
prepared in a shorter period than manual processing with the help of GIS analysis technique
(Hao Jie, 2002). The present erosion intensity zone analysis has categorized into five
different zones i.e Very High, High, Moderate, Gentle and Very Gentle. Very high zone is
covering 11.33% of the total area. 20.67% and 15.57% area is included in high and very high
zone as mention below Table.4 & Figure.5.
Geomorphological study of Atagad Basin, Chamoli District, Uttarakhand: GIS and Remote Sensing
approaches
Khanduri Kamlesh
International Journal of Geomatics and Geosciences
Volume 2 Issue 2, 2011 600
Table 4: Erosion Intensity Class of Alaknanda Basin
Erosion Intensity
Zones
Atagad Catchment Bhyunder Ganga
I Very gentle Dense Forest, Shrubs Dense Forest, Snow, Shrubs,
Alpine
II Gentle Open Forest Open Forest
III Moderate Agriculture, Scrub Agriculture, Scrub
IV High Settlement, Bridge, River Settlement, River, Perennial
V Very High Roads ,Bridge ,Barren land Roads ,Barren land ,Bridge
Figure 5: Erosion Intensity Class or Zone of Alaknanda Basin
5. Conclusion
This small study it is observed that geomorphological study has several advantages. The
geomorphological parameters estimated may be utilized for testing geomorphic model as a
DEM, LST etc. It will be of great use to policy makers, rural or villages planners, in
preparing proper village plans, slope stability plan, disaster management plan and prevention
for natural hazards and manmade hazards. Besides, its drainage designers to layout drains
conforming and hydro projects probabilities, as well as creation of other infrastructure
facilities like laying out of roads, national parks, reserve forest and many more projects and
Government Plans.
Acknowledgement
Author are thankful to Prof. Kamlesh Kumar (Rtd.) and Dr. L.P.Lakhera(Assit. Profeesor)
Dept. of Geography, HNBG University, Srinagar Garhwal , Uttarakhand for their suggestion
and necessary supervision.

Geomorphological study of Atagad Basin, Chamoli District, Uttarakhand: GIS and Remote Sensing
approaches
Khanduri Kamlesh
International Journal of Geomatics and Geosciences
Volume 2 Issue 2, 2011 601
6. References
1. Agrawal Devendra, Mahendra S. Lodhi and Shradha Panwar., (2010), Are EIA
studies sufficient for projected Hydropower development in the Indian Himalayan
region?, Current Science, 98(2-25).
2. Balaguru, B. et.al., (2003), Vegetation Mapping an.d Slope Characteristics in
Shervarayan Hills, Eastern Ghats Using Remote sensing and GIS , Current Science,
85(5).
3. Boegh. E, Soegaard.H, Hannan.N, Kabat. P, Lesch.L., ( 1998), A Remote Sensing
study of the NDVI – Ts relationship and the transpiration from sparse vegetation in
the Sahel based on high resolution satellite data, Remote Sensing of Environment, 69,
pp 224 – 240.
4. Environmental Impact & Management Plan for Alaknanda H.E.
Project,Uttarakhand,CISMHE,http://envfor.nic.in/divisions/iass/Executive%20Summ
ary.pdfV.
5. Geomorphological Study of Devak Basin, CS\AR-33/1998-99, National Institute of
Hydrology Jal Vigyan of Hydrology, Roorkee.
6. Jegankumar R., Umamathi S., (2009), GIS and Remote Sensing for Urban Heat
Island Analysis – A Case Study of Salem City and its Environ, GIS for Natural
Resources and Disaster Management, pp 203-215.
7. Khanduri Kamlesh , 2011 ,”GIS & Remote Sensing Technology in Geomorphic
analysis of Mandakini River Basin, Garhwal Himalaya, Rudraprayag District,
Uttarakhand, India” International journal of Advanced Scientific and Technical
Research, Issue 1, Vol 2, pp.138-145.
8. Khanduri Kamlesh, (2007-2011) A Geographical Study of Hazards & Disaster
Management in Uttrakhand : With Reference to Chamoli District, Unpublished
D.Phil Thesis, H.N.B.G.University.
9. Khanduri Kamlesh, et.al, "Geomorphic Evaluation of Valley of Flower Region
Bhyunder Ganga Cathchment, Chamoli District,Uttarakhand Using: Remote Sensing
and GIS Technology", Earth Science Journal, Toronto,Canada, Vol 1(1) February
2012, pp 114-120.
10. Lilly Rose A, Monsingh D. Devadas., (2009), Analysis of land surface temperature
and land use / land cover types using remote sensing imagery - a case in Chennai City,
India, Anna University Chennai, India.
11. Lo, C.P. and D.A. Quattrochi., (2003), Land- use and land-cover change, urban heat
island phenomenon, and health implications: A remote sensing approach.
Photogrammetric Engineering and Remote Sensing, 69(9), pp 1053-1063.
12. Mohan,J.D.Giri and R.L.Shyampura., ( 2006), 3DVisualization of Udaipur City and
its Environs , Indian Cartographer, pp 104-105.