geophysical journal international -...
TRANSCRIPT

Geophys. J. Int. (2012) 188, 850–872 doi: 10.1111/j.1365-246X.2011.05328.x
GJI
Geo
dyna
mic
san
dte
cton
ics
Neotectonics of the SW Iberia margin, Gulf of Cadiz and AlboranSea: a reassessment including recent structural, seismic and geodeticdata
T. A. Cunha,1,2 L. M. Matias,1,3 P. Terrinha,1,2 A. M. Negredo,4,5 F. Rosas,1,3
R. M. S. Fernandes1,6 and L. M. Pinheiro7
1Instituto Don Luiz (IDL-LA). Campo Grande, Edif ıcio C8, 1749-016, Lisboa, Portugal. E-mail: [email protected] de Geologia Marinha, LNEG Bairro do Zambujal-Alfragide, Apartado 7586, 2611-901 Amadora, Portugal3Universidade de Lisboa, Faculdade de Ciencias, Campo Grande, Edif ıcio C8, 1749-016, Lisboa, Portugal4Dpto. Geofısica y Meteorologıa. Universite Complutense de Madrid, 28040 Madrid, Spain5Instituto de Geociencias (UCM-CSIC) 28040 Madrid, Spain6Universidade da Beira Interior Rua Marques Avila Bolama, 6200-053 Covilha, Portugal7Department Geociencias and CESAM, Universite de Aveiro Campus de Santiago, 3810-193 Aveiro, Portugal
Accepted 2011 December 4. Received 2011 October 29; in original form 2011 March 3
S U M M A R YWe use a thin-shell approximation for the lithosphere to model the neotectonics of the Gulfof Cadiz, SW Iberia margin and the westernmost Mediterranean, in the eastern segment ofthe Azores–Gibraltar plate boundary. In relation to previous neotectonic models in the region,we utilize a better constrained structural map offshore, and the recent GPS measurementsover NW Africa and Iberia have been taken into account, together with the seismic strainrate and stress data, to evaluate alternative geodynamic settings proposed for the region. Weshow that by assuming a relatively simple, two-plate tectonic framework, where Nubia andEurasia converge NW–SE to WNW–ESE at a rate of 4.5–6 mm yr−1, the models correctlypredict the amount of shortening and wrenching between northern Algeria–Morocco andsouthern Spain and between NW Morocco and SW Iberia, as estimated from both GPS dataand geological constraints. The consistency between modelled and observed velocities in thevicinity of Gibraltar and NW Morocco indicates that forcing by slab sinking beneath Gibraltaris not required to reproduce current horizontal deformation in these areas. In the Gulf of Cadizand SW Iberia, the modelling results support a diffuse Nubia–Eurasia Plate boundary, wherethe convergence is accommodated along NNE–SSW to NE–SW and ENE–WSW thrust faultsand WNW–ESE right-lateral strike-slip faults, over an area >200 km wide, in good generalagreement with the distribution of the seismic strain rate and associated faulting mechanisms.The modelling results are robust to regional uncertainties in the structure of the lithosphereand have important implications for the earthquake and tsunami hazard of Portugal, SW Spainand Morocco. We predict maximum, long-term average fault slip rates between 1–2 mm yr−1,that is, less than 50 per cent the average plate relative movement, suggesting very long returnperiods for high-magnitude (Mw > 8) earthquakes on individual structures.
Key words: Seismicity and tectonics; Continental neotectonics; Dynamics: seismotectonics;Neotectonics; Kinematics of crustal and mantle deformation.
1 I N T RO D U C T I O N A N DG E O L O G I C A L / G E O DY NA M I C S E T T I N G
The present-day boundary between Nubia and Eurasia tectonicplates changes from dextral transtensional in the Terceira Ridge(east of the Azores Triple Junction), through a dextral transcurrent(transform-type) boundary along the Gloria Fault to compressionalwith minor right-lateral strike-slip in northern Algeria (Fig. 1). Ac-cording to recent kinematic plate models, based on GPS data, the
convergence between Nubia and SW Eurasia (Iberia) is oblique,striking NW–SE to WNW–ESE (red arrows in inset of Fig. 1), andoccurs at a rate of 4.5–6 mm yr−1 (Sella et al. 2002; Calais et al.2003; McClusky et al. 2003; Fernandes et al. 2003). However, theway this convergence is being accommodated in the SW Iberia mar-gin (comprising the southern Tagus and Horseshoe abyssal plains,the Gorringe Bank and the Tore-Madeira Rise), the Gulf of Cadizand the westernmost Mediterranean (comprising the Alboran Seaand surrounding Betic and Rif cordilleras, often designated as the
850 C© 2012 The Authors
Geophysical Journal International C© 2012 RAS
Geophysical Journal International

Neotectonics SW Iberia–Gulf of Cadiz–Alboran 851
Figure 1. Topography–bathymetry map of Iberia, NW Africa and the surrounding central eastern Atlantic and western Mediterranean Sea showing theinstrumental seismicity (red circles). The epicentres were extracted from the catalogues of the International Seismic Centre (ISC, between 1964–2006;http://www.ISC.ac.uk), the Instituto de Metereologia de Portugal (IM, 1970–2000; http://www.meteo.pt), the Instituto Geografico Nacional (ICN, 2002–2007;http://www.ign.es/ign/es/IGN/home.jsp) and the Centre Sismologique Euro-Mediterraneen (CSEM, 2007-Fev 2009; http://www.emsc-csem.org). In theperiods of superposition the IM catalogue prevailed, then the ISC. Focal mechanisms are from University of Harvard catalogue for the whole area(http://www.seismology.harvard.edu), complemented with a compilation from smaller magnitude earthquakes from several published sources. Between20◦W–5◦W, the data sets were completed from various sources. Arrows at right bottom corner show the relative movement of Africa/Nubia with respect toEurasia at the centre of the Gulf of Cadiz, according to different authors. Black arrows deduced from geological indicators (Argus et al. 1989; DeMets et al.1994) and red arrows from GPS data (Sella et al. 2002; Fernandes et al. 2003; Calais et al. 2003). The white square delimits the area of Fig. 2, where the recentSW Iberia–Gulf of Cadiz structural map is discussed. Inset on the left-bottom corner shows the distinct segments where the Africa–Eurasia plate boundaryhas been identified (thick black lines) and where is still poorly constrained (stippled area), and the relative movement of Nubia with respect to Eurasia atdistinct locations of the boundary (red arrows; after Fernandes et al. 2003). Acronyms in alphabetic order: AGFZ, Azores-Gribraltar Fracture Zone; AM, AtlasMountains; AS, Alboran Sea; BM, Betic Mountains; GC, Gulf of Cadiz; GB, Gorringe Bank; GF, Gloria Fault; GL, Gulf of Lyon; HAP, Horseshoe AbyssalPlain; IAP, Iberia Abyssal Plain; MAR, Mid-Atlantic Ridge; Pyr., Pyrenees; RM, Rift Mountains; SAP, Seine Abyssal Plain; SBS, South Balearic Sea; SoG,Straits of Gibraltar; TAP, Tagus Abyssal Plain; TM, Tell Mountains; TMR, Tore-Madeira Rise; TR, Terceira Ridge; TTF, Tell Thrust Front; VT, ValenciaTrough.
Alboran domain) is still a matter of controversy (e.g. Gutscher et al.2002; Fadil et al. 2006; Stich et al. 2006; 2010; Zitellini et al. 2009;Vernant et al. 2010).
The region forms an approximately 1000-km-long, and up to 400-km-wide corridor of widespread seismicity, where the location andstyle of the plate boundary is still poorly constrained (stippled areain inset of Fig. 1), and where focal mechanism solutions of shal-low to intermediate depth earthquakes show important variations inthe regional faulting trends and rupture mechanisms (Buforn et al.2004; Stich et al. 2006; 2010; Fig. 1) with (1) predominant strike-slip, with some reverse faulting, under NW–SE compression alongthe west Portuguese margin; (2) reverse and strike-slip faulting inthe SW Iberia margin and Gulf of Cadiz, with maximum compres-sion in the NW–SE direction and (3) a combination of strike-slipand normal faulting in the Alboran Sea and minor thrusting in thesurrounding cordilleras, under NNE–SSW to N–S compression.Beneath the Alboran Sea, a lithospheric slab extending to depthsof more than 600 km has been inferred from the seismicity and
tomographic images (Buforn et al. 1991; Blanco & Spakman 1993;Seber et al. 1996; Calvert et al. 2000; Wortel & Spakman 2000).
Several geodynamic models have been proposed to explainthe seismicity of the Gulf of Cadiz–Alboran region, the na-ture and geometry of the lithospheric slab, as well as theOligocene–Recent evolution of Alboran domain, marked by thestrong clockwise/counter-clockwise rotation of the allochthonousterranes and external zones of the Rif and Betic mountain belts,(respectively) during the Miocene (Allerton et al. 1993; Platzmanet al. 1993; Lonergan & White 1997), and by the apparently coevalextension of the Alboran Sea. These include (1) backarc exten-sion due to subduction roll-back (Royden 1993; Lonergan & White1997; Gutscher et al. 2002); (2) extension induced by the break-off of a subducting lithospheric slab (Blanco & Spakman 1993;Carminati et al. 1998); (3) delamination of subcontinental litho-sphere (Docherty & Banda 1995; Seber et al. 1996; Calvert et al.2000; Valera et al. 2008) and (4) convective removal of a thickenedlithospheric root (Platt & Vissers 1989; Platt et al. 2003).
C© 2012 The Authors, GJI, 188, 850–872
Geophysical Journal International C© 2012 RAS
852 T. A. Cunha et al.
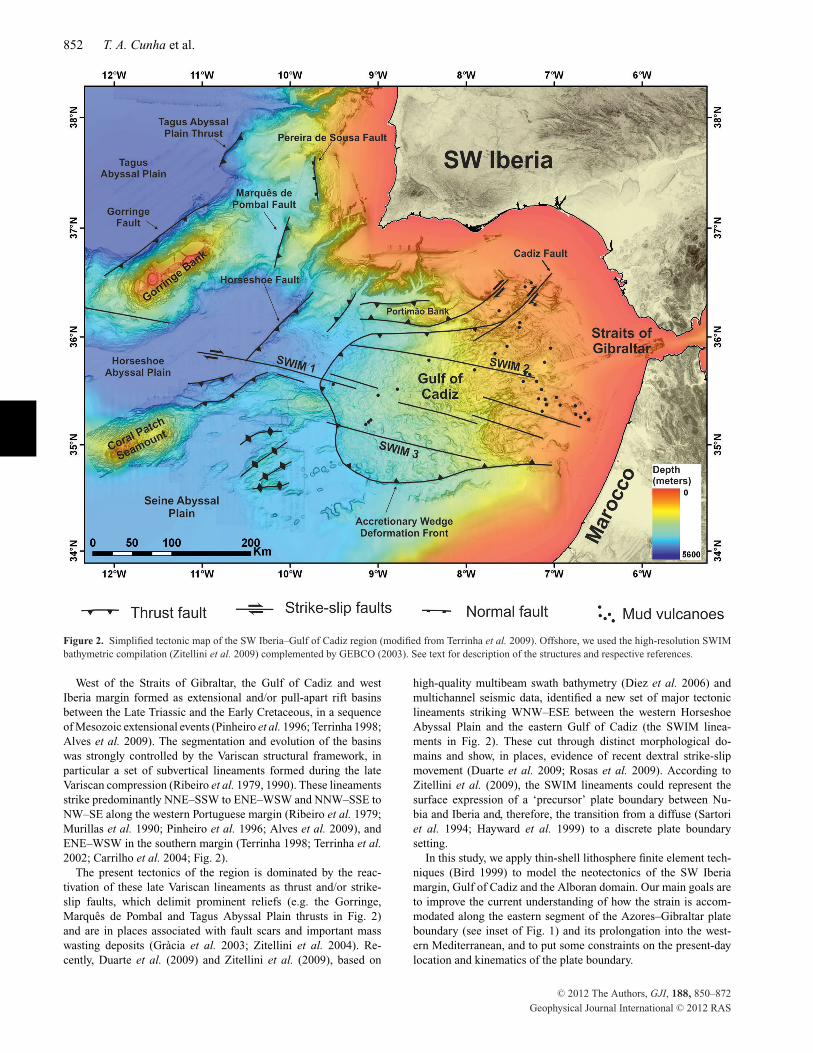
Figure 2. Simplified tectonic map of the SW Iberia–Gulf of Cadiz region (modified from Terrinha et al. 2009). Offshore, we used the high-resolution SWIMbathymetric compilation (Zitellini et al. 2009) complemented by GEBCO (2003). See text for description of the structures and respective references.
West of the Straits of Gibraltar, the Gulf of Cadiz and westIberia margin formed as extensional and/or pull-apart rift basinsbetween the Late Triassic and the Early Cretaceous, in a sequenceof Mesozoic extensional events (Pinheiro et al. 1996; Terrinha 1998;Alves et al. 2009). The segmentation and evolution of the basinswas strongly controlled by the Variscan structural framework, inparticular a set of subvertical lineaments formed during the lateVariscan compression (Ribeiro et al. 1979, 1990). These lineamentsstrike predominantly NNE–SSW to ENE–WSW and NNW–SSE toNW–SE along the western Portuguese margin (Ribeiro et al. 1979;Murillas et al. 1990; Pinheiro et al. 1996; Alves et al. 2009), andENE–WSW in the southern margin (Terrinha 1998; Terrinha et al.2002; Carrilho et al. 2004; Fig. 2).
The present tectonics of the region is dominated by the reac-tivation of these late Variscan lineaments as thrust and/or strike-slip faults, which delimit prominent reliefs (e.g. the Gorringe,Marques de Pombal and Tagus Abyssal Plain thrusts in Fig. 2)and are in places associated with fault scars and important masswasting deposits (Gracia et al. 2003; Zitellini et al. 2004). Re-cently, Duarte et al. (2009) and Zitellini et al. (2009), based on
high-quality multibeam swath bathymetry (Diez et al. 2006) andmultichannel seismic data, identified a new set of major tectoniclineaments striking WNW–ESE between the western HorseshoeAbyssal Plain and the eastern Gulf of Cadiz (the SWIM linea-ments in Fig. 2). These cut through distinct morphological do-mains and show, in places, evidence of recent dextral strike-slipmovement (Duarte et al. 2009; Rosas et al. 2009). According toZitellini et al. (2009), the SWIM lineaments could represent thesurface expression of a ‘precursor’ plate boundary between Nu-bia and Iberia and, therefore, the transition from a diffuse (Sartoriet al. 1994; Hayward et al. 1999) to a discrete plate boundarysetting.
In this study, we apply thin-shell lithosphere finite element tech-niques (Bird 1999) to model the neotectonics of the SW Iberiamargin, Gulf of Cadiz and the Alboran domain. Our main goals areto improve the current understanding of how the strain is accom-modated along the eastern segment of the Azores–Gibraltar plateboundary (see inset of Fig. 1) and its prolongation into the west-ern Mediterranean, and to put some constraints on the present-daylocation and kinematics of the plate boundary.
C© 2012 The Authors, GJI, 188, 850–872
Geophysical Journal International C© 2012 RAS

Neotectonics SW Iberia–Gulf of Cadiz–Alboran 853
Thin-shell (or thin-sheet) finite element modelling has beendemonstrated to be a powerful means to investigate the neotec-tonics of complex plate boundary settings, characterized by markedtransitions in the seismotectonic regime and lateral variations innature and structure of the lithosphere (e.g. Bird & Kong 1994;Jimenez-Munt et al. 2001; Liu & Bird 2002; Negredo et al. 2002).The models incorporate realistic boundary conditions based on platemotions, fault networks, thermally activated non-linear rheologiesfor the crust and mantle, and the stresses associated with horizontalpressure gradients (due to topography and its compensation), andmake predictions of strain partitioning, stress orientations, velocityfields and fault slip rates (Kong & Bird 1995; Bird 1999), whichmay be quantitatively compared against geophysical, geodetic andgeological observations.
Previously published neotectonic models for the eastern segmentof the Azores–Gibraltar plate boundary have successfully reproducethe major changes in the stress regime between the Tell mountainsand the Gloria Fault, and obtained a good correlation between thehighest predicted strain rates and the regions of strong seismic ac-tivity (e.g. Jimenez-Munt et al. 2001; Negredo et al. 2002; Jimenez-Munt & Negredo 2003). However, these earlier studies did not haveaccess to the GPS velocities compiled for Iberia and NW Africa overthe last decade (e.g. Stich et al. 2006; Fadil et al. 2006; Vernant et al.2010), and assumed for the relative motion between the Nubia andEurasia the rotation poles and angular velocities calculated Arguset al. (1989) and DeMets et al. (1990), which are based on geolog-ical indicators (i.e. magnetic lineations and transform faults). Asdepicted in the inset of Fig. 1, these are strongly oblique in rela-tion to the predictions from recently derived kinematic plate modelsbased on space-geodetic solutions.
Moreover, in contrast to previous works, which either considerthe entire Azores–Gibraltar Plate boundary, extending to the mid-Atlantic ridge (Jimenez-Munt et al. 2001; Jimenez-Munt & Negredo2003), or focus in the Iberian–Maghrebian region (Negredo et al.2002), we attribute a greater relevance to the SW Iberia margin andGulf of Cadiz areas. We had access to a better constrained tectonicmap offshore, based on recently acquired multibeam bathymetry,backscatter data and numerous high-quality multichannel seismicprofiles (Terrinha et al. 2009; Zitellini et al. 2009 and referencestherein). As depicted in Fig. 2, the tectonic map is dominated byNNW–SSW to NE–SW and ENE–WSW trending thrusts, and bylong, WNW–ESE dextral strike-slip faults, both of which havebeen proposed as possible sources for destructive earthquakes andtsunamis in the region (Zitellini et al. 2001; Baptista & Miranda2003; Gracia et al. 2003; Terrinha et al. 2003; Ribeiro et al. 2006;Stich et al. 2007; Baptista & Miranda 2009; Zitellini et al. 2009;Cunha et al. 2010). By incorporating these structures in the neo-tectonic models we will be able to provide some estimates of faultslip rates, and thus evaluate their relative long-term seismic haz-ard. Another significant novelty of this study is that we evaluate thepotential effects on the neotectonics of the area of plate boundary ge-ometries which have been recently proposed for the SW Iberia-Gulfof Cadiz-Alboran domain region, based on the tectonics (Zitelliniet al. 2009), geodetic studies and seismic data (e.g. Gutscher 2004;Stich et al. 2006).
2 M E T H O D O L O G Y
We use the thin-shell finite element program SHELLS (Kong & Bird1995; Bird 1999) to model the neotectonics of the eastern sectorof the Azores–Gibraltar Plate boundary. The thin-shell lithosphereapproximation implies that only the horizontal velocity components
Table 1. Model parameterization.
Parameter Symbol Value
Gravitational acceleration g 9.8 m s−2
Crustal reference density ρc 2800 kg m−3
Mantle lith. ref. density Pm 3330 kg m−3
Asthenosphere density ρa 3160 kg m−3
Volumetric coefficient of thermalexpansion
a 3.5 × 10⁻⁵ K−1
Thermal conductivity of the crust Kc 3.0 W m−1 K−1
Thermal conductivity of the mantle Km 3.2 W m−1 K−1
Surface temperature T sup 0oCTemperature at the base of the
lithosphereTa 1300oC
Constant crust radioactive heatproduction
Hcrust 7.91 × 10⁻⁷ W m−3
of the momentum equation are integrated and solved across a finiteelement grid (FEG) of spherical triangles. Body forces arising fromhorizontal gradients of pressure are included in this modelling.Because the angular velocity is assumed invariant with depth, eachtriangular element deforms by a rigid plate rotation and a uniformstrain rate. The calculation of the velocity field, and associatedstrain, further assumes that the lithosphere behaves as a continuousmedium, even in the neighborhood of plate boundaries (Kreemeret al. 2000). This is a reasonable approximation when the modelledarea is significantly larger than the thickness of the elastic/brittlelithosphere (England & McKenzie 1982).
Although the velocity model is 2-D, the momentum equation issolved accounting for the vertically integrated strength of the litho-sphere. In this sense, SHELLS can be regarded as a 2.5-D finiteelement method (Kong & Bird 1995). At each node of the FEG, themodel imports the elevation and surface heat flow and calculates,iteratively, the crustal and mantle lithosphere thicknesses under theassumption of local isostasy. To compute the temperature distribu-tion, the steady-state vertical heat conduction equation is solvedassuming a constant temperature at the base of the lithosphere,Ta. The system is considered to be isostatically balanced with a7-km-thick mid-ocean ridge at a depth of 2.7 km. Radiogenic heatproduction is assumed constant within the crust (i.e. an averagedvalue, following Negredo et al. 2002), and negligible in the litho-spheric mantle. The default density and thermal parameters usedthroughout this study are summarized in Table 1, and are similar tothose used in previous thin-sheet neotectonic models of the region.(Negredo et al. 2002; Jimenez-Munt et al. 2003).
For a given strain distribution, the deviatoric stress tensor iscalculated at regularly spaced test points through the litho-spheric thickness, considering both frictional-sliding (brittle) anddislocation-creep (ductile) flow laws (Brace & Kohlstedt 1980).The deformation mechanism providing the lower yielding shearstress is assumed to be the dominant. Brittle failure yield stress (σ f )is evaluated assuming hydrostatic pore pressure
σ f = −μ f (σn + Pw) , (1)
where σ n is the normal stress, Pw is the pore pressure and μf isthe coefficient of friction. In this work, we assume a constant μf of0.85 (e.g. Byerlee 1978; Kirby 1983) for the continuous lithosphereand test several values to be applied at the fault elements. The creepshear of the lithosphere is computed using the following expression
σcreep =[
2A(
2√
−ε1ε2 − ε2ε3 − ε3ε1
)(1−n)/nexp
(B + Cz
T
)]ε,
(2)
C© 2012 The Authors, GJI, 188, 850–872
Geophysical Journal International C© 2012 RAS
854 T. A. Cunha et al.
where σ is the deviatoric stress tensor,ε is the anelastic strain ratetensor, T is the absolute temperature, z is the depth and A, B, C andn are rheological parameters. The term within the square root is thesecond invariant of the strain rate tensor, and parameter B in thecrust is given by Q/nR, where Q is the activation energy and R is thegas constant (Bird 1989). The rheological parameters are adoptedfrom studies in the region (Negredo et al. 2002; Jimenez-Munt &Negredo 2003).
3 M O D E L C O N S T RU C T I O N
In SHELLS, a model is essentially defined by the following inputs:(1) the geometry of the FEG and the traces and dips of the active(or potentially active) faults; (2) the boundary conditions and (3)the topography and heat flow data, which will determine how thethicknesses of the crust and lithospheric mantle vary laterally.
For this study, the modelled region was defined between parallels30 ◦N and 45◦N and meridians 15◦W and 3◦E. The lateral bound-aries were chosen so that the modelled domain encloses the areawhere the geometry of the Nubia–Eurasia Plate boundary is lesswell-constrained (Fig. 1). To the west, the boundary is a clearlymarked, E–W oriented fracture zone (the Gloria Fault). To the east,the plate boundary is also linear and well-defined, following thethrusts of the Tell Mountains in northern Algeria. The southernboundary is placed to the south of the Atlas, to allow for some con-vergence accommodation in this area and the northern boundary isassumed to be representative of the motion of the Eurasian Plate.The model boundaries extend well beyond the SW Iberia margin,Gulf of Cadiz and west Alboran domains, where we will focus ouranalysis (Figs 1, 2 and 3). In this way, we avoid the modelling resultsin our target area being strongly affected by the imposed boundaryconditions.
3.1 Grid geometry and structure
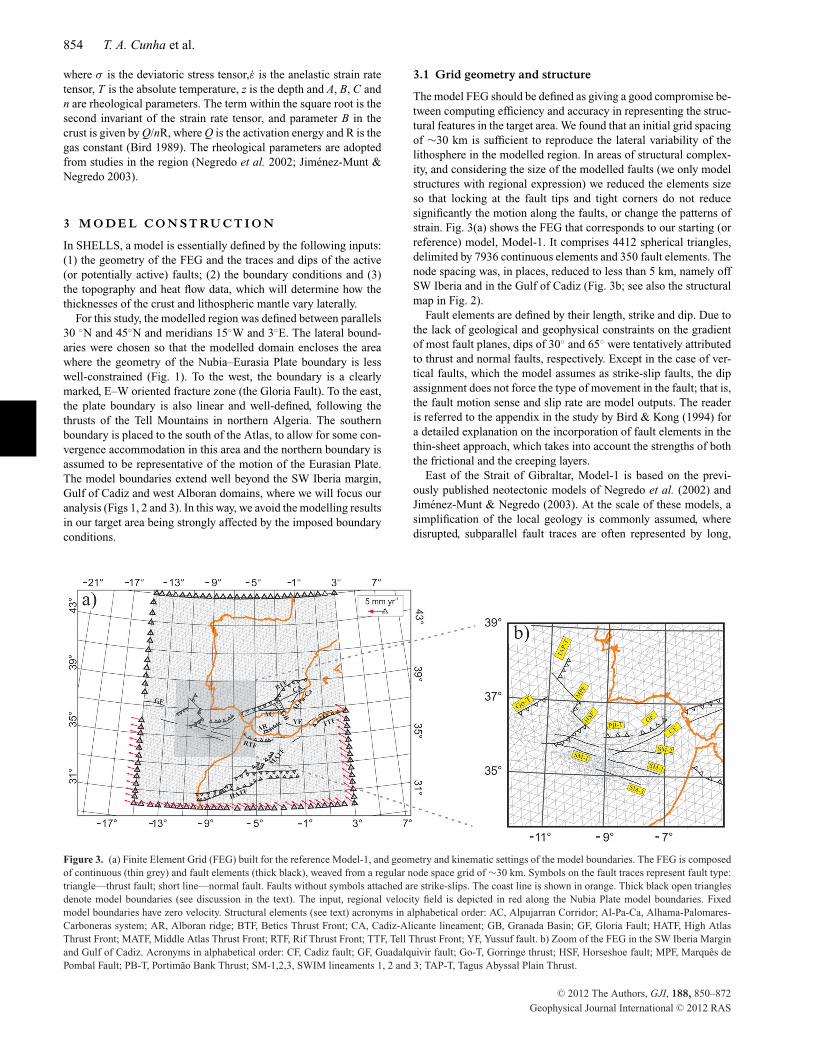
The model FEG should be defined as giving a good compromise be-tween computing efficiency and accuracy in representing the struc-tural features in the target area. We found that an initial grid spacingof ∼30 km is sufficient to reproduce the lateral variability of thelithosphere in the modelled region. In areas of structural complex-ity, and considering the size of the modelled faults (we only modelstructures with regional expression) we reduced the elements sizeso that locking at the fault tips and tight corners do not reducesignificantly the motion along the faults, or change the patterns ofstrain. Fig. 3(a) shows the FEG that corresponds to our starting (orreference) model, Model-1. It comprises 4412 spherical triangles,delimited by 7936 continuous elements and 350 fault elements. Thenode spacing was, in places, reduced to less than 5 km, namely offSW Iberia and in the Gulf of Cadiz (Fig. 3b; see also the structuralmap in Fig. 2).
Fault elements are defined by their length, strike and dip. Due tothe lack of geological and geophysical constraints on the gradientof most fault planes, dips of 30◦ and 65◦ were tentatively attributedto thrust and normal faults, respectively. Except in the case of ver-tical faults, which the model assumes as strike-slip faults, the dipassignment does not force the type of movement in the fault; that is,the fault motion sense and slip rate are model outputs. The readeris referred to the appendix in the study by Bird & Kong (1994) fora detailed explanation on the incorporation of fault elements in thethin-sheet approach, which takes into account the strengths of boththe frictional and the creeping layers.
East of the Strait of Gibraltar, Model-1 is based on the previ-ously published neotectonic models of Negredo et al. (2002) andJimenez-Munt & Negredo (2003). At the scale of these models, asimplification of the local geology is commonly assumed, wheredisrupted, subparallel fault traces are often represented by long,
Figure 3. (a) Finite Element Grid (FEG) built for the reference Model-1, and geometry and kinematic settings of the model boundaries. The FEG is composedof continuous (thin grey) and fault elements (thick black), weaved from a regular node space grid of ∼30 km. Symbols on the fault traces represent fault type:triangle—thrust fault; short line—normal fault. Faults without symbols attached are strike-slips. The coast line is shown in orange. Thick black open trianglesdenote model boundaries (see discussion in the text). The input, regional velocity field is depicted in red along the Nubia Plate model boundaries. Fixedmodel boundaries have zero velocity. Structural elements (see text) acronyms in alphabetical order: AC, Alpujarran Corridor; Al-Pa-Ca, Alhama-Palomares-Carboneras system; AR, Alboran ridge; BTF, Betics Thrust Front; CA, Cadiz-Alicante lineament; GB, Granada Basin; GF, Gloria Fault; HATF, High AtlasThrust Front; MATF, Middle Atlas Thrust Front; RTF, Rif Thrust Front; TTF, Tell Thrust Front; YF, Yussuf fault. b) Zoom of the FEG in the SW Iberia Marginand Gulf of Cadiz. Acronyms in alphabetical order: CF, Cadiz fault; GF, Guadalquivir fault; Go-T, Gorringe thrust; HSF, Horseshoe fault; MPF, Marques dePombal Fault; PB-T, Portimao Bank Thrust; SM-1,2,3, SWIM lineaments 1, 2 and 3; TAP-T, Tagus Abyssal Plain Thrust.
C© 2012 The Authors, GJI, 188, 850–872
Geophysical Journal International C© 2012 RAS

Neotectonics SW Iberia–Gulf of Cadiz–Alboran 855
continuous fault zones which accommodate most of the deforma-tion. This is the case, for example, of the Cadiz–Alicante strike-slipfault and the large thrusts fronts in the Atlas mountains, in the Rifchain and the Tell Mountains (Fig. 3a). The thrust front along theBetic chain, continuous for more than 600 km, is also an exag-gerated representation of several mapped compressional structures,bordering both the most external (thin-skinned) and the internalunits of the mountain belt (Negredo et al. 2002).
Logically, the slip rates predicted by the models along these faultswill depend not only on their extent, but also on their orienta-tion relative to the present-day stress field and connectivity withother fault systems. In this sense, the imposed lateral continuity ofthe fault zones should be understood as an end-member assump-tion to assess their importance in the neotectonics of the region.Also considered in the southern Iberia region are the Granada basinNNW–SSE trending normal faults and the NE–SW to NNE–SSEAlhama–Palomares–Carboneras fault system (Negredo et al. 2002and references therein). In the Alboran Sea, the Nerja and YussufNW–SE trending faults and the NE–SW Alboran Ridge (see Fig. 3afor location) have been mapped from wide-angle seismic data(Comas et al. 1999) and show evidence of recent tectonic activ-ity (e.g. Watts et al. 1993; Alvarez-Marron 1999).
Fig. 3(b) zooms on the Gulf of Cadiz and SW Iberia margin,where our models are based on recently acquired high-resolutionbathymetry, backscatter and seismic data (Fig. 2). In our referenceModel-1, relatively long (up to 200 km), although disrupted, SWIMsegments are assumed in areas where there are some evidence oftheir recent and/or past activity (Duarte et al. 2009). Also includedare the NE–SW thrusts off southern Portugal, linked through pos-sible NW–SE transfer zones (Zitellini et al. 2001; Terrinha et al.2003; Cunha et al. 2010), the Gorringe Bank thrust, the eastern-most segment of the Gloria Fault (Fig. 3a), the Cadiz Fault andthe Portimao Bank and Guadalquivir thrust fronts (see also struc-tural map of Fig. 2). As discussed in Section 1, all these structuresshow evidence of recent (Pliocene–Quaternary) activity and are,in places, associated with seismic activity. We explicitly did notconsider the Gulf of Cadiz Accretionary Wedge in the models, aprominent feature of the tectonic map presented in Fig. 2, becauseit consists of a sequence of stack thrusts soling along a basal, neartop Cretaceous decollement horizon, not affecting the underlyingcrust/lithosphere. Variations to this model setup will be discussedin Section 5.2, together with the modelling results.
3.2 Model boundaries
Another requirement of the SHELLS modelling approach is thedefinition of the model boundary types and forces. The models canbe tectonically loaded from below, through asthenosphere couplingand/or from the lateral boundaries. In this work, we will assume thatno horizontal shear traction is exerted on the base of the lithosphereand consider only the effects due to loading from the lateral bound-aries, that is, the stresses resulting from the relative plate motionsand their interactions.
Several kinematic plate models have been recently proposed,which place constraints on the relative motion between the Nubianplate and Iberia (e.g. Sella et al. 2002; Calais et al. 2003; McCluskyet al. 2003; Fernandes et al. 2003). Fernandes et al. (2003; modelDEOS2K), for example, based on GPS data predicts a convergencerate between Nubia and Europe of 4.3 mm yr−1 with a directionof N70◦W in the center of the Gulf of Cadiz (9◦W, 36◦N). Thisconvergence is significantly tilted in relation to the one predictedby the kinematic global plate model NUVEL-1A of DeMets et al.
(1994; 4.1 mm yr−1 striking N53◦W), commonly used as a referencein geodynamic studies (see inset in Fig. 2 for the velocity vectorsassociated with several proposed kinematic models) we did nottest the recent MORVEL global plate model (DeMets et al. 2010)because the rotation pole is almost identical to the one in modelNUVEL-1A.
A number of recent works, also based on space geodetic ob-servations, confirm the DEOS2K model (e.g.Calais et al. 2003;McClusky et al. 2003; Kreemer et al. 2003) and predict the loca-tion of the Nubia–Iberia Euler pole of rotation, in average, between10◦S–1◦N and 28◦-15◦W, that is, more than 20◦ to the south of thepole inferred by of DeMets et al. (1994; 21◦N, –21◦W; kinematicmodel NUVEL-1A). An important difference between the NUVEL-1A and the recently proposed GPS based models is that NUVEL-1Aassumes a single African block, instead of considering the Nubiaand Somalia as two independent lithospheric plates with an open-ing rate of up to 7 mm yr−1 along the East African Rift (Fernandeset al. 2004). One of the aims of this work is thus to evaluate theconsequences of using different kinematic models on the calculatedvelocity fields and strain rates in the study area.
For simplicity, the Eurasia Plate will be assumed as reference(fixed plate) throughout this study. As depicted in Fig. 3(a), threedifferent types of boundaries may be defined in the models (1)fixed, as established along the northern limit of the model and northof 37.7◦N in the western limit (thick, open triangles); (2) ‘free’(in the sense that motion is allowed), along the eastern boundarynorth of 36.8◦N and along the western boundary between 36◦N and37.7◦N, that is, in the vicinity of the Gloria Fault and (3) movingaccording to a particular kinematic plate model, as defined alongthe south, southeast and southwest boundaries of the model (redarrows). In the case of the ‘free’ boundaries, they are only subjectedto lithostatic normal traction, with no shear traction. The westernboundary defined in the model presented in Fig. 3 allows for a broadarea (∼200 km wide) of wrenching around the Azores–GribraltarFracture Zone (see inset of Fig. 1).
3.3 Lithospheric structure
As discussed in Section 2, the thermal and mechanical structureof the lithosphere is computed at each node of the FEG from theelevation, the surface heat flow and the rheology of the crust andmantle lithosphere, assuming local isostasy, a steady state thermalregime and the thermal-density parameters of Table 1. We describebelow the utilized data sets and compare, with considerable detail,the model predictions with the available evidences and previouslithospheric models.
The topography data set used was the GEBCO 1 arc-minute grid,which provides a continuous digital terrain model over oceans andland. Offshore, the data is mainly based on digitized bathymetriccontours from the GEBCO Digital Atlas, together with shallow-water soundings where available (GEBCO, British OceanographicData Centre 2003). Onshore, the elevations are from the GLOBEdigital elevation model (GLOBE Task Team & others 1999). Thedata has subsequently been re-sampled at 5 arc-minute grid spacingfor usage in SHELLS, as this resolution provides sufficient infor-mation for the modelling. All gridding and re-sampling operationshave been performed using the open source GMT software (Wessel& Smith 1998).
For the surface heat flow, we used an updated and re-griddedversion (5 arc-minute spacing) of the data set compiled by Jimenez-Munt & Negredo (2003). The utilized data set includes the mea-surements available from the global data set of Pollack et al. (1993),
C© 2012 The Authors, GJI, 188, 850–872
Geophysical Journal International C© 2012 RAS

856 T. A. Cunha et al.
Figure 4. Model calculated lithospheric structure, assuming local isostasy and a steady state thermal regime (see Section 2 of the text for details). The mainthermal-density parameters are provided in Table 1. (a) Crustal thickness, with contours every 2.5 km. (b) Total lithopsheric thickness, with contours every10 km.
complemented by data in the Iberia Peninsula, its margins and theWestern Mediterranean compiled by Fernandez et al. (1998). Afew measurements offshore Galicia (∼42◦N; Louden et al. 1997),the SW Portuguese margin and Gulf of Cadiz (Grevemeyer et al.2009) have also been included in the compiled grid. In the Atlantic,offshore Iberia and Morocco, the lack of data was compensatedby assuming an age-heat flow relationship from the cooling platemodel of Parsons & Sclater (1977).
Figs 4(a) and (b) show the model predicted crustal and litho-spheric thicknesses, respectively. In general, crustal thicknessesincrease from <10 km in the distal West Iberia margin to∼30 km along the coast, in good agreement with the results fromnumerous seismic refraction/wide-angle experiments, both offshore(e.g. Pinheiro et al. 1992; Whitmarsh et al. 1996; Gonzalez et al.1999, 2001; Dean et al. 2000; Afilhado et al. 2008) and onshore(Cordoba et al. 1988; Banda 1988; Dıaz et al. 1993; Matias 1996). Asimilar structure is also recovered off NW Morocco, where slightlyhigher crustal thicknesses are found offshore (Contrucci et al. 2004),and along the northern Spanish coast, between 5◦W and 9◦W ap-proximately (Alvarez-Marron et al. 1997 and references therein).
Between the Gulf of Cadiz and the Horseshoe and the Seineabyssal plains, the model shows a westward thinning of the crustfrom >25 to <10 km. Near the Portuguese and Spanish southerncoasts, and towards the west, this crustal structure is consistentwith that constrained from multichannel and wide-angle seismicprofiles (Fernandez et al. 2004; Rovere et al. 2004). Towards thecentral Gulf of Cadiz, however, it is likely that the model predictedcrustal thicknesses include most of the thick olisthostrome body;see compilations of seismic data by Thiebot & Gutscher (2006) andGutscher et al. (2009). In the Alboran Sea, the model predictedcrustal thicknesses are consistent with those compiled by Gutscheret al. (2009) and comparable with the models inferred by Torne
et al. (2000) and Fullea et al. (2006), based on combined forwardmodelling of heat-flow, gravity, geoid and elevation data.
In the west and central Iberia Peninsula, as well as under thesurrounding mountain ranges, the predicted crustal thicknesses arealso in good general agreement with the available constraints fromboth seismic data (Choukroune 1992; ILIHA DSS Group 1993;Matias 1996; Pedreira et al. 2003) and tomography models (Gurrıa& Mezcua 2000; Souriau et al. 2008; Dıaz & Gallart 2009). Forexample, the wide-angle/refraction seismic data show a progressivethickening of the crust between the northern Portugal and Galiciaand the central Iberia System, from 30 to 34 km, approximately,and a relatively constant 30-km-thick crust in the South Portugueseand Ossa Morena terranes (Matias 1996; ILIHA DSS Group 1993).The larger discrepancies are observed in areas of large sedimentaccumulations, such as the high Douro and Tejo basins, to the northand south of the Spanish Central System, respectively. In both cases,however, the differences in relation to our model do not exceed 5km (Dıaz & Gallart 2009 and references therein).
In North Africa, the seismic constraints on the crustal structureare relatively scarce, or even inexistent, as in the Sahara Craton.Along the Atlas mountains, however, our model predicts a crustalroot which is in average 5 km thicker than that constrained froma seismic explosion event realized along NNW–SSE, NW–SE andE–W profiles (Wigger et al. 1992). Combined 3-D topography, geoidand gravity modelling also suggest a crustal thickness varying from34 to 38 km between the middle and the High Atlas (Fullea et al.2007).
Fig. 4(b) shows that a regional lithospheric thickness of85–95 km is recovered under central and west Iberia Peninsulaas well as along the Atlantic margins of Iberia and Africa. On-shore, these values are slightly higher than inferred from shear wavevelocity modelling (80 km; Badal et al. 1993) and deep seismic
C© 2012 The Authors, GJI, 188, 850–872
Geophysical Journal International C© 2012 RAS

Neotectonics SW Iberia–Gulf of Cadiz–Alboran 857
sounding investigations (85–90 km; Dıaz et al. 1993). The relativelyshort wavelength variations observed in the map of Fig. 4(b) are ei-ther due to local crustal thickening (e.g. the volcanic seamounts andthe Galicia Bank in the West Iberia margin and continental Iberiamountain ranges), important heat flow gradients (e.g. between theGulf of Cadiz and the Alboran Sea, and across the Pyrenees), or toa combination of both (e.g. the Cantabrian mountains and CentralIberia System).
Along the continental margins, offshore and underneath Africa,previous lithospheric thickness estimates are mostly based on com-bined forward modelling of topography, heat flow, gravity and geoiddata (e.g. Zeyen & Fernandez 1994; Banda et al. 1995; Torneet al. 2000; Zeyen et al. 2005; Fullea et al. 2007). In most areas,the differences between these estimates and the model presentedin Fig. 4(b) are <15 km, including the Pyrenees–Catalan ranges(Zeyen & Fernandez 1994), under the Betic chain and Alboran Sea(Torne et al. 2000) and along the West Iberia margin (Banda et al.1995). Large discrepancies are, nevertheless, observed in the east-ern Straits of Gibraltar and Rharb Basin and in the Atlas mountains,where lithospheric thicknesses of 140–160 and 60–80 km, respec-tively, have been modelled (e.g. Zeyen et al. 2005; Fullea et al.2007). The main difference is that these studies relax the heat flowconstraints and are strongly influenced by geoid anomaly data. Inthe eastern Atlas, for example, the 2-D model put forward by Zeyenet al. (2005) overestimates the measured heat flow by up to 30 mWm−2.
The 3-D lithosphere model proposed by Fullea et al. (2007) mim-ics the ‘L-shaped’ P-wave tomographic anomalies of Spakman &Wortel (2004) under the Gibraltar Arc, though displaced to the eastby up to 100 km in the Gulf of Cadiz. On the other hand, the thicklithosphere extending from offshore NW Morocco to the Gulf ofCadiz and the Betic chain (>140 km thick) is not confirmed byrecent tomography (e.g. Raykova & Panza 2010) and receiver func-tion studies (Dundar et al. 2011). Dundar et al. (2011), in particular,based on observations from stations surrounding the Alboran Sea,central Iberia and Morocco, suggests a lithosphere–asthenosphereboundary around 90–100 km depth under NW Morocco and south-ern Portugal, shallowing to 60 km in the Alboran, consistent with thepredictions from our model. Considering the existing observationsand model predictions, the Fullea et al. (2007) thick lithospheremay be regarded as an end member model for the region.
Notwithstanding, we agree with Fullea et al. (2007) that theadopted assumption of thermal steady-state is particularly accept-able for old tectonothermal provinces. In contrast, the study areawas affected by Mesozoic extension and Alpine orogeny, and there-fore is likely affected by transient perturbations in the temperaturedistribution. Model results must therefore be interpreted as averagephysical conditions necessary to produce the required density dis-tribution and/or measured heat flow, rather than the actual thermalstructure. Fullea et al. (2007) suggest that the steady state assump-tion leads to overestimation of the actual lithospheric thickness inregions of lithospheric thinning and to its underestimation wherethe lithosphere is thickened.
4 M O D E L / K I N E M AT I C C O N S T R A I N T S
The thin-sheet modelling results are quantitatively compared andscored with three different sets of available kinematic and stressdata: (1) stress directions; (2) seismic strain rate and (3) GPS in-ferred velocities. Together, these data provide a solid framework tounderstand the effects that different fault geometries and/or bound-
Figure 5. Direction of most compressive horizontal principal stress. NF,Normal faulting; NS, Normal/Strike-slip (transtension); SS, Strike-slip; TS,Thrust/Strike-slip (transpression); TF, Thrust faulting; Und., undefined faultmechanism. The grey shaded rectangle shows the area of scoring, that is,where the fit between the model predictions and observations will be mea-sured (see text).
ary conditions may have on the present-day seismotectonic regimeof the region. Some changes were made in relation to previous ver-sions of the scoring code, which improve the quality of the scoring.These include the definition of a maximum earthquake magnitude,when calculating the seismic strain rate from the recorded events,the rating of the GPS measurements according to the size of theassociated error ellipses, and the definition of a subarea where thescoring is performed. For this study, we delimited the scoring areabetween 13◦W and 0◦, and between 32◦N and 40◦N (shaded areain Fig. 5). In this way, we avoid border effects and focus on thedomains where our models are of greater relevance, namely the SWIberia margin, the Gulf of Cadiz and the Alboran domain.
4.1 Stress orientations
The misfit in the principal stress directions is evaluated as the meandeviation between the observed and the computed maximum hor-izontal compression stress azimuths—Shmax (e.g. Jimenez-Muntet al. 2001; Jimenez-Munt et al. 2003). In total, 199 Shmax azimuthshave been compiled within the scoring area (Fig. 5), of which 107were extracted from the World Stress Map (Heidbach et al. 2008).The rest were determined from earthquake focal mechanism solu-tions, not included in the Heidbach et al. (2008) compilation. Forscoring, the data is weighted according to the quality of the mea-surement, with weights varying between 1 and 5 (corresponding toqualities E to A, respectively; e.g. Jimenez-Munt et al. 2001). Over88% of the stress data used is of class C, 4% of Class A and B andonly 7% of class D.
The value of the scoring of Shmax in Neotectonic modelling wasdiscussed in more detail by Bird (1998). He found that due to thelarge data dispersion in the Shmax data sets, which have a stronginfluence of local conditions, it is not expected that any neotectonicmodelling of the lithosphere in a broad area will obtain an averageerror less than 25◦. Moreover, keeping in mind the small range ofexpected variations in the values of this misfit, we can infer thateven small variations of the average misfit can be significant todiscriminate between different models.
C© 2012 The Authors, GJI, 188, 850–872
Geophysical Journal International C© 2012 RAS
858 T. A. Cunha et al.
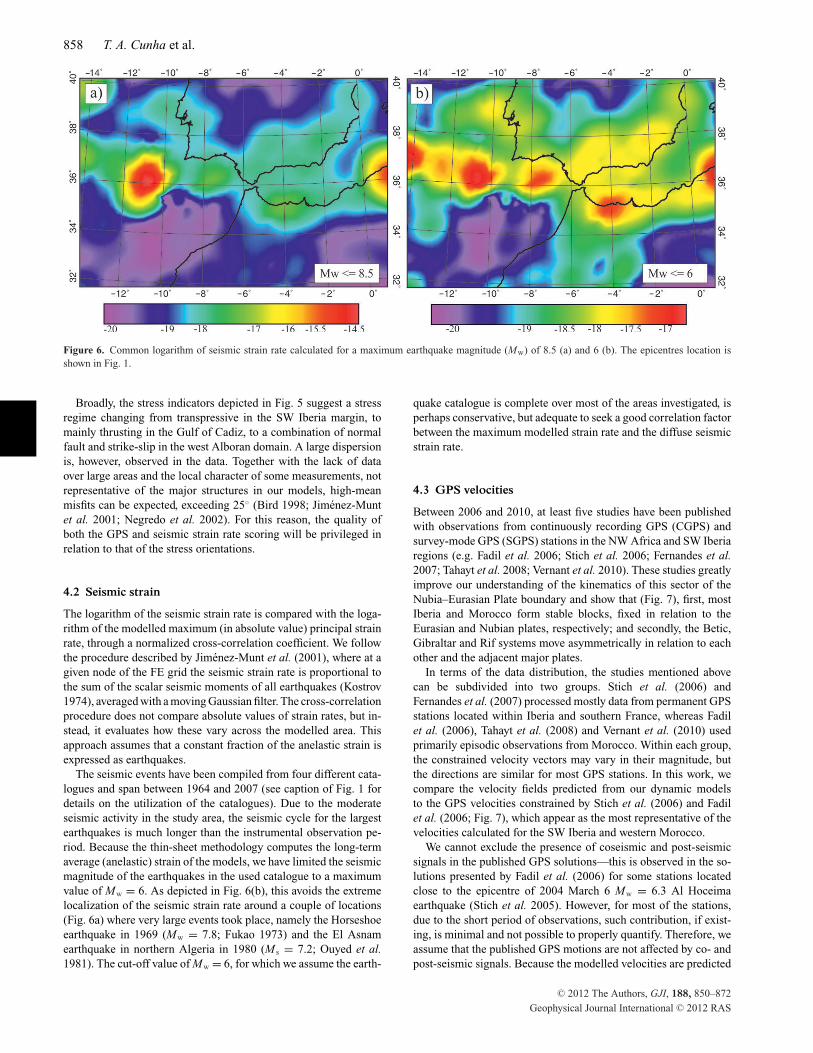
Figure 6. Common logarithm of seismic strain rate calculated for a maximum earthquake magnitude (Mw) of 8.5 (a) and 6 (b). The epicentres location isshown in Fig. 1.
Broadly, the stress indicators depicted in Fig. 5 suggest a stressregime changing from transpressive in the SW Iberia margin, tomainly thrusting in the Gulf of Cadiz, to a combination of normalfault and strike-slip in the west Alboran domain. A large dispersionis, however, observed in the data. Together with the lack of dataover large areas and the local character of some measurements, notrepresentative of the major structures in our models, high-meanmisfits can be expected, exceeding 25◦ (Bird 1998; Jimenez-Muntet al. 2001; Negredo et al. 2002). For this reason, the quality ofboth the GPS and seismic strain rate scoring will be privileged inrelation to that of the stress orientations.
4.2 Seismic strain
The logarithm of the seismic strain rate is compared with the loga-rithm of the modelled maximum (in absolute value) principal strainrate, through a normalized cross-correlation coefficient. We followthe procedure described by Jimenez-Munt et al. (2001), where at agiven node of the FE grid the seismic strain rate is proportional tothe sum of the scalar seismic moments of all earthquakes (Kostrov1974), averaged with a moving Gaussian filter. The cross-correlationprocedure does not compare absolute values of strain rates, but in-stead, it evaluates how these vary across the modelled area. Thisapproach assumes that a constant fraction of the anelastic strain isexpressed as earthquakes.
The seismic events have been compiled from four different cata-logues and span between 1964 and 2007 (see caption of Fig. 1 fordetails on the utilization of the catalogues). Due to the moderateseismic activity in the study area, the seismic cycle for the largestearthquakes is much longer than the instrumental observation pe-riod. Because the thin-sheet methodology computes the long-termaverage (anelastic) strain of the models, we have limited the seismicmagnitude of the earthquakes in the used catalogue to a maximumvalue of Mw = 6. As depicted in Fig. 6(b), this avoids the extremelocalization of the seismic strain rate around a couple of locations(Fig. 6a) where very large events took place, namely the Horseshoeearthquake in 1969 (Mw = 7.8; Fukao 1973) and the El Asnamearthquake in northern Algeria in 1980 (M s = 7.2; Ouyed et al.1981). The cut-off value of Mw = 6, for which we assume the earth-
quake catalogue is complete over most of the areas investigated, isperhaps conservative, but adequate to seek a good correlation factorbetween the maximum modelled strain rate and the diffuse seismicstrain rate.
4.3 GPS velocities
Between 2006 and 2010, at least five studies have been publishedwith observations from continuously recording GPS (CGPS) andsurvey-mode GPS (SGPS) stations in the NW Africa and SW Iberiaregions (e.g. Fadil et al. 2006; Stich et al. 2006; Fernandes et al.2007; Tahayt et al. 2008; Vernant et al. 2010). These studies greatlyimprove our understanding of the kinematics of this sector of theNubia–Eurasian Plate boundary and show that (Fig. 7), first, mostIberia and Morocco form stable blocks, fixed in relation to theEurasian and Nubian plates, respectively; and secondly, the Betic,Gibraltar and Rif systems move asymmetrically in relation to eachother and the adjacent major plates.
In terms of the data distribution, the studies mentioned abovecan be subdivided into two groups. Stich et al. (2006) andFernandes et al. (2007) processed mostly data from permanent GPSstations located within Iberia and southern France, whereas Fadilet al. (2006), Tahayt et al. (2008) and Vernant et al. (2010) usedprimarily episodic observations from Morocco. Within each group,the constrained velocity vectors may vary in their magnitude, butthe directions are similar for most GPS stations. In this work, wecompare the velocity fields predicted from our dynamic modelsto the GPS velocities constrained by Stich et al. (2006) and Fadilet al. (2006; Fig. 7), which appear as the most representative of thevelocities calculated for the SW Iberia and western Morocco.
We cannot exclude the presence of coseismic and post-seismicsignals in the published GPS solutions—this is observed in the so-lutions presented by Fadil et al. (2006) for some stations locatedclose to the epicentre of 2004 March 6 Mw = 6.3 Al Hoceimaearthquake (Stich et al. 2005). However, for most of the stations,due to the short period of observations, such contribution, if exist-ing, is minimal and not possible to properly quantify. Therefore, weassume that the published GPS motions are not affected by co- andpost-seismic signals. Because the modelled velocities are predicted
C© 2012 The Authors, GJI, 188, 850–872
Geophysical Journal International C© 2012 RAS

Neotectonics SW Iberia–Gulf of Cadiz–Alboran 859
Figure 7. Comparison between model calculated and GPS-inferred velocities for different boundary settings. (a) Assumes the DEOS2K plate kinematic modelfor the relative motion between Nubia and Iberia and a ‘free’ boundary to the west of the Iberian block. (b) As in (a) but assuming a ‘fixed’ boundary to thewest in Iberia. The ‘free’ boundary segment between 36◦ and 37◦ simulates an area of distributed deformation (see text). (c) Assumes the NUVEL-1A platekinematic model. The GPS velocities of Stich et al. (2006; orange) and Fadil et al. (2006; magenta) are residuals with respect to a stable European referenceframe. The ellipses represent the error associated with the observation within a 95 per cent confidence limit. All GPS solutions are realized in the ITRF2000global reference frame (Altamini et al. 2002).
long-term averages assuming a steady-state fault regime, a correc-tion is applied to the later before scoring the models.
In essence, this correction simulates temporary (interseismic)locking of the brittle portion of the faults (Liu & Bird 2002). Themisfit between modelled and the GPS constrained velocities is thenexpressed in terms of weighted mean error, where the weightingfactor is a function of the error ellipses associated with the estimatedvelocities in each GPS station (Fig. 7). Because we score the modelsindependently for each GPS data set the results will not be affectedby the fact that different authors may apply distinct methodologiesto compute the uncertainties in the GPS velocities.
5 M O D E L L I N G R E S U LT S A N DD I S C U S S I O N
The numerical experiments performed in this work are presentedin five stages. First, we test different model boundary conditions,by comparing the computed velocity fields with the available GPS
data. We then discuss the predicted sense and slip rates along themain fault systems for our reference Model-1 (Fig. 3a) in the lightof a wide range of observations. Third, we test alternative tectonicsettings for the SW Iberia, Gulf of Cadiz and west Alboran regions,where there are still large uncertainties on the lateral extent and con-nectivity between the main fault systems, their present day activityand their relation with the observed seismicity. Fourth, we scorethe models against the available kinematic and dynamic constraints(Shmax, seismic strain rate and GPS velocities). In Section 6, wediscuss some implications for the tectonic and geodynamic settingof the region.
5.1 Boundary conditions
The model boundary conditions are essentially defined by the ge-ometry and properties of the plate boundaries and by the kinematicmodel assumed to describe the relative motions between the tec-tonic plates. As referred in Section 3.2, we do not consider inthis study the effect of basal drag, that is, which may result from
C© 2012 The Authors, GJI, 188, 850–872
Geophysical Journal International C© 2012 RAS

860 T. A. Cunha et al.
Figure 8. Long-term average fault slip rates for reference Model-1 and the thermal, mechanical and rheological parameters specified in Table 1. Boundaryconditions applied as in Fig. 7(b). The modelled structures are identified in Fig. 3.
mantle flow and traction at the lithosphere–asthenosphere boundary,in line with previous neotectonic modelling studies for the region(Jimenez-Munt et al. 2001; Negredo et al. 2002).
Fig. 7 shows the model predicted velocity field for three arguableboundary settings. Also plotted, for comparison, are the GPS ve-locities determined by Fadil et al. (2006; in magenta) and Stichet al. (2006; in orange). The models presented in Figs 7(a) and (b)both use the DEOS2K plate kinematic model of Fernandes et al.(2003) for the relative motion between Africa and Iberia (see insetof Fig. 2). They differ, however, in the type of boundary assumedwest of Iberia. The model in Fig. 7(a) considers a ‘free’ boundaryto the west, north of the Gloria fault, therefore allowing continu-ous motion in this region, similarly to that proposed by Negredoet al. (2002). These authors, however, were primarily concernedwith the neotectonics of the Alboran Sea and surrounding Ibero-Maghrebian domains, and did not have access to the GPS data, onlyrecently made available. As depicted in Fig. 7(a), this type of modelpredicts small relative motion between Iberia and the Maghrebianregion, suggesting that Iberia is moving together with the Nubianplate, and largely overestimates the GPS velocities inferred in cen-tral and west Iberia. The number of permanent GPS sites in thisregion is large enough to conclude that the current velocity field isrepresentative of the present-day kinematics of this area.
In the model of Fig. 7(b), both the northern and western Iberiaboundaries are fixed to the velocity reference frame (i.e. fixedEurasia Plate). As discussed in Section 3.2, the gap between 36◦Nand 38◦N allows for a broad area of wrenching between Africa andIberia, though the velocities predicted by this type of model do notchange significantly if a sharp Iberia–Africa boundary is definedat the Gloria Fault (∼37.2◦N; Fig. 1). Despite its simplicity, thismodel is in general good agreement with the GPS observations andexplains some relevant features such as the turn in the direction ofthe velocity field from NW to predominantly WNW–ESE acrossthe Rif and Atlas mountains, and the western motion of SW Spainin relation to Europe (2.5–4.4 mm yr−1 at San Fernando according
to Stich et al. 2006 and Fernandes et al. 2007, respectively), andof NW Morocco in relation to stable Nubia (∼1–2 mm yr−1; Fadilet al. 2006; Tahayt et al. 2008).
Finally, we tested the NUVEL-1A plate kinematic model, whichcan be considered as an end-member boundary condition, that is,one which presents the greatest obliquity in relation to the recentlyGPS-derived plate kinematic models (see inset of Fig. 1). As de-picted in Fig. 7(c), the velocities calculated with this model showsystematic deviations in relation to the GPS-derived velocities insome areas1 . For example, in central Morocco the model predictsthe anticlockwise rotation of the velocity field to occur further tothe west, and along the NW Morocco and SW Iberia coasts it under-estimates the western component of the velocity field measured inseveral GPS stations. It appears, therefore, that a fixed western Iberiaboundary, combined with a plate kinematic model which predictsa WNW–ESE movement of Africa in relation to Iberia, stronglytilted in relation to the NUVEL-1A global solution of DeMets et al.(1994), are the most suitable boundary settings for the modelling(Fig. 7b).
5.2 Reference model predictions versus observations
Fig. 8 shows the long-term average fault slip rates predicted forreference Model-1, assuming the boundary conditions presented inFig. 7(b) and the default thermal–mechanical parameters of Table 1.Ideally, the predicted slip rates should be quantitatively comparedwith measurements along the fault planes. Such measurements,however, are too scarce within the studied area to obtain a mean-ingful scoring. Consequently, the modelling results will be mostly
1 Note that the GPS data used for imposing the boundary conditions refersto a model for the angular velocities of several plates (including Nubia andEurasia), which considers the velocities over a much broader area, awayfrom the plate boundaries (Fernandes et al. 2003).
C© 2012 The Authors, GJI, 188, 850–872
Geophysical Journal International C© 2012 RAS

Neotectonics SW Iberia–Gulf of Cadiz–Alboran 861
discussed in terms of the GPS inferred deformation, the distributionof the seismic strain rate, geological constraints when available, andcomparisons with previous neotectonic models in the region.
Broadly, the slip directions in the east Alboran Sea, SE Iberiaand along the Tell mountains, are consistent with those predictedin previous works and with available geological, seismologic andGPS indicators (Negredo et al. 2002; Jimenez-Munt et al. 2003;Stich et al. 2006 and references therein). The model predicts thehighest shortening rates in the Tell Mountains (between 2.6 and4.3 mm yr−1). Possibly, these estimates should be considered asan upper limit, due to the exaggerated lateral continuity of thethrusts assumed in the model (Section 3.1). Notwithstanding, theyare within the range of values predicted by Dewey et al. (1989)for the last 9 myr (5 mm yr−1), and inferred by Meghraoui et al.(1996) for the Quaternary (2.3 mm yr−1). More recently, Stich et al.(2006) based on GPS observations estimated more than 3 mm yr−1
of African–Iberia convergence accommodated in the north Algerianmargin. This suggests that, in the long term, most of the shorten-ing in the region is being accommodated by faulting, consistentwith the occurrence of frequent, reverse faulting, moderate to largeearthquakes (e.g. Buforn et al. 2004; Stich et al. 2006). Between SEIberia and Nubia, the model predicts up to 2.8 mm yr−1 of dextralmotion, accommodated along the Yusuf and Alpujarra faults cor-ridors (added 1.2 and 1.6 mm yr−1, respectively). This amount ofwrenching is also comparable with that inferred from the GPS databy Stich et al. 2006 (∼3.5 mm yr−1). In the Cadiz–Alicante faultzone, which has a less favourable WSW–ENE direction, the modelpredicts a much lower slip rate (∼0.1 mm yr−1), except where itintersects the Alpujarra Corridor (see also Fig. 3 for faults nomen-clature).
Further to the west, significant shortening is also predicted alongthe faults that border the Alboran Ridge (up to 2.8 mm yr−1). Inthis area, however, the focal mechanism solutions of shallow earth-quakes indicate predominantly sinistral strike-slip and minor normalfault motion (Buforn et al. 2004; Stich et al. 2006). In fact, onlyone intermediate depth (∼80 km depth), reverse fault earthquakehas been reported in the area (Mw = 3.9; Buforn et al. 2004). Themodel presented in Fig. 8 is also inconsistent with the high seis-micity that characterizes the Murcia and Alhoceima regions (in theBetics and Rif ranges, respectively; Fig. 1).
In the western High Atlas, the model predicts less shortening(0.1–0.8 mm yr−1) than estimated from GPS data, which variesbetween maximum ≤1 mm yr−1 (Fadil et al. 2006; Vernant et al.2010) and 2 mm yr−1 (Stich et al. 2006). Similar amounts of short-ening (1–2 mm yr−1) have also been inferred from restored crosssections in the Middle and High Atlas (Beauchamp et al. 1999;Gomez et al. 2000; Teixell et al. 2003). A plausible interpretationis that part of the shortening is being accommodating by foldingand/or by crustal-scale (or lithospheric-scale) buckling. In fact, thearea is characterized by moderate to low seismicity, and only onestrong event (Mb = 5.9), reverse fault earthquake has been recorded(Alami et al. 2004). In the Middle Atlas, the predicted low-slip rates(<0.2 mm yr−1) are consistent with those estimated in quaternaryfault scarps (0.05–0.3 mm yr−1; Rigby 2008).
Along the western Betics and Rif mountains, our referenceModel-1 shows significant differences in relation to previously pub-lished neotectonic studies, where the chains have been explicitlymodelled as a single orogenic belt, connected through a majorthrust front arcuated under the eastern Gulf of Cadiz (i.e. an ac-tive Gibraltar Arc; Negredo et al. 2002; Jimenez-Munt et al. 2003).Such studies predict relatively high-convergence rates in the Beticsand the Rif fronts (1–2 mm yr−1 approximately), combined with
moderate normal faulting and dextral strike-slip (0.3–0.5 mm yr−1)west of the Straits of Gibraltar. Contrastingly, the model presentedin Fig. 8 suggests low-convergence rates in the Betics and a com-bination of strike-slip and thrusting in the Rif mountains, in bet-ter agreement with the shallow crustal deformation inferred fromfocal mechanism solutions in NW Morocco (Meghraoui et al. 1996;Buforn et al. 2004).
In the Gulf of Cadiz, Horseshoe Abyssal Plain and SW Por-tuguese margin, our reference fault Model-1 comprises the threemain types of mapped structures: (1) large WNW–ESE trendingstrike-slip faults (the eastern Gloria Fault segment and the dis-rupted SWIM lineaments, ca. 200 km long segments); (2) thePortimao Bank and Guadalquivir ENE–WSW trending, dippingto the north thrust faults and (3) the NNE–SSW to NE–SW, dip-ping to the east thrusts (e.g. the Horseshoe, the Marques de Pombaland Tagus Abyssal Plain thrusts), connected along NW–SE trend-ing, sinistral transfer faults. As depicted in Fig. 8, the model pre-dicts a distribution of the deformation along the mapped structures,with: up to 1 and 1.4 mm yr−1 dextral slip in the northern SWIMand Gloria fault lineaments, respectively; up 0.5 mm yr−1 in theGuadalquivir thrust and a maximum 0.7 mm yr−1 in NE–SW trend-ing thrusts off SW Portugal, combined with 0.3–0.5 mm yr−1 in thesinistral transfer faults.
The predicted strain partitioning between the different tectonicstructures in the region agrees with the large dispersion of epicen-tres, as well as the deformation of the Pliocene–Recent sedimentsobserved in numerous compressional and transpressional structuresbetween south of the Horseshoe Abyssal Plain and the SW Por-tuguese margin (Masson et al. 1994; Hayward et al. 1999; Terrinhaet al. 2003; Zitellini et al. 2004; Terrinha et al. 2009). Moreover,the sense of movement predicted in the modelled faults is consis-tent with the predominant stress regime inferred from intermediateto large earthquakes, which comprise shallow to intermediate depthevents associated with thrust and/or dextral strike-slip faults (Fukao1973; Buforn et al. 1988; Stich et al. 2007).
However, according to Stich et al. (2006), who projected the GPSvelocities along the direction of the principal seismic stresses, theamount of shortening between NW Morocco and southern Portugalis ∼1.4 mm yr−1, that is, about three times larger than predicted inModel-1 (<0.5 mm yr−1 in the Portimao Bank and Guadalquivirthrusts; Fig. 8). This suggests that, either part of the strain is beingaccommodated elastically within the lithosphere or, as appears to besupported by the seismicity of the region, the model underestimatesthe amount of thrusting in the northern Gulf of Cadiz. We also notethat the distribution of the strain is not entirely consistent with thatcomputed from the instrumental seismicity, which in the Gulf ofCadiz focus along a WSW–ENE, ∼80-km-wide band to the north(Fig. 6b, for Mw ≤ 6; see also Fig. S1d in the online SupportingInformation for comparison2 ).
Along the SW Portuguese margin, Model-1 is consistent withthe shortening estimated by Stich et al. (2006) of ∼0.5 mm yr−1.Some geological constraints on the fault slip rates are also acces-sible off SW Portugal, where extensive and detailed seismostrati-graphic work has been done in the last decade (e.g. Roque 2008).In the Marques de Pombal Fault, for example, it appears that up to
2 Additional figures in the online Supporting Information include: Fig. S1shows the fault slip rates, the computed strain and the predicted Shmax andvelocities for tectonic Models-1,2 and 3; Fig S2 tests a model with an activeGibraltar Arc linking the Betic and Rif chains; Fig S3 compares the modelpredictions for two contrasting lithosphere structures.
C© 2012 The Authors, GJI, 188, 850–872
Geophysical Journal International C© 2012 RAS

862 T. A. Cunha et al.
1 km of vertical displacement accumulated within the last 5–10 myr,resulting in the condensed Tortonian (possibly base of Pliocene) toRecent sediment sequences in the fault footwall (Roque 2008). Foran average fault plane dip of 24◦ (Zitellini et al. 2001) this corre-sponds to a net slip rate of 0.25–0.5 mm yr−1, that is, slightly lessthan the predictions from our model (up to 0.7 mm yr−1; Fig. 8).However, since the convergence between Nubia and Iberia rotatedfrom NNW–SSE in the Middle Miocene, to WNW–ESE in recenttimes (e.g. Ribeiro et al. 1996), favourable to the orientation of theNNW oriented Marques de Pombal thrust fault, it is likely that theobserved displacement accelerated in recent times, even exceedingthe model predictions.
In summary, our reference tectonic Model-1 is broadly consistentwith the instrumental seismicity and the kinematics of the Iberia andNubia plates inferred from GPS data in the east Alboran, Tell Moun-tains and west of southern Portugal. Some improvements in relationto previously proposed neotectonic models are also observed alongthe Rif Mountains (NE Morocco), where the model predicts a com-bination of reverse faulting and dextral strike-slip and in the Atlasmountains. In the central-west Alboran, Gulf of Cadiz and Horse-shoe abyssal plain, however, the model is not fully consistent withthe distribution of the seismicity and, in places, with the amountof shortening inferred from GPS data. In the next two sections,we will discuss the results from two alternative fault models andquantitatively evaluate the models predictions against the availablekinematic and dynamic constraints.
5.3 Tectonic setting of the west Alboran, Gulf of Cadizand SW Iberia margin
In this section, we compare the results from three distinct structuralmodels, representative of a large series of numerical experimentsthat translate some of the geodynamic models proposed for the Gulfof Cadiz–SW Iberia region. Fault Model-2 (Fig. 9a) is based on therecently published work of Zitellini et al. (2009), which identifieda narrow (<100 km wide) and long (>600 km) band of strike-slipdeformation (the SWIM lineaments; Fig. 2), probably linking theGloria Fault and the Rif-Tell cordilleras. As discussed in Section 1,the authors interpreted these lineaments as a precursor of a new
transcurrent plate boundary between Iberia and Africa. Model-3(Fig. 9b), on the other hand, considers that the deformation along theSWIM lineaments is restricted to the upper crust and sedimentarycover (i.e. has limited expression at the lithospheric scale), andthat the deformation is primarily accommodated along seismicallyactive structures. To build this model, we consider a major structurecomprising the Portimao Bank and Gualdalquivir thrusts off southPortugal, and a NNE–SSW trending major shear zone across theAlboran; the Trans-Alboran Shear Zone (TASZ) as proposed byStich et al. (2006). Model-3 also tests a highly segmented thrustfront along the middle-high Atlas and the central-northern Betics,where the seismic strain rate is relatively low (Fig. 6).
Fig. 9(a) shows that the model which includes a long WNW-ESElineament, continuous for more than 600 km as proposed by Zitelliniet al. (2009), concentrates almost all the deformation along a narrowzone in the vicinity of the lineament. The predicted slip rates varyalong this lineament from ∼2 mm yr−1, east of the Horseshoe fault,to almost 4 mm yr−1 in the Horseshoe abyssal plain. North of thewrenching zone, however, the slip rates along the NE–SW thruststhat border the southwest Portuguese coast are reduced to half, inrelation to Model-1, or become insignificant, as along the northGorringe Bank thrust. Model-2 also predicts an increase in thefault slip rates across the Rif Mountains, in the continuation of theSWIM lineaments, with a stronger strike-slip component. A majordifficulty of this model is, therefore, to conciliate the existence of adeveloping plate boundary along the major SWIM lineaments withthe seismicity of the area, which is displaced 50–100 km to the north(Figs 6 S1e), and the widespread evidences of recent re-activationof thrust faults to the north of the Horseshoe Abyssal Plain.
The predicted fault slip rates in our model Model-3 (Fig. 9b)also show important differences in relation to those of our referenceModel-1 (Fig. 8). The elimination of the SWIM lineaments, for ex-ample, results in an increase in the activity of the NE–SW thrusts offsouthwest Portugal (up to 100 per cent in the Horseshoe fault) andalong the Gloria Fault. Significantly higher fault slip rates are alsopredicted in the Portimao Bank and Gualdalquivir thrusts (>300per cent in relation to Model-1). Although connected, the type offaulting predicted by the model along these two structures varies asa function of their orientation, with predominantly thrusting in the
Figure 9. Long-term average fault slip rates predicted for two alternative tectonic model scenarios. (a) Fault Model-2 is based on the work of Zitellini et al.(2009) who consider the development of a new plate boundary along the WNW–ESE trending SWIM lineaments. (b) Fault Model-3 is based on the mappedstructures and the distribution of the seismic strain (see text). Boundary conditions applied as in Fig. 7(b). See Fig. 3 for the names of the structures.
C© 2012 The Authors, GJI, 188, 850–872
Geophysical Journal International C© 2012 RAS

Neotectonics SW Iberia–Gulf of Cadiz–Alboran 863
Gualdalquivir and dextral strike-slip along the more E–W orientedPortimao Bank Fault. In fact, the interpretation of multichannel seis-mic profiles suggests that during the Betic orogeny, in the Miocene,both structures acted as dipping to the north thrusts (Gracia et al.2003; Terrinha et al. 2009), whereas in recent times the deforma-tion is masked by the northward emplacement of the olisthostrome,the overlying sediments (Camerlenghi & Pini 2009) and wrenching(Terrinha et al. 2009). The mixed strike-slip and thrust regime pre-dicted for the area is, nevertheless, in good general agreement withthe seismicity of the region, characterized by strike-slip and thrustfocal mechanisms solutions (Buforn et al. 2004; Stich et al. 2006).
In the Rif Mountains, Model-3 predicts similar fault slip rates toModels-1 and 2, but with a strong predominance of thrust faulting.Although inconsistent with the lack of noteworthy thrust faultingrupture events in the area (Meghraoui et al. 1996; Buforn et al.2004), this model should not be rejected, since the time span of theinstrumental seismicity may be shorter than the recurrence periodof moderate–large size earthquakes. Moreover, the model predictedshortening is consistent with that inferred by Meghraoui et al. (1996)during the Pliocene–Quaternary, based on geological and geophys-ical (seismic and magnetic anomalies) data, of 1–2.3 mm yr−1. Inthe Atlas mountains, the amount of shortening predicted by thismodel, which assumes a highly disrupted thrust front, is signifi-cantly less than in Models-1 and 2 (Figs 8 and 9a, respectively) andin apparent disagreement with the amount of shortening predictedfrom geological constraints and GPS velocities.
As mentioned above, Model-3 also simulates the TASZ as put for-ward by Stich et al. (2006), linking the Palomares and Carbonerasfaults in SE Spain to the N’kor fault in northern Morocco, across theAlboran ridge. Although the continuity between the mapped struc-tures is a model assumption, it is in general agreement with the leftlateral strike-slip motion observed in some of the main structures,such as the Palomares and Carboneras faults in SE Spain (Martınez-Dıaz & Hernandez-Enrile 2004; Montenat et al. 1990) and theN’kor Fault in north Morocco (Meghraoui et al. 1996), and ex-plains a number of features in the seismicity (Stich et al. 2006,2010and references therein), including (1) the dominance of left-lateralstrike-slip events across the TASZ; (2) occasional normal and thrustfaulting events, both in SE Spain and along the Alboran Ridge, en-hancing the importance of fault interaction and local stress transfer
and (3) the occurrence of mainly reverse fault to strike-slip eventsin the easternmost sector of the Cadiz–Alicante fault zone. Themodel predicted maximum strike-slip rates, of ∼2 mm yr−1alongthe TASZ, between the Alpujarra corridor and the Alboran ridge,are also consistent with that estimated from GPS data (Stich et al.2006).
Finally, Model-3 considers the Lower Tagus Valley and Nazarefaults. The Lower Tagus fault system has been invoked as responsi-ble for moderate, but continued seismic activity (Fig. 1), and someimportant historical earthquakes, namely the 1531 (estimated M s =7.1; Sousa et al. 1992) and the 1909 (estimated M s = 5.9; Teves-Costa et al. 1999) events, which destroyed a large part of Lisbonand Benavente, respectively. Vilanova et al. (2003) also suggestedthat this fault might have been re-activated during the 1755 GreatLisbon Earthquake, which had its source area offshore SW Portu-gal. Cabral (1995), on the other hand, based on geological criteria,estimated the Pliocene-to-Recent activity of the Lower Vale do Tejofault in 0.05 and 0.1 mm yr−1, that is, consistent with the modelpredictions.
5.4 Models scoring
The results discussed above show clearly that the models predictedfault slip rates and the style of faulting depend on the assumedstructural framework as well as on the faults length and segmenta-tion. This has important implications for the geodynamic setting,the stress regime and the seismic hazard of the region. A way toquantitatively test the consistency of the different models with ob-servations is, therefore, critical. In this study, we use three differenttypes of constraints to score the models (see Section 4 for discus-sion of the data sets): (1) the seismic strain rate; (2) the directionof the maximum horizontal compression (Shmax) and (3) the GPSvelocity data.
5.4.1 Seismic strain rate and Shmax
Fig. 10 compares the scoring of the three fault models discussedin the previous sections in terms of the seismic strain rate andShmax. For each model, the fault friction coefficient (fc) is varied
Figure 10. Scoring of the three tested tectonic models, for a varying fault friction coefficient (fc), against seismic strain (right axis) and stress direction data(left axis). The improvement of the fit between modelled and observed is always upwards in the graphic. Model-3 provides the best fit to both the seismic andstress orientation data. Grey bar highlights best interval of fc values (see text).
C© 2012 The Authors, GJI, 188, 850–872
Geophysical Journal International C© 2012 RAS

864 T. A. Cunha et al.
systematically between 0.01 and 0.85. The results show little sen-sitivity for fc > 0.4. For lower values, the misfit between computedand observed stress direction progressively increases, whereas thecorrelation with the seismic strain rate is improved for 0.03<fc<0.2,and then, in Models 1 and 2, slightly decreases for 0.01<fc<0.03.As discussed in Section 4.2, Shmax observations show high disper-sion and are scarce over large areas, particularly in the deep offshore(Fig. 5). For this reason, we privilege the improvement in the seismiccorrelation and infer that for the modelled region 0.05<fc<0.08.This interval of fc values lies between the optimal friction coeffi-cients found by Negredo et al. (2002) for the Ibero-Maghrebian re-gion (0.04–0.06) and those obtained by Jimenez-Munt et al. (2001)and Jimenez-Munt & Negredo (2003) for the Azores–Gibraltar sys-tem (0.1–0.15). As suggested by Negredo et al. (2002), the lowvalues of fc may be indicative of a lower strength of faults in conti-nental domain.
As expected, the scoring results in Fig. 10 show that Model-3correlates better with the computed seismic strain rate than Models1 and 2. It is worth noticing, nevertheless, that a significant im-provement, of approximately 14 per cent, is achieved in relationto our reference Model-1 (based on mapped elements), and of 40per cent in relation to previously published neotectonic models forthe region, which either considered a more restricted (Negredo et al.2002) or a much larger (Jimenez-Munt et al. 2001; Jimenez-Munt &Negredo 2003) area for the scoring. The distribution of the modelcomputed strain depicted in Fig. 11(a) shows, in fact, a remark-able similarity with the observed (for Mw ≤ 6; Fig. 6b). The maindiscrepancies are observed within two relatively restricted areas,around Lisbon and in the central Alboran, where there are no in-strumental earthquakes to justify the model predictions. We recallthat the seismic coupling is assumed uniform all over the model,and that this assumption may fail in the Alboran domain, where avery thin lithosphere is inferred (<50 km; Fig. 4).
The scoring in terms of Shmax also favours Model-3. The im-provement in relation to our reference Model-1 is mainly noticed inthe northern Morocco–Alboran region and, particularly, in the east-ern Horseshoe Abyssal Plain-SW Iberia (between parallels 35◦N
and 37◦N parallel and meridians 10◦W and 11◦W), where Model-3is consistent with a more northerly oriented observed Shmax (Figs5 and 11b; Fig. S1h–i).
Despite this, relatively large errors in the computed mean stressazimuth are obtained in all the models, similar to those obtained inprevious neotectonic studies (Negredo et al. 2002; Jimenez-Munt &Negredo 2003). Large departures between the observations (Fig. 5)and the predictions from our best fit Model-3 (Fig. 11b), both interms of the direction and predicted stress regime, are noticed, forexample, along the southern Spanish and Portuguese coasts. Asdiscussed in Section 4, however, the great majority of the availablestress directions are computed from seismic events, often of smallmagnitude, which may reflect local interference patterns (e.g. Stichet al. 2010). For this reason, we have also compared our Model-3predicted stress azimuths with those computed by Stich et al. (2006),based on moment tensor mechanisms inferred from earthquakes ofMw ≥ 3.5. Four areas have been considered in the analysis, which areshown in Fig. 11(b). Area E of Stich et al. (2006), which comprisesthe Tell Mountain in northern Algeria, was not considered becausethe stress tensor is only poorly constrained in their work.
For the remaining areas, we obtained the following average de-viations between Stich et al. (2006) and Model-3 Shmax (com-puted assuming Fisher statistics): A—17.1◦; B—16.9◦; C/D—24.9◦; F—2◦. Except for area A, all the other deviations are inthe counter-clockwise direction. This represents an improvement of∼45 per cent in areas A and B, and of 17 per cent in areas C–D, inrelation to the previous scoring, where inferior quality stress mea-surements were dominant. Notwithstanding, all of our models failto reproduce the predominantly extensional stress regime in area B(Fig. S1i), where a large proportion of the computed stress tensorsare associated with normal faulting (Stich et al. 2006, 2010).
Fig. 10 also shows that Model-2 has the poorest seismic corre-lation coefficient and the greatest error in the direction of Shmax.This is an important result, which argues against the interpretationof the mapped SWIM lineaments as mature lithospheric-scale fea-tures, extending continuously between Gloria fault and the easternGulf of Cadiz; in which case they would accommodate most of
Figure 11. (a) Logarithm of smoothed strain rate predicted by fault Model-3, assuming a fault friction coefficient of 0.05. Arrows are predicted velocitieswith respect to Eurasia. (b) Shmax orientations and stress regime predicted by fault Model-3. Areas A to F (excluding E) are highlighted to compare Model-3predicted stress azimuths with those inferred by Stich et al. (2006) based on seismic moment tensors. Computed seismic strain and observed principal stressorientations, for comparison, are depicted in Figs 6 and 5, respectively. In Fig. S1 (Supporting Information), we show the smoothed strain rate and the predictedprincipal stress directions for Models 1, 2 and 3.
C© 2012 The Authors, GJI, 188, 850–872
Geophysical Journal International C© 2012 RAS
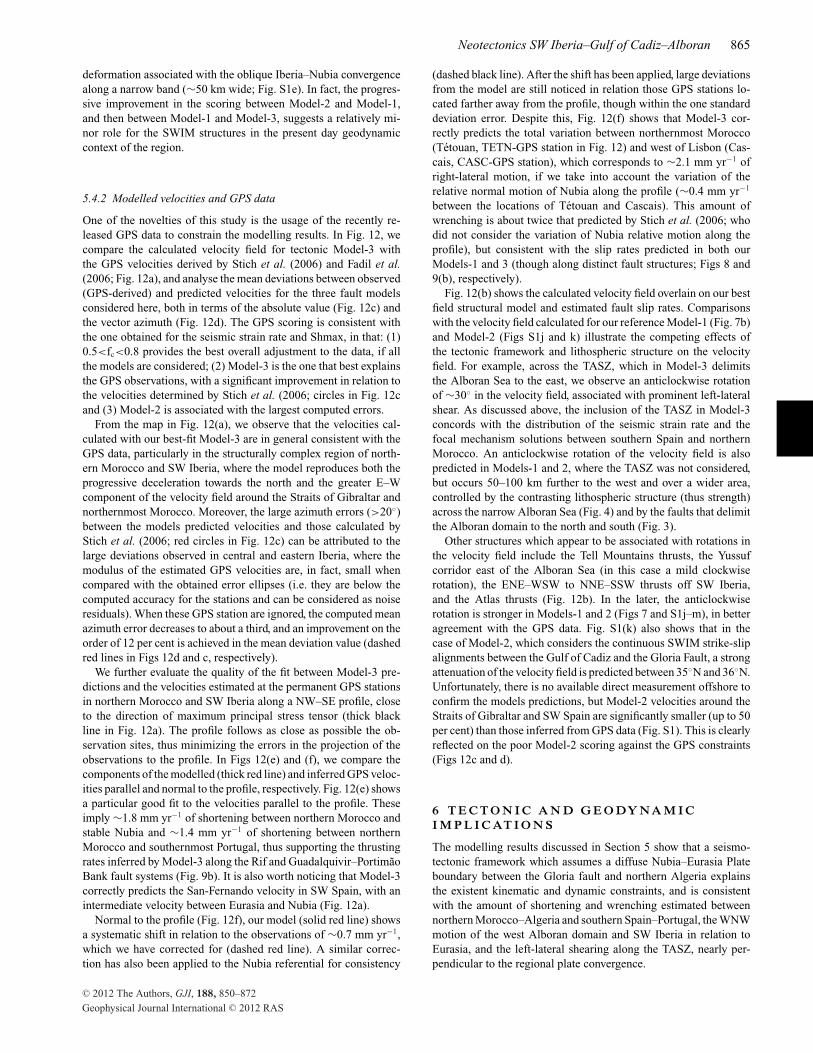
Neotectonics SW Iberia–Gulf of Cadiz–Alboran 865
deformation associated with the oblique Iberia–Nubia convergencealong a narrow band (∼50 km wide; Fig. S1e). In fact, the progres-sive improvement in the scoring between Model-2 and Model-1,and then between Model-1 and Model-3, suggests a relatively mi-nor role for the SWIM structures in the present day geodynamiccontext of the region.
5.4.2 Modelled velocities and GPS data
One of the novelties of this study is the usage of the recently re-leased GPS data to constrain the modelling results. In Fig. 12, wecompare the calculated velocity field for tectonic Model-3 withthe GPS velocities derived by Stich et al. (2006) and Fadil et al.(2006; Fig. 12a), and analyse the mean deviations between observed(GPS-derived) and predicted velocities for the three fault modelsconsidered here, both in terms of the absolute value (Fig. 12c) andthe vector azimuth (Fig. 12d). The GPS scoring is consistent withthe one obtained for the seismic strain rate and Shmax, in that: (1)0.5<fc<0.8 provides the best overall adjustment to the data, if allthe models are considered; (2) Model-3 is the one that best explainsthe GPS observations, with a significant improvement in relation tothe velocities determined by Stich et al. (2006; circles in Fig. 12cand (3) Model-2 is associated with the largest computed errors.
From the map in Fig. 12(a), we observe that the velocities cal-culated with our best-fit Model-3 are in general consistent with theGPS data, particularly in the structurally complex region of north-ern Morocco and SW Iberia, where the model reproduces both theprogressive deceleration towards the north and the greater E–Wcomponent of the velocity field around the Straits of Gibraltar andnorthernmost Morocco. Moreover, the large azimuth errors (>20◦)between the models predicted velocities and those calculated byStich et al. (2006; red circles in Fig. 12c) can be attributed to thelarge deviations observed in central and eastern Iberia, where themodulus of the estimated GPS velocities are, in fact, small whencompared with the obtained error ellipses (i.e. they are below thecomputed accuracy for the stations and can be considered as noiseresiduals). When these GPS station are ignored, the computed meanazimuth error decreases to about a third, and an improvement on theorder of 12 per cent is achieved in the mean deviation value (dashedred lines in Figs 12d and c, respectively).
We further evaluate the quality of the fit between Model-3 pre-dictions and the velocities estimated at the permanent GPS stationsin northern Morocco and SW Iberia along a NW–SE profile, closeto the direction of maximum principal stress tensor (thick blackline in Fig. 12a). The profile follows as close as possible the ob-servation sites, thus minimizing the errors in the projection of theobservations to the profile. In Figs 12(e) and (f), we compare thecomponents of the modelled (thick red line) and inferred GPS veloc-ities parallel and normal to the profile, respectively. Fig. 12(e) showsa particular good fit to the velocities parallel to the profile. Theseimply ∼1.8 mm yr−1 of shortening between northern Morocco andstable Nubia and ∼1.4 mm yr−1 of shortening between northernMorocco and southernmost Portugal, thus supporting the thrustingrates inferred by Model-3 along the Rif and Guadalquivir–PortimaoBank fault systems (Fig. 9b). It is also worth noticing that Model-3correctly predicts the San-Fernando velocity in SW Spain, with anintermediate velocity between Eurasia and Nubia (Fig. 12a).
Normal to the profile (Fig. 12f), our model (solid red line) showsa systematic shift in relation to the observations of ∼0.7 mm yr−1,which we have corrected for (dashed red line). A similar correc-tion has also been applied to the Nubia referential for consistency
(dashed black line). After the shift has been applied, large deviationsfrom the model are still noticed in relation those GPS stations lo-cated farther away from the profile, though within the one standarddeviation error. Despite this, Fig. 12(f) shows that Model-3 cor-rectly predicts the total variation between northernmost Morocco(Tetouan, TETN-GPS station in Fig. 12) and west of Lisbon (Cas-cais, CASC-GPS station), which corresponds to ∼2.1 mm yr−1 ofright-lateral motion, if we take into account the variation of therelative normal motion of Nubia along the profile (∼0.4 mm yr−1
between the locations of Tetouan and Cascais). This amount ofwrenching is about twice that predicted by Stich et al. (2006; whodid not consider the variation of Nubia relative motion along theprofile), but consistent with the slip rates predicted in both ourModels-1 and 3 (though along distinct fault structures; Figs 8 and9(b), respectively).
Fig. 12(b) shows the calculated velocity field overlain on our bestfield structural model and estimated fault slip rates. Comparisonswith the velocity field calculated for our reference Model-1 (Fig. 7b)and Model-2 (Figs S1j and k) illustrate the competing effects ofthe tectonic framework and lithospheric structure on the velocityfield. For example, across the TASZ, which in Model-3 delimitsthe Alboran Sea to the east, we observe an anticlockwise rotationof ∼30◦ in the velocity field, associated with prominent left-lateralshear. As discussed above, the inclusion of the TASZ in Model-3concords with the distribution of the seismic strain rate and thefocal mechanism solutions between southern Spain and northernMorocco. An anticlockwise rotation of the velocity field is alsopredicted in Models-1 and 2, where the TASZ was not considered,but occurs 50–100 km further to the west and over a wider area,controlled by the contrasting lithospheric structure (thus strength)across the narrow Alboran Sea (Fig. 4) and by the faults that delimitthe Alboran domain to the north and south (Fig. 3).
Other structures which appear to be associated with rotations inthe velocity field include the Tell Mountains thrusts, the Yussufcorridor east of the Alboran Sea (in this case a mild clockwiserotation), the ENE–WSW to NNE–SSW thrusts off SW Iberia,and the Atlas thrusts (Fig. 12b). In the later, the anticlockwiserotation is stronger in Models-1 and 2 (Figs 7 and S1j–m), in betteragreement with the GPS data. Fig. S1(k) also shows that in thecase of Model-2, which considers the continuous SWIM strike-slipalignments between the Gulf of Cadiz and the Gloria Fault, a strongattenuation of the velocity field is predicted between 35◦N and 36◦N.Unfortunately, there is no available direct measurement offshore toconfirm the models predictions, but Model-2 velocities around theStraits of Gibraltar and SW Spain are significantly smaller (up to 50per cent) than those inferred from GPS data (Fig. S1). This is clearlyreflected on the poor Model-2 scoring against the GPS constraints(Figs 12c and d).
6 T E C T O N I C A N D G E O DY NA M I CI M P L I C AT I O N S
The modelling results discussed in Section 5 show that a seismo-tectonic framework which assumes a diffuse Nubia–Eurasia Plateboundary between the Gloria fault and northern Algeria explainsthe existent kinematic and dynamic constraints, and is consistentwith the amount of shortening and wrenching estimated betweennorthern Morocco–Algeria and southern Spain–Portugal, the WNWmotion of the west Alboran domain and SW Iberia in relation toEurasia, and the left-lateral shearing along the TASZ, nearly per-pendicular to the regional plate convergence.
C© 2012 The Authors, GJI, 188, 850–872
Geophysical Journal International C© 2012 RAS

866 T. A. Cunha et al.
Figure 12. Predicted model velocities and comparison with GPS data. (a) Comparison between the predicted Model-3 velocities (grey arrows) and GPSvelocities calculated at a number of stations in NW Africa and Iberia, according to Fadil et al. (2006; magenta arrows) and Stich et al. (2006; orange arrows).Ellipses show 95 per cent confidence limits. The thick black line is a profile along which we plot the GPS and model velocities for comparison in (e) and(f). In (b) we overlay the structural framework of Model-3 on the calculated velocity, to discuss the competing effects of the faults and lithospheric structure(see text). (c) and (d) show the mean deviation and azimuth error, respectively, between the models predicted velocities and the GPS data, as a function of fc.Tectonic models 1, 2 and 3 are shown in Figs 8 and 9. Model-3 (red) is clearly associated with the lowest mean deviation from the GPS data. The dashed linesshow the scoring for Model-3 when the GPS stations in central and eastern Iberia are excluded (see text). (e) and (f) show the parallel and normal horizontalcomponents, respectively, of both the GPS (Stich et al. 2006) and Model-3 velocities (red lines), projected along a NW–SE profile (thick black line in a). Ateach GPS station the one standard deviation error bar is shown. Dashed black lines give the relative motion of Nubia calculated along the profile. The dashedred line in (f) is shifted of –0.7 mm (see text for further explanation).
C© 2012 The Authors, GJI, 188, 850–872
Geophysical Journal International C© 2012 RAS

Neotectonics SW Iberia–Gulf of Cadiz–Alboran 867
The modelling kinematic assumptions are straightforward, as weonly input the relative motion of Nubia in relation to a fixed Eurasiaplate, as derived from recent geodetic data (Calais et al. 2003;McClusky et al. 2003; Fernandes et al. 2003). Therefore, althoughthe modelling results are not irreconcilable with ongoing subcrustalregional processes, they suggest these may have a minor role inexplaining, for example, the differential westward motion of theAlboran domain. As depicted in Fig. 12(a), the deviations betweenmodelled and GPS-derived velocities in the vicinity of Gibraltar(including the GPS stations of Tetouan, Ceuta and San Fernando),as well as in NW coast of Morocco, are <1 mm yr−1. This arguesagainst the hypothesis of a tectonic regime dominated by a presentlyactive, eastward dipping subduction beneath Gibraltar, with slabroll-back and hydrostatic pull of the overlying plate, as put forwardby Gutscher et al. (2002).
We have also considered the possibility of an active GibraltarArc, linking the Betic and Rif thrust fronts and explicitly separatingthe Alboran and Atlantic domains (Model-4 in Fig. S2b, SupportingInformation). Similar to that predicted by Negredo et al. (2002), thistectonic setting results in a strong localization of the strain alongthe Betic chain thrust front (Fig. S2d), in disagreement with thedistribution of the seismic strain rate (Fig. 6). In relation to tec-tonic Model-3, the scoring calculated for this model (assuming fc
= 0.05; Fig. 10) is lower by approximately 15 per cent. A weakercorrelation is also obtained between the model predicted velocityfield and the GPS observations, by 22 and 6 per cent in relationto the Stich et al. (2006) and Fadil et al. (2006) data sets, respec-tively. The larger departures are observed along southern Spain andaround the Straits of Gibraltar, where the model predicted velocitiesfail to reproduce the dominant E–W direction of the GPS data (Fig.S2d). This model also predicts much lower thrust rates along theRif Mountains, and significantly higher (almost twice the ampli-tude) slip rates along the Guadalquivir–Portimao faults (Fig. S2b),thus largely underestimating the amount of shortening within theNubia plate inferred from GPS data, and overestimating it betweenMorocco and southern Portugal (Stich et al. 2006; Section 5.4.2).
A feature of the GPS data which the models fail to reproduce, andthat may, in fact, be indicative of coupled subcrustal (or sublithopsh-eric) processes and crustal deformation, is the SW motion of the RifMountains in relation to the Nubia Plate, and of sites in the Beticsin relation to Eurasia, that is, normal to the relative motion betweenNubia and Eurasia (Fadil et al. 2006; Stich et al. 2006; Vernantet al. 2010). The main reason why we did not attempt to adjust themodels to these observations is that they are localized and possiblycontrolled by remnant lithospheric processes, associated with theNW–SE Africa–Eurasia convergence during the Eocene–Miocene.Platt & Houseman (2003), for example, argue that the tomographicdata and intermediate to deep seismicity in the Alboran domain areconsistent with a laterally propagating Rayleigh–Taylor instabilityaround a slab of delaminated subcontinental lithospheric, whosedownwelling initiated ca. 27 Ma (Platt et al. 1998). Perouse et al.(2010), on the other hand, used dynamical modelling techniques andshowed that the observed southward motion of the Rif and Beticscan be reproduced by applying a small (100 × 50 km) traction patchto the base of an elastic plate in the external Rif zone. Based onthe size, location and orientation of the patch the authors associatedthe traction with delamination and roll-back of subducted Africanlithospheric mantle.
In the Gulf of Cadiz and SW Iberia, our results evidence theinconsistency of the kinematic data with a model dominated byWNW–ESE trending long lineaments (up to 600 km), extend-ing between south of the Gorringe and the eastern Gulf of Cadiz
(the SWIM lineaments, Duarte et al. 2009; Zitellini et al. 2009).The great spatial continuity of these lineaments has been sug-gested based on morphological criteria (high-resolution multibeambathymetry) and Zitellini et al. (2009) argued they represent anemergent plate boundary between Nubia and Iberia, linking theGloria Fault to the Rif–Tell Mountains.
Such a tectonic model, however, predicts large slip rates alongthe SWIM lineaments (up to 4 mm yr−1, depending on their length,Figs 8 and 9a), and little deformation in the northern Gulf of Cadizand SW Iberia margin, in strong contrast with the distribution ofstrain computed from the instrumental seismicity (Figs 6 and S1e)and with the widespread evidences of recent re-activation of thrustfaults to the north of the Horseshoe Abyssal Plain (e.g. Massonet al. 1994; Hayward et al. 1999; Terrinha et al. 2003; Zitellini et al.2004; Terrinha et al. 2009). Moreover, the model is associated witha strong attenuation of the velocity field between northern Moroccoand Gibraltar, in disagreement with present day GPS measurements(Fig. S1h). In our view, therefore, the SWIM lineaments shouldnot be regarded as mature lithospheric-scale features marking thepresent day plate boundary between Nubia and Eurasia.
On the other hand, a tectonic model dominated by NNE–SSW toENE–WSW thrust faults, locally disrupted by strike-slip (or trans-fer) faults (Model-3), is in particularly good agreement with theamount of shortening and wrenching between NW Morocco andSW Iberia estimated from GPS data (Fig. 12), the distribution ofthe seismic strain rate (Figs 11 and S1e), and the associated fault-ing mechanisms. In its widest segment, the region of transpressivedeformation is over 200 km, between the Gulf of Cadiz and thenorthern Tagus Abyssal Plain (Fig. 2; Sartori et al. 1994; Massonet al. 1994; Hayward et al. 1999; Terrinha et al. 2003; Zitelliniet al. 2004; Cunha et al. 2010), and extends over thinned continen-tal, transitional and oceanic type crust of Jurassic-Early Cretaceousage (Gutscher et al. 2009, Gonzalez et al. 1996, 2001; Rovere et al.2004). Off SW Portugal, the model predicted fault slip rates are alsoconsistent with the existing, though scarce, geological constraints,where the seismostratigraphy indicates a minimum thrusting rateof 0.25–0.5 mm yr−1 in the Marques de Pombal Fault between theTortonian (possibly base of Pliocene) and Recent (Zitellini et al.2001; Roque 2008)
In the Gulf of Cadiz and SW Iberia margin, the convergenceis accommodated by several structures, and maximum predictedlong-term average faults slip rates vary between 1–2 mm yr−1; thatis, <50 per cent the average plate relative movement. This regionis known to have been the source of destructive earthquakes andtsunamis in the historical past, like the 1755 November 1 ‘GreatLisbon Earthquake’ with an estimated magnitude (Mw) between8.5 and 8.7 (Johnston 1996; Solares & Arroyo 2004), and severalother high-energy events since 7.0 kyr BP (c.f. Baptista & Miranda2009 and references therein).
The low-predicted fault slip rates are thus an important resultwhen assessing the seismic hazard of Portugal, SW Spain andMorocco, suggesting very long return periods for high-magnitudeearthquakes on individual structures (exceeding a few thousandyears). However, the existence of several mapped faults in the Gulfof Cadiz-SW Iberia margin that can generate Mw > 8 earthquakes(i.e. >60 km in length, approximately, Ribeiro et al. 2006; Stichet al., 2007; see tectonic map of Fig. 2 for location of the structures)or compound, multiple rupture hypothesis involving several faultsystems (Zitellini et al. 2001; Terrinha et al. 2003; Ribeiro et al.2006; Stich et al. 2007; Cunha et al. 2010; Terrinha et al. 2009), pre-clude a straightforward time dependent seismic and tsunami hazardassessment.
C© 2012 The Authors, GJI, 188, 850–872
Geophysical Journal International C© 2012 RAS

868 T. A. Cunha et al.
As discussed in Section 3.3, the crust and lithospheric structureused in the neotectonic models throughout this study, under thegeneral assumptions of local isostasy and a steady state thermalregime, are broadly consistent with the observations and previouscrust/lithosphere models in the region. The greater uncertainties arearguably in the eastern Gulf of Cadiz–Gharb basin-Rif area andunder the Atlas mountains, where models such as those put forwardby Zeyen et al. (2005) and Fullea et al. (2007, 2010) suggest a muchthicker and thinner lithosphere, respectively.
We investigated the impact that such distinctive features may havein the modelling predictions by building an alternative lithosphericmodel, where we locally modified the heat flow input data (Fig.S3, Supporting Information). The model presented in Fig. S3(b)reproduces approximately the lithosphere in Fullea et al. (2007),with 140–160 km lithosphere thicknesses between the eastern Gulfof Cadiz and the Betic chain, extending into northern Moroccoand a <80-km-thick lithosphere in Central Atlas. Despite the largedifferences in relation to the reference model (Fig. S3a), of up to50 km in the Atlas mountains and 60–70 km in the Rif region,the predicted slip rates (Figs S3c and d), strain distribution andvelocity field (Figs S3e and f) are very similar between the twomodels. The most notable effects are an increase in the amountof shortening in the Atlas mountains combined with a decrease inthe thrusting rates along the Rif front. In terms of the scoring, the‘Fullea-like’ lithosphere model is associated with a marginal (<5per cent) decline in the correlation with the seismic strain rate, anda comparable improvement in the fit to the GPS data.
7 C O N C LU S I O N S
We summarize here the main results from a neotectonic modellingstudy of the western sector of the Nubia–Eurasia Plate boundary,between the Gloria Fault (off SW Iberia) and north Algeria (Fig. 1).In relation to previous neotectonic models in the region, we used abetter constrained tectonic map for the SW Iberia and Gulf of Cadiz,and we utilize the recently made available GPS measurements toevaluate the modelling results, together with the instrumental seis-micity and the stress data. In the SW Iberia margin and Gulf ofCadiz, three distinct tectonic models have been tested, based on themapped structural elements, the seismicity of the area and proposedgeodynamic models for region.
We show that the seismic strain rate, the stress field and the GPSvelocities in Morocco and the Iberia Peninsula can be broadly ex-plained assuming a relatively simple, two-plate tectonic framework,where Nubia and Eurasia converge NW–SE to WNW–ESE at a rateof 4.5–6 mm yr−1, as inferred from recent, geodetically constrainedkinematic plate models. In relation to previous neotectonic mod-els, covering both larger and more restricted areas of this sector ofthe Nubia–Eurasia Plate boundary, but which used the NUVEL-1Aglobal plate model and the Argus 3-Plate model (Argus et al. 1989),an improvement of up to 40 per cent was achieved in terms of thecorrelation with the seismic strain rate.
In the Gulf of Cadiz and SW Iberia margin, the modellingresults strongly support a tectonic model where the compres-sional deformation is accommodated along NNE–SSW to NE–SSWand ENE–WSW thrust faults and WNW–ESE right-lateral strike-slip faults. In our preferred model, ∼1.8 mm yr−1 of shorten-ing is predicted between northern Morocco and stable Nubia,∼1.4 mm yr−1 between NW Morocco and southernmost Portugaland ∼0.4 mm yr−1 between southernmost Portugal and the latitudeof Lisbon, associated with ∼2.1 mm yr−1 of total right-lateral mo-
tion. These results are in excellent agreement with the GPS data.Moreover, the deviations between the model predicted and the GPSderived velocities around the Straits of Gibraltar and NW Moroccocoast are <1 mm yr−1, which argues against the possibility of asecond geodynamic engine to explain the data, such as an activesubduction roll-back as proposed by Gutscher et al. (2002).
The proposed tectonic model is also consistent with the seis-micity of the region, dominated by shallow to intermediate depthevents with strike-slip and thrust focal mechanisms solutions, andthe evidences of recent activity on numerous compressional andtranspressional structures along the SW Iberia margin. The max-imum predicted, long-term average fault slip rates vary between1.5–2 mm yr−1 in the northern Gulf of Cadiz and 0.5–1 mm yr−1
in the NNE-SSW to NE-SW trending thrusts off SW Portugal,consistent with the existent geological constraints. The small sliprate values, only a fraction of the plate convergence velocity(4.5–6 mm yr−1), point to very long return periods for big earth-quakes (Mw > 8) and tsunamis on individual structures.
On the other hand, a model which is dominated by long (up to600 km), WNW–ESE trending lineaments across the Gulf of Cadizand the Horseshoe abyssal plain (the SWIM lineaments) predictslittle or no deformation in the faults located to the north, and a strongattenuation of the velocity field between the northern Morocco andthe Straits of Gibraltar, in clear disagreement with the observations.The modelling results thus support a diffuse Nubia–Eurasia Plateboundary along SW Iberia and the Gulf of Cadiz, meaning thatthe emergent plate boundary along the recently mapped SWIMlineaments, as put forward by Zitellini et al. (2009), is still notmature and might have only a limited lithospheric expression.
A C K N OW L E D G M E N T S
The authors would like to gratefully acknowledge the funding fromFundacao para a Ciencia e Tecnologia (FCT, Portugal) throughthe research projects SWITNAME (PDCT/CGEGIN59244/2004),TOPOMED (TOPOEUROPE/0001/2007) and KINEMA(PTDC/CTEGIN/64101/2006), and the research fellowshipSFRH/BPD/34798/2007. The authors would also like to acknowl-edge P. Bird and M. Sambridge for making the SHELLS codefreely available, and are grateful to I. Jimenez-Munt for providingthe initial heat-flow grid and help with the scoring of the seismicdata. Constructive reviews by M. Miranda, Rob Govers and twoanonymous reviewers helped improve an early version of thismanuscript considerably.
R E F E R E N C E S
Afilhado, A., Matias, L., Shiobara, H., Hirn, A., Mendes-Victor, L. & Shi-mamura, H., 2008. From unthinned continent to ocean: the deep structureof the West Iberia passive continental margin at 38oN, Tectonophysics,458, 9–50.
Alami, S.O., Tadili, B., Brahim, L.A. & Mouyan, I., 2004. Seismicity ofMorocco for the period 1987-1994, Pure Appl. Geophys., 161, 969–982.
Allerton, S., Lonergan, L., Platt, J.P., Platzman, E.S. & McClelland, E., 1993.Palaeomagnetic rotations in the eastern Betic Cordillera, southern Spain,Earth planet. Sci. Lett., 119, 225–241.
Altamini, Z., Sillard, P. & Boucher, C., 2002. ITRF2000: a new release of theInternational Terrestrial Reference Frame for earth science applications.J. geophys. Res., 107, 2214, doi:10.1029/2001JB000561.
Alvarez-Marron, J., 1999. Pliocene to recent structure of the eastern AlboranSea (W Mediterranean), Proc. ODP, Sci. Results, 161, 345–355.
Alvarez-Marron, J., Rubio, E. & Torne, M., 1997. Subduction-related struc-tures in the North Iberian Margin, J. geophys. Res., 102, 22 497–22 511.
C© 2012 The Authors, GJI, 188, 850–872
Geophysical Journal International C© 2012 RAS

Neotectonics SW Iberia–Gulf of Cadiz–Alboran 869
Alves, T.M., Moita, C., Cunha, T., Ullnaess, M., Myklebust, R., Monteiro,J.H. & Manuppella, G., 2009. Diachronous evolution of Late Jurassic?Cretaceous continental rifting in the northeast Atlantic (west Iberian mar-gin), Tectonics, 28, doi:10.1029/2008TC002337.
Argus, D.F., Gordon, R.G., DeMets, C. & Stein, S., 1989. Closure of theAfrica-Eurasia-North America plate motion circuit and tectonics of theGloria fault, J. geophys. Res., 94, 5585–5602.
Badal, J., Corchete, V., Payo, G., Canas, J.A. & Pujades, L., 1993. Shear wavevelocity structure below the Iberian Peninsula as obtained by a detailedanalysis of surface waves, Tectonophysics, 225, 167–190.
Banda, E., 1988. Crustal parameters in the Iberian Peninsula, Phys. Earthplanet. Inter., 51, 222–225.
Banda, E., Torne, M. & Iberian Atlantic Margins Group, 1995. Iberia At-lantic Margins (IAM) Group investigates deep structure of continentalmargins. EOS, Trans. Am. geophys. Un., 76, 25–29.
Baptista, M.A. & Miranda, J.M., 2009. Revision of the Portuguese catalogof tsunamis. Nat. Hazards Earth Sys. Sci., 9, 25–42.
Baptista, M.A., Miranda, J.M., Chiericci, F. & Zitellini, N., 2003. New studyof the 1755 earthquake source based on multi-channel seismic survey dataand tsunami modeling, Nat. Hazards Earth Sys. Sci., 3, 333–340.
Beauchamp, W., Allmendinger, R.W., Barazangi, M., Demnati, A., El Alji,M. & Dahmani, M., 1999. Inversion tectonics and the evolution of theHigh Atlas Mountains, Morocco, based on a geological-geophysical tran-sect, Tectonics, 18, 163–184.
Bird, P., 1989. New finite element techniques for modeling deformationhistories of continents with stratified temperature-dependent rheologies,J. geophys. Res., 94, 3967–3990.
Bird, P., 1998. Testing hypotheses on plate-driving mechanisms with globallithosphere models including topography, thermal structure, and faults,J. geophys. Res., 103, 10 115–10 129.
Bird, P., 1999. Thin-plate and thin-shell finite element modeling programsfor forward dynamic modeling of plate deformation and faulting, Comput.Geosci., 25, 383–394.
Bird, P. & Kong, X., 1994. Computer simulations of California tectonicsconfirm very low strength of major faults, Geol. Soc. Am. Bull., 106,159–174.
Blanco, M.J. & Spakman, W., 1993. The P-velocity structure of the mantlebelow the Iberian Peninsula: evidence for subducted lithosphere belowsouth Spain, Tectonophysics, 221, 13–43.
Brace, W.F. & Kohlstedt, D.L., 1980. Limits on lithospheric stress imposedby laboratory experiments, J. geophys. Res., 85, 6248–6252.
Buforn, E., Udıas, A. & Colombas, M.A., 1988. Seismicity, sourcemechanisms and tectonics of the Azores-Gibraltar plate boundary,Tectonophysics, 152, 89–118.
Buforn, E., Udıas, A. & Madariaga, R., 1991. Intermediate and deep earth-quakes in Spain, Pure Appl. Geophys., 136, 375–393.
Buforn, E., Bezzeghoud, M., Udıas, A. & Pro, C., 2004. Seismic sources onthe Iberia – African plate boundary and their tectonic implications, PureAppl. Geophys., 161, 623–646.
Byerlee, J., 1978. Friction of rocks, Pure App. Geophys., 116, 615–626.
Cabral, J., 1995. Neotectonica em Portugal Continental, Mem. 31, pp. 265,Instituto Geol. Min., Lisboa.
Calais, E., DeMets, C. & Nocquet, J.M., 2003. Evidence for a post-3.16-Machange in Nubia–Eurasia–North America plate motions? Earth planet.Sci. Lett., 216, 8–92.
Calvert, A. et al., 2000. Geodynamic evolution of the lithosphere andupper mantle beneath the Alboran region of the western Mediter-ranean: constraints from travel time tomography, J. geophys. Res., 105,10 871–10 898.
Camerlenghi, A. & Pini, G.A., 2009. Mud volcanoes, olistostromes,and argille scagliose in the Mediterranean Region, Sedimentology, 56,319–365, doi:10.1111/j.1365-3091.2008.01016.x.
Carminati, E., Wortel, M.J.R., Spakman, W. & Sabadini, R., 1998. Therole of slab detachment processes in the opening of the western-centralMediterranean basins: some geological and geophysical evidence, Earthplanet. Sci. Lett., 160, 651–665.
Carrilho, F., Teves-Costa, P., Morais, I., Pagarete, J. & Dias, R., 2004.
GEOALGAR Project: first results on seismicity and fault-plane solutions,Pure appl. Geophys., 161, 589–606.
Choukroune, P., 1992. Tectonic evolution of the Pyrenees, Annu. Rev. EarthPlanet. Sci., 20, 143–158.
Comas, M.C., Platt, J.P., Soto, J.I. & Watts, A.B., 1999. The origin andtectonic history of the Alboran Basin: insights from Leg 161 results,Proc. ODP, Sci. Results, 161, 155–580.
Contrucci, I., Klingelhoefer, F., Perrot, J., Bartolome, R., Gutscher, M.-A.,Sahabi, M., Malod, J. & Rehault, J.P., 2004. The crustal structure of theNW-Moroccan continental margin from wide angle and reflection seismicdata, Geophys. J. Int., 159, 117–128.
Cordoba, D., Banda, E. & Ansorge, J., 1988. P-wave velocity–depth distri-bution in the Hercynian crust of Northwest Spain, Phys. Earth Planet.Inter., 51, 235–248.
Cunha T.A., Watts A.B., Pinheiro, L.M., Myklebust, R., 2010. Seismic andgravity anomaly evidence of large-scale compressional deformation offSW Portugal, Earth planet. Sci. Lett., 293, 171–179.
Dean, S.M., Minshull, T.A., Whitmarsh, R.B. & Louden, K.E., 2000. Deepstructure of the ocean-continent transition in the southern Iberia AbyssalPlain from seismic refraction profiles: The IAM-9 transect at 40o20’N,J. geophys. Res., 105, 5859–5885.
Dewey, J.F., Helman, M.L., Turco, E., Hutton, D.H.W. & Knott, S.D., 1989.Kinematics of the Western Mediterranean, Geol. Soc. Lond. Spec. Publ.,45, 265–283, doi:10.1144/GSL.SP.1989.045.01.15.
Dıaz, J. & Gallart, J., 2009. Crustal structure beneath the Iberian Peninsulaand surrounding waters: A new compilation of deep seismic soundingresults, Phys. Earth planet. Int., 173, 181–190.
Dıaz, J., et al. 1993. A deep seismic sounding investigation of lithosphericheterogeneity and anisotropy beneath the Iberian Peninsula, Tectono-physics, 221, 35–51.
Diez, S. et al., 2006. The Swim Bathymetric Compilation of the Gulf ofCadiz, 5◦ Simposio sobre a Margem Iberica Atlantica, Aveiro, 55–56.
DeMets, C., Gordon, R.G., Argus, D.F. & Stein, S., 1990. Current platemotions, Geophys. J. Int., 101, 425–478.
DeMets, C., Gordon, R.G., Argus, D.F. & Stein, S., 1994. Effect of recentrevisions to the geomagnetic reversal time scale on estimates of currentplate motions, Geophys. Res. Lett., 21, 2191–2194.
DeMets, C., Gordon, R.G. & Argus, D.F., 2010. Geologically cur-rent plate motions, Geophys. J. Int., 181, 1–80, doi:10.1111/j.1365-246X.2009.04491.x.
Docherty, C. & Banda, E., 1995. Evidence for the eastward migration ofthe Alboran Sea based on regional subsidence analysis: a case for basinformation by delamination of the subcrustal lithosphere? Tectonics, 14,804–818.
Duarte, J.C., Valadares, V., Terrinha, P., Rosas, F., Zitellini, N. & Gracia,E., 2009. Anatomy and tectonic significance of WNW-ESE and NE-SWlineaments at a transpressive plate boundary (Nubia-Iberia), Trabajos deGeologıa, 29, 237–241.
Dundar, S. et al., 2011. Receiver function images of the base of the litho-spherein the Alboran Sea region, Geophys. J. Int., doi:10.1111/j.1365-246X.2011.05216.x.
England, P. & McKenzie, D.A., 1982. A thin viscous sheet model for conti-nental deformation, Geophys. J. R. astr. Soc., 70, 295–321.
Fadil, A. et al., 2006. Active tectonics of the western Mediterranean. GPSevidence for roll back of a delaminated subcontinental lithospheric slabbeneath the Rif Mountains, Morocco, Geology, 34, 529–532.
Fernandes, R.M.S., Ambrosius, B.A.C., Noomen, R., Bastos, L., Wortel,M.J.R., Spakman, W. & Govers, R., 2003. The relative motion betweenAfrica and Eurasia as derived from ITRF 2000 and GPS data, Geophys.Res. Lett., 30, 1828, doi:10.1029/2003GL017089.
Fernandes, R.M.S., Ambrosius, B.A.C., Noomen, R., Bastos, L., Combrink,L., Miranda, J.M. & Spakman, W., 2004. Angular velocities of Nubia andSomalia from continuous GPS data: implications on present-day relativekinematics, Earth planet. Sci. Lett., 222, 197–208.
Fernandes, R.M.S., Miranda, J.M., Meijninger, B.M.L., Bos, M.S., Noomen,R., Bastos, L., Ambrosius, B.A.C. & Riva, R.E.M., 2007. Surface veloc-ity field of the Ibero-Maghrebian segment of the Eurasia-Nubia plateboundary, Geophys. J. Int., 169, 315–324.
C© 2012 The Authors, GJI, 188, 850–872
Geophysical Journal International C© 2012 RAS

870 T. A. Cunha et al.
Fernandez, M., Marzan, I., Correia, A. & Ramalho, E., 1998. Heat flow,heat production, and lithospheric thermal regime in the Iberian Peninsula,Tectonophysics, 291, 29–53
Fernandez, M., Marzan, I. & Torne, M., 2004. Lithospheric transition fromthe Variscan Iberian Massif to the Jurassic oceanic crust of the CentralAtlantic, Tectonophysics, 386, 97–115.
Fullea, J., Fernandez, M. & Zeyen, H., 2006. Lithospheric structure in the At-lanticMediterranean transition zone (southern Spain, northern Morocco):a simple approach from regional elevation and geoid data, C. R. Geo-science, 338, 140–151.
Fullea, J., Fernandez, M., Zeyen, H. & Verges, J., 2007. A rapid method tomap the crustal and lithospheric thickness using elevation, geoid anomalyand thermal analysis: application to the Gibraltar Arc System and adjacentzones, Tectonophysics, 430, 97–117.
Fullea, J., Fernandez, M., Afonso, J.C., Verges, J. & Zeyen, H., 2010. Thestructure and evolution of the lithosphere-asthenosphere boundary be-neath the Atlantic-Mediterranean Transition Region, Lithos, 120, 74–95,doi:10.1016/j.lithos.2010.03.003.
Fukao, Y., 1973. Thrust faulting at a lithospheric plate boundary: the Portugalearthquake of 1969, Earth planet. Sci. Lett., 18, 205–216.
GEBCO, British Oceanographic Data Centre, 2003. Centenary Edition of theGEBCO Digital Atlas (CD-ROM). Published on behalf of the Intergovern-mental Oceanographic Commission and the International HydrographicOrganization, Liverpool.
GLOBE Task Team et al., 1999. The Global Land One-kilometer Base Eleva-tion (GLOBE) Digital Elevation Model, Version 1.0. National Oceanic andAtmospheric Administration, National Geophysical Data Center, Boul-der, CO.
Gomez, F., Beauchamp, W. & Barazangi, M., 2000. Role of the Atlas Moun-tains (northwest Africa) within the African-Eurasian plate boundary zone,Geology, 28, 775–778.
Gonzalez, A., Torne, M., Cordoba, D., Vidal, N., Matias, L.M. & Dıaz, J.,1996. Crustal thinning in the Southwestern Iberia margin, Geophys. Res.Lett., 23, 2477–2480.
Gonzalez, A., Cordoba, D., & Vales, D. 1999. Seismic crustal structure ofGalicia continental margin, NW Iberian Peninsula, Geophys. Res. Lett.,26, 1061–1064.
Gonzalez, A., Cordoba, D., Matias, L.M. & Torne, M., 2001. Seismic crustalstructure in the Gulf of Cadiz (SW Iberian Peninsula), Marine Geophys.Res., 22, 207–223.
Gracia, E., Danobeitia, J., Verges, J. & the Parsifal Team, 2003. Mappingactive faults offshore Portugal (36oN-38oN): implications for the seis-mic hazard assessment along the southwest Iberian margin, Geology, 31,83–86.
Grevemeyer, I., Kaul, N. & Kopf, A., 2009. Heat flow anomalies in the Gulfof Cadiz and off Cape San Vicente, Portugal, Marine Petrol. Geol., 26,795–804.
Gutscher, M.A., 2004. What caused the great Lisbon earthquake?, Science,305, 1247–1248.
Gutscher, M.A., Malod, J., Rehault, J.-P., Contrucci, I., Klingelhoefer, F.,Mendes-Victor, L. & Spakman, W., 2002. Evidence for active subductionbeneath Gibraltar, Geology, 30, 1071–1074.
Gutscher, M.A., Dominguez, S., Westbrook, G.K. & Leroy, P., 2009. Deepstructure, recent deformation and analog modeling of the Gulf of Cadiz ac-cretionary wedge: implications for the 1755 Lisbon earthquake, Tectono-physics, 475, 85–97.
Gurrıa E. & Mezcua J., 2000. Seismic tomography of the crust and litho-spheric mantle in the Betic Cordillera and Alboran Sea, Tectonophysics,329, 99–119.
Hayward, N., Watts, A.B., Westbrook, G.K. & Collier, J.S., 1999. A seismicreflection and GLORIA study of compressional deformation in the Gor-ringe Bank region, eastern North Atlantic, Geophys. J. Int., 138, 831–850.
Heidbach, O., Tingay, M., Barth, A., Reinecker, J., Kurfeß, D. & Muller,B., 2008. Global crustal stress pattern based on the World Stress Mapdatabase release, Tectonophysics, 482, 3–15.
ILIHA DSS Group:Dıaz, J., Gallart, J., Cordoba, D.C., Senos, L., Matias,L., Surinach, E., Hirn, A. & Maguire, P., 1993. A deep seismic sound-ing investigation of lithospheric heterogeneity and anisotropy beneath
the Iberian Peninsula, Tectonophysics, 221, 35–51, doi:10.1016/0040-1951(93)90026-G.
Kirby, S.H., 1983. Rheology of the lithosphere, Rev. Geophys., 21,1458–1487.
Jimenez-Munt, I. & Negredo, A.M., 2003. Neotectonic modelling of theAfrica-Eurasia plate boundary from the Mid-Atlantic ridge to Algeria,Earth. planet. Sci. Lett., 205, 257–271.
Jimenez-Munt, I., Fernandez, M., Torne, M. & Bird, P., 2001, The transitionfrom linear to diffuse plate boundary in the Azores-Gibraltar region:results from a thin-sheet model, Earth planet. Sci. Lett., 192, 175–189.
Jimenez-Munt, I., Sabadini, R., Gardi, A. & Bianco, G., 2003. Active de-formation in the Mediterranean from Gibraltar to Anatolia inferred fromnumerical modeling, geodetic and seismological data, J. geophys. Res.,108, doi:10.1029/2001JB001544.
Johnston, A.C., 1996. Seismic moment assessment of earthquakes in stablecontinental regions. III. New Madrid 1811–1812, Charleston 1886, andLisbon 1755, Geophys. J. Int., 126, 314–344.
Kreemer, C., Haines, J. Holt, W.E., Blewitt, G. & Lavallee, D., 2000. Onthe determination of a global strain rate model, Earth Planets Space, 52,765–770.
Kreemer, C., Holt, W.E. & Haines, A.J., 2003. An integrated global modelof present-day plate motions and plate boundary deformation, Geophys.J. Int., 154, 8–34.
Kong, X. & Bird, P., 1995. SHELLS: a thin-plate program for modelingneotectonics of regional or global lithosphere with faults, J. geophys.Res., 100, 22 129–22 131.
Kostrov, V., 1974. Seismic moment and energy of earthquakes, and seismicflow of rock, Izv. Acad. Sci. USSR Phys. Solid Earth, 1, 23–44.
Liu, Z. & Bird, P., 2002. Finite element modeling of neotectonics in NewZealand, J. geophys. Res., 107, doi:10.1029/2001JB001075.
Lonergan, L. & White, N., 1997. Origin of the Betic-Rif mountain belt,Tectonics, 16, 504–522.
Louden, K.E., Sibuet, J.-C. & Harmegnies, F., 1997. Variations in heat flowacross the ocean-continent transitioln in the Iberia abyssal plain, Earthplanet. Sci. Lett., 151, 233–254.
McClusky, S., Reilinger, R., Mahmoud, S., Ben Sari, D. & Tealeb, A., 2003.GPS constraints on Africa (Nubia) and Arabia plate motions, Geophys. J.Int., 155, 126–138.
Martınez-Dıaz, J.J. & Hernandez-Enrile, J.L., 2004. Neotectonics and mor-photectonics of the southern Almeria region (Betic Cordilleras-Spain)kinematic implications, Int. J. Earth Sci., 93, 189–206.
Masson, D.G., Cartwright, J.A., Pinheiro, L.M., Whitmarsh, R.B. & Beslier,M.O., 1994. Compressional deformation at the ocean-continent transitionin the NE Atlantic, J. Geol. Soc. London, 151, 607–613.
Matias, L., 1996. A Sismologia Experimental na Modelacao da Estruturada Crusta em Portugal Continental, PhD thesis, University of Lisbon (inPortuguese).
Meghraoui, M., Morel, J.L., Andrieux, J. & Dahmani, M., 1996. Tectoniqueplioquaternaire de la chaine tello-rifaine et de la mer d’Alboran: Une zonecomplexe de convergence continent-continent, Bull. Soc. Geol. Fr., 167,141–157.
Montenat, C., D’Estevou, P.O. & La Chappelle, G., 1990. Le Bassin deNijar-Carboneras et le Couloir du Bas-Andarax, Documents et Travaux,Intitute de Geologique Albert de Lapparent, 12, 129–164.
Murillas, J., Mougenot, D., Boillot, G., Comas, M.C., Banda, E. & Mauffret,A., 1990. Structure and evolution of the Galicia Interior Basin (Atlanticwestern Iberian continental margin), Tectonophysics, 184, 297–319.
Negredo, A.M., Bird, P., Sanz de Galdeano, C. & Buforn, E., 2002. Neo-tectonic modeling of the Ibero-Maghrebian region, J. geophys. Res., 107,doi:10.1029/2001JB000743.
Ouyed, M. et al., 1981. Seismotectonics of the El Asnam earthquake, Nature,292, 26–31.
Parsons, B.E. & Sclater, J.G., 1977. An analysis of the variation of oceanfloor bathymetry and heat flow with age, J. geophys. Res., 82, 803–827.
Pedreira, D., Pulgar, J.A., Gallart, J. & Diaz, J., 2003. Seismic evi-dence of Alpine crustal thickening and wedging from the western Pyre-nees to the Cantabrian mountains (north Iberia), J. geophys. Res., 108,doi:10.1029/2001JB001667.
C© 2012 The Authors, GJI, 188, 850–872
Geophysical Journal International C© 2012 RAS

Neotectonics SW Iberia–Gulf of Cadiz–Alboran 871
Perouse, E., Vernant, P., Chery, J., Reilinger, R. & McClusky, S., 2010.Active surface deformation and sub-lithospheric processes in the westernMediterranean constrained by numerical models, Geology, 38, 823–826.
Pinheiro, L.M., Whitmarsh, R.B. & Miles, P.R., 1992. The ocean-continentboundary off the western continental margin of Iberia-II. Crustal structurein the Tagus Abyssal Plain, Geophys. J. Int., 109, 106–124.
Pinheiro, L.M., Wilson, R.C.L., Pena dos Reis, R., Whitmarsh, R.B. &Ribeiro, A., 1996, The Western Iberia Margin: a geophysical overview,Proc. ODP, Sci. Results, 149, 3–19.
Platt J. & Houseman, G., 2003. Evidence for active subduction beneathGibraltar, Comment, Geology, 31, e22.
Platt, J.P. & Vissers, R.L.M., 1989. Extensional collapse of thickened conti-nental lithosphere: a working hypothesis for the Alboran Sea and GibraltarArc, Geology, 17, 540–543.
Platt, J.P., Soto, J.-I., Whitehouse, M.J., Hurford, A.J. & Kelley, S.P., 1998.Thermal evolution, rate of exhumation, and tectonic significance of meta-morphic rocks from the floor of the Alboran extensional basin, westernMediterranean, Tectonics, 17, 671–689.
Platt, J.P., Whitehouse, M.J., Kelley, S.P., Carter, A. & Hollick, L., 2003.Simultaneous extensional exhumation across the Alboran Basin: impli-cations for the causes of late orogenic extension, Geology, 31, 251–254.
Platzman, E.S., Platt, J.P. & Olivier, P., 1993. Palaeomagnetic rotations andfault kinematics in the Rif Arc of Morocco, J. Geol. Soc., 150, 707–718.
Pollack, H.N., Hurter, S.J. & Johnson, J.R., 1993. Heat flow from the Earth’sinterior: analysis of the global data set, Rev. Geophys., 31, 267–280.
Raykova, R.B. & Panza, G.F., 2010. The shear-wave velocity structure of thelithosphere–asthenosphere system in the Iberian area and surroundings,Rend. Fis. Acc. Lincei, 21, 183–231.
Ribeiro, A., Antunes, M.T., Ferreira, M.P., Rocha, R.B., Soares, A.F.,Zbyszewisky, G. & de Almeida, F.M., 1979. Intoduction a la GeologieGenerale du Portugal, Serv. Geol. Portugal, Lisbon.
Ribeiro, A., Quesada, C. & Dallmeyer, R.D., 1990. Geodynamic evolutionof the Iberian Massif, in Pre-Mesozoic Geology of the Iberian Peninsula,pp 399–409, eds. Dallmeyer, R. D. & Gracia, M., Springer-Verlag, Berlin.
Ribeiro, A., Cabral, J., Baptista, R. & Matias, L., 1996. Stress patterns inPortugal mainland and the adjacent Atlantic region, West Iberia, Tectonics,2, 641–659.
Ribeiro, A., Mendes-Victor, L., Cabral, J., Matias, L. & Terrinha, P., 2006.The Lisbon earthquake and the beginning of closure of the Atlantic, Eur.Rev., 14, 193–205.
Rigby, M., 2008. Recent faulting and active shortening of the Middle AtlasMountains, Morocco, within the diffuse African-Eurasian Plate boundary.MSc thesis, University of Missouri, Columbia, MO.
Roque, A.C., 2008. Tectonostratigrafia do Cenozoico das Margens Con-tinentais Sul e Sudoeste Portuguesas: Um Modelo de Correlacao Sis-mostratigrafica, PhD thesis, University of Lisbon (in Portuguese).
Rosas, F.M., Duarte J.C, Terrinha, P., Valadares, V. & Matias, L., 2009. Mor-photectonic characterization of major bathymetric lineaments in Gulf ofCadiz (Africa–Iberia plate boundary): insights from analogue modellingexperiments, Mar. Geol., 261, 33–47.
Rovere, M., Ranero, C.R., Sartori, R., Torelli, L. & Zitellini, N., 2004.Seismic images and magnetic signature of the Late Jurassic to EarlyCretaceous Africa-Eurasia plate Boundary off SW Iberia, Geophys.J. Int., 158, 554–568.
Royden, L.H., 1993. Evolution of retreating subduction boundaries formedduring continental collision, Tectonics, 12, 629–638.
Sartori, R., Torelli, L., Zitellini, N., Peis, D. & Lodolo, E., 1994. Eastern seg-ment of the Azores–Gibraltar line (central-eastern Atlantic): an oceanicplate boundary with diffuse compressional deformation, Geology, 22,555–558.
Seber, D., Barazangi, M., Ibenbrahim, A. & Demnati, A., 1996. Geophysicalevidence for lithospheric delamination beneath the Alboran Sea and Rif-Betic mountains, Nature, 379, 785–790.
Sella, G., Dixom, T. & Mao, A., 2002. REVEL: a model for Re-cent plate velocities from space geodesy, J. geophys. Res., 107,doi:10.1029/2000JB000033.
Solares, J.M. & Arroyo, A.L., 2004. The great historical 1755 earthquake.Effects and damage in Spain, J. Seismol., 8, 275–294.
Souriau, A., Chevrot, S. & Olivera, C., 2008. A new tomographic imageof the Pyrenean lithosphere from teleseismic data, Tectonophysics, 460,206–214.
Sousa, M.L., Martins, A. & Oliveira, C.S., 1992. Compilacao de catalogossısmicos da regiao Iberica, Relatorio 36/92, NDA, Laboratorio Nacionalde Engenharia Civil, Lisboa.
Spakman, W. & Wortel, R., 2004. A Tomographic view on Western Mediter-ranean geodynamics, in Transmed Atlas—The Mediterranean Region fromCrust to Mantle, pp. 31–51, eds. Cavazza, W., Roure, F.M., Spakman, W.,Stampfli, G.M. & Ziegler, P.A., Springer-Verlag, Berlin.
Stich, D., Mancilla, F.-L., Baumont, D. & Morales, J., 2005. Sourceanalysis of the Mw 6.3 2004 Al Hoceima earthquake (Morocco) us-ing regional apparent source time functions, J. geophys. Res., 110,doi:10.1029/2002JB002057.
Stich, D., Serpelloni, E., Mancilla, F.-L. & Morales, J., 2006. Kinematics ofthe Iberia–Maghreb plate contact from seismic moment tensors and GPSobservations, Tectonophysics, 426, 295–317.
Stich, D., Mancilla, F., Pondrelli, S. & Morales, J., 2007. Source anal-ysis of the February 12th 2007, Mw 6.0 Horseshoe earthquake: im-plications for the 1755 Lisbon earthquake, Geophys. Res. Lett., 34,doi:10.1029/2007GL030012.
Stich, D., Martin, R. & Morales, J., 2010. Moment tensor inversion forIberia-Maghreb earthquakes 2005–2008, Tectonophysics, 483, 390–398.
Tahayt, A. et al., 2008. Mouvements actuels des blocs tectoniques dans l’arcBetico-Rifain a partir des mesures GPS entre 1999 et 2005, ComptesRendus Geoscience, 340, 400–413.
Teixell, A., Arboleya, M.-L., Julivert, M., & Charroud, M., 2003. Tectonicshortening and topography in the central High Atlas (Morocco), Tectonics,22, doi:10.1029/2002TC001460.
Terrinha, P., 1998. Structural Geology and Tectonic Evolution of the AlgarveBasin, South Portugal, PhD thesis, University of London.
Terrinha, P., Ribeiro, C., Kullberg, J.C., Lopes, C., Rocha, R. & Ribeiro, A.,2002. Compressive episodes and faunal isolation during rifting, southwestIberia, J. Geology, 110, 101–113.
Terrinha, P. et al. 2003. Tsunamigenic–seismogenic structures, neotectonics,sedimentary process and slope instability on the southwest Portuguesemargin, Mar. Geol., 195, 55–73.
Terrinha, P., et al. 2009. Morphotectonics and strain partitioning at theIberia–Africa plate boundary from multibeam and seismic reflection data,Mar. Geol., 267, 156–174.
Teves Costa, P., Rio, I., Marreiros, C., Ribeiro R., & Borges, J.F., 1999.Source parameters of old earthquakes: semi-automatic digitization ofanalog records and seismic moment assessment, Natural Hazards, 19,205–220.
Thiebot, E. & Gutscher, M.-A., 2006. The Gibraltar Arc seismogenic zone(part 1): constraints on a shallow east dipping fault plane source for the1755 Lisbon earthquake provided by seismic data, gravity and thermalmodeling, Tectonophysics, 426, 135–152.
Torne, M., Fernandez, M., Comas, M.C. & Soto, J.I., 2000. Lithosphericstructure beneath the Alboran Basin: results from 3D gravity modelingand tectonic relevance, J. geophys. Res., 105, 3209–3228.
Valera, J.-L., Negredo, A. & Villasenor, A., 2008. Asymmetric delamina-tion and convective removal numerical modeling: comparison with evo-lutionary models for the Alboran Sea region, Pure appl. Geophys., 165,1683–1706.
Vernant, P. et al., 2010. Geodetic constraints on active tectonics of theWestern Mediterranean: Implications for the kinematics and dynam-ics of the Nubia-Eurasia plate boundary zone, J. Geodyn., 49, 123–129.
Vilanova, S.P., Nunes, C.F. & Fonseca, J.F.B.D., 2003. Lisbon 1755: a caseof triggered onshore rupture?, Bull. seism. Soc. Am., 93, 2056–2068.
Watts, A.B., Platt, J.P. & Buhl, P., 1993. Tectonic evolution of the AlboranSea Basin, Basin Res., 5, 153–177.
Wessel, P. & Smith, W.H.F., 1998. New, improved version of the GenericMapping Tools released, EOS, Trans. Am. Geophys. Un., 79, 579,doi:10.1029/98EO00426.
Whitmarsh, R.B., White, R.S., Horsefield, S.J., Sibuet, J.-C., Recq, M.& Louvel, V., 1996. The ocean-continent boundary off the western
C© 2012 The Authors, GJI, 188, 850–872
Geophysical Journal International C© 2012 RAS

872 T. A. Cunha et al.
continental margin of Iberia: crustal structure west of Galicia Bank, J.geophys. Res., 101, 28 291–28 314.
Wigger, P., Asch, G., Giese, P., Heinsohn, W.-D., El Alami, S.O. & Ramdani,F., 1992. Crustal structure along a transverse across the Middle and HighAtlas Mountains derived from seismic refraction studies, GeologischeRundschau, 81, 237–248.
Wortel, M.J.R. & Spakman, W., 2000. Subduction and slab detachment inthe Mediterranean–Carpathian Region, Science, 290, 1910–1917.
Zeyen, H., & Fernandez, M., 1994. Integrated lithospheric modelling com-bining thermal, gravity, and local isostasy analysis: application to the NESpanish geotransect, J. geophys. Res., 99, 18 089–18 102.
Zeyen, H., Ayarza, P., Fernandez, M. & Rimi, A., 2005. Lithosphericstructure under the western African–European plate boundary: a tran-sect across the Atlas Mountains and the Gulf of Cadiz, Tectonics, 24,doi:10.1029/2004TC001639.
Zitellini, N. et al., 2001. Source of the 1755 Lisbon earthquake and tsunamiinvestigated, EOS, Trans. Am. geophys. Un., 82, 290–291.
Zitellini, N., Rovere, M., Terrinha, P., Chierici, F., Matias, L. & BIGSETSTeam, 2004. Neogene through quaternary tectonic reactivation of SWIberian passive margin, Pure appl. Geophys., 161, 565–587.
Zitellini, N. et al., 2009. The quest for the Africa–Eurasia plate boundarywest of the Strait of Gibraltar, Earth planet. Sci. Lett., 280, 13–50.
S U P P O RT I N G I N F O R M AT I O N
Additional information may be found in the online version of thisarticle:
Figure S1. Comparison of the tested tectonic models in terms of:Top-panel (a–c)—the long-term average fault slip rates; Middletop-panel (d–f)—The logarithm of smoothed strain rate assuming afault friction coefficient of 0.05.Figure S2. Comparison of the best-fit tectonic Model-3 with amodel where the Gibraltar Arc has been closed, linking the Beticand Rif thrust fronts and thus separating the Alboran and Atlanticdomains (Model-4; see Section 6 of the paper): Top-panel (a andb)—the long-term average fault slip rates; Bottom-panel (c andd)—The logarithm of smoothed strain rate assuming a fault frictioncoefficient of 0.05.Figure S3. Comparison of model predictions for two distinct litho-sphere configurations: (1) Lithosphere calculated in this studyunder the general assumption of local isostasy and a steady statethermal regime; (2) Assuming a lithospheric structure similar tothat predicted by Fullea et al. (2007; see Sections 3.3 and 6 of thepaper).
Please note: Wiley-Blackwell is not responsible for the content orfunctionality of any supporting materials supplied by the authors.Any queries (other than missing material) should be directed to thecorresponding author for the article.
C© 2012 The Authors, GJI, 188, 850–872
Geophysical Journal International C© 2012 RAS