georeferencing of historical maps: gis technology …
TRANSCRIPT
Geographia Technica, Vol. 09, Issue 1, 2014, pp 10 to 19
GEOREFERENCING OF HISTORICAL MAPS: GIS TECHNOLOGY FOR
URBAN ANALYSIS
Raffaella BRIGANTE1, Fabio RADICIONI1
ABSTRACT:
Mapping methods have undergone substantial changes over the centuries, going from
representations based on subjective perceptions and reconstructions to actual scale
reproductions of the land. The creation of a GIS in which to store georeferenced historical
maps for a given area is essential for assessing its evolution and its changes due both to
natural development and to catastrophic events such as earthquakes. More specifically, in
this experimentation, starting from a historical research of the maps available, we want to
create a GIS for a specific area of central Italy (Municipality of Foligno – Perugia) struck by
an earthquake in 1997 that caused extensive damage. Analyzing the various maps available
(raster and vector), georeferenced in the same datum and regarding different periods, we
want to identify the changes in the area being analyzed, especially in reference to urban
development and to the damage caused by the earthquake.
We also want to evaluate the possibility of using historical maps as an aid for other types of
investigations, such as to search for possible causes of the collapsing of sections of ancient
city walls, as occurred in Amelia, an Umbrian town in the province of Terni.
1. INTRODUCTION
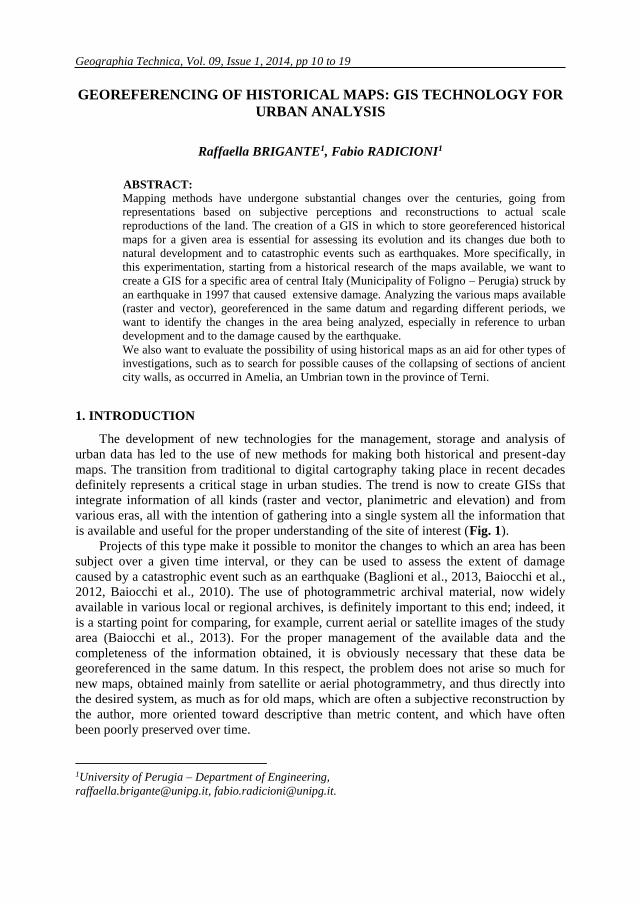
The development of new technologies for the management, storage and analysis of
urban data has led to the use of new methods for making both historical and present-day
maps. The transition from traditional to digital cartography taking place in recent decades
definitely represents a critical stage in urban studies. The trend is now to create GISs that
integrate information of all kinds (raster and vector, planimetric and elevation) and from
various eras, all with the intention of gathering into a single system all the information that
is available and useful for the proper understanding of the site of interest (Fig. 1).
Projects of this type make it possible to monitor the changes to which an area has been
subject over a given time interval, or they can be used to assess the extent of damage
caused by a catastrophic event such as an earthquake (Baglioni et al., 2013, Baiocchi et al.,
2012, Baiocchi et al., 2010). The use of photogrammetric archival material, now widely
available in various local or regional archives, is definitely important to this end; indeed, it
is a starting point for comparing, for example, current aerial or satellite images of the study
area (Baiocchi et al., 2013). For the proper management of the available data and the
completeness of the information obtained, it is obviously necessary that these data be
georeferenced in the same datum. In this respect, the problem does not arise so much for
new maps, obtained mainly from satellite or aerial photogrammetry, and thus directly into
the desired system, as much as for old maps, which are often a subjective reconstruction by
the author, more oriented toward descriptive than metric content, and which have often
been poorly preserved over time.
1University of Perugia – Department of Engineering,
Raffaella BRIGANTE and Fabio RADICIONI / GEOREFERENCING OF HISTORICAL MAPS … 11
Fig. 1 Overlay of data in a GIS.
2. 1997 UMBRIA-MARCHE EARTHQUAKE
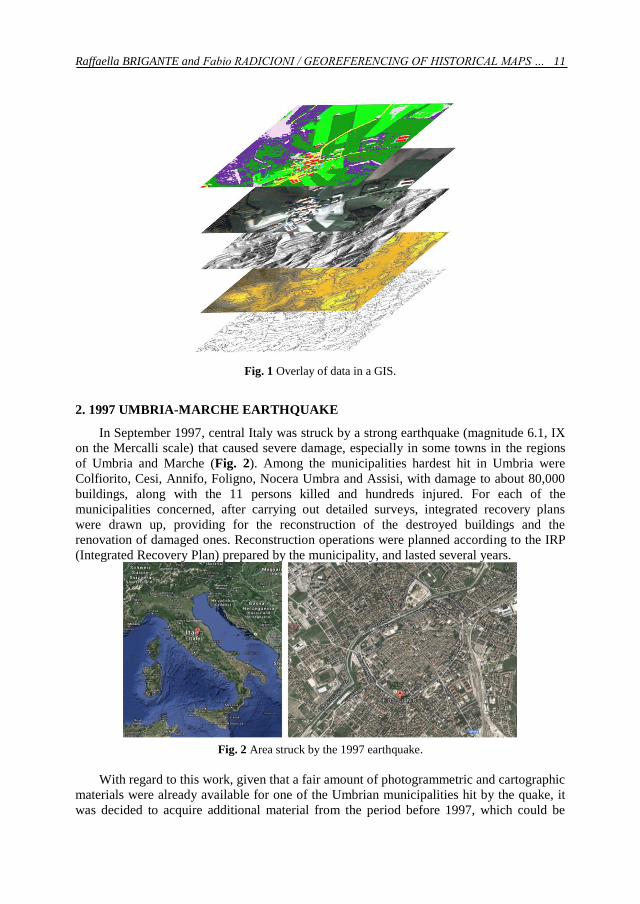
In September 1997, central Italy was struck by a strong earthquake (magnitude 6.1, IX
on the Mercalli scale) that caused severe damage, especially in some towns in the regions
of Umbria and Marche (Fig. 2). Among the municipalities hardest hit in Umbria were
Colfiorito, Cesi, Annifo, Foligno, Nocera Umbra and Assisi, with damage to about 80,000
buildings, along with the 11 persons killed and hundreds injured. For each of the
municipalities concerned, after carrying out detailed surveys, integrated recovery plans
were drawn up, providing for the reconstruction of the destroyed buildings and the
renovation of damaged ones. Reconstruction operations were planned according to the IRP
(Integrated Recovery Plan) prepared by the municipality, and lasted several years.
Fig. 2 Area struck by the 1997 earthquake.
With regard to this work, given that a fair amount of photogrammetric and cartographic
materials were already available for one of the Umbrian municipalities hit by the quake, it
was decided to acquire additional material from the period before 1997, which could be
12
used as a comparison in assessing the damage to the architectural heritage. The
municipality taken into consideration is Foligno, located in the province of Perugia, for
which high-resolution multispectral satellite images taken from the QuickBird satellite in
2003 and 2004 and regional technical maps in vector format were available. The additional
material acquired included aerial photographs from 1977 in 1:13000 scale (the only
cartographic data available from a time prior to the earthquake), an Ikonos satellite stereo
pair from 2006, aerial multispectral orthophoto from 2008 and a map of the damage caused
by the earthquake drawn by municipal technicians.
Thus having photogrammetric and cartographic material available for the same study
area that covers a time span of about 30 years, we wished to search for further historical
records in order to create a database to represent its evolution over time and, with regard to
the earthquake, to find a relationship between the period of construction of the buildings
and the damage they suffered.
3. GEOREFERENCING THE MAPS OF THE GREGORIAN CADASTRE
The Gregorian Cadastre was the first detailed cadastral survey of the old Papal States,
promoted by Pius VII in 1816 and begun by Gregory XVI in 1835. On the maps, generally
in 1:2000 scale, each parcel of land is identified by a number and described in the cadastral
register with the name of the owner. Sacred places, fortresses and public places instead are
indicated by alphabetical letters. There is also information about the types of crops planted
or the presence of trees, woods, vineyards, etc.
(http://www.bonificaumbra.it/index.php?page=catasto_gregoriano).
In many cases these maps represent the only historical record of the area (Buonora,
2009), and they can be used as a informational tool in map processing and urban analyses to
be carried out. The most important information that can be extracted regards the buildings,
but the road layout and the land cover of the mapped areas are also well defined.
Georeferencing is necessary, however, in order to integrate this information into a GIS and
to overlay it on other cartographic and/or photogrammetric material, so as to be able to
have all the urban information available in a single system, organized on layers that can be
activated or not, or combined with each other. The georeferencing undoubtedly causes
deformations of the original map so that it can be adapted to a common reference system,
which translates into “errors” in the coordinates of some characteristic points (control
points). However, such errors can be considered acceptable for all those urban analyses
where high accuracy is not required, or in which the comparison to be made is only
qualitative and not metric, such as to verify the presence or absence of a building, or to
evaluate the expansion of an urban center or the changes in the road layout, etc (Baiocchi &
Lelo, 2010, Mastronunzio, 2010).
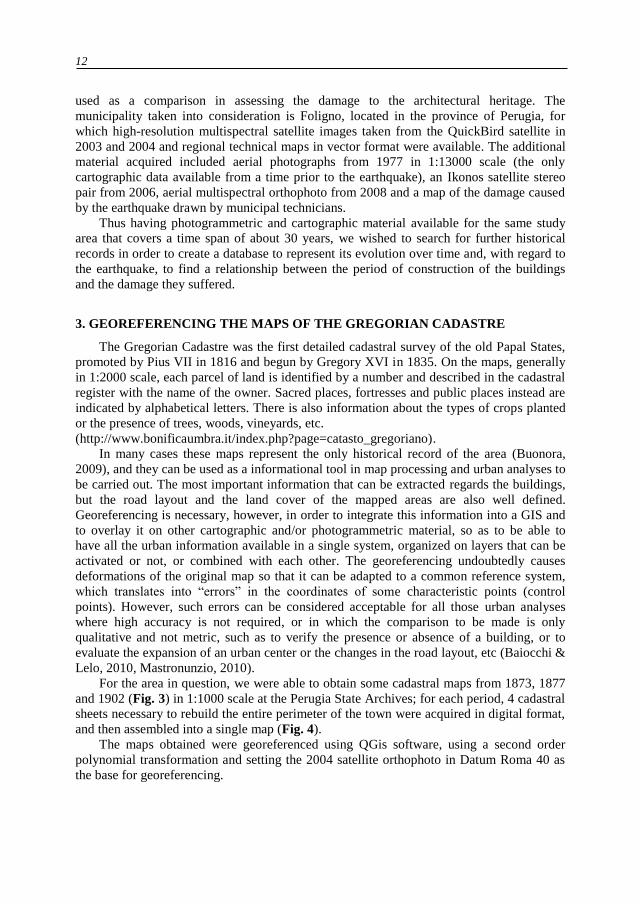
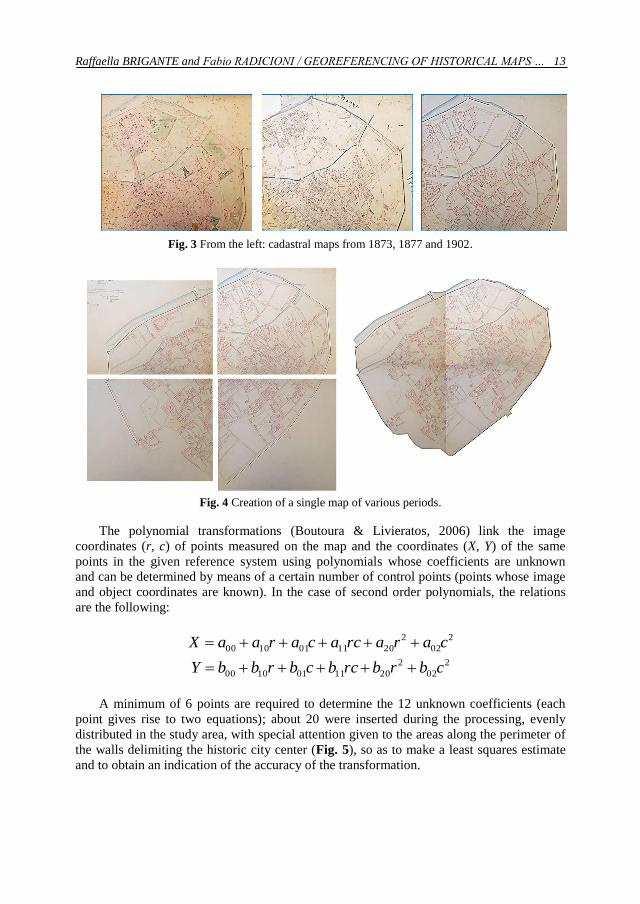
For the area in question, we were able to obtain some cadastral maps from 1873, 1877
and 1902 (Fig. 3) in 1:1000 scale at the Perugia State Archives; for each period, 4 cadastral
sheets necessary to rebuild the entire perimeter of the town were acquired in digital format,
and then assembled into a single map (Fig. 4).
The maps obtained were georeferenced using QGis software, using a second order
polynomial transformation and setting the 2004 satellite orthophoto in Datum Roma 40 as
the base for georeferencing.
Raffaella BRIGANTE and Fabio RADICIONI / GEOREFERENCING OF HISTORICAL MAPS … 13
Fig. 3 From the left: cadastral maps from 1873, 1877 and 1902.
Fig. 4 Creation of a single map of various periods.
The polynomial transformations (Boutoura & Livieratos, 2006) link the image
coordinates (r, c) of points measured on the map and the coordinates (X, Y) of the same
points in the given reference system using polynomials whose coefficients are unknown
and can be determined by means of a certain number of control points (points whose image
and object coordinates are known). In the case of second order polynomials, the relations
are the following:
2
02
2
2011011000 cararcacaraaX
2
02
2
2011011000 cbrbrcbcbrbbY
A minimum of 6 points are required to determine the 12 unknown coefficients (each
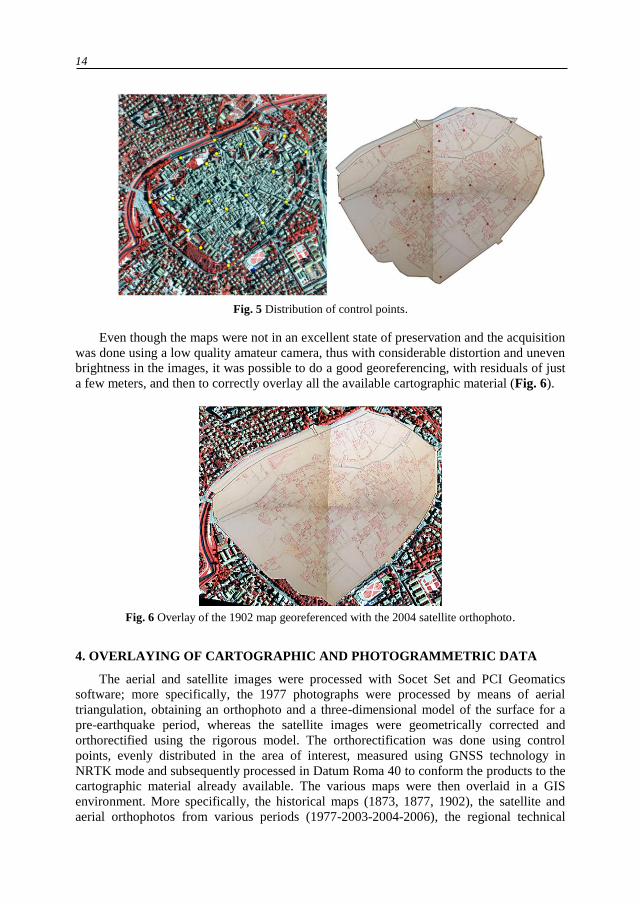
point gives rise to two equations); about 20 were inserted during the processing, evenly
distributed in the study area, with special attention given to the areas along the perimeter of
the walls delimiting the historic city center (Fig. 5), so as to make a least squares estimate
and to obtain an indication of the accuracy of the transformation.
14
Fig. 5 Distribution of control points.
Even though the maps were not in an excellent state of preservation and the acquisition
was done using a low quality amateur camera, thus with considerable distortion and uneven
brightness in the images, it was possible to do a good georeferencing, with residuals of just
a few meters, and then to correctly overlay all the available cartographic material (Fig. 6).
Fig. 6 Overlay of the 1902 map georeferenced with the 2004 satellite orthophoto.
4. OVERLAYING OF CARTOGRAPHIC AND PHOTOGRAMMETRIC DATA
The aerial and satellite images were processed with Socet Set and PCI Geomatics
software; more specifically, the 1977 photographs were processed by means of aerial
triangulation, obtaining an orthophoto and a three-dimensional model of the surface for a
pre-earthquake period, whereas the satellite images were geometrically corrected and
orthorectified using the rigorous model. The orthorectification was done using control
points, evenly distributed in the area of interest, measured using GNSS technology in
NRTK mode and subsequently processed in Datum Roma 40 to conform the products to the
cartographic material already available. The various maps were then overlaid in a GIS
environment. More specifically, the historical maps (1873, 1877, 1902), the satellite and
aerial orthophotos from various periods (1977-2003-2004-2006), the regional technical
Raffaella BRIGANTE and Fabio RADICIONI / GEOREFERENCING OF HISTORICAL MAPS … 15
vector maps at 1:5000 scale, the map of the damage caused by the earthquake and other
thematic maps provided by the Municipality of Foligno were integrated in a single project.
This overlay allowed us to perform various analyses. First, it was possible to evaluate the
transformation of the area, especially the road network and the built-up area, noting that
there has been an expansion from the city center – which remained virtually unchanged
over the period considered – towards the outside, with the development of the suburban
areas zoned primarily for commercial and industrial activities, as well as residential.
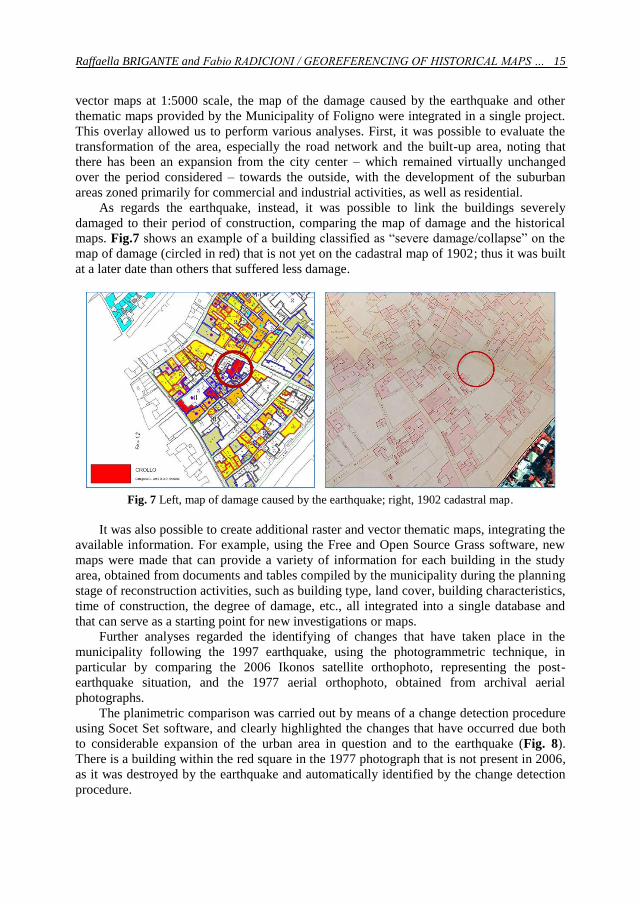
As regards the earthquake, instead, it was possible to link the buildings severely
damaged to their period of construction, comparing the map of damage and the historical
maps. Fig.7 shows an example of a building classified as “severe damage/collapse” on the
map of damage (circled in red) that is not yet on the cadastral map of 1902; thus it was built
at a later date than others that suffered less damage.
Fig. 7 Left, map of damage caused by the earthquake; right, 1902 cadastral map.
It was also possible to create additional raster and vector thematic maps, integrating the
available information. For example, using the Free and Open Source Grass software, new
maps were made that can provide a variety of information for each building in the study
area, obtained from documents and tables compiled by the municipality during the planning
stage of reconstruction activities, such as building type, land cover, building characteristics,
time of construction, the degree of damage, etc., all integrated into a single database and
that can serve as a starting point for new investigations or maps.
Further analyses regarded the identifying of changes that have taken place in the
municipality following the 1997 earthquake, using the photogrammetric technique, in
particular by comparing the 2006 Ikonos satellite orthophoto, representing the post-
earthquake situation, and the 1977 aerial orthophoto, obtained from archival aerial
photographs.
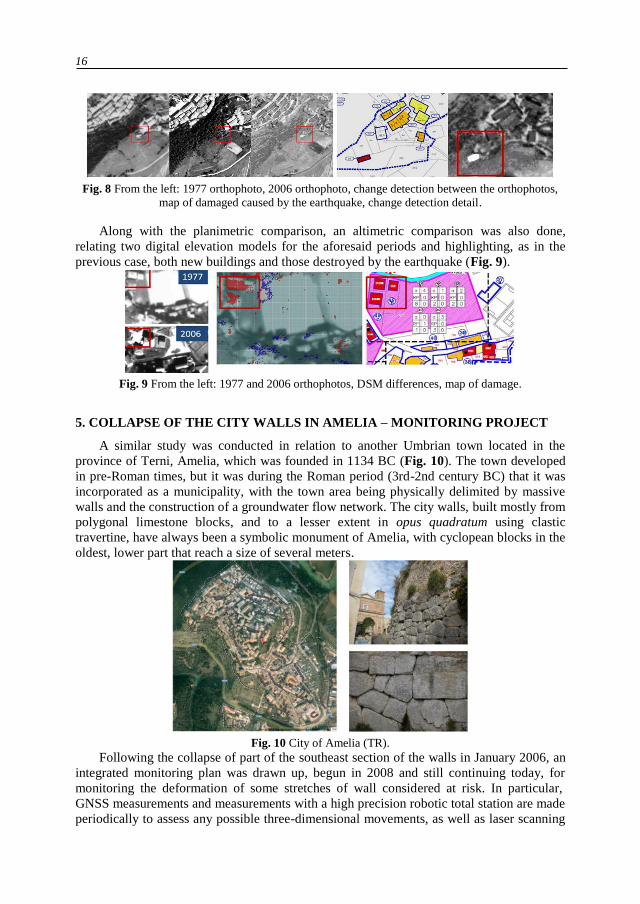
The planimetric comparison was carried out by means of a change detection procedure
using Socet Set software, and clearly highlighted the changes that have occurred due both
to considerable expansion of the urban area in question and to the earthquake (Fig. 8).
There is a building within the red square in the 1977 photograph that is not present in 2006,
as it was destroyed by the earthquake and automatically identified by the change detection
procedure.
16
Fig. 8 From the left: 1977 orthophoto, 2006 orthophoto, change detection between the orthophotos,
map of damaged caused by the earthquake, change detection detail.
Along with the planimetric comparison, an altimetric comparison was also done,
relating two digital elevation models for the aforesaid periods and highlighting, as in the
previous case, both new buildings and those destroyed by the earthquake (Fig. 9).
Fig. 9 From the left: 1977 and 2006 orthophotos, DSM differences, map of damage.
5. COLLAPSE OF THE CITY WALLS IN AMELIA – MONITORING PROJECT
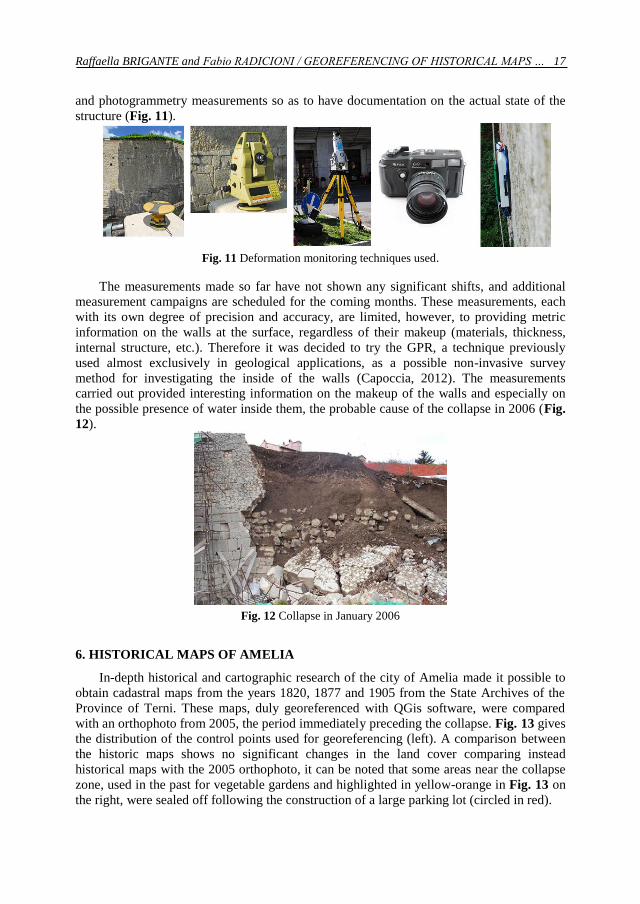
A similar study was conducted in relation to another Umbrian town located in the
province of Terni, Amelia, which was founded in 1134 BC (Fig. 10). The town developed
in pre-Roman times, but it was during the Roman period (3rd-2nd century BC) that it was
incorporated as a municipality, with the town area being physically delimited by massive
walls and the construction of a groundwater flow network. The city walls, built mostly from
polygonal limestone blocks, and to a lesser extent in opus quadratum using clastic
travertine, have always been a symbolic monument of Amelia, with cyclopean blocks in the
oldest, lower part that reach a size of several meters.
Fig. 10 City of Amelia (TR).
Following the collapse of part of the southeast section of the walls in January 2006, an
integrated monitoring plan was drawn up, begun in 2008 and still continuing today, for
monitoring the deformation of some stretches of wall considered at risk. In particular,
GNSS measurements and measurements with a high precision robotic total station are made
periodically to assess any possible three-dimensional movements, as well as laser scanning
Raffaella BRIGANTE and Fabio RADICIONI / GEOREFERENCING OF HISTORICAL MAPS … 17
and photogrammetry measurements so as to have documentation on the actual state of the
structure (Fig. 11).
Fig. 11 Deformation monitoring techniques used.
The measurements made so far have not shown any significant shifts, and additional
measurement campaigns are scheduled for the coming months. These measurements, each
with its own degree of precision and accuracy, are limited, however, to providing metric
information on the walls at the surface, regardless of their makeup (materials, thickness,
internal structure, etc.). Therefore it was decided to try the GPR, a technique previously
used almost exclusively in geological applications, as a possible non-invasive survey
method for investigating the inside of the walls (Capoccia, 2012). The measurements
carried out provided interesting information on the makeup of the walls and especially on
the possible presence of water inside them, the probable cause of the collapse in 2006 (Fig.
12).
Fig. 12 Collapse in January 2006
6. HISTORICAL MAPS OF AMELIA
In-depth historical and cartographic research of the city of Amelia made it possible to
obtain cadastral maps from the years 1820, 1877 and 1905 from the State Archives of the
Province of Terni. These maps, duly georeferenced with QGis software, were compared
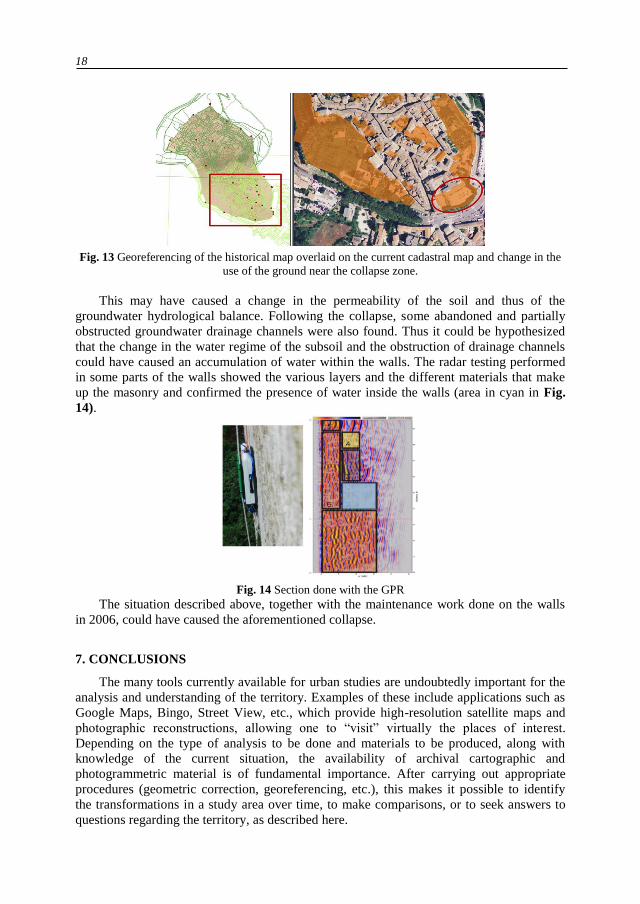
with an orthophoto from 2005, the period immediately preceding the collapse. Fig. 13 gives
the distribution of the control points used for georeferencing (left). A comparison between
the historic maps shows no significant changes in the land cover comparing instead
historical maps with the 2005 orthophoto, it can be noted that some areas near the collapse
zone, used in the past for vegetable gardens and highlighted in yellow-orange in Fig. 13 on
the right, were sealed off following the construction of a large parking lot (circled in red).
18
Fig. 13 Georeferencing of the historical map overlaid on the current cadastral map and change in the
use of the ground near the collapse zone.
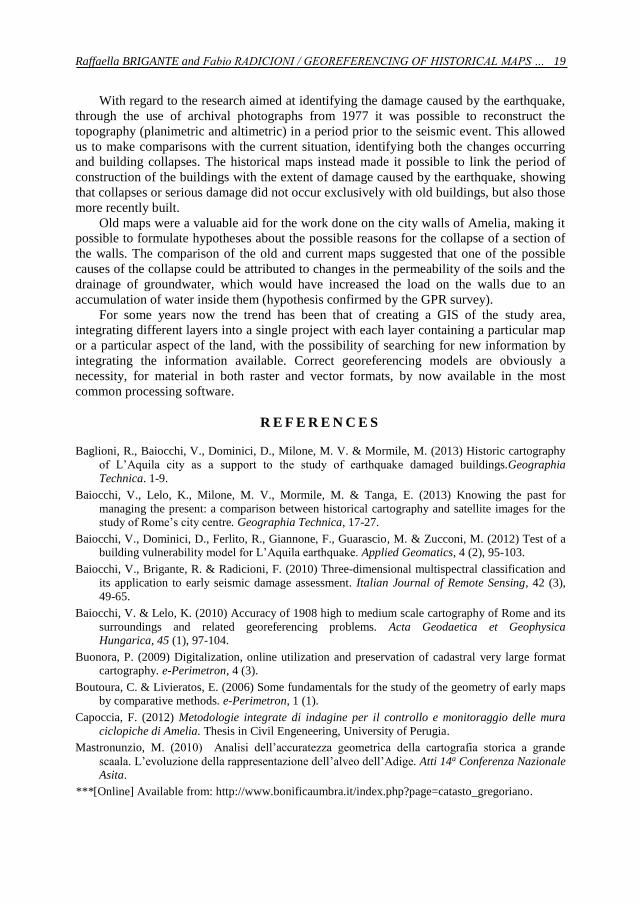
This may have caused a change in the permeability of the soil and thus of the
groundwater hydrological balance. Following the collapse, some abandoned and partially
obstructed groundwater drainage channels were also found. Thus it could be hypothesized
that the change in the water regime of the subsoil and the obstruction of drainage channels
could have caused an accumulation of water within the walls. The radar testing performed
in some parts of the walls showed the various layers and the different materials that make
up the masonry and confirmed the presence of water inside the walls (area in cyan in Fig.
14).
Fig. 14 Section done with the GPR
The situation described above, together with the maintenance work done on the walls
in 2006, could have caused the aforementioned collapse.
7. CONCLUSIONS
The many tools currently available for urban studies are undoubtedly important for the
analysis and understanding of the territory. Examples of these include applications such as
Google Maps, Bingo, Street View, etc., which provide high-resolution satellite maps and
photographic reconstructions, allowing one to “visit” virtually the places of interest.
Depending on the type of analysis to be done and materials to be produced, along with
knowledge of the current situation, the availability of archival cartographic and
photogrammetric material is of fundamental importance. After carrying out appropriate
procedures (geometric correction, georeferencing, etc.), this makes it possible to identify
the transformations in a study area over time, to make comparisons, or to seek answers to
questions regarding the territory, as described here.
Raffaella BRIGANTE and Fabio RADICIONI / GEOREFERENCING OF HISTORICAL MAPS … 19
With regard to the research aimed at identifying the damage caused by the earthquake,
through the use of archival photographs from 1977 it was possible to reconstruct the
topography (planimetric and altimetric) in a period prior to the seismic event. This allowed
us to make comparisons with the current situation, identifying both the changes occurring
and building collapses. The historical maps instead made it possible to link the period of
construction of the buildings with the extent of damage caused by the earthquake, showing
that collapses or serious damage did not occur exclusively with old buildings, but also those
more recently built.
Old maps were a valuable aid for the work done on the city walls of Amelia, making it
possible to formulate hypotheses about the possible reasons for the collapse of a section of
the walls. The comparison of the old and current maps suggested that one of the possible
causes of the collapse could be attributed to changes in the permeability of the soils and the
drainage of groundwater, which would have increased the load on the walls due to an
accumulation of water inside them (hypothesis confirmed by the GPR survey).
For some years now the trend has been that of creating a GIS of the study area,
integrating different layers into a single project with each layer containing a particular map
or a particular aspect of the land, with the possibility of searching for new information by
integrating the information available. Correct georeferencing models are obviously a
necessity, for material in both raster and vector formats, by now available in the most
common processing software.
R E F E R E N C E S
Baglioni, R., Baiocchi, V., Dominici, D., Milone, M. V. & Mormile, M. (2013) Historic cartography
of L’Aquila city as a support to the study of earthquake damaged buildings.Geographia
Technica. 1-9.
Baiocchi, V., Lelo, K., Milone, M. V., Mormile, M. & Tanga, E. (2013) Knowing the past for
managing the present: a comparison between historical cartography and satellite images for the study of Rome’s city centre. Geographia Technica, 17-27.
Baiocchi, V., Dominici, D., Ferlito, R., Giannone, F., Guarascio, M. & Zucconi, M. (2012) Test of a building vulnerability model for L’Aquila earthquake. Applied Geomatics, 4 (2), 95-103.
Baiocchi, V., Brigante, R. & Radicioni, F. (2010) Three-dimensional multispectral classification and
its application to early seismic damage assessment. Italian Journal of Remote Sensing, 42 (3),
49-65.
Baiocchi, V. & Lelo, K. (2010) Accuracy of 1908 high to medium scale cartography of Rome and its
surroundings and related georeferencing problems. Acta Geodaetica et Geophysica Hungarica, 45 (1), 97-104.
Buonora, P. (2009) Digitalization, online utilization and preservation of cadastral very large format cartography. e-Perimetron, 4 (3).
Boutoura, C. & Livieratos, E. (2006) Some fundamentals for the study of the geometry of early maps by comparative methods. e-Perimetron, 1 (1).
Capoccia, F. (2012) Metodologie integrate di indagine per il controllo e monitoraggio delle mura
ciclopiche di Amelia. Thesis in Civil Engeneering, University of Perugia.
Mastronunzio, M. (2010) Analisi dell’accuratezza geometrica della cartografia storica a grande
scaala. L’evoluzione della rappresentazione dell’alveo dell’Adige. Atti 14a Conferenza Nazionale Asita.
***[Online] Available from: http://www.bonificaumbra.it/index.php?page=catasto_gregoriano.