geotechnical report investigation data and …
TRANSCRIPT
GEOTECHNICAL REPORT
INVESTIGATION DATA AND ENGINEERING ASSESSMENTS
PEEJAY-1 JACK-UP SITE INVESTIGATION BASS STRAIT, OFFSHORE AUSTRALIA
Client Reference No. K-10-08-07
Fugro Report No. G0007 - N4808/16 ISSUE 3
Australian Drilling Associates Pty Ltd
Fugro Report No. N4808/16 (3) Table of Contents
© F
EBV/
CD
E/R
EP/
002
ISSU
E 24
Page 1 of 2
CONTENTS Page
REPORT ISSUE CONTROL (i)
QUALITY ASSURANCE RECORD (ii)
MAIN TEXT: 1. INTRODUCTION ....................................................................................................1
1.1 GENERAL PROJECT DESCRIPTION ...........................................................1 1.2 PURPOSE AND SCOPE................................................................................1 1.3 GUIDELINES FOR USE OF REPORT ...........................................................1 1.4 REPORT FORMAT ........................................................................................2
2. STUDY OVERVIEW ...............................................................................................3 2.1 PROJECT RESPONSIBILITIES .....................................................................3 2.2 DATA SOURCES ...........................................................................................3 2.3 POSITIONING AND WATER DEPTH ............................................................3 2.4 SAMPLING AND IN-SITU TESTING ..............................................................4 2.5 SAMPLE HANDLING .....................................................................................4 2.6 LABORATORY TESTING...............................................................................5 2.7 GEOTECHNICAL DATA INTERPRETATION.................................................5 2.8 ENGINEERING ANALYSIS............................................................................5
3. SITE CONDITIONS ................................................................................................6 3.1 INTERPRETED GEOLOGICAL SETTING .....................................................6 3.2 SEAFLOOR CONDITIONS.............................................................................7 3.3 GENERALISED STRATIGRAPHY .................................................................7 3.4 LATERAL VARIABILITY.................................................................................8
4. SPUDCAN FOUNDATION .....................................................................................9 4.1 DESIGN BASIS ..............................................................................................9 4.2 SELECTION OF PARAMETER VALUES.......................................................9 4.3 CALCULATION RESULTS...........................................................................10
5. CONCLUSIONS AND RECOMMENDATIONS ....................................................12
6. REFERENCES .....................................................................................................13
Fugro Report No. N4808/16 (3) Table of Contents
© F
EBV/
CD
E/R
EP/
002
ISSU
E 24
Page 2 of 2
CONTENTS (CONTINUED) LIST OF TABLES IN MAIN TEXT: Page TABLE 3.1 SOIL PROFILE AT THE PEEJAY-1_02 LOCATION ...................................................................... 7 TABLE 4.1 SPUDCAN DIMENSIONS AND PRELOAD .................................................................................... 9 LIST OF PLATES FOLLOWING MAIN TEXT: Plate Vicinity Map .................................................................................................................................................... 1-1 Location Plan ................................................................................................................................................. 1-2 Detailed Location Plan ................................................................................................................................... 1-3 Co-ordinates and Water Depths .................................................................................................................... 1-4 Geodetic Parameters AGD84 ........................................................................................................................ 1-5 Geodetic Parameters GDA94 ........................................................................................................................ 1-6 Geotechnical Project Responsibilities ............................................................................................................ 2-1
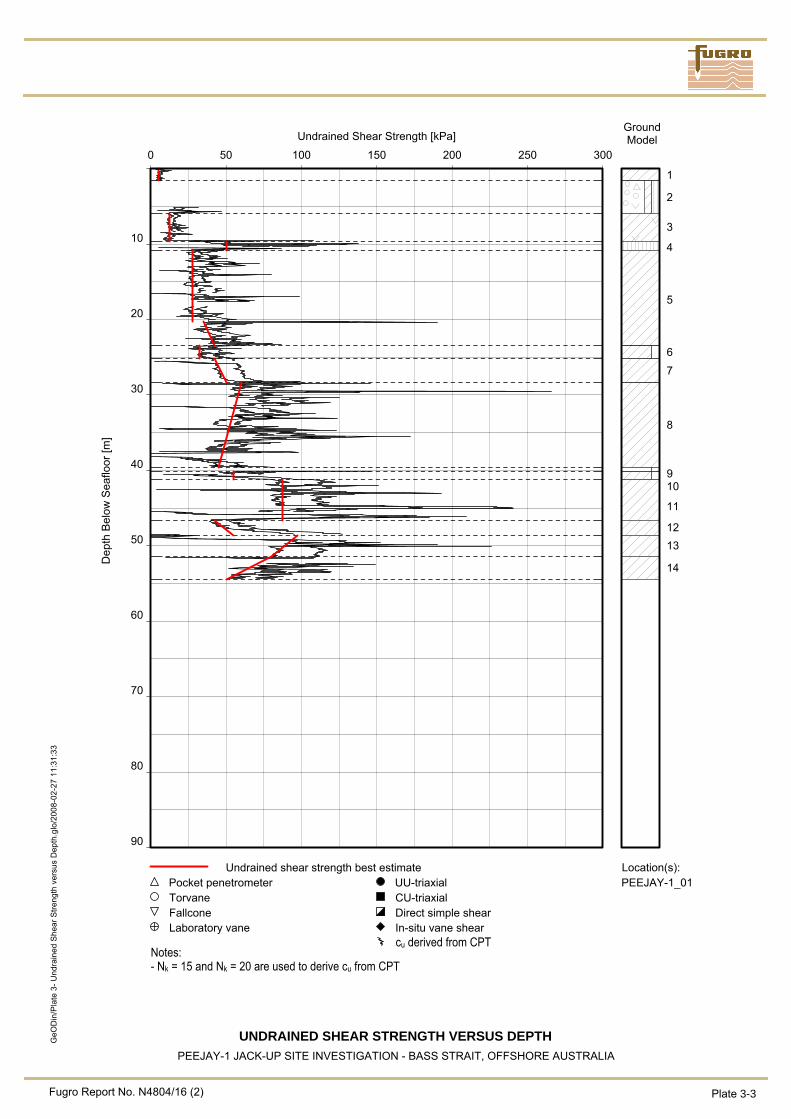
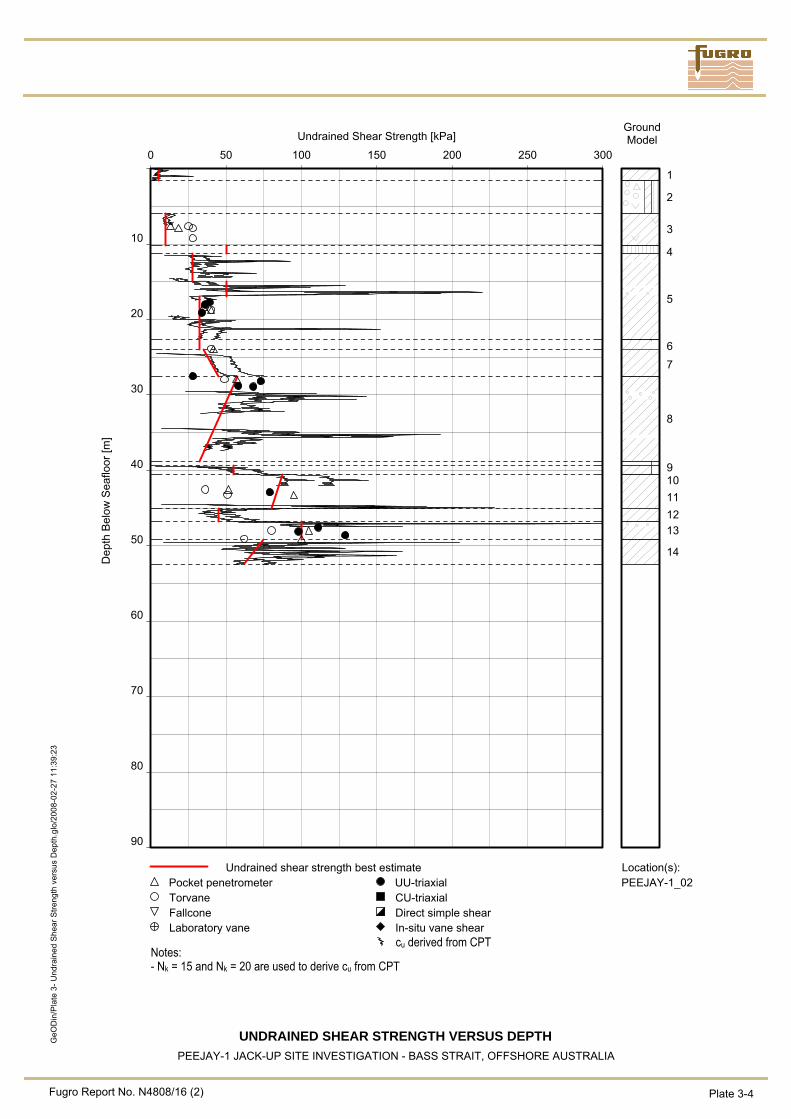
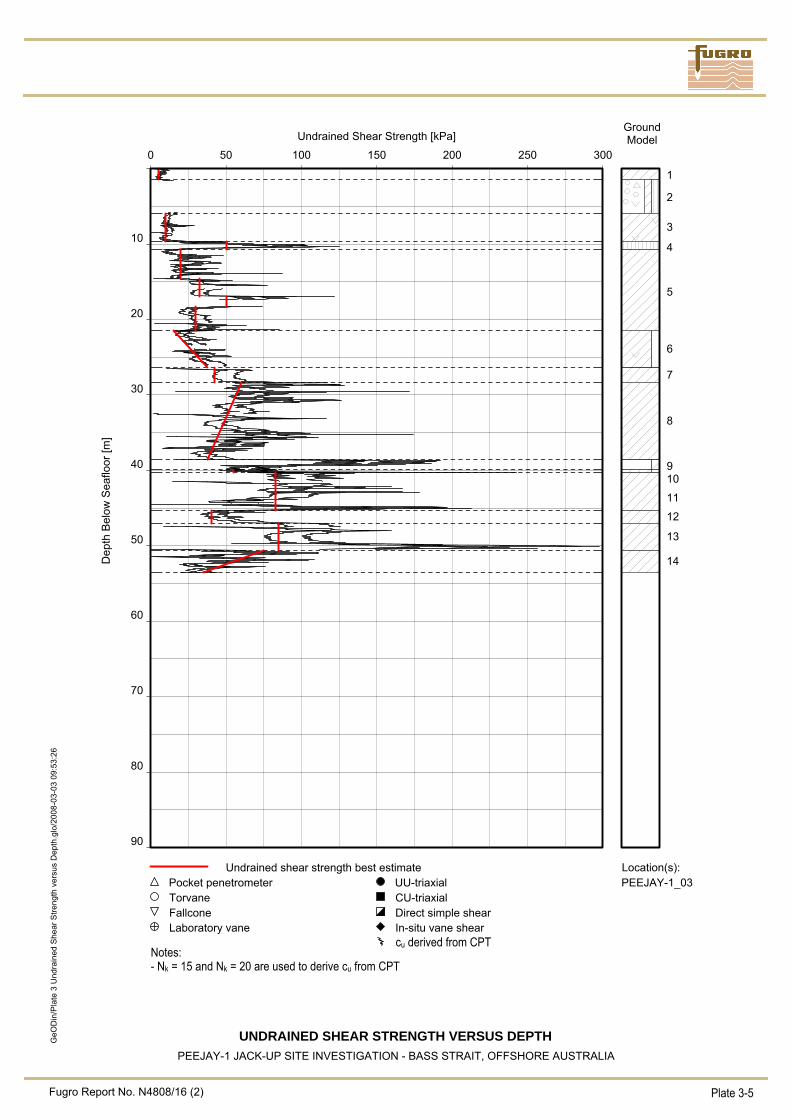
Geotechnical Cross-section ............................................................................................................................ 3-1 Unit Weight versus Depth ............................................................................................................................... 3-2 Undrained Shear Strength versus Depth PEEJAY-1_01................................................................................ 3-3 Undrained Shear Strength versus Depth PEEJAY-1_02................................................................................ 3-4 Undrained Shear Strength versus Depth PEEJAY-1_03................................................................................ 3-5
Design Basis for Jack-Up Platform Foundation ….. .............................................................................4-1 to 4-2 Parameter Values for Jack-Up Leg Penetration Analyses PEEJAY-1_01 …................................................. 4-3 Jack-Up Platform Leg Penetration Analyses Results PEEJAY-1_01 ……..................................................... 4-4 Parameter Values for Jack-Up Leg Penetration Analyses PEEJAY-1_02 …................................................. 4-5 Jack-Up Platform Leg Penetration Analyses Results PEEJAY-1_02 ……..................................................... 4-6 Parameter Values for Jack-Up Leg Penetration Analyses PEEJAY-1_03 …................................................. 4-7 Jack-Up Platform Leg Penetration Analyses Results PEEJAY-1_03 ……..................................................... 4-8 SECTION A: GEOTECHNICAL LOGS SECTION B: IN-SITU TEST RESULTS SECTION C: GEOTECHNICAL LABORATORY TEST RESULTS SECTION D: GUIDELINES FOR USE OF REPORT APPENDIX 1: DESCRIPTIONS OF METHODS AND PRACTICES
Fugro Report No. N4808/16 (3) Report Issue Control Page i of ii
REPORT ISSUE CONTROL
Report Section
Page No.
Plate No.
Issue No.
Revision
Main Text 3 Editorial changes
Notes:
1) The report issue number is the same as the highest issue number of any individual page.
2) Pages of this report are at Issue 2, except those listed above.
3) The number at the bottom left-hand corner of each page shows the Fugro report number and page issue number. The number
in brackets indicates the issue number of the page.
Fugro Report No. N4808/16 (3) Quality Assurance Record Page ii of ii
QUALITY ASSURANCE RECORD Section Checked By Approved By
Main Text HLM LJP
Plates following Main Text HLM LJP
A – Geotechnical Borehole Logs HLM LJP
B – Cone Penetration Tests HLM LJP
C – Summary of Laboratory Test Results HLM LJP
– Index Laboratory Test Results HLM LJP
– UU Triaxial Test Results HLM LJP
Notes:
1) The definitive copy of this report is held in the Fugro library.
Fugro Report No. N4808/16 (3) Main Text Page 1
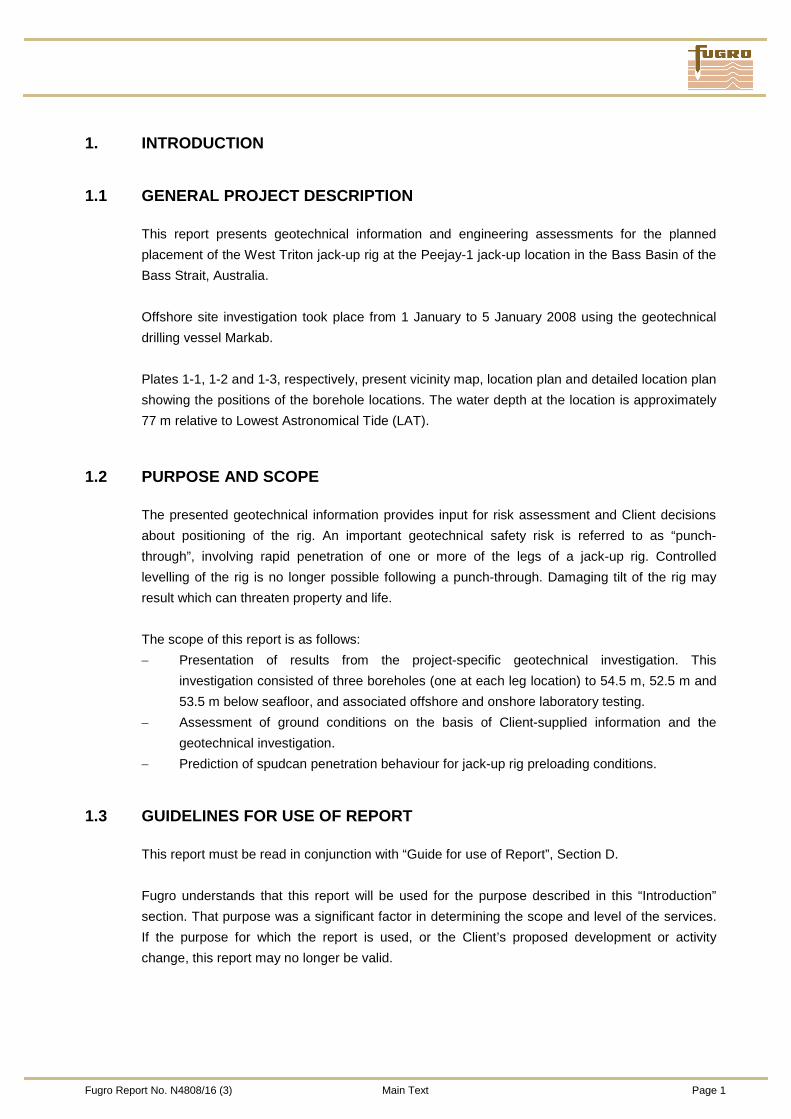
1. INTRODUCTION
1.1 GENERAL PROJECT DESCRIPTION
This report presents geotechnical information and engineering assessments for the planned placement of the West Triton jack-up rig at the Peejay-1 jack-up location in the Bass Basin of the Bass Strait, Australia. Offshore site investigation took place from 1 January to 5 January 2008 using the geotechnical drilling vessel Markab.
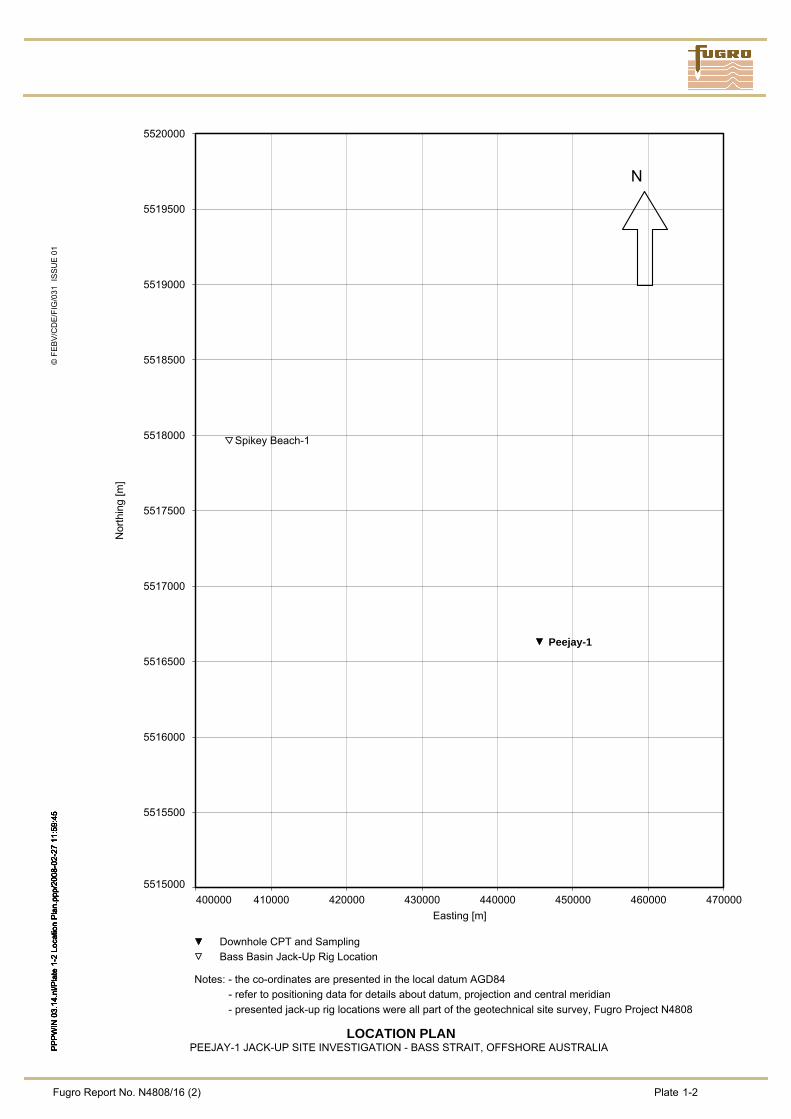
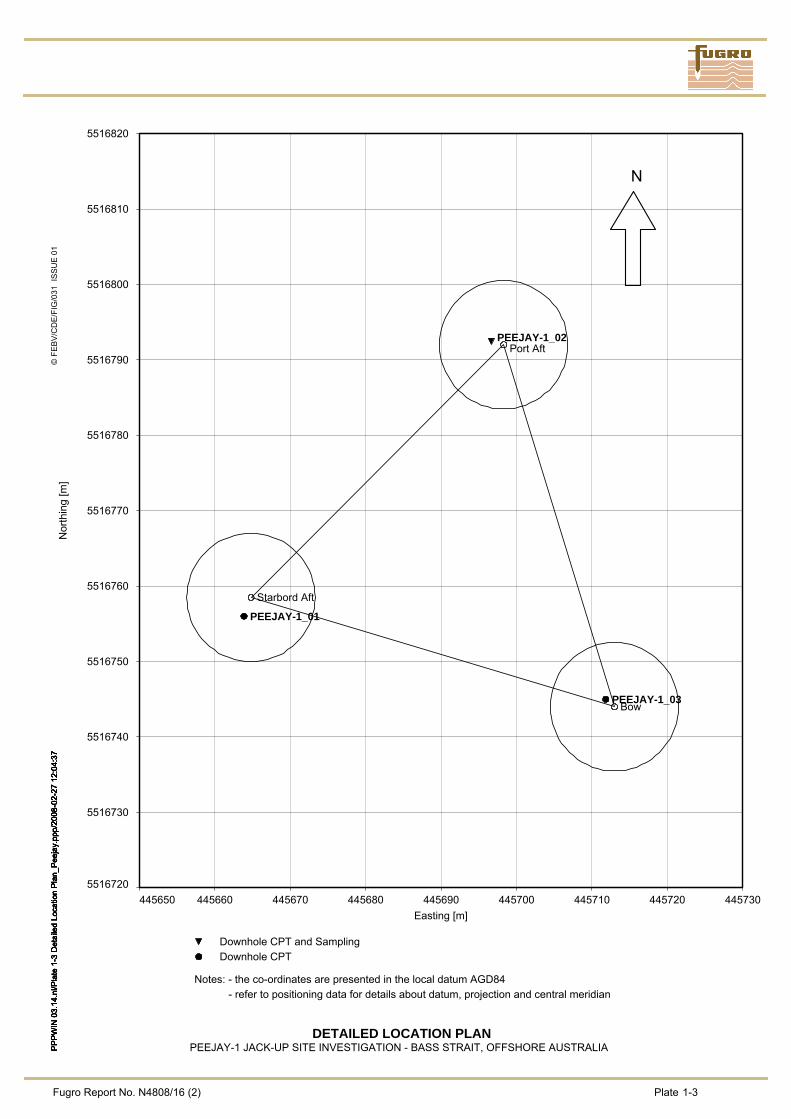
Plates 1-1, 1-2 and 1-3, respectively, present vicinity map, location plan and detailed location plan showing the positions of the borehole locations. The water depth at the location is approximately 77 m relative to Lowest Astronomical Tide (LAT).
1.2 PURPOSE AND SCOPE
The presented geotechnical information provides input for risk assessment and Client decisions about positioning of the rig. An important geotechnical safety risk is referred to as “punch-through”, involving rapid penetration of one or more of the legs of a jack-up rig. Controlled levelling of the rig is no longer possible following a punch-through. Damaging tilt of the rig may result which can threaten property and life. The scope of this report is as follows: − Presentation of results from the project-specific geotechnical investigation. This
investigation consisted of three boreholes (one at each leg location) to 54.5 m, 52.5 m and 53.5 m below seafloor, and associated offshore and onshore laboratory testing.
− Assessment of ground conditions on the basis of Client-supplied information and the geotechnical investigation.
− Prediction of spudcan penetration behaviour for jack-up rig preloading conditions.
1.3 GUIDELINES FOR USE OF REPORT
This report must be read in conjunction with “Guide for use of Report”, Section D. Fugro understands that this report will be used for the purpose described in this “Introduction” section. That purpose was a significant factor in determining the scope and level of the services. If the purpose for which the report is used, or the Client’s proposed development or activity change, this report may no longer be valid.
Fugro Report No. N4808/16 (3) Main Text Page 2
1.4 REPORT FORMAT
The principal report sections are the Main Text, Plates following the Main Text and Sections A through D. Presentation of geotechnical data is by section, generally in the following order: 1. Comments on measurements and/or data processing, if appropriate. 2. Project-specific practice information in tabular format. 3. Results of logging and measurements, with data grouping according to location and numbering.
Method statements and terminology are generally familiar to expert users of the information. For those who may not be familiar with the methods and terminology, background information is presented separately in the report appendix titled “Descriptions of Methods and Practices”, Appendix 1.
Fugro Report No. N4808/16 (3) Main Text Page 3
2. STUDY OVERVIEW
2.1 PROJECT RESPONSIBILITIES
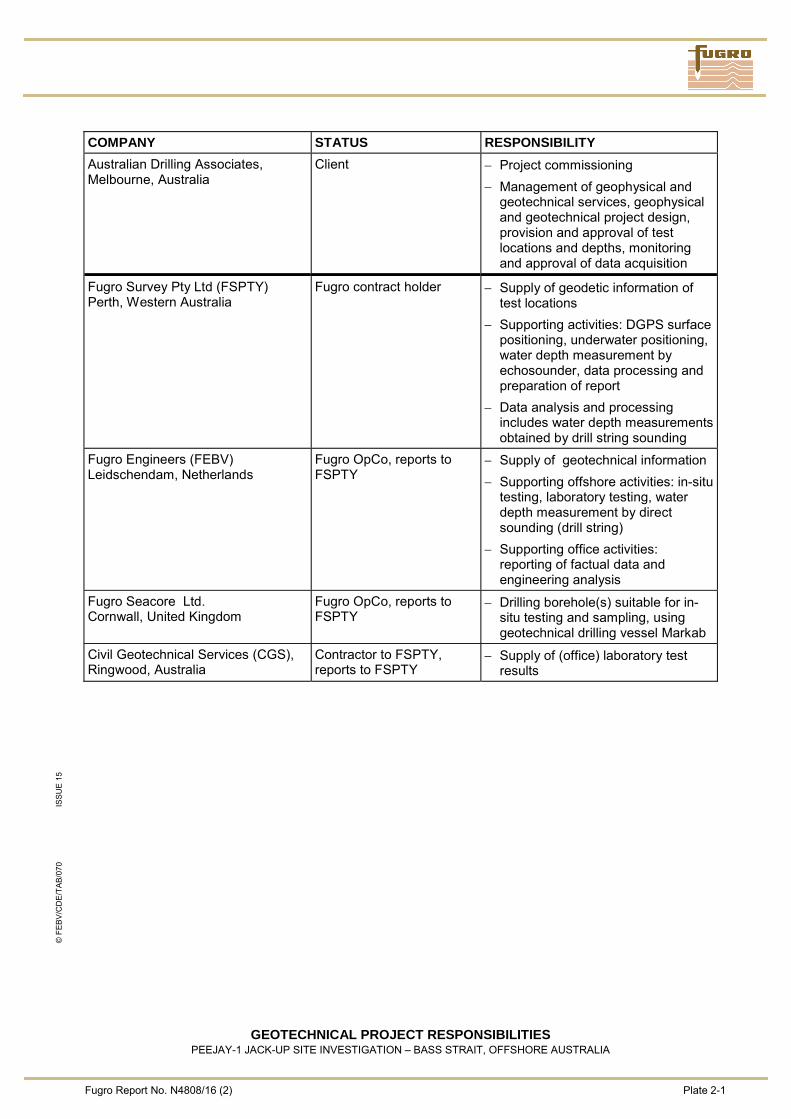
Plate 2-1 titled "Geotechnical Project Responsibilities" presents details of specific agreements and responsibilities that apply to preparation of this report. The on-site investigation initially followed a programme provided by the Client. The programme was adjusted to suit as-found conditions, operational and management constraints. This report considers the results of the final programme. The results of the site-specific data acquisition provide support to the geotechnical objectives presented in the report section titled “Purpose and Scope”. The results may also be suitable for input into analyses performed for other reasons. Such use will require verification.
2.2 DATA SOURCES
Client-supplied information included the following: − Location details (reproduced on Plates 1-1, 1-2 and 1-3). − Spudcan geometry. − Proposed preloading conditions at the spudcan base. Fugro data included: − Geophysical investigation data from Peejay-1 site (Fugro, 2007). This report summarises and uses selected information, where appropriate.
2.3 POSITIONING AND WATER DEPTH
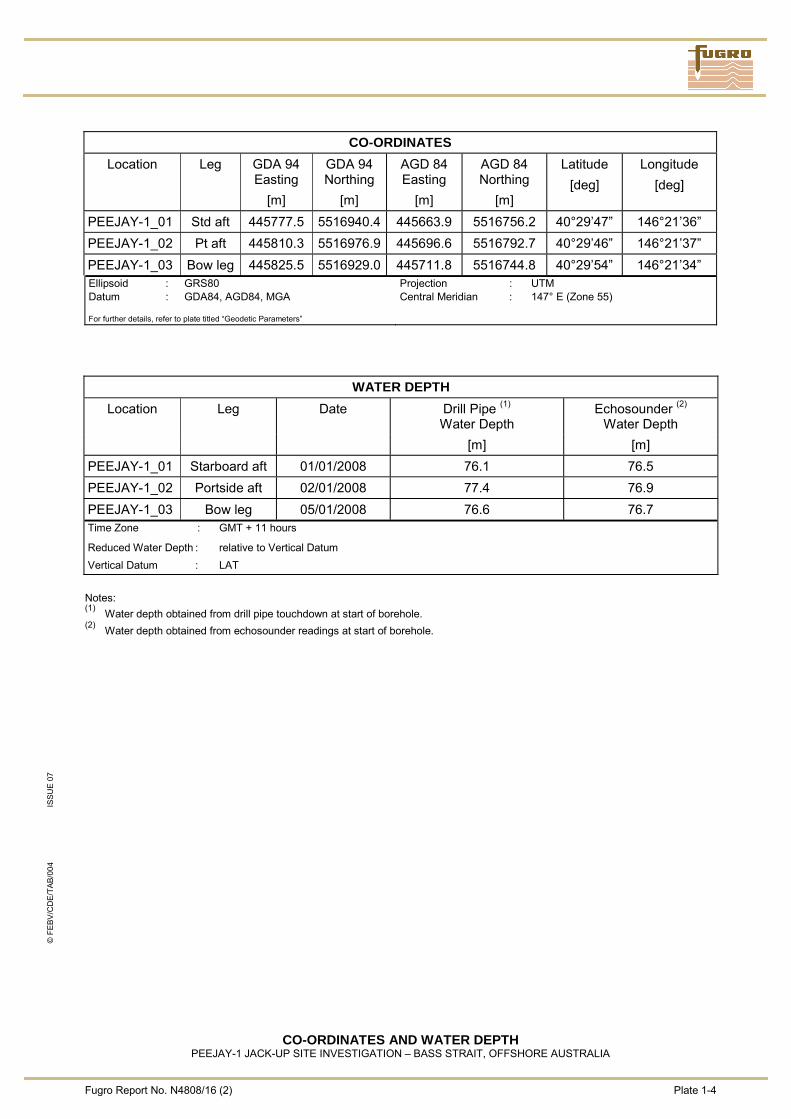
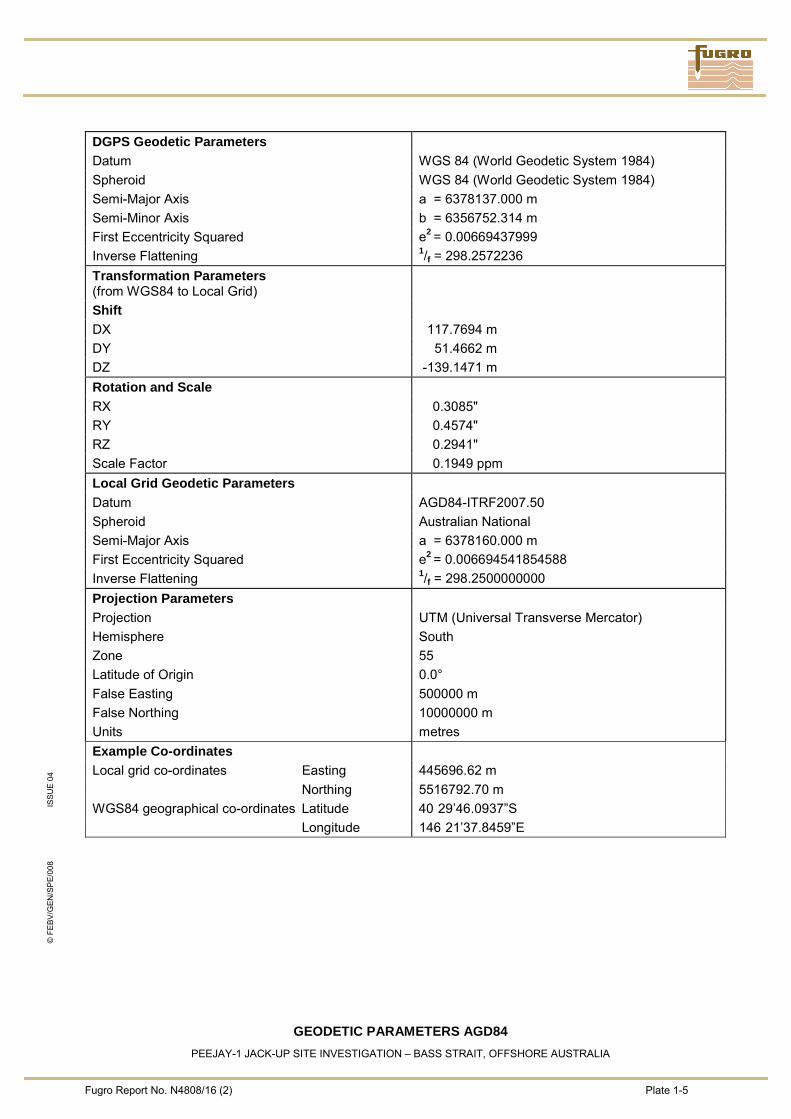
Plate 1-4 provides co-ordinates and water depth measurements at the borehole locations. Water depth measurements consisted of echo-sounding and drill string measurements when borehole drilling began. The extremely soft nature of the seafloor soils encountered may have prevented accurate determination of seafloor due to sinking of the reaction frame, and hence affecting water depth measurement. Borehole log interpretation should therefore consider the possibility of the top layer of soil being thicker than as is presented here. The local datum for geodetic parameters used was AGD84 (Plate 1-5). This datum is frequently used in Tasmania. As a reference to other sites investigated during this fieldwork campaign, the co-ordinates are also presented in GDA94 (Plate 1-6). The Lowest Astronomical Tide (LAT) was used as the vertical datum.
Fugro Report No. N4808/16 (3) Main Text Page 4
Sub-surface positioning was performed in addition to vessel positioning. This included use of an Ultra Short Base Line (USBL) system, with a transmitter mounted on the seabed frame lowered onto the seafloor. The user of presented geodetic information must consider the accuracy of measurements, particularly where use may differ from original intentions. For example, the water depth measurements serve to establish sample and test depths below seafloor.
2.4 SAMPLING AND IN-SITU TESTING
The sampling and in-situ testing programme for the geotechnical site investigation consisted of drilling three boreholes to depths between 52 m and 55 m below seafloor. The test programme for one borehole consisted of alternating CPT and sampling (PEEJAY-1_02). In the other boreholes continuous CPTs were performed (PEEJAY-1_01 and PEEJAY-1_03). The testing sequence was adapted to the soil conditions encountered. A rotary drilling method was used. Water and/or natural polymer (guar gum) was used as drill fluid for each borehole. The SEACLAM seabed frame was used for re-entry, lateral and vertical support of the drill string at seafloor. The sampling and testing operations employed PISTON/WISON downhole tools operated and retrieved by a hydraulic-electrical umbilical. The PISTON sampler takes a cylindrical soil sample with a diameter of 72 mm. The maximum sample length is 0.85 m. The WISON apparatus is for downhole real-time Cone Penetration Testing (CPT). A 10 cm2 piezo-cone (F5 cone) was used. This cone measures cone resistance (qc), sleeve friction (fs) and is equipped with a piezo-sensor to measure pore pressure (u2). Section A includes project-specific details (see sub-section titled “Practice for Geotechnical Borehole”) and the borehole log. Sections B and C include results of offshore geotechnical observations and measurements.
2.5 SAMPLE HANDLING
Important stages in sample handling included the following: − On-site sample extrusion of all samples. − Laboratory testing on selected samples. − Preparation for additional onshore geotechnical laboratory testing. − Storage of untested samples (or sample sections) for a period of 12 months after issue of
the final report. Section C provides further details on the sample handling.
Fugro Report No. N4808/16 (3) Main Text Page 5
2.6 LABORATORY TESTING
On-site geotechnical laboratory testing consisted of: − Classification testing: Sample description, water content and unit weight determination,
carbonate content estimation. − Index strength testing: Torvane test, pocket penetrometer test. − Strength testing: Unconsolidated Undrained triaxial tests (UU).
Onshore geotechnical laboratory testing was performed in the Civil Geotechnical Services laboratory in Ringwood (Australia). Testing consisted of particle size analysis, particle density test, carbonate content measurement and Atterberg limits. Section C presents the results of laboratory tests performed offshore and in the onshore laboratory. The geotechnical log presented in Section A includes summaries of selected test results.
2.7 GEOTECHNICAL DATA INTERPRETATION
Geotechnical data interpretation included the following: − Preparation of borehole logs by integration of sample descriptions and test results,
including interpretation and correlation of various parameters. − Correlation of borehole and CPT data, where possible. − Checks and any adjustment of interpretation on the basis of available geological and
geophysical information.
2.8 ENGINEERING ANALYSIS
The approach adopted for geotechnical analyses includes the following steps: − Selection of procedures and models for geotechnical analyses, including assessment of
data supplied by the Client. − Selection of model parameter values. − Application of calculation models and evaluation of results, including general design and
construction recommendations as given in SNAME (2002).
The report sections describing engineering assessments include assumptions and premises. One premise is that the Client’s equipment is state-of-the-practice in all areas, engineering, construction and maintenance, as documented in the Design Basis sections of this report.
A general description of geotechnical analysis for jack-up rigs is included in Appendix 1.
Fugro Report No. N4808/16 (3) Main Text Page 6
3. SITE CONDITIONS
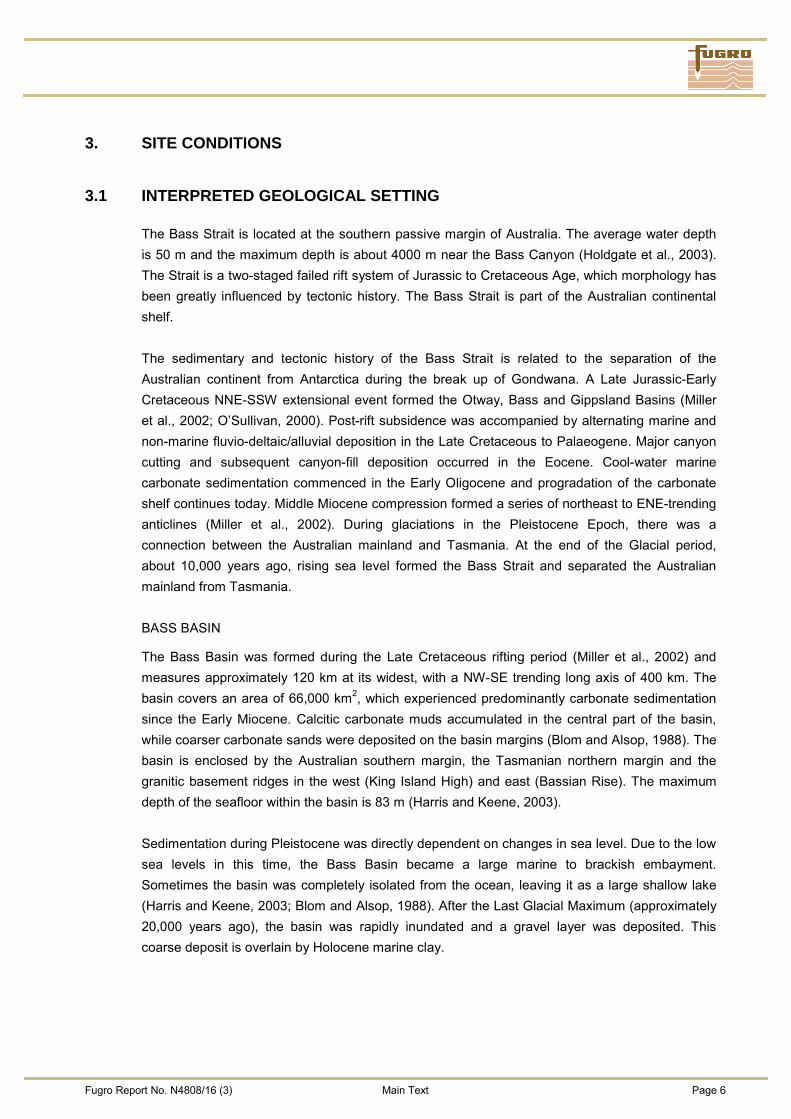
3.1 INTERPRETED GEOLOGICAL SETTING
The Bass Strait is located at the southern passive margin of Australia. The average water depth is 50 m and the maximum depth is about 4000 m near the Bass Canyon (Holdgate et al., 2003). The Strait is a two-staged failed rift system of Jurassic to Cretaceous Age, which morphology has been greatly influenced by tectonic history. The Bass Strait is part of the Australian continental shelf. The sedimentary and tectonic history of the Bass Strait is related to the separation of the Australian continent from Antarctica during the break up of Gondwana. A Late Jurassic-Early Cretaceous NNE-SSW extensional event formed the Otway, Bass and Gippsland Basins (Miller et al., 2002; O’Sullivan, 2000). Post-rift subsidence was accompanied by alternating marine and non-marine fluvio-deltaic/alluvial deposition in the Late Cretaceous to Palaeogene. Major canyon cutting and subsequent canyon-fill deposition occurred in the Eocene. Cool-water marine carbonate sedimentation commenced in the Early Oligocene and progradation of the carbonate shelf continues today. Middle Miocene compression formed a series of northeast to ENE-trending anticlines (Miller et al., 2002). During glaciations in the Pleistocene Epoch, there was a connection between the Australian mainland and Tasmania. At the end of the Glacial period, about 10,000 years ago, rising sea level formed the Bass Strait and separated the Australian mainland from Tasmania. BASS BASIN
The Bass Basin was formed during the Late Cretaceous rifting period (Miller et al., 2002) and measures approximately 120 km at its widest, with a NW-SE trending long axis of 400 km. The basin covers an area of 66,000 km2, which experienced predominantly carbonate sedimentation since the Early Miocene. Calcitic carbonate muds accumulated in the central part of the basin, while coarser carbonate sands were deposited on the basin margins (Blom and Alsop, 1988). The basin is enclosed by the Australian southern margin, the Tasmanian northern margin and the granitic basement ridges in the west (King Island High) and east (Bassian Rise). The maximum depth of the seafloor within the basin is 83 m (Harris and Keene, 2003). Sedimentation during Pleistocene was directly dependent on changes in sea level. Due to the low sea levels in this time, the Bass Basin became a large marine to brackish embayment. Sometimes the basin was completely isolated from the ocean, leaving it as a large shallow lake (Harris and Keene, 2003; Blom and Alsop, 1988). After the Last Glacial Maximum (approximately 20,000 years ago), the basin was rapidly inundated and a gravel layer was deposited. This coarse deposit is overlain by Holocene marine clay.

Fugro Report No. N4808/16 (3) Main Text Page 7
3.2 SEAFLOOR CONDITIONS
Fugro performed a site survey at the proposed Peejay-1 location prior to the geotechnical investigation (Fugro, 2007). The water depth within the site ranges from 76.1 m to 76.7 m below LAT (Lowest Astronomical Tide). The seafloor does not exhibit any significant relief and appears to be smooth and featureless exhibiting a uniform low degree of acoustic reflectivity, consistent with the very soft clay recovered in the top of the boreholes.
3.3 GENERALISED STRATIGRAPHY
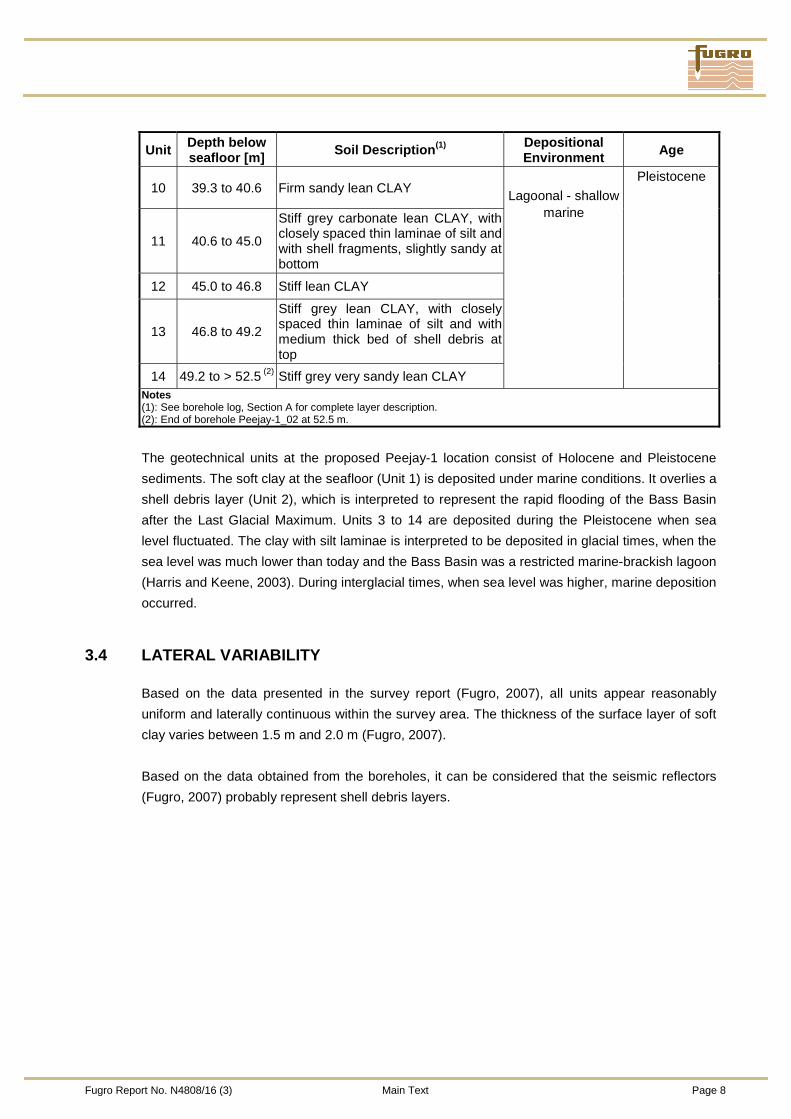
Table 3.1 shows 14 stratigraphical geotechnical units identified at the proposed Peejay-1 well location. The units were differentiated, using geotechnical and geological identification, including composition, density/consistency determined from laboratory test results and interpretation from CPT results.
TABLE 3.1 SOIL PROFILE AT THE PEEJAY-1_02 LOCATION
Unit Depth below seafloor [m] Soil Description(1) Depositional
Environment Age
1 0 to 1.6 Very soft lean CLAY, with shells and shell fragments Marine Holocene
2 1.6 to 5.9 Very loose greenish grey clayey carbonate SHELL DEBRIS, with coral fragments
3 5.9 to 10.2
Very soft greenish grey lean CLAY, with shells and shell fragments, with widely spaced pockets of sand, and with medium spaced very thin beds of shell debris, and closely spaced thick laminae of silt at bottom
4 10.2 to 11.2 Firm dark greenish grey carbonate lean CLAY, with many shells and shell fragments
5 11.2 to 22.7
Soft grey carbonate fat CLAY, with closely spaced thin laminae of silt and with widely spaced thin to medium beds of shell debris
6 22.7 to 24.0
Slightly cemented grey sandy carbonate lean CLAY, with pockets of clayey slightly cemented sand, and with shells and shell fragments
7 24.0 to 27.6 Firm light greenish grey carbonate fat CLAY, with few shells and shell fragments
8 27.6 to 38.8
Firm grey carbonate lean CLAY, with closely spaced thin laminae of silt, shells and shell fragments and with very widely spaced medium to thick beds of shell debris
9 38.8 to 39.3 Very loose grey clayey siliceous carbonate fine SAND, with many shells and shell fragments
Lagoonal - shallow marine
Pleistocene
Fugro Report No. N4808/16 (3) Main Text Page 8
Unit Depth below seafloor [m] Soil Description(1) Depositional
Environment Age
10 39.3 to 40.6 Firm sandy lean CLAY
11 40.6 to 45.0
Stiff grey carbonate lean CLAY, with closely spaced thin laminae of silt and with shell fragments, slightly sandy at bottom
12 45.0 to 46.8 Stiff lean CLAY
13 46.8 to 49.2
Stiff grey lean CLAY, with closely spaced thin laminae of silt and with medium thick bed of shell debris at top
14 49.2 to > 52.5 (2) Stiff grey very sandy lean CLAY
Lagoonal - shallow
marine
Pleistocene
Notes (1): See borehole log, Section A for complete layer description. (2): End of borehole Peejay-1_02 at 52.5 m.
The geotechnical units at the proposed Peejay-1 location consist of Holocene and Pleistocene sediments. The soft clay at the seafloor (Unit 1) is deposited under marine conditions. It overlies a shell debris layer (Unit 2), which is interpreted to represent the rapid flooding of the Bass Basin after the Last Glacial Maximum. Units 3 to 14 are deposited during the Pleistocene when sea level fluctuated. The clay with silt laminae is interpreted to be deposited in glacial times, when the sea level was much lower than today and the Bass Basin was a restricted marine-brackish lagoon (Harris and Keene, 2003). During interglacial times, when sea level was higher, marine deposition occurred.
3.4 LATERAL VARIABILITY
Based on the data presented in the survey report (Fugro, 2007), all units appear reasonably uniform and laterally continuous within the survey area. The thickness of the surface layer of soft clay varies between 1.5 m and 2.0 m (Fugro, 2007). Based on the data obtained from the boreholes, it can be considered that the seismic reflectors (Fugro, 2007) probably represent shell debris layers.
Fugro Report No. N4808/16 (3) Main Text Page 9
4. SPUDCAN FOUNDATION
4.1 DESIGN BASIS
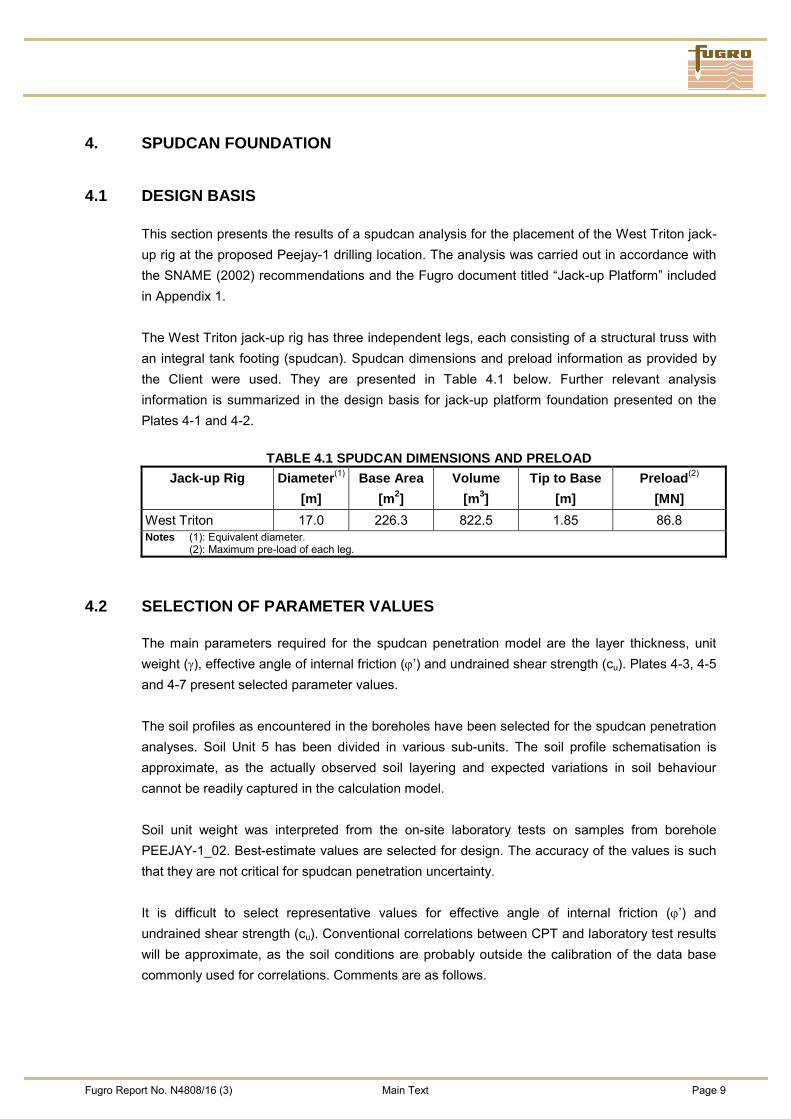
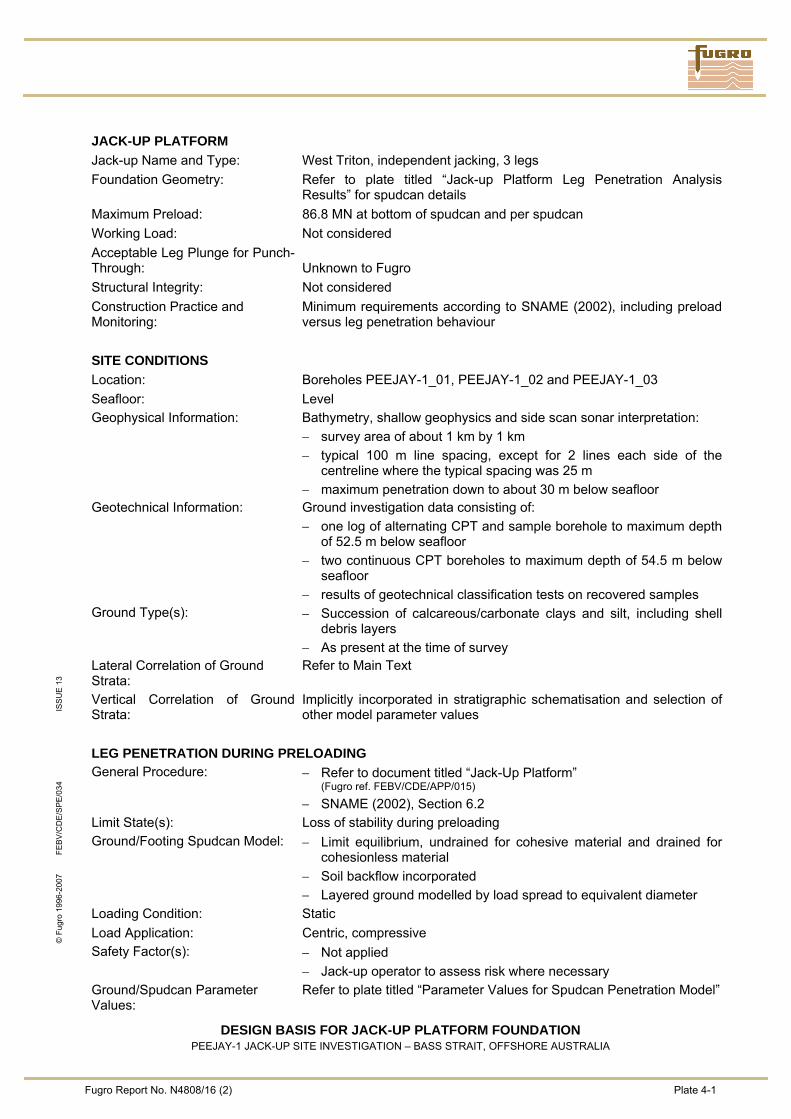
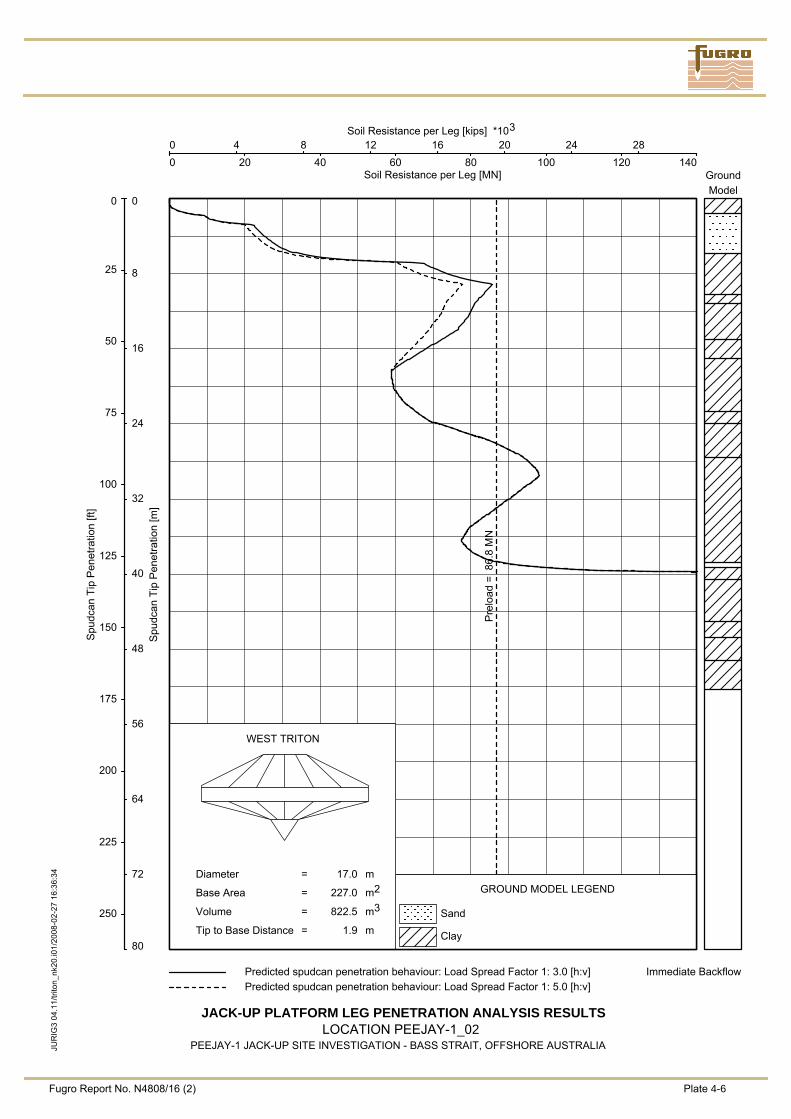
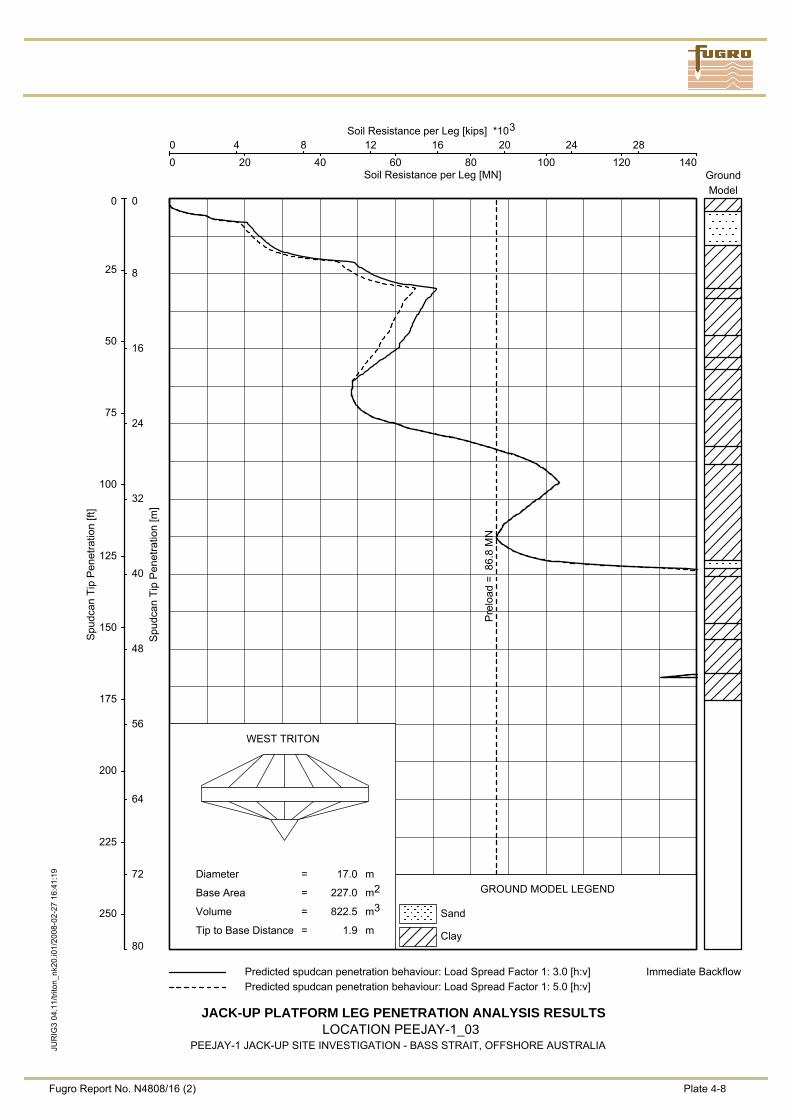
This section presents the results of a spudcan analysis for the placement of the West Triton jack-up rig at the proposed Peejay-1 drilling location. The analysis was carried out in accordance with the SNAME (2002) recommendations and the Fugro document titled “Jack-up Platform” included in Appendix 1. The West Triton jack-up rig has three independent legs, each consisting of a structural truss with an integral tank footing (spudcan). Spudcan dimensions and preload information as provided by the Client were used. They are presented in Table 4.1 below. Further relevant analysis information is summarized in the design basis for jack-up platform foundation presented on the Plates 4-1 and 4-2.
TABLE 4.1 SPUDCAN DIMENSIONS AND PRELOAD Jack-up Rig Diameter(1)
[m] Base Area
[m2] Volume
[m3] Tip to Base
[m] Preload(2)
[MN] West Triton 17.0 226.3 822.5 1.85 86.8 Notes (1): Equivalent diameter. (2): Maximum pre-load of each leg.
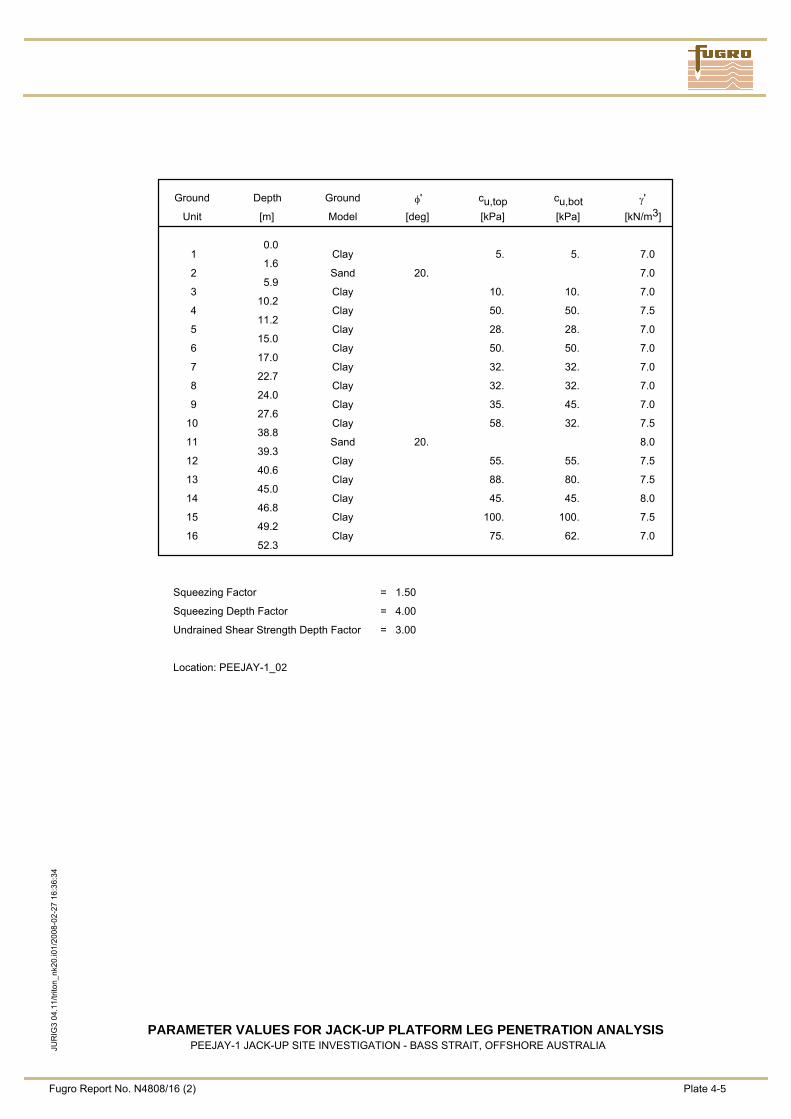
4.2 SELECTION OF PARAMETER VALUES
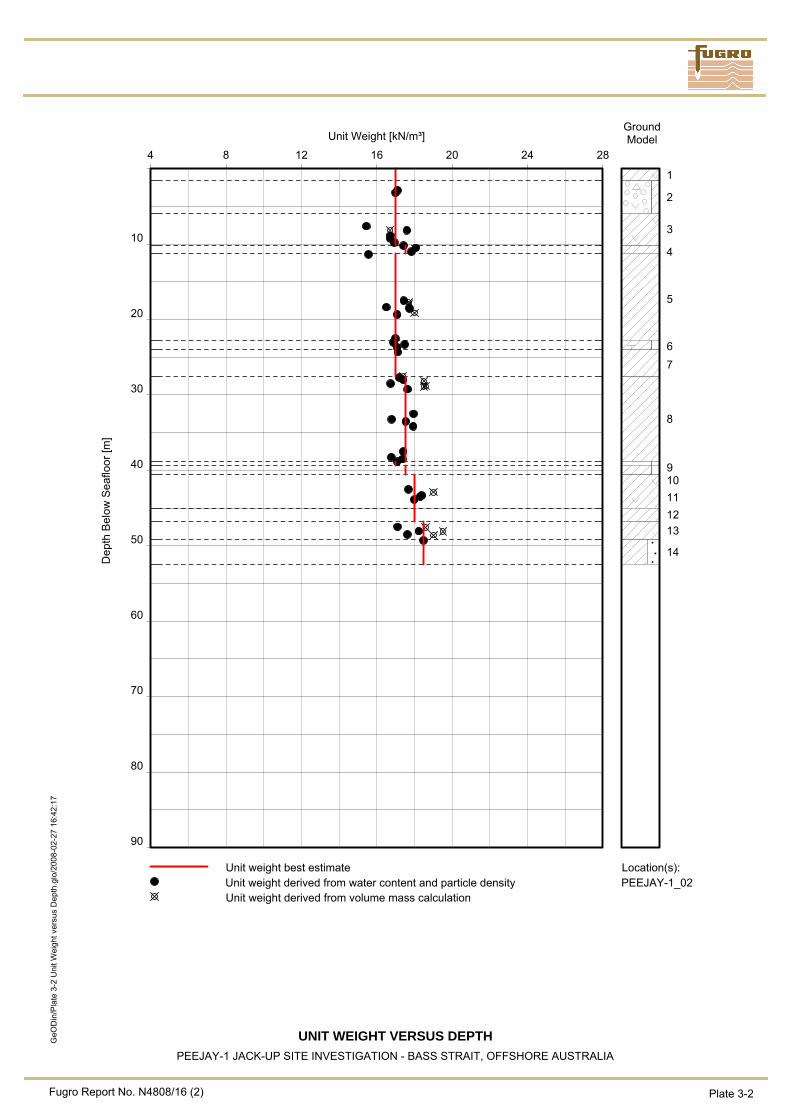
The main parameters required for the spudcan penetration model are the layer thickness, unit weight (γ), effective angle of internal friction (ϕ’) and undrained shear strength (cu). Plates 4-3, 4-5 and 4-7 present selected parameter values. The soil profiles as encountered in the boreholes have been selected for the spudcan penetration analyses. Soil Unit 5 has been divided in various sub-units. The soil profile schematisation is approximate, as the actually observed soil layering and expected variations in soil behaviour cannot be readily captured in the calculation model. Soil unit weight was interpreted from the on-site laboratory tests on samples from borehole PEEJAY-1_02. Best-estimate values are selected for design. The accuracy of the values is such that they are not critical for spudcan penetration uncertainty. It is difficult to select representative values for effective angle of internal friction (ϕ’) and undrained shear strength (cu). Conventional correlations between CPT and laboratory test results will be approximate, as the soil conditions are probably outside the calibration of the data base commonly used for correlations. Comments are as follows.
Fugro Report No. N4808/16 (3) Main Text Page 10
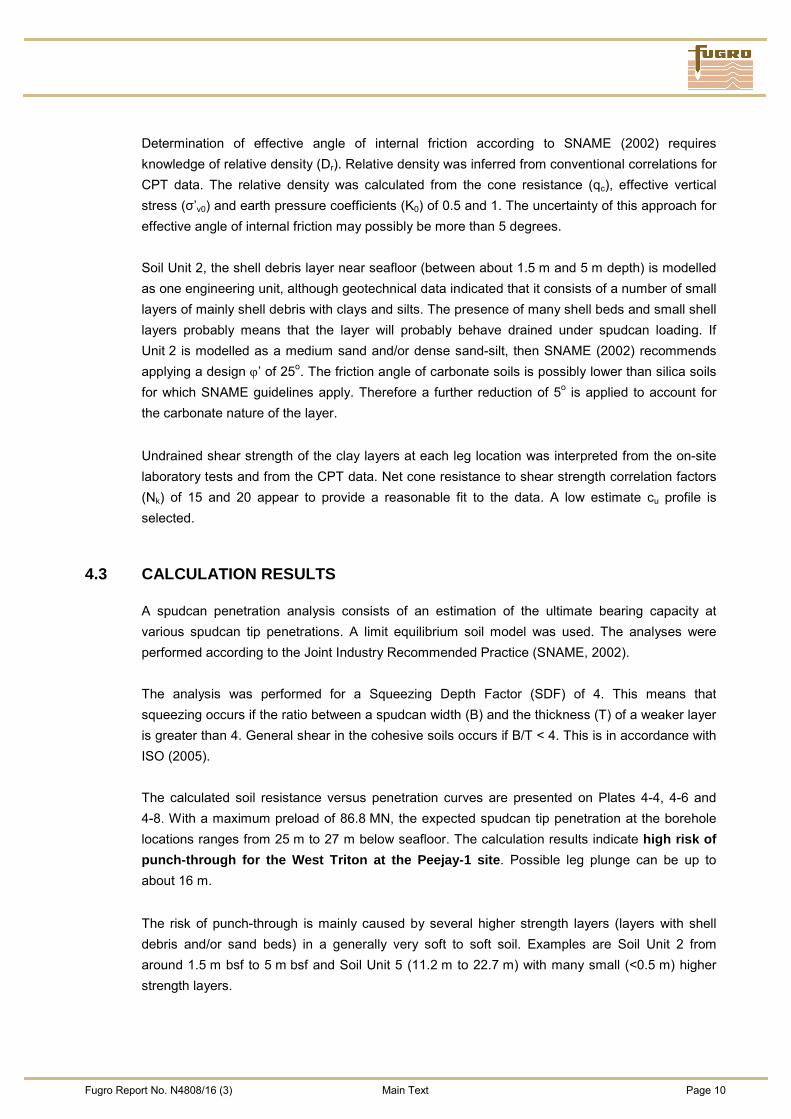
Determination of effective angle of internal friction according to SNAME (2002) requires knowledge of relative density (Dr). Relative density was inferred from conventional correlations for CPT data. The relative density was calculated from the cone resistance (qc), effective vertical stress (σ’v0) and earth pressure coefficients (K0) of 0.5 and 1. The uncertainty of this approach for effective angle of internal friction may possibly be more than 5 degrees. Soil Unit 2, the shell debris layer near seafloor (between about 1.5 m and 5 m depth) is modelled as one engineering unit, although geotechnical data indicated that it consists of a number of small layers of mainly shell debris with clays and silts. The presence of many shell beds and small shell layers probably means that the layer will probably behave drained under spudcan loading. If Unit 2 is modelled as a medium sand and/or dense sand-silt, then SNAME (2002) recommends applying a design ϕ’ of 25o. The friction angle of carbonate soils is possibly lower than silica soils for which SNAME guidelines apply. Therefore a further reduction of 5o is applied to account for the carbonate nature of the layer. Undrained shear strength of the clay layers at each leg location was interpreted from the on-site laboratory tests and from the CPT data. Net cone resistance to shear strength correlation factors (Nk) of 15 and 20 appear to provide a reasonable fit to the data. A low estimate cu profile is selected.
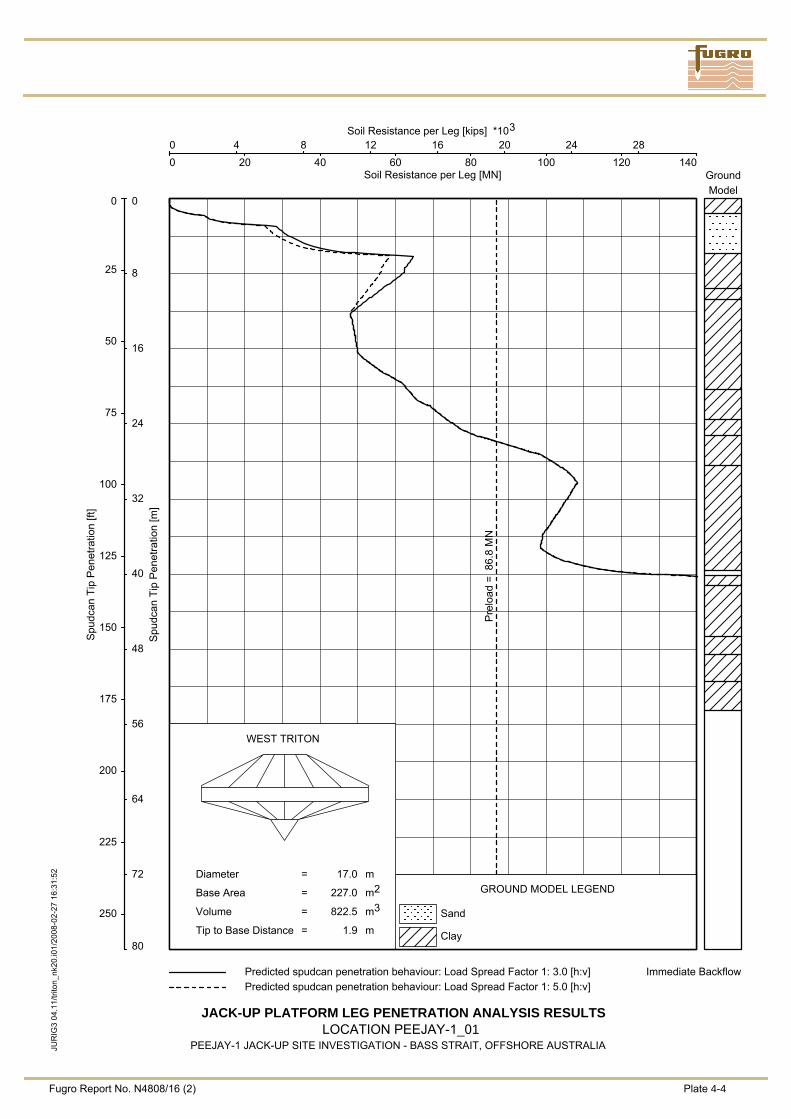
4.3 CALCULATION RESULTS
A spudcan penetration analysis consists of an estimation of the ultimate bearing capacity at various spudcan tip penetrations. A limit equilibrium soil model was used. The analyses were performed according to the Joint Industry Recommended Practice (SNAME, 2002). The analysis was performed for a Squeezing Depth Factor (SDF) of 4. This means that squeezing occurs if the ratio between a spudcan width (B) and the thickness (T) of a weaker layer is greater than 4. General shear in the cohesive soils occurs if B/T < 4. This is in accordance with ISO (2005). The calculated soil resistance versus penetration curves are presented on Plates 4-4, 4-6 and 4-8. With a maximum preload of 86.8 MN, the expected spudcan tip penetration at the borehole locations ranges from 25 m to 27 m below seafloor. The calculation results indicate high risk of punch-through for the West Triton at the Peejay-1 site. Possible leg plunge can be up to about 16 m. The risk of punch-through is mainly caused by several higher strength layers (layers with shell debris and/or sand beds) in a generally very soft to soft soil. Examples are Soil Unit 2 from around 1.5 m bsf to 5 m bsf and Soil Unit 5 (11.2 m to 22.7 m) with many small (<0.5 m) higher strength layers.
Fugro Report No. N4808/16 (3) Main Text Page 11
The predicted spudcan penetration assumes a continuous, uniform rate, without interruption. Uninterrupted penetration may not be practicable for the relatively large penetrations. A temporary interruption can induce undesirable soil heterogeneity, particularly in the slow-draining clays of very soft to firm consistency identified at this site. The soil immediately below and adjacent to a spudcan will consolidate upon load application and thereby become stronger. However, soils at greater depths will not gain strength. Therefore, punch-through conditions may also arise upon application of a higher load than the load applied during the interruption. Furthermore, if a final spudcan penetration of around 25 m below seafloor is desirable, then this may be difficult to achieve. Erbrich (2005) presents Australian experience in this regard.
Fugro Report No. N4808/16 (3) Main Text Page 12
5. CONCLUSIONS AND RECOMMENDATIONS
The analyses show that punch-through conditions may arise for the West Triton jack-up rig at the Peejay-1 location. Fugro recommends that risk assessments for jack-up siting allow for a high risk of punch-through. Possible leg plunge can be up to about 16 m. This adverse setting can primarily be attributed to non-uniform layered soil conditions.
Fugro Report No. N4808/16 (3) Main Text Page 13
6. REFERENCES
Blom, W.M. and Alsop, D.B. (1988), “Carbonate Mud Sedimentation on a Temperate Shelf: Bass Basin, South-eastern Australia”, Sedimentary Geology, 60, pp. 269-280.
Erbrich, C.T. (2005), “Australian Frontiers – Spudcans on the Edge”, in Gourvenec, S. and Cassidy, M. (Eds.), Frontiers in Offshore Geotechnics ISFOG 2005: Proceedings of the First International Symposium on Frontiers in Offshore Geotechnics, University of Western Australia, Perth, 19-21 September 2005, Taylor & Francis, London, pp. 49-74. Fugro Survey Pty Ltd (2007), “Revised Speke-1 infill Survey Preliminary Field Report”, Report No. P0758-7, 3 November 2007. Holgate, G.R., Wallace, M.W., Gallagher, S.J., Smith, A.J., Keene, J.B., Moore, D. and Shafik, S. (2003), “Plio-Pleistocene Tectonics and Eustasy in the Gippsland Basin, Southeast Australia: Evidence from Magnetic Imagery and Marine Geological Data”, Australian Journal Earth Sciences, 50, pp. 403-426. ISO International Organization for Standardization (2005), “Petroleum and Natural Gas Industries – Site Specific Assessment of Mobile Offshore Units – Part1: Jack-Ups”, International Standard ISO/WD 19905-1.7, Working Draft, 31 September. Jones, H.A. and Davies P.J. (1983), “Superficial Sedimentation of the Tasmanian Continental Shelf and Part of Bass Strait”, BMR Bulletin, Vol. 218, pp. 25. Leach, A.S. and Wallace, M.W. (2003), “Oligocene-Recent Canyon Systems of the Otway Basin, Victoria, Australia’”, Abstract 17th Victorian Universities Earth Sciences Conference, Monash University, 5 September 2003. Miller, J. McL., Norvick, M.S. and Wilson, C.J.L. (2002), “Basement Controls on Rifting and the Associated Formation of Ocean Transform Faults – Cretaceous continental extension of the southern margin of Australia”, Tectonophysics, 359, pp. 131-155. O’Sullivan, P.B., Mitchell, M.M., O’Sullivan, A.J., Kohn, B.P. and Gleadow, A.J.W. (2000), “Thermotectonic History of the Bassian Rise, Australia: Implications for the Breakup of Eastern Gondwana along Australia’s South-eastern Margins”, Earth and Planetary Science Letters, 182, pp. 31-47. SNAME Society of Naval Architects and Marine Engineers (2002), “Recommended Practice for Site Specific Assessment of Mobile Jack-up Units”, First Edition, Revision 2, Technical & Research Bulletin, 5-5A.
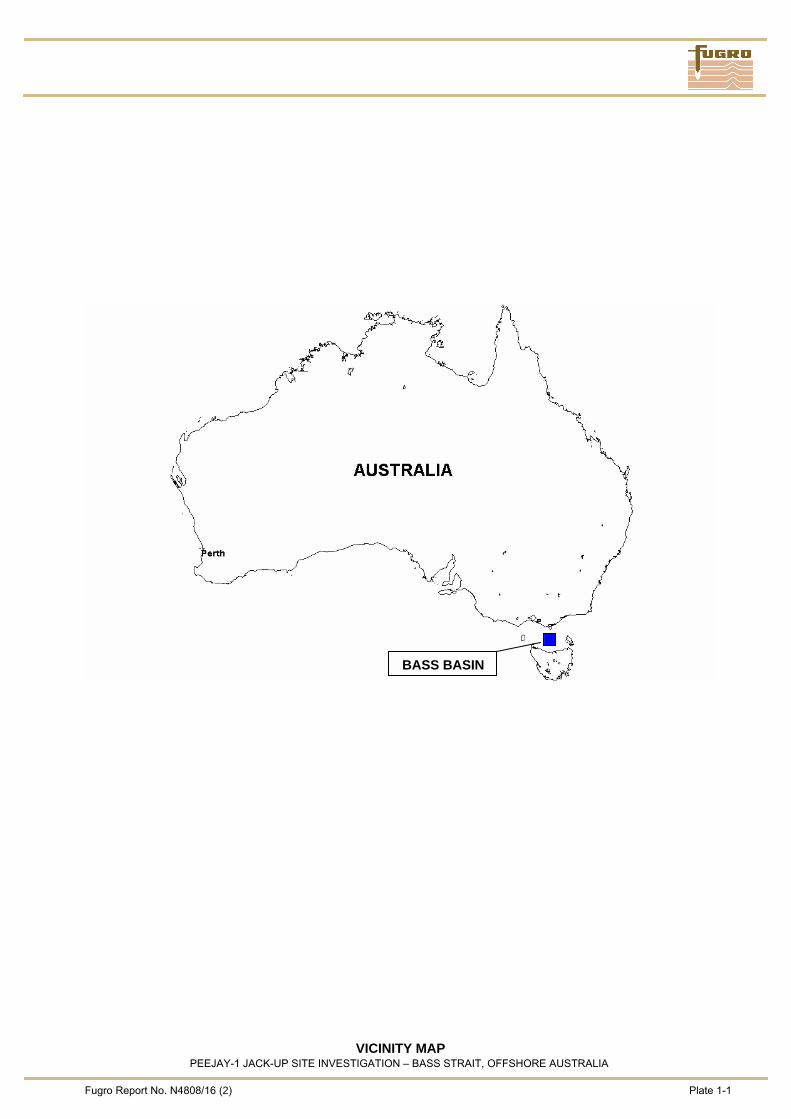
VICINITY MAP PEEJAY-1 JACK-UP SITE INVESTIGATION – BASS STRAIT, OFFSHORE AUSTRALIA
Fugro Report No. N4808/16 (2) Plate 1-1
BASS BASIN
© F
EBV/
CD
E/FI
G/0
31 I
SS
UE
01
PPPW
IN 0
3.14
.nl/P
late
1-2
Loc
atio
n Pl
an.p
pp/2
008-
02-2
7 11
:59:
45PP
PWIN
03.
14.n
l/Pla
te 1
-2 L
ocat
ion
Plan
.ppp
/200
8-02
-27
11:5
9:45
PPPW
IN 0
3.14
.nl/P
late
1-2
Loc
atio
n Pl
an.p
pp/2
008-
02-2
7 11
:59:
45PP
PWIN
03.
14.n
l/Pla
te 1
-2 L
ocat
ion
Plan
.ppp
/200
8-02
-27
11:5
9:45
Fugro Report No. N4808/16 (2) Plate
LOCATION PLANPEEJAY-1 JACK-UP SITE INVESTIGATION - BASS STRAIT, OFFSHORE AUSTRALIAPP
PWIN
03.
14.n
l/Pla
te 1
-2 L
ocat
ion
Plan
.ppp
/200
8-02
-27
11:5
9:45
1-2
400000 410000 420000 430000 440000 450000 460000 470000Easting [m]
5515000
5515500
5516000
5516500
5517000
5517500
5518000
5518500
5519000
5519500
5520000N
orth
ing
[m]
N
Spikey Beach-1
Peejay-1
Downhole CPT and Sampling Bass Basin Jack-Up Rig Location
Notes: - the co-ordinates are presented in the local datum AGD84 - refer to positioning data for details about datum, projection and central meridian - presented jack-up rig locations were all part of the geotechnical site survey, Fugro Project N4808
© F
EBV/
CD
E/FI
G/0
31 I
SS
UE
01
PPPW
IN 0
3.14
.nl/P
late
1-3
Det
aile
d Lo
catio
n Pl
an_P
eeja
y.pp
p/20
08-0
2-27
12:
04:3
7PP
PWIN
03.
14.n
l/Pla
te 1
-3 D
etai
led
Loca
tion
Plan
_Pee
jay.
ppp/
2008
-02-
27 1
2:04
:37
PPPW
IN 0
3.14
.nl/P
late
1-3
Det
aile
d Lo
catio
n Pl
an_P
eeja
y.pp
p/20
08-0
2-27
12:
04:3
7PP
PWIN
03.
14.n
l/Pla
te 1
-3 D
etai
led
Loca
tion
Plan
_Pee
jay.
ppp/
2008
-02-
27 1
2:04
:37
Fugro Report No. N4808/16 (2) Plate
DETAILED LOCATION PLANPEEJAY-1 JACK-UP SITE INVESTIGATION - BASS STRAIT, OFFSHORE AUSTRALIAPP
PWIN
03.
14.n
l/Pla
te 1
-3 D
etai
led
Loca
tion
Plan
_Pee
jay.
ppp/
2008
-02-
27 1
2:04
:37
1-3
445650 445660 445670 445680 445690 445700 445710 445720 445730Easting [m]
5516720
5516730
5516740
5516750
5516760
5516770
5516780
5516790
5516800
5516810
5516820
Nor
thin
g [m
]
N
PEEJAY-1_02
PEEJAY-1_03
PEEJAY-1_01
Bow
Starbord Aft
Port Aft
Downhole CPT and Sampling Downhole CPT
Notes: - the co-ordinates are presented in the local datum AGD84 - refer to positioning data for details about datum, projection and central meridian
CO-ORDINATES AND WATER DEPTH PEEJAY-1 JACK-UP SITE INVESTIGATION – BASS STRAIT, OFFSHORE AUSTRALIA
Fugro Report No. N4808/16 (2) Plate 1-4
© F
EBV/
CD
E/TA
B/00
4
ISSU
E 07
CO-ORDINATES Location Leg GDA 94
Easting [m]
GDA 94 Northing
[m]
AGD 84 Easting
[m]
AGD 84 Northing
[m]
Latitude [deg]
Longitude [deg]
PEEJAY-1_01 Std aft 445777.5 5516940.4 445663.9 5516756.2 40°29’47” 146°21’36” PEEJAY-1_02 Pt aft 445810.3 5516976.9 445696.6 5516792.7 40°29’46” 146°21’37” PEEJAY-1_03 Bow leg 445825.5 5516929.0 445711.8 5516744.8 40°29’54” 146°21’34” Ellipsoid : GRS80 Datum : GDA84, AGD84, MGA For further details, refer to plate titled “Geodetic Parameters”
Projection : UTM Central Meridian : 147° E (Zone 55)
WATER DEPTH Location Leg Date Drill Pipe (1)
Water Depth Echosounder (2)
Water Depth [m] [m] PEEJAY-1_01 Starboard aft 01/01/2008 76.1 76.5 PEEJAY-1_02 Portside aft 02/01/2008 77.4 76.9 PEEJAY-1_03 Bow leg 05/01/2008 76.6 76.7 Time Zone : GMT + 11 hours
Reduced Water Depth : relative to Vertical Datum Vertical Datum : LAT Notes: (1) Water depth obtained from drill pipe touchdown at start of borehole. (2) Water depth obtained from echosounder readings at start of borehole.
GEODETIC PARAMETERS AGD84
PEEJAY-1 JACK-UP SITE INVESTIGATION – BASS STRAIT, OFFSHORE AUSTRALIA
Fugro Report No. N4808/16 (2) Plate 1-5
© F
EBV/
GEN
/SP
E/00
8
ISSU
E 04
DGPS Geodetic Parameters Datum WGS 84 (World Geodetic System 1984) Spheroid WGS 84 (World Geodetic System 1984) Semi-Major Axis a = 6378137.000 m Semi-Minor Axis b = 6356752.314 m First Eccentricity Squared e2 = 0.00669437999 Inverse Flattening 1/f = 298.2572236 Transformation Parameters (from WGS84 to Local Grid)
Shift DX 117.7694 m DY 51.4662 m DZ -139.1471 m Rotation and Scale RX 0.3085" RY 0.4574" RZ 0.2941" Scale Factor 0.1949 ppm Local Grid Geodetic Parameters Datum AGD84-ITRF2007.50 Spheroid Australian National Semi-Major Axis a = 6378160.000 m First Eccentricity Squared e2 = 0.006694541854588 Inverse Flattening 1/f = 298.2500000000 Projection Parameters Projection UTM (Universal Transverse Mercator) Hemisphere South Zone 55 Latitude of Origin 0.0° False Easting 500000 m False Northing 10000000 m Units metres Example Co-ordinates Local grid co-ordinates Easting 445696.62 m Northing 5516792.70 m WGS84 geographical co-ordinates Latitude 40 29’46.0937”S Longitude 146 21’37.8459”E
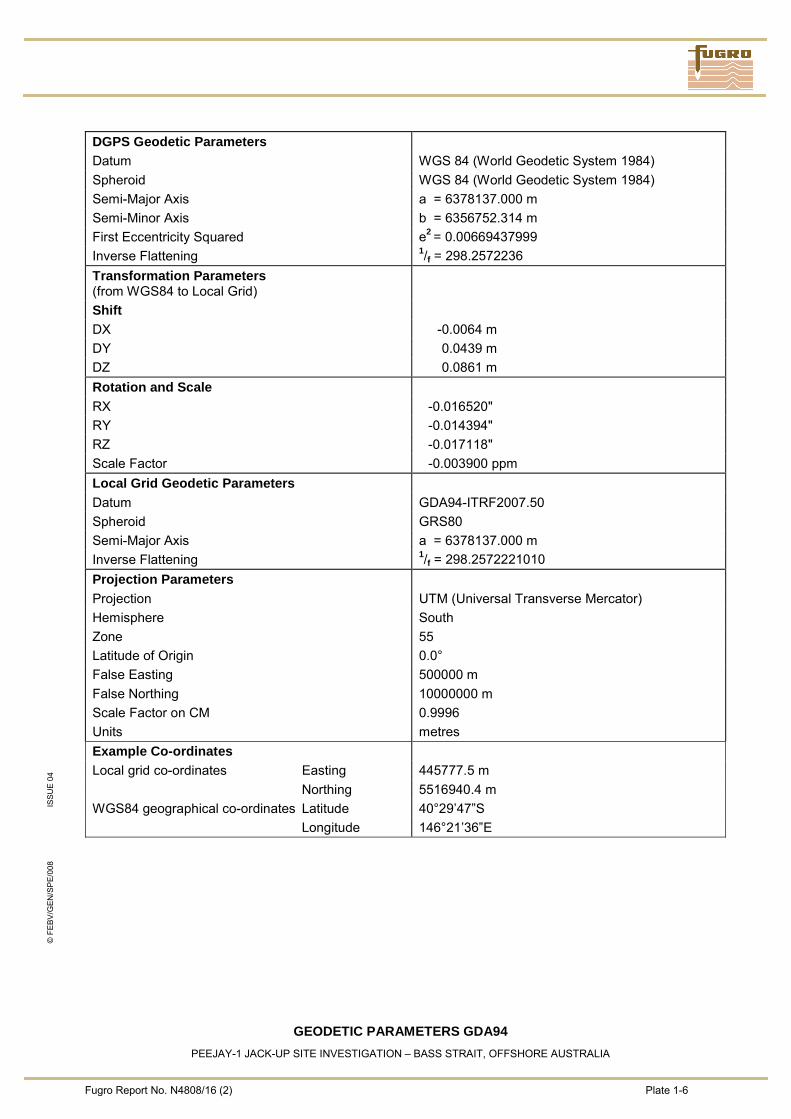
GEODETIC PARAMETERS GDA94
PEEJAY-1 JACK-UP SITE INVESTIGATION – BASS STRAIT, OFFSHORE AUSTRALIA
Fugro Report No. N4808/16 (2) Plate 1-6
© F
EBV/
GEN
/SP
E/00
8
ISSU
E 04
DGPS Geodetic Parameters Datum WGS 84 (World Geodetic System 1984) Spheroid WGS 84 (World Geodetic System 1984) Semi-Major Axis a = 6378137.000 m Semi-Minor Axis b = 6356752.314 m First Eccentricity Squared e2 = 0.00669437999 Inverse Flattening 1/f = 298.2572236 Transformation Parameters (from WGS84 to Local Grid)
Shift DX -0.0064 m DY 0.0439 m DZ 0.0861 m Rotation and Scale RX -0.016520" RY -0.014394" RZ -0.017118" Scale Factor -0.003900 ppm Local Grid Geodetic Parameters Datum GDA94-ITRF2007.50 Spheroid GRS80 Semi-Major Axis a = 6378137.000 m Inverse Flattening 1/f = 298.2572221010 Projection Parameters Projection UTM (Universal Transverse Mercator) Hemisphere South Zone 55 Latitude of Origin 0.0° False Easting 500000 m False Northing 10000000 m Scale Factor on CM 0.9996 Units metres Example Co-ordinates Local grid co-ordinates Easting 445777.5 m Northing 5516940.4 m WGS84 geographical co-ordinates Latitude 40°29’47”S Longitude 146°21’36”E
GEOTECHNICAL PROJECT RESPONSIBILITIES PEEJAY-1 JACK-UP SITE INVESTIGATION – BASS STRAIT, OFFSHORE AUSTRALIA
Fugro Report No. N4808/16 (2) Plate 2-1
© F
EBV/
CD
E/TA
B/07
0
ISSU
E 15
COMPANY STATUS RESPONSIBILITY Australian Drilling Associates, Melbourne, Australia
Client − Project commissioning − Management of geophysical and
geotechnical services, geophysical and geotechnical project design, provision and approval of test locations and depths, monitoring and approval of data acquisition
Fugro Survey Pty Ltd (FSPTY) Perth, Western Australia
Fugro contract holder − Supply of geodetic information of test locations
− Supporting activities: DGPS surface positioning, underwater positioning, water depth measurement by echosounder, data processing and preparation of report
− Data analysis and processing includes water depth measurements obtained by drill string sounding
Fugro Engineers (FEBV) Leidschendam, Netherlands
Fugro OpCo, reports to FSPTY
− Supply of geotechnical information − Supporting offshore activities: in-situ
testing, laboratory testing, water depth measurement by direct sounding (drill string)
− Supporting office activities: reporting of factual data and engineering analysis
Fugro Seacore Ltd. Cornwall, United Kingdom
Fugro OpCo, reports to FSPTY
− Drilling borehole(s) suitable for in-situ testing and sampling, using geotechnical drilling vessel Markab
Civil Geotechnical Services (CGS), Ringwood, Australia
Contractor to FSPTY, reports to FSPTY
− Supply of (office) laboratory test results
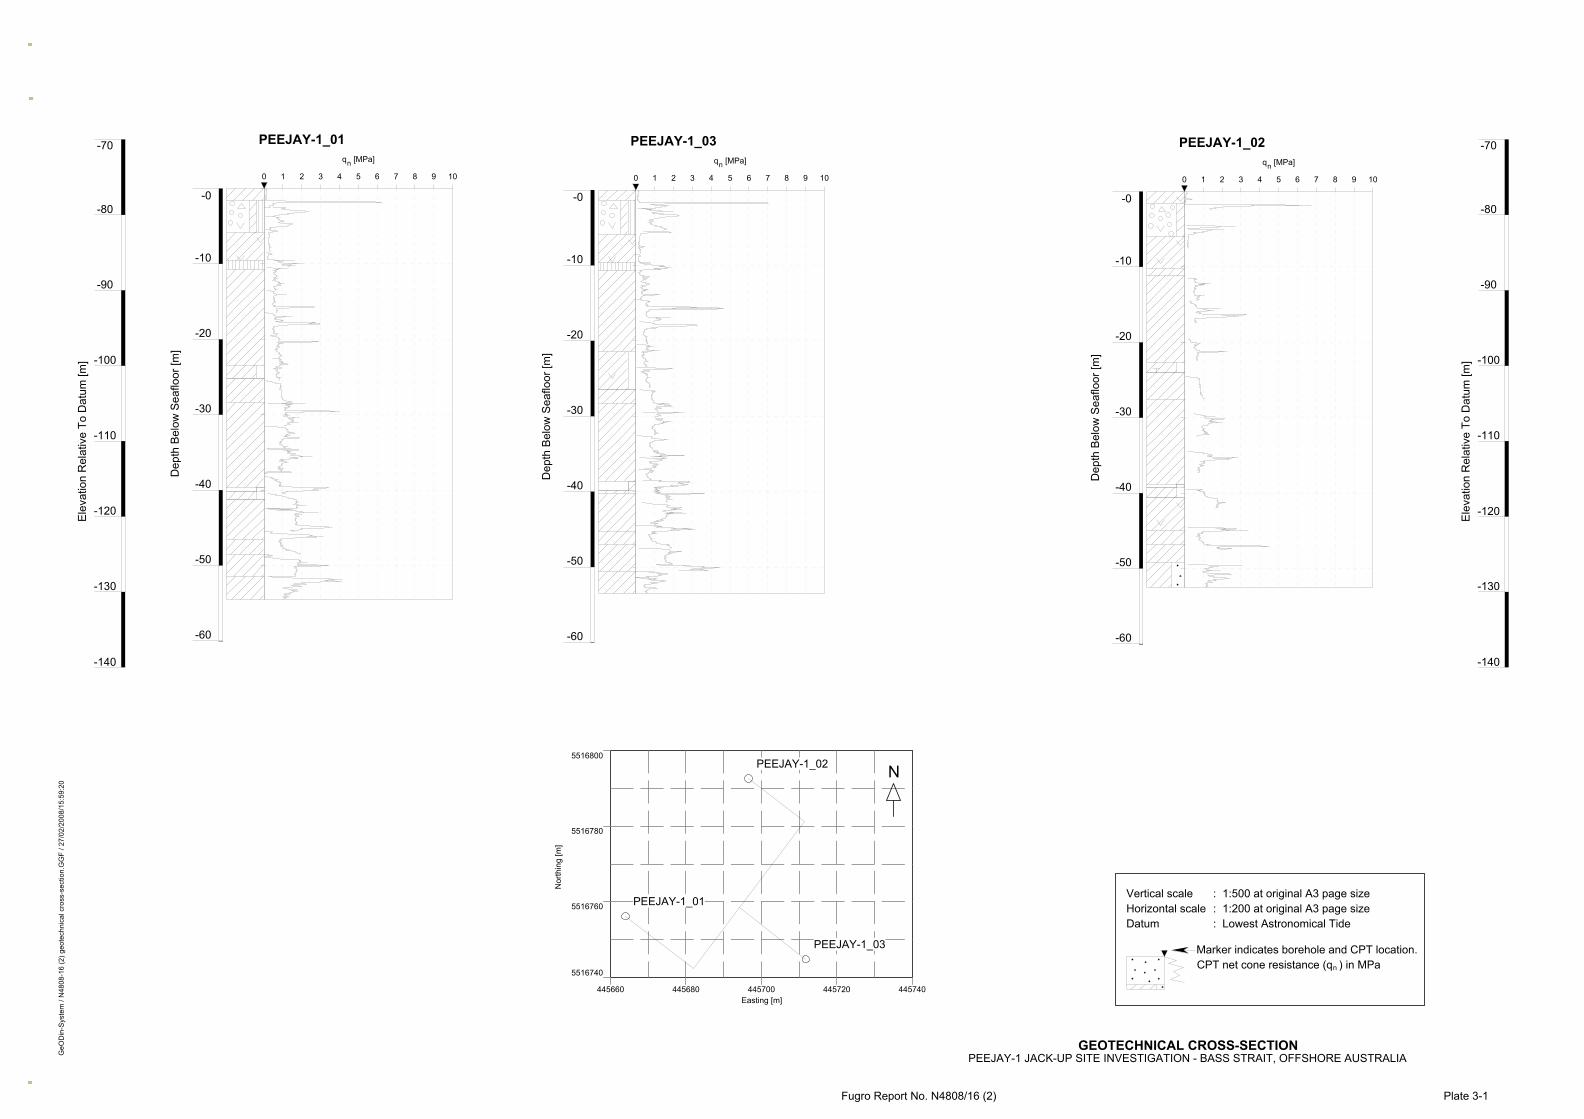
Plate 3-1
GEOTECHNICAL CROSS-SECTIONPEEJAY-1 JACK-UP SITE INVESTIGATION - BASS STRAIT, OFFSHORE AUSTRALIAG
eOD
in-S
yste
m /
N48
08-1
6 (2
) geo
tech
nica
l cro
ss-s
ectio
n.G
GF
/ 27/
02/2
008/
15:5
9:20
Fugro Report No. N4808/16 (2)
Dep
th B
elow
Sea
floor
[m]
Dep
th B
elow
Sea
floor
[m]
n nD
epth
Bel
ow S
eaflo
or [m
]
Marker indicates borehole and CPT location.
Horizontal scale
CPT net cone resistance (q ) in MPan
Datum : Lowest Astronomical Tide: 1:200 at original A3 page size
PEEJAY-1_01
-0
-10
-20
-30
-40
-50
-60
0 1 2 3 4 5 6 7 8 9 10
q [MPa]
PEEJAY-1_03
-0
-10
-20
-30
-40
-50
-60
0 1 2 3 4 5 6 7 8 9 10
q [MPa]
PEEJAY-1_02
-0
-10
-20
-30
-40
-50
-60
0 1 2 3 4 5 6 7 8 9 10
q [MPa]n
Vertical scale : 1:500 at original A3 page size
5516740
5516760
5516780
5516800
445660 445680 445700 445720 445740
PEEJAY-1_03
PEEJAY-1_02
PEEJAY-1_01
N
Easting [m]
Nor
thin
g [m
]
Ele
vatio
n R
elat
ive
To D
atum
[m]
-70
-80
-90
-100
-110
-120
-130
-140
Ele
vatio
n R
elat
ive
To D
atum
[m]
-70
-80
-90
-100
-110
-140
-120
-130
1
2
3
4
5
67
8
910111213
14
10
20
30
40
50
60
70
80
90
4 8 12 16 20 24 28
PEEJAY-1 JACK-UP SITE INVESTIGATION - BASS STRAIT, OFFSHORE AUSTRALIA
Fugro Report No. N4808/16 (2) Plate 3-2
GeO
Din
/Pla
te 3
-2 U
nit W
eigh
t ver
sus
Dep
th.g
lo/2
008-
02-2
7 16
:42:
17
PEEJAY-1_02
UNIT WEIGHT VERSUS DEPTH
Location(s):
GroundModelUnit Weight [kN/m³]
Unit weight best estimate
Dep
th B
elow
Sea
floor
[m]
Unit weight derived from volume mass calculationUnit weight derived from water content and particle density
PEEJAY-1 JACK-UP SITE INVESTIGATION - BASS STRAIT, OFFSHORE AUSTRALIA
Fugro Report No. N4804/16 (2) Plate 3-3
GeO
Din
/Pla
te 3
- Und
rain
ed S
hear
Stre
ngth
ver
sus
Dep
th.g
lo/2
008-
02-2
7 11
:31:
33
PEEJAY-1_01
1
2
3
4
5
67
8
910
11
1213
14
10
20
30
40
50
60
70
80
90
0 50 100 150 200 250 300
UNDRAINED SHEAR STRENGTH VERSUS DEPTH
Location(s):
Notes:- Nk = 15 and Nk = 20 are used to derive cu from CPT
Dep
th B
elow
Sea
floor
[m]
GroundModelUndrained Shear Strength [kPa]
Undrained shear strength best estimatePocket penetrometerTorvaneFallconeLaboratory vane
UU-triaxialCU-triaxialDirect simple shearIn-situ vane shearcu derived from CPT
PEEJAY-1 JACK-UP SITE INVESTIGATION - BASS STRAIT, OFFSHORE AUSTRALIA
Fugro Report No. N4808/16 (2) Plate 3-4
GeO
Din
/Pla
te 3
- Und
rain
ed S
hear
Stre
ngth
ver
sus
Dep
th.g
lo/2
008-
02-2
7 11
:39:
23
PEEJAY-1_02
1
2
3
4
5
67
8
910111213
14
10
20
30
40
50
60
70
80
90
0 50 100 150 200 250 300
UNDRAINED SHEAR STRENGTH VERSUS DEPTH
Location(s):
Notes:- Nk = 15 and Nk = 20 are used to derive cu from CPT
Dep
th B
elow
Sea
floor
[m]
GroundModelUndrained Shear Strength [kPa]
Undrained shear strength best estimatePocket penetrometerTorvaneFallconeLaboratory vane
UU-triaxialCU-triaxialDirect simple shearIn-situ vane shearcu derived from CPT
PEEJAY-1 JACK-UP SITE INVESTIGATION - BASS STRAIT, OFFSHORE AUSTRALIA
Fugro Report No. N4808/16 (2) Plate 3-5
GeO
Din
/Pla
te 3
Und
rain
ed S
hear
Stre
ngth
ver
sus
Dep
th.g
lo/2
008-
03-0
3 09
:53:
26
PEEJAY-1_03
1
2
3
4
5
6
7
8
910
11
12
13
14
10
20
30
40
50
60
70
80
90
0 50 100 150 200 250 300
UNDRAINED SHEAR STRENGTH VERSUS DEPTH
Location(s):
Notes:- Nk = 15 and Nk = 20 are used to derive cu from CPT
Dep
th B
elow
Sea
floor
[m]
GroundModelUndrained Shear Strength [kPa]
Undrained shear strength best estimatePocket penetrometerTorvaneFallconeLaboratory vane
UU-triaxialCU-triaxialDirect simple shearIn-situ vane shearcu derived from CPT
DESIGN BASIS FOR JACK-UP PLATFORM FOUNDATION PEEJAY-1 JACK-UP SITE INVESTIGATION – BASS STRAIT, OFFSHORE AUSTRALIA
Fugro Report No. N4808/16 (2) Plate 4-1
© F
ugro
199
6-20
07
FEB
V/C
DE
/SP
E/0
34
IS
SU
E 1
3
JACK-UP PLATFORM Jack-up Name and Type: West Triton, independent jacking, 3 legs Foundation Geometry: Refer to plate titled “Jack-up Platform Leg Penetration Analysis
Results” for spudcan details Maximum Preload: 86.8 MN at bottom of spudcan and per spudcan Working Load: Not considered Acceptable Leg Plunge for Punch-Through:
Unknown to Fugro
Structural Integrity: Not considered Construction Practice and Monitoring:
Minimum requirements according to SNAME (2002), including preload versus leg penetration behaviour
SITE CONDITIONS Location: Boreholes PEEJAY-1_01, PEEJAY-1_02 and PEEJAY-1_03 Seafloor: Level Geophysical Information: Bathymetry, shallow geophysics and side scan sonar interpretation:
− survey area of about 1 km by 1 km − typical 100 m line spacing, except for 2 lines each side of the
centreline where the typical spacing was 25 m − maximum penetration down to about 30 m below seafloor
Geotechnical Information: Ground investigation data consisting of: − one log of alternating CPT and sample borehole to maximum depth
of 52.5 m below seafloor − two continuous CPT boreholes to maximum depth of 54.5 m below
seafloor − results of geotechnical classification tests on recovered samples
Ground Type(s): − Succession of calcareous/carbonate clays and silt, including shell debris layers
− As present at the time of survey Lateral Correlation of Ground Strata:
Refer to Main Text
Vertical Correlation of Ground Strata:
Implicitly incorporated in stratigraphic schematisation and selection of other model parameter values
LEG PENETRATION DURING PRELOADING General Procedure: − Refer to document titled “Jack-Up Platform”
(Fugro ref. FEBV/CDE/APP/015) − SNAME (2002), Section 6.2
Limit State(s): Loss of stability during preloading Ground/Footing Spudcan Model: − Limit equilibrium, undrained for cohesive material and drained for
cohesionless material − Soil backflow incorporated − Layered ground modelled by load spread to equivalent diameter
Loading Condition: Static Load Application: Centric, compressive Safety Factor(s): − Not applied
− Jack-up operator to assess risk where necessary Ground/Spudcan Parameter Values:
Refer to plate titled “Parameter Values for Spudcan Penetration Model”
DESIGN BASIS FOR JACK-UP PLATFORM FOUNDATION PEEJAY-1 JACK-UP SITE INVESTIGATION – BASS STRAIT, OFFSHORE AUSTRALIA
Fugro Report No. N4808/16 (2) Plate 4-2
© F
ugro
199
6-20
07
FEB
V/C
DE
/SP
E/0
34
IS
SU
E 1
3
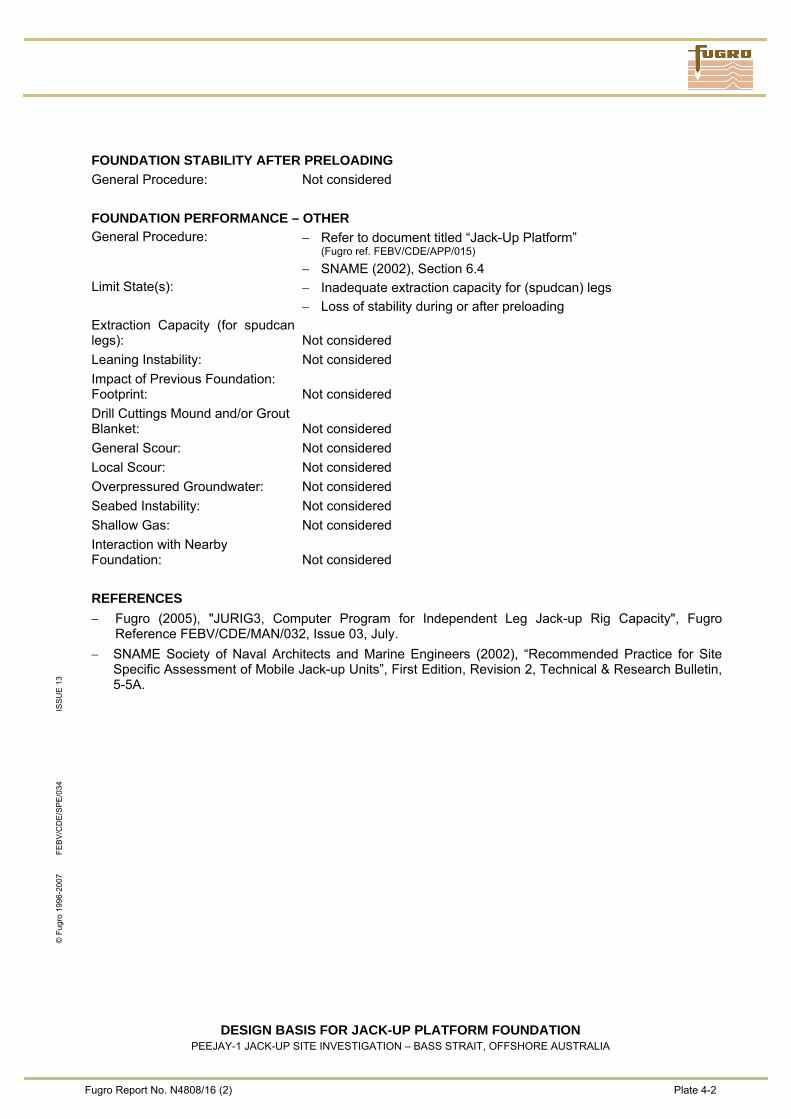
FOUNDATION STABILITY AFTER PRELOADING General Procedure: Not considered FOUNDATION PERFORMANCE – OTHER General Procedure: − Refer to document titled “Jack-Up Platform”
(Fugro ref. FEBV/CDE/APP/015) − SNAME (2002), Section 6.4
Limit State(s): − Inadequate extraction capacity for (spudcan) legs − Loss of stability during or after preloading
Extraction Capacity (for spudcan legs):
Not considered
Leaning Instability: Not considered Impact of Previous Foundation: Footprint:
Not considered
Drill Cuttings Mound and/or Grout Blanket:
Not considered
General Scour: Not considered Local Scour: Not considered Overpressured Groundwater: Not considered Seabed Instability: Not considered Shallow Gas: Not considered Interaction with Nearby Foundation:
Not considered
REFERENCES − Fugro (2005), "JURIG3, Computer Program for Independent Leg Jack-up Rig Capacity", Fugro
Reference FEBV/CDE/MAN/032, Issue 03, July. − SNAME Society of Naval Architects and Marine Engineers (2002), “Recommended Practice for Site
Specific Assessment of Mobile Jack-up Units”, First Edition, Revision 2, Technical & Research Bulletin, 5-5A.
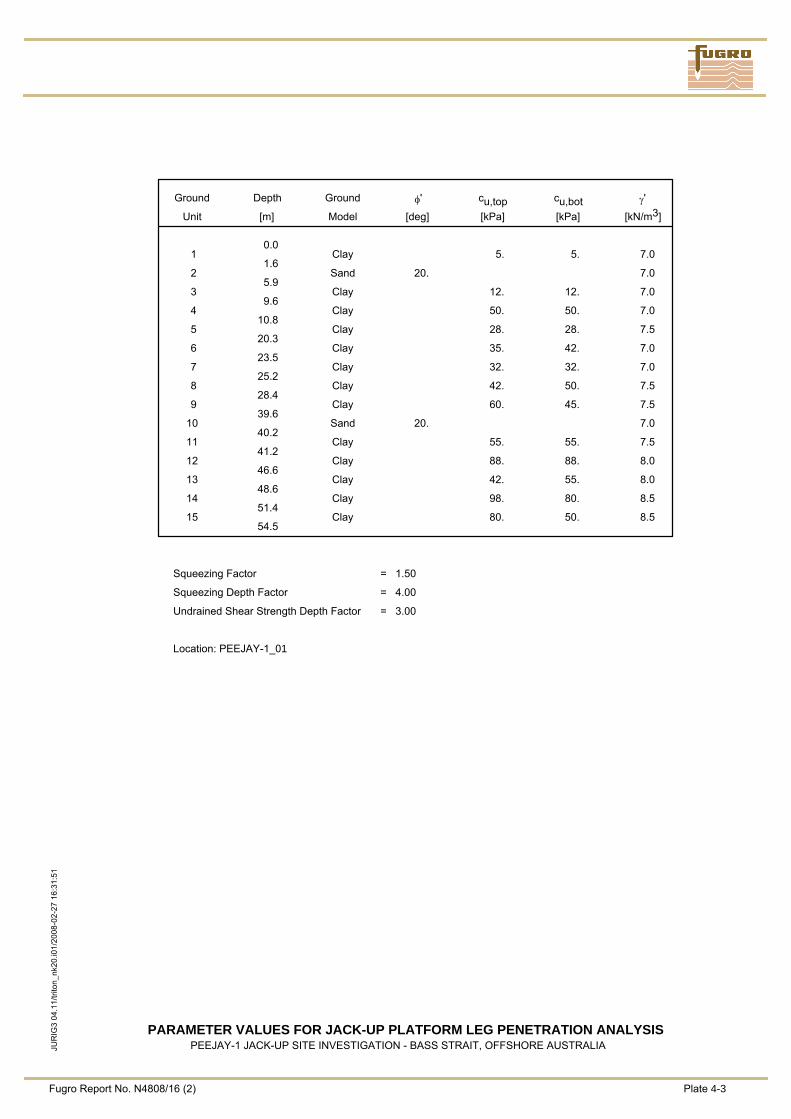
Fugro Report No. N4808/16 (2) Plate 4-3
PARAMETER VALUES FOR JACK-UP PLATFORM LEG PENETRATION ANALYSISPEEJAY-1 JACK-UP SITE INVESTIGATION - BASS STRAIT, OFFSHORE AUSTRALIA
Ground Depth Ground φ' cu,top cu,bot γ'
Unit [m] Model [deg] [kPa] [kPa] [kN/m3]
1 0.0
Clay 5. 5. 7.0
2 1.6
Sand 20. 7.0
3 5.9
Clay 12. 12. 7.0
4 9.6
Clay 50. 50. 7.0
5 10.8
Clay 28. 28. 7.5
6 20.3
Clay 35. 42. 7.0
7 23.5
Clay 32. 32. 7.0
8 25.2
Clay 42. 50. 7.5
9 28.4
Clay 60. 45. 7.5
10 39.6
Sand 20. 7.0
11 40.2
Clay 55. 55. 7.5
12 41.2
Clay 88. 88. 8.0
13 46.6
Clay 42. 55. 8.0
14 48.6
Clay 98. 80. 8.5
15 51.4
Clay 80. 50. 8.5 54.5
Squeezing Factor = 1.50
Squeezing Depth Factor = 4.00
Undrained Shear Strength Depth Factor = 3.00
Location: PEEJAY-1_01
JUR
IG3
04.1
1/tri
ton_
nk20
.i01/
2008
-02-
27 1
6:31
:51
0 20 40 60 80 100 120 140Soil Resistance per Leg [MN]
0 4 8 12 16 20 24 28Soil Resistance per Leg [kips] *103
0
8
16
24
32
40
48
56
64
72
80
Spu
dcan
Tip
Pen
etra
tion
[m]
0
25
50
75
100
125
150
175
200
225
250
Spu
dcan
Tip
Pen
etra
tion
[ft]
Predicted spudcan penetration behaviour: Load Spread Factor 1: 3.0 [h:v]Predicted spudcan penetration behaviour: Load Spread Factor 1: 5.0 [h:v]
Pre
load
= 8
6.8
MN
GroundModel
GROUND MODEL LEGEND
Sand
Clay
WEST TRITON
Diameter
Base Area
Volume
Tip to Base Distance
=
=
=
=
17.0
227.0
822.5
1.9
m
m2
m3
m
Fugro Report No. N4808/16 (2) Plate 4-4
JACK-UP PLATFORM LEG PENETRATION ANALYSIS RESULTSLOCATION PEEJAY-1_01
PEEJAY-1 JACK-UP SITE INVESTIGATION - BASS STRAIT, OFFSHORE AUSTRALIA
Immediate Backflow
JUR
IG3
04.1
1/tri
ton_
nk20
.i01/
2008
-02-
27 1
6:31
:52
Fugro Report No. N4808/16 (2) Plate 4-5
PARAMETER VALUES FOR JACK-UP PLATFORM LEG PENETRATION ANALYSISPEEJAY-1 JACK-UP SITE INVESTIGATION - BASS STRAIT, OFFSHORE AUSTRALIA
Ground Depth Ground φ' cu,top cu,bot γ'
Unit [m] Model [deg] [kPa] [kPa] [kN/m3]
1 0.0
Clay 5. 5. 7.0
2 1.6
Sand 20. 7.0
3 5.9
Clay 10. 10. 7.0
4 10.2
Clay 50. 50. 7.5
5 11.2
Clay 28. 28. 7.0
6 15.0
Clay 50. 50. 7.0
7 17.0
Clay 32. 32. 7.0
8 22.7
Clay 32. 32. 7.0
9 24.0
Clay 35. 45. 7.0
10 27.6
Clay 58. 32. 7.5
11 38.8
Sand 20. 8.0
12 39.3
Clay 55. 55. 7.5
13 40.6
Clay 88. 80. 7.5
14 45.0
Clay 45. 45. 8.0
15 46.8
Clay 100. 100. 7.5
16 49.2
Clay 75. 62. 7.0 52.3
Squeezing Factor = 1.50
Squeezing Depth Factor = 4.00
Undrained Shear Strength Depth Factor = 3.00
Location: PEEJAY-1_02
JUR
IG3
04.1
1/tri
ton_
nk20
.i01/
2008
-02-
27 1
6:36
:34
0 20 40 60 80 100 120 140Soil Resistance per Leg [MN]
0 4 8 12 16 20 24 28Soil Resistance per Leg [kips] *103
0
8
16
24
32
40
48
56
64
72
80
Spu
dcan
Tip
Pen
etra
tion
[m]
0
25
50
75
100
125
150
175
200
225
250
Spu
dcan
Tip
Pen
etra
tion
[ft]
Predicted spudcan penetration behaviour: Load Spread Factor 1: 3.0 [h:v]Predicted spudcan penetration behaviour: Load Spread Factor 1: 5.0 [h:v]
Pre
load
= 8
6.8
MN
GroundModel
GROUND MODEL LEGEND
Sand
Clay
WEST TRITON
Diameter
Base Area
Volume
Tip to Base Distance
=
=
=
=
17.0
227.0
822.5
1.9
m
m2
m3
m
Fugro Report No. N4808/16 (2) Plate 4-6
JACK-UP PLATFORM LEG PENETRATION ANALYSIS RESULTSLOCATION PEEJAY-1_02
PEEJAY-1 JACK-UP SITE INVESTIGATION - BASS STRAIT, OFFSHORE AUSTRALIA
Immediate Backflow
JUR
IG3
04.1
1/tri
ton_
nk20
.i01/
2008
-02-
27 1
6:36
:34

Fugro Report No. N4808/16 (2) Plate 4-7
PARAMETER VALUES FOR JACK-UP PLATFORM LEG PENETRATION ANALYSISPEEJAY-1 JACK-UP SITE INVESTIGATION - BASS STRAIT, OFFSHORE AUSTRALIA
Ground Depth Ground φ' cu,top cu,bot γ'
Unit [m] Model [deg] [kPa] [kPa] [kN/m3]
1 0.0
Clay 5. 5. 7.0
2 1.4
Sand 20. 7.0
3 5.0
Clay 10. 10. 7.0
4 9.6
Clay 50. 50. 7.5
5 10.7
Clay 20. 20. 7.0
6 14.6
Clay 32. 32. 7.0
7 16.9
Clay 50. 50. 7.0
8 18.2
Clay 30. 30. 7.0
9 21.4
Clay 15. 38. 7.0
10 26.4
Clay 42. 42. 7.0
11 28.3
Clay 60. 38. 7.5
12 38.5
Sand 20. 7.0
13 39.4
Clay 55. 55. 7.5
14 40.3
Clay 82. 82. 8.0
15 45.3
Clay 40. 40. 8.5
16 47.0
Clay 85. 85. 8.5
17 50.6
Clay 75. 35. 8.5 53.5
Squeezing Factor = 1.50
Squeezing Depth Factor = 4.00
Undrained Shear Strength Depth Factor = 3.00
Location: PEEJAY-1_03
JUR
IG3
04.1
1/tri
ton_
nk20
.i01/
2008
-02-
27 1
6:41
:19
0 20 40 60 80 100 120 140Soil Resistance per Leg [MN]
0 4 8 12 16 20 24 28Soil Resistance per Leg [kips] *103
0
8
16
24
32
40
48
56
64
72
80
Spu
dcan
Tip
Pen
etra
tion
[m]
0
25
50
75
100
125
150
175
200
225
250
Spu
dcan
Tip
Pen
etra
tion
[ft]
Predicted spudcan penetration behaviour: Load Spread Factor 1: 3.0 [h:v]Predicted spudcan penetration behaviour: Load Spread Factor 1: 5.0 [h:v]
Pre
load
= 8
6.8
MN
GroundModel
GROUND MODEL LEGEND
Sand
Clay
WEST TRITON
Diameter
Base Area
Volume
Tip to Base Distance
=
=
=
=
17.0
227.0
822.5
1.9
m
m2
m3
m
Fugro Report No. N4808/16 (2) Plate 4-8
JACK-UP PLATFORM LEG PENETRATION ANALYSIS RESULTSLOCATION PEEJAY-1_03
PEEJAY-1 JACK-UP SITE INVESTIGATION - BASS STRAIT, OFFSHORE AUSTRALIA
Immediate Backflow
JUR
IG3
04.1
1/tri
ton_
nk20
.i01/
2008
-02-
27 1
6:41
:19
Fugro Report No. N4808/16 (2) Table of Contents – Section A Page 1 of 1
SECTION A
GEOTECHNICAL LOGS TEXT – SECTION A: Page A. GEOTECHNICAL BOREHOLE LOGS A.1 DETAILS ................................................................................................................................A1 A.2 DISCUSSION OF RESULTS ................................................................................................A1 A.3 PRACTICE FOR GEOTECHNICAL BOREHOLE ....................................................... A2 to A3 LIST OF PLATES IN SECTION A: Plate Geotechnical Log PEEJAY-1_02 .......................................................................................................... A1 to A2
Fugro Report No. N4808/16 (2) Text - Section A Page A1
A. GEOTECHNICAL BOREHOLE LOGS
A.1 DETAILS Sampling has been performed using the PISTON sampler. For the PISTON sampler, 3 inch thin-walled tubes were used. A.2 DISCUSSION OF RESULTS
The borehole log shows shell debris graphically presented with gravel symbols.
Fugro Report No. N4808/16 (2) Text - Section A Page A1
© F
EBV/
CD
E/SP
E/00
2
ISSU
E 16
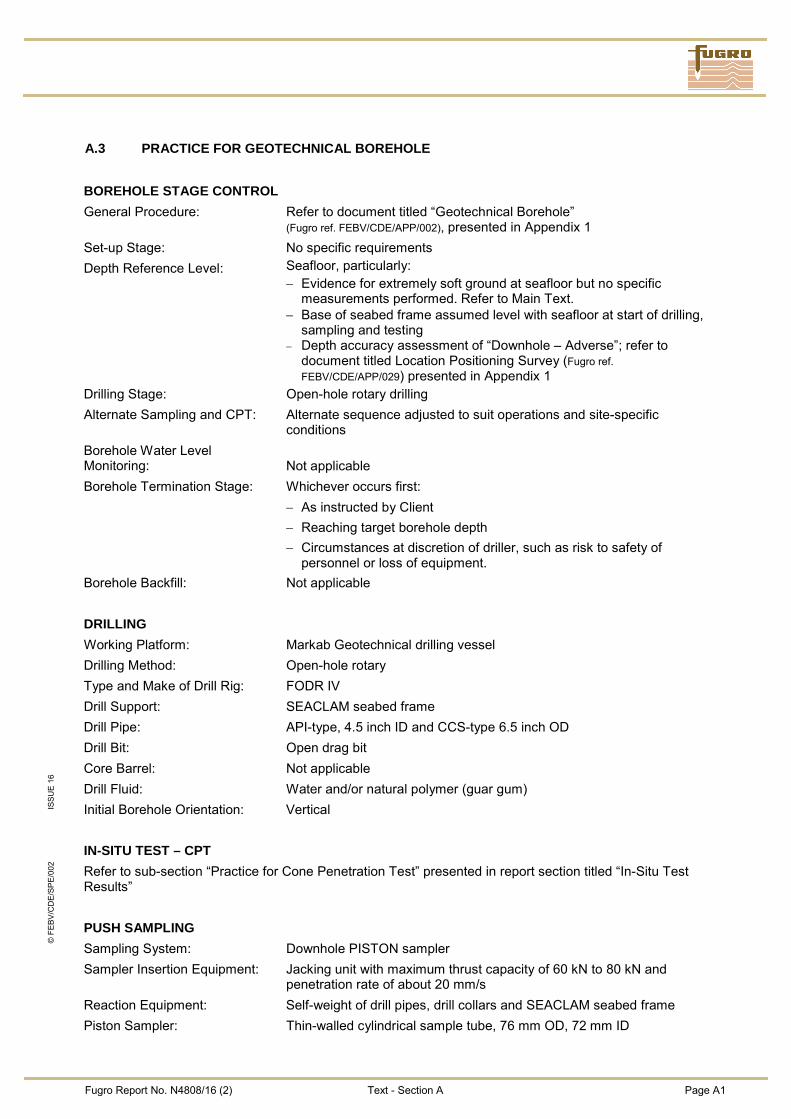
A.3 PRACTICE FOR GEOTECHNICAL BOREHOLE
BOREHOLE STAGE CONTROL General Procedure: Refer to document titled “Geotechnical Borehole”
(Fugro ref. FEBV/CDE/APP/002), presented in Appendix 1 Set-up Stage: No specific requirements Depth Reference Level: Seafloor, particularly:
− Evidence for extremely soft ground at seafloor but no specific measurements performed. Refer to Main Text.
− Base of seabed frame assumed level with seafloor at start of drilling, sampling and testing
− Depth accuracy assessment of “Downhole – Adverse”; refer to document titled Location Positioning Survey (Fugro ref. FEBV/CDE/APP/029) presented in Appendix 1
Drilling Stage: Open-hole rotary drilling Alternate Sampling and CPT: Alternate sequence adjusted to suit operations and site-specific
conditions Borehole Water Level Monitoring: Not applicable Borehole Termination Stage: Whichever occurs first:
− As instructed by Client − Reaching target borehole depth − Circumstances at discretion of driller, such as risk to safety of
personnel or loss of equipment. Borehole Backfill: Not applicable DRILLING Working Platform: Markab Geotechnical drilling vessel Drilling Method: Open-hole rotary Type and Make of Drill Rig: FODR IV Drill Support: SEACLAM seabed frame Drill Pipe: API-type, 4.5 inch ID and CCS-type 6.5 inch OD Drill Bit: Open drag bit Core Barrel: Not applicable Drill Fluid: Water and/or natural polymer (guar gum) Initial Borehole Orientation: Vertical IN-SITU TEST – CPT Refer to sub-section “Practice for Cone Penetration Test” presented in report section titled “In-Situ Test Results” PUSH SAMPLING Sampling System: Downhole PISTON sampler Sampler Insertion Equipment: Jacking unit with maximum thrust capacity of 60 kN to 80 kN and
penetration rate of about 20 mm/s Reaction Equipment: Self-weight of drill pipes, drill collars and SEACLAM seabed frame Piston Sampler: Thin-walled cylindrical sample tube, 76 mm OD, 72 mm ID

Fugro Report No. N4808/16 (2) Text - Section A Page A2
© F
EBV/
CD
E/SP
E/00
2
ISSU
E 16
Core Catcher: Not applicable Push Sampling Termination: Whichever occurs first:
− reaching maximum permissible sample tube penetration − reaching maximum capacity of sample insertion equipment and/or
sample tube − reaching maximum capacity of reaction equipment − circumstances at discretion of operator, such as risk of loss of
equipment SAMPLE HANDLING Refer to sub-section “Practice for Sample Handling and Laboratory Testing” presented in report section titled “Geotechnical Laboratory Test Results” GEOTECHNICAL LOG Purpose: Input for spudcan penetration analysis Data Processing and Management:
GeODin® database software
Ground Description: − According to document titled “Soil Description” (Fugro ref. FEBV/CDE/APP/005) presented in Appendix 1
− Based on BSI (1999) Graphical Display: − Graphical scales selected to suit general presentation of data
− No display of data outside of chart limits, i.e. some values may not be shown
Unit Weight derived from Water Content:
Assuming: − Samples fully saturated with pore water of 10 Mg/m3 (= t/m3) − Density of solid particles of ρs = 2.65 Mg/m3
Undrained Shear Strength derived from CPT:
− Refer to document titled “Cone Penetration Test Interpretation” (Fugro ref. FEBV/CDE/APP/012), presented in Appendix 1
− Based on cone factor of Nk = 15 and 20 Relative Density derived from CPT:
− Refer to document titled “Cone Penetration Test Interpretation” (Fugro ref. FEBV/CDE/APP/012), presented in Appendix 1
− Based on earth pressure coefficient values of K0 = 0.5 and 1.0 REFERENCES − BSI British Standards Institution (1999), "Code of Practice for Site Investigations", British Standard
BS 5930:1999. − Computer Program GeODin®, Recording, Presentation and Analysis of Geo-data.
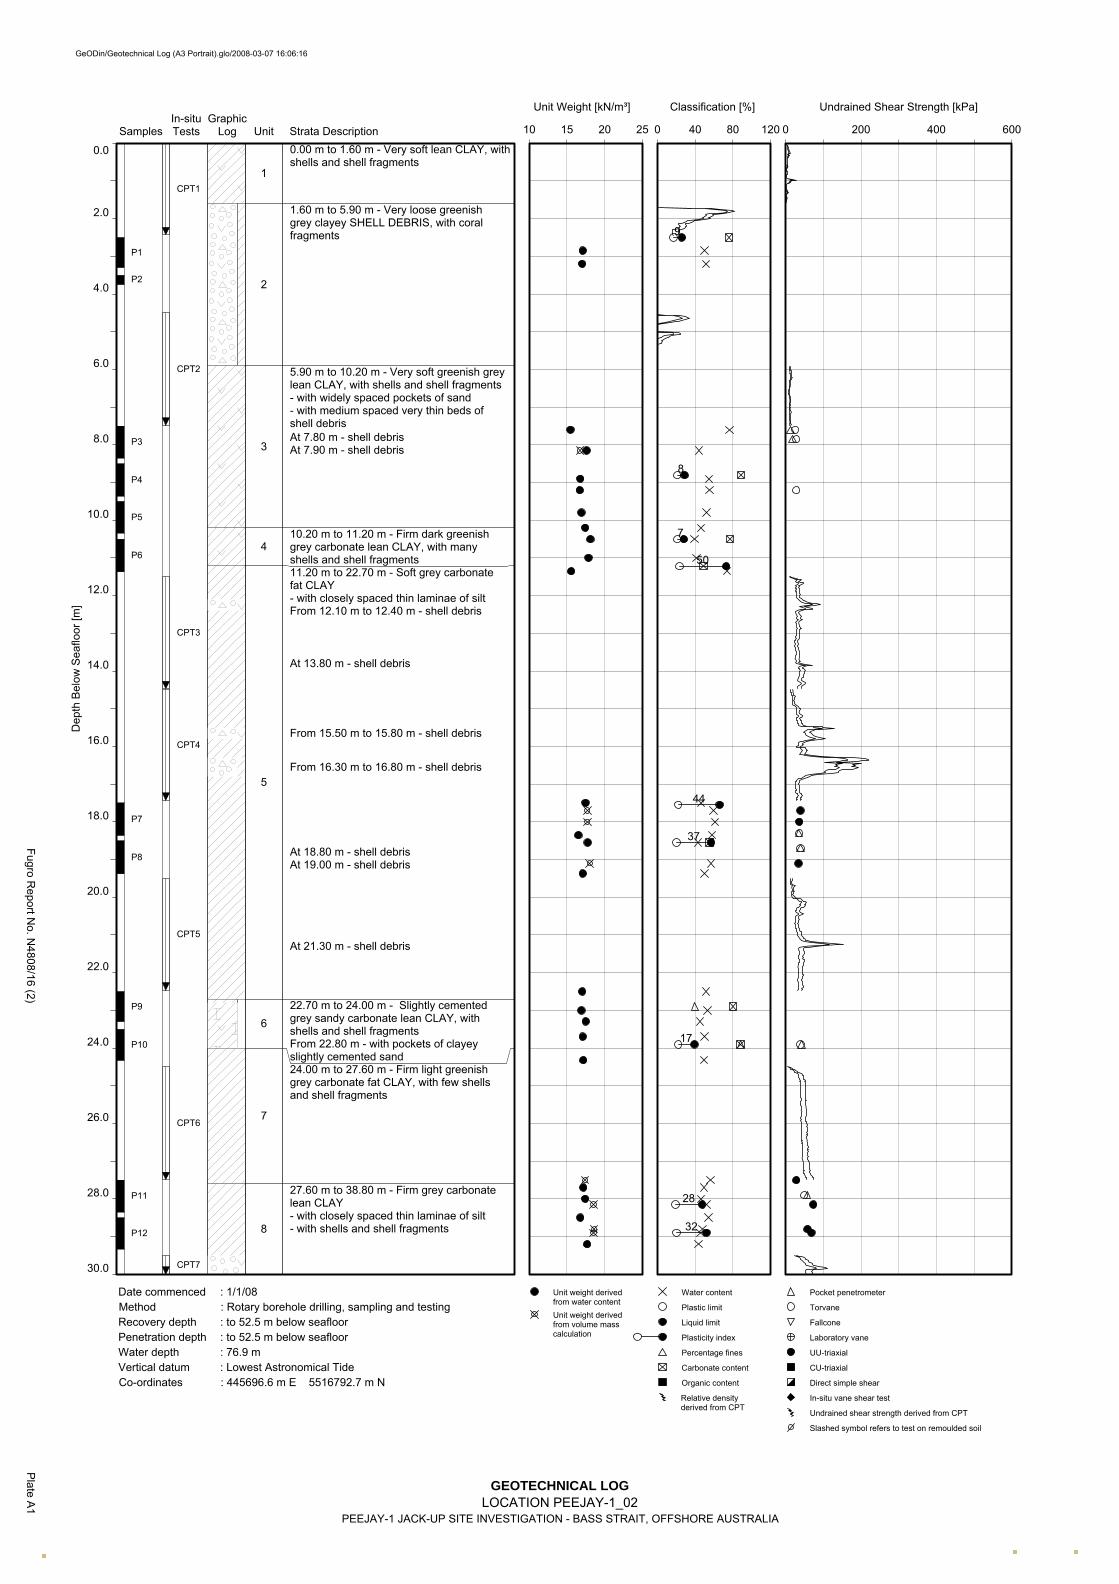
Dep
th B
elow
Sea
floor
[m]
SamplesIn-situTests
GraphicLog Strata Description
Unit Weight [kN/m³] Classification [%] Undrained Shear Strength [kPa]
10 15 20 25 0 200 400 6000 40 80 120
9
8
7
50
44
37
17
28
32
0.00 m to 1.60 m - Very soft lean CLAY, withshells and shell fragments
1.60 m to 5.90 m - Very loose greenishgrey clayey SHELL DEBRIS, with coralfragments
5.90 m to 10.20 m - Very soft greenish greylean CLAY, with shells and shell fragments- with widely spaced pockets of sand- with medium spaced very thin beds ofshell debrisAt 7.80 m - shell debrisAt 7.90 m - shell debris
10.20 m to 11.20 m - Firm dark greenishgrey carbonate lean CLAY, with manyshells and shell fragments11.20 m to 22.70 m - Soft grey carbonatefat CLAY- with closely spaced thin laminae of siltFrom 12.10 m to 12.40 m - shell debris
At 13.80 m - shell debris
From 15.50 m to 15.80 m - shell debris
From 16.30 m to 16.80 m - shell debris
At 18.80 m - shell debrisAt 19.00 m - shell debris
At 21.30 m - shell debris
22.70 m to 24.00 m - Slightly cementedgrey sandy carbonate lean CLAY, withshells and shell fragmentsFrom 22.80 m - with pockets of clayeyslightly cemented sand24.00 m to 27.60 m - Firm light greenishgrey carbonate fat CLAY, with few shellsand shell fragments
27.60 m to 38.80 m - Firm grey carbonatelean CLAY- with closely spaced thin laminae of silt- with shells and shell fragments
CPT1
CPT2
CPT3
CPT4
CPT5
CPT6
CPT7
P1
P2
P3
P4
P5
P6
P7
P8
P9
P10
P11
P12
0.0
2.0
4.0
6.0
8.0
10.0
12.0
14.0
16.0
18.0
20.0
22.0
24.0
26.0
28.0
30.0
GeODin/Geotechnical Log (A3 Portrait).glo/2008-03-07 16:06:16
Plate A
1Fugro R
eport No. N
4808/16 (2)
PEEJAY-1 JACK-UP SITE INVESTIGATION - BASS STRAIT, OFFSHORE AUSTRALIALOCATION PEEJAY-1_02
: 76.9 m: Lowest Astronomical Tide
: to 52.5 m below seafloor
: 445696.6 m E 5516792.7 m N
: 1/1/08: Rotary borehole drilling, sampling and testing
1
2
3
4
5
6
7
8
: to 52.5 m below seafloor
Date commenced
Water depthVertical datumCo-ordinates
Method
GEOTECHNICAL LOG
Unit weight derivedfrom volume masscalculation
Unit weight derivedfrom water content
Water content
Plastic limit
Liquid limit
Plasticity index
Percentage fines
Carbonate content
Organic content
Relative density derived from CPT
Pocket penetrometer
Torvane
Fallcone
Laboratory vane
UU-triaxial
CU-triaxial
Direct simple shear
In-situ vane shear test
Undrained shear strength derived from CPT
Slashed symbol refers to test on remoulded soil
Penetration depthRecovery depth
Unit
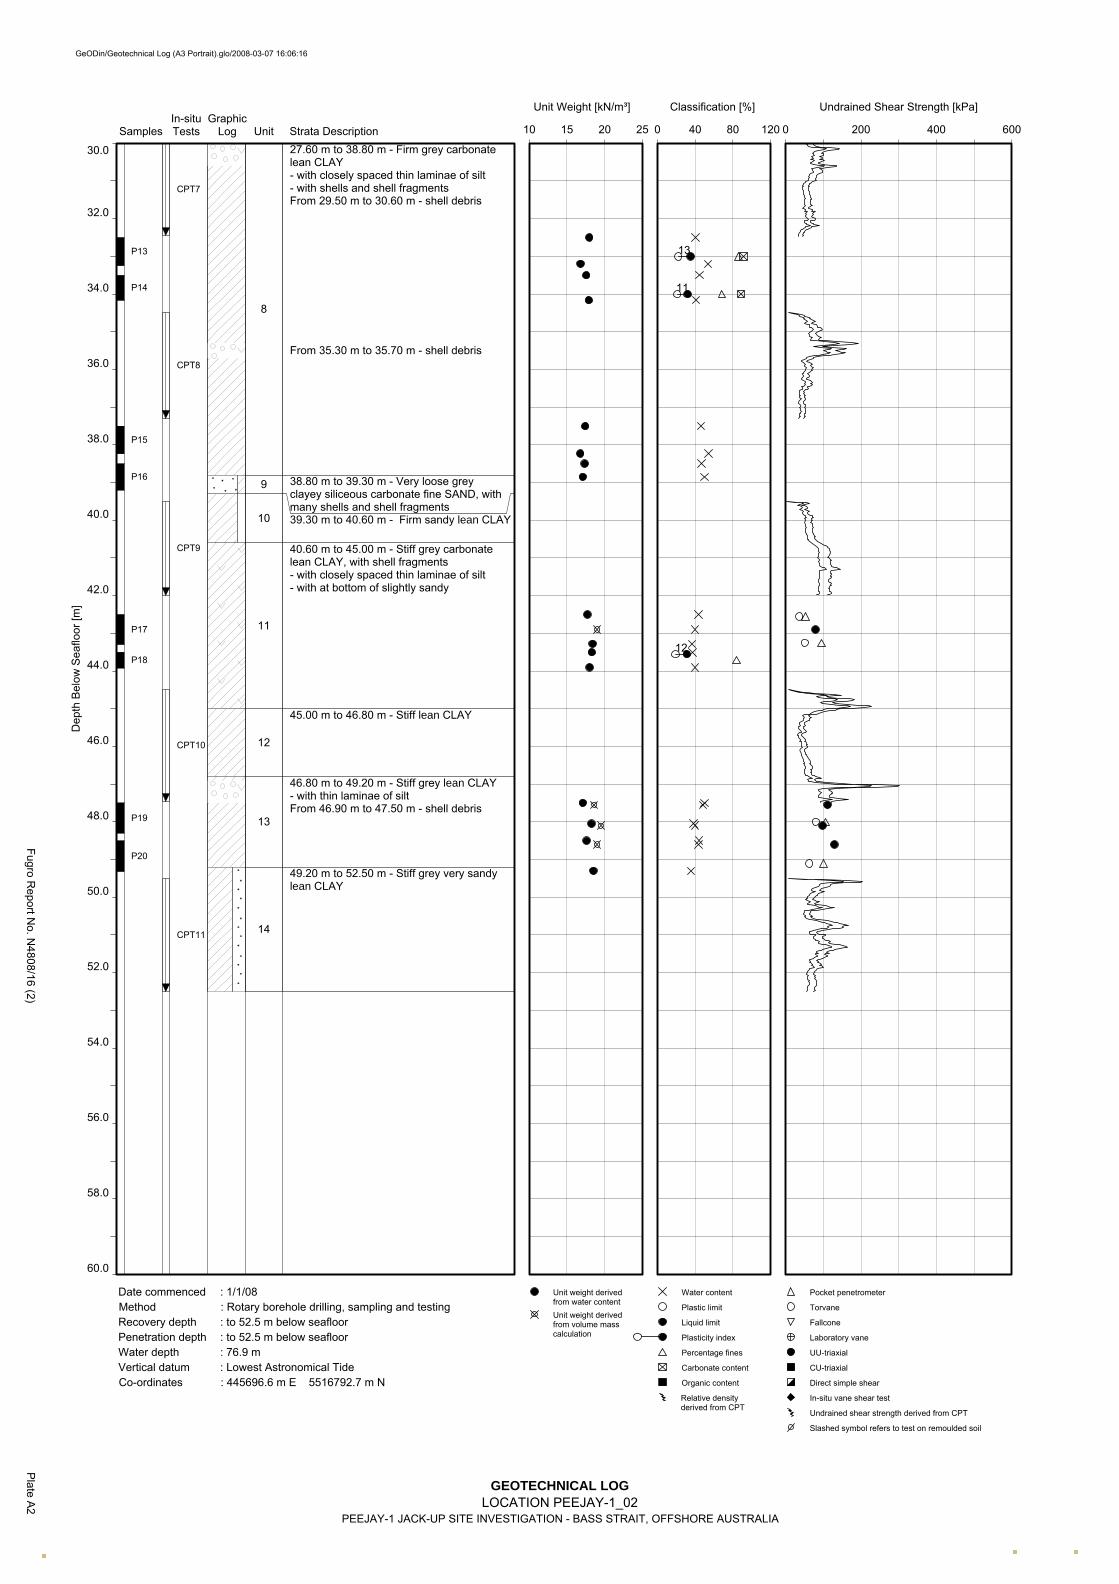
Dep
th B
elow
Sea
floor
[m]
SamplesIn-situTests
GraphicLog Strata Description
Unit Weight [kN/m³] Classification [%] Undrained Shear Strength [kPa]
10 15 20 25 0 200 400 6000 40 80 120
13
11
12
27.60 m to 38.80 m - Firm grey carbonatelean CLAY- with closely spaced thin laminae of silt- with shells and shell fragmentsFrom 29.50 m to 30.60 m - shell debris
From 35.30 m to 35.70 m - shell debris
38.80 m to 39.30 m - Very loose greyclayey siliceous carbonate fine SAND, withmany shells and shell fragments39.30 m to 40.60 m - Firm sandy lean CLAY
40.60 m to 45.00 m - Stiff grey carbonatelean CLAY, with shell fragments- with closely spaced thin laminae of silt- with at bottom of slightly sandy
45.00 m to 46.80 m - Stiff lean CLAY
46.80 m to 49.20 m - Stiff grey lean CLAY- with thin laminae of siltFrom 46.90 m to 47.50 m - shell debris
49.20 m to 52.50 m - Stiff grey very sandylean CLAY
CPT7
CPT8
CPT9
CPT10
CPT11
P13
P14
P15
P16
P17
P18
P19
P20
30.0
32.0
34.0
36.0
38.0
40.0
42.0
44.0
46.0
48.0
50.0
52.0
54.0
56.0
58.0
60.0
GeODin/Geotechnical Log (A3 Portrait).glo/2008-03-07 16:06:16
Plate A
2Fugro R
eport No. N
4808/16 (2)
PEEJAY-1 JACK-UP SITE INVESTIGATION - BASS STRAIT, OFFSHORE AUSTRALIALOCATION PEEJAY-1_02
: 76.9 m: Lowest Astronomical Tide
: to 52.5 m below seafloor
: 445696.6 m E 5516792.7 m N
: 1/1/08: Rotary borehole drilling, sampling and testing
8
9
10
11
12
13
14
: to 52.5 m below seafloor
Date commenced
Water depthVertical datumCo-ordinates
Method
GEOTECHNICAL LOG
Unit weight derivedfrom volume masscalculation
Unit weight derivedfrom water content
Water content
Plastic limit
Liquid limit
Plasticity index
Percentage fines
Carbonate content
Organic content
Relative density derived from CPT
Pocket penetrometer
Torvane
Fallcone
Laboratory vane
UU-triaxial
CU-triaxial
Direct simple shear
In-situ vane shear test
Undrained shear strength derived from CPT
Slashed symbol refers to test on remoulded soil
Penetration depthRecovery depth
Unit
Fugro Report No. N4808/16 (2) Table of Contents - Section B Page 1 of 1
SECTION B
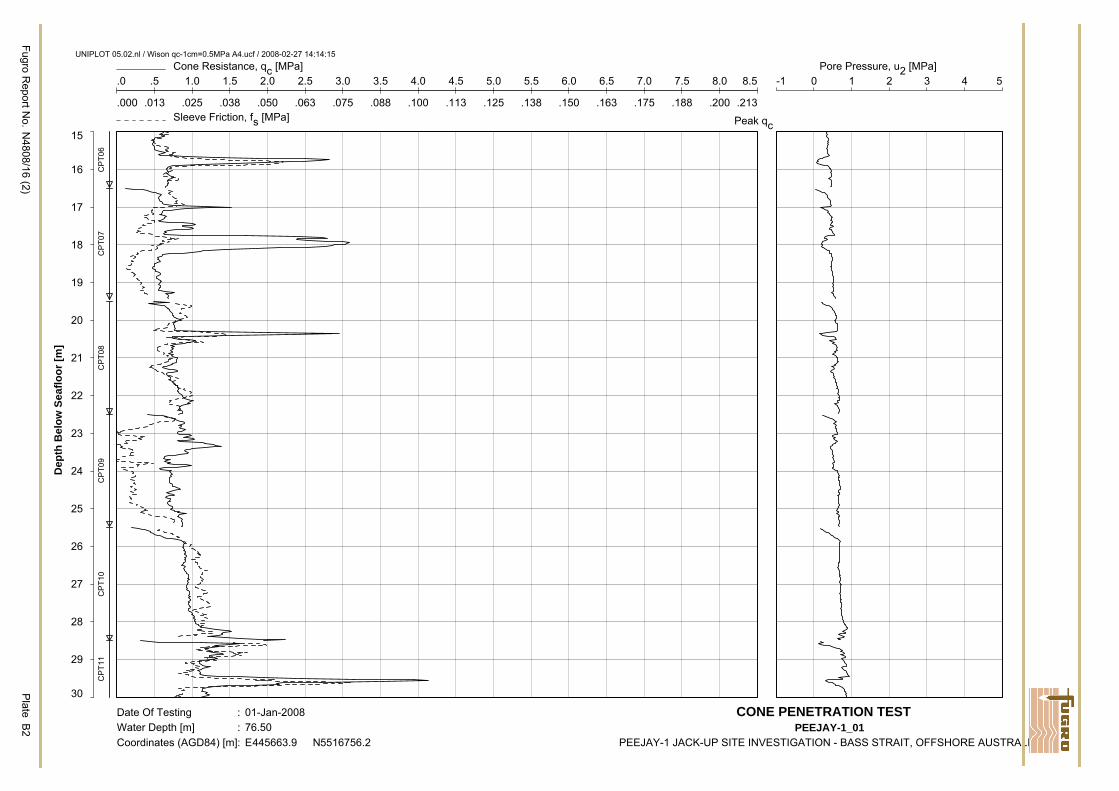
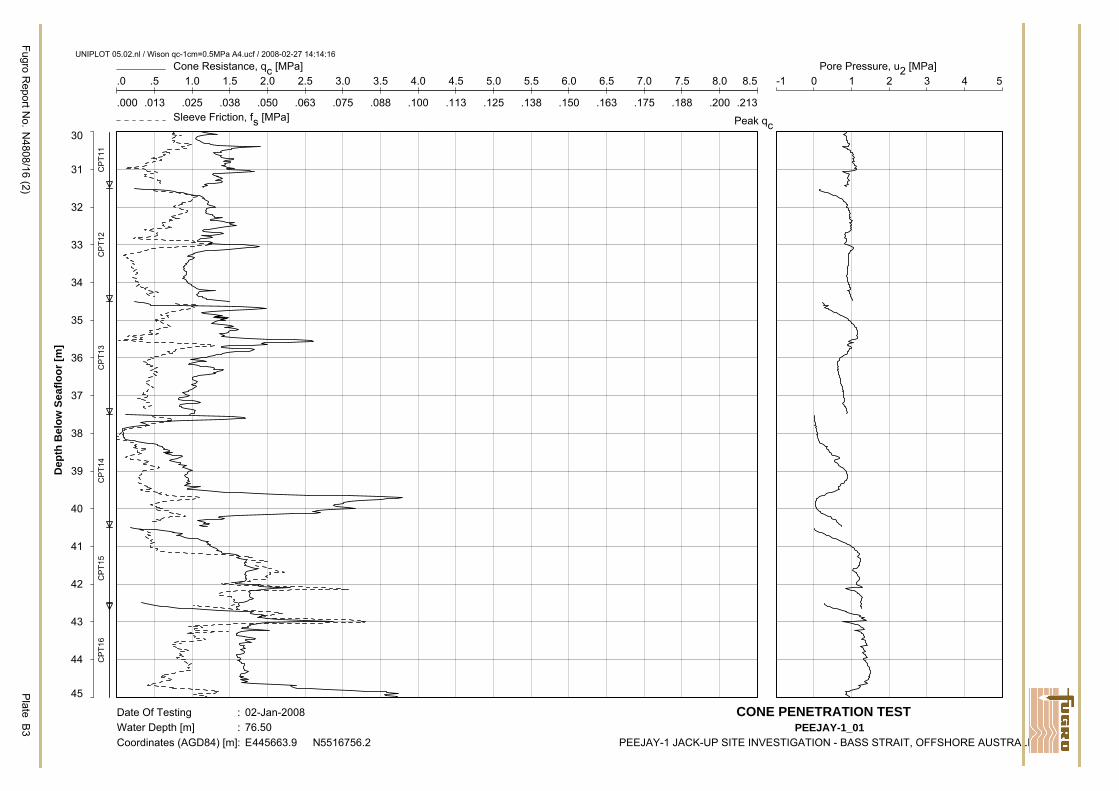
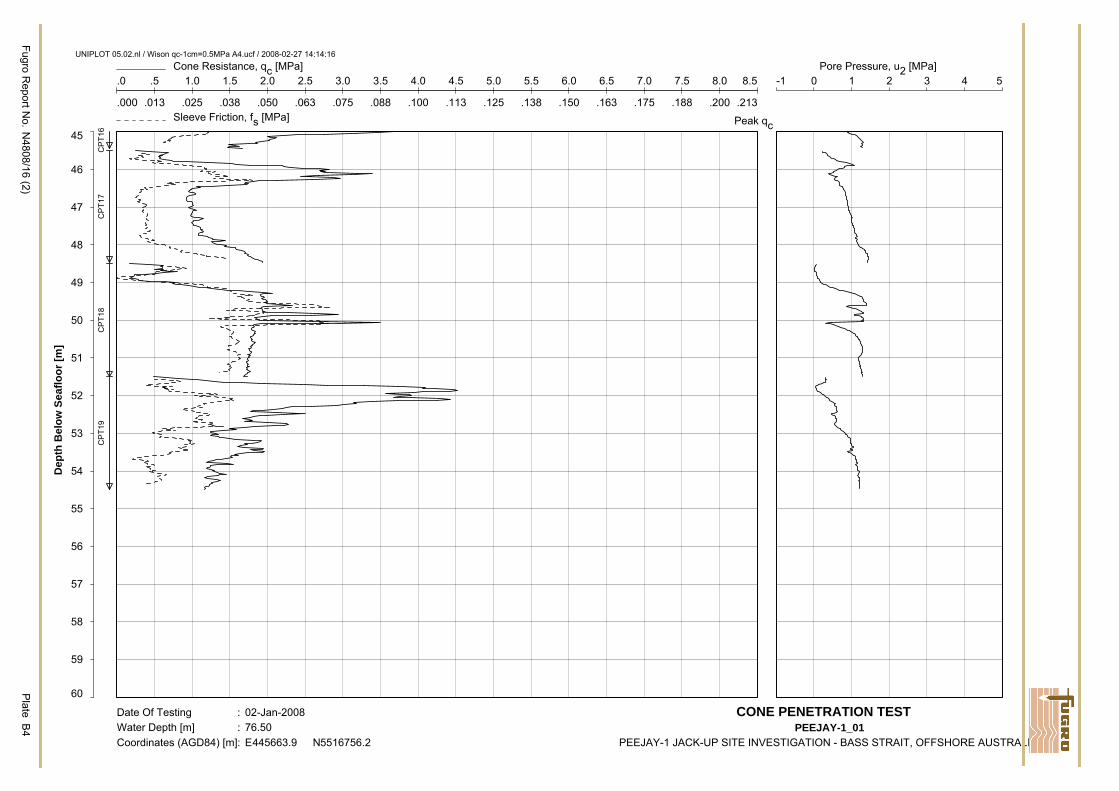
IN-SITU TEST RESULTS TEXT – SECTION B: Page B. CONE PENETRATION TESTS B.1 DETAILS ................................................................................................................................B1 B.2 DISCUSSION OF RESULTS ................................................................................................B1 B.3 PRACTICE FOR CONE PENETRATION TEST ......................................................... B2 to B3 LIST OF PLATES IN SECTION B: Plate Cone Penetration Test; qc, fs and u2, PEEJAY-1_01 ........................................................................... B1 to B4 Cone Penetration Test; qn, qt, Rf and Bq, PEEJAY-1_01 ...................................................................... B5 to B8 Parameter Values for Net Cone Resistance Calculations, PEEJAY-1_01 .....................................................B9 Cone Penetration Test; Zero Load Drift, PEEJAY-1_01 ...............................................................................B10
Cone Penetration Test; qc, fs and u2, PEEJAY-1_02 ........................................................................ B11 to B14 Cone Penetration Test; qn, qt, Rf and Bq, PEEJAY-1_02 .................................................................. B15 to B18 Parameter Values for Net Cone Resistance Calculations, PEEJAY-1_02 ...................................................B19 Cone Penetration Test; Zero Load Drift, PEEJAY-1_02 ...............................................................................B20
Cone Penetration Test; qc, fs and u2, PEEJAY-1_03 ........................................................................ B21 to B24 Cone Penetration Test; qn, qt, Rf and Bq, PEEJAY-1_03 .................................................................. B25 to B28 Parameter Values for Net Cone Resistance Calculations, PEEJAY-1_03 ...................................................B29 Cone Penetration Test; Zero Load Drift, PEEJAY-1_03 ...............................................................................B30
Fugro Report No. N4808/16 (2) Text - Section B Page B1
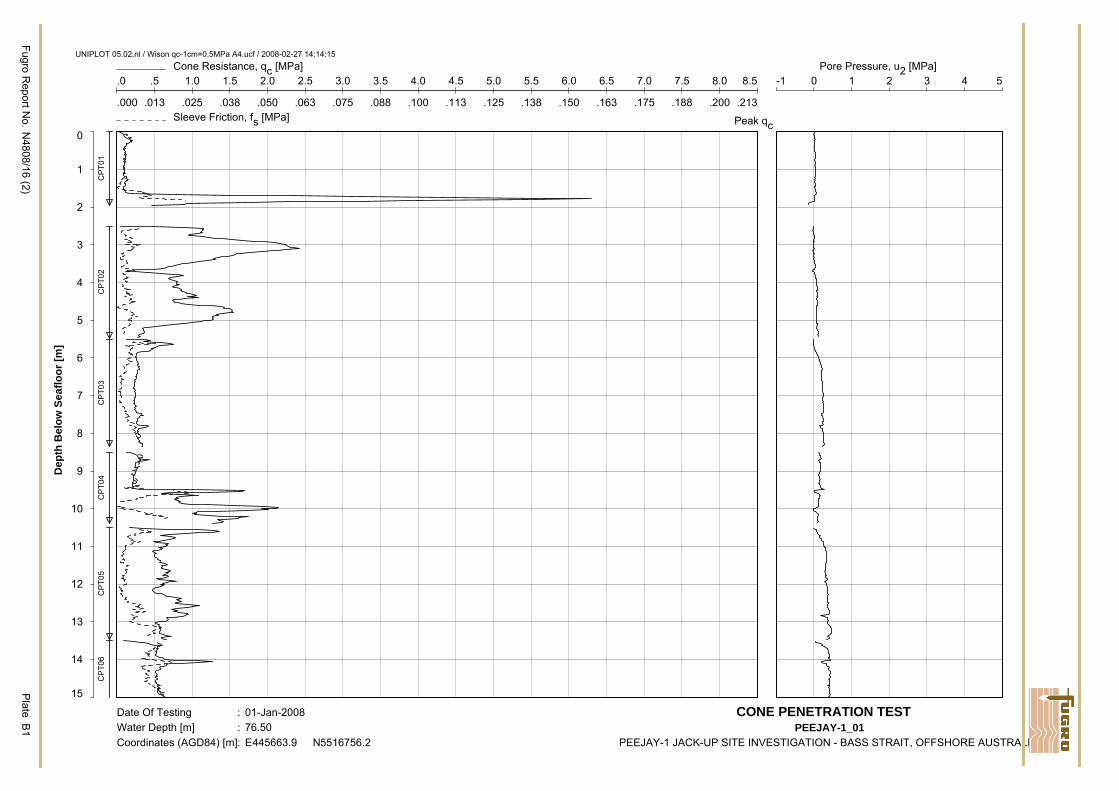
B. CONE PENETRATION TESTS B.1 DETAILS The type of cone penetrometer used during this investigation is the F5CKEW2/V. This cone is equipped with a pore pressure sensor, which makes it possible to present the net cone resistance (qnet). Testing in each borehole commenced with a test to determine seafloor. Generally, when the seafloor CPT is performed, the drill bit is approximately 0.5 m above the seafloor. From there the WISON CPT tool is lowered in the drill pipe and latches into the Bottom Hole Assembly. The cone penetrates the seafloor from the drill bit, through the water, into the soil. At each location at this site a CPT was started approximately half a metre above seafloor to ensure a correct test depth. Therefore, the first CPT results in a lower penetration depth (less than the full 3 m stroke). B.2 DISCUSSION OF RESULTS Generally, the test results are of good quality. At PEEJAY-1_01, CPT4 at 8.5 m depth was stopped after two metres penetration due to interference of the heave on the drill string. The following CPT (CPT5) commenced at the depth of termination of CPT4. Zero Load Drift of the cone during testing in PEEJAY-1_03 was unstable. However, the performed tests appear reliable and representative of the soils encountered, when compared to PEEJAY-1_01 and -_02. During testing of CPT13 and CPT14 in PEEJAY-1_03 electrical interferences occurred. Affected sections have been processed to remove interfering signals. The cone was replaced following CPT14 and subsequent testing showed stable signals.
Fugro Report No. N4808/16 (2) Text - Section B Page B2
© F
EBV/
CD
E/SP
E/00
1
ISSU
E 18
B.3 PRACTICE FOR CONE PENETRATION TEST TEST CONTROL – PENETRATION General Procedure: Refer to document titled “Cone Penetration Test”
(Fugro ref. FEBV/CDE/APP/001), presented in Appendix 1 Metrological Confirmation: Refer to document titled “Metrological Confirmation System for In-situ
Test” (Fugro ref. FEBV/GEN/APP/001), presented in Appendix 1 Target Accuracy Class: Class 3, refer to document titled “Cone Penetration Test”
(Fugro ref. FEBV/CDE/APP/001), presented in Appendix 1 Set-up Stage: − Location as directed by Client
− Cone penetrometer selected as directed by Client and in liaison with Fugro
Test Stage: Refer to document titled “Geotechnical Borehole” (Fugro ref. FEBV/CDE/APP/002)
Test Termination: Refer to document titled “Cone Penetration Test” (Fugro ref. FEBV/CDE/APP/001), presented in Appendix 1
Drill-Out: Refer to document titled “Geotechnical Borehole” (Fugro ref. FEBV/CDE/APP/002), presented in Appendix 1
CPT APPARATUS Thrust Machine: WISON wireline hydraulic jacking unit, nominal 100 kN thrust capacity,
3 m stroke
Reaction Equipment: Self-weight of drill pipes, drill collars and SEACLAM seabed frame Push Rods: 36 mm OD, 3.0 m stroke Penetrometer Type: F5CKEW2/V piezo-cone penetrometer, 50 kN load sensors (100 kN for
overloading), 15 MPa pressure sensor, HDPE filter in cylindrical extension above base of cone, with non-directional inclinometer, 1,000 mm2 cone base area, 15,000 mm2 sleeve area, net area ratio of 0.75
DATA ACQUISITION AND PROCESSING Data recording – Penetration: − Digital, manual and computer software control
− Logging frequency of 1 Hz
Depth Correction for Penetrometer Inclination:
Not applicable
Graphical Display: No display of data outside of chart limits, except where shown otherwise
Fugro Report No. N4808/16 (2) Text - Section B Page B3
© F
EBV/
CD
E/SP
E/00
1
ISSU
E 18
Graphical Scales – Penetration Data:
At original A4 paper size: − Axis for depth z: 10 mm = 1 m − Axis for cone resistance qc, corrected cone resistance qt and net
cone resistance qn: 10 mm = 2 MPa − Axis for sleeve friction fs: 10 mm = 50 kPa − Axis for friction ratio Rf: 10 mm = 2% − Axis for pore pressure u: 10 mm = 1 MPa − Axis for pore pressure ratio Bq: 10 mm = 1
Parameter Values for Data Processing:
Refer to plate titled “Parameter Values for Net Cone Resistance Calculation”
REFERENCES Computer Program UNIPLOT, Processing of CPT data
.0 .5 1.0 1.5 2.0 2.5 3.0 3.5 4.0 4.5 5.0 5.5 6.0 6.5 7.0 7.5 8.0 8.5Cone Resistance, qc [MPa]
0
1
2
3
4
5
6
7
8
9
10
11
12
13
14
15
Dep
th B
elow
Sea
floor
[m]
Peak qc
.000 .013 .025 .038 .050 .063 .075 .088 .100 .113 .125 .138 .150 .163 .175 .188 .200 .213Sleeve Friction, fs [MPa]
-1 0 1 2 3 4 5Pore Pressure, u2 [MPa]
Fugro Report N
o.N
4808/16 (2)P
lateB
1
Date Of Testing : 01-Jan-2008Water Depth [m] : 76.50Coordinates (AGD84) [m] : E445663.9 N5516756.2
CONE PENETRATION TEST PEEJAY-1_01
PEEJAY-1 JACK-UP SITE INVESTIGATION - BASS STRAIT, OFFSHORE AUSTRALIA
UNIPLOT 05.02.nl / Wison qc-1cm=0.5MPa A4.ucf / 2008-02-27 14:14:15
CPT
01C
PT02
CPT
03C
PT04
CPT
05C
PT06
.0 .5 1.0 1.5 2.0 2.5 3.0 3.5 4.0 4.5 5.0 5.5 6.0 6.5 7.0 7.5 8.0 8.5Cone Resistance, qc [MPa]
15
16
17
18
19
20
21
22
23
24
25
26
27
28
29
30
Dep
th B
elow
Sea
floor
[m]
Peak qc
.000 .013 .025 .038 .050 .063 .075 .088 .100 .113 .125 .138 .150 .163 .175 .188 .200 .213Sleeve Friction, fs [MPa]
-1 0 1 2 3 4 5Pore Pressure, u2 [MPa]
Fugro Report N
o.N
4808/16 (2)P
lateB
2
Date Of Testing : 01-Jan-2008Water Depth [m] : 76.50Coordinates (AGD84) [m] : E445663.9 N5516756.2
CONE PENETRATION TEST PEEJAY-1_01
PEEJAY-1 JACK-UP SITE INVESTIGATION - BASS STRAIT, OFFSHORE AUSTRALIA
UNIPLOT 05.02.nl / Wison qc-1cm=0.5MPa A4.ucf / 2008-02-27 14:14:15
CPT
06C
PT07
CPT
08C
PT09
CPT
10C
PT11
.0 .5 1.0 1.5 2.0 2.5 3.0 3.5 4.0 4.5 5.0 5.5 6.0 6.5 7.0 7.5 8.0 8.5Cone Resistance, qc [MPa]
30
31
32
33
34
35
36
37
38
39
40
41
42
43
44
45
Dep
th B
elow
Sea
floor
[m]
Peak qc
.000 .013 .025 .038 .050 .063 .075 .088 .100 .113 .125 .138 .150 .163 .175 .188 .200 .213Sleeve Friction, fs [MPa]
-1 0 1 2 3 4 5Pore Pressure, u2 [MPa]
Fugro Report N
o.N
4808/16 (2)P
lateB
3
Date Of Testing : 02-Jan-2008Water Depth [m] : 76.50Coordinates (AGD84) [m] : E445663.9 N5516756.2
CONE PENETRATION TEST PEEJAY-1_01
PEEJAY-1 JACK-UP SITE INVESTIGATION - BASS STRAIT, OFFSHORE AUSTRALIA
UNIPLOT 05.02.nl / Wison qc-1cm=0.5MPa A4.ucf / 2008-02-27 14:14:16
CPT
11C
PT12
CPT
13C
PT14
CPT
15C
PT16
.0 .5 1.0 1.5 2.0 2.5 3.0 3.5 4.0 4.5 5.0 5.5 6.0 6.5 7.0 7.5 8.0 8.5Cone Resistance, qc [MPa]
45
46
47
48
49
50
51
52
53
54
55
56
57
58
59
60
Dep
th B
elow
Sea
floor
[m]
Peak qc
.000 .013 .025 .038 .050 .063 .075 .088 .100 .113 .125 .138 .150 .163 .175 .188 .200 .213Sleeve Friction, fs [MPa]
-1 0 1 2 3 4 5Pore Pressure, u2 [MPa]
Fugro Report N
o.N
4808/16 (2)P
lateB
4
Date Of Testing : 02-Jan-2008Water Depth [m] : 76.50Coordinates (AGD84) [m] : E445663.9 N5516756.2
CONE PENETRATION TEST PEEJAY-1_01
PEEJAY-1 JACK-UP SITE INVESTIGATION - BASS STRAIT, OFFSHORE AUSTRALIA
UNIPLOT 05.02.nl / Wison qc-1cm=0.5MPa A4.ucf / 2008-02-27 14:14:16
CPT
16C
PT17
CPT
18C
PT19
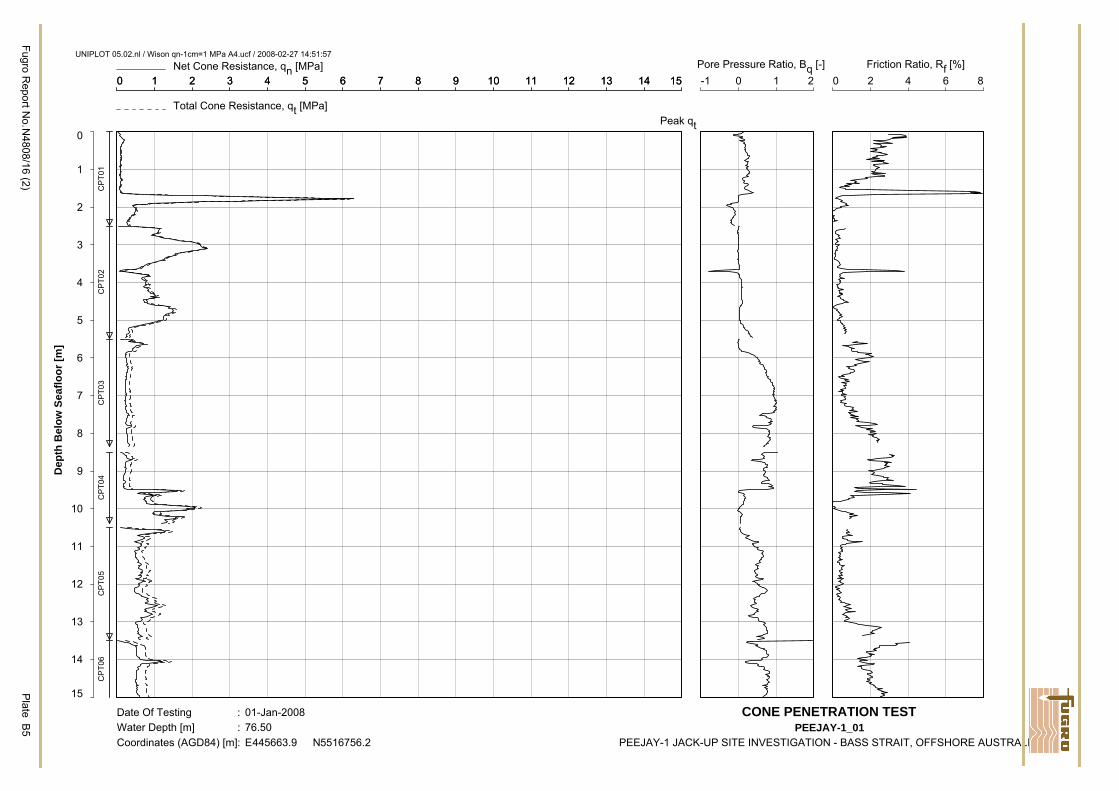
0 1 2 3 4 5 6 7 8 9 10 11 12 13 14 15Net Cone Resistance, qn [MPa]
0
1
2
3
4
5
6
7
8
9
10
11
12
13
14
15
Dep
th B
elow
Sea
floor
[m]
0 1 2 3 4 5 6 7 8 9 10 11 12 13 14 15
Total Cone Resistance, qt [MPa]Peak qt
-1 0 1 2Pore Pressure Ratio, Bq [-]
0 2 4 6 8Friction Ratio, Rf [%]
Fugro Report N
o.N4808/16 (2)
Plate
B5
Date Of Testing : 01-Jan-2008Water Depth [m] : 76.50Coordinates (AGD84) [m] : E445663.9 N5516756.2
CONE PENETRATION TESTPEEJAY-1_01
PEEJAY-1 JACK-UP SITE INVESTIGATION - BASS STRAIT, OFFSHORE AUSTRALIA
UNIPLOT 05.02.nl / Wison qn-1cm=1 MPa A4.ucf / 2008-02-27 14:51:57
CPT
01C
PT02
CPT
03C
PT04
CPT
05C
PT06
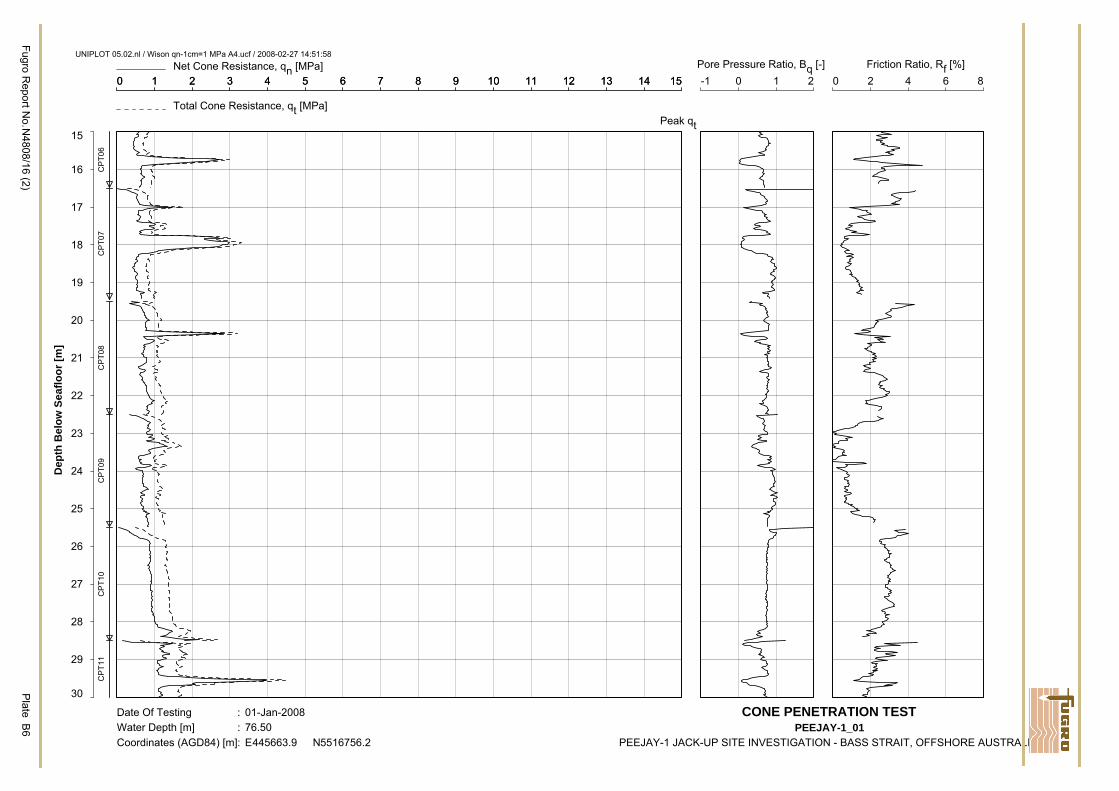
0 1 2 3 4 5 6 7 8 9 10 11 12 13 14 15Net Cone Resistance, qn [MPa]
15
16
17
18
19
20
21
22
23
24
25
26
27
28
29
30
Dep
th B
elow
Sea
floor
[m]
0 1 2 3 4 5 6 7 8 9 10 11 12 13 14 15
Total Cone Resistance, qt [MPa]Peak qt
-1 0 1 2Pore Pressure Ratio, Bq [-]
0 2 4 6 8Friction Ratio, Rf [%]
Fugro Report N
o.N4808/16 (2)
Plate
B6
Date Of Testing : 01-Jan-2008Water Depth [m] : 76.50Coordinates (AGD84) [m] : E445663.9 N5516756.2
CONE PENETRATION TESTPEEJAY-1_01
PEEJAY-1 JACK-UP SITE INVESTIGATION - BASS STRAIT, OFFSHORE AUSTRALIA
UNIPLOT 05.02.nl / Wison qn-1cm=1 MPa A4.ucf / 2008-02-27 14:51:58
CPT
06C
PT07
CPT
08C
PT09
CPT
10C
PT11
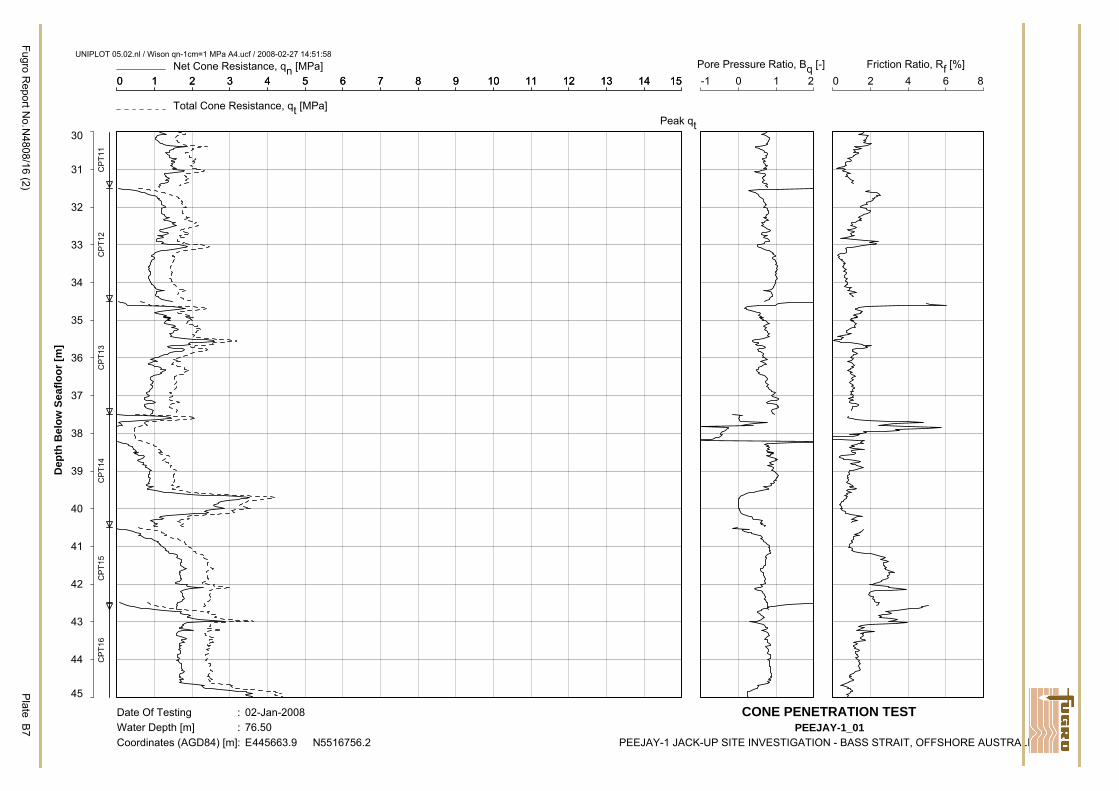
0 1 2 3 4 5 6 7 8 9 10 11 12 13 14 15Net Cone Resistance, qn [MPa]
30
31
32
33
34
35
36
37
38
39
40
41
42
43
44
45
Dep
th B
elow
Sea
floor
[m]
0 1 2 3 4 5 6 7 8 9 10 11 12 13 14 15
Total Cone Resistance, qt [MPa]Peak qt
-1 0 1 2Pore Pressure Ratio, Bq [-]
0 2 4 6 8Friction Ratio, Rf [%]
Fugro Report N
o.N4808/16 (2)
Plate
B7
Date Of Testing : 02-Jan-2008Water Depth [m] : 76.50Coordinates (AGD84) [m] : E445663.9 N5516756.2
CONE PENETRATION TESTPEEJAY-1_01
PEEJAY-1 JACK-UP SITE INVESTIGATION - BASS STRAIT, OFFSHORE AUSTRALIA
UNIPLOT 05.02.nl / Wison qn-1cm=1 MPa A4.ucf / 2008-02-27 14:51:58
CPT
11C
PT12
CPT
13C
PT14
CPT
15C
PT16
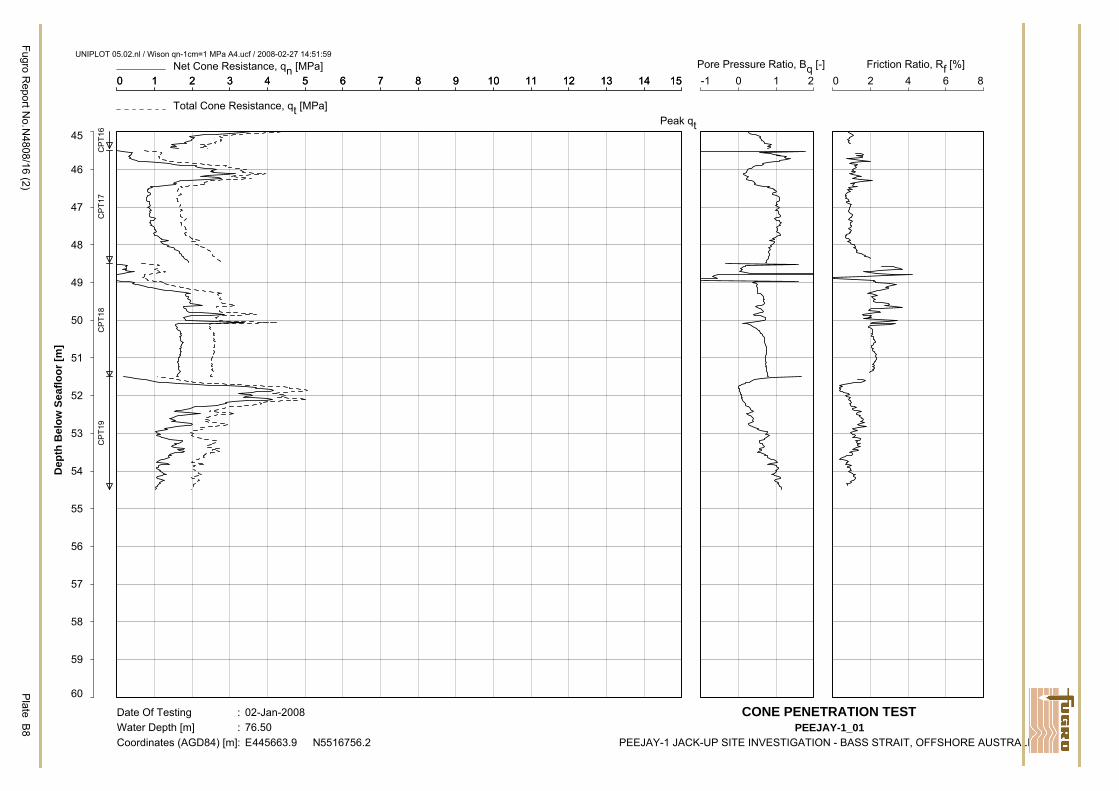
0 1 2 3 4 5 6 7 8 9 10 11 12 13 14 15Net Cone Resistance, qn [MPa]
45
46
47
48
49
50
51
52
53
54
55
56
57
58
59
60
Dep
th B
elow
Sea
floor
[m]
0 1 2 3 4 5 6 7 8 9 10 11 12 13 14 15
Total Cone Resistance, qt [MPa]Peak qt
-1 0 1 2Pore Pressure Ratio, Bq [-]
0 2 4 6 8Friction Ratio, Rf [%]
Fugro Report N
o.N4808/16 (2)
Plate
B8
Date Of Testing : 02-Jan-2008Water Depth [m] : 76.50Coordinates (AGD84) [m] : E445663.9 N5516756.2
CONE PENETRATION TESTPEEJAY-1_01
PEEJAY-1 JACK-UP SITE INVESTIGATION - BASS STRAIT, OFFSHORE AUSTRALIA
UNIPLOT 05.02.nl / Wison qn-1cm=1 MPa A4.ucf / 2008-02-27 14:51:59
CPT
16C
PT17
CPT
18C
PT19

Borehole/Location
DepthRange
[m]
Unit Weight γ
Ground
[kN/m3]
Ground Water
[kN/m3]
Net Area Ratio
a
[-]
Pore Pressure AdjustmentFactor K
[-]
Note:1. The adjustment factor K applies only to probes with a pore pressure filter in the face of the cone.
PARAMETER VALUES FOR NET CONE RESISTANCE CALCULATIONPEEJAY-1 JACK-UP SITE INVESTIGATION - BASS STRAIT, OFFSHORE AUSTRALIA
Fugro Report No.N4808/16 (2) Plate B9
UN
IPLO
T 04
.09.
nl/Q
aQc_
04 W
IS_T
B18
.cm
d/20
08-0
2-25
10:
30:2
5
PEEJAY-1_01 0.00 to 1.601.60 to 5.905.90 to 9.609.60 to 10.80
10.80 to 23.5023.50 to 25.2025.20 to 28.4028.40 to 39.6039.60 to 40.2040.20 to 41.2041.20 to 46.6046.60 to 48.6048.60 to 51.4051.40 to 54.5054.50
17.0017.0017.0017.5017.0017.0017.0017.5017.0017.5018.0018.0018.5018.5018.50
10.0010.0010.0010.0010.0010.0010.0010.0010.0010.0010.0010.0010.0010.0010.00
0.750 ---
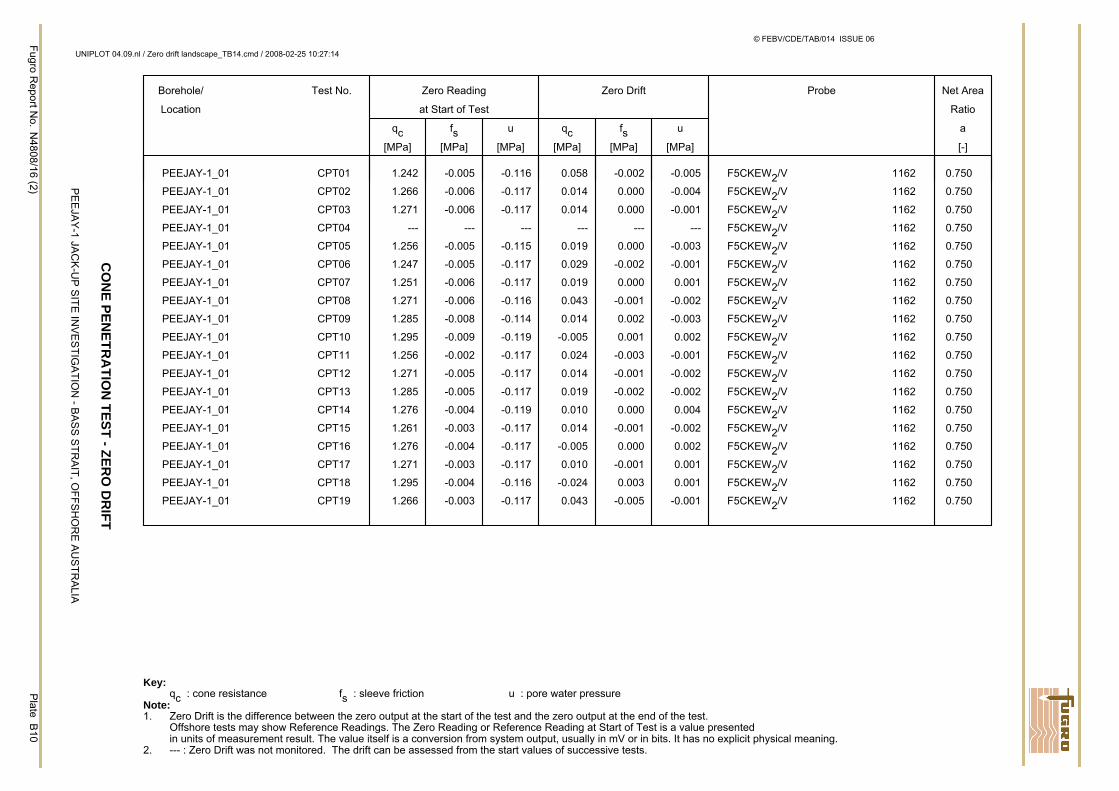
Borehole/
Location
Test No. Zero Reading
at Start of Test
qc[MPa]
fs[MPa]
u
[MPa]
Zero Drift
qc[MPa]
fs[MPa]
u
[MPa]
Probe Net Area
Ratio
a
[-]
Key:qc : cone resistance fs : sleeve friction u : pore water pressure
Note:1. Zero Drift is the difference between the zero output at the start of the test and the zero output at the end of the test.
Offshore tests may show Reference Readings. The Zero Reading or Reference Reading at Start of Test is a value presentedin units of measurement result. The value itself is a conversion from system output, usually in mV or in bits. It has no explicit physical meaning.
2. --- : Zero Drift was not monitored. The drift can be assessed from the start values of successive tests.
CO
NE PEN
ETRA
TION
TEST - ZERO
DR
IFT
PE
EJA
Y-1 JA
CK
-UP
SITE
INV
ES
TIGA
TION
- BA
SS
STR
AIT, O
FFSH
OR
E A
US
TRA
LIA
Fugro Report N
o.N
4808/16 (2)P
lateB
10
© FEBV/CDE/TAB/014 ISSUE 06
UNIPLOT 04.09.nl / Zero drift landscape_TB14.cmd / 2008-02-25 10:27:14
PEEJAY-1_01 CPT01 1.242 -0.005 -0.116 0.058 -0.002 -0.005 F5CKEW2/V 1162 0.750
PEEJAY-1_01 CPT02 1.266 -0.006 -0.117 0.014 0.000 -0.004 F5CKEW2/V 1162 0.750
PEEJAY-1_01 CPT03 1.271 -0.006 -0.117 0.014 0.000 -0.001 F5CKEW2/V 1162 0.750
PEEJAY-1_01 CPT04 --- --- --- --- --- --- F5CKEW2/V 1162 0.750
PEEJAY-1_01 CPT05 1.256 -0.005 -0.115 0.019 0.000 -0.003 F5CKEW2/V 1162 0.750
PEEJAY-1_01 CPT06 1.247 -0.005 -0.117 0.029 -0.002 -0.001 F5CKEW2/V 1162 0.750
PEEJAY-1_01 CPT07 1.251 -0.006 -0.117 0.019 0.000 0.001 F5CKEW2/V 1162 0.750
PEEJAY-1_01 CPT08 1.271 -0.006 -0.116 0.043 -0.001 -0.002 F5CKEW2/V 1162 0.750
PEEJAY-1_01 CPT09 1.285 -0.008 -0.114 0.014 0.002 -0.003 F5CKEW2/V 1162 0.750
PEEJAY-1_01 CPT10 1.295 -0.009 -0.119 -0.005 0.001 0.002 F5CKEW2/V 1162 0.750
PEEJAY-1_01 CPT11 1.256 -0.002 -0.117 0.024 -0.003 -0.001 F5CKEW2/V 1162 0.750
PEEJAY-1_01 CPT12 1.271 -0.005 -0.117 0.014 -0.001 -0.002 F5CKEW2/V 1162 0.750
PEEJAY-1_01 CPT13 1.285 -0.005 -0.117 0.019 -0.002 -0.002 F5CKEW2/V 1162 0.750
PEEJAY-1_01 CPT14 1.276 -0.004 -0.119 0.010 0.000 0.004 F5CKEW2/V 1162 0.750
PEEJAY-1_01 CPT15 1.261 -0.003 -0.117 0.014 -0.001 -0.002 F5CKEW2/V 1162 0.750
PEEJAY-1_01 CPT16 1.276 -0.004 -0.117 -0.005 0.000 0.002 F5CKEW2/V 1162 0.750
PEEJAY-1_01 CPT17 1.271 -0.003 -0.117 0.010 -0.001 0.001 F5CKEW2/V 1162 0.750
PEEJAY-1_01 CPT18 1.295 -0.004 -0.116 -0.024 0.003 0.001 F5CKEW2/V 1162 0.750
PEEJAY-1_01 CPT19 1.266 -0.003 -0.117 0.043 -0.005 -0.001 F5CKEW2/V 1162 0.750
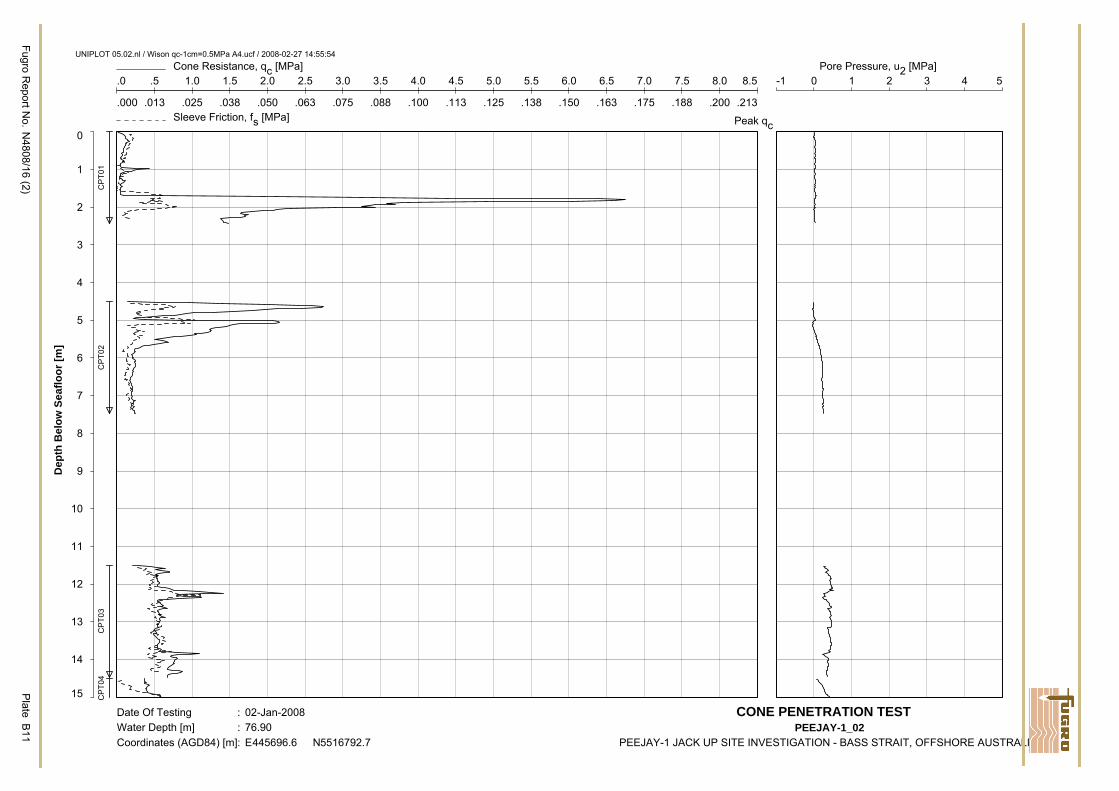
.0 .5 1.0 1.5 2.0 2.5 3.0 3.5 4.0 4.5 5.0 5.5 6.0 6.5 7.0 7.5 8.0 8.5Cone Resistance, qc [MPa]
0
1
2
3
4
5
6
7
8
9
10
11
12
13
14
15
Dep
th B
elow
Sea
floor
[m]
Peak qc
.000 .013 .025 .038 .050 .063 .075 .088 .100 .113 .125 .138 .150 .163 .175 .188 .200 .213Sleeve Friction, fs [MPa]
-1 0 1 2 3 4 5Pore Pressure, u2 [MPa]
Fugro Report N
o.N
4808/16 (2)P
lateB
11
Date Of Testing : 02-Jan-2008Water Depth [m] : 76.90Coordinates (AGD84) [m] : E445696.6 N5516792.7
CONE PENETRATION TEST PEEJAY-1_02
PEEJAY-1 JACK UP SITE INVESTIGATION - BASS STRAIT, OFFSHORE AUSTRALIA
UNIPLOT 05.02.nl / Wison qc-1cm=0.5MPa A4.ucf / 2008-02-27 14:55:54
CPT
01C
PT02
CPT
03C
PT04
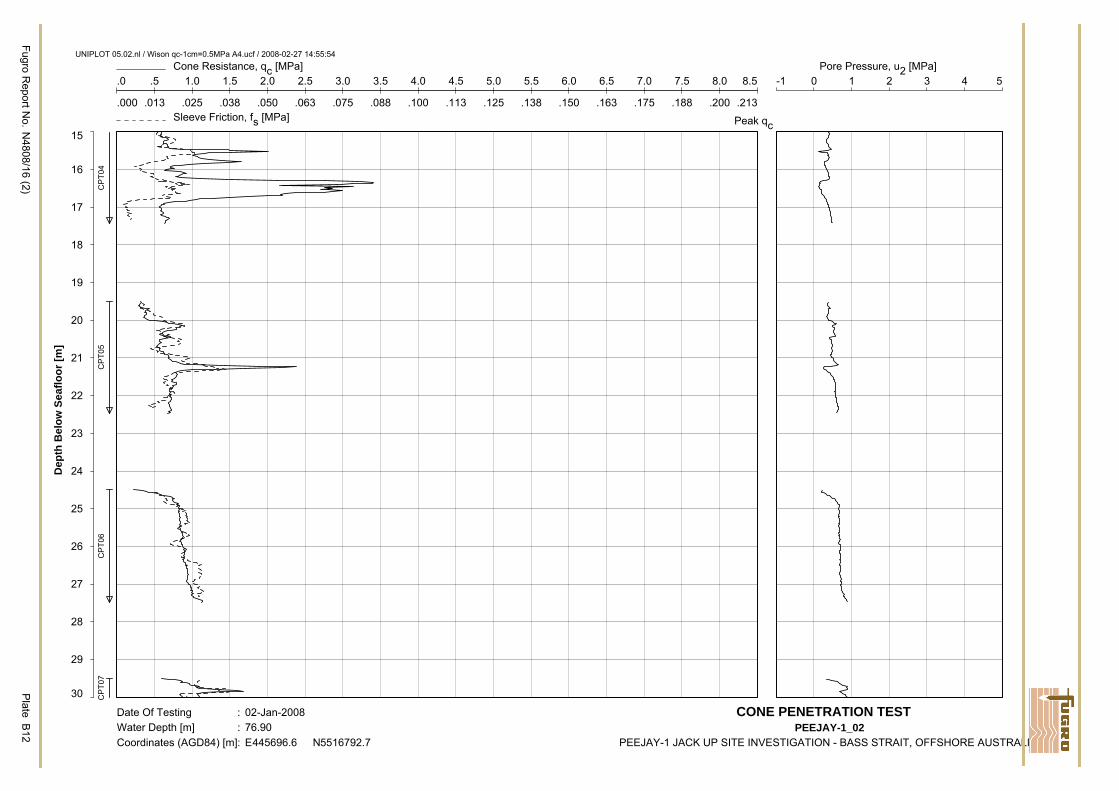
.0 .5 1.0 1.5 2.0 2.5 3.0 3.5 4.0 4.5 5.0 5.5 6.0 6.5 7.0 7.5 8.0 8.5Cone Resistance, qc [MPa]
15
16
17
18
19
20
21
22
23
24
25
26
27
28
29
30
Dep
th B
elow
Sea
floor
[m]
Peak qc
.000 .013 .025 .038 .050 .063 .075 .088 .100 .113 .125 .138 .150 .163 .175 .188 .200 .213Sleeve Friction, fs [MPa]
-1 0 1 2 3 4 5Pore Pressure, u2 [MPa]
Fugro Report N
o.N
4808/16 (2)P
lateB
12
Date Of Testing : 02-Jan-2008Water Depth [m] : 76.90Coordinates (AGD84) [m] : E445696.6 N5516792.7
CONE PENETRATION TEST PEEJAY-1_02
PEEJAY-1 JACK UP SITE INVESTIGATION - BASS STRAIT, OFFSHORE AUSTRALIA
UNIPLOT 05.02.nl / Wison qc-1cm=0.5MPa A4.ucf / 2008-02-27 14:55:54
CPT
04C
PT05
CPT
06C
PT07
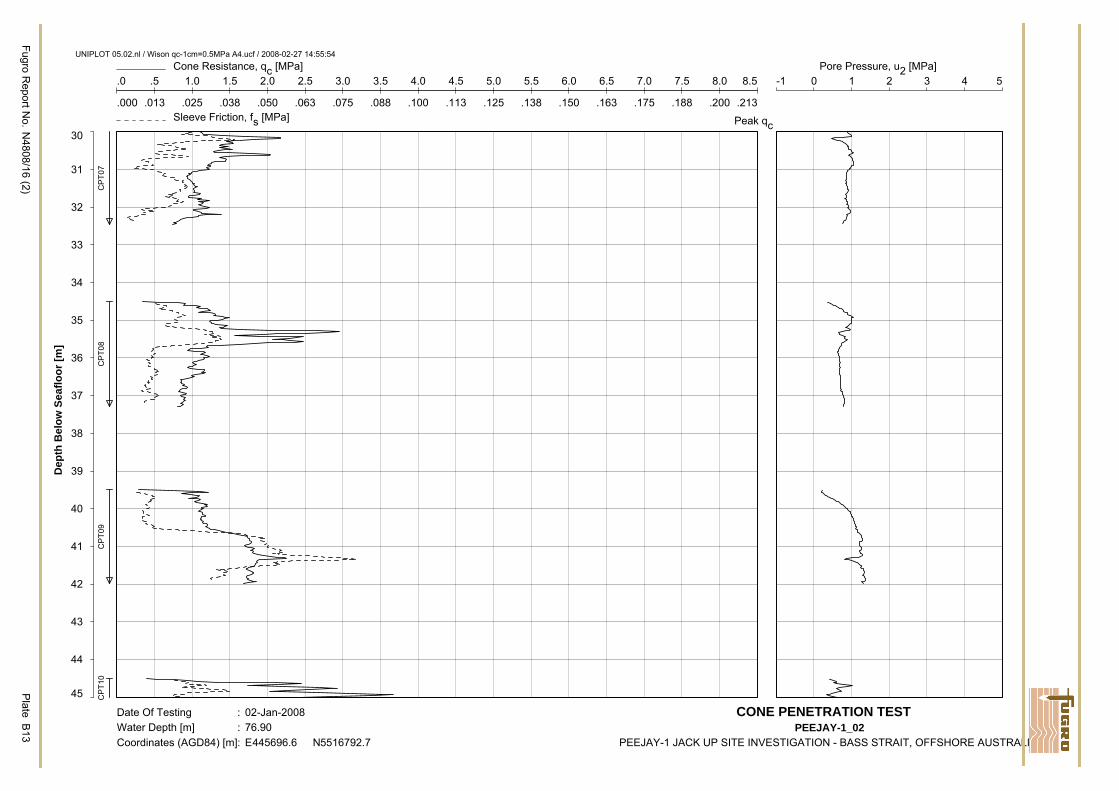
.0 .5 1.0 1.5 2.0 2.5 3.0 3.5 4.0 4.5 5.0 5.5 6.0 6.5 7.0 7.5 8.0 8.5Cone Resistance, qc [MPa]
30
31
32
33
34
35
36
37
38
39
40
41
42
43
44
45
Dep
th B
elow
Sea
floor
[m]
Peak qc
.000 .013 .025 .038 .050 .063 .075 .088 .100 .113 .125 .138 .150 .163 .175 .188 .200 .213Sleeve Friction, fs [MPa]
-1 0 1 2 3 4 5Pore Pressure, u2 [MPa]
Fugro Report N
o.N
4808/16 (2)P
lateB
13
Date Of Testing : 02-Jan-2008Water Depth [m] : 76.90Coordinates (AGD84) [m] : E445696.6 N5516792.7
CONE PENETRATION TEST PEEJAY-1_02
PEEJAY-1 JACK UP SITE INVESTIGATION - BASS STRAIT, OFFSHORE AUSTRALIA
UNIPLOT 05.02.nl / Wison qc-1cm=0.5MPa A4.ucf / 2008-02-27 14:55:54
CPT
07C
PT08
CPT
09C
PT10
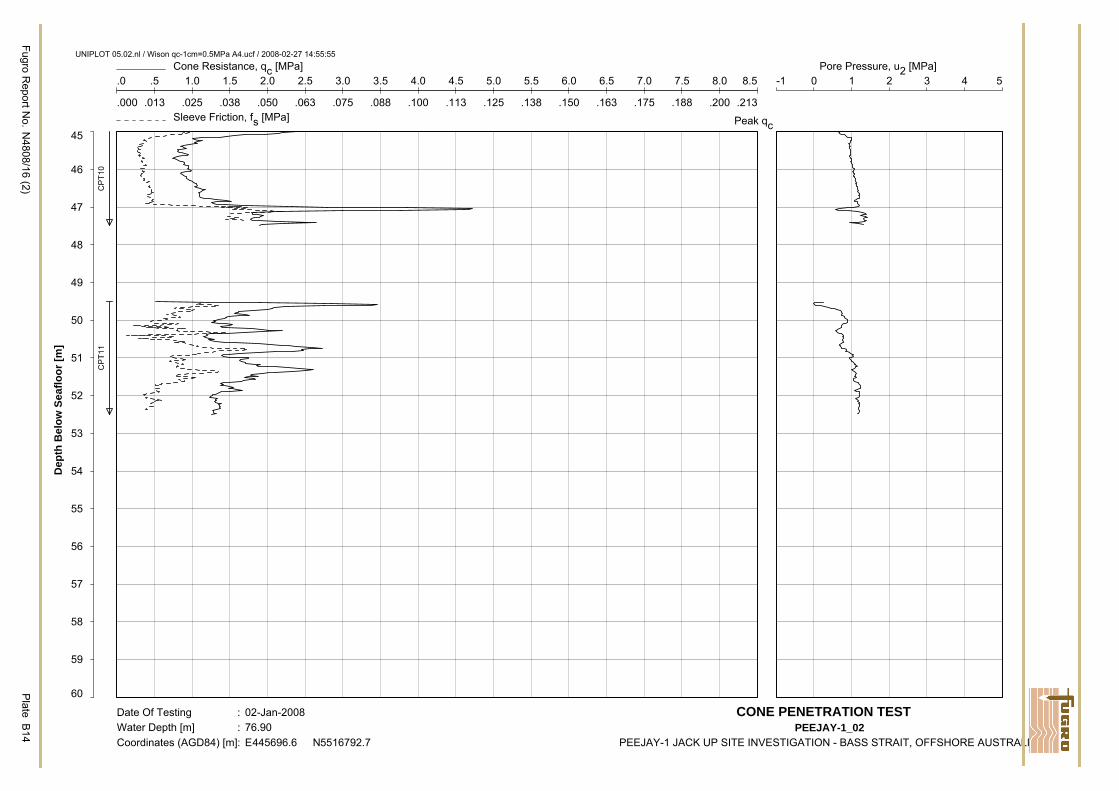
.0 .5 1.0 1.5 2.0 2.5 3.0 3.5 4.0 4.5 5.0 5.5 6.0 6.5 7.0 7.5 8.0 8.5Cone Resistance, qc [MPa]
45
46
47
48
49
50
51
52
53
54
55
56
57
58
59
60
Dep
th B
elow
Sea
floor
[m]
Peak qc
.000 .013 .025 .038 .050 .063 .075 .088 .100 .113 .125 .138 .150 .163 .175 .188 .200 .213Sleeve Friction, fs [MPa]
-1 0 1 2 3 4 5Pore Pressure, u2 [MPa]
Fugro Report N
o.N
4808/16 (2)P
lateB
14
Date Of Testing : 02-Jan-2008Water Depth [m] : 76.90Coordinates (AGD84) [m] : E445696.6 N5516792.7
CONE PENETRATION TEST PEEJAY-1_02
PEEJAY-1 JACK UP SITE INVESTIGATION - BASS STRAIT, OFFSHORE AUSTRALIA
UNIPLOT 05.02.nl / Wison qc-1cm=0.5MPa A4.ucf / 2008-02-27 14:55:55
CPT
10C
PT11
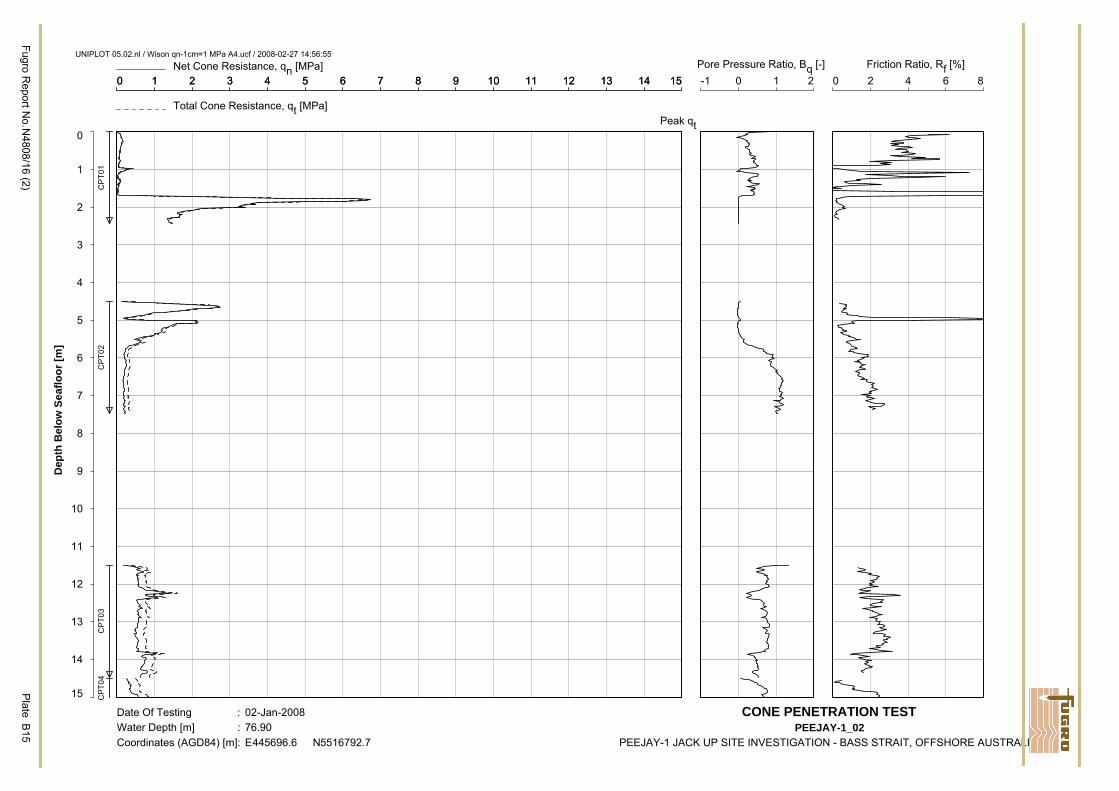
0 1 2 3 4 5 6 7 8 9 10 11 12 13 14 15Net Cone Resistance, qn [MPa]
0
1
2
3
4
5
6
7
8
9
10
11
12
13
14
15
Dep
th B
elow
Sea
floor
[m]
0 1 2 3 4 5 6 7 8 9 10 11 12 13 14 15
Total Cone Resistance, qt [MPa]Peak qt
-1 0 1 2Pore Pressure Ratio, Bq [-]
0 2 4 6 8Friction Ratio, Rf [%]
Fugro Report N
o.N4808/16 (2)
Plate
B15
Date Of Testing : 02-Jan-2008Water Depth [m] : 76.90Coordinates (AGD84) [m] : E445696.6 N5516792.7
CONE PENETRATION TESTPEEJAY-1_02
PEEJAY-1 JACK UP SITE INVESTIGATION - BASS STRAIT, OFFSHORE AUSTRALIA
UNIPLOT 05.02.nl / Wison qn-1cm=1 MPa A4.ucf / 2008-02-27 14:56:55
CPT
01C
PT02
CPT
03C
PT04
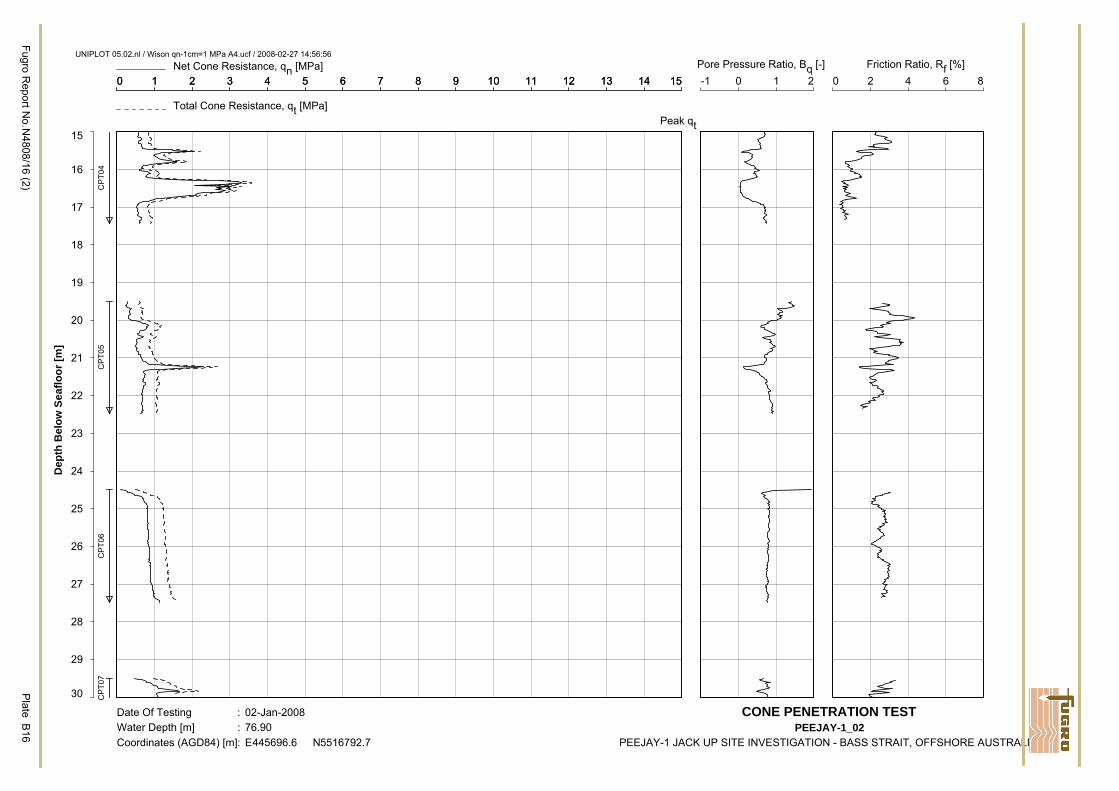
0 1 2 3 4 5 6 7 8 9 10 11 12 13 14 15Net Cone Resistance, qn [MPa]
15
16
17
18
19
20
21
22
23
24
25
26
27
28
29
30
Dep
th B
elow
Sea
floor
[m]
0 1 2 3 4 5 6 7 8 9 10 11 12 13 14 15
Total Cone Resistance, qt [MPa]Peak qt
-1 0 1 2Pore Pressure Ratio, Bq [-]
0 2 4 6 8Friction Ratio, Rf [%]
Fugro Report N
o.N4808/16 (2)
Plate
B16
Date Of Testing : 02-Jan-2008Water Depth [m] : 76.90Coordinates (AGD84) [m] : E445696.6 N5516792.7
CONE PENETRATION TESTPEEJAY-1_02
PEEJAY-1 JACK UP SITE INVESTIGATION - BASS STRAIT, OFFSHORE AUSTRALIA
UNIPLOT 05.02.nl / Wison qn-1cm=1 MPa A4.ucf / 2008-02-27 14:56:56
CPT
04C
PT05
CPT
06C
PT07
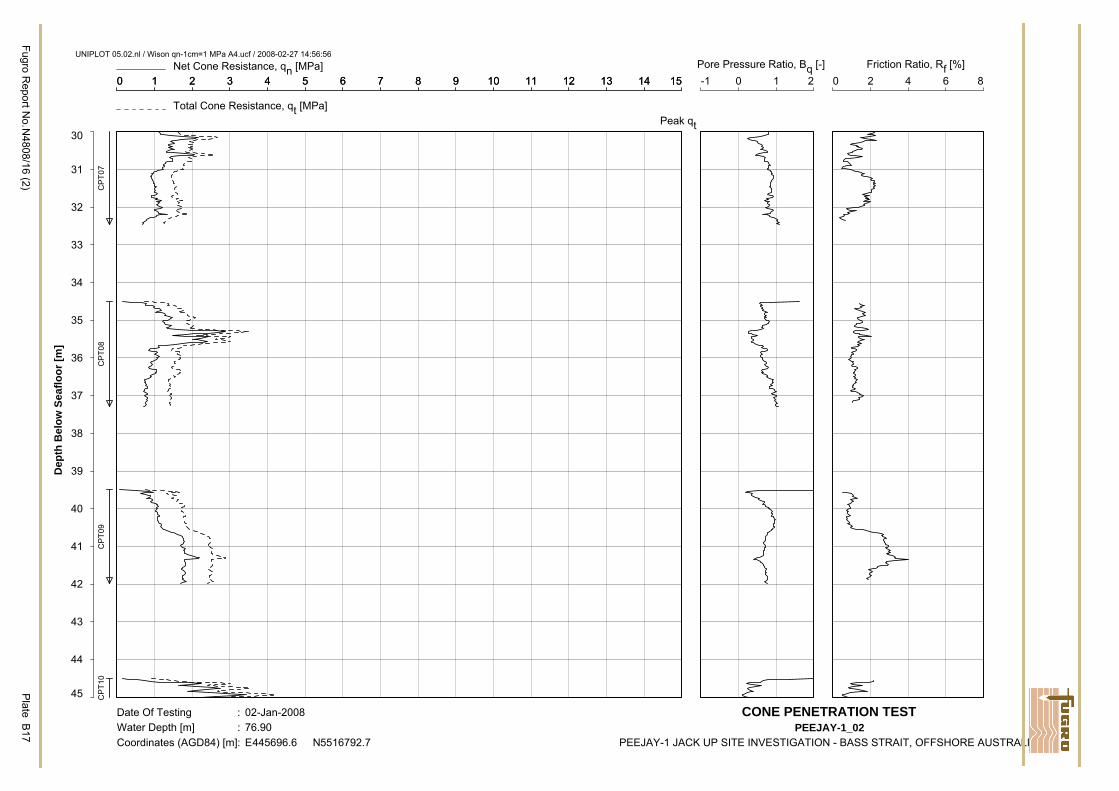
0 1 2 3 4 5 6 7 8 9 10 11 12 13 14 15Net Cone Resistance, qn [MPa]
30
31
32
33
34
35
36
37
38
39
40
41
42
43
44
45
Dep
th B
elow
Sea
floor
[m]
0 1 2 3 4 5 6 7 8 9 10 11 12 13 14 15
Total Cone Resistance, qt [MPa]Peak qt
-1 0 1 2Pore Pressure Ratio, Bq [-]
0 2 4 6 8Friction Ratio, Rf [%]
Fugro Report N
o.N4808/16 (2)
Plate
B17
Date Of Testing : 02-Jan-2008Water Depth [m] : 76.90Coordinates (AGD84) [m] : E445696.6 N5516792.7
CONE PENETRATION TESTPEEJAY-1_02
PEEJAY-1 JACK UP SITE INVESTIGATION - BASS STRAIT, OFFSHORE AUSTRALIA
UNIPLOT 05.02.nl / Wison qn-1cm=1 MPa A4.ucf / 2008-02-27 14:56:56
CPT
07C
PT08
CPT
09C
PT10
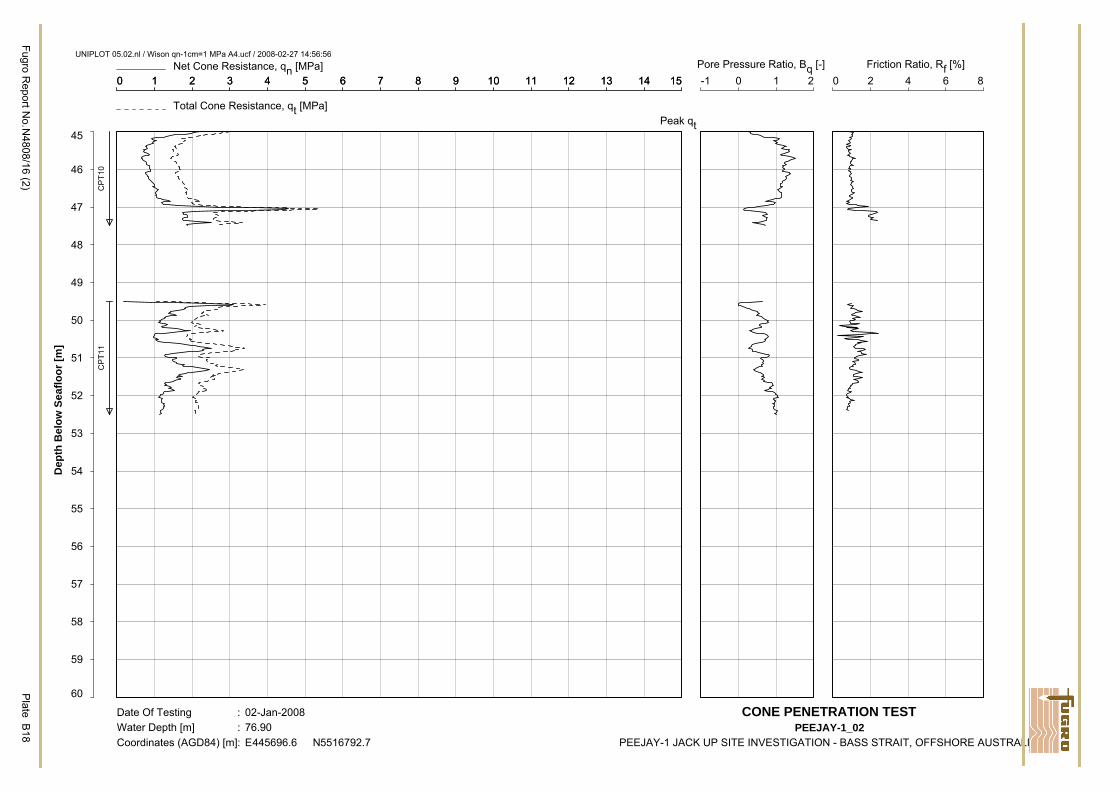
0 1 2 3 4 5 6 7 8 9 10 11 12 13 14 15Net Cone Resistance, qn [MPa]
45
46
47
48
49
50
51
52
53
54
55
56
57
58
59
60
Dep
th B
elow
Sea
floor
[m]
0 1 2 3 4 5 6 7 8 9 10 11 12 13 14 15
Total Cone Resistance, qt [MPa]Peak qt
-1 0 1 2Pore Pressure Ratio, Bq [-]
0 2 4 6 8Friction Ratio, Rf [%]
Fugro Report N
o.N4808/16 (2)
Plate
B18
Date Of Testing : 02-Jan-2008Water Depth [m] : 76.90Coordinates (AGD84) [m] : E445696.6 N5516792.7
CONE PENETRATION TESTPEEJAY-1_02
PEEJAY-1 JACK UP SITE INVESTIGATION - BASS STRAIT, OFFSHORE AUSTRALIA
UNIPLOT 05.02.nl / Wison qn-1cm=1 MPa A4.ucf / 2008-02-27 14:56:56
CPT
10C
PT11
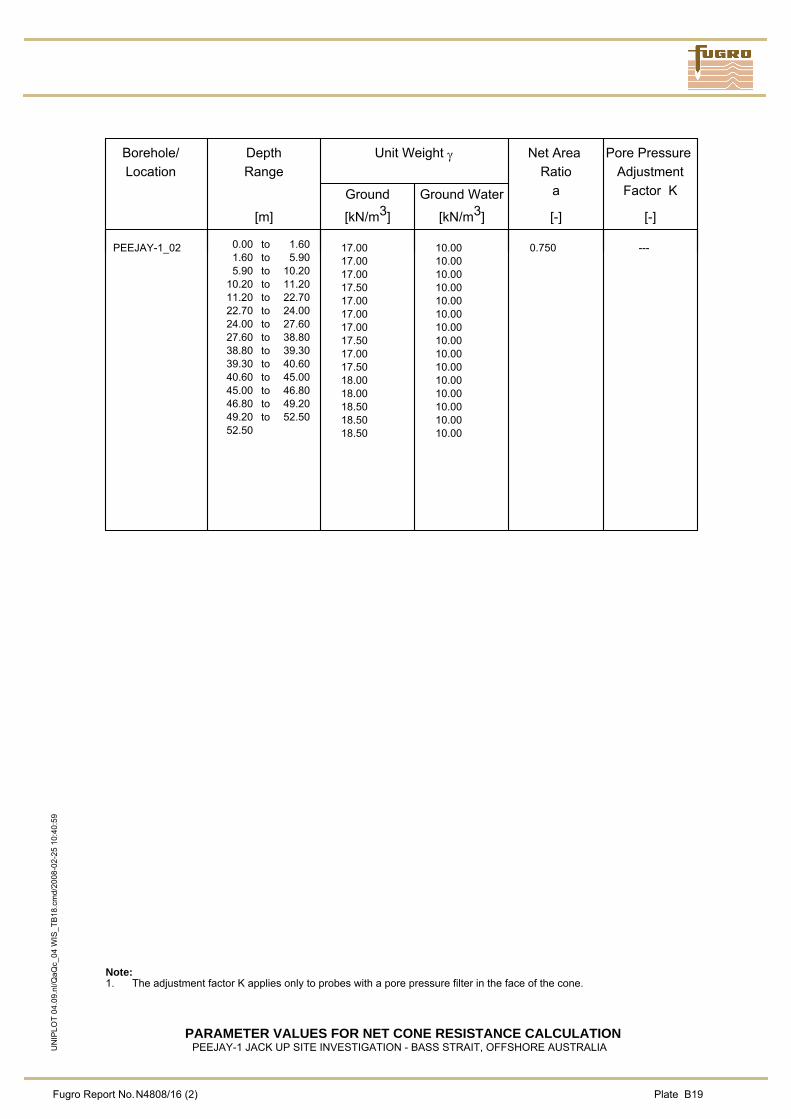
Borehole/Location
DepthRange
[m]
Unit Weight γ
Ground
[kN/m3]
Ground Water
[kN/m3]
Net Area Ratio
a
[-]
Pore Pressure AdjustmentFactor K
[-]
Note:1. The adjustment factor K applies only to probes with a pore pressure filter in the face of the cone.
PARAMETER VALUES FOR NET CONE RESISTANCE CALCULATIONPEEJAY-1 JACK UP SITE INVESTIGATION - BASS STRAIT, OFFSHORE AUSTRALIA
Fugro Report No.N4808/16 (2) Plate B19
UN
IPLO
T 04
.09.
nl/Q
aQc_
04 W
IS_T
B18
.cm
d/20
08-0
2-25
10:
40:5
9
PEEJAY-1_02 0.00 to 1.601.60 to 5.905.90 to 10.20
10.20 to 11.2011.20 to 22.7022.70 to 24.0024.00 to 27.6027.60 to 38.8038.80 to 39.3039.30 to 40.6040.60 to 45.0045.00 to 46.8046.80 to 49.2049.20 to 52.5052.50
17.0017.0017.0017.5017.0017.0017.0017.5017.0017.5018.0018.0018.5018.5018.50
10.0010.0010.0010.0010.0010.0010.0010.0010.0010.0010.0010.0010.0010.0010.00
0.750 ---
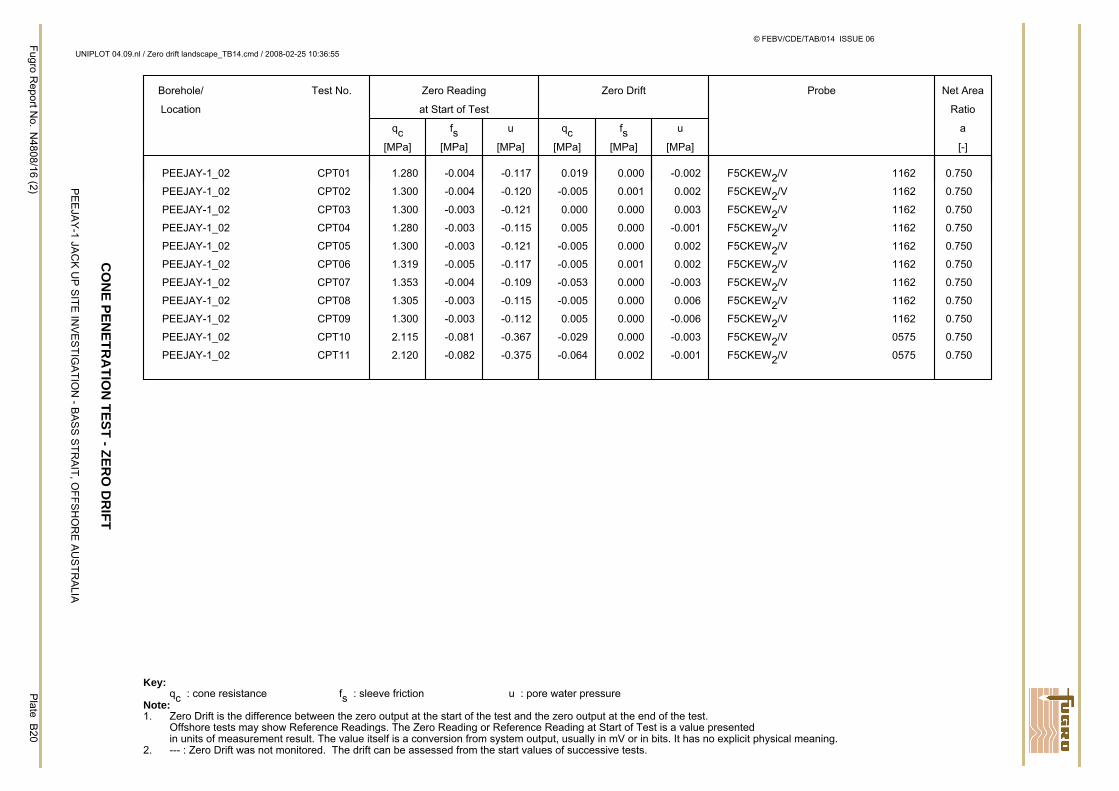
Borehole/
Location
Test No. Zero Reading
at Start of Test
qc[MPa]
fs[MPa]
u
[MPa]
Zero Drift
qc[MPa]
fs[MPa]
u
[MPa]
Probe Net Area
Ratio
a
[-]
Key:qc : cone resistance fs : sleeve friction u : pore water pressure
Note:1. Zero Drift is the difference between the zero output at the start of the test and the zero output at the end of the test.
Offshore tests may show Reference Readings. The Zero Reading or Reference Reading at Start of Test is a value presentedin units of measurement result. The value itself is a conversion from system output, usually in mV or in bits. It has no explicit physical meaning.
2. --- : Zero Drift was not monitored. The drift can be assessed from the start values of successive tests.
CO
NE PEN
ETRA
TION
TEST - ZERO
DR
IFT
PE
EJA
Y-1 JA
CK
UP
SITE
INV
ES
TIGA
TION
- BA
SS
STR
AIT, O
FFSH
OR
E A
US
TRA
LIA
Fugro Report N
o.N
4808/16 (2)P
lateB
20
© FEBV/CDE/TAB/014 ISSUE 06
UNIPLOT 04.09.nl / Zero drift landscape_TB14.cmd / 2008-02-25 10:36:55
PEEJAY-1_02 CPT01 1.280 -0.004 -0.117 0.019 0.000 -0.002 F5CKEW2/V 1162 0.750
PEEJAY-1_02 CPT02 1.300 -0.004 -0.120 -0.005 0.001 0.002 F5CKEW2/V 1162 0.750
PEEJAY-1_02 CPT03 1.300 -0.003 -0.121 0.000 0.000 0.003 F5CKEW2/V 1162 0.750
PEEJAY-1_02 CPT04 1.280 -0.003 -0.115 0.005 0.000 -0.001 F5CKEW2/V 1162 0.750
PEEJAY-1_02 CPT05 1.300 -0.003 -0.121 -0.005 0.000 0.002 F5CKEW2/V 1162 0.750
PEEJAY-1_02 CPT06 1.319 -0.005 -0.117 -0.005 0.001 0.002 F5CKEW2/V 1162 0.750
PEEJAY-1_02 CPT07 1.353 -0.004 -0.109 -0.053 0.000 -0.003 F5CKEW2/V 1162 0.750
PEEJAY-1_02 CPT08 1.305 -0.003 -0.115 -0.005 0.000 0.006 F5CKEW2/V 1162 0.750
PEEJAY-1_02 CPT09 1.300 -0.003 -0.112 0.005 0.000 -0.006 F5CKEW2/V 1162 0.750
PEEJAY-1_02 CPT10 2.115 -0.081 -0.367 -0.029 0.000 -0.003 F5CKEW2/V 0575 0.750
PEEJAY-1_02 CPT11 2.120 -0.082 -0.375 -0.064 0.002 -0.001 F5CKEW2/V 0575 0.750
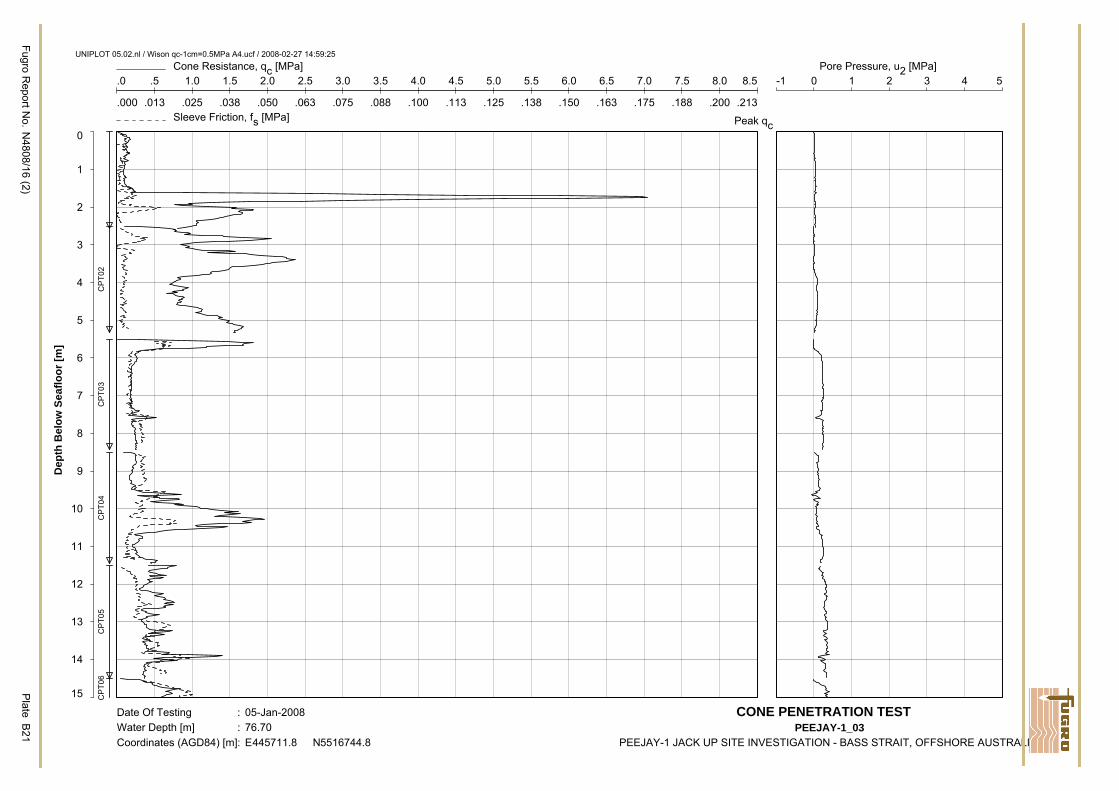
.0 .5 1.0 1.5 2.0 2.5 3.0 3.5 4.0 4.5 5.0 5.5 6.0 6.5 7.0 7.5 8.0 8.5Cone Resistance, qc [MPa]
0
1
2
3
4
5
6
7
8
9
10
11
12
13
14
15
Dep
th B
elow
Sea
floor
[m]
Peak qc
.000 .013 .025 .038 .050 .063 .075 .088 .100 .113 .125 .138 .150 .163 .175 .188 .200 .213Sleeve Friction, fs [MPa]
-1 0 1 2 3 4 5Pore Pressure, u2 [MPa]
Fugro Report N
o.N
4808/16 (2)P
lateB
21
Date Of Testing : 05-Jan-2008Water Depth [m] : 76.70Coordinates (AGD84) [m] : E445711.8 N5516744.8
CONE PENETRATION TEST PEEJAY-1_03
PEEJAY-1 JACK UP SITE INVESTIGATION - BASS STRAIT, OFFSHORE AUSTRALIA
UNIPLOT 05.02.nl / Wison qc-1cm=0.5MPa A4.ucf / 2008-02-27 14:59:25
CPT
02C
PT03
CPT
04C
PT05
CPT
06
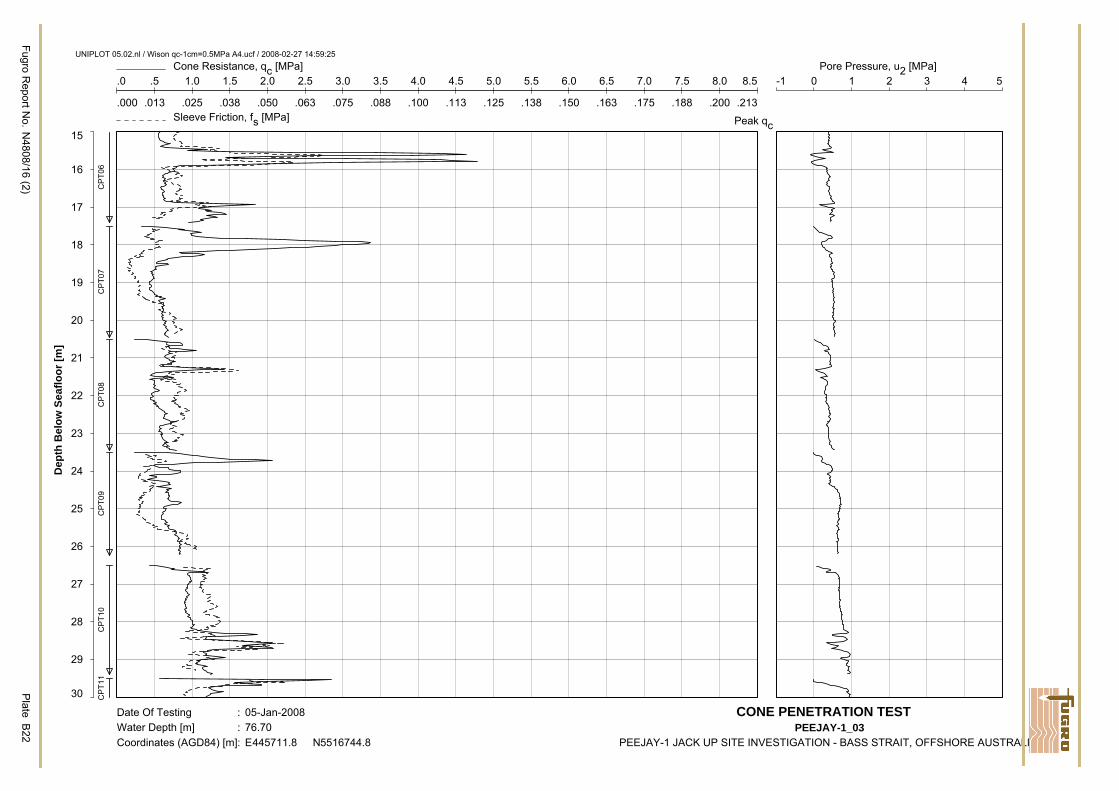
.0 .5 1.0 1.5 2.0 2.5 3.0 3.5 4.0 4.5 5.0 5.5 6.0 6.5 7.0 7.5 8.0 8.5Cone Resistance, qc [MPa]
15
16
17
18
19
20
21
22
23
24
25
26
27
28
29
30
Dep
th B
elow
Sea
floor
[m]
Peak qc
.000 .013 .025 .038 .050 .063 .075 .088 .100 .113 .125 .138 .150 .163 .175 .188 .200 .213Sleeve Friction, fs [MPa]
-1 0 1 2 3 4 5Pore Pressure, u2 [MPa]
Fugro Report N
o.N
4808/16 (2)P
lateB
22
Date Of Testing : 05-Jan-2008Water Depth [m] : 76.70Coordinates (AGD84) [m] : E445711.8 N5516744.8
CONE PENETRATION TEST PEEJAY-1_03
PEEJAY-1 JACK UP SITE INVESTIGATION - BASS STRAIT, OFFSHORE AUSTRALIA
UNIPLOT 05.02.nl / Wison qc-1cm=0.5MPa A4.ucf / 2008-02-27 14:59:25
CPT
06C
PT07
CPT
08C
PT09
CPT
10C
PT11
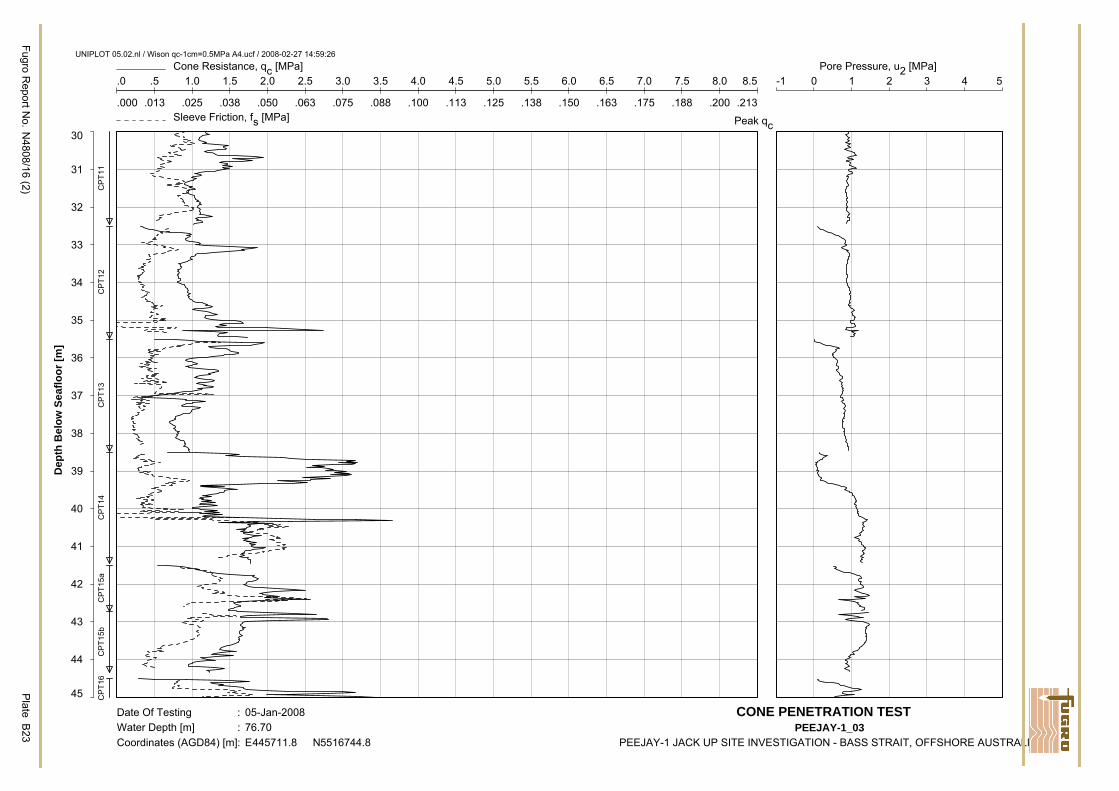
.0 .5 1.0 1.5 2.0 2.5 3.0 3.5 4.0 4.5 5.0 5.5 6.0 6.5 7.0 7.5 8.0 8.5Cone Resistance, qc [MPa]
30
31
32
33
34
35
36
37
38
39
40
41
42
43
44
45
Dep
th B
elow
Sea
floor
[m]
Peak qc
.000 .013 .025 .038 .050 .063 .075 .088 .100 .113 .125 .138 .150 .163 .175 .188 .200 .213Sleeve Friction, fs [MPa]
-1 0 1 2 3 4 5Pore Pressure, u2 [MPa]
Fugro Report N
o.N
4808/16 (2)P
lateB
23
Date Of Testing : 05-Jan-2008Water Depth [m] : 76.70Coordinates (AGD84) [m] : E445711.8 N5516744.8
CONE PENETRATION TEST PEEJAY-1_03
PEEJAY-1 JACK UP SITE INVESTIGATION - BASS STRAIT, OFFSHORE AUSTRALIA
UNIPLOT 05.02.nl / Wison qc-1cm=0.5MPa A4.ucf / 2008-02-27 14:59:26
CPT
11C
PT12
CPT
13C
PT14
CPT
15a
CPT
15b
CPT
16
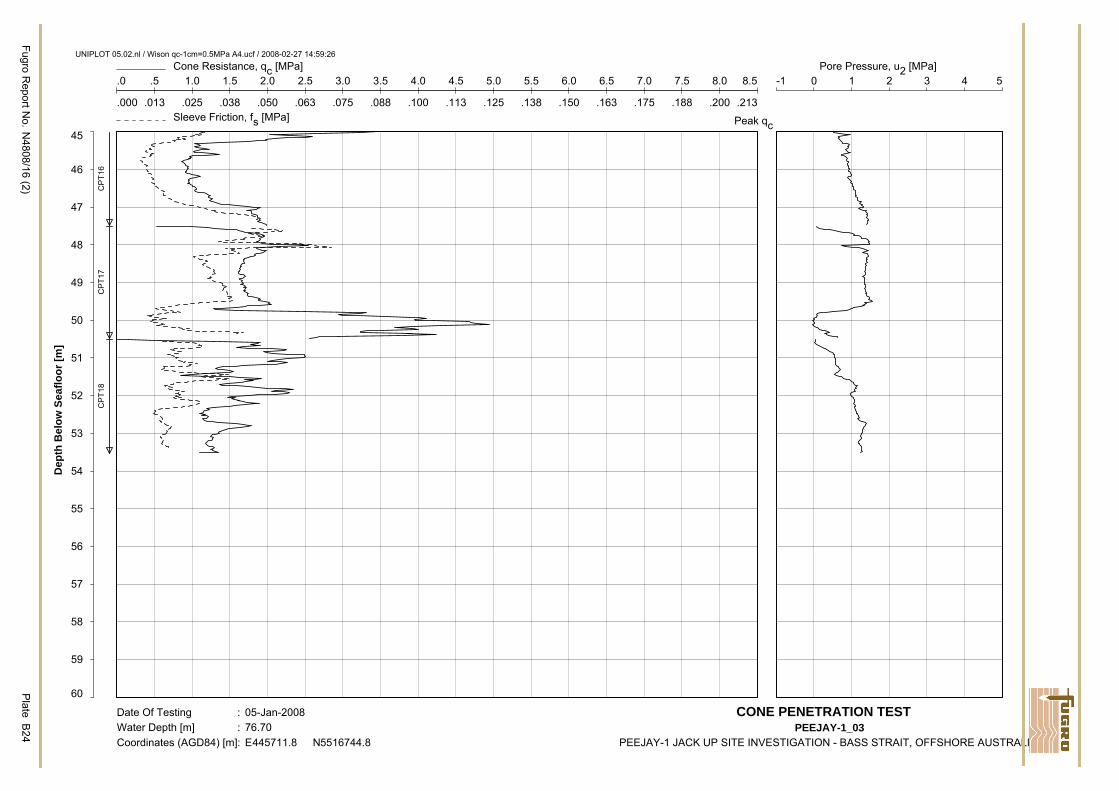
.0 .5 1.0 1.5 2.0 2.5 3.0 3.5 4.0 4.5 5.0 5.5 6.0 6.5 7.0 7.5 8.0 8.5Cone Resistance, qc [MPa]
45
46
47
48
49
50
51
52
53
54
55
56
57
58
59
60
Dep
th B
elow
Sea
floor
[m]
Peak qc
.000 .013 .025 .038 .050 .063 .075 .088 .100 .113 .125 .138 .150 .163 .175 .188 .200 .213Sleeve Friction, fs [MPa]
-1 0 1 2 3 4 5Pore Pressure, u2 [MPa]
Fugro Report N
o.N
4808/16 (2)P
lateB
24
Date Of Testing : 05-Jan-2008Water Depth [m] : 76.70Coordinates (AGD84) [m] : E445711.8 N5516744.8
CONE PENETRATION TEST PEEJAY-1_03
PEEJAY-1 JACK UP SITE INVESTIGATION - BASS STRAIT, OFFSHORE AUSTRALIA
UNIPLOT 05.02.nl / Wison qc-1cm=0.5MPa A4.ucf / 2008-02-27 14:59:26
CPT
16C
PT17
CPT
18
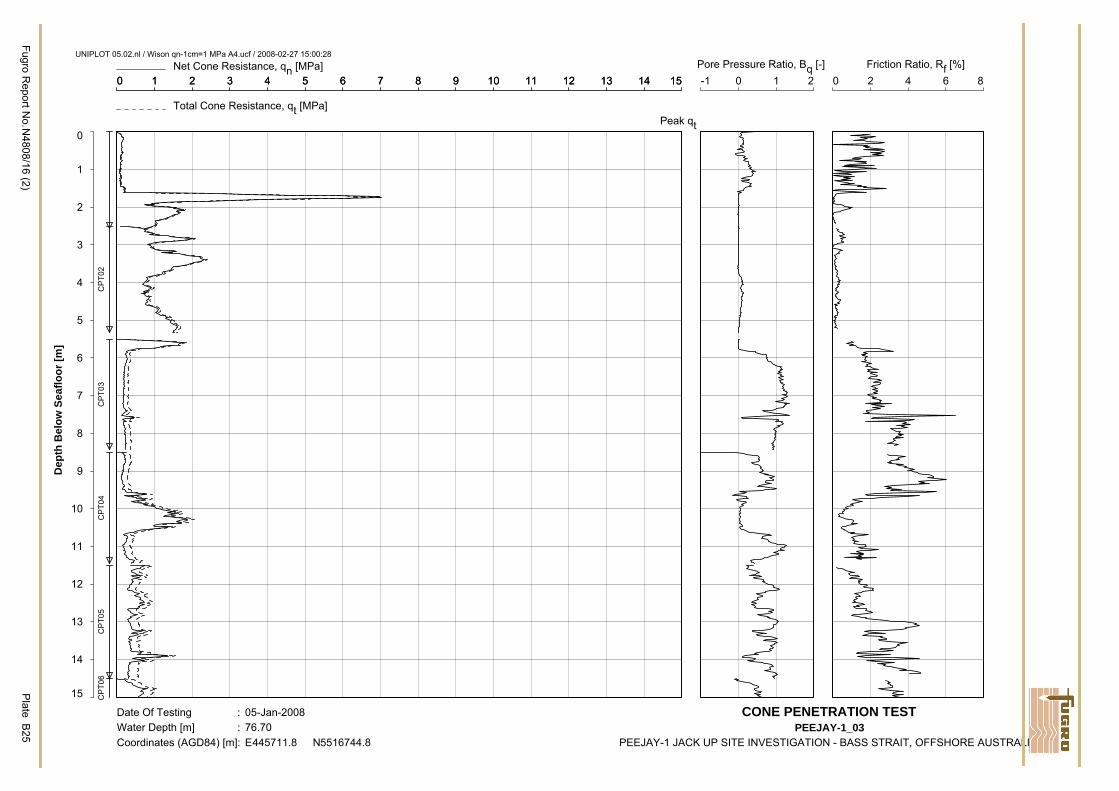
0 1 2 3 4 5 6 7 8 9 10 11 12 13 14 15Net Cone Resistance, qn [MPa]
0
1
2
3
4
5
6
7
8
9
10
11
12
13
14
15
Dep
th B
elow
Sea
floor
[m]
0 1 2 3 4 5 6 7 8 9 10 11 12 13 14 15
Total Cone Resistance, qt [MPa]Peak qt
-1 0 1 2Pore Pressure Ratio, Bq [-]
0 2 4 6 8Friction Ratio, Rf [%]
Fugro Report N
o.N4808/16 (2)
Plate
B25
Date Of Testing : 05-Jan-2008Water Depth [m] : 76.70Coordinates (AGD84) [m] : E445711.8 N5516744.8
CONE PENETRATION TESTPEEJAY-1_03
PEEJAY-1 JACK UP SITE INVESTIGATION - BASS STRAIT, OFFSHORE AUSTRALIA
UNIPLOT 05.02.nl / Wison qn-1cm=1 MPa A4.ucf / 2008-02-27 15:00:28
CPT
02C
PT03
CPT
04C
PT05
CPT
06
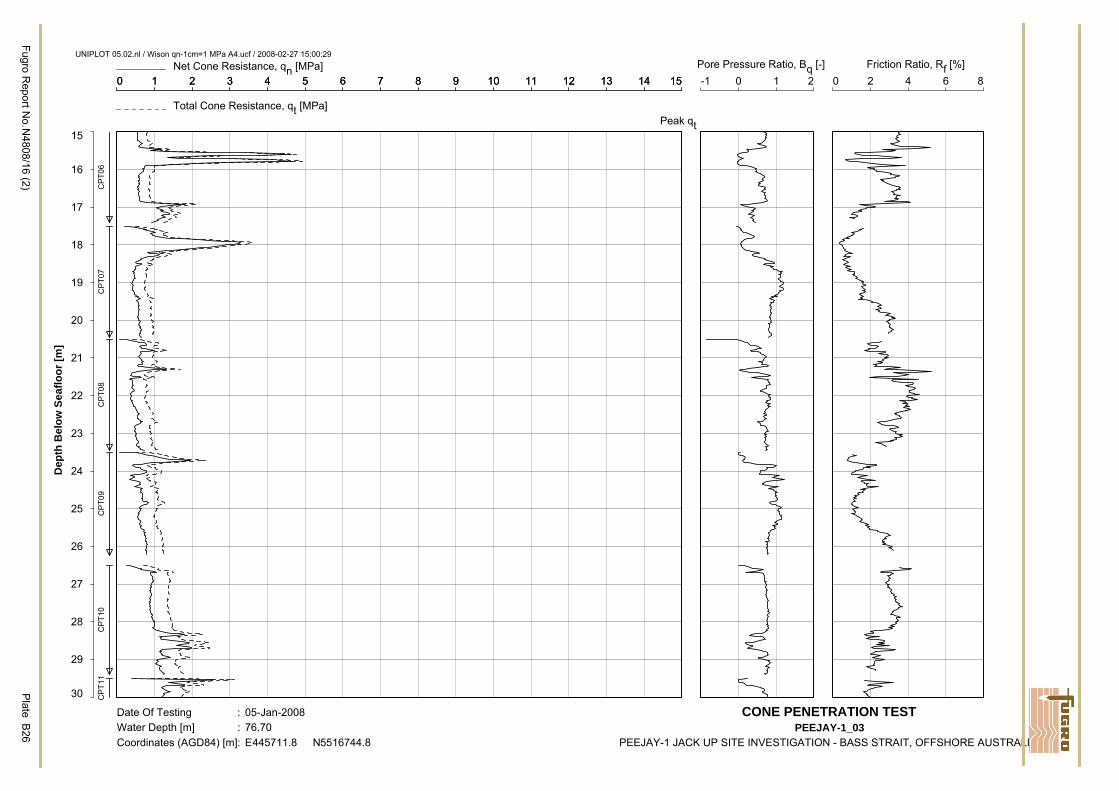
0 1 2 3 4 5 6 7 8 9 10 11 12 13 14 15Net Cone Resistance, qn [MPa]
15
16
17
18
19
20
21
22
23
24
25
26
27
28
29
30
Dep
th B
elow
Sea
floor
[m]
0 1 2 3 4 5 6 7 8 9 10 11 12 13 14 15
Total Cone Resistance, qt [MPa]Peak qt
-1 0 1 2Pore Pressure Ratio, Bq [-]
0 2 4 6 8Friction Ratio, Rf [%]
Fugro Report N
o.N4808/16 (2)
Plate
B26
Date Of Testing : 05-Jan-2008Water Depth [m] : 76.70Coordinates (AGD84) [m] : E445711.8 N5516744.8
CONE PENETRATION TESTPEEJAY-1_03
PEEJAY-1 JACK UP SITE INVESTIGATION - BASS STRAIT, OFFSHORE AUSTRALIA
UNIPLOT 05.02.nl / Wison qn-1cm=1 MPa A4.ucf / 2008-02-27 15:00:29
CPT
06C
PT07
CPT
08C
PT09
CPT
10C
PT11
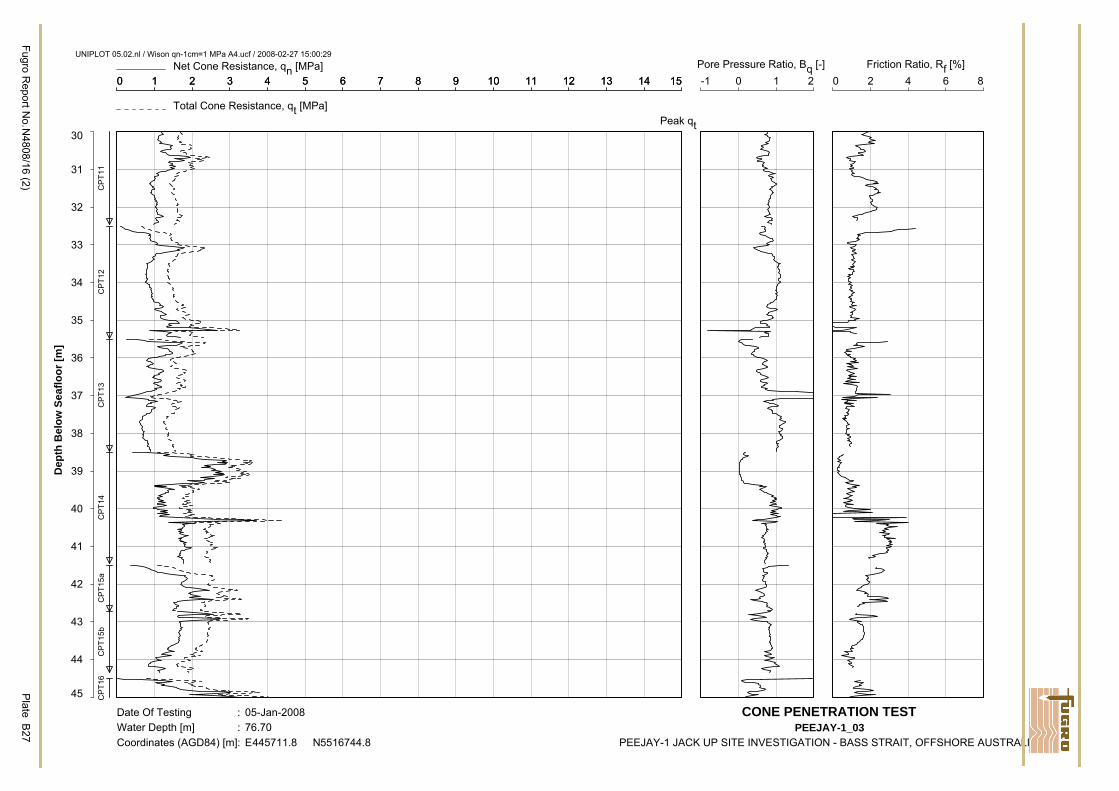
0 1 2 3 4 5 6 7 8 9 10 11 12 13 14 15Net Cone Resistance, qn [MPa]
30
31
32
33
34
35
36
37
38
39
40
41
42
43
44
45
Dep
th B
elow
Sea
floor
[m]
0 1 2 3 4 5 6 7 8 9 10 11 12 13 14 15
Total Cone Resistance, qt [MPa]Peak qt
-1 0 1 2Pore Pressure Ratio, Bq [-]
0 2 4 6 8Friction Ratio, Rf [%]
Fugro Report N
o.N4808/16 (2)
Plate
B27
Date Of Testing : 05-Jan-2008Water Depth [m] : 76.70Coordinates (AGD84) [m] : E445711.8 N5516744.8
CONE PENETRATION TESTPEEJAY-1_03
PEEJAY-1 JACK UP SITE INVESTIGATION - BASS STRAIT, OFFSHORE AUSTRALIA
UNIPLOT 05.02.nl / Wison qn-1cm=1 MPa A4.ucf / 2008-02-27 15:00:29
CPT
11C
PT12
CPT
13C
PT14
CPT
15a
CPT
15b
CPT
16
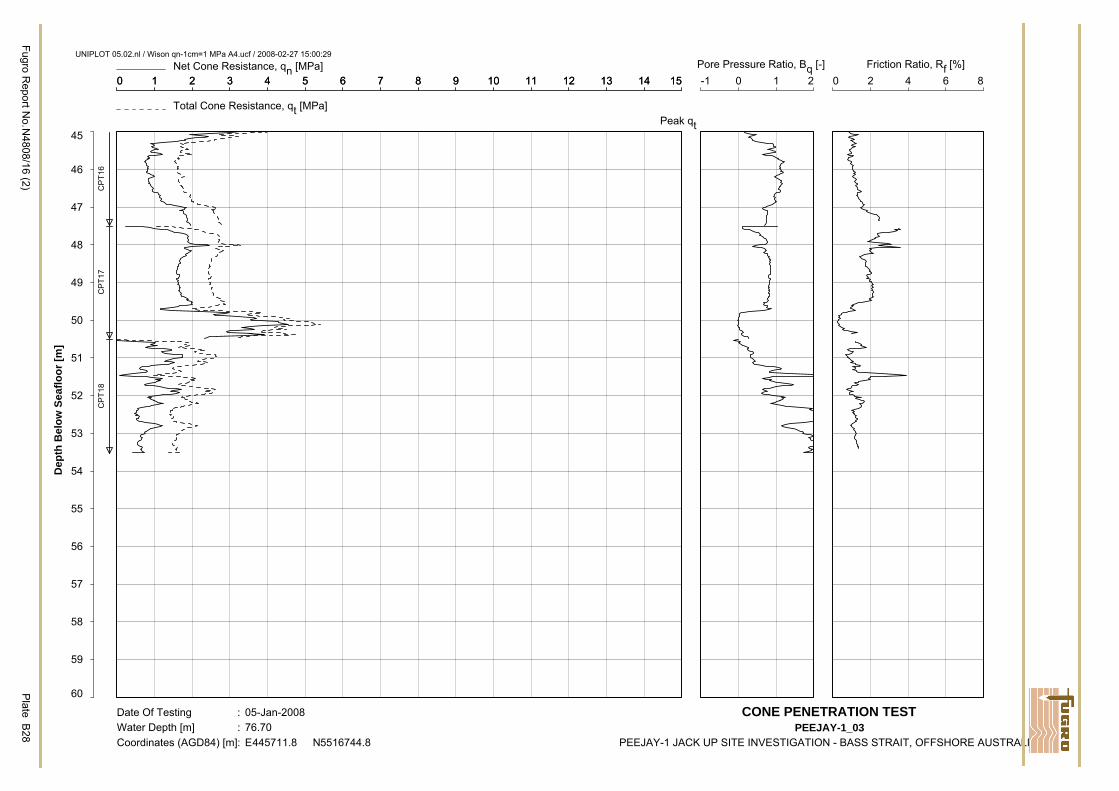
0 1 2 3 4 5 6 7 8 9 10 11 12 13 14 15Net Cone Resistance, qn [MPa]
45
46
47
48
49
50
51
52
53
54
55
56
57
58
59
60
Dep
th B
elow
Sea
floor
[m]
0 1 2 3 4 5 6 7 8 9 10 11 12 13 14 15
Total Cone Resistance, qt [MPa]Peak qt
-1 0 1 2Pore Pressure Ratio, Bq [-]
0 2 4 6 8Friction Ratio, Rf [%]
Fugro Report N
o.N4808/16 (2)
Plate
B28
Date Of Testing : 05-Jan-2008Water Depth [m] : 76.70Coordinates (AGD84) [m] : E445711.8 N5516744.8
CONE PENETRATION TESTPEEJAY-1_03
PEEJAY-1 JACK UP SITE INVESTIGATION - BASS STRAIT, OFFSHORE AUSTRALIA
UNIPLOT 05.02.nl / Wison qn-1cm=1 MPa A4.ucf / 2008-02-27 15:00:29
CPT
16C
PT17
CPT
18

Borehole/Location
DepthRange
[m]
Unit Weight γ
Ground
[kN/m3]
Ground Water
[kN/m3]
Net Area Ratio
a
[-]
Pore Pressure AdjustmentFactor K
[-]
Note:1. The adjustment factor K applies only to probes with a pore pressure filter in the face of the cone.
PARAMETER VALUES FOR NET CONE RESISTANCE CALCULATIONPEEJAY-1 JACK UP SITE INVESTIGATION - BASS STRAIT, OFFSHORE AUSTRALIA
Fugro Report No.N4808/16 (2) Plate B29
UN
IPLO
T 05
.02.
nl/Q
aQc_
04 W
IS_T
B18
.cm
d/20
08-0
2-25
15:
20:2
4
PEEJAY-1_03 0.00 to 1.401.40 to 5.905.90 to 9.609.60 to 10.70
10.70 to 21.4021.40 to 26.4026.40 to 28.3028.30 to 38.6038.60 to 39.9039.90 to 40.3040.30 to 45.1045.10 to 47.0047.00 to 50.6050.60 to 53.5053.50
17.0017.0017.0017.5017.0017.0017.0017.5017.0017.5018.0018.0018.5018.5018.00
10.0010.0010.0010.0010.0010.0010.0010.0010.0010.0010.0010.0010.0010.0010.00
0.750 ---
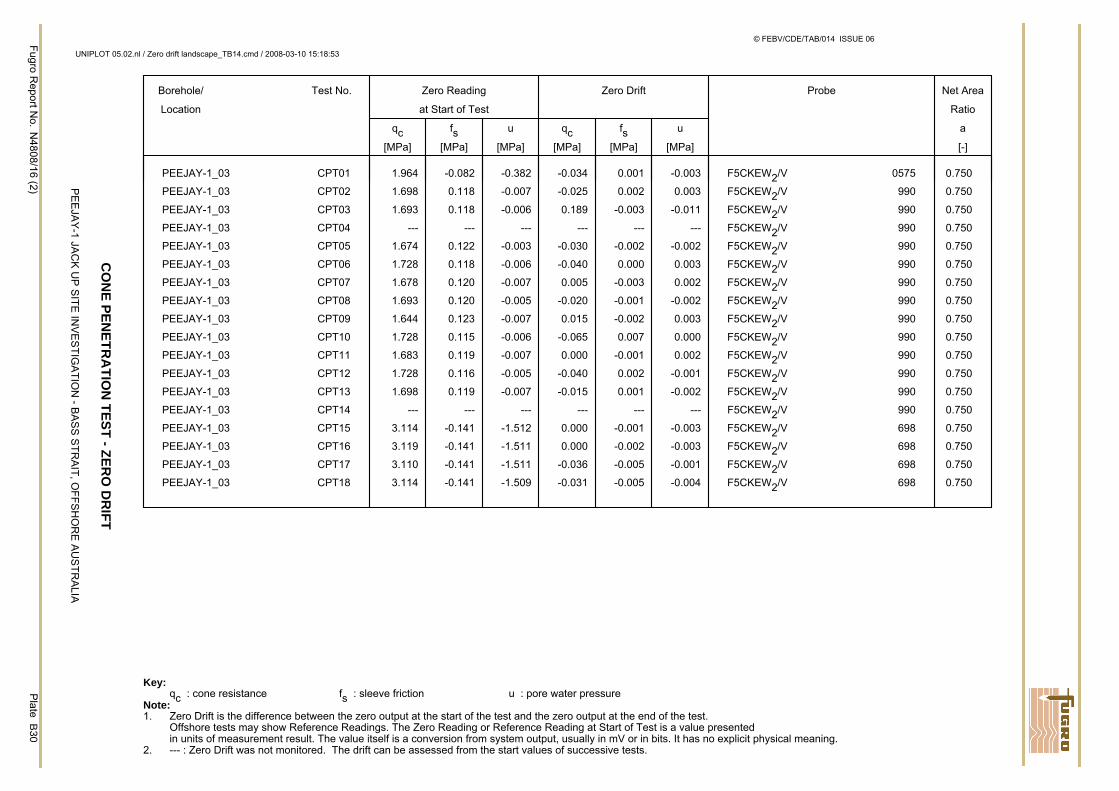
Borehole/
Location
Test No. Zero Reading
at Start of Test
qc[MPa]
fs[MPa]
u
[MPa]
Zero Drift
qc[MPa]
fs[MPa]
u
[MPa]
Probe Net Area
Ratio
a
[-]
Key:qc : cone resistance fs : sleeve friction u : pore water pressure
Note:1. Zero Drift is the difference between the zero output at the start of the test and the zero output at the end of the test.
Offshore tests may show Reference Readings. The Zero Reading or Reference Reading at Start of Test is a value presentedin units of measurement result. The value itself is a conversion from system output, usually in mV or in bits. It has no explicit physical meaning.
2. --- : Zero Drift was not monitored. The drift can be assessed from the start values of successive tests.
CO
NE PEN
ETRA
TION
TEST - ZERO
DR
IFT
PE
EJA
Y-1 JA
CK
UP
SITE
INV
ES
TIGA
TION
- BA
SS
STR
AIT, O
FFSH
OR
E A
US
TRA
LIA
Fugro Report N
o.N
4808/16 (2)P
lateB
30
© FEBV/CDE/TAB/014 ISSUE 06
UNIPLOT 05.02.nl / Zero drift landscape_TB14.cmd / 2008-03-10 15:18:53
PEEJAY-1_03 CPT01 1.964 -0.082 -0.382 -0.034 0.001 -0.003 F5CKEW2/V 0575 0.750
PEEJAY-1_03 CPT02 1.698 0.118 -0.007 -0.025 0.002 0.003 F5CKEW2/V 990 0.750
PEEJAY-1_03 CPT03 1.693 0.118 -0.006 0.189 -0.003 -0.011 F5CKEW2/V 990 0.750
PEEJAY-1_03 CPT04 --- --- --- --- --- --- F5CKEW2/V 990 0.750
PEEJAY-1_03 CPT05 1.674 0.122 -0.003 -0.030 -0.002 -0.002 F5CKEW2/V 990 0.750
PEEJAY-1_03 CPT06 1.728 0.118 -0.006 -0.040 0.000 0.003 F5CKEW2/V 990 0.750
PEEJAY-1_03 CPT07 1.678 0.120 -0.007 0.005 -0.003 0.002 F5CKEW2/V 990 0.750
PEEJAY-1_03 CPT08 1.693 0.120 -0.005 -0.020 -0.001 -0.002 F5CKEW2/V 990 0.750
PEEJAY-1_03 CPT09 1.644 0.123 -0.007 0.015 -0.002 0.003 F5CKEW2/V 990 0.750
PEEJAY-1_03 CPT10 1.728 0.115 -0.006 -0.065 0.007 0.000 F5CKEW2/V 990 0.750
PEEJAY-1_03 CPT11 1.683 0.119 -0.007 0.000 -0.001 0.002 F5CKEW2/V 990 0.750
PEEJAY-1_03 CPT12 1.728 0.116 -0.005 -0.040 0.002 -0.001 F5CKEW2/V 990 0.750
PEEJAY-1_03 CPT13 1.698 0.119 -0.007 -0.015 0.001 -0.002 F5CKEW2/V 990 0.750
PEEJAY-1_03 CPT14 --- --- --- --- --- --- F5CKEW2/V 990 0.750
PEEJAY-1_03 CPT15 3.114 -0.141 -1.512 0.000 -0.001 -0.003 F5CKEW2/V 698 0.750
PEEJAY-1_03 CPT16 3.119 -0.141 -1.511 0.000 -0.002 -0.003 F5CKEW2/V 698 0.750
PEEJAY-1_03 CPT17 3.110 -0.141 -1.511 -0.036 -0.005 -0.001 F5CKEW2/V 698 0.750
PEEJAY-1_03 CPT18 3.114 -0.141 -1.509 -0.031 -0.005 -0.004 F5CKEW2/V 698 0.750
Fugro Report No. N4808/16 (2) Table of Contents - Section C Page 1 of 1
SECTION C
GEOTECHNICAL LABORATORY TEST RESULTS SECTION C1: LABORATORY TESTING OVERVIEW SECTION C2: INDEX LABORATORY TESTS SECTION C3: TRIAXIAL TESTS
Fugro Report No. N4808/16 (2) Table of Contents - Section C1 Page 1 of 1
SECTION C1
LABORATORY TESTING OVERVIEW TEXT – SECTION C1: Page C1. LABORATORY TESTING OVERVIEW C1.1 INDEX LABORATORY TESTS ......................................................................................... C1-1 C1.1.1 DETAILS ............................................................................................................ C1-1 C1.1.2 DISCUSSION OF RESULTS .............................................................................. C1-1 C1.2 PRACTICE FOR SAMPLE HANDLING AND LABORATORY TESTING ..............C1-3 to C1-4
Fugro Report No. N4808/16 (2) Text - Section C1 Page C1-1
C1. LABORATORY TESTING OVERVIEW C1.1 INDEX LABORATORY TESTS C1.1.1 DETAILS The sample descriptions presented on the Laboratory Classification Test Results (Plates C2-1 to C2-6) may be slightly different compared to the soil description illustrated on the borehole log (Section A), which is an interpretation of the soil conditions based on the sample description, the on-site laboratory test results combined with the onshore laboratory test results, and the CPT data. C1.1.2 DISCUSSION OF RESULTS a) In general, the results are considered to be of good quality and representative of the soils that
were tested. b) Conventional sampling of non-cohesive soils does not provide undisturbed samples; therefore the
unit weight values presented for non-cohesive soils should be interpreted carefully. c) Results of sieve analyses should be used with caution. According to Netterberg (1971), “The
sieve analysis of carbonate soils may result in erratic modifications of grain sizes following attrition of soft particles. Because specific gravities vary with particle size, the gradation curve gives a distorted picture of the space arrangement of particles”.
d) Some particle size distribution curves show the presence of ‘gravel’, but are in fact measurements of the presence of all particles with a size greater than that of sand. Such particles could include shells, coral fragments, cemented pieces or conglomerations. The borehole log should be consulted to distinguish between fragment types.
e) A specific gravity value of 2.65 has been adopted for all soil layers for consistency throughout the project, even though individual particle density tests performed may show different results. Specific gravity for carbonate soils will generally fall in the range 2.65 to 2.80, depending on the mineralogy and the percentage of non-carbonate particles (Tan et al., 2003). According to Winterkorn and Fang (1975), the value of 2.65 for specific gravity of soil fines is “sufficiently accurate for the majority of mechanical analyses”. Note that the comments regarding sieve analyses are also applicable here.
f) Onshore laboratory testing included collecting carbonate content and particle size distribution data. It must be noted that the onshore laboratory which performed these tests adhered to Australian Standards (AS), while the offshore testing and descriptions applied British Standards (BS).
g) Field classification of fine grained soil type (clay or silt) may vary with that presented on the borehole log. This is because the borehole log presents classification based on Atterberg limits testing performed in the onshore laboratory.
Fugro Report No. N4808/16 (2) Text - Section C1 Page C1-2
REFERENCES Lambe, T.W. and Whitman, R.V. (1969), “Soil Mechanics”, John Wiley & Sons, New York, Series in Soil Engineering.
Netterberg, F. (1971), “Calcrete in Road Construction”, NIRR BULL. 10, CSIR RES. REP. 286, 56p.
Standards Australia (1999), “Methods of Testing Soils for Engineering Purposes - Sampling and preparation of soils - Preparation of disturbed samples for testing”, AS 1289.1.1 Standards Australia (1999), “Methods of Testing Soils for Engineering Purposes - Sampling and Preparation of Soils - Preparation of Disturbed Samples for Testing”, AS 1289.1.1 Standards Australia (1992), “Methods of Testing Soils for Engineering Purposes - Soil Moisture Content Tests - Determination of the Moisture Content of a Soil - Oven Drying Method (standard method)”, AS 1289.2.1.1 Standards Australia (1995), “Methods of Testing Soils for Engineering Purposes - Soil Classification Tests - Determination of the Particle Size Distribution of a Soil - Standard Method of Analysis by Sieving”, AS 1289.3.6.1
Standards Australia (1995), “Methods of Testing Soils for Engineering Purposes - Soil Classification Tests - Determination of the Liquid Limit of a Soil - One Point Casagrande Method (subsidiary method)”, AS 1289.3.1.2 Standards Australia (1995), “Methods of Testing Soils for Engineering Purposes - Soil Classification Tests - Determination of the Plastic Limit of a Soil - Standard Method”, AS 1289.3.2.1 Standards Australia (1995), “Methods of Testing Soils for Engineering Purposes - Soil Classification Tests - Calculation of the Plasticity Index of a Soil”, AS 1289.3.3.1
Tan, T.S., Phoon, K.K., Hight, D.W. and Leroueil, S. (Eds.) (2003), "Characterisation and engineering properties of natural soils Volume 2", A.A. Balkema, Lisse, XI p. Winterkorn, H.F. and Fang, H.Y. (Eds.) (1975), "Foundation Engineering Handbook", Van Nostrand Reinhold Company, New York.
Fugro Report No. N4808/16 (2) Text - Section C1 Page C1-3
© F
EBV/
CD
E/SP
E/02
0
ISSU
E 07
C1.2 PRACTICE FOR SAMPLE HANDLING AND LABORATORY TESTING INITIAL SAMPLE HANDLING Piston Sampler: Identification/labelling and transfer of sample tube to site laboratory SITE GEOTECHNICAL LABORATORY Test Programme: Geotechnical classification and strength Programme Adjustment: Assessment of feasibility of a test (by sample inspection) and, if
required, selection of alternative test specimen if adequate test completion proves impracticable
Tube Sample: − Sample extrusion − Visual geotechnical description including visual carbonate content
assessment − Geotechnical classification testing (water content, unit weight,
pocket penetrometer, torvane) − Geotechnical strength testing (unconsolidated undrained triaxial
test) − Selection and labelling of geotechnical sample sections for
undisturbed preservation and/or disturbed preservation SAMPLE PROTECTION Packaging of Selected Sample Sections:
− Disturbed sample sections placed in double set of plastic bags, and labelled
− Placement in labelled shipping container Packaging of Sample in Tube: Not applicable On-Site Sample/Core Storage: − On-board storage area
− Storage temperature within the range +2oC and +35oC − Protection from direct sunlight
SAMPLE TRANSPORT Fugro Sample Transport: − Shipping containers off-loading from drilling vessel at port of
demobilisation − Road-freight and air freight to Fugro-nominated laboratory
Client Sample Transport: Not applicable OFFICE GEOTECHNICAL LABORATORY Test Programme: Geotechnical classification, strength and stiffness Programme Adjustment: − Assessment of feasibility of a test (by sample inspection) prior to
start of specimen preparation − Decision by laboratory: (1) to proceed with test, (2) not to proceed
with test, (3) to advise on adjustments to test procedure − Selection by laboratory of alternative test specimen if decision is
“not to proceed” or when adequate test completion provesimpracticable
Sample Waxed in Cardboard Tube: Not applicable Sample in Plastic Bags − Geotechnical testing
− If applicable, selection and labelling of left-over sample sections for disturbed preservation
Fugro Report No. N4808/16 (2) Text - Section C1 Page C1-4
© F
EBV/
CD
E/SP
E/02
0
ISSU
E 07
SAMPLE STORAGE AND DISPOSITION Sample Storage: − Storage period of 12 months after submission of the final report
− Storage temperature within the range +2oC and +35oC − Protection from direct sunlight
Transport: Not applicable Final Disposition: In accordance with office laboratory procedures

Fugro Report No. N4808/16 (2) Table of Contents - Section C2 Page 1 of 1
SECTION C2
INDEX LABORATORY TESTS LIST OF PLATES IN SECTION C2: Plate Laboratory Classification Test Results ............................................................................................C2-1 to C2-6 Particle Size Distribution ................................................................................................................C2-7 to C2-11 Plasticity Chart .......................................................................................................................................... C2-12
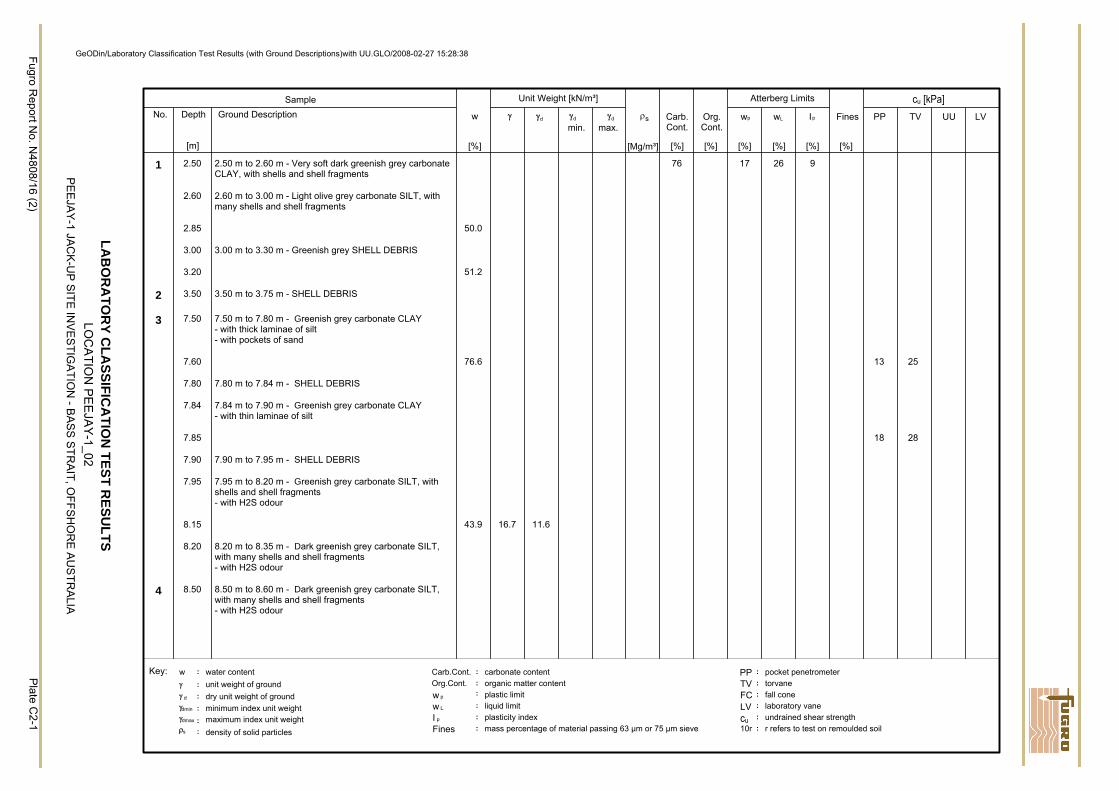
Fugro Report N
o. N4808/16 (2)
1 2.50 2.50 m to 2.60 m - Very soft dark greenish grey carbonateCLAY, with shells and shell fragments
76 17 26 9
2.60 2.60 m to 3.00 m - Light olive grey carbonate SILT, withmany shells and shell fragments
2.85 50.0
3.00 3.00 m to 3.30 m - Greenish grey SHELL DEBRIS
3.20 51.2
2 3.50 3.50 m to 3.75 m - SHELL DEBRIS
3 7.50 7.50 m to 7.80 m - Greenish grey carbonate CLAY- with thick laminae of silt- with pockets of sand
7.60 76.6 13 25
7.80 7.80 m to 7.84 m - SHELL DEBRIS
7.84 7.84 m to 7.90 m - Greenish grey carbonate CLAY- with thin laminae of silt
7.85 18 28
7.90 7.90 m to 7.95 m - SHELL DEBRIS
7.95 7.95 m to 8.20 m - Greenish grey carbonate SILT, withshells and shell fragments- with H2S odour
8.15 43.9 16.7 11.6
8.20 8.20 m to 8.35 m - Dark greenish grey carbonate SILT,with many shells and shell fragments- with H2S odour
4 8.50 8.50 m to 8.60 m - Dark greenish grey carbonate SILT,with many shells and shell fragments- with H2S odour
PE
EJA
Y-1 JA
CK
-UP
SITE IN
VE
STIG
ATIO
N - B
AS
S S
TRA
IT, OFFSH
OR
E A
US
TRA
LIA
Plate C
2-1
GeODin/Laboratory Classification Test Results (with Ground Descriptions)with UU.GLO/2008-02-27 15:28:38
LOC
ATIO
N P
EE
JAY
-1_02LA
BO
RA
TOR
Y CLA
SSIFICA
TION
TEST RESU
LTS
Sample Unit Weight [kN/m³] Atterberg Limits cu [kPa]Depth
[m]
w
[%]
γ
[Mg/m³]
Carb.Cont.
Org.Cont.
[%] [%] [%][%] [%] [%]
Fines PP TV UUNo. LVγd γd
min.γd
max.Ground Description ρs wp wL Ip
Key: w :
:water contentunit weight of groundγ
: dry unit weight of groundγ d
: minimum index unit weightγdmin
: maximum index unit weightγdmax
: density of solid particlesρs
: carbonate contentCarb.Cont.: organic matter contentOrg.Cont.
w : plastic limitp
w : liquid limitL
I : plasticity indexp
Fines : mass percentage of material passing 63 µm or 75 µm sieve
PP : pocket penetrometerTV : torvaneFC : fall coneLV : laboratory vane
: undrained shear strengthcu:10r r refers to test on remoulded soil
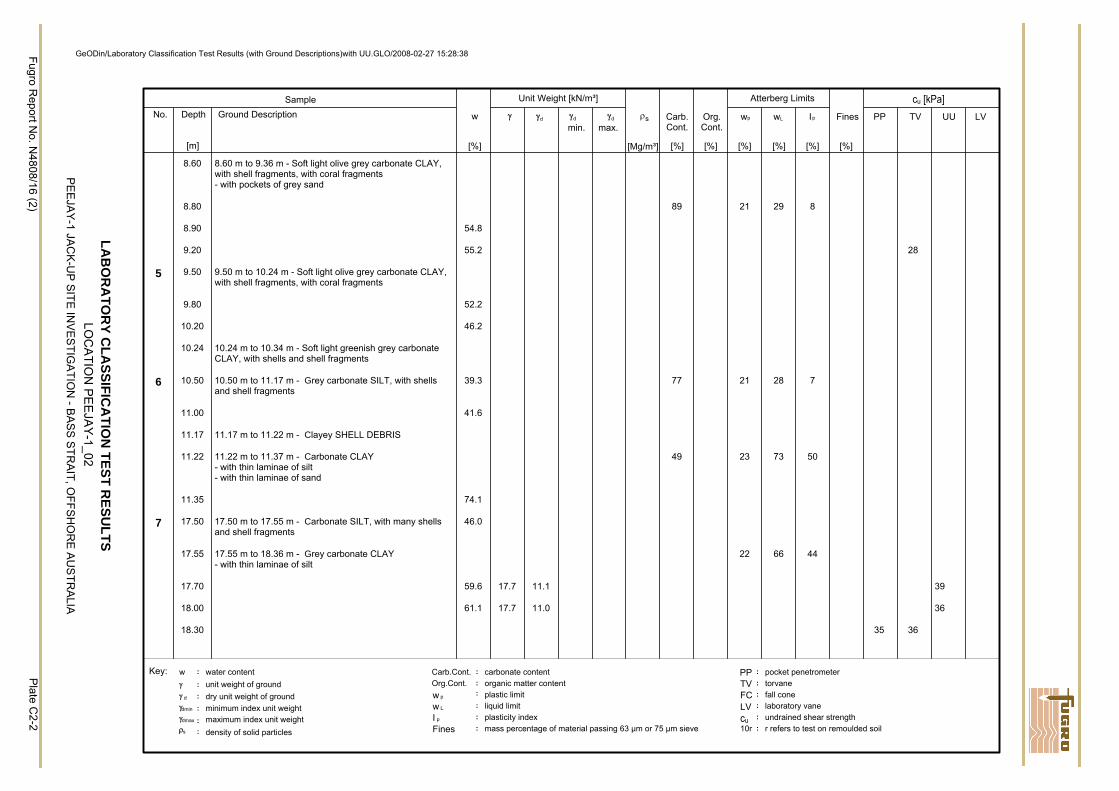
Fugro Report N
o. N4808/16 (2)
8.60 8.60 m to 9.36 m - Soft light olive grey carbonate CLAY,with shell fragments, with coral fragments- with pockets of grey sand
8.80 89 21 29 8
8.90 54.8
9.20 55.2 28
5 9.50 9.50 m to 10.24 m - Soft light olive grey carbonate CLAY,with shell fragments, with coral fragments
9.80 52.2
10.20 46.2
10.24 10.24 m to 10.34 m - Soft light greenish grey carbonateCLAY, with shells and shell fragments
6 10.50 10.50 m to 11.17 m - Grey carbonate SILT, with shellsand shell fragments
39.3 77 21 28 7
11.00 41.6
11.17 11.17 m to 11.22 m - Clayey SHELL DEBRIS
11.22 11.22 m to 11.37 m - Carbonate CLAY- with thin laminae of silt- with thin laminae of sand
49 23 73 50
11.35 74.1
7 17.50 17.50 m to 17.55 m - Carbonate SILT, with many shellsand shell fragments
46.0
17.55 17.55 m to 18.36 m - Grey carbonate CLAY- with thin laminae of silt
22 66 44
17.70 59.6 17.7 11.1 39
18.00 61.1 17.7 11.0 36
18.30 35 36
PE
EJA
Y-1 JA
CK
-UP
SITE IN
VE
STIG
ATIO
N - B
AS
S S
TRA
IT, OFFSH
OR
E A
US
TRA
LIA
Plate C
2-2
GeODin/Laboratory Classification Test Results (with Ground Descriptions)with UU.GLO/2008-02-27 15:28:38
LOC
ATIO
N P
EE
JAY
-1_02LA
BO
RA
TOR
Y CLA
SSIFICA
TION
TEST RESU
LTS
Sample Unit Weight [kN/m³] Atterberg Limits cu [kPa]Depth
[m]
w
[%]
γ
[Mg/m³]
Carb.Cont.
Org.Cont.
[%] [%] [%][%] [%] [%]
Fines PP TV UUNo. LVγd γd
min.γd
max.Ground Description ρs wp wL Ip
Key: w :
:water contentunit weight of groundγ
: dry unit weight of groundγ d
: minimum index unit weightγdmin
: maximum index unit weightγdmax
: density of solid particlesρs
: carbonate contentCarb.Cont.: organic matter contentOrg.Cont.
w : plastic limitp
w : liquid limitL
I : plasticity indexp
Fines : mass percentage of material passing 63 µm or 75 µm sieve
PP : pocket penetrometerTV : torvaneFC : fall coneLV : laboratory vane
: undrained shear strengthcu:10r r refers to test on remoulded soil
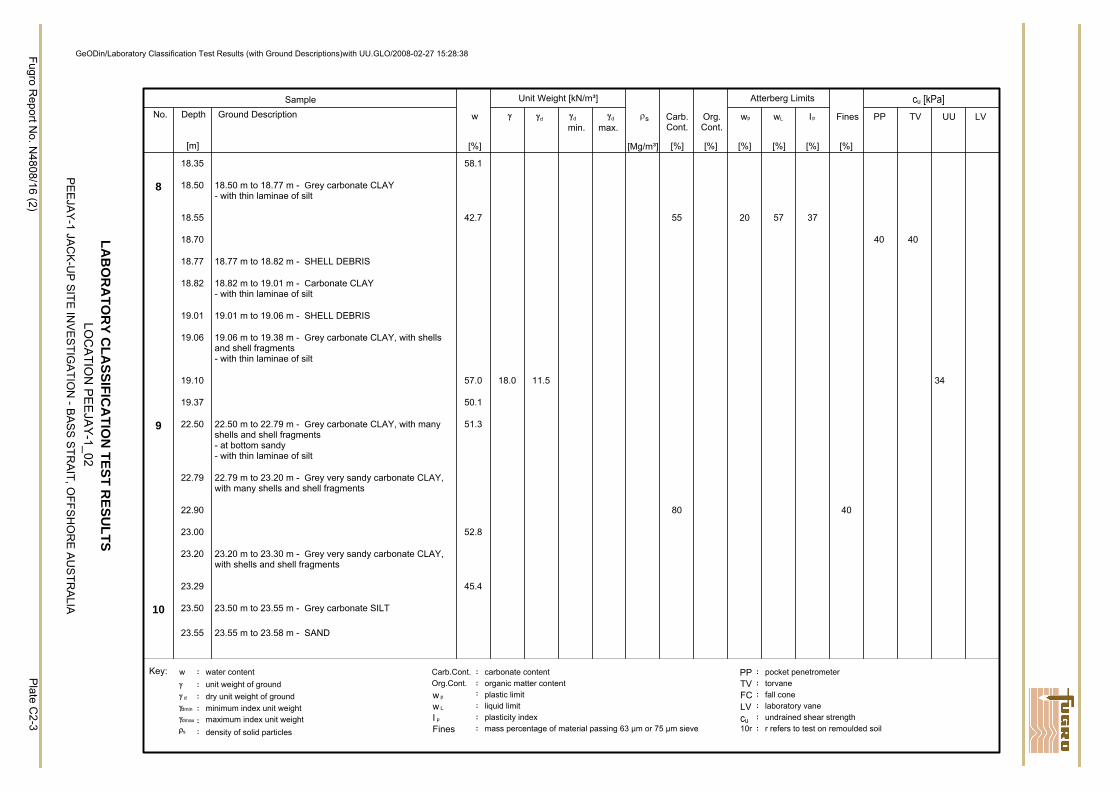
Fugro Report N
o. N4808/16 (2)
18.35 58.1
8 18.50 18.50 m to 18.77 m - Grey carbonate CLAY- with thin laminae of silt
18.55 42.7 55 20 57 37
18.70 40 40
18.77 18.77 m to 18.82 m - SHELL DEBRIS
18.82 18.82 m to 19.01 m - Carbonate CLAY- with thin laminae of silt
19.01 19.01 m to 19.06 m - SHELL DEBRIS
19.06 19.06 m to 19.38 m - Grey carbonate CLAY, with shellsand shell fragments- with thin laminae of silt
19.10 57.0 18.0 11.5 34
19.37 50.1
9 22.50 22.50 m to 22.79 m - Grey carbonate CLAY, with manyshells and shell fragments- at bottom sandy- with thin laminae of silt
51.3
22.79 22.79 m to 23.20 m - Grey very sandy carbonate CLAY,with many shells and shell fragments
22.90 80 40
23.00 52.8
23.20 23.20 m to 23.30 m - Grey very sandy carbonate CLAY,with shells and shell fragments
23.29 45.4
10 23.50 23.50 m to 23.55 m - Grey carbonate SILT
23.55 23.55 m to 23.58 m - SAND
PE
EJA
Y-1 JA
CK
-UP
SITE IN
VE
STIG
ATIO
N - B
AS
S S
TRA
IT, OFFSH
OR
E A
US
TRA
LIA
Plate C
2-3
GeODin/Laboratory Classification Test Results (with Ground Descriptions)with UU.GLO/2008-02-27 15:28:38
LOC
ATIO
N P
EE
JAY
-1_02LA
BO
RA
TOR
Y CLA
SSIFICA
TION
TEST RESU
LTS
Sample Unit Weight [kN/m³] Atterberg Limits cu [kPa]Depth
[m]
w
[%]
γ
[Mg/m³]
Carb.Cont.
Org.Cont.
[%] [%] [%][%] [%] [%]
Fines PP TV UUNo. LVγd γd
min.γd
max.Ground Description ρs wp wL Ip
Key: w :
:water contentunit weight of groundγ
: dry unit weight of groundγ d
: minimum index unit weightγdmin
: maximum index unit weightγdmax
: density of solid particlesρs
: carbonate contentCarb.Cont.: organic matter contentOrg.Cont.
w : plastic limitp
w : liquid limitL
I : plasticity indexp
Fines : mass percentage of material passing 63 µm or 75 µm sieve
PP : pocket penetrometerTV : torvaneFC : fall coneLV : laboratory vane
: undrained shear strengthcu:10r r refers to test on remoulded soil
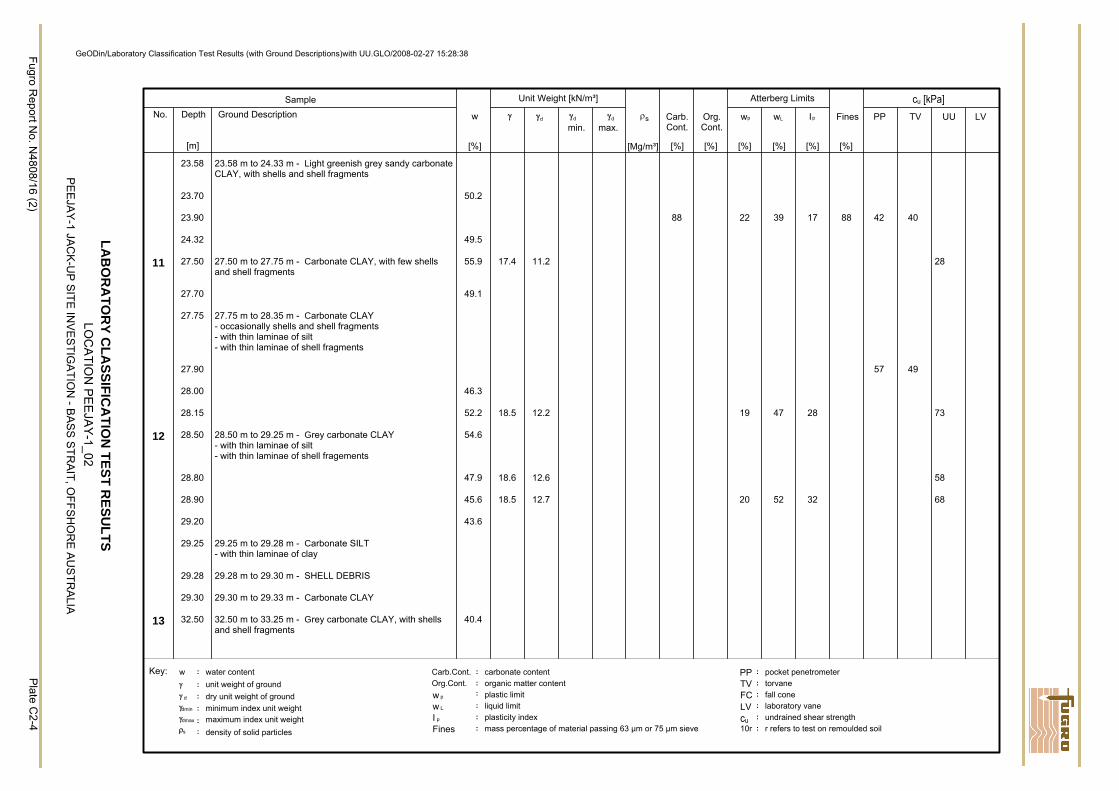
Fugro Report N
o. N4808/16 (2)
23.58 23.58 m to 24.33 m - Light greenish grey sandy carbonateCLAY, with shells and shell fragments
23.70 50.2
23.90 88 22 39 17 88 42 40
24.32 49.5
11 27.50 27.50 m to 27.75 m - Carbonate CLAY, with few shellsand shell fragments
55.9 17.4 11.2 28
27.70 49.1
27.75 27.75 m to 28.35 m - Carbonate CLAY- occasionally shells and shell fragments- with thin laminae of silt- with thin laminae of shell fragments
27.90 57 49
28.00 46.3
28.15 52.2 18.5 12.2 19 47 28 73
12 28.50 28.50 m to 29.25 m - Grey carbonate CLAY- with thin laminae of silt- with thin laminae of shell fragements
54.6
28.80 47.9 18.6 12.6 58
28.90 45.6 18.5 12.7 20 52 32 68
29.20 43.6
29.25 29.25 m to 29.28 m - Carbonate SILT- with thin laminae of clay
29.28 29.28 m to 29.30 m - SHELL DEBRIS
29.30 29.30 m to 29.33 m - Carbonate CLAY
13 32.50 32.50 m to 33.25 m - Grey carbonate CLAY, with shellsand shell fragments
40.4
PE
EJA
Y-1 JA
CK
-UP
SITE IN
VE
STIG
ATIO
N - B
AS
S S
TRA
IT, OFFSH
OR
E A
US
TRA
LIA
Plate C
2-4
GeODin/Laboratory Classification Test Results (with Ground Descriptions)with UU.GLO/2008-02-27 15:28:38
LOC
ATIO
N P
EE
JAY
-1_02LA
BO
RA
TOR
Y CLA
SSIFICA
TION
TEST RESU
LTS
Sample Unit Weight [kN/m³] Atterberg Limits cu [kPa]Depth
[m]
w
[%]
γ
[Mg/m³]
Carb.Cont.
Org.Cont.
[%] [%] [%][%] [%] [%]
Fines PP TV UUNo. LVγd γd
min.γd
max.Ground Description ρs wp wL Ip
Key: w :
:water contentunit weight of groundγ
: dry unit weight of groundγ d
: minimum index unit weightγdmin
: maximum index unit weightγdmax
: density of solid particlesρs
: carbonate contentCarb.Cont.: organic matter contentOrg.Cont.
w : plastic limitp
w : liquid limitL
I : plasticity indexp
Fines : mass percentage of material passing 63 µm or 75 µm sieve
PP : pocket penetrometerTV : torvaneFC : fall coneLV : laboratory vane
: undrained shear strengthcu:10r r refers to test on remoulded soil
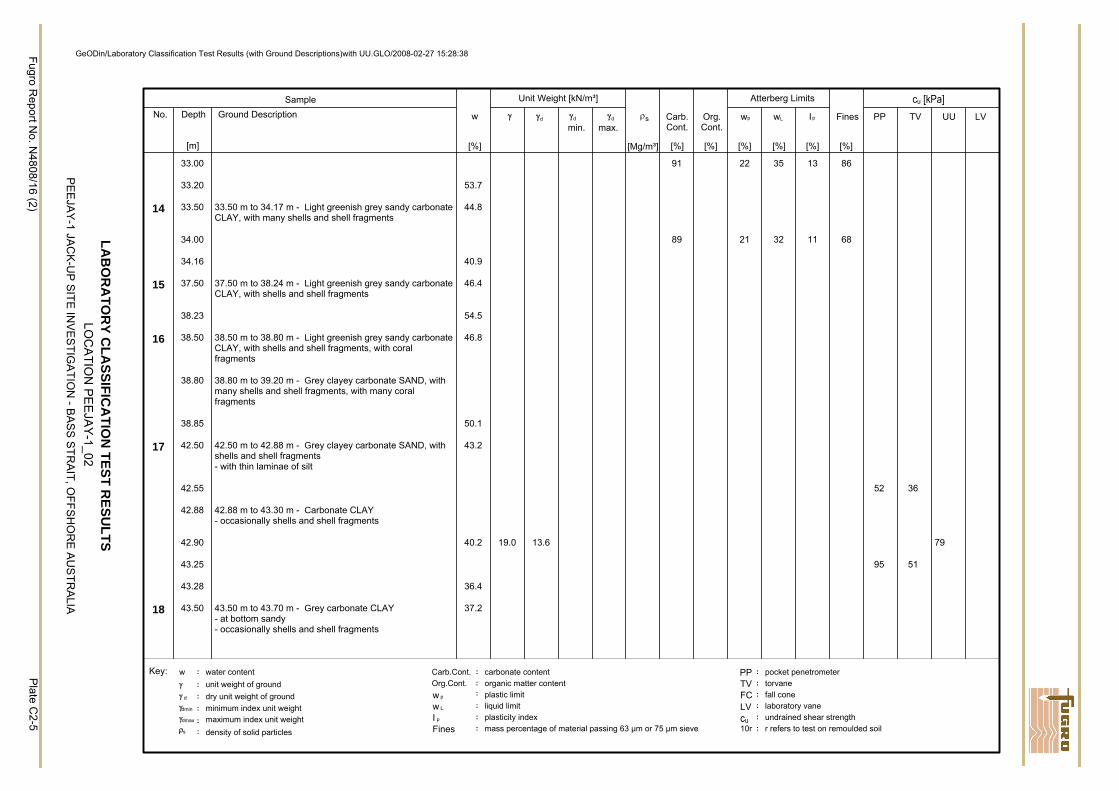
Fugro Report N
o. N4808/16 (2)
33.00 91 22 35 13 86
33.20 53.7
14 33.50 33.50 m to 34.17 m - Light greenish grey sandy carbonateCLAY, with many shells and shell fragments
44.8
34.00 89 21 32 11 68
34.16 40.9
15 37.50 37.50 m to 38.24 m - Light greenish grey sandy carbonateCLAY, with shells and shell fragments
46.4
38.23 54.5
16 38.50 38.50 m to 38.80 m - Light greenish grey sandy carbonateCLAY, with shells and shell fragments, with coralfragments
46.8
38.80 38.80 m to 39.20 m - Grey clayey carbonate SAND, withmany shells and shell fragments, with many coralfragments
38.85 50.1
17 42.50 42.50 m to 42.88 m - Grey clayey carbonate SAND, withshells and shell fragments- with thin laminae of silt
43.2
42.55 52 36
42.88 42.88 m to 43.30 m - Carbonate CLAY- occasionally shells and shell fragments
42.90 40.2 19.0 13.6 79
43.25 95 51
43.28 36.4
18 43.50 43.50 m to 43.70 m - Grey carbonate CLAY- at bottom sandy- occasionally shells and shell fragments
37.2
PE
EJA
Y-1 JA
CK
-UP
SITE IN
VE
STIG
ATIO
N - B
AS
S S
TRA
IT, OFFSH
OR
E A
US
TRA
LIA
Plate C
2-5
GeODin/Laboratory Classification Test Results (with Ground Descriptions)with UU.GLO/2008-02-27 15:28:38
LOC
ATIO
N P
EE
JAY
-1_02LA
BO
RA
TOR
Y CLA
SSIFICA
TION
TEST RESU
LTS
Sample Unit Weight [kN/m³] Atterberg Limits cu [kPa]Depth
[m]
w
[%]
γ
[Mg/m³]
Carb.Cont.
Org.Cont.
[%] [%] [%][%] [%] [%]
Fines PP TV UUNo. LVγd γd
min.γd
max.Ground Description ρs wp wL Ip
Key: w :
:water contentunit weight of groundγ
: dry unit weight of groundγ d
: minimum index unit weightγdmin
: maximum index unit weightγdmax
: density of solid particlesρs
: carbonate contentCarb.Cont.: organic matter contentOrg.Cont.
w : plastic limitp
w : liquid limitL
I : plasticity indexp
Fines : mass percentage of material passing 63 µm or 75 µm sieve
PP : pocket penetrometerTV : torvaneFC : fall coneLV : laboratory vane
: undrained shear strengthcu:10r r refers to test on remoulded soil
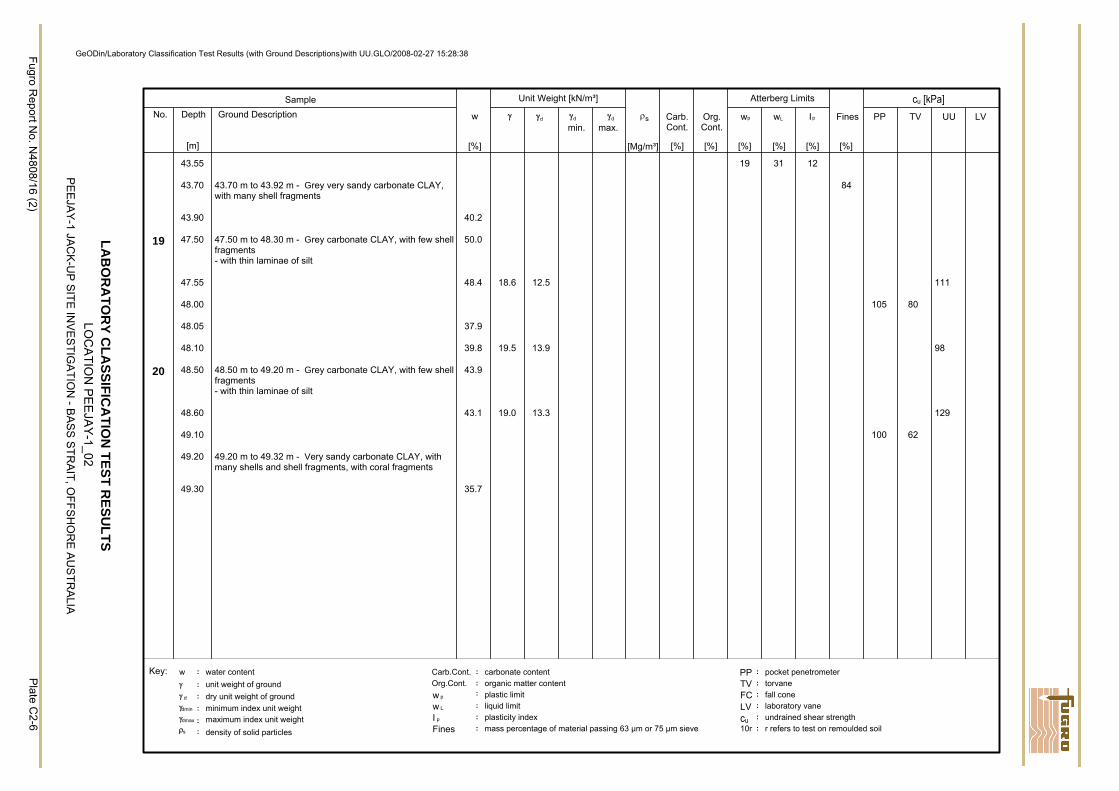
Fugro Report N
o. N4808/16 (2)
43.55 19 31 12
43.70 43.70 m to 43.92 m - Grey very sandy carbonate CLAY,with many shell fragments
84
43.90 40.2
19 47.50 47.50 m to 48.30 m - Grey carbonate CLAY, with few shellfragments- with thin laminae of silt
50.0
47.55 48.4 18.6 12.5 111
48.00 105 80
48.05 37.9
48.10 39.8 19.5 13.9 98
20 48.50 48.50 m to 49.20 m - Grey carbonate CLAY, with few shellfragments- with thin laminae of silt
43.9
48.60 43.1 19.0 13.3 129
49.10 100 62
49.20 49.20 m to 49.32 m - Very sandy carbonate CLAY, withmany shells and shell fragments, with coral fragments
49.30 35.7
PE
EJA
Y-1 JA
CK
-UP
SITE IN
VE
STIG
ATIO
N - B
AS
S S
TRA
IT, OFFSH
OR
E A
US
TRA
LIA
Plate C
2-6
GeODin/Laboratory Classification Test Results (with Ground Descriptions)with UU.GLO/2008-02-27 15:28:38
LOC
ATIO
N P
EE
JAY
-1_02LA
BO
RA
TOR
Y CLA
SSIFICA
TION
TEST RESU
LTS
Sample Unit Weight [kN/m³] Atterberg Limits cu [kPa]Depth
[m]
w
[%]
γ
[Mg/m³]
Carb.Cont.
Org.Cont.
[%] [%] [%][%] [%] [%]
Fines PP TV UUNo. LVγd γd
min.γd
max.Ground Description ρs wp wL Ip
Key: w :
:water contentunit weight of groundγ
: dry unit weight of groundγ d
: minimum index unit weightγdmin
: maximum index unit weightγdmax
: density of solid particlesρs
: carbonate contentCarb.Cont.: organic matter contentOrg.Cont.
w : plastic limitp
w : liquid limitL
I : plasticity indexp
Fines : mass percentage of material passing 63 µm or 75 µm sieve
PP : pocket penetrometerTV : torvaneFC : fall coneLV : laboratory vane
: undrained shear strengthcu:10r r refers to test on remoulded soil
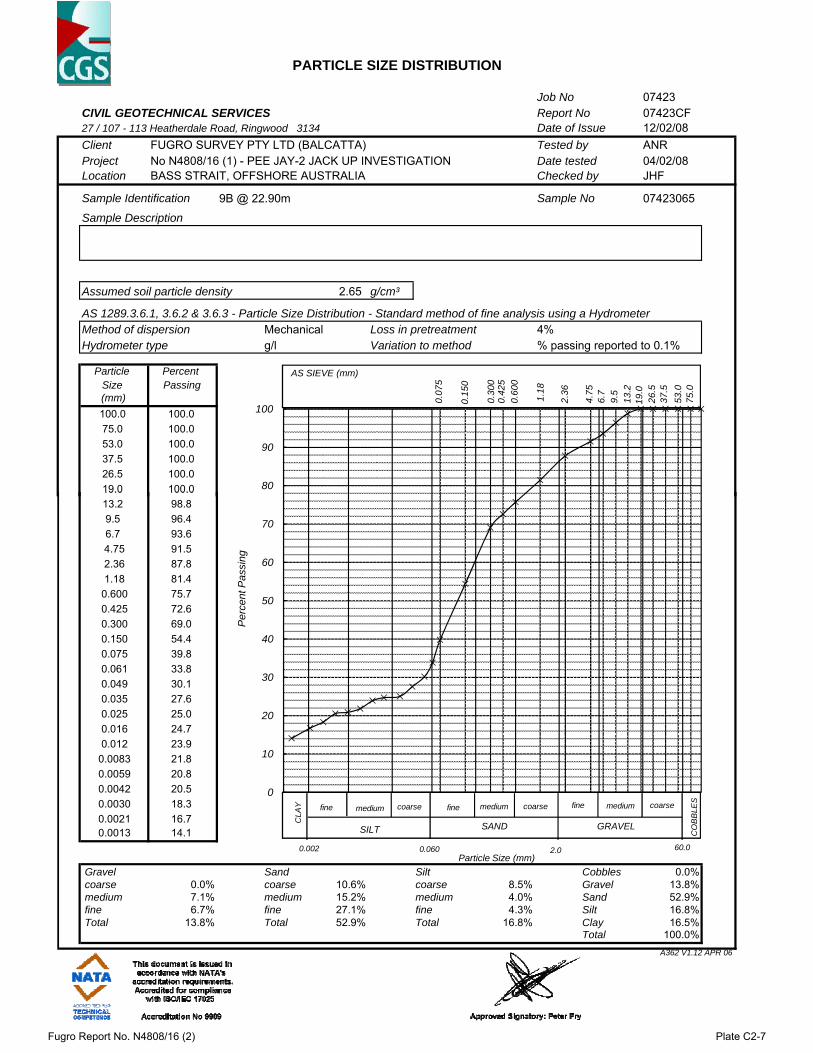
PARTICLE SIZE DISTRIBUTION
Job No 07423CIVIL GEOTECHNICAL SERVICES Report No 07423CF27 / 107 - 113 Heatherdale Road, Ringwood 3134 Date of Issue 12/02/08Client FUGRO SURVEY PTY LTD (BALCATTA) Tested by ANRProject No N4808/16 (1) - PEE JAY-2 JACK UP INVESTIGATION Date tested 04/02/08Location BASS STRAIT, OFFSHORE AUSTRALIA Checked by JHF
Sample Identification 9B @ 22.90m Sample No 07423065
Sample Description
Assumed soil particle density 2.65 g/cm³
AS 1289.3.6.1, 3.6.2 & 3.6.3 - Particle Size Distribution - Standard method of fine analysis using a HydrometerMethod of dispersion Mechanical Loss in pretreatment 4%Hydrometer type g/l Variation to method % passing reported to 0.1%
Particle Percent Size Passing(mm)100.0 100.075.0 100.053.0 100.037.5 100.026.5 100.019.0 100.0 80
90
100
AS SIEVE (mm)
0.07
5
0.15
0
0.30
00.
425
0.60
0
1.18
2.36
4.75
6.7
9.5
13.2
19.0
26.5
37.5
53.0
75.0
19.0 100.013.2 98.89.5 96.46.7 93.64.75 91.52.36 87.81.18 81.40.600 75.70.425 72.60.300 69.00.150 54.40.075 39.80.061 33.80.049 30.10.035 27.60.025 25.00.016 24.70.012 23.9
0.0083 21.80.0059 20.80.0042 20.50.0030 18.30.0021 16.70.0013 14.1
Gravel Sand Silt Cobbles 0.0% coarse 0.0% coarse 10.6% coarse 8.5% Gravel 13.8% medium 7.1% medium 15.2% medium 4.0% Sand 52.9% fine 6.7% fine 27.1% fine 4.3% Silt 16.8% Total 13.8% Total 52.9% Total 16.8% Clay 16.5%
Total 100.0%A362 V1.12 APR 06
0
10
20
30
40
50
60
70
CLA
Y fine medium coarse
SILT
fine medium coarse
SAND
fine medium coarse
GRAVEL
CO
BB
LES
Per
cent
Pas
sing
Particle Size (mm)60.02.00.002 0.060
Fugro Report No. N4808/16 (2) Plate C2-7
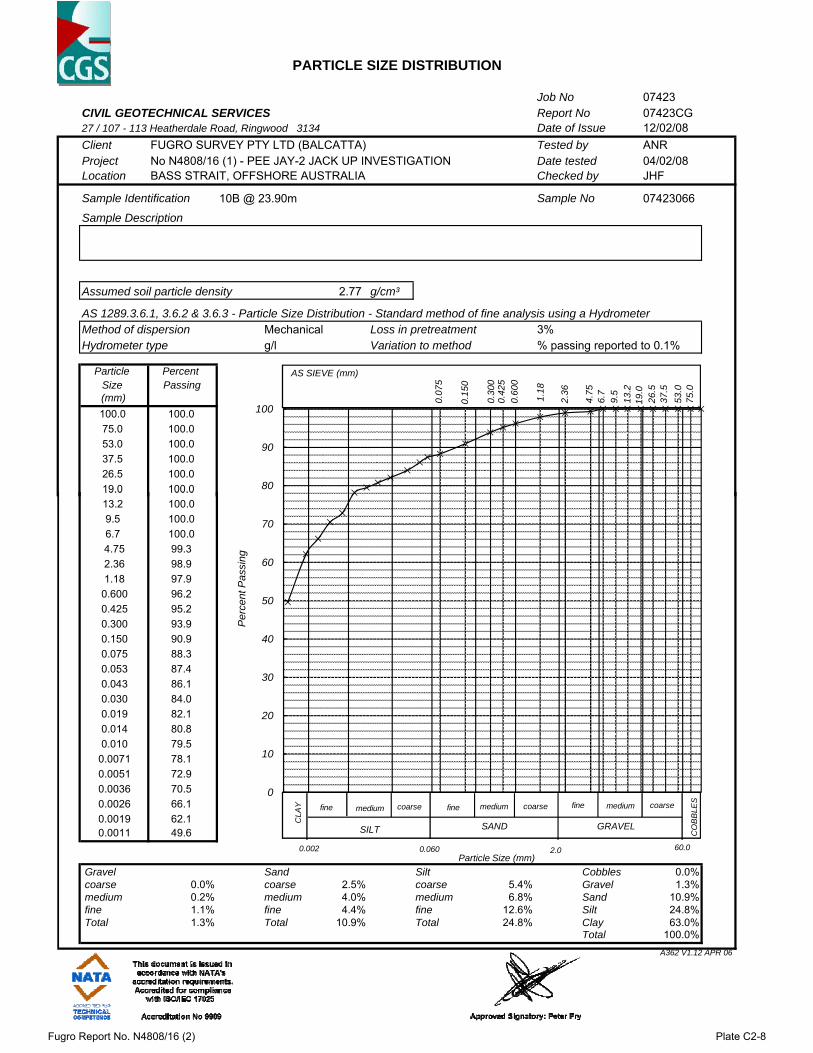
PARTICLE SIZE DISTRIBUTION
Job No 07423CIVIL GEOTECHNICAL SERVICES Report No 07423CG27 / 107 - 113 Heatherdale Road, Ringwood 3134 Date of Issue 12/02/08Client FUGRO SURVEY PTY LTD (BALCATTA) Tested by ANRProject No N4808/16 (1) - PEE JAY-2 JACK UP INVESTIGATION Date tested 04/02/08Location BASS STRAIT, OFFSHORE AUSTRALIA Checked by JHF
Sample Identification 10B @ 23.90m Sample No 07423066
Sample Description
Assumed soil particle density 2.77 g/cm³
AS 1289.3.6.1, 3.6.2 & 3.6.3 - Particle Size Distribution - Standard method of fine analysis using a HydrometerMethod of dispersion Mechanical Loss in pretreatment 3%Hydrometer type g/l Variation to method % passing reported to 0.1%
Particle Percent Size Passing(mm)100.0 100.075.0 100.053.0 100.037.5 100.026.5 100.019.0 100.0 80
90
100
AS SIEVE (mm)
0.07
5
0.15
0
0.30
00.
425
0.60
0
1.18
2.36
4.75
6.7
9.5
13.2
19.0
26.5
37.5
53.0
75.0
19.0 100.013.2 100.09.5 100.06.7 100.04.75 99.32.36 98.91.18 97.90.600 96.20.425 95.20.300 93.90.150 90.90.075 88.30.053 87.40.043 86.10.030 84.00.019 82.10.014 80.80.010 79.5
0.0071 78.10.0051 72.90.0036 70.50.0026 66.10.0019 62.10.0011 49.6
Gravel Sand Silt Cobbles 0.0% coarse 0.0% coarse 2.5% coarse 5.4% Gravel 1.3% medium 0.2% medium 4.0% medium 6.8% Sand 10.9% fine 1.1% fine 4.4% fine 12.6% Silt 24.8% Total 1.3% Total 10.9% Total 24.8% Clay 63.0%
Total 100.0%A362 V1.12 APR 06
0
10
20
30
40
50
60
70
CLA
Y fine medium coarse
SILT
fine medium coarse
SAND
fine medium coarse
GRAVEL
CO
BB
LES
Per
cent
Pas
sing
Particle Size (mm)60.02.00.002 0.060
Fugro Report No. N4808/16 (2) Plate C2-8

PARTICLE SIZE DISTRIBUTION
Job No 07423CIVIL GEOTECHNICAL SERVICES Report No 07423CH27 / 107 - 113 Heatherdale Road, Ringwood 3134 Date of Issue 12/02/08Client FUGRO SURVEY PTY LTD (BALCATTA) Tested by ANRProject No N4808/16 (1) - PEE JAY-2 JACK UP INVESTIGATION Date tested 04/02/08Location BASS STRAIT, OFFSHORE AUSTRALIA Checked by JHF
Sample Identification 13B @ 33.00m Sample No 07423069
Sample Description
Assumed soil particle density 2.80 g/cm³
AS 1289.3.6.1, 3.6.2 & 3.6.3 - Particle Size Distribution - Standard method of fine analysis using a HydrometerMethod of dispersion Mechanical Loss in pretreatment 3%Hydrometer type g/l Variation to method % passing reported to 0.1%
Particle Percent Size Passing(mm)100.0 100.075.0 100.053.0 100.037.5 100.026.5 100.019.0 100.0 80
90
100
AS SIEVE (mm)
0.07
5
0.15
0
0.30
00.
425
0.60
0
1.18
2.36
4.75
6.7
9.5
13.2
19.0
26.5
37.5
53.0
75.0
19.0 100.013.2 100.09.5 100.06.7 100.04.75 100.02.36 99.91.18 99.30.600 96.10.425 94.40.300 92.50.150 88.90.075 86.10.049 85.50.040 83.80.028 82.30.018 81.20.013 79.30.009 77.4
0.0066 74.90.0042 68.50.0034 65.30.0025 60.60.0018 53.90.0011 42.5
Gravel Sand Silt Cobbles 0.0% coarse 0.0% coarse 3.6% coarse 4.3% Gravel 0.2% medium 0.0% medium 5.7% medium 8.0% Sand 13.9% fine 0.2% fine 4.6% fine 17.7% Silt 30.0% Total 0.2% Total 13.9% Total 30.0% Clay 55.9%
Total 100.0%A362 V1.12 APR 06
0
10
20
30
40
50
60
70
CLA
Y fine medium coarse
SILT
fine medium coarse
SAND
fine medium coarse
GRAVEL
CO
BB
LES
Per
cent
Pas
sing
Particle Size (mm)60.02.00.002 0.060
Fugro Report No. N4808/16 (2) Plate C2-9

PARTICLE SIZE DISTRIBUTION
Job No 07423CIVIL GEOTECHNICAL SERVICES Report No 07423CI27 / 107 - 113 Heatherdale Road, Ringwood 3134 Date of Issue 12/02/08Client FUGRO SURVEY PTY LTD (BALCATTA) Tested by ANRProject No N4808/16 (1) - PEE JAY-2 JACK UP INVESTIGATION Date tested 04/02/08Location BASS STRAIT, OFFSHORE AUSTRALIA Checked by JHF
Sample Identification 14B @ 34.00m Sample No 07423070
Sample Description
Assumed soil particle density 2.65 g/cm³
AS 1289.3.6.1, 3.6.2 & 3.6.3 - Particle Size Distribution - Standard method of fine analysis using a HydrometerMethod of dispersion Mechanical Loss in pretreatment 1%Hydrometer type g/l Variation to method % passing reported to 0.1%
Particle Percent Size Passing(mm)100.0 100.075.0 100.053.0 100.037.5 100.026.5 100.019.0 100.0 80
90
100
AS SIEVE (mm)
0.07
5
0.15
0
0.30
00.
425
0.60
0
1.18
2.36
4.75
6.7
9.5
13.2
19.0
26.5
37.5
53.0
75.0
19.0 100.013.2 100.09.5 100.06.7 100.04.75 99.82.36 97.81.18 95.90.600 93.00.425 90.70.300 86.90.150 77.40.075 68.40.053 65.60.044 62.20.031 59.90.022 57.10.014 55.60.010 54.3
0.0074 49.60.0053 46.70.0038 43.70.0028 38.10.0020 34.90.0012 28.7
Gravel Sand Silt Cobbles 0.0% coarse 0.0% coarse 4.4% coarse 9.8% Gravel 2.7% medium 0.1% medium 11.6% medium 9.0% Sand 30.8% fine 2.6% fine 14.8% fine 12.8% Silt 31.6% Total 2.7% Total 30.8% Total 31.6% Clay 34.9%
Total 100.0%A362 V1.12 APR 06
0
10
20
30
40
50
60
70
CLA
Y fine medium coarse
SILT
fine medium coarse
SAND
fine medium coarse
GRAVEL
CO
BB
LES
Per
cent
Pas
sing
Particle Size (mm)60.02.00.002 0.060
Fugro Report No. N4808/16 (2) Plate C2-10

PARTICLE SIZE DISTRIBUTION
Job No 07423CIVIL GEOTECHNICAL SERVICES Report No 07423CJ27 / 107 - 113 Heatherdale Road, Ringwood 3134 Date of Issue 12/02/08Client FUGRO SURVEY PTY LTD (BALCATTA) Tested by ANRProject No N4808/16 (1) - PEE JAY-2 JACK UP INVESTIGATION Date tested 04/02/08Location BASS STRAIT, OFFSHORE AUSTRALIA Checked by JHF
Sample Identification 18B @ 43.70m Sample No 07423072
Sample Description
Assumed soil particle density 2.70 g/cm³
AS 1289.3.6.1, 3.6.2 & 3.6.3 - Particle Size Distribution - Standard method of fine analysis using a HydrometerMethod of dispersion Mechanical Loss in pretreatment 4%Hydrometer type g/l Variation to method % passing reported to 0.1%
Particle Percent Size Passing(mm)100.0 100.075.0 100.053.0 100.037.5 100.026.5 100.019.0 100.0 80
90
100
AS SIEVE (mm)
0.07
5
0.15
0
0.30
00.
425
0.60
0
1.18
2.36
4.75
6.7
9.5
13.2
19.0
26.5
37.5
53.0
75.0
19.0 100.013.2 100.09.5 100.06.7 100.04.75 100.02.36 100.01.18 99.40.600 98.40.425 97.50.300 95.80.150 89.90.075 84.20.053 80.90.043 75.70.031 68.40.020 63.80.014 59.30.011 55.2
0.0076 50.60.0054 47.90.0039 41.50.0028 38.90.0020 37.00.0012 33.5
Gravel Sand Silt Cobbles 0.0% coarse 0.0% coarse 1.5% coarse 18.3% Gravel 0.1% medium 0.0% medium 6.1% medium 15.2% Sand 17.8% fine 0.1% fine 10.2% fine 11.6% Silt 45.1% Total 0.1% Total 17.8% Total 45.1% Clay 37.0%
Total 100.0%A362 V1.12 APR 06
0
10
20
30
40
50
60
70
CLA
Y fine medium coarse
SILT
fine medium coarse
SAND
fine medium coarse
GRAVEL
CO
BB
LES
Per
cent
Pas
sing
Particle Size (mm)60.02.00.002 0.060
Fugro Report No. N4808/16 (2) Plate C2-11
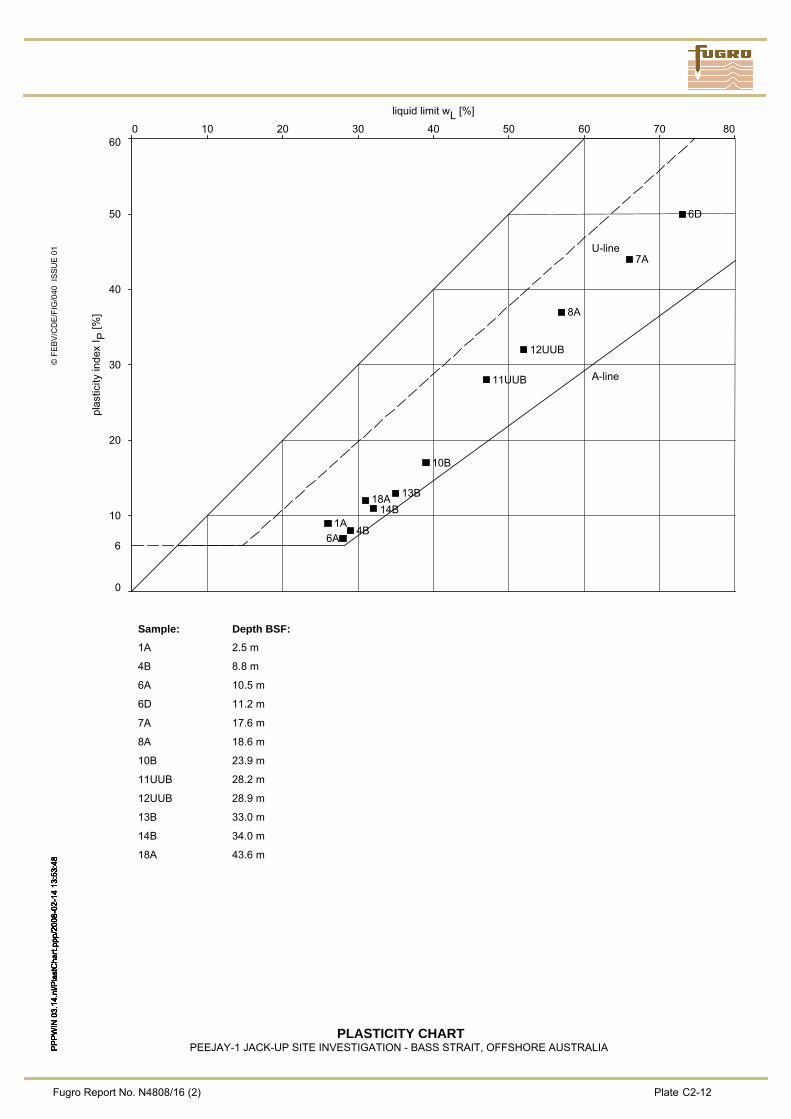
© F
EBV/
CD
E/FI
G/0
40 I
SS
UE
01
PPPW
IN 0
3.14
.nl/P
last
Cha
rt.pp
p/20
08-0
2-14
13:
53:4
8PP
PWIN
03.
14.n
l/Pla
stC
hart.
ppp/
2008
-02-
14 1
3:53
:48
PPPW
IN 0
3.14
.nl/P
last
Cha
rt.pp
p/20
08-0
2-14
13:
53:4
8PP
PWIN
03.
14.n
l/Pla
stC
hart.
ppp/
2008
-02-
14 1
3:53
:48
Fugro Report No. N4808/16 (2) Plate
PLASTICITY CHARTPEEJAY-1 JACK-UP SITE INVESTIGATION - BASS STRAIT, OFFSHORE AUSTRALIAPP
PWIN
03.
14.n
l/Pla
stC
hart.
ppp/
2008
-02-
14 1
3:53
:48
C2-12
0 10 20 30 40 50 60 70 80
liquid limit wL [%]
0
10
20
30
40
50
60
plas
ticity
inde
x I P
[%]
1A 4B
6A
6D
7A
8A
10B
11UUB
12UUB
13B 14B
18A
Sample: 1A
4B
6A
6D
7A
8A
10B
11UUB
12UUB
13B
14B
18A
Depth BSF: 2.5 m
8.8 m
10.5 m
11.2 m
17.6 m
18.6 m
23.9 m
28.2 m
28.9 m
33.0 m
34.0 m
43.6 m
6
A-line
U-line
Fugro Report No. N4808/16 (2) Table of Contents - Section C3 Page 1 of 1
SECTION C3
TRIAXIAL TESTS LIST OF PLATES IN SECTION C3: Plate
Unconsolidated Undrained Triaxial Test .......................................................................................C3-1 to C3-11
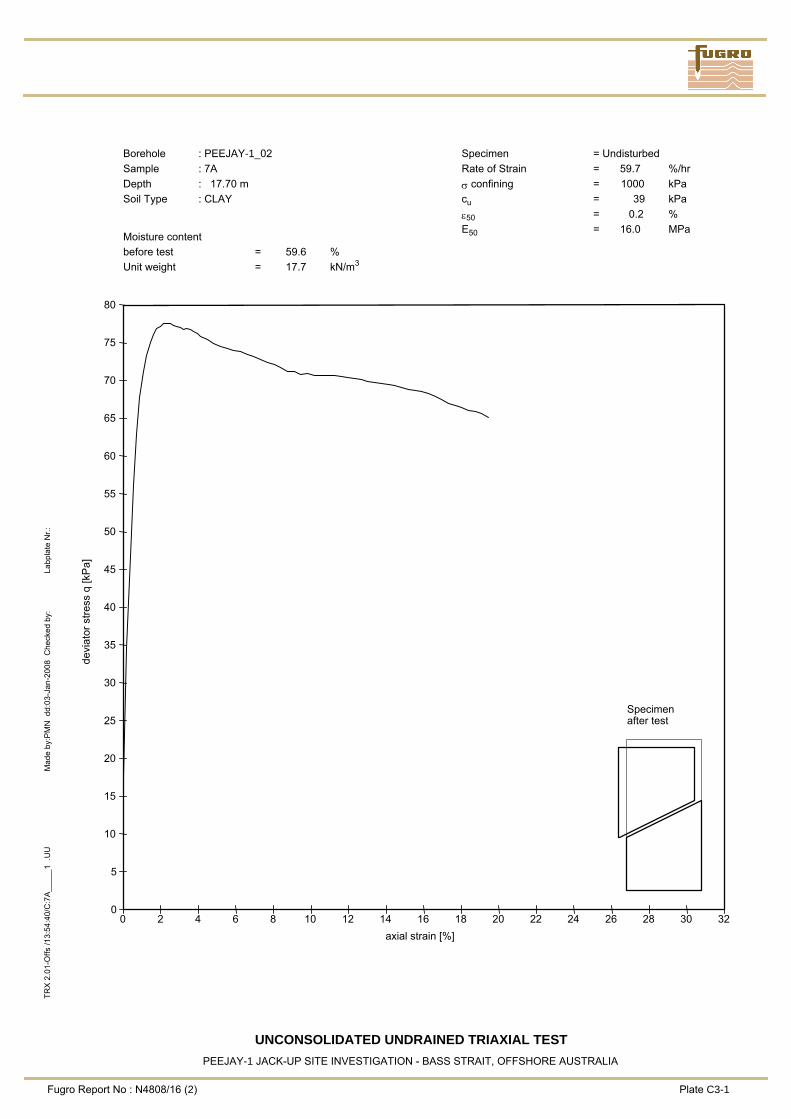
devi
ator
stre
ss q
[kP
a]
axial strain [%]0 2 4 6 8 10 12 14 16 18 20 22 24 26 28 30 32
0
5
10
15
20
25
30
35
40
45
50
55
60
65
70
75
80
Borehole : PEEJAY-1_02Sample : 7ADepth : 17.70 mSoil Type : CLAY Moisture contentbefore test = 59.6 %Unit weight = 17.7 kN/m3
Specimen = UndisturbedRate of Strain = 59.7 %/hrσ confining = 1000 kPacu = 39 kPaε50 = 0.2 %E50 = 16.0 MPa
Specimenafter test
UNCONSOLIDATED UNDRAINED TRIAXIAL TESTPEEJAY-1 JACK-UP SITE INVESTIGATION - BASS STRAIT, OFFSHORE AUSTRALIA
Fugro Report No : N4808/16 (2) Plate C3-1
TRX
2.0
1-O
ffs /1
3:54
:40/
C:7
A__
___1
.U
UM
ade
by:P
MN
dd:
03-J
an-2
008
Che
cked
by:
Labp
late
Nr.:
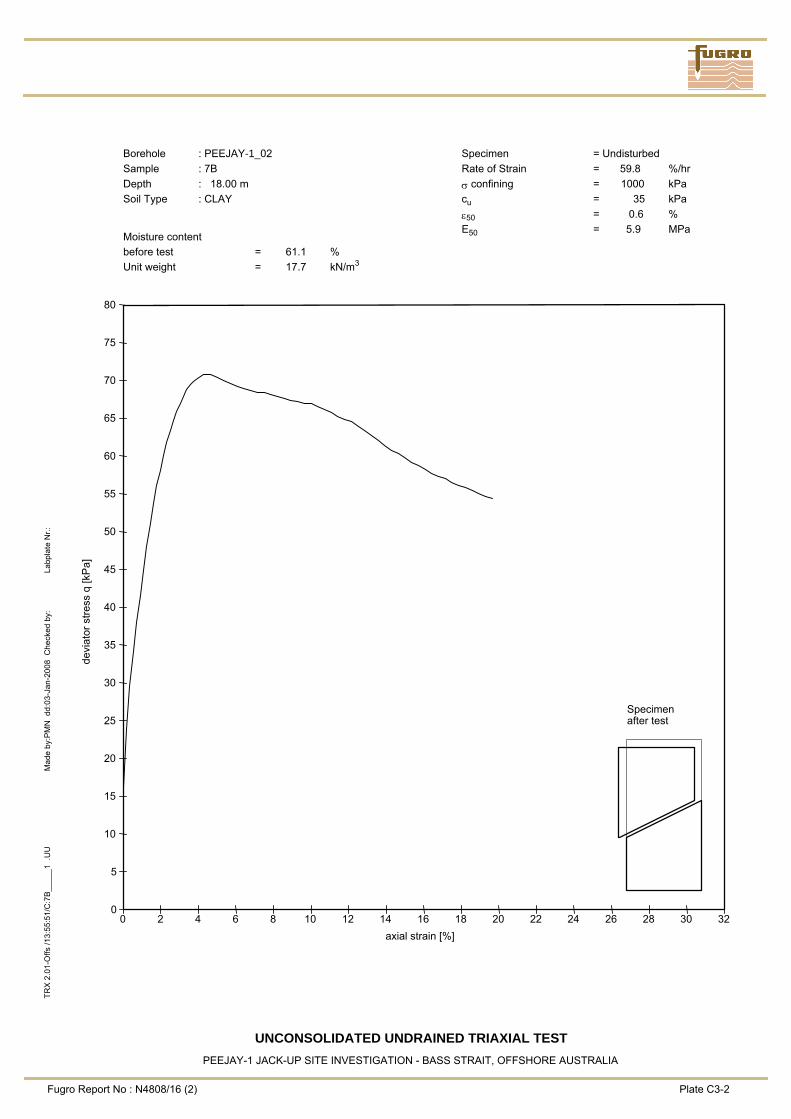
devi
ator
stre
ss q
[kP
a]
axial strain [%]0 2 4 6 8 10 12 14 16 18 20 22 24 26 28 30 32
0
5
10
15
20
25
30
35
40
45
50
55
60
65
70
75
80
Borehole : PEEJAY-1_02Sample : 7BDepth : 18.00 mSoil Type : CLAY Moisture contentbefore test = 61.1 %Unit weight = 17.7 kN/m3
Specimen = UndisturbedRate of Strain = 59.8 %/hrσ confining = 1000 kPacu = 35 kPaε50 = 0.6 %E50 = 5.9 MPa
Specimenafter test
UNCONSOLIDATED UNDRAINED TRIAXIAL TESTPEEJAY-1 JACK-UP SITE INVESTIGATION - BASS STRAIT, OFFSHORE AUSTRALIA
Fugro Report No : N4808/16 (2) Plate C3-2
TRX
2.0
1-O
ffs /1
3:55
:51/
C:7
B__
___1
.U
UM
ade
by:P
MN
dd:
03-J
an-2
008
Che
cked
by:
Labp
late
Nr.:
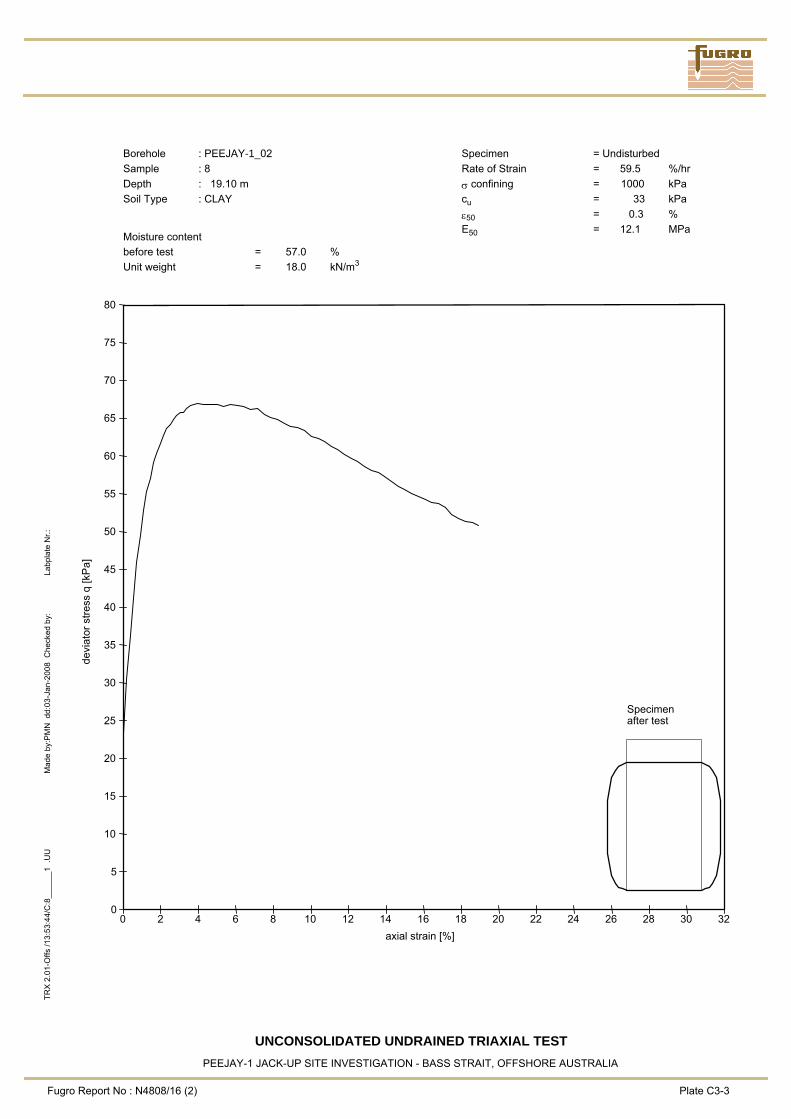
devi
ator
stre
ss q
[kP
a]
axial strain [%]0 2 4 6 8 10 12 14 16 18 20 22 24 26 28 30 32
0
5
10
15
20
25
30
35
40
45
50
55
60
65
70
75
80
Borehole : PEEJAY-1_02Sample : 8Depth : 19.10 mSoil Type : CLAY Moisture contentbefore test = 57.0 %Unit weight = 18.0 kN/m3
Specimen = UndisturbedRate of Strain = 59.5 %/hrσ confining = 1000 kPacu = 33 kPaε50 = 0.3 %E50 = 12.1 MPa
Specimenafter test
UNCONSOLIDATED UNDRAINED TRIAXIAL TESTPEEJAY-1 JACK-UP SITE INVESTIGATION - BASS STRAIT, OFFSHORE AUSTRALIA
Fugro Report No : N4808/16 (2) Plate C3-3
TRX
2.0
1-O
ffs /1
3:53
:44/
C:8
____
__1
.UU
Mad
e by
:PM
N d
d:03
-Jan
-200
8 C
heck
ed b
y:La
bpla
te N
r.:
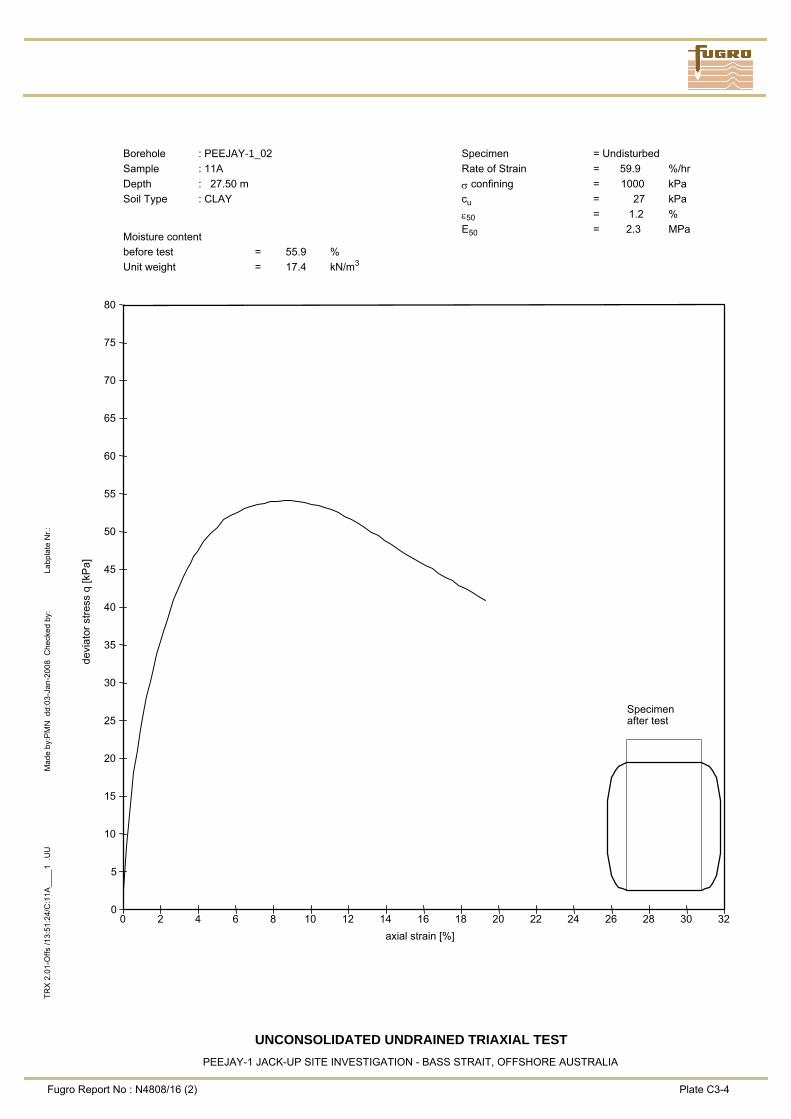
devi
ator
stre
ss q
[kP
a]
axial strain [%]0 2 4 6 8 10 12 14 16 18 20 22 24 26 28 30 32
0
5
10
15
20
25
30
35
40
45
50
55
60
65
70
75
80
Borehole : PEEJAY-1_02Sample : 11ADepth : 27.50 mSoil Type : CLAY Moisture contentbefore test = 55.9 %Unit weight = 17.4 kN/m3
Specimen = UndisturbedRate of Strain = 59.9 %/hrσ confining = 1000 kPacu = 27 kPaε50 = 1.2 %E50 = 2.3 MPa
Specimenafter test
UNCONSOLIDATED UNDRAINED TRIAXIAL TESTPEEJAY-1 JACK-UP SITE INVESTIGATION - BASS STRAIT, OFFSHORE AUSTRALIA
Fugro Report No : N4808/16 (2) Plate C3-4
TRX
2.0
1-O
ffs /1
3:51
:24/
C:1
1A__
__1
.UU
Mad
e by
:PM
N d
d:03
-Jan
-200
8 C
heck
ed b
y:La
bpla
te N
r.:
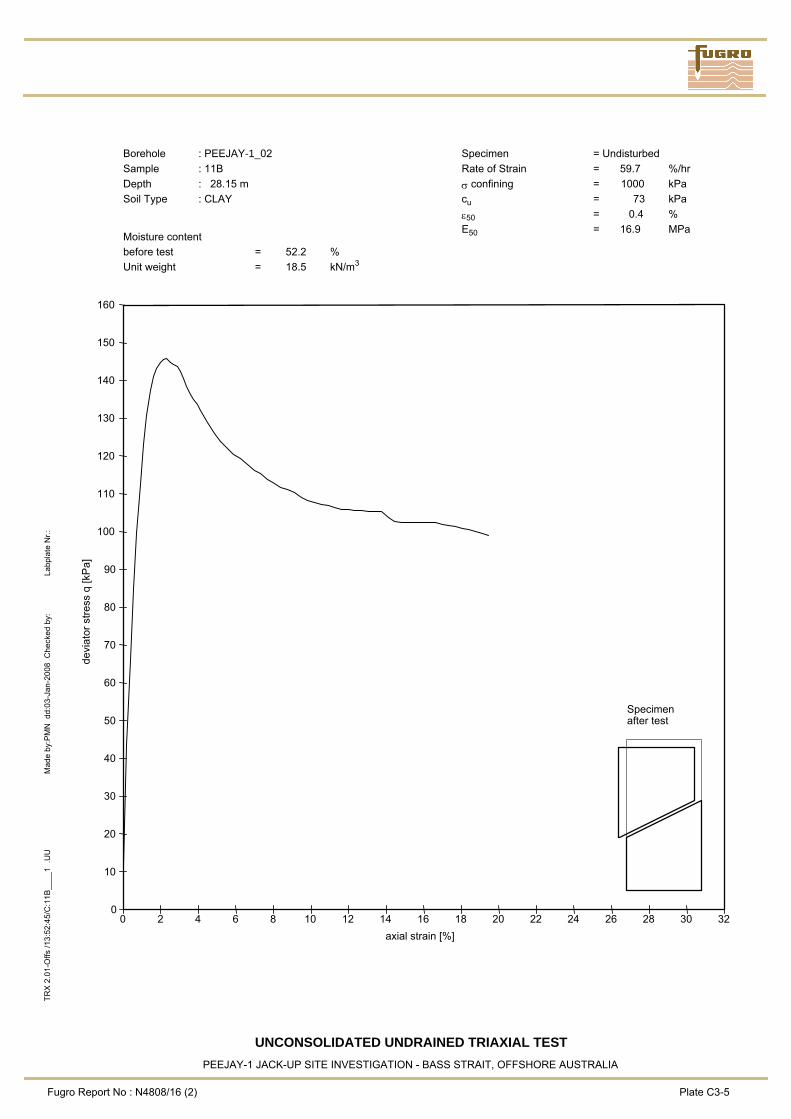
devi
ator
stre
ss q
[kP
a]
axial strain [%]0 2 4 6 8 10 12 14 16 18 20 22 24 26 28 30 32
0
10
20
30
40
50
60
70
80
90
100
110
120
130
140
150
160
Borehole : PEEJAY-1_02Sample : 11BDepth : 28.15 mSoil Type : CLAY Moisture contentbefore test = 52.2 %Unit weight = 18.5 kN/m3
Specimen = UndisturbedRate of Strain = 59.7 %/hrσ confining = 1000 kPacu = 73 kPaε50 = 0.4 %E50 = 16.9 MPa
Specimenafter test
UNCONSOLIDATED UNDRAINED TRIAXIAL TESTPEEJAY-1 JACK-UP SITE INVESTIGATION - BASS STRAIT, OFFSHORE AUSTRALIA
Fugro Report No : N4808/16 (2) Plate C3-5
TRX
2.0
1-O
ffs /1
3:52
:45/
C:1
1B__
__1
.UU
Mad
e by
:PM
N d
d:03
-Jan
-200
8 C
heck
ed b
y:La
bpla
te N
r.:

devi
ator
stre
ss q
[kP
a]
axial strain [%]0 2 4 6 8 10 12 14 16 18 20 22 24 26 28 30 32
0
10
20
30
40
50
60
70
80
90
100
110
120
130
140
150
160
Borehole : PEEJAY-1_02Sample : 12ADepth : 28.80 mSoil Type : CLAY Moisture contentbefore test = 47.9 %Unit weight = 18.6 kN/m3
Specimen = UndisturbedRate of Strain = 60.0 %/hrσ confining = 1000 kPacu = 58 kPaε50 = 0.6 %E50 = 9.4 MPa
Specimenafter test
UNCONSOLIDATED UNDRAINED TRIAXIAL TESTPEEJAY-1 JACK-UP SITE INVESTIGATION - BASS STRAIT, OFFSHORE AUSTRALIA
Fugro Report No : N4808/16 (2) Plate C3-6
TRX
2.0
1-O
ffs /1
3:50
:24/
C:1
2A__
__1
.UU
Mad
e by
:PM
N d
d:03
-Jan
-200
8 C
heck
ed b
y:La
bpla
te N
r.:
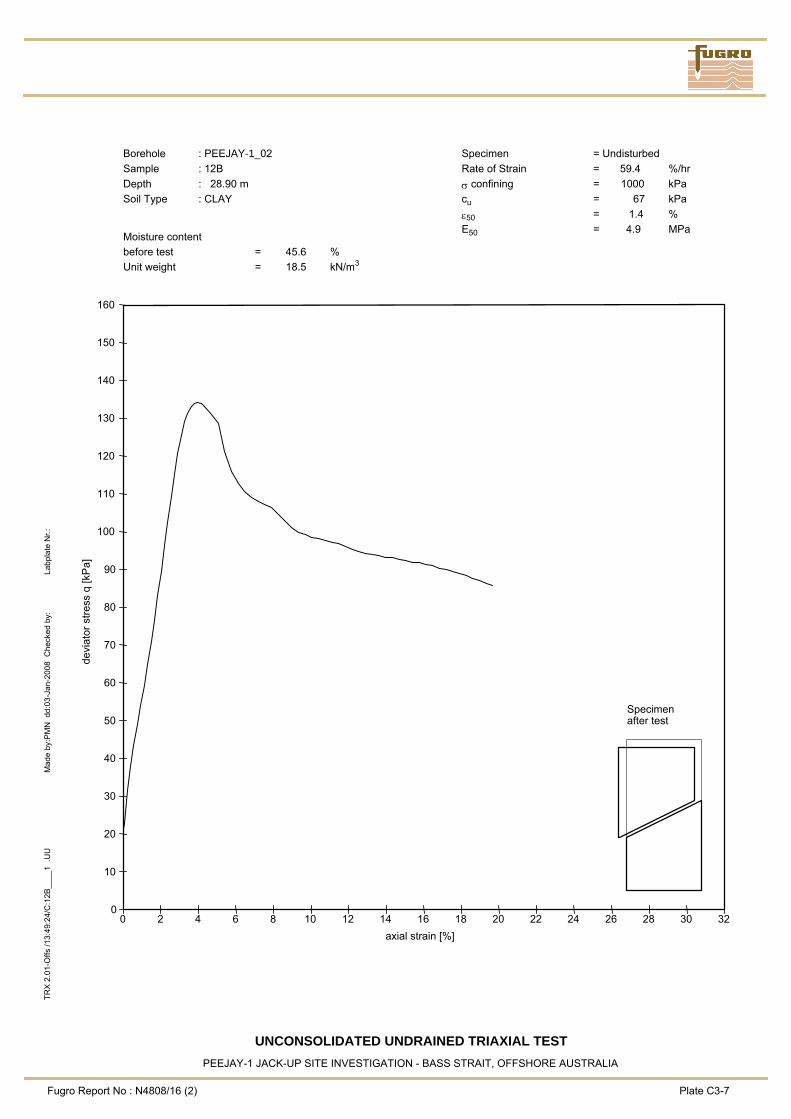
devi
ator
stre
ss q
[kP
a]
axial strain [%]0 2 4 6 8 10 12 14 16 18 20 22 24 26 28 30 32
0
10
20
30
40
50
60
70
80
90
100
110
120
130
140
150
160
Borehole : PEEJAY-1_02Sample : 12BDepth : 28.90 mSoil Type : CLAY Moisture contentbefore test = 45.6 %Unit weight = 18.5 kN/m3
Specimen = UndisturbedRate of Strain = 59.4 %/hrσ confining = 1000 kPacu = 67 kPaε50 = 1.4 %E50 = 4.9 MPa
Specimenafter test
UNCONSOLIDATED UNDRAINED TRIAXIAL TESTPEEJAY-1 JACK-UP SITE INVESTIGATION - BASS STRAIT, OFFSHORE AUSTRALIA
Fugro Report No : N4808/16 (2) Plate C3-7
TRX
2.0
1-O
ffs /1
3:49
:24/
C:1
2B__
__1
.UU
Mad
e by
:PM
N d
d:03
-Jan
-200
8 C
heck
ed b
y:La
bpla
te N
r.:
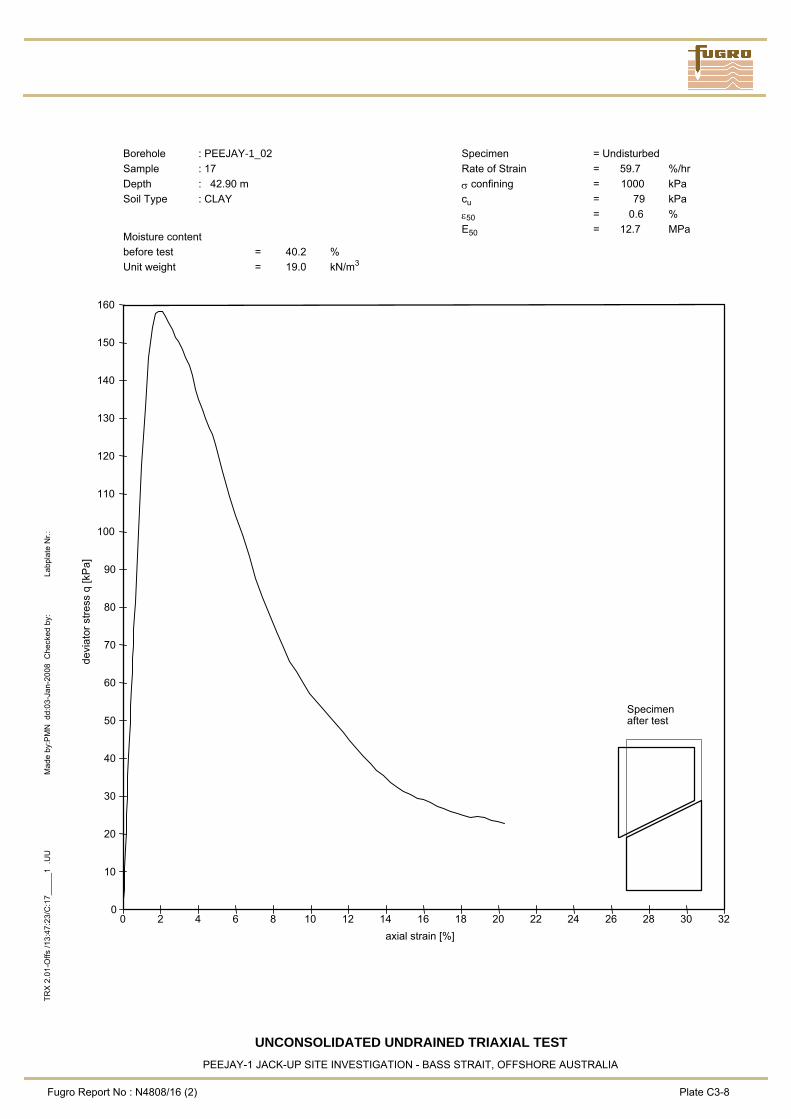
devi
ator
stre
ss q
[kP
a]
axial strain [%]0 2 4 6 8 10 12 14 16 18 20 22 24 26 28 30 32
0
10
20
30
40
50
60
70
80
90
100
110
120
130
140
150
160
Borehole : PEEJAY-1_02Sample : 17Depth : 42.90 mSoil Type : CLAY Moisture contentbefore test = 40.2 %Unit weight = 19.0 kN/m3
Specimen = UndisturbedRate of Strain = 59.7 %/hrσ confining = 1000 kPacu = 79 kPaε50 = 0.6 %E50 = 12.7 MPa
Specimenafter test
UNCONSOLIDATED UNDRAINED TRIAXIAL TESTPEEJAY-1 JACK-UP SITE INVESTIGATION - BASS STRAIT, OFFSHORE AUSTRALIA
Fugro Report No : N4808/16 (2) Plate C3-8
TRX
2.0
1-O
ffs /1
3:47
:23/
C:1
7___
__1
.UU
Mad
e by
:PM
N d
d:03
-Jan
-200
8 C
heck
ed b
y:La
bpla
te N
r.:
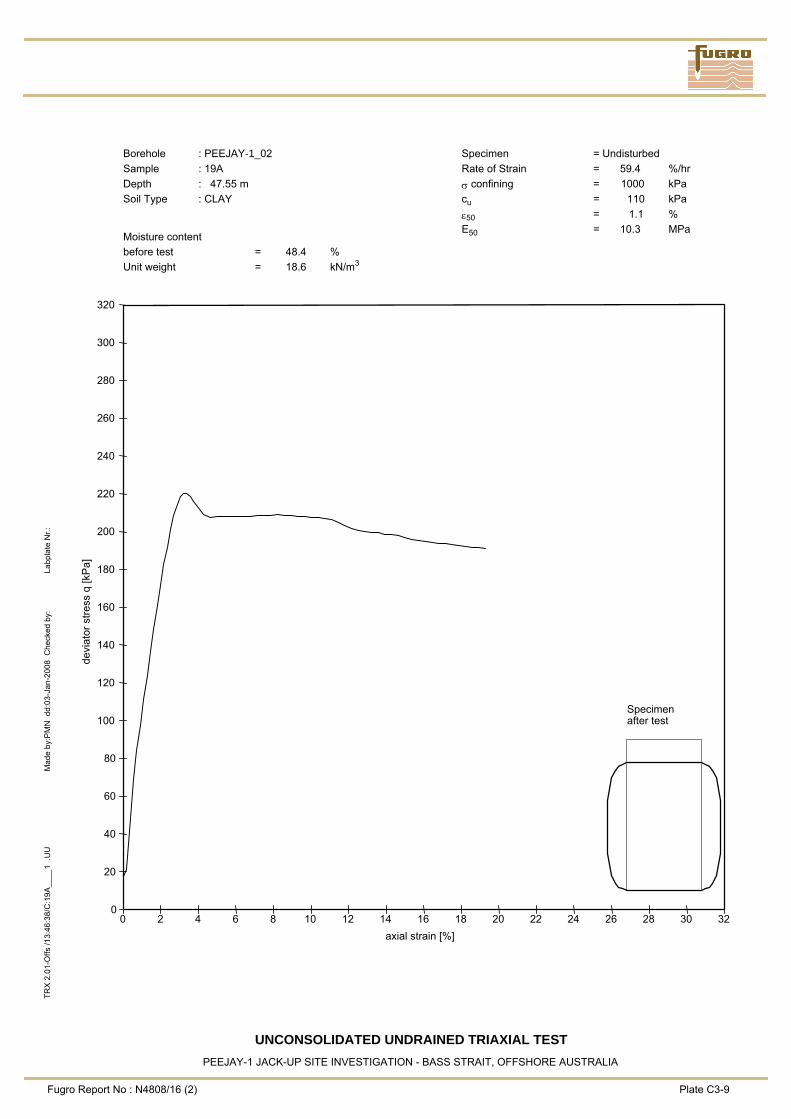
devi
ator
stre
ss q
[kP
a]
axial strain [%]0 2 4 6 8 10 12 14 16 18 20 22 24 26 28 30 32
0
20
40
60
80
100
120
140
160
180
200
220
240
260
280
300
320
Borehole : PEEJAY-1_02Sample : 19ADepth : 47.55 mSoil Type : CLAY Moisture contentbefore test = 48.4 %Unit weight = 18.6 kN/m3
Specimen = UndisturbedRate of Strain = 59.4 %/hrσ confining = 1000 kPacu = 110 kPaε50 = 1.1 %E50 = 10.3 MPa
Specimenafter test
UNCONSOLIDATED UNDRAINED TRIAXIAL TESTPEEJAY-1 JACK-UP SITE INVESTIGATION - BASS STRAIT, OFFSHORE AUSTRALIA
Fugro Report No : N4808/16 (2) Plate C3-9
TRX
2.0
1-O
ffs /1
3:46
:38/
C:1
9A__
__1
.UU
Mad
e by
:PM
N d
d:03
-Jan
-200
8 C
heck
ed b
y:La
bpla
te N
r.:
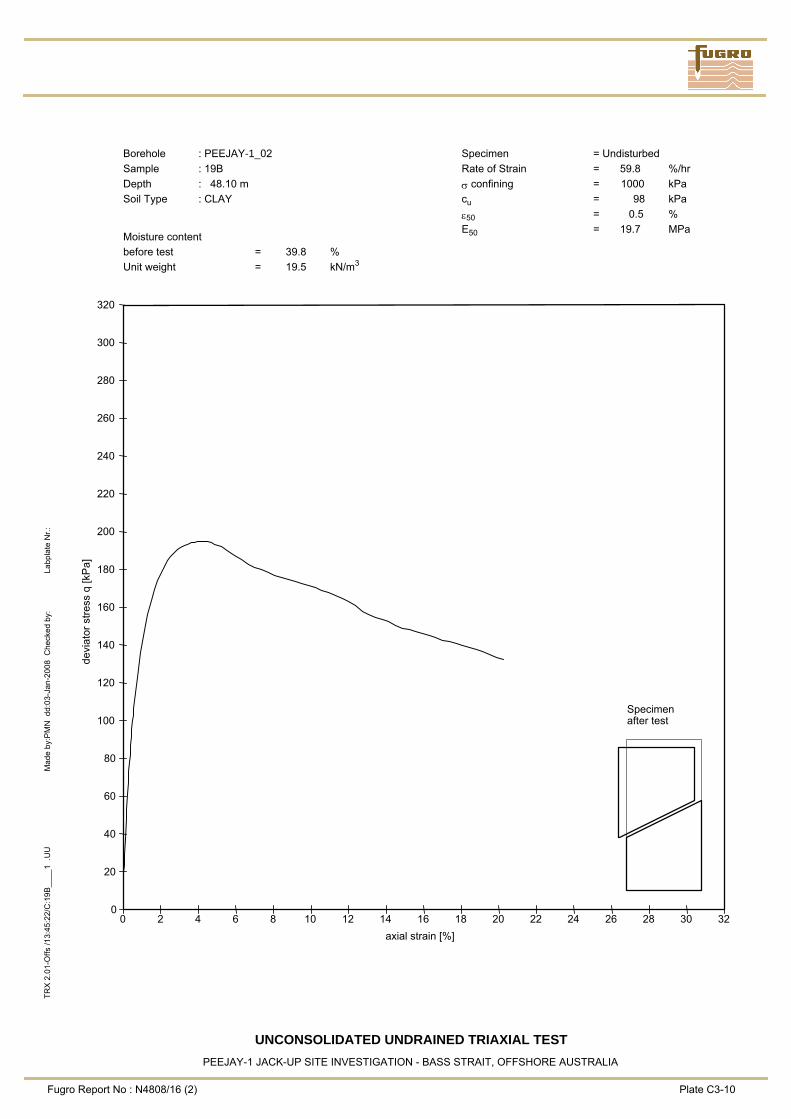
devi
ator
stre
ss q
[kP
a]
axial strain [%]0 2 4 6 8 10 12 14 16 18 20 22 24 26 28 30 32
0
20
40
60
80
100
120
140
160
180
200
220
240
260
280
300
320
Borehole : PEEJAY-1_02Sample : 19BDepth : 48.10 mSoil Type : CLAY Moisture contentbefore test = 39.8 %Unit weight = 19.5 kN/m3
Specimen = UndisturbedRate of Strain = 59.8 %/hrσ confining = 1000 kPacu = 98 kPaε50 = 0.5 %E50 = 19.7 MPa
Specimenafter test
UNCONSOLIDATED UNDRAINED TRIAXIAL TESTPEEJAY-1 JACK-UP SITE INVESTIGATION - BASS STRAIT, OFFSHORE AUSTRALIA
Fugro Report No : N4808/16 (2) Plate C3-10
TRX
2.0
1-O
ffs /1
3:45
:22/
C:1
9B__
__1
.UU
Mad
e by
:PM
N d
d:03
-Jan
-200
8 C
heck
ed b
y:La
bpla
te N
r.:
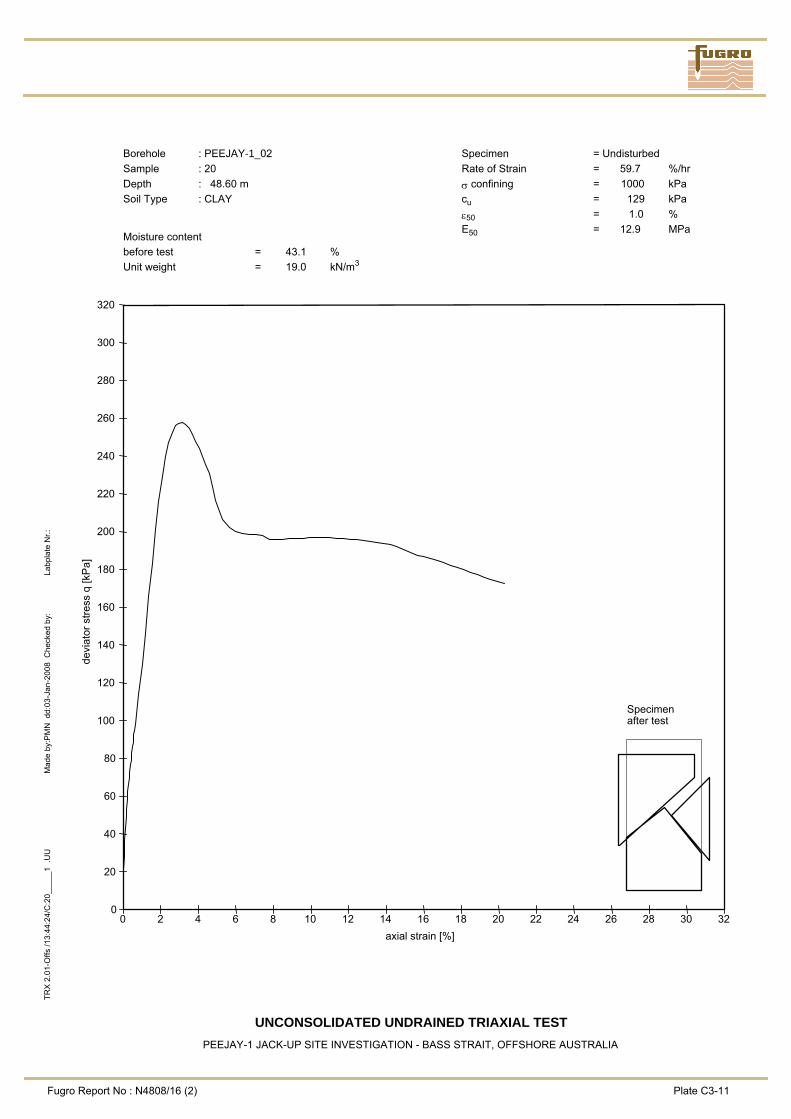
devi
ator
stre
ss q
[kP
a]
axial strain [%]0 2 4 6 8 10 12 14 16 18 20 22 24 26 28 30 32
0
20
40
60
80
100
120
140
160
180
200
220
240
260
280
300
320
Borehole : PEEJAY-1_02Sample : 20Depth : 48.60 mSoil Type : CLAY Moisture contentbefore test = 43.1 %Unit weight = 19.0 kN/m3
Specimen = UndisturbedRate of Strain = 59.7 %/hrσ confining = 1000 kPacu = 129 kPaε50 = 1.0 %E50 = 12.9 MPa
Specimenafter test
UNCONSOLIDATED UNDRAINED TRIAXIAL TESTPEEJAY-1 JACK-UP SITE INVESTIGATION - BASS STRAIT, OFFSHORE AUSTRALIA
Fugro Report No : N4808/16 (2) Plate C3-11
TRX
2.0
1-O
ffs /1
3:44
:24/
C:2
0___
__1
.UU
Mad
e by
:PM
N d
d:03
-Jan
-200
8 C
heck
ed b
y:La
bpla
te N
r.:

Fugro Report No. N4808/16 (2) Table of Contents - Section D Page 1 of 1
SECTION D
GUIDELINES FOR USE OF REPORT CONTENTS Reference Guide for Use of Report FEBV/GEN/APP/006
GUIDE FOR USE OF REPORT
FEBV/GEN/APP/006 Page 1 of 3
© F
ugro
199
6-20
07
ISSU
E 07
INTRODUCTION Fugro Engineers B.V. (FEBV) prepared this report. FEBV is a Fugro N.V. Group operating company. FEBV specialises in providing geotechnical information and engineering advice for on-land, nearshore and offshore construction projects. FEBV will hereafter be referred to as Fugro. This document provides guidelines, recommendations and limitations regarding the use of information in this report. The cost of geotechnical data acquisition, interpretation and monitoring is a small portion of the total cost of a construction project. By contrast, the costs of correcting a wrongly designed programme or mobilising alternative construction methods are often far greater than the cost of the original investigation. Attention and adherence to the guidelines and recommendations presented in this guide and in the geotechnical report can reduce delays and cost overruns related to geotechnical factors. This guide applies equally to the use of geotechnical and multi-disciplinary project information and advice. REQUIREMENTS FOR QUALITY GEOTECHNICAL INVESTIGATIONS Fugro follows ISO 9001 quality principles for project management. Project activities usually comprise part of specific phases of a construction project. The quality plan for the entire construction project must incorporate geotechnical input in every phase - from the feasibility planning stages to project completion. The parties involved must do the following. − Provide complete and accurate information necessary to plan an appropriate geotechnical site
investigation. − Describe the purpose(s), type(s) and construction methods of planned structures in detail. − Provide the time, financial, personnel and other resources necessary for the planning, execution and
follow-up of a site investigation programme. − Understand the limitations and degree of accuracy inherent in the geotechnical data and engineering
advice based upon these data. − During all design and construction activities, be aware of the limitations of geotechnical data and
geotechnical engineering analyses/advice, and use appropriate preventative measures. − Incorporate all geotechnical input in the design, planning, construction and other activities involving the
site and structures. Provide the entire geotechnical report to parties involved in design and construction.
− Use the geotechnical data and engineering advice for only the structures, site and activities which were described to Fugro prior to and for the purpose of planning the geotechnical site investigation or geotechnical engineering analysis programme.
AUTHORITY, TIME AND RESOUCES NECESSARY FOR QUALITY GEOTECHNICAL INVESTIGATIONS
To ensure compliance with these requirements, there must be adequate designation of authority and accountability for geotechnical aspects of construction projects. This way, an appropriate investigation can be performed, and the use of the results by project design and construction professionals can be optimised. Figure 1 illustrates the importance of the initial project phases in ensuring that adequate geotechnical information is gathered for a project. The initial phases, when site investigation requirements are defined and resources are allocated, are represented by more than 50% of the Quality triangle (Figure 1). Decisions and actions made during these phases have a large impact of the outcome and thus the potential of the investigation to meet project requirements.
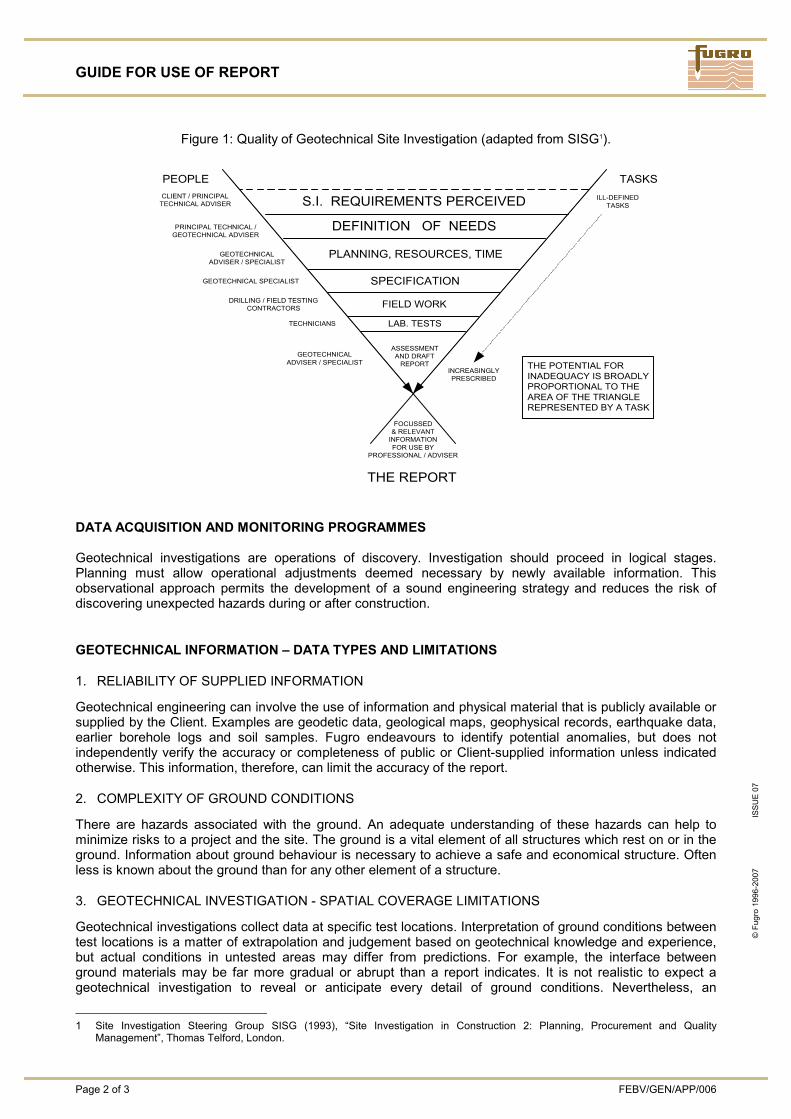
GUIDE FOR USE OF REPORT
Page 2 of 3 FEBV/GEN/APP/006
© F
ugro
199
6-20
07
ISSU
E 07
Figure 1: Quality of Geotechnical Site Investigation (adapted from SISG1).
DATA ACQUISITION AND MONITORING PROGRAMMES Geotechnical investigations are operations of discovery. Investigation should proceed in logical stages. Planning must allow operational adjustments deemed necessary by newly available information. This observational approach permits the development of a sound engineering strategy and reduces the risk of discovering unexpected hazards during or after construction. GEOTECHNICAL INFORMATION – DATA TYPES AND LIMITATIONS 1. RELIABILITY OF SUPPLIED INFORMATION
Geotechnical engineering can involve the use of information and physical material that is publicly available or supplied by the Client. Examples are geodetic data, geological maps, geophysical records, earthquake data, earlier borehole logs and soil samples. Fugro endeavours to identify potential anomalies, but does not independently verify the accuracy or completeness of public or Client-supplied information unless indicated otherwise. This information, therefore, can limit the accuracy of the report. 2. COMPLEXITY OF GROUND CONDITIONS
There are hazards associated with the ground. An adequate understanding of these hazards can help to minimize risks to a project and the site. The ground is a vital element of all structures which rest on or in the ground. Information about ground behaviour is necessary to achieve a safe and economical structure. Often less is known about the ground than for any other element of a structure. 3. GEOTECHNICAL INVESTIGATION - SPATIAL COVERAGE LIMITATIONS
Geotechnical investigations collect data at specific test locations. Interpretation of ground conditions between test locations is a matter of extrapolation and judgement based on geotechnical knowledge and experience, but actual conditions in untested areas may differ from predictions. For example, the interface between ground materials may be far more gradual or abrupt than a report indicates. It is not realistic to expect a geotechnical investigation to reveal or anticipate every detail of ground conditions. Nevertheless, an
1 Site Investigation Steering Group SISG (1993), “Site Investigation in Construction 2: Planning, Procurement and Quality
Management”, Thomas Telford, London.
S.I. REQUIREMENTS PERCEIVED
DEFINITION OF NEEDS
PLANNING, RESOURCES, TIME
SPECIFICATION
FIELD WORK
LAB. TESTS
ASSESSMENTAND DRAFT
REPORT
FOCUSSED& RELEVANT
INFORMATIONFOR USE BY
PROFESSIONAL / ADVISER
PEOPLECLIENT / PRINCIPAL
TECHNICAL ADVISER
PRINCIPAL TECHNICAL /GEOTECHNICAL ADVISER
GEOTECHNICALADVISER / SPECIALIST
GEOTECHNICAL SPECIALIST
DRILLING / FIELD TESTINGCONTRACTORS
TECHNICIANS
GEOTECHNICALADVISER / SPECIALIST
THE REPORT
THE POTENTIAL FORINADEQUACY IS BROADLYPROPORTIONAL TO THEAREA OF THE TRIANGLEREPRESENTED BY A TASK
TASKSILL-DEFINED
TASKS
INCREASINGLYPRESCRIBED
GUIDE FOR USE OF REPORT
FEBV/GEN/APP/006 Page 3 of 3
© F
ugro
199
6-20
07
ISSU
E 07
investigation can reduce the residual risk associated with unforeseen conditions to a tolerable level. If ground problems do arise, it is important to have geotechnical expertise available to help reduce and mitigate safety and financial risks. 4. ROLE OF JUDGEMENT AND OPINION IN GEOTECHNICAL ENGINEERING
Geotechnical engineering is less exact than most other design disciplines, and requires extensive judgement and opinion. Therefore, a geotechnical report may contain definitive statements that identify where the responsibility of Fugro begins and ends. These are not exculpatory clauses designed to transfer liabilities to another party, but they are statements that can help all parties involved to recognise their individual responsibilities and take appropriate actions. COMPLETE GEOTECHNICAL REPORT SHOULD BE AVAILABILE TO ALL PARTIES INVOLVED To prevent costly construction problems, construction contractors should have access to the best available information. They should have access to the complete original report to prevent or minimize any misinterpretation of site conditions and engineering advice (Halligan et al.1). To prevent errors or omissions that could lead to misinterpretation, geotechnical logs and illustrations should not be redrawn, and users of geotechnical engineering information and advice should confer with the authors when applying the report information and/or recommendations. GEOTECHNICAL INFORMATION IS PROJECT-SPECIFIC Fugro’s investigative programmes and engineering assessments are designed and conducted specifically for the Client described project and conditions. Thus this report presents data and/or recommendations for a unique construction project. Project-specific factors for a structure include but are not limited to: − location − size and configuration of structure − type and purpose or use of structure − other facilities or structures in the area.
Any factor that changes subsequent to the preparation of this report may affect its applicability. A specialised review of the impact of changes would be necessary. Fugro is not responsible for conditions which develop after any factor in site investigation programming or report development changes. For purposes or parties other than the original project or Client, the report may not be adequate and should not be used. CHANGES IN SUBSURFACE CONDITIONS AFFECT THE ACCURACY / SUITABILITY OF THE DATA Ground is complex and can be changed by natural phenomena such as earthquakes, floods, seabed scour and groundwater fluctuations. Construction operations at or near the site can also change ground conditions. This report considers conditions at the time of investigation. Construction decisions must consider any changes in site conditions, regulatory provisions, technology or economic conditions subsequent to the investigation. In general, two years after the report date, the information may be considered inaccurate or unreliable. A specialist should be consulted regarding the adequacy of this geotechnical report for use after any passage of time.
1 Halligan D.W., Hester W.T., Thomas H.R., (1987), "Managing Unforeseen Site Conditions", ASCE Journal of Construction
Engineering and Management, Vol. 113, No. 2, pp. 273-287.
Fugro Report No. N4808/16 (2) Table of Contents – Appendix 1 Page 1 of 1
APPENDIX 1
DESCRIPTIONS OF METHODS AND PRACTICES CONTENTS Reference Investigation Practice Geotechnical Borehole FEBV/CDE/APP/002
Metrological Confirmation System for In-Situ Test FEBV/GEN/APP/001
Cone Penetration Test FEBV/CDE/APP/001
Cone Penetration Test Interpretation FEBV/CDE/APP/012
Soil Description FEBV/CDE/APP/005
Geotechnical Laboratory Tests FEBV/CDE/APP/007
Location Positioning Survey FEBV/CDE/APP/029
Symbols and Units FEBV/CDE/APP/017
Engineering Practice Geotechnical Analysis FEBV/CDE/APP/052
Jack-Up Platform FEBV/CDE/APP/015

GEOTECHNICAL BOREHOLE
FEBV/CDE/APP/002 Page 1 of 9
© F
ugro
199
5-20
08
ISSU
E 21
INTRODUCTION This document describes borehole activities for a geotechnical project. The activities comprise borehole drilling and, optionally (1) in-situ testing in borehole and/or (2) sampling and sample handling. The common drilling techniques for onshore and nearshore projects are: - Open-hole drilling: a drilling method whereby all material within the diameter of the borehole is cut, such
as open-hole rotary drilling, cable percussion drilling and auger drilling. - Open-hole rotary drilling: an open-hole drilling method whereby ground at the bottom of the borehole is
cut by a drill bit rotated on the bottom of a borehole, and drill fluid is pumped down to the drill bit through the hollow drill pipe.
- Cable percussion drilling: an open-hole drilling method whereby ground at the bottom of the borehole is broken up by percussive action of a bailer, clay cutter or chisel, and brought to the surface by the bailer or clay cutter.
- Auger drilling: an open-hole drilling method whereby ground at the bottom of the borehole is cut and brought to the surface by auger flights.
- Core drilling: a rotary drilling method that cuts out cylindrical ground samples. The common drilling techniques for an offshore project are open-hole rotary drilling and core drilling. Offshore core drilling is by either piggyback or by downhole system. Piggyback core drilling uses drilling techniques whereby the drill pipe for open-hole rotary drilling acts as drill casing and as support for the drill rig. Downhole core drilling uses a core barrel that latches in a bottomhole assembly for open-hole rotary drilling. A wide range of in-situ tests is available for boreholes. Examples are the Standard Penetration Test (SPT), the pressuremeter test for onshore and nearshore boreholes and the Cone Penetration Test (CPT) for offshore boreholes. This document describes such tests as an integral part of borehole activities, but gives no test details. Separate descriptions apply, if appropriate. The common sampling techniques are drive sampling and/or push sampling of an open-tube sampler, and push sampling in case of a piston sampler. Sampling of cuttings from drilling may be feasible for some types of drilling techniques. Borehole activities are based on ISO, CEN, BSI and ASTM standards. DRILLING APPARATUS GENERAL Descriptions of common borehole drilling apparatus are as follows: - Drilling Equipment: any equipment that provides a suitably clean open hole before insertion of downhole
sampling and/or testing apparatus and ensures that sampling and/or testing is performed in undisturbed ground.
- Drill Rig: machine capable of providing: . rotation, feed and retraction to drill pipe, casing and/or auger, . drill fluid pumping capacity, as required, . sampler or test apparatus insertion.
- Drill Casing: cylindrical pipe with one or more of the following purposes: . to support the sides of a borehole, . to support drill pipe above ground surface in case of over-water drilling, . to promote return of drilling fluid.
- Drill Pipe: cylindrical pipe connecting drill rig and drill bit. - Drill Collar: thick-walled drill pipe providing self-weight thrust for the drill bit. - Drill Bit: device attached to drill pipe and used as a cutting tool to drill into the ground. - Bottom Hole Assembly: lower section of offshore drill pipe and drill bit, shaped to permit latching of
downhole in-situ testing and sampling apparatus. An optional facility for rotary drilling is analogue or digital recording of MWD (Measure-While-Drilling) parameters, such as penetration rate, torque and drill fluid pressure.

GEOTECHNICAL BOREHOLE
Page 2 of 9 FEBV/CDE/APP/002
© F
ugro
199
5-20
08
ISSU
E 21
CORING Core drilling is a ground investigation technique comprising simultaneous drilling and sampling. Descriptions of apparatus are as follows: - Single Tube Core Barrel: hollow steel tube with a head at the upper end threaded for drill pipe, and a
threaded connection for the core bit at the lower end. - Double Tube Core Barrel: assembly of two concentric steel tubes joined at the upper end by means of a
swivel arranged to permit rotation of the outer tube without causing rotation of the inner tube; the upper end of the outer tube is threaded for drill pipe and the lower end is threaded for the core bit.
- Double Tube Core Barrel with Retrievable Inner Tube: double tube core barrel that permits retrieval of the core-laden inner tube assembly to the surface through matching drill pipe without the need for withdrawal of the drill pipe.
- Core Bit: device attached to the core barrel and used as a cutting tool to drill into the ground. - Core Catcher: device that assists retention of core in the core barrel. - Core Box: box with longitudinal separators for the protection and storage of core. OFFSHORE OPERATIONS Offshore drilling can require additional apparatus, in particular when drilling from a vessel: - Seabed Reaction Frame: seafloor-based apparatus capable of providing one or more of the following:
. improved horizontal and vertical control of the drill pipe
. re-entry of a borehole by drill pipe after earlier retraction
. vertical reaction for the drill pipe during downhole testing and sampling
. vertical reaction for hard-tie rigging. - Heave Compensator: apparatus to compensate the drill pipe for vertical motion of a drill rig mounted on
a vessel. - Hard-tie Rigging: special rigging system incorporating a seabed reaction frame and a heave
compensator, for heave-compensated drilling with low drill bit load and/or increased depth control of the drill bit.
SAMPLING APPARATUS DRIVE SAMPLING - Drive-Weight Assembly: Device consisting of hammer, hammer fall guide, anvil and hammer drop
system. - Hammer: impact mass, which is successively lifted and dropped to provide the energy that
accomplishes sampler penetration. - Hammer Fall Guide: guide arrangement for the fall of the hammer. - Anvil: drive-head which the hammer strikes and through which the hammer energy passes into the
sampling rods. - Hammer Drop System: pick-up and release mechanism by which lifting and dropping of the hammer is
accomplished. - Cathead: rotating drum in a rope-cathead hammer drop system around which a rope is wrapped to lift
and drop the hammer by successively tightening and loosening the rope turns around the drum. - Self-Tripping Release: hammer drop system that ensures a free fall of the hammer after lifting by a
cable or rope. - Free-Fall Winch: hammer drop system that permits a free release of the rotating drum of the winch
around which a cable is wrapped to lift and drop the hammer. - Hydraulic Percussion: hammer drop system that provides rapid impact hammer blows by fluid flow. - Sampling Rods: rods that connect the drive-weight assembly to the sampler head. PUSH SAMPLING APPARATUS - Sampler Insertion Equipment: apparatus providing relatively rapid continuous penetration force. - Reaction Equipment: reaction for the sampler insertion equipment. - Sampling Rods: rods that connect the sampler insertion equipment to the sampler head.
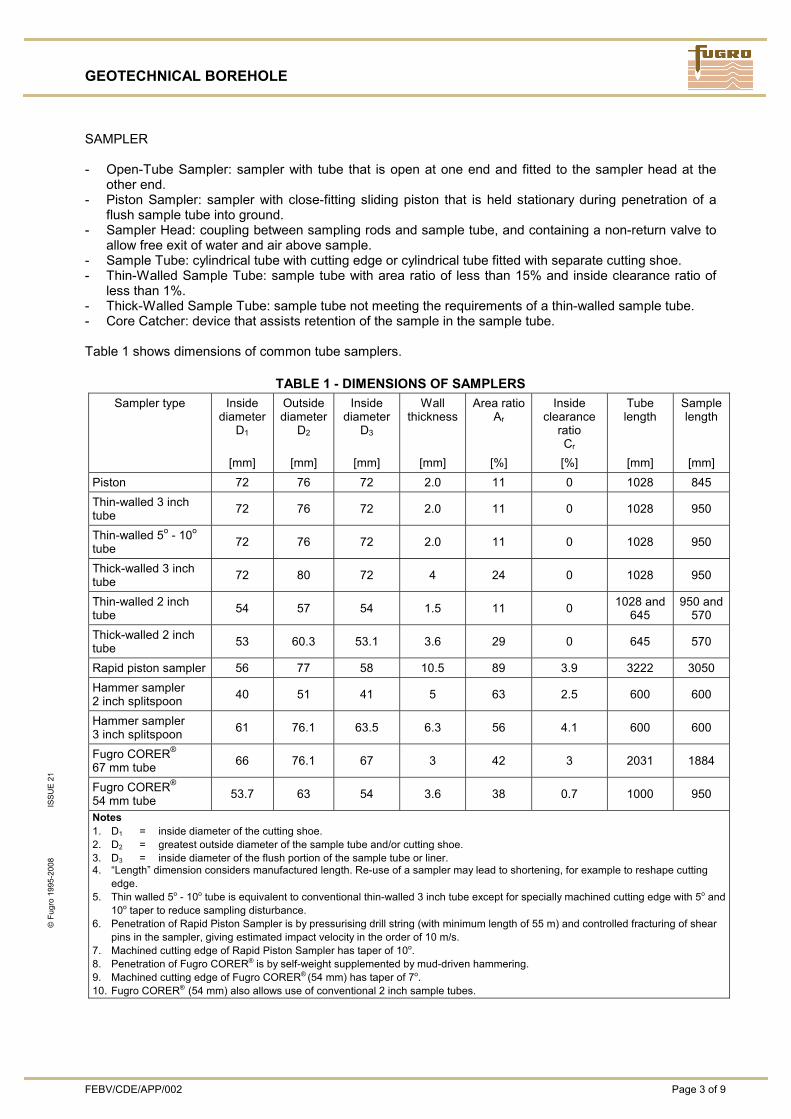
GEOTECHNICAL BOREHOLE
FEBV/CDE/APP/002 Page 3 of 9
© F
ugro
199
5-20
08
ISSU
E 21
SAMPLER - Open-Tube Sampler: sampler with tube that is open at one end and fitted to the sampler head at the
other end. - Piston Sampler: sampler with close-fitting sliding piston that is held stationary during penetration of a
flush sample tube into ground. - Sampler Head: coupling between sampling rods and sample tube, and containing a non-return valve to
allow free exit of water and air above sample. - Sample Tube: cylindrical tube with cutting edge or cylindrical tube fitted with separate cutting shoe. - Thin-Walled Sample Tube: sample tube with area ratio of less than 15% and inside clearance ratio of
less than 1%. - Thick-Walled Sample Tube: sample tube not meeting the requirements of a thin-walled sample tube. - Core Catcher: device that assists retention of the sample in the sample tube. Table 1 shows dimensions of common tube samplers.
TABLE 1 - DIMENSIONS OF SAMPLERS Sampler type Inside
diameter D1
Outside diameter
D2
Inside diameter
D3
Wall thickness
Area ratioAr
Inside clearance
ratio Cr
Tube length
Sample length
[mm] [mm] [mm] [mm] [%] [%] [mm] [mm] Piston 72 76 72 2.0 11 0 1028 845 Thin-walled 3 inch tube 72 76 72 2.0 11 0 1028 950
Thin-walled 5o - 10o tube 72 76 72 2.0 11 0 1028 950
Thick-walled 3 inch tube 72 80 72 4 24 0 1028 950
Thin-walled 2 inch tube 54 57 54 1.5 11 0 1028 and
645 950 and
570 Thick-walled 2 inch tube 53 60.3 53.1 3.6 29 0 645 570
Rapid piston sampler 56 77 58 10.5 89 3.9 3222 3050 Hammer sampler 2 inch splitspoon 40 51 41 5 63 2.5 600 600
Hammer sampler 3 inch splitspoon 61 76.1 63.5 6.3 56 4.1 600 600
Fugro CORER® 67 mm tube 66 76.1 67 3 42 3 2031 1884
Fugro CORER® 54 mm tube 53.7 63 54 3.6 38 0.7 1000 950
Notes 1. D1 = inside diameter of the cutting shoe. 2. D2 = greatest outside diameter of the sample tube and/or cutting shoe. 3. D3 = inside diameter of the flush portion of the sample tube or liner. 4. “Length” dimension considers manufactured length. Re-use of a sampler may lead to shortening, for example to reshape cutting
edge. 5. Thin walled 5o - 10o tube is equivalent to conventional thin-walled 3 inch tube except for specially machined cutting edge with 5o and
10o taper to reduce sampling disturbance. 6. Penetration of Rapid Piston Sampler is by pressurising drill string (with minimum length of 55 m) and controlled fracturing of shear
pins in the sampler, giving estimated impact velocity in the order of 10 m/s. 7. Machined cutting edge of Rapid Piston Sampler has taper of 10o. 8. Penetration of Fugro CORER® is by self-weight supplemented by mud-driven hammering. 9. Machined cutting edge of Fugro CORER® (54 mm) has taper of 7o. 10. Fugro CORER® (54 mm) also allows use of conventional 2 inch sample tubes.
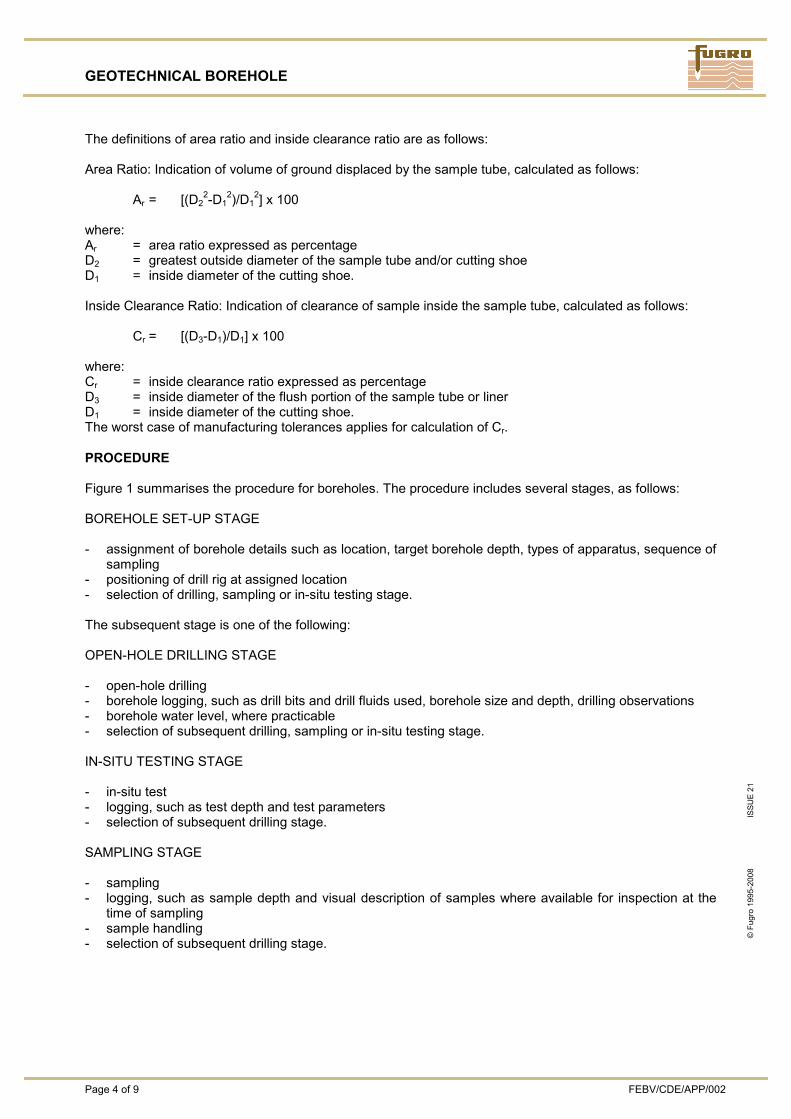
GEOTECHNICAL BOREHOLE
Page 4 of 9 FEBV/CDE/APP/002
© F
ugro
199
5-20
08
ISSU
E 21
The definitions of area ratio and inside clearance ratio are as follows: Area Ratio: Indication of volume of ground displaced by the sample tube, calculated as follows: Ar = [(D2
2-D12)/D1
2] x 100 where: Ar = area ratio expressed as percentage D2 = greatest outside diameter of the sample tube and/or cutting shoe D1 = inside diameter of the cutting shoe. Inside Clearance Ratio: Indication of clearance of sample inside the sample tube, calculated as follows:
Cr = [(D3-D1)/D1] x 100 where: Cr = inside clearance ratio expressed as percentage D3 = inside diameter of the flush portion of the sample tube or liner D1 = inside diameter of the cutting shoe. The worst case of manufacturing tolerances applies for calculation of Cr. PROCEDURE Figure 1 summarises the procedure for boreholes. The procedure includes several stages, as follows: BOREHOLE SET-UP STAGE - assignment of borehole details such as location, target borehole depth, types of apparatus, sequence of
sampling - positioning of drill rig at assigned location - selection of drilling, sampling or in-situ testing stage. The subsequent stage is one of the following: OPEN-HOLE DRILLING STAGE - open-hole drilling - borehole logging, such as drill bits and drill fluids used, borehole size and depth, drilling observations - borehole water level, where practicable - selection of subsequent drilling, sampling or in-situ testing stage. IN-SITU TESTING STAGE - in-situ test - logging, such as test depth and test parameters - selection of subsequent drilling stage. SAMPLING STAGE - sampling - logging, such as sample depth and visual description of samples where available for inspection at the
time of sampling - sample handling - selection of subsequent drilling stage.
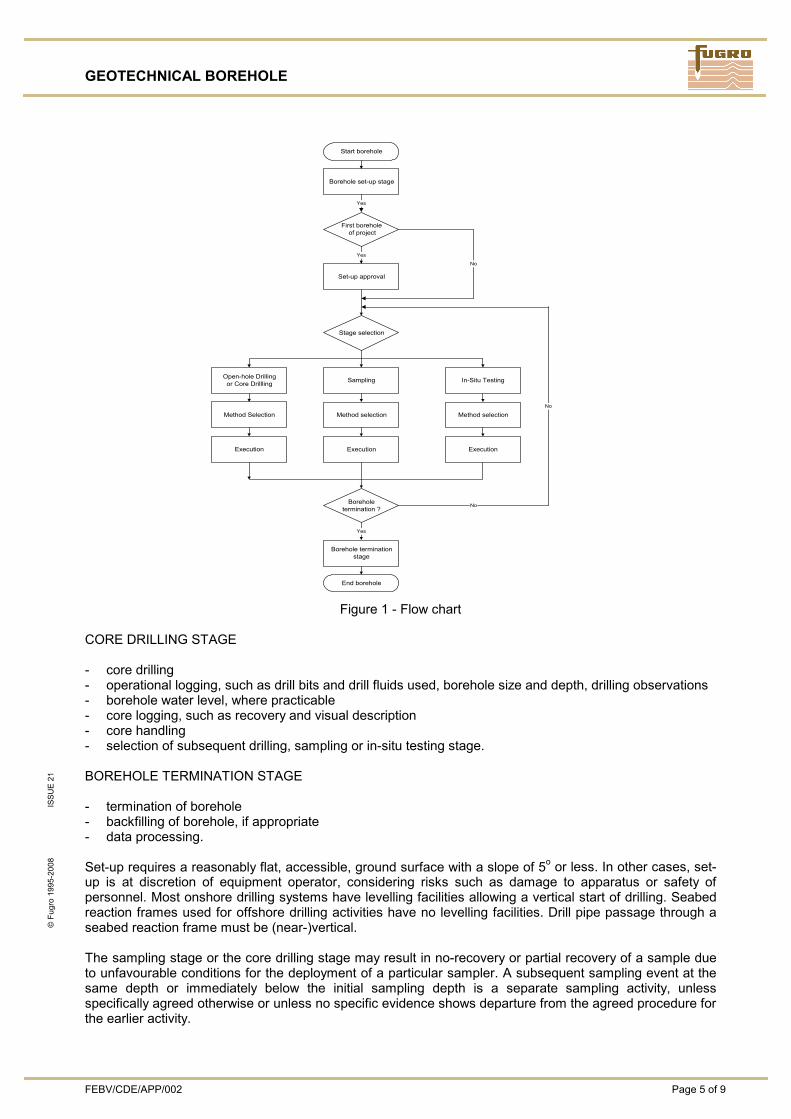
GEOTECHNICAL BOREHOLE
FEBV/CDE/APP/002 Page 5 of 9
© F
ugro
199
5-20
08
ISSU
E 21
Figure 1 - Flow chart
CORE DRILLING STAGE - core drilling - operational logging, such as drill bits and drill fluids used, borehole size and depth, drilling observations - borehole water level, where practicable - core logging, such as recovery and visual description - core handling - selection of subsequent drilling, sampling or in-situ testing stage. BOREHOLE TERMINATION STAGE - termination of borehole - backfilling of borehole, if appropriate - data processing. Set-up requires a reasonably flat, accessible, ground surface with a slope of 5o or less. In other cases, set-up is at discretion of equipment operator, considering risks such as damage to apparatus or safety of personnel. Most onshore drilling systems have levelling facilities allowing a vertical start of drilling. Seabed reaction frames used for offshore drilling activities have no levelling facilities. Drill pipe passage through a seabed reaction frame must be (near-)vertical. The sampling stage or the core drilling stage may result in no-recovery or partial recovery of a sample due to unfavourable conditions for the deployment of a particular sampler. A subsequent sampling event at the same depth or immediately below the initial sampling depth is a separate sampling activity, unless specifically agreed otherwise or unless no specific evidence shows departure from the agreed procedure for the earlier activity.
Borehole set-up stage
Start borehole
Sampling
Stage selection
Open-hole Drillingor Core Drillling In-Situ Testing
Method selectionMethod selection
Execution Execution
Boreholetermination ?
Borehole terminationstage
End borehole
No
First borehole of project
Set-up approval
Yes
Yes
Method Selection
Execution
Yes
No
No
GEOTECHNICAL BOREHOLE
Page 6 of 9 FEBV/CDE/APP/002
© F
ugro
199
5-20
08
ISSU
E 21
Criteria for borehole termination are as follows, unless specifically agreed otherwise: - as instructed by Client - reaching target penetration - drilling progress rate of less than 1m/hour based on half-hourly observation - circumstances at discretion of system operator, such as risk of damage to apparatus or safety of
personnel whichever occurs first and as applicable. RESULTS GEOTECHNICAL LOG The geotechnical log or borehole log contains the geotechnical descriptions of the encountered strata, and the borehole water level measurements, if applicable. In addition, it may include the principal details of the borehole operational activities. The penetration depth of a (vertical) borehole is defined as the deepest point reached by drilling, sampling or in-situ testing. The recovery depth of a borehole is the deepest point for which sample or test data are presented. Unless indicated otherwise, recovery of a tube sample or a core sample is assumed to be continuous from the starting depth of sampling. In other words, the geotechnical log ignores possible plugging, flow-in and/or wash-out. MWD PARAMETERS Optional presentation of MWD parameters for rotary drilling is usually in graphical format. Interpretation of MWD parameters can help characterisation of ground conditions such as cemented strata, weak rock and formations with cavities. GEOTECHNICAL DESCRIPTION The geotechnical description, including the strata boundaries, is an interpretation of the processed data available at the time of the preparation of the geotechnical log. Subsequent processing and integration of supplementary ground investigation data may require adjustment of the log. Supplementary information can include: - geological information - geophysical data - results of nearby boreholes and in-situ tests - laboratory test results - analysis of drilling parameters such as torque, feed, drill fluid pressure and drilling time. Level of detail and accuracy in geotechnical description depend on factors such as sample size, quality, coverage of samples and test data, availability of supplementary information, and project requirements. For example, geotechnical descriptions prepared for the purpose of a pile foundation may differ from those prepared for a pipeline. Any graphical presentation of test results considers values within the scale limits only. No automatic scaling applies, unless indicated otherwise. WATER LEVEL Water level measurements taken in boreholes can be valuable. Interpretation of water levels requires due caution. They may or may not be representative of the ground water levels. In any case, water levels apply to the time and date of the measurements only. They will vary due to seasonal and other environmental influences, including construction activities.
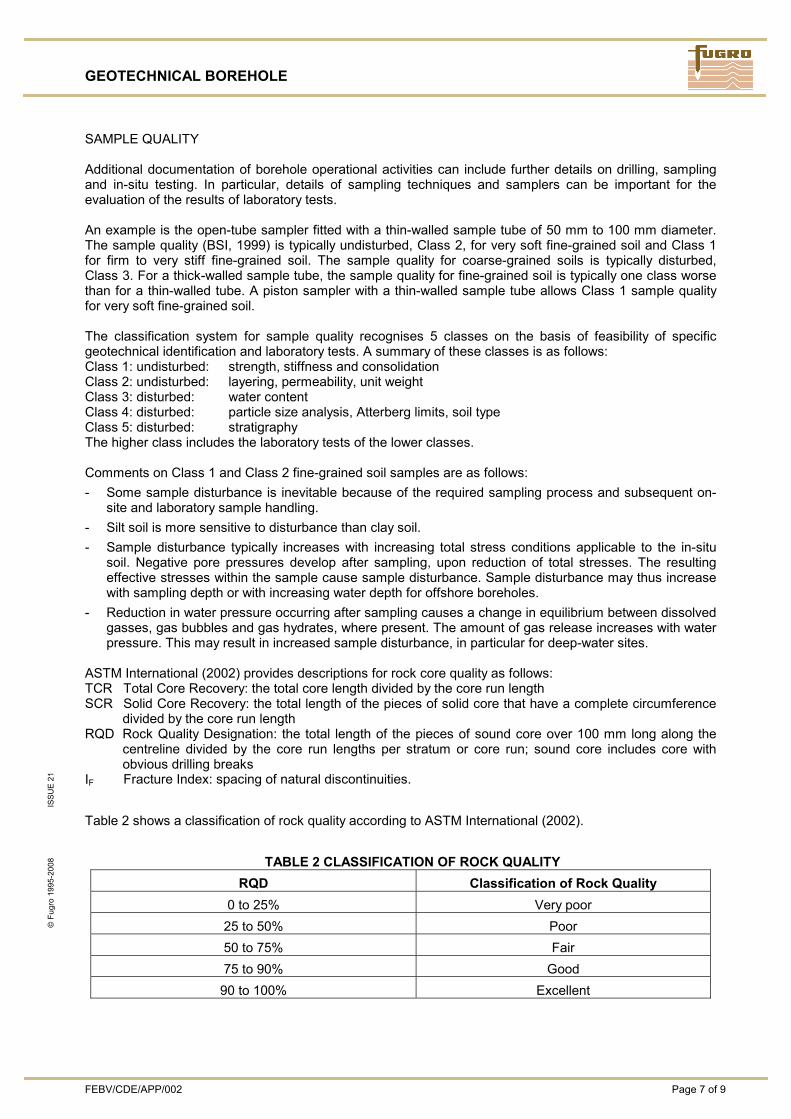
GEOTECHNICAL BOREHOLE
FEBV/CDE/APP/002 Page 7 of 9
© F
ugro
199
5-20
08
ISSU
E 21
SAMPLE QUALITY Additional documentation of borehole operational activities can include further details on drilling, sampling and in-situ testing. In particular, details of sampling techniques and samplers can be important for the evaluation of the results of laboratory tests. An example is the open-tube sampler fitted with a thin-walled sample tube of 50 mm to 100 mm diameter. The sample quality (BSI, 1999) is typically undisturbed, Class 2, for very soft fine-grained soil and Class 1 for firm to very stiff fine-grained soil. The sample quality for coarse-grained soils is typically disturbed, Class 3. For a thick-walled sample tube, the sample quality for fine-grained soil is typically one class worse than for a thin-walled tube. A piston sampler with a thin-walled sample tube allows Class 1 sample quality for very soft fine-grained soil. The classification system for sample quality recognises 5 classes on the basis of feasibility of specific geotechnical identification and laboratory tests. A summary of these classes is as follows: Class 1: undisturbed: strength, stiffness and consolidation Class 2: undisturbed: layering, permeability, unit weight Class 3: disturbed: water content Class 4: disturbed: particle size analysis, Atterberg limits, soil type Class 5: disturbed: stratigraphy The higher class includes the laboratory tests of the lower classes. Comments on Class 1 and Class 2 fine-grained soil samples are as follows: - Some sample disturbance is inevitable because of the required sampling process and subsequent on-
site and laboratory sample handling. - Silt soil is more sensitive to disturbance than clay soil. - Sample disturbance typically increases with increasing total stress conditions applicable to the in-situ
soil. Negative pore pressures develop after sampling, upon reduction of total stresses. The resulting effective stresses within the sample cause sample disturbance. Sample disturbance may thus increase with sampling depth or with increasing water depth for offshore boreholes.
- Reduction in water pressure occurring after sampling causes a change in equilibrium between dissolved gasses, gas bubbles and gas hydrates, where present. The amount of gas release increases with water pressure. This may result in increased sample disturbance, in particular for deep-water sites.
ASTM International (2002) provides descriptions for rock core quality as follows: TCR Total Core Recovery: the total core length divided by the core run length SCR Solid Core Recovery: the total length of the pieces of solid core that have a complete circumference
divided by the core run length RQD Rock Quality Designation: the total length of the pieces of sound core over 100 mm long along the
centreline divided by the core run lengths per stratum or core run; sound core includes core with obvious drilling breaks
IF Fracture Index: spacing of natural discontinuities.
Table 2 shows a classification of rock quality according to ASTM International (2002).
TABLE 2 CLASSIFICATION OF ROCK QUALITY RQD Classification of Rock Quality
0 to 25% Very poor 25 to 50% Poor 50 to 75% Fair 75 to 90% Good 90 to 100% Excellent
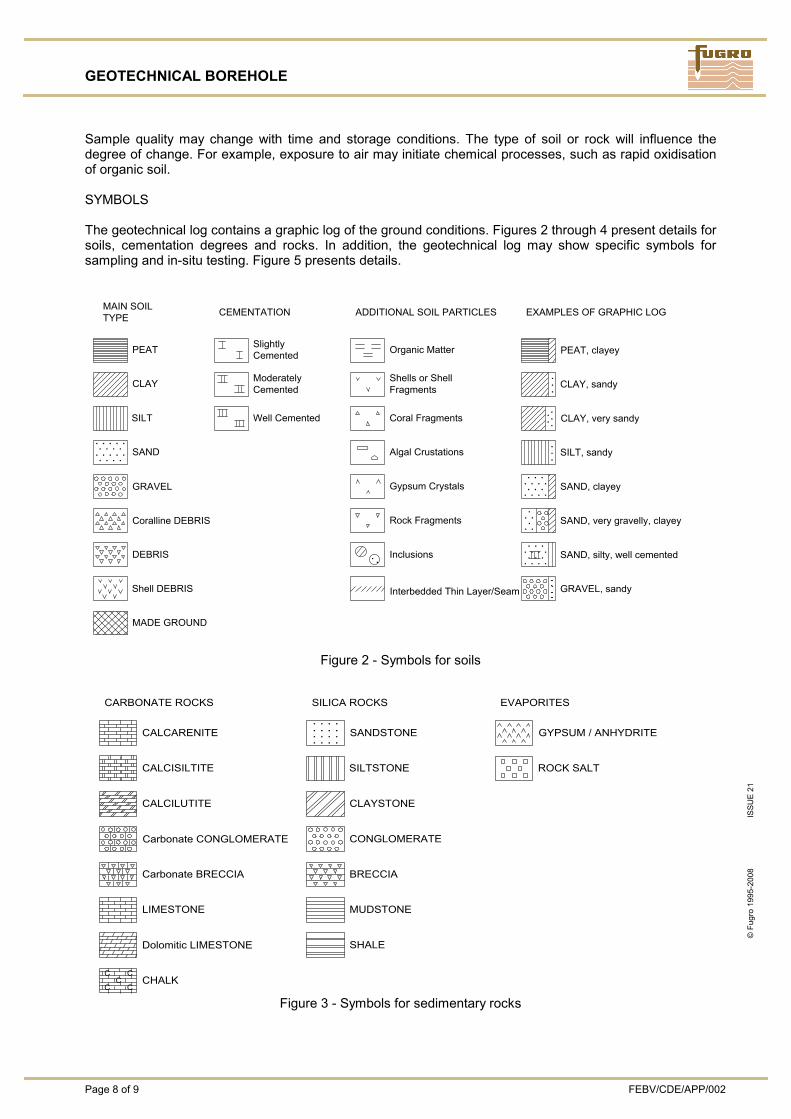
GEOTECHNICAL BOREHOLE
Page 8 of 9 FEBV/CDE/APP/002
© F
ugro
199
5-20
08
ISSU
E 21
Sample quality may change with time and storage conditions. The type of soil or rock will influence the degree of change. For example, exposure to air may initiate chemical processes, such as rapid oxidisation of organic soil. SYMBOLS The geotechnical log contains a graphic log of the ground conditions. Figures 2 through 4 present details for soils, cementation degrees and rocks. In addition, the geotechnical log may show specific symbols for sampling and in-situ testing. Figure 5 presents details.
PEAT
CLAY
SILT
SAND
Interbedded Thin Layer/Seam
Inclusions
Rock Fragments
Gypsum Crystals
Algal Crustations
Coral Fragments
Shells or ShellFragments
Organic Matter
DEBRIS
MAIN SOILTYPE CEMENTATION
Well Cemented
ModeratelyCemented
SlightlyCemented
GRAVEL
Coralline DEBRIS
ADDITIONAL SOIL PARTICLES
PEAT, clayey
CLAY, sandy
CLAY, very sandy
SILT, sandy
SAND, clayey
SAND, very gravelly, clayey
SAND, silty, well cemented
GRAVEL, sandy
EXAMPLES OF GRAPHIC LOG
MADE GROUND
Shell DEBRIS
. . . . .. . . .. . . . .. . . .
. .
. . .. . . .. . .. . . .
.. ... .
. . .. .
. . .
. . .. . . .. . .. . . .
. . .
Figure 2 - Symbols for soils
Figure 3 - Symbols for sedimentary rocks
SILTSTONE
SANDSTONE
CONGLOMERATE
BRECCIA
LIMESTONE
CALCILUTITE
CALCISILTITE
CALCARENITE
CARBONATE ROCKS
CLAYSTONE
Carbonate CONGLOMERATE
Carbonate BRECCIA
SILICA ROCKS
GYPSUM / ANHYDRITE
ROCK SALT
EVAPORITES
CHALKC
CC
C C
Dolomitic LIMESTONE
MUDSTONE
SHALE
. . . .. . . .. . . .
. . . .
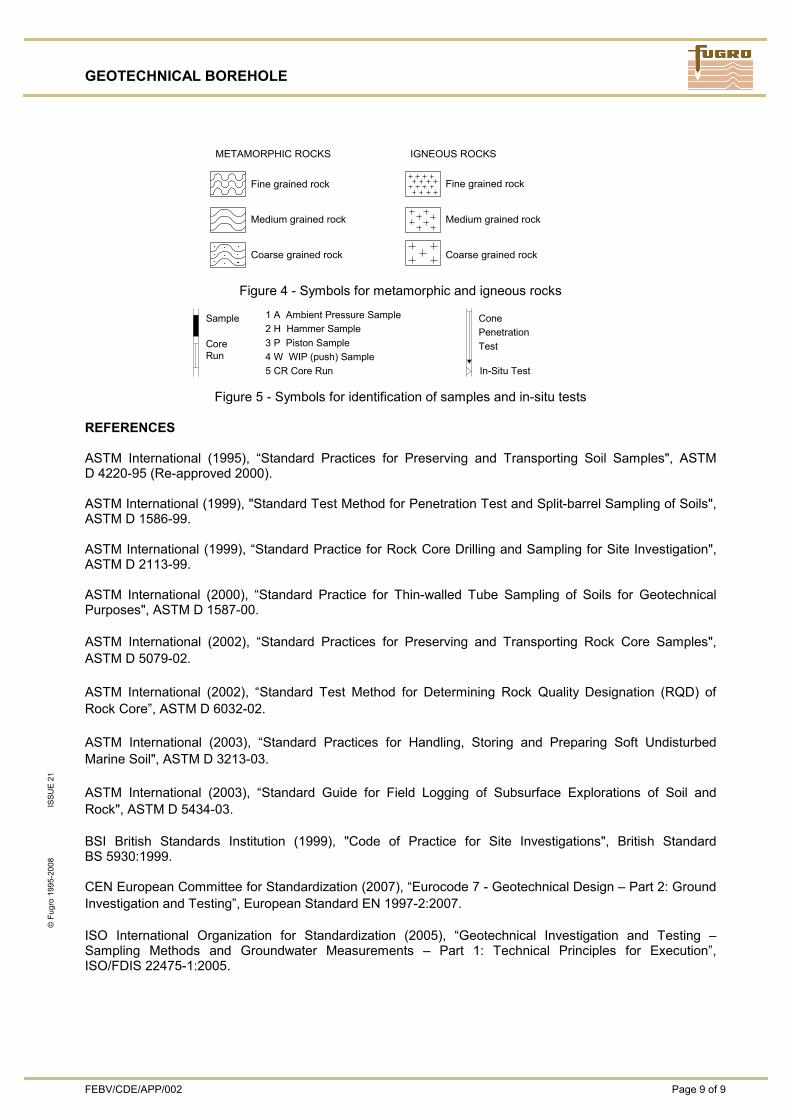
GEOTECHNICAL BOREHOLE
FEBV/CDE/APP/002 Page 9 of 9
© F
ugro
199
5-20
08
ISSU
E 21
Figure 4 - Symbols for metamorphic and igneous rocks
Figure 5 - Symbols for identification of samples and in-situ tests
REFERENCES ASTM International (1995), “Standard Practices for Preserving and Transporting Soil Samples", ASTM D 4220-95 (Re-approved 2000). ASTM International (1999), "Standard Test Method for Penetration Test and Split-barrel Sampling of Soils", ASTM D 1586-99. ASTM International (1999), “Standard Practice for Rock Core Drilling and Sampling for Site Investigation", ASTM D 2113-99. ASTM International (2000), “Standard Practice for Thin-walled Tube Sampling of Soils for Geotechnical Purposes", ASTM D 1587-00. ASTM International (2002), “Standard Practices for Preserving and Transporting Rock Core Samples", ASTM D 5079-02. ASTM International (2002), “Standard Test Method for Determining Rock Quality Designation (RQD) of Rock Core”, ASTM D 6032-02. ASTM International (2003), “Standard Practices for Handling, Storing and Preparing Soft Undisturbed Marine Soil", ASTM D 3213-03. ASTM International (2003), “Standard Guide for Field Logging of Subsurface Explorations of Soil and Rock", ASTM D 5434-03. BSI British Standards Institution (1999), "Code of Practice for Site Investigations", British Standard BS 5930:1999. CEN European Committee for Standardization (2007), “Eurocode 7 - Geotechnical Design – Part 2: Ground Investigation and Testing”, European Standard EN 1997-2:2007. ISO International Organization for Standardization (2005), “Geotechnical Investigation and Testing – Sampling Methods and Groundwater Measurements – Part 1: Technical Principles for Execution”, ISO/FDIS 22475-1:2005.
Medium grained rock
METAMORPHIC ROCKS
Fine grained rock
Coarse grained rock
IGNEOUS ROCKS
Fine grained rock
Medium grained rock
Coarse grained rock
Sample 1 A Ambient Pressure Sample 2 H Hammer Sample 3 P Piston Sample 4 W WIP (push) Sample
ConePenetrationTestCore
Run5 CR Core Run In-Situ Test
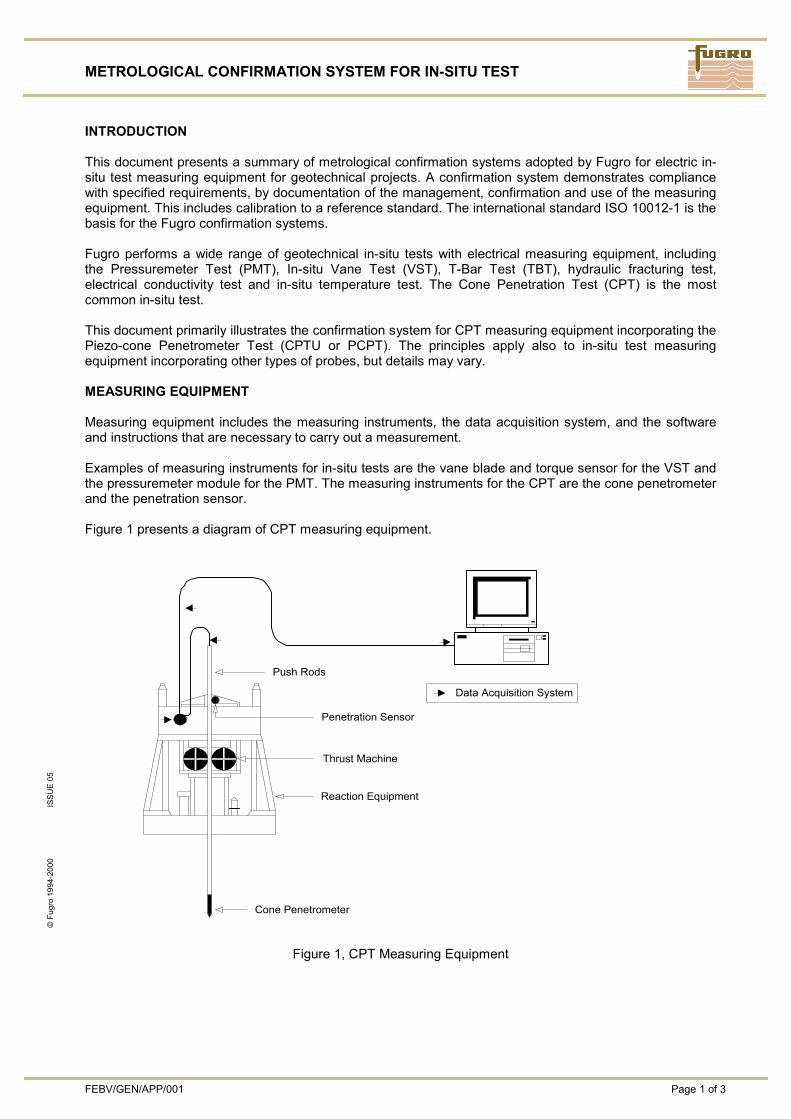
METROLOGICAL CONFIRMATION SYSTEM FOR IN-SITU TEST
FEBV/GEN/APP/001 Page 1 of 3
© F
ugro
199
4-20
00
ISSU
E 05
INTRODUCTION This document presents a summary of metrological confirmation systems adopted by Fugro for electric in-situ test measuring equipment for geotechnical projects. A confirmation system demonstrates compliance with specified requirements, by documentation of the management, confirmation and use of the measuring equipment. This includes calibration to a reference standard. The international standard ISO 10012-1 is the basis for the Fugro confirmation systems. Fugro performs a wide range of geotechnical in-situ tests with electrical measuring equipment, including the Pressuremeter Test (PMT), In-situ Vane Test (VST), T-Bar Test (TBT), hydraulic fracturing test, electrical conductivity test and in-situ temperature test. The Cone Penetration Test (CPT) is the most common in-situ test. This document primarily illustrates the confirmation system for CPT measuring equipment incorporating the Piezo-cone Penetrometer Test (CPTU or PCPT). The principles apply also to in-situ test measuring equipment incorporating other types of probes, but details may vary. MEASURING EQUIPMENT Measuring equipment includes the measuring instruments, the data acquisition system, and the software and instructions that are necessary to carry out a measurement. Examples of measuring instruments for in-situ tests are the vane blade and torque sensor for the VST and the pressuremeter module for the PMT. The measuring instruments for the CPT are the cone penetrometer and the penetration sensor. Figure 1 presents a diagram of CPT measuring equipment.
Cone Penetrometer
Reaction Equipment
Thrust Machine
Penetration Sensor
Push Rods
Data Acquisition System
Figure 1, CPT Measuring Equipment
METROLOGICAL CONFIRMATION SYSTEM FOR IN-SITU TEST
Page 2 of 3 FEBV/GEN/APP/001
© F
ugro
199
4-20
00
ISSU
E 05
MEASURANDS A measurand is the quantity to be measured. In most cases, this is not equivalent to inferred value. For example, the principal measurand for a vane test is torque required for rotation of the vane blade. The inferred value is undrained shear strength. Determination of the undrained shear strength from torque measurement requires a model for failure zone geometry and assumptions about soil behaviour during the test. The principles for the cone penetration test are similar, but more complex. For example, one of the measurands is cone resistance. This is a quantity calculated from (1) axial force measurement, (2) allowance for internal friction of penetrometer components and (3) geometry. The important piezo-cone measurands are: − Cone resistance, qc − Sleeve friction, fs − Pore pressure, u − Inclination, i − Penetration depth, z − Penetration rate − Data logging frequency. APPROACH TO CONFIRMATION CONFIRMATION METHODS The approach to confirmation of measuring equipment is generally as follows: (1) Periodic laboratory calibration of the in-situ test probe by Methods 3 and 4 of ISO 10012-1. (2) In-service testing of the penetration (depth) sensor by Method 5 of ISO 10012-1. (3) In-service testing of the data acquisition system by Method 5 of ISO 10012-1. (4) Surveillance and control of the measurement process. Method 3 assigns confirmation (calibration) intervals by calendar time. "In-use" time is the basis for Method 4 confirmation. Method 5 uses portable check standards. If the measuring equipment is found to be non-conforming, it is returned for a full confirmation. Table 1 presents a summary of typical confirmation intervals.
TABLE 1 CONFIRMATION INTERVALS Measuring Equipment
Component Confirmation Interval Records
Measuring Instrument − 6 months − single project or campaign of projects − suspected non-conformance identified
by surveillance and control whichever is earlier
− calibration data certificate available on site and in Fugro calibration laboratory
− surveillance and control data in project file
Penetration Sensor − in-service testing − suspected non-conformance identified
by surveillance and control whichever is earlier
− in-service testing data in project file− surveillance and control data in
project file
Data Acquisition System − in-service testing − suspected non-conformance identified
by surveillance and control whichever is earlier
− in-service testing data in project file− calibration data certificate for
portable check standard available on site and in Fugro calibration laboratory
− surveillance and control data in project file
METROLOGICAL CONFIRMATION SYSTEM FOR IN-SITU TEST
FEBV/GEN/APP/001 Page 3 of 3
© F
ugro
199
4-20
00
ISSU
E 05
MEASURING INSTRUMENT The calibration of the measuring instruments (for example, a cone penetrometer) takes place in the Fugro calibration laboratory. The calibration facilities of the laboratory have traceability to the Dutch NMi (Nederlands Meet-instituut) measurement standards. The confirmation interval for the laboratory is 12 months in accordance with Method 3 of ISO 10012-1. For example, the calibration of the piezo-cone penetrometer covers four components, namely (1) the load sensors for determination of cone resistance (qc) and sleeve friction (fs), (2) the pressure sensor for determination of water pressure (u), (3) the inclinometer for determination of the inclination of the cone penetrometer from vertical, and (4) the geometry. Practice details are as follows: − Load sensor calibration is by a special test loading facility. The test loading facility provides the following
calibration data: (1) the calibration factors for the specified measuring range and (2) the zero-load offsets.
− The pressure sensor calibration takes place in a special pressure vessel for cone penetrometers. A special test frame provides calibration data for the inclinometer. The calibration data are as for the load sensors.
− The calibration of the geometry of the cone penetrometer is by vernier calliper length measurements. This allows checking of the geometrical tolerances for the various diameters and lengths of the cone penetrometer components.
Some in-situ test methods include measurements that are continuous with penetration (z). This requires use of a penetration sensor. The common method is to use a rotary pulse encoder, with rotation mechanically coupled to the moving crosshead. An exception is the downhole WISON system, which derives penetration data from measuring the flow of the hydraulic fluid used to advance a push rod. The in-service testing is by survey tape length measurements of actual penetration. DATA ACQUISITION SYSTEM The data acquisition system provides the link between the electrical output signals of the measuring instrument and the digitally recorded data. This link includes the transmission cable, the connectors, the analogue/digital converter and the data recording software. Fugro operates the VRB (Voltage Reference Box) for in-service testing. The VRB simulates the instrument output signals by transmission of known output signals through the data acquisition system. Each VRB includes a NMi calibration certificate. The confirmation interval for the VRB is 12 months in accordance with Method 3 of ISO 10012-1. SURVEILLANCE AND CONTROL Controlled laboratory conditions do not apply to in-situ tests. Surveillance and control of the measuring processes are, therefore, important to promote confidence in the test results. The field checks applied by Fugro can comprise the following, depending on the type of the in-situ test system and the mode of deployment: − General review of the in-situ test signatures for the expected ground conditions. − Visual inspection of the geometry of the measuring instrument and push rods upon retraction. − Visual inspection of the transmission cables and connectors. − Checks and monitoring of the zero-load offsets before and after each test. This provides an indication of
the uncertainty of the test results. − Checks and monitoring of the response of the load and pressure sensors to water depth, in case of
underwater deployment. This provides an indication of the performance of the sensors. − Monitoring of the pressure in the hydraulic thrust machine. This permits the calculation of the total force
required for penetration. − Time checks. Real time of the clock of the recording apparatus provides the basis for recording of some
measurands (for example qc, fs, u and z). Together, time and penetration measurements permit checks on the standardised penetration rate.
REFERENCES International Organization for Standardization ISO (1992), "Quality Assurance Requirements for Measuring Equipment - Part 1: Metrological Confirmation System for Measuring Equipment", ISO 10012-1:1992(E).
CONE PENETRATION TEST
FEBV/CDE/APP/001 Page 1 of 9
© F
ugro
199
5-20
08
ISSU
E 2
1
INTRODUCTION The Cone Penetration Test (CPT) is in wide use for in-situ geotechnical characterisation of ground. It involves the measurement of the resistance of ground to steady and continuous penetration of a cone penetrometer equipped with internal sensors. The measurements comprise penetration depth, cone resistance, sleeve friction and, optionally, pore pressure and inclination from vertical. These measurements permit interpretation of ground conditions. CPT apparatus and procedures adopted by Fugro are in general accordance with the International Reference Test Procedure published by the International Society of Soil Mechanics and Geotechnical Engineering (ISSMGE, 1999). BS 5930 (BSI, 1999) and NORSOK Standard G-CR-001 (NORSOK, 2004) refer to ISSMGE (1999). General agreement also applies to standards published by ASTM International (ASTM D5778-07), ISO/DIS 22476-1 (ISO, 2005), Eurocode 7 (CEN, 2007) and Nederlands Normalisatie-Instituut (NEN 5140). CPT APPARATUS GENERAL CPT apparatus includes various parts as described below: − Thrust machine: apparatus providing thrust to the push rods so that the required constant rate of
penetration is controlled. − Reaction equipment: reaction for the thrust machine. − Push rod: thick-walled cylindrical tube used for advancing the penetrometer to the required test depth. − Friction-cone penetrometer (CPT): cylindrical terminal body mounted on the lower end of the push
rods, including a cone, a friction sleeve and internal sensing devices for the measurement of cone resistance, sleeve friction and, optionally, inclination.
− Piezo-cone penetrometer (CPTU or PCPT): cylindrical terminal body mounted on the lower end of the push rods, including a cone, a friction sleeve, a filter and internal sensing devices for the measurement of cone resistance, sleeve friction, pressure and, optionally, inclination.
− Measuring system: apparatus and software, including sensors, data transmission apparatus, recording apparatus and data processing apparatus.
DEPLOYMENT FROM GROUND SURFACE OR SEAFLOOR Specific additional apparatus for CPT deployment from ground surface and seafloor can include: − Push rod casing: guide for the part of the push rods protruding above the soil, and for the push rod
length exposed in water or soil, in order to prevent buckling when the required penetration pressure increases beyond the safe limit for the exposed upstanding length of push rods.
− Friction reducer: ring or special projections fixed on the outside of the push rods, with an outside diameter larger than the base of the cone, to reduce soil friction acting on the push rods.
DOWNHOLE DEPLOYMENT Downhole CPT systems latch into the lower end of a drill pipe. Fugro employs two types of downhole systems: 1. Operation of the thrust machine by applying mud pressure in the borehole, together with downhole
recording of data. 2. Remote control of the thrust machine by hydraulic pressure transmitted through an umbilical cable
connected to a surface-based pump unit, together with surface-based recording of data. Downhole CPTs require drilling apparatus for advancing the borehole and a bottom hole assembly that permits latching of the thrust machine. The maximum stroke of the thrust machine is generally 1.5 m or 3 m.
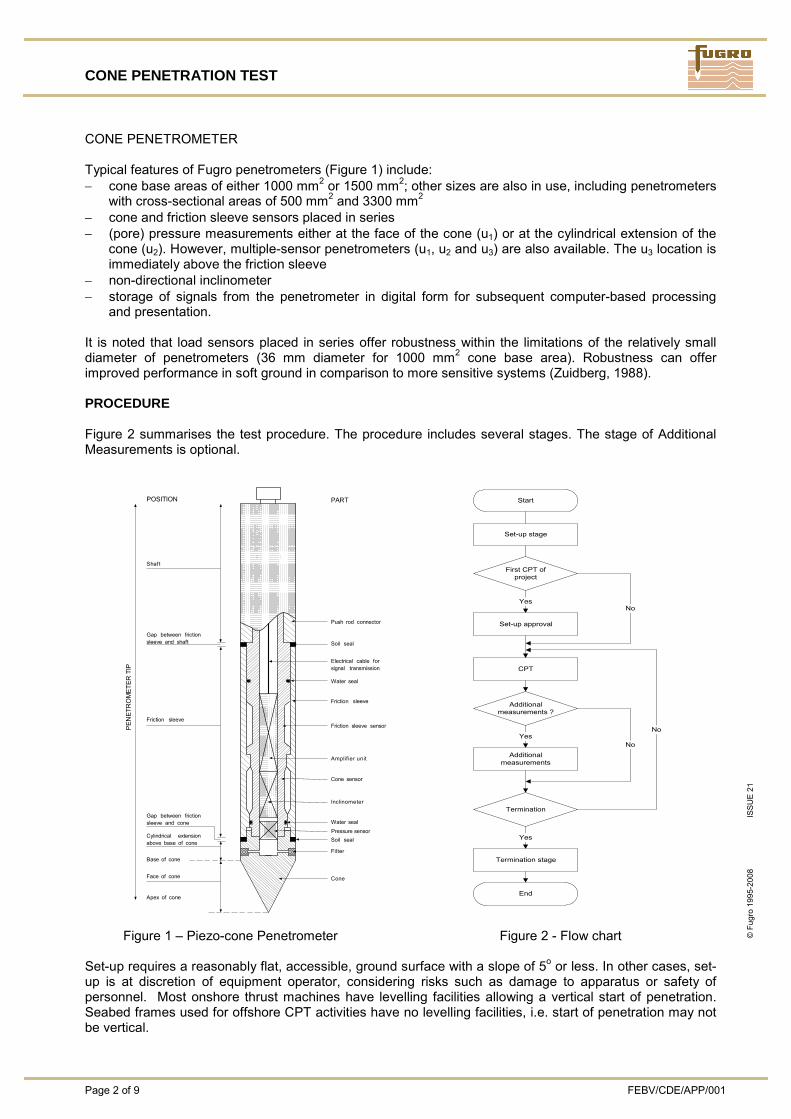
CONE PENETRATION TEST
Page 2 of 9 FEBV/CDE/APP/001
© F
ugro
199
5-20
08
ISSU
E 21
CONE PENETROMETER Typical features of Fugro penetrometers (Figure 1) include: − cone base areas of either 1000 mm2 or 1500 mm2; other sizes are also in use, including penetrometers
with cross-sectional areas of 500 mm2 and 3300 mm2 − cone and friction sleeve sensors placed in series − (pore) pressure measurements either at the face of the cone (u1) or at the cylindrical extension of the
cone (u2). However, multiple-sensor penetrometers (u1, u2 and u3) are also available. The u3 location is immediately above the friction sleeve
− non-directional inclinometer − storage of signals from the penetrometer in digital form for subsequent computer-based processing
and presentation. It is noted that load sensors placed in series offer robustness within the limitations of the relatively small diameter of penetrometers (36 mm diameter for 1000 mm2 cone base area). Robustness can offer improved performance in soft ground in comparison to more sensitive systems (Zuidberg, 1988). PROCEDURE Figure 2 summarises the test procedure. The procedure includes several stages. The stage of Additional Measurements is optional.
Figure 1 – Piezo-cone Penetrometer Figure 2 - Flow chart Set-up requires a reasonably flat, accessible, ground surface with a slope of 5o or less. In other cases, set-up is at discretion of equipment operator, considering risks such as damage to apparatus or safety of personnel. Most onshore thrust machines have levelling facilities allowing a vertical start of penetration. Seabed frames used for offshore CPT activities have no levelling facilities, i.e. start of penetration may not be vertical.
Start
Set-up stage
First CPT ofproject
Set-up approval
Additionalmeasurements ?
Additionalmeasurements
Termination
End
Yes
Yes
Yes
No
CPT
Termination stage
No
No
unit
Friction sleeve
Gap between frictionsleeve and shaft
Shaft
PARTPOSITION
Gap between frictionsleeve and cone
Cylindrical extensionabove base of cone
Base of cone
Face of cone
Apex of cone
PEN
ETR
OM
ETER
TIP
Push rod connector
Soil seal
Electrical cable forsignal transmission
Water seal
Friction sleeve
Friction sleeve sensor
Amplifier
Cone sensor
Inclinometer
Water sealPressure sensorSoil seal
Filter
Cone
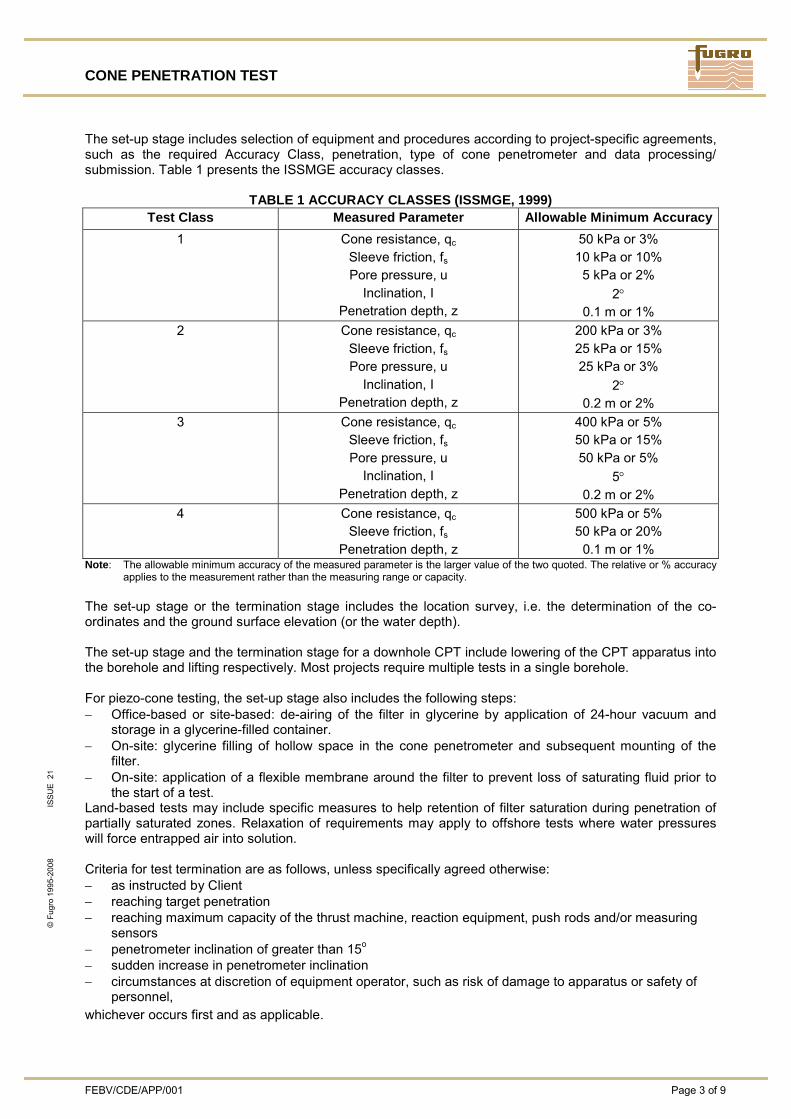
CONE PENETRATION TEST
FEBV/CDE/APP/001 Page 3 of 9
© F
ugro
199
5-20
08
ISSU
E 2
1
The set-up stage includes selection of equipment and procedures according to project-specific agreements, such as the required Accuracy Class, penetration, type of cone penetrometer and data processing/ submission. Table 1 presents the ISSMGE accuracy classes.
TABLE 1 ACCURACY CLASSES (ISSMGE, 1999) Test Class Measured Parameter Allowable Minimum Accuracy
1 Cone resistance, qc
Sleeve friction, fs Pore pressure, u
Inclination, I Penetration depth, z
50 kPa or 3% 10 kPa or 10% 5 kPa or 2%
2° 0.1 m or 1%
2 Cone resistance, qc
Sleeve friction, fs Pore pressure, u
Inclination, I Penetration depth, z
200 kPa or 3% 25 kPa or 15% 25 kPa or 3%
2° 0.2 m or 2%
3 Cone resistance, qc
Sleeve friction, fs Pore pressure, u
Inclination, I Penetration depth, z
400 kPa or 5% 50 kPa or 15% 50 kPa or 5%
5° 0.2 m or 2%
4 Cone resistance, qc
Sleeve friction, fs
Penetration depth, z
500 kPa or 5% 50 kPa or 20%
0.1 m or 1% Note: The allowable minimum accuracy of the measured parameter is the larger value of the two quoted. The relative or % accuracy
applies to the measurement rather than the measuring range or capacity. The set-up stage or the termination stage includes the location survey, i.e. the determination of the co-ordinates and the ground surface elevation (or the water depth). The set-up stage and the termination stage for a downhole CPT include lowering of the CPT apparatus into the borehole and lifting respectively. Most projects require multiple tests in a single borehole. For piezo-cone testing, the set-up stage also includes the following steps: − Office-based or site-based: de-airing of the filter in glycerine by application of 24-hour vacuum and
storage in a glycerine-filled container. − On-site: glycerine filling of hollow space in the cone penetrometer and subsequent mounting of the
filter. − On-site: application of a flexible membrane around the filter to prevent loss of saturating fluid prior to
the start of a test. Land-based tests may include specific measures to help retention of filter saturation during penetration of partially saturated zones. Relaxation of requirements may apply to offshore tests where water pressures will force entrapped air into solution. Criteria for test termination are as follows, unless specifically agreed otherwise: − as instructed by Client − reaching target penetration − reaching maximum capacity of the thrust machine, reaction equipment, push rods and/or measuring
sensors − penetrometer inclination of greater than 15o − sudden increase in penetrometer inclination − circumstances at discretion of equipment operator, such as risk of damage to apparatus or safety of
personnel, whichever occurs first and as applicable.
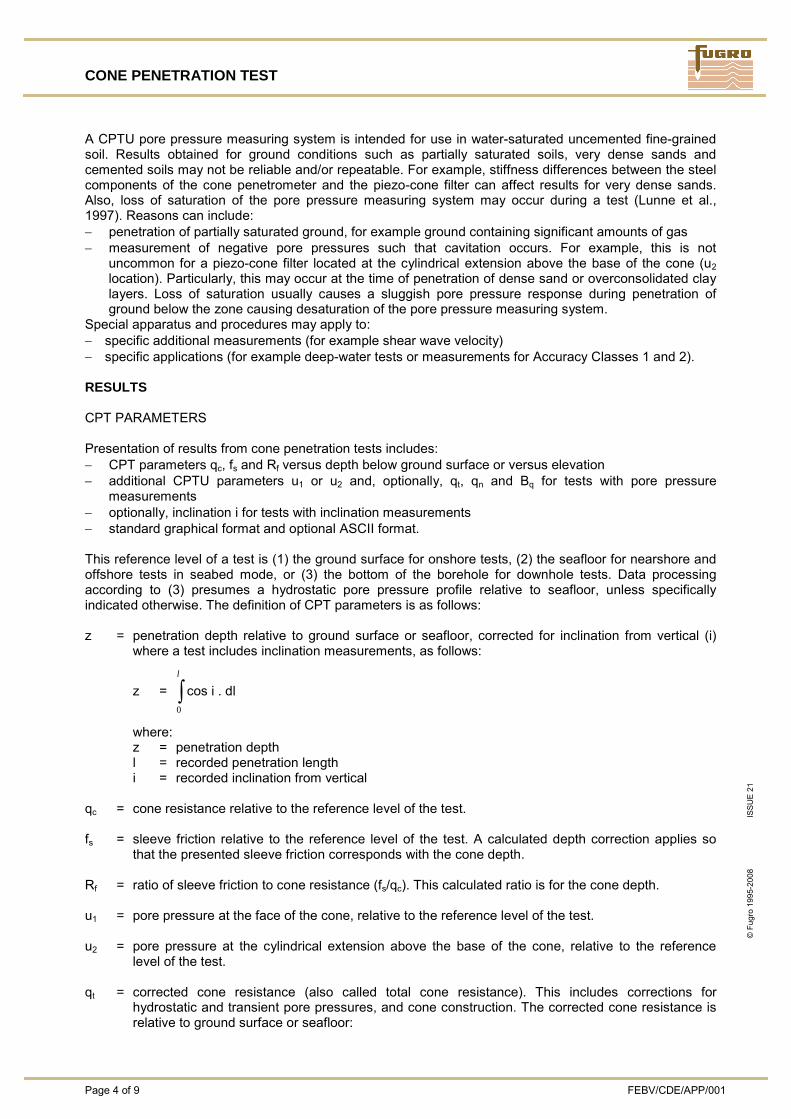
CONE PENETRATION TEST
Page 4 of 9 FEBV/CDE/APP/001
© F
ugro
199
5-20
08
ISSU
E 21
A CPTU pore pressure measuring system is intended for use in water-saturated uncemented fine-grained soil. Results obtained for ground conditions such as partially saturated soils, very dense sands and cemented soils may not be reliable and/or repeatable. For example, stiffness differences between the steel components of the cone penetrometer and the piezo-cone filter can affect results for very dense sands. Also, loss of saturation of the pore pressure measuring system may occur during a test (Lunne et al., 1997). Reasons can include: − penetration of partially saturated ground, for example ground containing significant amounts of gas − measurement of negative pore pressures such that cavitation occurs. For example, this is not
uncommon for a piezo-cone filter located at the cylindrical extension above the base of the cone (u2 location). Particularly, this may occur at the time of penetration of dense sand or overconsolidated clay layers. Loss of saturation usually causes a sluggish pore pressure response during penetration of ground below the zone causing desaturation of the pore pressure measuring system.
Special apparatus and procedures may apply to: − specific additional measurements (for example shear wave velocity) − specific applications (for example deep-water tests or measurements for Accuracy Classes 1 and 2). RESULTS CPT PARAMETERS Presentation of results from cone penetration tests includes: − CPT parameters qc, fs and Rf versus depth below ground surface or versus elevation − additional CPTU parameters u1 or u2 and, optionally, qt, qn and Bq for tests with pore pressure
measurements − optionally, inclination i for tests with inclination measurements − standard graphical format and optional ASCII format. This reference level of a test is (1) the ground surface for onshore tests, (2) the seafloor for nearshore and offshore tests in seabed mode, or (3) the bottom of the borehole for downhole tests. Data processing according to (3) presumes a hydrostatic pore pressure profile relative to seafloor, unless specifically indicated otherwise. The definition of CPT parameters is as follows: z = penetration depth relative to ground surface or seafloor, corrected for inclination from vertical (i)
where a test includes inclination measurements, as follows:
z = ∫l
0
cos i . dl
where: z = penetration depth l = recorded penetration length i = recorded inclination from vertical qc = cone resistance relative to the reference level of the test. fs = sleeve friction relative to the reference level of the test. A calculated depth correction applies so
that the presented sleeve friction corresponds with the cone depth. Rf = ratio of sleeve friction to cone resistance (fs/qc). This calculated ratio is for the cone depth. u1 = pore pressure at the face of the cone, relative to the reference level of the test. u2 = pore pressure at the cylindrical extension above the base of the cone, relative to the reference
level of the test. qt = corrected cone resistance (also called total cone resistance). This includes corrections for
hydrostatic and transient pore pressures, and cone construction. The corrected cone resistance is relative to ground surface or seafloor:
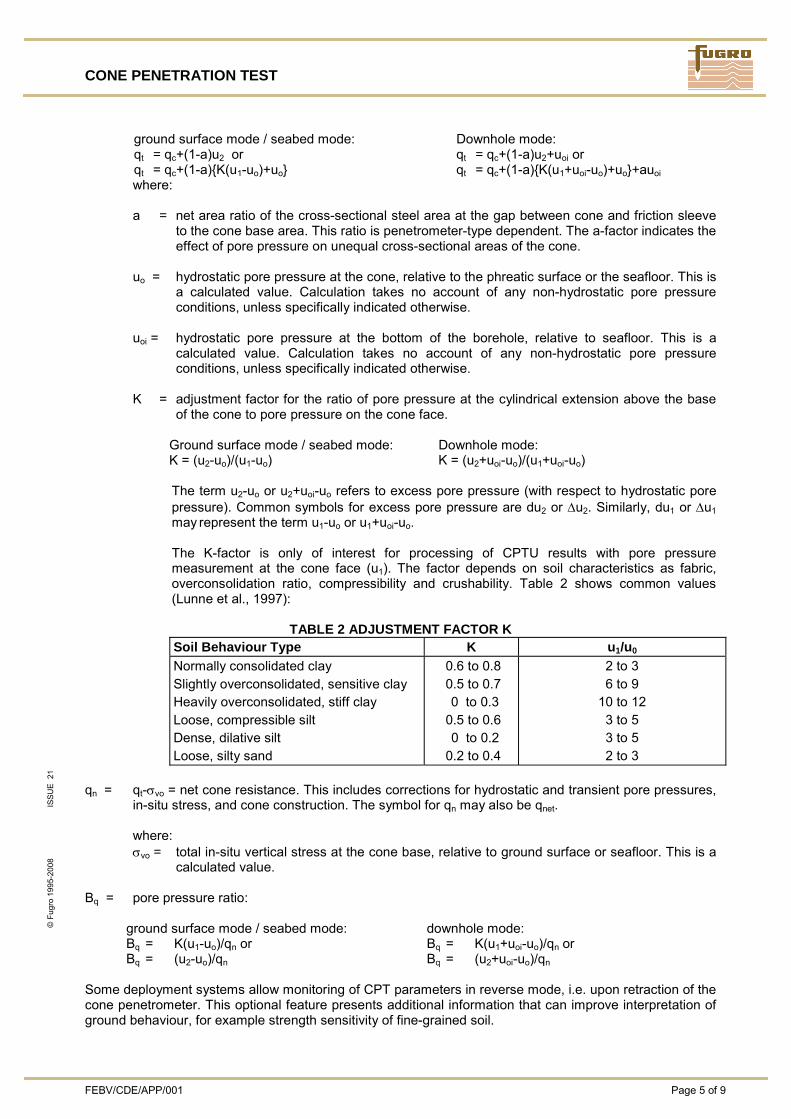
CONE PENETRATION TEST
FEBV/CDE/APP/001 Page 5 of 9
© F
ugro
199
5-20
08
ISSU
E 2
1
ground surface mode / seabed mode: Downhole mode: qt = qc+(1-a)u2 or qt = qc+(1-a){K(u1-uo)+uo}
qt = qc+(1-a)u2+uoi or qt = qc+(1-a){K(u1+uoi-uo)+uo}+auoi
where:
a = net area ratio of the cross-sectional steel area at the gap between cone and friction sleeve to the cone base area. This ratio is penetrometer-type dependent. The a-factor indicates the effect of pore pressure on unequal cross-sectional areas of the cone.
uo = hydrostatic pore pressure at the cone, relative to the phreatic surface or the seafloor. This is
a calculated value. Calculation takes no account of any non-hydrostatic pore pressure conditions, unless specifically indicated otherwise.
uoi = hydrostatic pore pressure at the bottom of the borehole, relative to seafloor. This is a
calculated value. Calculation takes no account of any non-hydrostatic pore pressure conditions, unless specifically indicated otherwise.
K = adjustment factor for the ratio of pore pressure at the cylindrical extension above the base
of the cone to pore pressure on the cone face.
Ground surface mode / seabed mode: Downhole mode: K = (u2-uo)/(u1-uo) K = (u2+uoi-uo)/(u1+uoi-uo)
The term u2-uo or u2+uoi-uo refers to excess pore pressure (with respect to hydrostatic pore pressure). Common symbols for excess pore pressure are du2 or Δu2. Similarly, du1 or Δu1 may represent the term u1-uo or u1+uoi-uo. The K-factor is only of interest for processing of CPTU results with pore pressure measurement at the cone face (u1). The factor depends on soil characteristics as fabric, overconsolidation ratio, compressibility and crushability. Table 2 shows common values (Lunne et al., 1997):
TABLE 2 ADJUSTMENT FACTOR K Soil Behaviour Type K u1/u0
Normally consolidated clay Slightly overconsolidated, sensitive clay Heavily overconsolidated, stiff clay Loose, compressible silt Dense, dilative silt Loose, silty sand
0.6 to 0.8 0.5 to 0.7 0 to 0.3 0.5 to 0.6 0 to 0.2 0.2 to 0.4
2 to 3 6 to 9
10 to 12 3 to 5 3 to 5 2 to 3
qn = qt-σvo = net cone resistance. This includes corrections for hydrostatic and transient pore pressures,
in-situ stress, and cone construction. The symbol for qn may also be qnet.
where: σvo = total in-situ vertical stress at the cone base, relative to ground surface or seafloor. This is a
calculated value. Bq = pore pressure ratio:
ground surface mode / seabed mode: downhole mode: Bq = K(u1-uo)/qn or Bq = (u2-uo)/qn
Bq = K(u1+uoi-uo)/qn or Bq = (u2+uoi-uo)/qn
Some deployment systems allow monitoring of CPT parameters in reverse mode, i.e. upon retraction of the cone penetrometer. This optional feature presents additional information that can improve interpretation of ground behaviour, for example strength sensitivity of fine-grained soil.
CONE PENETRATION TEST
Page 6 of 9 FEBV/CDE/APP/001
© F
ugro
199
5-20
08
ISSU
E 21
ACCURACY OF MEASUREMENTS Accuracy Classes
Traditionally, cone penetration test standards followed a “prescriptive” approach, whereby specific detailed measures provided a “deemed to comply” practice. Current practice (NNI, 1996 and ISSMGE, 1999) specifies “performance” criteria for cone penetration test measurements. The ISO standard on metrological confirmation (ISO, 2003) provides the general framework for assessment of performance compliance. The following comments apply: − Accuracy is the “closeness of a measurement to the true value of the quantity being measured”. It is
the accuracy as a whole that is ultimately important not the individual parts. Precision is the “closeness of each set of measurements to each other”. The resolution of a measuring system is the “minimum size of the change in the value of a quantity that it can detect”. It will influence the accuracy and precision of a measurement.
− Accuracy Class 3 represents industry practice for common adverse field conditions. It is approximately equivalent to the more implicit requirements of ASTM International. Class 3 applies, unless specifically agreed otherwise.
− Accuracy Class 1 is a future target, currently believed to be feasible only for favourable test conditions (Lunne, 2000). Class 2 is usually feasible on a project-specific basis.
So-called “zero drift” of the measured parameters is a performance indicator for the measuring system. Zero drift is the absolute difference of the zero readings or reference readings of a measuring system between the start and completion of the cone penetration test. The zero drift of the measured parameters should be within the allowable minimum accuracy according to the selected accuracy class. Correction of measured parameters for zero drift applies if appropriate for meeting the requirements of the selected accuracy class. Accuracy considerations for strongly layered soils must allow for heat flux phenomena. Heat flux is reported to give an apparent shift in cone resistance (Post and Nebbeling, 1995). For example, friction in dense sand causes a cone to heat by about 1oC/MPa cone resistance. Resulting heat flux decreases cone resistance by an apparent shift in the order of 100 kPa to 200 kPa for a penetrating probe going from dense sand into clay. This is a temporary decrease lasting about 5 minutes. Ambient temperature compensation systems fail to avoid heat flux effects. Penetration interruption can be an effective mitigation measure. The following sections provide important information for use of results. Shallow Penetration
Use of reaction equipment will affect stress conditions for shallow penetration. Particularly, offshore conditions may include extremely soft ground at seafloor. Soil disturbance, pore pressure build-up and consolidation of near-surface soft soil may take place. This will affect the measurements. Downhole deployment implies a typical limiting CPT stroke of 1.5 m or 3 m. It is common to perform multiple semi-continuous tests. Graphics for such tests typically show a build-up of CPT values for the initial 0.1 m to 0.5 m penetration. This penetration zone is immediately below the required borehole and represents complex ground stress conditions and/or borehole-induced ground disturbance that cannot be avoided. Penetration Interruption
A penetration interruption may be unavoidable, for example to add a push rod or to perform a pore pressure dissipation test. This will affect test results. Consolidation of low-permeability soil around a cone tip is of particular interest. A stationary cone penetrometer can apply local stresses that approach failure conditions, i.e. about 9 times the undrained shear strength or about 2 times the in-situ mean effective stress. Pore pressure re-distribution and dissipation occur, resulting in a local increase in undrained shear strength and hence cone (bearing) resistance. A doubling of cone resistance may not be unreasonable for 100% consolidation. Supplementary considerations include:
CONE PENETRATION TEST
FEBV/CDE/APP/001 Page 7 of 9
© F
ugro
199
5-20
08
ISSU
E 2
1
− Small downward movement of a penetrometer (order of millimetres) during a test can contribute to maintaining local stresses approaching failure conditions.
− Soil consolidation around a cone penetrometer may lead to soil/penetrometer adhesion that is sufficient to give an increase in “cone” diameter. Resumption of penetration will lead to loss of adhered soil, usually within an equivalent distance of a few times the cone diameter.
− A low Bq value may imply partially drained penetration conditions. It is likely that any steady-state penetration conditions will not apply instantaneously upon resumption of penetration.
− Measuring sensors in a probe generate heat, but this is probably not significant for any stationary measurement. Fugro’s strain-gauge load sensors are compensated for ambient temperature fluctuations.
Depth Measurement for Offshore Conditions
Offshore definition of the seafloor (ground surface) is difficult for extremely soft ground at seafloor. Penetration of the reaction equipment into a near-fluid zone of the seabed may take place unnoticed. Such settlement affects the start of penetration depth z. Also, settlement may continue at the time of testing. Downhole CPT systems rely on depth control applicable to borehole drilling. Depth control in the order of 0.2 m is feasible for drilling systems deployed from a fixed platform, for example a jack-up platform. This value excludes uncertainty associated with determination of seafloor level. Drilling control from floating equipment, for example a geotechnical survey vessel, may be subject to the additional influence of waves and tides. Depth control in the order of 0.2 m is feasible for favourable conditions, but may increase to about 0.5 m for adverse conditions. The accuracy classes include requirements for depth measurement. It is clear that these requirements may not be feasible for offshore activities. The selected approach for offshore conditions is retain only the requirements for the principal CPT parameters such as cone resistance qc. Zero-Correction for Offshore Conditions
Water pressures generate significant values of cone resistance and pore pressure. The standardised practice is to correct these Reference Readings to zero at seafloor. Seabed-based CPT systems allow zero-correction to hydrostatic conditions prior to the start of a test, typically with a zero-correction uncertainty approaching the resolution of the CPT system. Downhole CPT systems latch into the lower end of a drill pipe. The pressure conditions in the drill pipe may not be in full equilibrium with the surrounding ground water pressure and zero-correction will be subject to increased uncertainty. Comparison of seabed-based and downhole based test results suggests a typical downhole zero-correction uncertainty for pore pressure in the order of 100 kPa for deepwater tests (Peuchen, 2000). This uncertainty depends on factors such as the free-flow and viscosity of drill fluid between the drill bit and the seafloor. The uncertainty typically decreases with decreasing depth of the drill bit below sea level and below seafloor. Uncertainty for the zero-correction of cone resistance is approximately equivalent, but by a factor representing the net area ratio effect. Deepwater Tests
A deepwater environment presents some favourable conditions for cone penetration tests, notably temperature. Ambient temperature conditions are practically constant and the measuring system has ample time to adjust to these temperatures (ASTM International, 1995; NNI, 1996). In addition, transient heat flow phenomena (Post and Nebbeling, 1995) in a cone penetrometer are usually not applicable due to the generally very soft soil consistency and the absence of crust layers formed by desiccation of clay or silt in geological history. Deepwater (piezo-cone) pore pressure measurements are essentially similar to shallow-water measurements, with the exception of an increased measuring range for pore pressure leading to some reduction in sensor accuracy. Saturation of a pore pressure measuring system is excellent for a deepwater environment, as the high pressures will force any gas bubbles into solution. Currently available evidence indicates that a high-quality subtraction-type cone penetrometer is adequate for very soft soil characterisation to a water depth of 3000 metres and probably beyond.
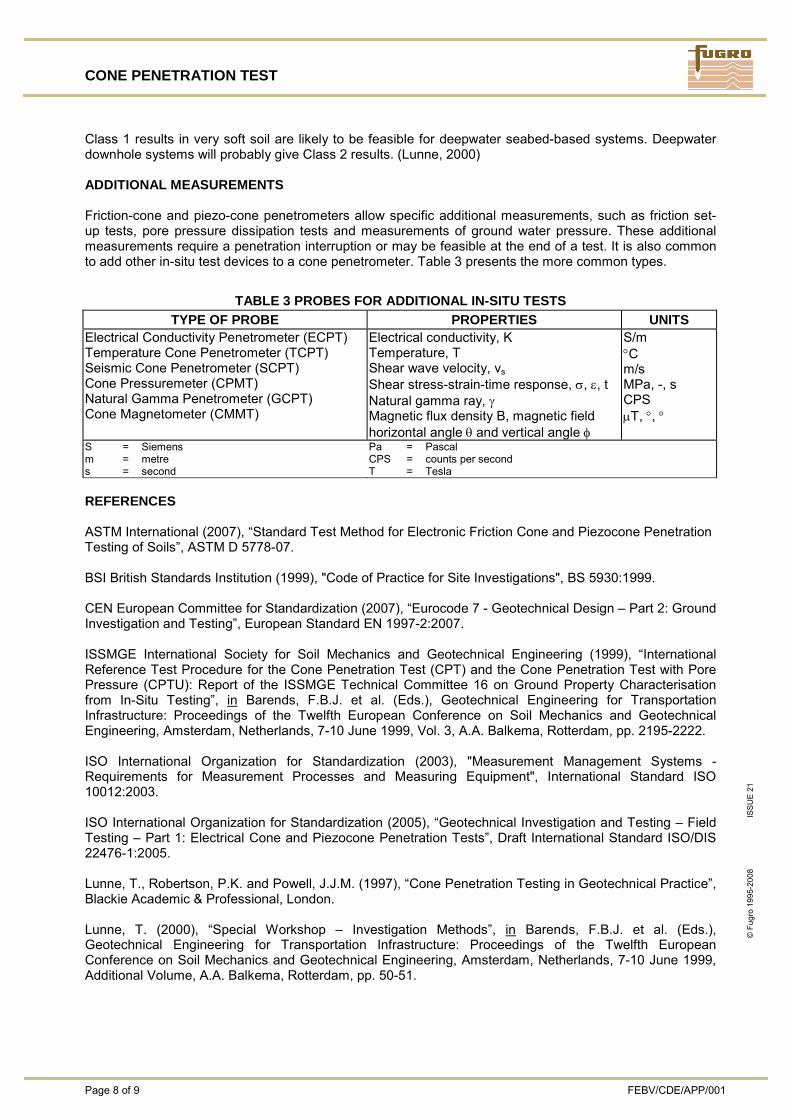
CONE PENETRATION TEST
Page 8 of 9 FEBV/CDE/APP/001
© F
ugro
199
5-20
08
ISSU
E 21
Class 1 results in very soft soil are likely to be feasible for deepwater seabed-based systems. Deepwater downhole systems will probably give Class 2 results. (Lunne, 2000) ADDITIONAL MEASUREMENTS Friction-cone and piezo-cone penetrometers allow specific additional measurements, such as friction set-up tests, pore pressure dissipation tests and measurements of ground water pressure. These additional measurements require a penetration interruption or may be feasible at the end of a test. It is also common to add other in-situ test devices to a cone penetrometer. Table 3 presents the more common types.
TABLE 3 PROBES FOR ADDITIONAL IN-SITU TESTS TYPE OF PROBE PROPERTIES UNITS
Electrical Conductivity Penetrometer (ECPT) Temperature Cone Penetrometer (TCPT) Seismic Cone Penetrometer (SCPT) Cone Pressuremeter (CPMT) Natural Gamma Penetrometer (GCPT) Cone Magnetometer (CMMT)
Electrical conductivity, K Temperature, T Shear wave velocity, vs
Shear stress-strain-time response, σ, ε, t Natural gamma ray, γ Magnetic flux density B, magnetic field horizontal angle θ and vertical angle φ
S/m °C m/s MPa, -, s CPS μT, °, °
S = Siemens m = metre s = second
Pa = Pascal CPS = counts per second T = Tesla
REFERENCES ASTM International (2007), “Standard Test Method for Electronic Friction Cone and Piezocone Penetration Testing of Soils”, ASTM D 5778-07. BSI British Standards Institution (1999), "Code of Practice for Site Investigations", BS 5930:1999. CEN European Committee for Standardization (2007), “Eurocode 7 - Geotechnical Design – Part 2: Ground Investigation and Testing”, European Standard EN 1997-2:2007. ISSMGE International Society for Soil Mechanics and Geotechnical Engineering (1999), “International Reference Test Procedure for the Cone Penetration Test (CPT) and the Cone Penetration Test with Pore Pressure (CPTU): Report of the ISSMGE Technical Committee 16 on Ground Property Characterisation from In-Situ Testing”, in Barends, F.B.J. et al. (Eds.), Geotechnical Engineering for Transportation Infrastructure: Proceedings of the Twelfth European Conference on Soil Mechanics and Geotechnical Engineering, Amsterdam, Netherlands, 7-10 June 1999, Vol. 3, A.A. Balkema, Rotterdam, pp. 2195-2222. ISO International Organization for Standardization (2003), "Measurement Management Systems - Requirements for Measurement Processes and Measuring Equipment", International Standard ISO 10012:2003. ISO International Organization for Standardization (2005), “Geotechnical Investigation and Testing – Field Testing – Part 1: Electrical Cone and Piezocone Penetration Tests”, Draft International Standard ISO/DIS 22476-1:2005. Lunne, T., Robertson, P.K. and Powell, J.J.M. (1997), “Cone Penetration Testing in Geotechnical Practice”, Blackie Academic & Professional, London. Lunne, T. (2000), “Special Workshop – Investigation Methods”, in Barends, F.B.J. et al. (Eds.), Geotechnical Engineering for Transportation Infrastructure: Proceedings of the Twelfth European Conference on Soil Mechanics and Geotechnical Engineering, Amsterdam, Netherlands, 7-10 June 1999, Additional Volume, A.A. Balkema, Rotterdam, pp. 50-51.

CONE PENETRATION TEST
FEBV/CDE/APP/001 Page 9 of 9
© F
ugro
199
5-20
08
ISSU
E 2
1
NEN Nederlands Normalisatie-instituut (1996), “Geotechnics. Determination of the Cone Resistance and the Sleeve Friction of Soil. Electric Cone Penetration Test”, Dutch Standard NEN 5140. (in Dutch) NORSOK (2004), "Marine soil investigations", NORSOK Standard G-001 Rev. 2. Peuchen, J. (2000), “Deepwater Cone Penetration Tests”, Offshore Technology Conference, 1-4 May 2000, Houston, Texas, U.S.A., OTC Paper 12094. Post, M.L. and Nebbeling, H. (1995), “Uncertainties in Cone Penetration Testing”, in International Symposium on Cone Penetration Testing CPT’95, Linköping, Sweden, October 4-5, 1995, Vol. 2, SGF Report, No. 3:95, Swedish Geotechnical Society, Linköping, pp. 73-78. Zuidberg, H. (1988) "Piezocone Penetration Testing, Probe Development", ISOPT-1, Speciality Session No. 13, March 24, Orlando, Florida.
CONE PENETRATION TEST INTERPRETATION
FEBV/CDE/APP/012 Page 1 of 11
© F
ugro
199
4-20
08
IS
SUE
12
INTRODUCTION
This document presents a summary of interpretation methods for Cone Penetration Test (CPT) results. The project-specific selection of methods depends on the agreed project requirements. Some of the methods suit computer-based interpretation of CPT data records. The Fugro program UNIPLOT is available for this purpose. Interpretation of cone penetration test results helps provide parameters for geotechnical models. Conventional models are typically based on plasticity theory for the ultimate limit state, and on elasticity theory and consolidation theory for the serviceability limit state (CEN, 2004). Features of these geotechnical models are: − analysis of either drained (sand model) behaviour or undrained (clay model) behaviour for plasticity
models − analysis for the ultimate limit state differs from that for the serviceability limit state. CPT interpretation techniques are mostly based on empirical correlations with limited theoretical backing. Data integration with other, complementary investigation techniques (such as drilling, sampling and laboratory testing) improves confidence levels. Lunne et al. (1997) present an overview of interpretation techniques. The interpretation techniques discussed below are subject to limitations such as: − The majority of interpretation techniques apply to "conventional" sands and clays. Conventional
techniques may not be appropriate for silts, sand/clay/gravel mixtures, varved or layered soils, gassy soils, underconsolidated soils, peats, carbonate soils, cemented soils and residual soils. These non-conventional soils warrant a more specific approach.
− Empirical correlations use reference parameters such as the undrained shear strength determined from a laboratory single-stage Isotropically Consolidated Undrained triaxial test (CIU) on an undisturbed specimen obtained by means of push sampling techniques. The reference parameter may not be appropriate for the selected model, and adjustment may be necessary.
− The cone penetration test offers limited direct information on serviceability limit states (deformation), as the penetration process imposes large strains in the surrounding soil. In comparison to ultimate limit states, better complementary data will usually be required.
− CPT interpretation techniques are often indirect. Usually, interpretation requires estimates of various other parameters. This is consistent with an integrated geotechnical investigation approach. Inevitably, this approach also includes some redundancy of data.
− Drained or undrained behaviour for the geotechnical analysis at hand may or may not coincide with respectively drained or undrained behaviour during fixed-rate penetration testing. This interpretation difficulty remains largely unresolved at this time.
− The interpretations apply to conditions as encountered at the time of the geotechnical investigation. Geological, environmental and construction/operational factors may alter as-found conditions.
PENETRATION BEHAVIOUR
Soil behaviour during cone penetration testing shows large displacements in the immediate vicinity of the penetrometer, and small elastic displacements further away from the penetrometer. Density/structure, stiffness and in-situ stress conditions significantly affect the measured parameters. The measured cone resistance (qc) includes hydrostatic water pressures as well as stress-induced pore pressures. The pore pressures are usually negligible for clean sand because the ratio of effective stress to pore pressure is high. This ratio is, however, low for penetration into clay. Knowledge of pore pressures around the penetrometer can thus be important. CPT parameters that take account of pore pressure effects include total cone resistance (qt), net cone resistance (qn) and pore pressure ratio (Bq). These parameters can be calculated if Piezo-cone Penetration Test (PCPT) data are available. The influence of pore pressures on sleeve friction fs is relatively small. It is common to ignore this influence. It is clear that calculation of friction ratio Rf (defined as fs/qc) includes no allowance for pore pressure effects. The penetration rate with respect to soil permeability determines whether soil behaviour is primarily undrained, drained or partially drained. In general, soil behaviour during cone penetration testing is drained in clean sand (no measurable pore pressures as a consequence of soil displacements) and undrained in clay
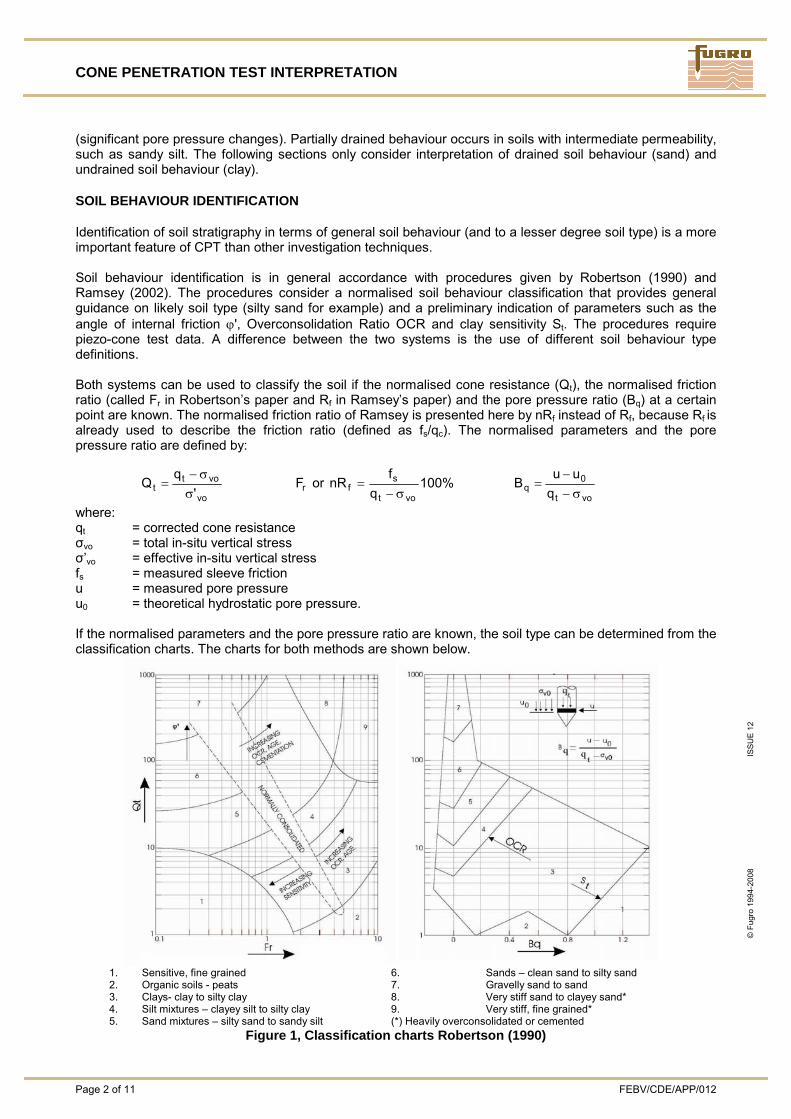
CONE PENETRATION TEST INTERPRETATION
Page 2 of 11 FEBV/CDE/APP/012
© F
ugro
199
4-20
08
I
SSU
E 12
(significant pore pressure changes). Partially drained behaviour occurs in soils with intermediate permeability, such as sandy silt. The following sections only consider interpretation of drained soil behaviour (sand) and undrained soil behaviour (clay). SOIL BEHAVIOUR IDENTIFICATION
Identification of soil stratigraphy in terms of general soil behaviour (and to a lesser degree soil type) is a more important feature of CPT than other investigation techniques. Soil behaviour identification is in general accordance with procedures given by Robertson (1990) and Ramsey (2002). The procedures consider a normalised soil behaviour classification that provides general guidance on likely soil type (silty sand for example) and a preliminary indication of parameters such as the angle of internal friction ϕ', Overconsolidation Ratio OCR and clay sensitivity St. The procedures require piezo-cone test data. A difference between the two systems is the use of different soil behaviour type definitions. Both systems can be used to classify the soil if the normalised cone resistance (Qt), the normalised friction ratio (called Fr in Robertson’s paper and Rf in Ramsey’s paper) and the pore pressure ratio (Bq) at a certain point are known. The normalised friction ratio of Ramsey is presented here by nRf instead of Rf, because Rf is already used to describe the friction ratio (defined as fs/qc). The normalised parameters and the pore pressure ratio are defined by:
vo
vott '
σσ−
= rF or %100q
fnR
vot
sf σ−
= vot
0q q
uuB
σ−−
=
where: qt = corrected cone resistance σvo = total in-situ vertical stress σ’vo = effective in-situ vertical stress fs = measured sleeve friction u = measured pore pressure u0 = theoretical hydrostatic pore pressure. If the normalised parameters and the pore pressure ratio are known, the soil type can be determined from the classification charts. The charts for both methods are shown below.
Figure 1, Classification charts Robertson (1990)
1. Sensitive, fine grained 6. Sands – clean sand to silty sand 2. Organic soils - peats 7. Gravelly sand to sand 3. Clays- clay to silty clay 8. Very stiff sand to clayey sand* 4. Silt mixtures – clayey silt to silty clay 9. Very stiff, fine grained* 5. Sand mixtures – silty sand to sandy silt (*) Heavily overconsolidated or cemented
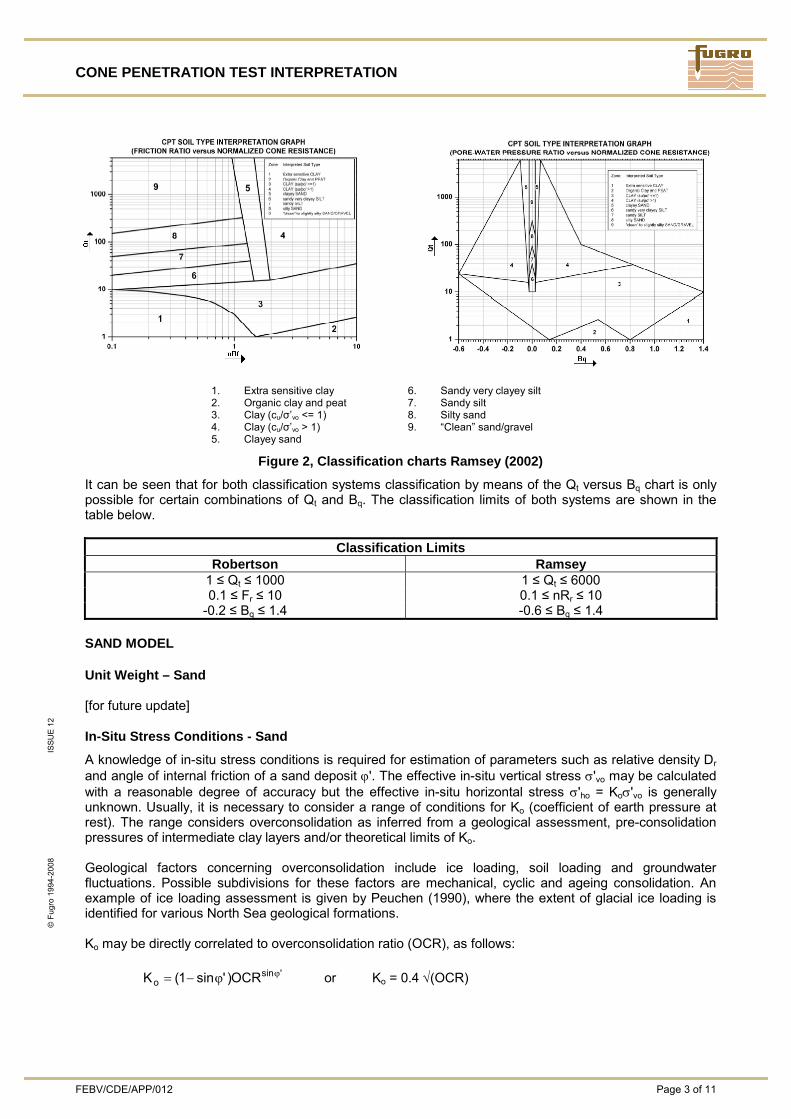
CONE PENETRATION TEST INTERPRETATION
FEBV/CDE/APP/012 Page 3 of 11
© F
ugro
199
4-20
08
ISS
UE
12
1. Extra sensitive clay 6. Sandy very clayey silt 2. Organic clay and peat 7. Sandy silt 3. Clay (cu/σ’vo <= 1) 8. Silty sand 4. Clay (cu/σ’vo > 1) 9. “Clean” sand/gravel 5. Clayey sand
Figure 2, Classification charts Ramsey (2002)
It can be seen that for both classification systems classification by means of the Qt versus Bq chart is only possible for certain combinations of Qt and Bq. The classification limits of both systems are shown in the table below.
Classification Limits Robertson Ramsey
1 ≤ Qt ≤ 1000 1 ≤ Qt ≤ 6000 0.1 ≤ Fr ≤ 10 0.1 ≤ nRr ≤ 10
-0.2 ≤ Bq ≤ 1.4 -0.6 ≤ Bq ≤ 1.4 SAND MODEL
Unit Weight – Sand [for future update] In-Situ Stress Conditions - Sand
A knowledge of in-situ stress conditions is required for estimation of parameters such as relative density Dr and angle of internal friction of a sand deposit ϕ'. The effective in-situ vertical stress σ'vo may be calculated with a reasonable degree of accuracy but the effective in-situ horizontal stress σ'ho = Koσ'vo is generally unknown. Usually, it is necessary to consider a range of conditions for Ko (coefficient of earth pressure at rest). The range considers overconsolidation as inferred from a geological assessment, pre-consolidation pressures of intermediate clay layers and/or theoretical limits of Ko. Geological factors concerning overconsolidation include ice loading, soil loading and groundwater fluctuations. Possible subdivisions for these factors are mechanical, cyclic and ageing consolidation. An example of ice loading assessment is given by Peuchen (1990), where the extent of glacial ice loading is identified for various North Sea geological formations. Ko may be directly correlated to overconsolidation ratio (OCR), as follows: 'sin
o OCR)'sin1(K ϕϕ−= or Ko = 0.4 √(OCR)
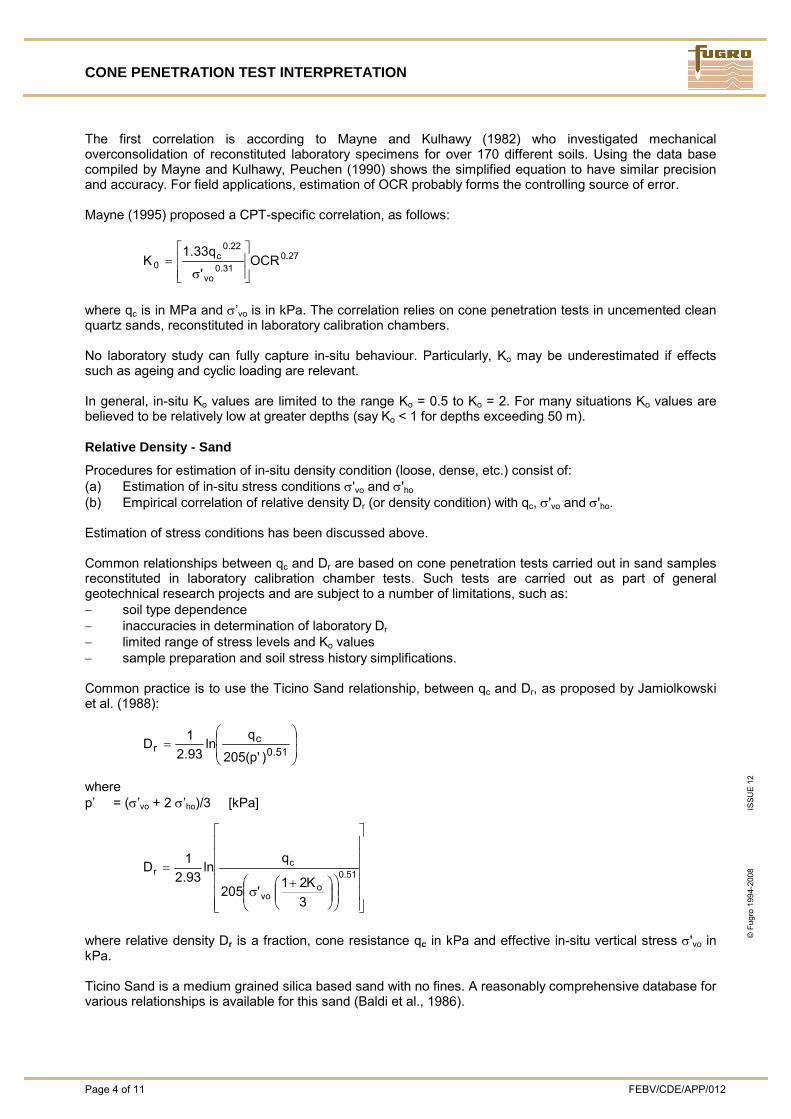
CONE PENETRATION TEST INTERPRETATION
Page 4 of 11 FEBV/CDE/APP/012
© F
ugro
199
4-20
08
I
SSU
E 12
The first correlation is according to Mayne and Kulhawy (1982) who investigated mechanical overconsolidation of reconstituted laboratory specimens for over 170 different soils. Using the data base compiled by Mayne and Kulhawy, Peuchen (1990) shows the simplified equation to have similar precision and accuracy. For field applications, estimation of OCR probably forms the controlling source of error. Mayne (1995) proposed a CPT-specific correlation, as follows:
27.031.0
vo
22.0c
0 OCR'
q33.1K
⎥⎥⎦
⎤
⎢⎢⎣
⎡
σ=
where qc is in MPa and σ’vo is in kPa. The correlation relies on cone penetration tests in uncemented clean quartz sands, reconstituted in laboratory calibration chambers. No laboratory study can fully capture in-situ behaviour. Particularly, Ko may be underestimated if effects such as ageing and cyclic loading are relevant. In general, in-situ Ko values are limited to the range Ko = 0.5 to Ko = 2. For many situations Ko values are believed to be relatively low at greater depths (say Ko < 1 for depths exceeding 50 m). Relative Density - Sand
Procedures for estimation of in-situ density condition (loose, dense, etc.) consist of: (a) Estimation of in-situ stress conditions σ'vo and σ'ho (b) Empirical correlation of relative density Dr (or density condition) with qc, σ'vo and σ'ho. Estimation of stress conditions has been discussed above. Common relationships between qc and Dr are based on cone penetration tests carried out in sand samples reconstituted in laboratory calibration chamber tests. Such tests are carried out as part of general geotechnical research projects and are subject to a number of limitations, such as: − soil type dependence − inaccuracies in determination of laboratory Dr − limited range of stress levels and Ko values − sample preparation and soil stress history simplifications. Common practice is to use the Ticino Sand relationship, between qc and Dr, as proposed by Jamiolkowski et al. (1988):
⎟⎟⎠
⎞⎜⎜⎝
⎛=
51.0c
r)'p(205
qln
93.21D
where p’ = (σ’vo + 2 σ’ho)/3 [kPa]
⎥⎥⎥⎥⎥⎥
⎦
⎤
⎢⎢⎢⎢⎢⎢
⎣
⎡
⎟⎟⎠
⎞⎜⎜⎝
⎛⎟⎟⎠
⎞⎜⎜⎝
⎛ +σ
=51.0
ovo
cr
3K21
'205
qln
93.21D
where relative density Dr is a fraction, cone resistance qc in kPa and effective in-situ vertical stress σ'vo in kPa. Ticino Sand is a medium grained silica based sand with no fines. A reasonably comprehensive database for various relationships is available for this sand (Baldi et al., 1986).
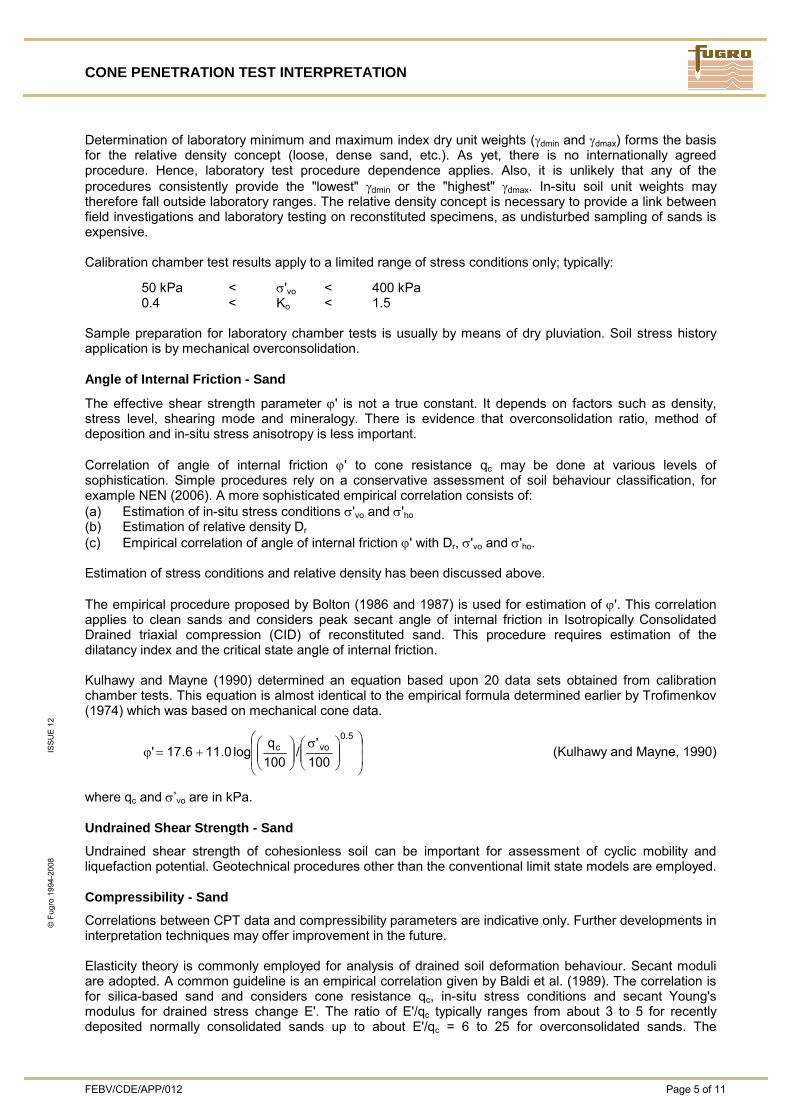
CONE PENETRATION TEST INTERPRETATION
FEBV/CDE/APP/012 Page 5 of 11
© F
ugro
199
4-20
08
ISS
UE
12
Determination of laboratory minimum and maximum index dry unit weights (γdmin and γdmax) forms the basis for the relative density concept (loose, dense sand, etc.). As yet, there is no internationally agreed procedure. Hence, laboratory test procedure dependence applies. Also, it is unlikely that any of the procedures consistently provide the "lowest" γdmin or the "highest" γdmax. In-situ soil unit weights may therefore fall outside laboratory ranges. The relative density concept is necessary to provide a link between field investigations and laboratory testing on reconstituted specimens, as undisturbed sampling of sands is expensive. Calibration chamber test results apply to a limited range of stress conditions only; typically:
50 kPa < σ'vo < 400 kPa 0.4 < Ko < 1.5
Sample preparation for laboratory chamber tests is usually by means of dry pluviation. Soil stress history application is by mechanical overconsolidation. Angle of Internal Friction - Sand
The effective shear strength parameter ϕ' is not a true constant. It depends on factors such as density, stress level, shearing mode and mineralogy. There is evidence that overconsolidation ratio, method of deposition and in-situ stress anisotropy is less important. Correlation of angle of internal friction ϕ' to cone resistance qc may be done at various levels of sophistication. Simple procedures rely on a conservative assessment of soil behaviour classification, for example NEN (2006). A more sophisticated empirical correlation consists of: (a) Estimation of in-situ stress conditions σ'vo and σ'ho (b) Estimation of relative density Dr (c) Empirical correlation of angle of internal friction ϕ' with Dr, σ'vo and σ'ho. Estimation of stress conditions and relative density has been discussed above. The empirical procedure proposed by Bolton (1986 and 1987) is used for estimation of ϕ'. This correlation applies to clean sands and considers peak secant angle of internal friction in Isotropically Consolidated Drained triaxial compression (CID) of reconstituted sand. This procedure requires estimation of the dilatancy index and the critical state angle of internal friction. Kulhawy and Mayne (1990) determined an equation based upon 20 data sets obtained from calibration chamber tests. This equation is almost identical to the empirical formula determined earlier by Trofimenkov (1974) which was based on mechanical cone data.
⎟⎟
⎠
⎞
⎜⎜
⎝
⎛⎟⎟⎠
⎞⎜⎜⎝
⎛ σ⎟⎟⎠
⎞⎜⎜⎝
⎛+=ϕ
5.0voc
100'
/100q
log0.116.17' (Kulhawy and Mayne, 1990)
where qc and σ’vo are in kPa. Undrained Shear Strength - Sand
Undrained shear strength of cohesionless soil can be important for assessment of cyclic mobility and liquefaction potential. Geotechnical procedures other than the conventional limit state models are employed. Compressibility - Sand
Correlations between CPT data and compressibility parameters are indicative only. Further developments in interpretation techniques may offer improvement in the future. Elasticity theory is commonly employed for analysis of drained soil deformation behaviour. Secant moduli are adopted. A common guideline is an empirical correlation given by Baldi et al. (1989). The correlation is for silica-based sand and considers cone resistance qc, in-situ stress conditions and secant Young's modulus for drained stress change E'. The ratio of E'/qc typically ranges from about 3 to 5 for recently deposited normally consolidated sands up to about E'/qc = 6 to 25 for overconsolidated sands. The
CONE PENETRATION TEST INTERPRETATION
Page 6 of 11 FEBV/CDE/APP/012
© F
ugro
199
4-20
08
I
SSU
E 12
correlation has been inferred from laboratory conditions; including CPT tests in a calibration chamber and conventional triaxial compression tests on reconstituted sand samples. It takes account of the degree of deformation and overconsolidation. In this regard it is noted that secant deformation moduli are strongly dependent on strain level: the elastic modulus increases with decreasing strain to an upper limit at about 10-4% strain. For estimation of initial (small strain) or dynamic shear moduli, ratios of Gmax/qc of between about 4 and 20 are considered, in accordance with Baldi et al. (1989).The basis for this correlation is similar to that of secant Young's modulus, except that laboratory resonant column tests serve as reference instead of triaxial compression tests. Results of limited in-situ seismic cross-hole and downhole tests provide an approximate check of this correlation. Constrained Modulus M
Kulhawy and Mayne (1990) derived two formulas for the determination of the constrained modulus for both normally consolidated and overconsolidated sands by indicating that the modulus is a function of relative density. The determination of relative density can be done with, for example, the methods indicated previously.
rD0075.009.1c 10*qM −= (Normally consolidated sands, Kulhawy and Mayne, 1990)
rD0122.078.1c 10*qM −= (Overconsolidated sands, Kulhawy and Mayne, 1990)
where Dr is in %, and qc and M in kPa respectively. Shear Modulus Gmax
Interpretation of low-strain shear modulus can be considered by using the modified correlation proposed by Rix and Stokoe (1991) in which data from calibration test measurements is compared to the correlation obtained between Gmax and qc by Baldi et al. (1989).
( ) 375.0vo
25.0cmax ')q(1634G σ= (Rix and Stokoe, 1991)
where Gmax, qc and σ’vo are in kPa.
CLAY MODEL
Unit Weight – Clay
[for future update] In-Situ Stress Conditions - Clay
Similar to sand, a knowledge of in-situ stress conditions is generally necessary for estimation of other parameters such as consistency (soft, stiff, etc.) of a clay deposit and compressibility. Calculation of the effective in-situ vertical stress σ’vo is reasonably accurate. A more approximate estimate applies to the effective in-situ horizontal stress σ'ho, or, more particular, Ko as σ'ho = Koσ'vo. Direct correlations for interpretation of the coefficient of earth pressure at rest Ko are uncommon. For normally consolidated clays and silts, Konc may be correlated with angle of internal friction, in accordance with Jaky (1944), or more simply in accordance with Mayne and Kulhawy (1982). The reference angle of internal friction is that obtained from a straight line approximation of the Mohr-Coulomb failure envelope determined from Isotropically Consolidated Undrained (CIU) triaxial compression tests on undisturbed specimens. For overconsolidated clays, Kooc may be correlated with angle of internal friction and overconsolidation ratio, in accordance with Mayne and Kulhawy (1982). The plasticity index together with OCR may also be used for preliminary estimates of Kooc as indicated by Brooker and Ireland (1965).
'sino OCR)'sin1(K ϕϕ−= (Mayne and Kulhawy, 1982)
CONE PENETRATION TEST INTERPRETATION
FEBV/CDE/APP/012 Page 7 of 11
© F
ugro
199
4-20
08
ISS
UE
12
Overconsolidation Ratio - Clay
Overconsolidation ratio is defined as: OCR = σ'p/σ'vo where σ'p is the pre-consolidation pressure considered to correspond with the maximum vertical effective stress to which the soil has been subjected, and σ'vo is the current effective in-situ vertical stress. The pre-consolidation pressure approximates a stress level where relatively small strains are separated from relatively large strains occurring on the virgin compression stress range. The reference OCR is usually based on laboratory oedometer tests carried out on undisturbed samples, and may thus be influenced by factors such as sample disturbance, strain rate effects and interpretation procedure. Various analytical and semi-empirical models for interpretation of pre-consolidation pressure from piezo-cone test data are available. Sandven (1990) presents a summary. The procedures are mostly "experimental" and as yet uncommon in practice. Chen and Mayne (1996) presented a direct correlation between net cone resistance and overconsolidation ratio for 205 clay sites around the world, as follows: tQ317.0OCR = (Chen and Mayne, 1996) The overconsolidation ratio may also be inferred from a geological assessment and from undrained strength ratios. Geological factors concerning overconsolidation have been discussed under "in-situ stress conditions - sand". An empirical procedure for estimation of OCR based on undrained strength ratio cu/σ'vo is given by Wroth (1984). The procedure uses the strength rebound parameter Λ. Guidance for selection of Λ and normally consolidated undrained strength ratio is given by Mayne (1988). Historically, much use has also been made of the Skempton (1957) relationship between normally consolidated undrained strength ratio and plasticity index Ip. This equation is useful for preliminary estimates, considering that Ip probably relates to ϕ' in some complex manner. Undrained Shear Strength - Clay
No single undrained shear strength exists. The in-situ undrained shear strength cu depends on factors such as mode of failure, stress history, anisotropy, strain rate and temperature. Various theoretical and empirical procedures are available to correlate qc with cu. Theoretical approaches use bearing capacity, cavity expansion or steady penetration solutions, all of which require a number of simplifying assumptions. Empirical approaches are more common in engineering practice because of difficulties in realistic soil modelling. An empirical correlation for soft to stiff, intact and relatively homogeneous clays is given by Battaglio et al. (1986) as follows: cu = (qc-σvo)/Nc where cu, σvo and qc are in kPa. Nc is an empirical factor that ranges between 10 and 25, with the higher Nc factors applying to clays with a relatively low plasticity index, and vice versa. The reference undrained shear strength is that determined from in-situ vane test results. The term σvo (total in-situ vertical stress) becomes insignificant for stiff clays at shallow depth so that the equation reduces to cu = qc/Nc. For specific design situations, a different cu reference strength should be used. For example, offshore axial pile capacity predictions in accordance with API (2000) recommend cu to be based on undrained triaxial compression tests, which are likely to yield lower cu values than in-situ vane tests. A site-specific or regional approach should generally be preferred. For example, Nc factors of 15 to 20 have been commonly used for firm to hard North Sea clays. They give reasonable strength estimates for cu values determined from pocket penetrometer, torvane and unconsolidated undrained triaxial tests (UU) on Shelby tube samples obtained by hammer sampling and push sampling techniques. Lower Nc factors are generally appropriate for soft clays and higher factors for heavily overconsolidated clays.
CONE PENETRATION TEST INTERPRETATION
Page 8 of 11 FEBV/CDE/APP/012
© F
ugro
199
4-20
08
I
SSU
E 12
If piezo-cone test data are available, then improved correlations are feasible because of the pore pressure information. Empirical correlations of piezo-cone test results with CIU undrained shear strengths are given by Rad and Lunne (1988), as follows: cu = qn/Nk Nk ranges typically between 8 and 30 with the higher Nk factors applying to heavily overconsolidated clays. The data points used for development of the correlation are generally limited to qn values of less than 2.5 MPa. Clay Sensitivity
The sensitivity of a clay (St) is the ratio of undisturbed undrained shear strength to remoulded undrained shear strength. Sensitivity may be assessed from the CPT friction ratio Rf, in accordance with Schmertmann (1978). The reference St value is taken to be that determined from undisturbed and remoulded laboratory undrained triaxial tests. This reference St value may differ from that determined from in-situ vane tests. This is partly related to the definition of sensitivity. For vane tests, remoulded undrained shear strength may not be appropriate. Rather, residual strength is probably measured at large strains. Skempton and Northey (1952) present a correlation of sensitivity and laboratory liquidity index IL. This correlation may allow a check on CPT-based interpretation of sensitivity. Effective Shear Strength Parameters - Clay
Measurement of pore water pressures during penetration testing has led to development of interpretation procedures for estimation of effective stress parameters of cohesive soils. Background information may be found in Sandven (1990). Currently available procedures are evaluated to be "experimental" and are as yet not commonly adopted. In general, CPT interpretation of effective shear strength parameters for clay and silt relies on soil behaviour-type classification. It is noted that significant silt and sand fractions in a clay deposit will increase ϕ', while a significant clay fraction in silt will decrease ϕ'. Masood and Mitchell (1993) provide an equation for the determination of ϕ’ by combining sleeve friction with the Rankine earth-pressure theory. The equation is based on the following assumptions: − Unit adhesion between soil and sleeve is negligible. − Friction angle between soil and sleeve = ϕ’/3. − Lateral earth pressure coefficient during penetration is equal to the Rankine coefficient of lateral earth
pressure under passive conditions.
)3'tan()
2'45(tan
'f 2
vo
s ϕϕ+°=
σ (Masood and Mitchell, 1993)
Mayne (2001) proposed an approximation of the Masood and Mitchell equation, as follows:
⎥⎦
⎤⎢⎣
⎡+
σ=ϕ 26.1)
'f
log(8.30'vo
s (Mayne, 2001)
Compressibility - Clay
Correlations between CPT data and compressibility parameters are viewed as indicative only, as discussed for sand compressibility.
CONE PENETRATION TEST INTERPRETATION
FEBV/CDE/APP/012 Page 9 of 11
© F
ugro
199
4-20
08
ISS
UE
12
The use of elasticity theory is common for analysis of undrained soil deformation behaviour. The adopted procedure is as follows: (a) Estimation of undrained shear strength cu from CPT data, as outlined above. (b) Estimation of secant Young's moduli for undrained stress change Eu in general accordance with
correlations based on cu, as presented by Ladd et al. (1977). Laboratory undrained triaxial tests carried out on undisturbed clay specimen form the basis for the Eu versus cu correlations. Typical Eu/cu ratios at a shear stress ratio of 0.3 range between about 300 and 900 for normally consolidated clays and Eu/cu = 100 to 300 for heavily overconsolidated clay. Higher Eu/cu ratios would apply to lower shear stress ratios, and vice versa. Mitchell and Gardner (1976) present an approximate correlation of cone resistance with constrained modulus M (or coefficient of volume compressibility mv, where M = 1/mv). Typical ratios of M/qc range between 1 and 8 for silts and clays. Refinements include qc ranges and soil type (silt, clay, low plasticity, high plasticity, etc). The correlation relies on the results of conventional laboratory oedometer tests carried out on undisturbed clay and silt samples. The constrained modulus can also be related (approximately) to secant Young's modulus E' and shear modulus G'. It is noted that laboratory soil stiffness may differ from in-situ stiffness because of inevitable sampling disturbance (in particular soil structure disturbance). In general, this implies that laboratory stiffness will usually be less than in-situ stiffness. Constrained Modulus M
Kulhawy and Mayne (1990) determined a useful formula for M in clays using high quality cone tip resistance data. This relationship is based on data from 12 different test sites, with constrained moduli up to 60 MPa. The published standard deviation is 6.7 MPa. nq25.8M = (Kulhawy and Mayne, 1990) Shear Modulus Gmax
Mayne and Rix (1993) determined a relationship between Gmax and qc by studying 481 data sets from 31 sites all over the world. Gmax ranged between about 0.7 MPa and 800 MPa. 335.1
cmax q78.2G = (Mayne and Rix, 1993)
where Gmax and qc are in kPa. REFERENCES
API American Petroleum Institute (2000), "Recommended Practice for Planning, Designing and Constructing Fixed Offshore Platforms - Working Stress Design", API Recommended Practice 2A-WSD (RP 2A-WSD), 21st Edition. (With Errata and Supplement 1, December 2002, Errata and Supplement 2, October 2005, and Errata and Supplement 3, October 2007). Baldi, G., Bellotti, R., Ghionna, N., Jamiolkowski, M. and Pasqualini, E. (1986), "Interpretation of CPT's and CPTU's, 2nd Part: Drained Penetration of Sands", in Field Instrumentation and In-Situ Measurements: Proceedings of the 4th International Geotechnical Seminar, 25-27 November 1986, Singapore, Nanyang Technological Institute, Singapore, pp. 143-156. Baldi, G., Bellotti, R., Ghionna, V.N., Jamiolkowski, M. and Lo Presti, D.C.F. (1989), "Modulus of Sands from CPT's and DMT's", in Proceedings of the Twelfth International Conference on Soil Mechanics and Foundation Engineering, Rio de Janeiro, 13-18 August 1989, Vol. 1, A.A. Balkema, Rotterdam, pp. 165-170. Battaglio, M., Bruzzi, D., Jamiolkowski, M. and Lancellotta, R. (1986), "Interpretation of CPT's and CPTU's, 1st Part: Undrained Penetration of Saturated Clays", in Field Instrumentation and In-Situ Measurements: Proceedings of the 4th International Geotechnical Seminar, 25-27 November 1986, Singapore, Nanyang Technological Institute, Singapore, pp. 129-143. Bolton, M.D. (1986), "The Strength and Dilatancy of Sands", Géotechnique, Vol. 36, No. 1, pp. 65-78.
CONE PENETRATION TEST INTERPRETATION
Page 10 of 11 FEBV/CDE/APP/012
© F
ugro
199
4-20
08
I
SSU
E 12
Bolton, M.D. (1987), Author’s Reply to Discussion of "The Strength and Dilatancy of Sands", Géotechnique, Vol. 37, No. 2, pp. 225-226. Brooker, E.W. and Ireland, H.O. (1965), "Earth Pressure at Rest related to Stress History", Canadian Geotechnical Journal, Vol. 2, pp. 1-15. CEN European Committee for Standardization (2004), "Eurocode 7: Geotechnical Design - Part 1: General Rules", European Standard EN 1997-1:2004. Chen, B.S.Y. and Mayne, P.W. (1996), “Statistical Relationships between Piezocone Measurements and Stress History of Clays", Canadian Geotechnical Journal, Vol. 33, No. 3, pp. 488-498. Jaky, J. (1944), “The Coefficient of Earth Pressure at Rest”, Magyar Mérnök és Epitész Egylet Közlönye, Vol. 78, No. 22, pp. 355-358. (in Hungarian). Jamiolkowski, M., Ghionna, V.N., Lancellotta, R. and Pasqualini, E. (1988), "New Correlations of Penetration Tests for Design Practice”, in De Ruiter, J. (Ed.), Penetration Testing 1988: Proceedings of the First International Symposium on Penetration Testing, ISOPT-1, Orlando, 20-24 March 1988, Vol. 1, A.A. Balkema, Rotterdam, pp. 263-296. Kulhawy, F.H. and Mayne, P.H. (1990), “Manual on Estimating Soil Properties for Foundation Design”, Electric Power Research Institute EPRI, Palo Alto, EPRI Report, EL-6800. Ladd, C.C., Foott, R., Ishihara, K., Schlosser, F. and Poulos, H.G. (1977), "Stress-deformation and Strength Characteristics", in Proceedings of the Ninth International Conference on Soil Mechanics and Foundation Engineering, 1977, Tokyo, Vol. 2, Japanese Society of Soil Mechanics and Foundation Engineering, Tokyo, pp. 421-494. Lunne, T., Robertson, P.K. and Powell, J.J.M. (1997), “Cone Penetration Testing in Geotechnical Practice”, Blackie Academic & Professional, London. Masood, T. and Mitchell, J.K. (1993), “Estimation of In Situ Lateral Stresses in Soils by Cone-Penetration Test”, Journal of Geotechnical Engineering, Vol. 119, No. 10, pp. 1624-1639. Mayne, P.W. (1988), "Determining OCR in Clays from Laboratory Strength", Journal of Geotechnical Engineering, Vol. 114, No. 1, pp. 76-92. Mayne, P.W. (1995), “CPT Determination of Overconsolidation Ratio and Lateral Stresses in Clean Quartz Sands”, in International Symposium on Cone Penetration Testing CPT’95, Linköping, Sweden, October 4-5, 1995, Vol. 2, SGF Report, No. 3:95, Swedish Geotechnical Society, Linköping, pp. 215-220. Mayne, P.W. (2001), “Geotechnical Site Characterization Using Cone, Piezocone, SCPTu, and VST”, Georgia Institute of Technology, Atlanta. Mayne, P.W. and Kulhawy, F.H. (1982), "Ko - OCR Relationships in Soil", Journal of the Geotechnical Engineering Division, Proceedings of the American Society of Civil Engineers, Vol. 108, No. GT6, pp. 851-872. Mayne, P.W. and Rix, G.J. (1993), “Gmax-qc Relationships for Clays”, Geotechnical Testing Journal, Vol. 16, No. 1, pp. 54-60. Mitchell, J.K. and Gardner, W.S. (1976), "In Situ Measurement of Volume Change Characteristics", in Proceedings of the Conference on In Situ Measurement of Soil Properties, June 1-4, 1975, Raleigh, North Carolina: Specialty Conference of the Geotechnical Engineering Division, ASCE, Vol. II, American Society of Civil Engineers, New York, pp. 279-345. NEN Nederlands Normalisatie-instituut (2006), “Geotechnics. TGB 1990 - Basic Requirements and Loads”, Dutch Standard NEN 6740. (in Dutch).
CONE PENETRATION TEST INTERPRETATION
FEBV/CDE/APP/012 Page 11 of 11
© F
ugro
199
4-20
08
ISS
UE
12
Peuchen, J. (1990), “Internal CDE Report on Relative Density, Overconsolidation and Cone Resistance”, Fugro Engineers B.V., Leidschendam, Report No. CDE-25. Ramsey, N. (2002), "A Calibrated Model for the Interpretation of Cone Penetration Tests (CPTs) in North Sea Quaternary Soils", in Cook, M. et al. (Eds.), Offshore Site Investigation and Geotechnics : 'Diversity and Sustainability': Proceedings of an International Conference Held in London, UK, 26-28 November 2002, Society for Underwater Technology, London, pp. 341-356. Rix, G.J. and Stokoe, K.H. (II) (1991), “Correlation of Initial Tangent Modulus and Cone Penetration Resistance”, in Huang, A.B. (Ed.), Calibration Chamber Testing: Proceedings of the First International Symposium on Calibration Chamber Testing ISOCCTI, Potsdam, New York, 28-29 June 1991, Elsevier Science Publishing Company, New York, pp. 351-362. Rad, N.S. and Lunne, T. (1988), "Direct Correlations between Piezocone Test Results and Undrained Shear Strength of Clay", in De Ruiter, J. (Ed.), Penetration Testing 1988: Proceedings of the First International Symposium on Penetration Testing, ISOPT-1, Orlando, 20-24 March 1988, Vol. 2, A.A. Balkema, Rotterdam, pp. 911-917. Robertson, P.K. (1990), "Soil Classification using the Cone Penetration Test", Canadian Geotechnical Journal, Vol. 27, No. 1, pp. 151-158. Sandven, R. (1990), "Strength and Deformation Properties of Fine Grained Soils obtained from Piezocone Tests", Thesis, Norwegian Institute of Technology, Department of Civil Engineering, Trondheim. Schmertmann, J.H. (1978), "Guidelines for Cone Penetration Test Performance and Design", U.S. Department of Transportation, Federal Highway Administration, Washington, D.C., Report No. FHWA-TS-78-209. Skempton, A.W. (1957), "Discussion on Airport Paper No. 35: The Planning and Design of the New Hong Kong Airport", ICE Proceedings, Vol. 7, p. 306. Skempton, A.W. and Northey, R.D. (1952), "The Sensitivity of Clays", Géotechnique, Vol. 3, No. 1, pp. 30-53. Trofimenkov, J.G. (1974), “Penetration Testing in USSR: State-of-the-Art Report”, in Proceedings of the European Symposium on Penetration Testing ESOPT, Stockholm, June 5-7, 1974, Vol. 1, National Swedish Building Research, Stockholm, pp. 147-154. Wroth, C.P. (1984), "The Interpretation of In Situ Soil Tests", Géotechnique, Vol. 34, No. 4, pp. 449-489.
SOIL DESCRIPTION
FEBV/CDE/APP/005 Page 1 of 13
©
Fug
ro 1
996-
2008
ISSU
E 16
INTRODUCTION The Fugro soil description system employs two industry-standard classification systems with additional refinements. These are: − British Standard 5930 (BS, specifically Section 6 Paragraphs 41 to 43 on Description of soils). The
most recent version was published in 1999. − American Society for Testing and Materials (ASTM) Standards D 2487 (Classification of soils for
Engineering Purposes) and D 2488 (Description and Identification of Soils – Visual-Manual Procedure). The current editions were last revised in 2006.
The British Standard and ASTM Standards are similar in that both are based on the Unified Classification System (Casagrande, 1948); both rely on a range of relatively simple visual and manual observations; and both classify soils according to particle-size distribution and plasticity. In both standards, laboratory particle-size distribution and Atterberg limits tests are used to confirm the observations. In addition, both standards include organic soils characterization under soil particle type description. Significant differences between the two standards, however, are the particle-size boundaries and the degree to which plasticity is used as a basis for description. Other differences include the format and order of the soil description. This document describes a classification convention that is consistent with either the BS or ASTM standard, and that produces soil descriptions which can be converted to the other standard. In addition, to describe calcareous soils, Fugro has integrated the carbonate classification system outlined by Clark and Walker (1977) with both British Standard and ASTM systems (Peuchen et al., 1999, Landva et al., 2007). British Standard and ASTM system applies primarily to common terrestrial soils in temperate climates. However, construction activities in coastal areas and offshore can also encounter major carbonate soil deposits. The engineering characteristics of carbonate soil deposits can differ substantially from those of silica-based soil deposits, primarily because of cementation and differences in void ratios (Kolk, 2000). Appropriate description is necessary. A commonly accepted procedure for calcareous soil deposits is the Clark and walker system, originally developed for the Middle East. This considers particle size, carbonate content and material strength. The particle size classification fits both BS and ASTM system. The carbonate content is an additional feature and the material strength classification relates to common post-depositional alteration of calcareous soil. This document does not include rock description or specific engineering geological classification systems, such as those for the detailed identification of peat, chalk or micaceous sand. The main steps of the soil description system are: 1. Determine particle type as silica-based, organic, or calcareous. 2. For soils that are predominantly silica-based and organic, select BS 5930:1999 or ASTM D 2487
based on local geotechnical practice or project requirements, and follow the appropriate descriptive procedure. For calcareous soils, use the process described by Peuchen et al. (1999).
3. Determine the particle-size distribution and Atterberg limits (plasticity) for use in defining the principal and secondary soil fractions.
4. Measure or estimate soil strength according to one of the following: (1) relative density of coarse-grained soil, (2) consistency of fine-grained soil, (3) cementation of cemented soil, or (4) lithification of soil undergoing diagenesis.
5. Complete the description using the additional terms for the soil mass characteristics and other features such as bedding, colour, and particle shape.
CALCAREOUS SOIL DESCRIPTION A commonly accepted procedure for describing calcareous soil deposits, originally developed for the Middle East, was presented in a Technical Note by Clark and Walker (1977). The procedure considers particle size, carbonate content and material strength. The particle-size classification follows the Unified Soil Classification System. The carbonate content is an additional feature and the material strength classification relates to common post-depositional alteration of calcareous soil.
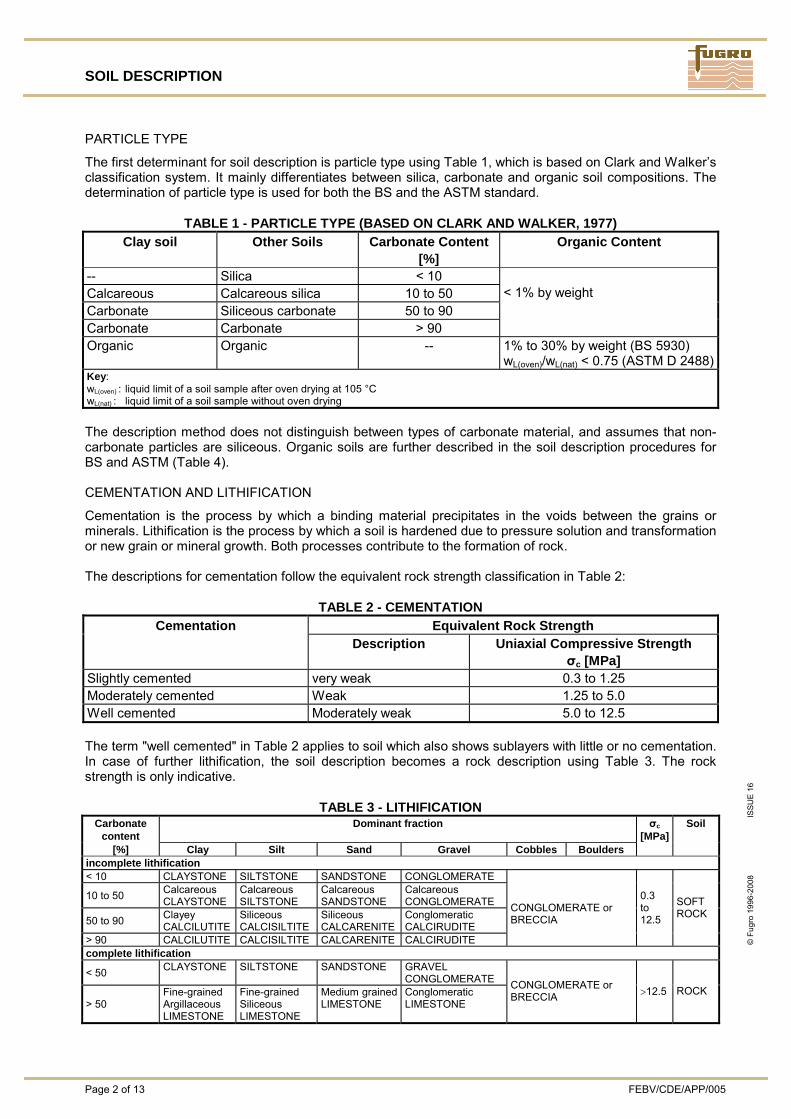
SOIL DESCRIPTION
Page 2 of 13 FEBV/CDE/APP/005
©
Fug
ro 1
996-
2008
ISSU
E 16
PARTICLE TYPE
The first determinant for soil description is particle type using Table 1, which is based on Clark and Walker’s classification system. It mainly differentiates between silica, carbonate and organic soil compositions. The determination of particle type is used for both the BS and the ASTM standard.
TABLE 1 - PARTICLE TYPE (BASED ON CLARK AND WALKER, 1977) Clay soil Other Soils Carbonate Content
[%] Organic Content
-- Silica < 10 Calcareous Calcareous silica 10 to 50 Carbonate Siliceous carbonate 50 to 90 Carbonate Carbonate > 90
< 1% by weight
Organic Organic -- 1% to 30% by weight (BS 5930) wL(oven)/wL(nat) < 0.75 (ASTM D 2488)
Key: wL(oven) : liquid limit of a soil sample after oven drying at 105 °C wL(nat) : liquid limit of a soil sample without oven drying The description method does not distinguish between types of carbonate material, and assumes that non-carbonate particles are siliceous. Organic soils are further described in the soil description procedures for BS and ASTM (Table 4). CEMENTATION AND LITHIFICATION
Cementation is the process by which a binding material precipitates in the voids between the grains or minerals. Lithification is the process by which a soil is hardened due to pressure solution and transformation or new grain or mineral growth. Both processes contribute to the formation of rock. The descriptions for cementation follow the equivalent rock strength classification in Table 2:
TABLE 2 - CEMENTATION Cementation Equivalent Rock Strength
Description Uniaxial Compressive Strength σc [MPa]
Slightly cemented very weak 0.3 to 1.25 Moderately cemented Weak 1.25 to 5.0 Well cemented Moderately weak 5.0 to 12.5 The term "well cemented" in Table 2 applies to soil which also shows sublayers with little or no cementation. In case of further lithification, the soil description becomes a rock description using Table 3. The rock strength is only indicative.
TABLE 3 - LITHIFICATION Carbonate
content Dominant fraction σc
[MPa]Soil
[%] Clay Silt Sand Gravel Cobbles Boulders
incomplete lithification < 10 CLAYSTONE SILTSTONE SANDSTONE CONGLOMERATE
10 to 50 Calcareous CLAYSTONE
Calcareous SILTSTONE
Calcareous SANDSTONE
Calcareous CONGLOMERATE
50 to 90 Clayey CALCILUTITE
Siliceous CALCISILTITE
Siliceous CALCARENITE
Conglomeratic CALCIRUDITE
> 90 CALCILUTITE CALCISILTITE CALCARENITE CALCIRUDITE
CONGLOMERATE or BRECCIA
0.3 to 12.5
SOFT ROCK
complete lithification
< 50 CLAYSTONE SILTSTONE SANDSTONE GRAVEL CONGLOMERATE
> 50 Fine-grained Argillaceous LIMESTONE
Fine-grained Siliceous LIMESTONE
Medium grained LIMESTONE
Conglomeratic LIMESTONE
CONGLOMERATE or BRECCIA >12.5 ROCK
SOIL DESCRIPTION
FEBV/CDE/APP/005 Page 3 of 13
©
Fug
ro 1
996-
2008
ISSU
E 16
The Clark and Walker system does not include reef limestone (biolithite). Reef limestone represents an in-situ accumulation of biological origin (e.g. coral reef) and consists largely of carbonate skeletal material of colonising organisms. The carbonate content normally exceeds 90%. Classification of strength follows rock description procedures. SOIL DESCRIPTION USING BS 5930:1999 In the following sections, each of the main characteristics is described in the order most commonly used for soil identification, with some portions of the text quoted (shown within quotation marks) or paraphrased from the BS 5930. SOIL GROUP
The soil group subdivides the soils into very coarse, coarse, fine, and organic soils. Very coarse soils consist of cobbles and boulders, with particles larger than 60 mm in diameter. These soil particles are rarely sampled using standard downhole soil sampling techniques. They are described separately, and not included when determining the proportions of the other soil components. The initial classification of silica soils as coarse or fine is based on the percentage of fine particles after the very coarse particles are removed. In BS 5930, the boundary between coarse (i.e. sands and gravels) and fines (i.e. silts and clays) is 0.060 mm (60 μm). When the soil contains approximately 35% or more fines, it is described as a fine soil; further classification of the fine soil as a clay or silt depends on the plasticity of the soil. When the soil contains less than about 35% fine material, it is usually described as a coarse soil. “The boundary between fine and coarse soils is approximate, as it depends on the plasticity of the fine fraction and the grading of the coarse fraction.” Organic soils contain usually small quantities of dispersed organic matter that can have a significant effect on soil plasticity. Organic soil descriptions in BS 5930 are based on an organic content by weight determined by loss on ignition. Where organic matter is present as a secondary constituent, the following terms are used:
TABLE 4 - ORGANIC SOIL DESCRIPTIONS Term Organic content
[% by weight] Typical colour
Slightly organic clay or silt Slightly organic sand
2 to 5 1 to 3
Grey Same as mineral
Organic clay or silt Organic sand
5 to 10 3 to 5
Dark grey Dark grey
Very organic clay or silt Very organic sand
> 10 > 5
Black Black
Soils with organic contents up to approximately 30% by weight and water contents up to about 250% behave as mineral soils and are described using the terms given in the lower portion of Table 4. Peat consists predominantly of plant remains, is usually dark brown or black, and has a distinctive smell. It is generally classified according to the degree of decomposition (fibrous, pseudo-fibrous, or amorphous) and strength (firm, spongy, or plastic). When encountered, reference can also be made to the classification given in ASTM Standard Procedure D 4427. PRINCIPAL SOIL TYPE AND PARTICLE SIZE Coarse-Grained Soils
The principal soil type in coarse-grained soils is sand if the dry weight of the sand fraction (0.06 mm to 2 mm particle sizes) exceeds that of the gravel fraction (2 mm to 60 mm particle sizes), and vice versa for gravel.
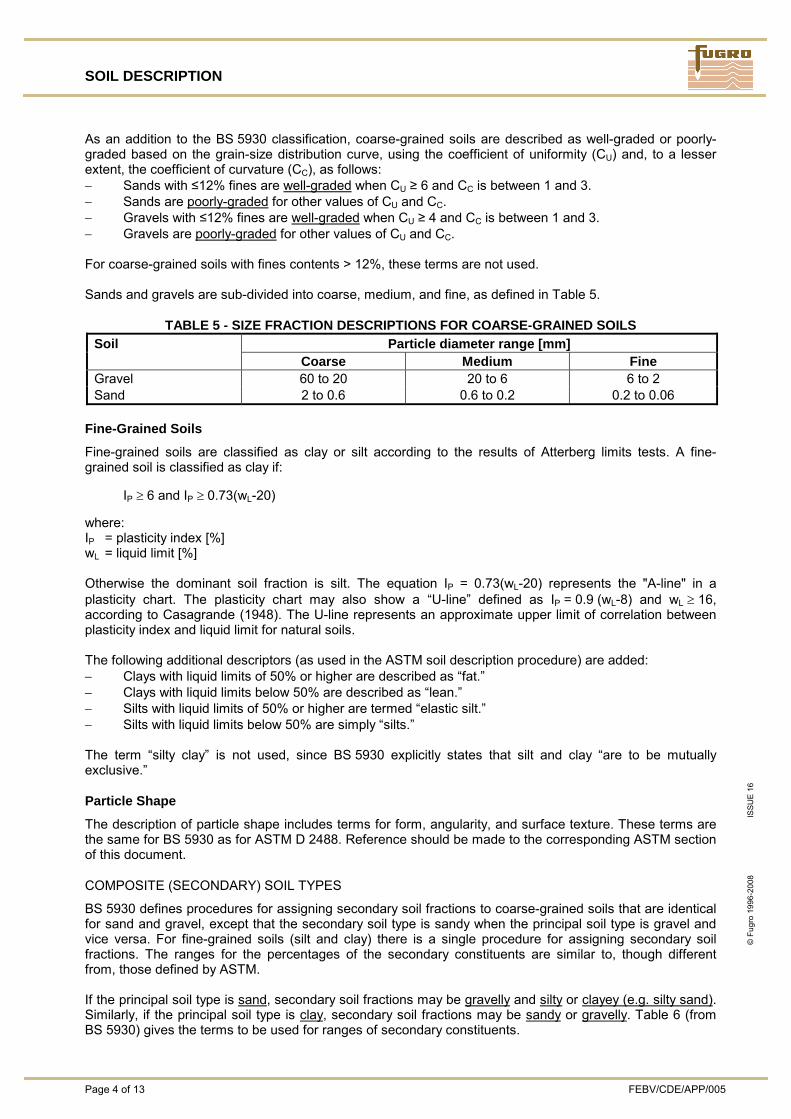
SOIL DESCRIPTION
Page 4 of 13 FEBV/CDE/APP/005
©
Fug
ro 1
996-
2008
ISSU
E 16
As an addition to the BS 5930 classification, coarse-grained soils are described as well-graded or poorly-graded based on the grain-size distribution curve, using the coefficient of uniformity (CU) and, to a lesser extent, the coefficient of curvature (CC), as follows: − Sands with ≤12% fines are well-graded when CU ≥ 6 and CC is between 1 and 3. − Sands are poorly-graded for other values of CU and CC. − Gravels with ≤12% fines are well-graded when CU ≥ 4 and CC is between 1 and 3. − Gravels are poorly-graded for other values of CU and CC. For coarse-grained soils with fines contents > 12%, these terms are not used. Sands and gravels are sub-divided into coarse, medium, and fine, as defined in Table 5.
TABLE 5 - SIZE FRACTION DESCRIPTIONS FOR COARSE-GRAINED SOILS Particle diameter range [mm] Soil
Coarse Medium Fine Gravel 60 to 20 20 to 6 6 to 2 Sand 2 to 0.6 0.6 to 0.2 0.2 to 0.06
Fine-Grained Soils
Fine-grained soils are classified as clay or silt according to the results of Atterberg limits tests. A fine-grained soil is classified as clay if: IP ≥ 6 and IP ≥ 0.73(wL-20) where: IP = plasticity index [%] wL = liquid limit [%] Otherwise the dominant soil fraction is silt. The equation IP = 0.73(wL-20) represents the "A-line" in a plasticity chart. The plasticity chart may also show a “U-line” defined as IP = 0.9 (wL-8) and wL ≥ 16, according to Casagrande (1948). The U-line represents an approximate upper limit of correlation between plasticity index and liquid limit for natural soils. The following additional descriptors (as used in the ASTM soil description procedure) are added: − Clays with liquid limits of 50% or higher are described as “fat.” − Clays with liquid limits below 50% are described as “lean.” − Silts with liquid limits of 50% or higher are termed “elastic silt.” − Silts with liquid limits below 50% are simply “silts.” The term “silty clay” is not used, since BS 5930 explicitly states that silt and clay “are to be mutually exclusive.” Particle Shape
The description of particle shape includes terms for form, angularity, and surface texture. These terms are the same for BS 5930 as for ASTM D 2488. Reference should be made to the corresponding ASTM section of this document. COMPOSITE (SECONDARY) SOIL TYPES
BS 5930 defines procedures for assigning secondary soil fractions to coarse-grained soils that are identical for sand and gravel, except that the secondary soil type is sandy when the principal soil type is gravel and vice versa. For fine-grained soils (silt and clay) there is a single procedure for assigning secondary soil fractions. The ranges for the percentages of the secondary constituents are similar to, though different from, those defined by ASTM. If the principal soil type is sand, secondary soil fractions may be gravelly and silty or clayey (e.g. silty sand). Similarly, if the principal soil type is clay, secondary soil fractions may be sandy or gravelly. Table 6 (from BS 5930) gives the terms to be used for ranges of secondary constituents.
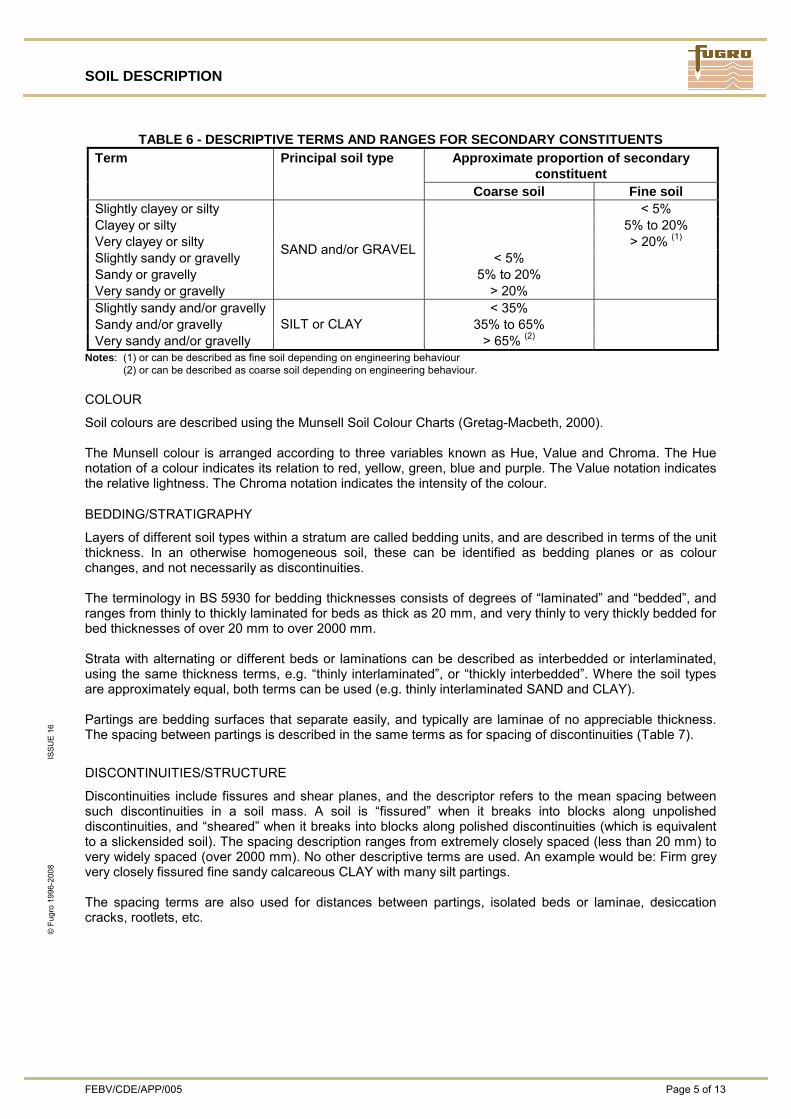
SOIL DESCRIPTION
FEBV/CDE/APP/005 Page 5 of 13
©
Fug
ro 1
996-
2008
ISSU
E 16
TABLE 6 - DESCRIPTIVE TERMS AND RANGES FOR SECONDARY CONSTITUENTS Approximate proportion of secondary
constituent Term Principal soil type
Coarse soil Fine soil Slightly clayey or silty < 5% Clayey or silty 5% to 20% Very clayey or silty > 20% (1) Slightly sandy or gravelly < 5% Sandy or gravelly 5% to 20% Very sandy or gravelly
SAND and/or GRAVEL
> 20% Slightly sandy and/or gravelly < 35% Sandy and/or gravelly 35% to 65% Very sandy and/or gravelly
SILT or CLAY > 65% (2)
Notes: (1) or can be described as fine soil depending on engineering behaviour (2) or can be described as coarse soil depending on engineering behaviour. COLOUR
Soil colours are described using the Munsell Soil Colour Charts (Gretag-Macbeth, 2000). The Munsell colour is arranged according to three variables known as Hue, Value and Chroma. The Hue notation of a colour indicates its relation to red, yellow, green, blue and purple. The Value notation indicates the relative lightness. The Chroma notation indicates the intensity of the colour. BEDDING/STRATIGRAPHY
Layers of different soil types within a stratum are called bedding units, and are described in terms of the unit thickness. In an otherwise homogeneous soil, these can be identified as bedding planes or as colour changes, and not necessarily as discontinuities. The terminology in BS 5930 for bedding thicknesses consists of degrees of “laminated” and “bedded”, and ranges from thinly to thickly laminated for beds as thick as 20 mm, and very thinly to very thickly bedded for bed thicknesses of over 20 mm to over 2000 mm. Strata with alternating or different beds or laminations can be described as interbedded or interlaminated, using the same thickness terms, e.g. “thinly interlaminated”, or “thickly interbedded”. Where the soil types are approximately equal, both terms can be used (e.g. thinly interlaminated SAND and CLAY). Partings are bedding surfaces that separate easily, and typically are laminae of no appreciable thickness. The spacing between partings is described in the same terms as for spacing of discontinuities (Table 7).
DISCONTINUITIES/STRUCTURE
Discontinuities include fissures and shear planes, and the descriptor refers to the mean spacing between such discontinuities in a soil mass. A soil is “fissured” when it breaks into blocks along unpolished discontinuities, and “sheared” when it breaks into blocks along polished discontinuities (which is equivalent to a slickensided soil). The spacing description ranges from extremely closely spaced (less than 20 mm) to very widely spaced (over 2000 mm). No other descriptive terms are used. An example would be: Firm grey very closely fissured fine sandy calcareous CLAY with many silt partings. The spacing terms are also used for distances between partings, isolated beds or laminae, desiccation cracks, rootlets, etc.
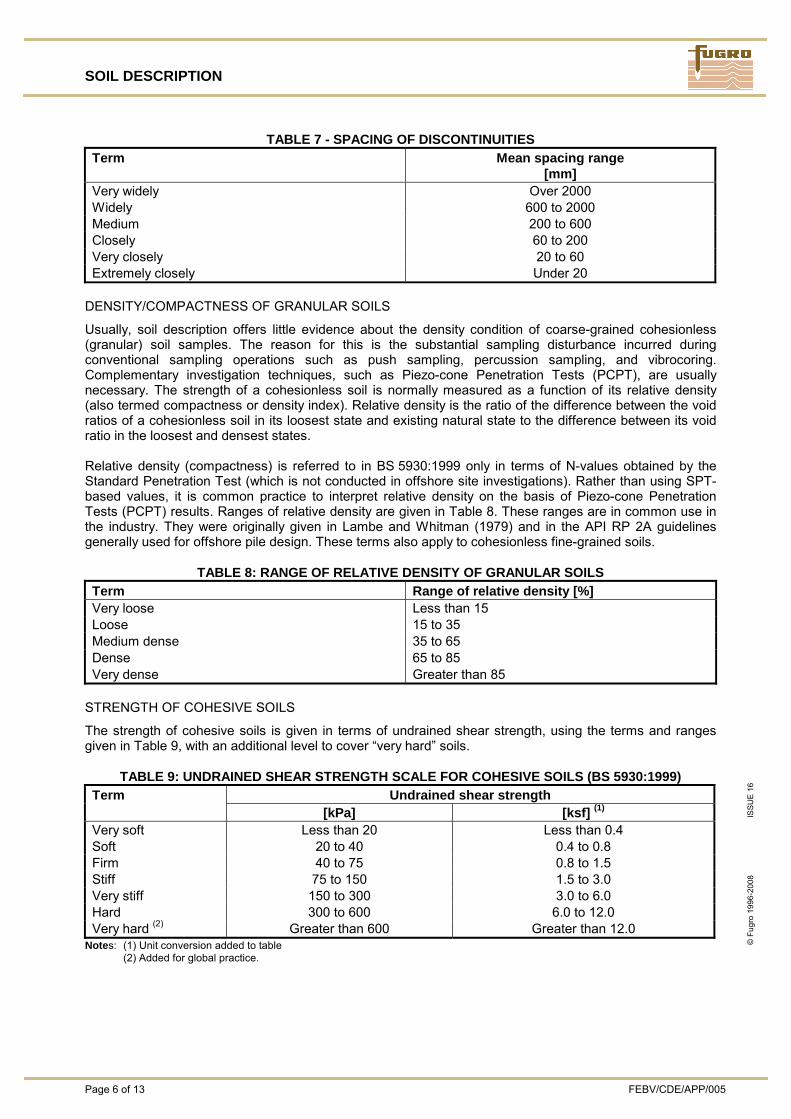
SOIL DESCRIPTION
Page 6 of 13 FEBV/CDE/APP/005
©
Fug
ro 1
996-
2008
ISSU
E 16
TABLE 7 - SPACING OF DISCONTINUITIES Term Mean spacing range
[mm] Very widely Over 2000 Widely 600 to 2000 Medium 200 to 600 Closely 60 to 200 Very closely 20 to 60 Extremely closely Under 20
DENSITY/COMPACTNESS OF GRANULAR SOILS
Usually, soil description offers little evidence about the density condition of coarse-grained cohesionless (granular) soil samples. The reason for this is the substantial sampling disturbance incurred during conventional sampling operations such as push sampling, percussion sampling, and vibrocoring. Complementary investigation techniques, such as Piezo-cone Penetration Tests (PCPT), are usually necessary. The strength of a cohesionless soil is normally measured as a function of its relative density (also termed compactness or density index). Relative density is the ratio of the difference between the void ratios of a cohesionless soil in its loosest state and existing natural state to the difference between its void ratio in the loosest and densest states. Relative density (compactness) is referred to in BS 5930:1999 only in terms of N-values obtained by the Standard Penetration Test (which is not conducted in offshore site investigations). Rather than using SPT-based values, it is common practice to interpret relative density on the basis of Piezo-cone Penetration Tests (PCPT) results. Ranges of relative density are given in Table 8. These ranges are in common use in the industry. They were originally given in Lambe and Whitman (1979) and in the API RP 2A guidelines generally used for offshore pile design. These terms also apply to cohesionless fine-grained soils.
TABLE 8: RANGE OF RELATIVE DENSITY OF GRANULAR SOILS Term Range of relative density [%] Very loose Less than 15 Loose 15 to 35 Medium dense 35 to 65 Dense 65 to 85 Very dense Greater than 85
STRENGTH OF COHESIVE SOILS
The strength of cohesive soils is given in terms of undrained shear strength, using the terms and ranges given in Table 9, with an additional level to cover “very hard” soils.
TABLE 9: UNDRAINED SHEAR STRENGTH SCALE FOR COHESIVE SOILS (BS 5930:1999) Term Undrained shear strength [kPa] [ksf] (1) Very soft Less than 20 Less than 0.4 Soft 20 to 40 0.4 to 0.8 Firm 40 to 75 0.8 to 1.5 Stiff 75 to 150 1.5 to 3.0 Very stiff 150 to 300 3.0 to 6.0 Hard 300 to 600 6.0 to 12.0 Very hard (2) Greater than 600 Greater than 12.0
Notes: (1) Unit conversion added to table (2) Added for global practice.
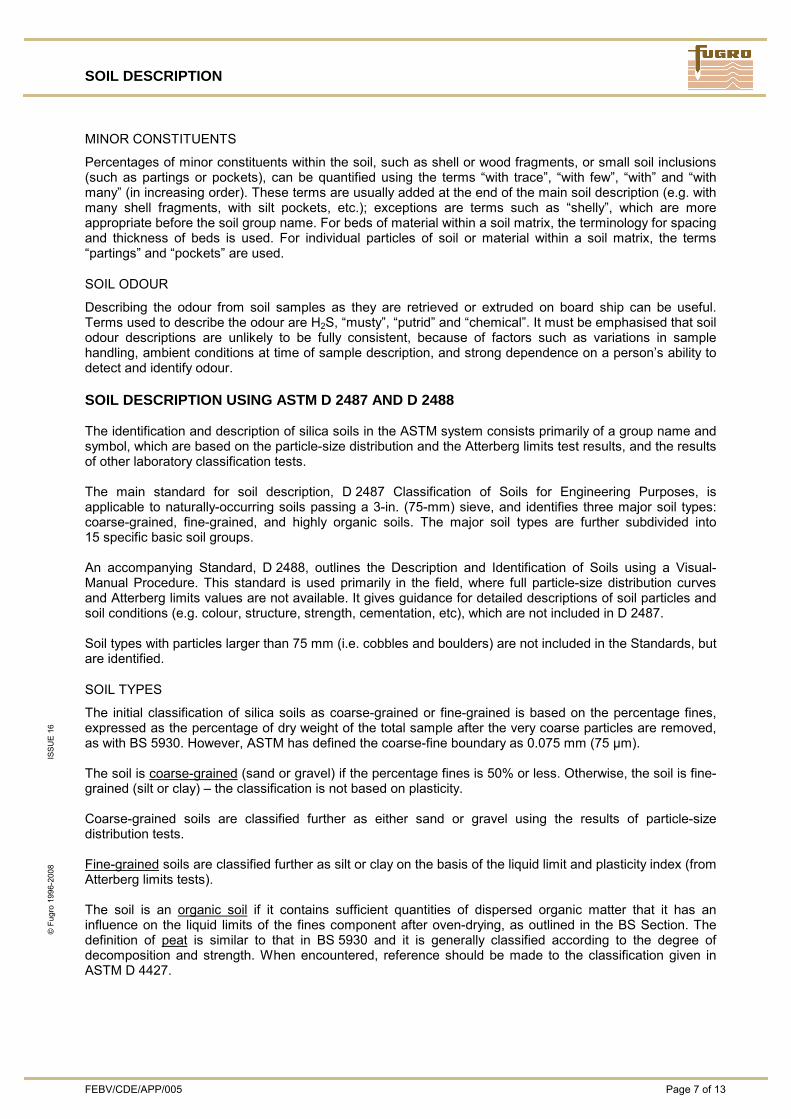
SOIL DESCRIPTION
FEBV/CDE/APP/005 Page 7 of 13
©
Fug
ro 1
996-
2008
ISSU
E 16
MINOR CONSTITUENTS
Percentages of minor constituents within the soil, such as shell or wood fragments, or small soil inclusions (such as partings or pockets), can be quantified using the terms “with trace”, “with few”, “with” and “with many” (in increasing order). These terms are usually added at the end of the main soil description (e.g. with many shell fragments, with silt pockets, etc.); exceptions are terms such as “shelly”, which are more appropriate before the soil group name. For beds of material within a soil matrix, the terminology for spacing and thickness of beds is used. For individual particles of soil or material within a soil matrix, the terms “partings” and “pockets” are used. SOIL ODOUR
Describing the odour from soil samples as they are retrieved or extruded on board ship can be useful. Terms used to describe the odour are H2S, “musty”, “putrid” and “chemical”. It must be emphasised that soil odour descriptions are unlikely to be fully consistent, because of factors such as variations in sample handling, ambient conditions at time of sample description, and strong dependence on a person’s ability to detect and identify odour. SOIL DESCRIPTION USING ASTM D 2487 AND D 2488 The identification and description of silica soils in the ASTM system consists primarily of a group name and symbol, which are based on the particle-size distribution and the Atterberg limits test results, and the results of other laboratory classification tests. The main standard for soil description, D 2487 Classification of Soils for Engineering Purposes, is applicable to naturally-occurring soils passing a 3-in. (75-mm) sieve, and identifies three major soil types: coarse-grained, fine-grained, and highly organic soils. The major soil types are further subdivided into 15 specific basic soil groups. An accompanying Standard, D 2488, outlines the Description and Identification of Soils using a Visual-Manual Procedure. This standard is used primarily in the field, where full particle-size distribution curves and Atterberg limits values are not available. It gives guidance for detailed descriptions of soil particles and soil conditions (e.g. colour, structure, strength, cementation, etc), which are not included in D 2487. Soil types with particles larger than 75 mm (i.e. cobbles and boulders) are not included in the Standards, but are identified. SOIL TYPES
The initial classification of silica soils as coarse-grained or fine-grained is based on the percentage fines, expressed as the percentage of dry weight of the total sample after the very coarse particles are removed, as with BS 5930. However, ASTM has defined the coarse-fine boundary as 0.075 mm (75 μm). The soil is coarse-grained (sand or gravel) if the percentage fines is 50% or less. Otherwise, the soil is fine-grained (silt or clay) – the classification is not based on plasticity. Coarse-grained soils are classified further as either sand or gravel using the results of particle-size distribution tests. Fine-grained soils are classified further as silt or clay on the basis of the liquid limit and plasticity index (from Atterberg limits tests). The soil is an organic soil if it contains sufficient quantities of dispersed organic matter that it has an influence on the liquid limits of the fines component after oven-drying, as outlined in the BS Section. The definition of peat is similar to that in BS 5930 and it is generally classified according to the degree of decomposition and strength. When encountered, reference should be made to the classification given in ASTM D 4427.
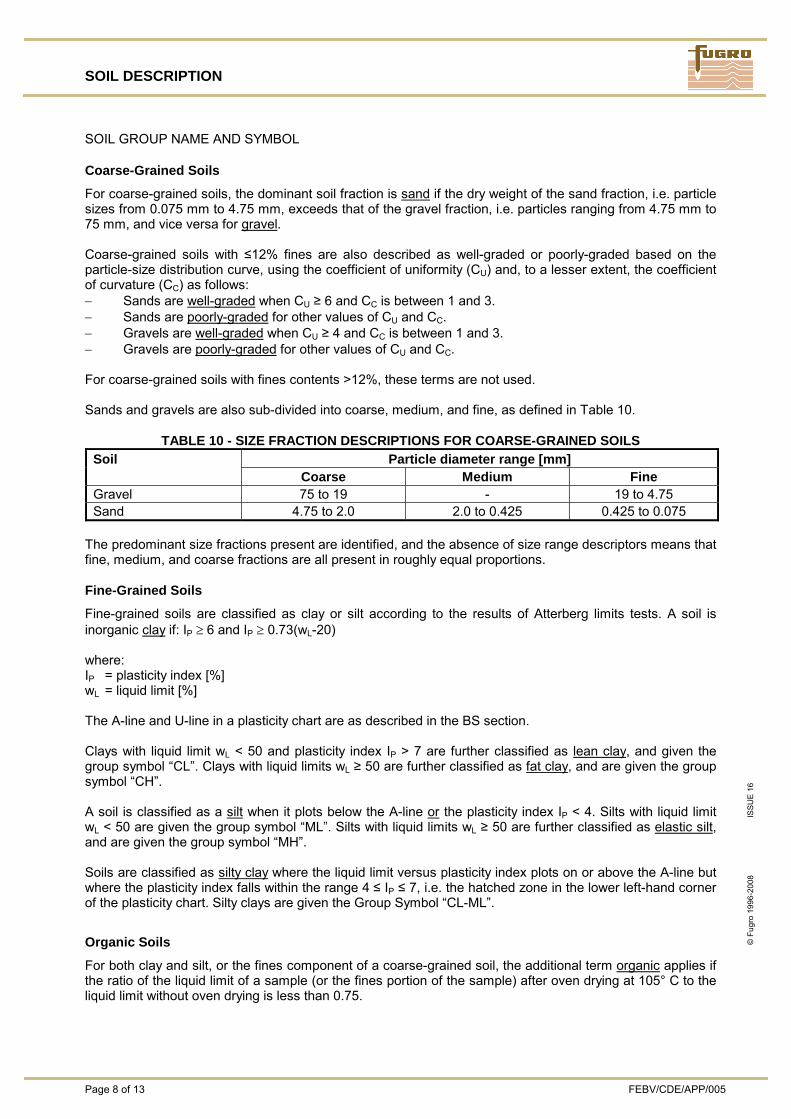
SOIL DESCRIPTION
Page 8 of 13 FEBV/CDE/APP/005
©
Fug
ro 1
996-
2008
ISSU
E 16
SOIL GROUP NAME AND SYMBOL Coarse-Grained Soils
For coarse-grained soils, the dominant soil fraction is sand if the dry weight of the sand fraction, i.e. particle sizes from 0.075 mm to 4.75 mm, exceeds that of the gravel fraction, i.e. particles ranging from 4.75 mm to 75 mm, and vice versa for gravel. Coarse-grained soils with ≤12% fines are also described as well-graded or poorly-graded based on the particle-size distribution curve, using the coefficient of uniformity (CU) and, to a lesser extent, the coefficient of curvature (CC) as follows: − Sands are well-graded when CU ≥ 6 and CC is between 1 and 3. − Sands are poorly-graded for other values of CU and CC. − Gravels are well-graded when CU ≥ 4 and CC is between 1 and 3. − Gravels are poorly-graded for other values of CU and CC. For coarse-grained soils with fines contents >12%, these terms are not used. Sands and gravels are also sub-divided into coarse, medium, and fine, as defined in Table 10.
TABLE 10 - SIZE FRACTION DESCRIPTIONS FOR COARSE-GRAINED SOILS Particle diameter range [mm] Soil
Coarse Medium Fine Gravel 75 to 19 - 19 to 4.75 Sand 4.75 to 2.0 2.0 to 0.425 0.425 to 0.075
The predominant size fractions present are identified, and the absence of size range descriptors means that fine, medium, and coarse fractions are all present in roughly equal proportions. Fine-Grained Soils
Fine-grained soils are classified as clay or silt according to the results of Atterberg limits tests. A soil is inorganic clay if: IP ≥ 6 and IP ≥ 0.73(wL-20) where: IP = plasticity index [%] wL = liquid limit [%] The A-line and U-line in a plasticity chart are as described in the BS section. Clays with liquid limit wL < 50 and plasticity index IP > 7 are further classified as lean clay, and given the group symbol “CL”. Clays with liquid limits wL ≥ 50 are further classified as fat clay, and are given the group symbol “CH”. A soil is classified as a silt when it plots below the A-line or the plasticity index IP < 4. Silts with liquid limit wL < 50 are given the group symbol “ML”. Silts with liquid limits wL ≥ 50 are further classified as elastic silt, and are given the group symbol “MH”. Soils are classified as silty clay where the liquid limit versus plasticity index plots on or above the A-line but where the plasticity index falls within the range 4 ≤ IP ≤ 7, i.e. the hatched zone in the lower left-hand corner of the plasticity chart. Silty clays are given the Group Symbol “CL-ML”.
Organic Soils
For both clay and silt, or the fines component of a coarse-grained soil, the additional term organic applies if the ratio of the liquid limit of a sample (or the fines portion of the sample) after oven drying at 105° C to the liquid limit without oven drying is less than 0.75.
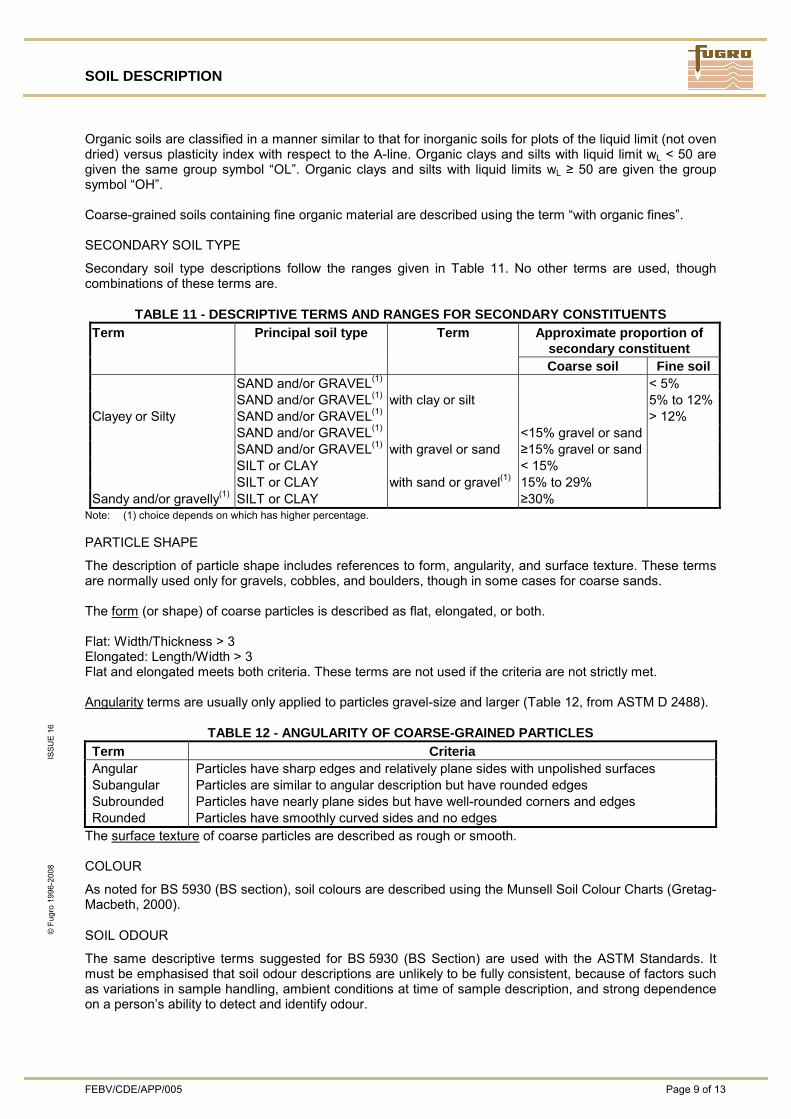
SOIL DESCRIPTION
FEBV/CDE/APP/005 Page 9 of 13
©
Fug
ro 1
996-
2008
ISSU
E 16
Organic soils are classified in a manner similar to that for inorganic soils for plots of the liquid limit (not oven dried) versus plasticity index with respect to the A-line. Organic clays and silts with liquid limit wL < 50 are given the same group symbol “OL”. Organic clays and silts with liquid limits wL ≥ 50 are given the group symbol “OH”. Coarse-grained soils containing fine organic material are described using the term “with organic fines”. SECONDARY SOIL TYPE
Secondary soil type descriptions follow the ranges given in Table 11. No other terms are used, though combinations of these terms are.
TABLE 11 - DESCRIPTIVE TERMS AND RANGES FOR SECONDARY CONSTITUENTS Approximate proportion of
secondary constituent Term Principal soil type Term
Coarse soil Fine soil SAND and/or GRAVEL(1) < 5% SAND and/or GRAVEL(1) with clay or silt 5% to 12%Clayey or Silty SAND and/or GRAVEL(1) > 12% SAND and/or GRAVEL(1) <15% gravel or sand SAND and/or GRAVEL(1) with gravel or sand ≥15% gravel or sand SILT or CLAY < 15% SILT or CLAY with sand or gravel(1) 15% to 29% Sandy and/or gravelly(1) SILT or CLAY ≥30%
Note: (1) choice depends on which has higher percentage. PARTICLE SHAPE
The description of particle shape includes references to form, angularity, and surface texture. These terms are normally used only for gravels, cobbles, and boulders, though in some cases for coarse sands. The form (or shape) of coarse particles is described as flat, elongated, or both. Flat: Width/Thickness > 3 Elongated: Length/Width > 3 Flat and elongated meets both criteria. These terms are not used if the criteria are not strictly met. Angularity terms are usually only applied to particles gravel-size and larger (Table 12, from ASTM D 2488).
TABLE 12 - ANGULARITY OF COARSE-GRAINED PARTICLES Term Criteria Angular Particles have sharp edges and relatively plane sides with unpolished surfaces Subangular Particles are similar to angular description but have rounded edges Subrounded Particles have nearly plane sides but have well-rounded corners and edges Rounded Particles have smoothly curved sides and no edges
The surface texture of coarse particles are described as rough or smooth. COLOUR
As noted for BS 5930 (BS section), soil colours are described using the Munsell Soil Colour Charts (Gretag-Macbeth, 2000). SOIL ODOUR
The same descriptive terms suggested for BS 5930 (BS Section) are used with the ASTM Standards. It must be emphasised that soil odour descriptions are unlikely to be fully consistent, because of factors such as variations in sample handling, ambient conditions at time of sample description, and strong dependence on a person’s ability to detect and identify odour.
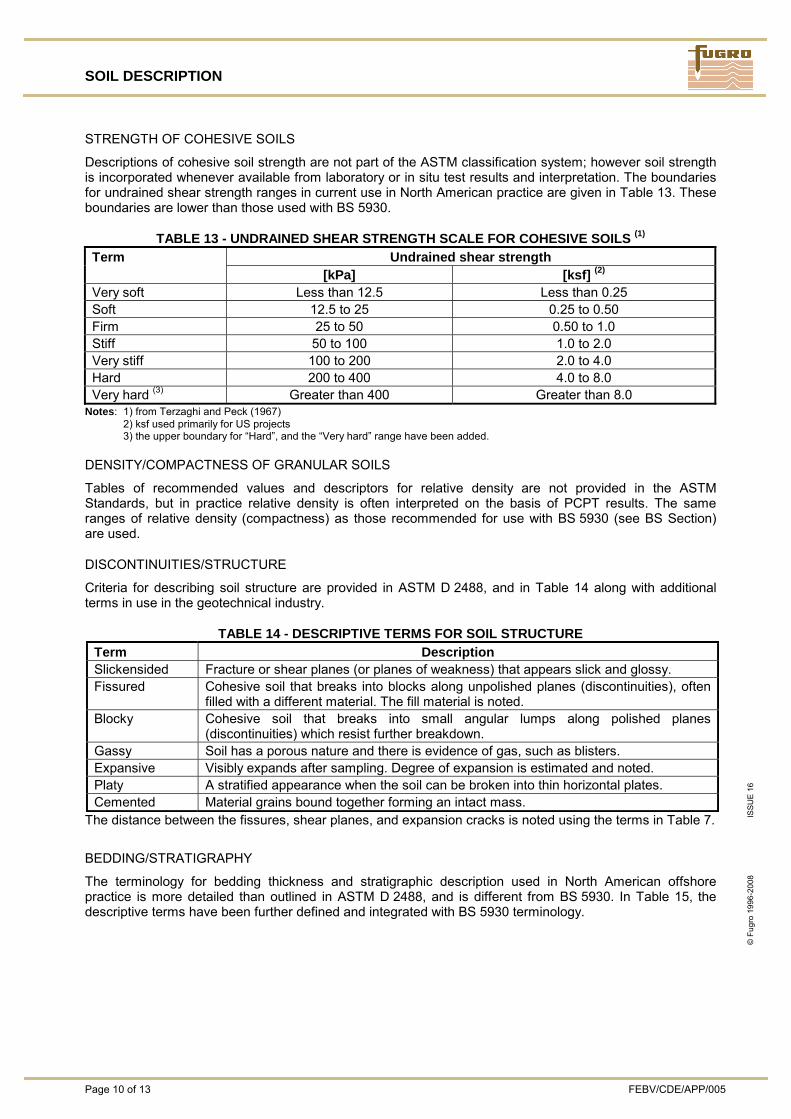
SOIL DESCRIPTION
Page 10 of 13 FEBV/CDE/APP/005
©
Fug
ro 1
996-
2008
ISSU
E 16
STRENGTH OF COHESIVE SOILS
Descriptions of cohesive soil strength are not part of the ASTM classification system; however soil strength is incorporated whenever available from laboratory or in situ test results and interpretation. The boundaries for undrained shear strength ranges in current use in North American practice are given in Table 13. These boundaries are lower than those used with BS 5930.
TABLE 13 - UNDRAINED SHEAR STRENGTH SCALE FOR COHESIVE SOILS (1) Term Undrained shear strength [kPa] [ksf] (2) Very soft Less than 12.5 Less than 0.25 Soft 12.5 to 25 0.25 to 0.50 Firm 25 to 50 0.50 to 1.0 Stiff 50 to 100 1.0 to 2.0 Very stiff 100 to 200 2.0 to 4.0 Hard 200 to 400 4.0 to 8.0 Very hard (3) Greater than 400 Greater than 8.0
Notes: 1) from Terzaghi and Peck (1967) 2) ksf used primarily for US projects 3) the upper boundary for “Hard”, and the “Very hard” range have been added. DENSITY/COMPACTNESS OF GRANULAR SOILS
Tables of recommended values and descriptors for relative density are not provided in the ASTM Standards, but in practice relative density is often interpreted on the basis of PCPT results. The same ranges of relative density (compactness) as those recommended for use with BS 5930 (see BS Section) are used. DISCONTINUITIES/STRUCTURE
Criteria for describing soil structure are provided in ASTM D 2488, and in Table 14 along with additional terms in use in the geotechnical industry.
TABLE 14 - DESCRIPTIVE TERMS FOR SOIL STRUCTURE Term Description Slickensided Fracture or shear planes (or planes of weakness) that appears slick and glossy. Fissured Cohesive soil that breaks into blocks along unpolished planes (discontinuities), often
filled with a different material. The fill material is noted. Blocky Cohesive soil that breaks into small angular lumps along polished planes
(discontinuities) which resist further breakdown. Gassy Soil has a porous nature and there is evidence of gas, such as blisters. Expansive Visibly expands after sampling. Degree of expansion is estimated and noted. Platy A stratified appearance when the soil can be broken into thin horizontal plates. Cemented Material grains bound together forming an intact mass.
The distance between the fissures, shear planes, and expansion cracks is noted using the terms in Table 7.
BEDDING/STRATIGRAPHY
The terminology for bedding thickness and stratigraphic description used in North American offshore practice is more detailed than outlined in ASTM D 2488, and is different from BS 5930. In Table 15, the descriptive terms have been further defined and integrated with BS 5930 terminology.
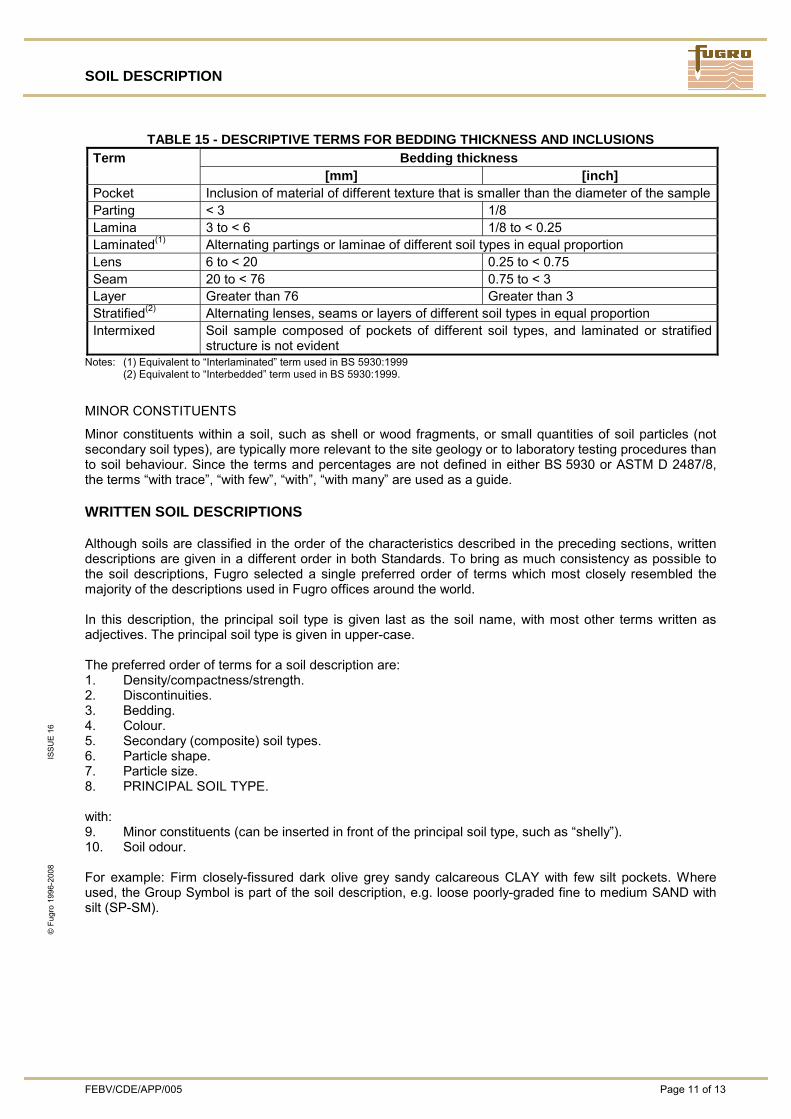
SOIL DESCRIPTION
FEBV/CDE/APP/005 Page 11 of 13
©
Fug
ro 1
996-
2008
ISSU
E 16
TABLE 15 - DESCRIPTIVE TERMS FOR BEDDING THICKNESS AND INCLUSIONS Bedding thickness Term
[mm] [inch] Pocket Inclusion of material of different texture that is smaller than the diameter of the sampleParting < 3 1/8 Lamina 3 to < 6 1/8 to < 0.25 Laminated(1) Alternating partings or laminae of different soil types in equal proportion Lens 6 to < 20 0.25 to < 0.75 Seam 20 to < 76 0.75 to < 3 Layer Greater than 76 Greater than 3 Stratified(2) Alternating lenses, seams or layers of different soil types in equal proportion Intermixed Soil sample composed of pockets of different soil types, and laminated or stratified
structure is not evident Notes: (1) Equivalent to “Interlaminated” term used in BS 5930:1999 (2) Equivalent to “Interbedded” term used in BS 5930:1999.
MINOR CONSTITUENTS
Minor constituents within a soil, such as shell or wood fragments, or small quantities of soil particles (not secondary soil types), are typically more relevant to the site geology or to laboratory testing procedures than to soil behaviour. Since the terms and percentages are not defined in either BS 5930 or ASTM D 2487/8, the terms “with trace”, “with few”, “with”, “with many” are used as a guide. WRITTEN SOIL DESCRIPTIONS
Although soils are classified in the order of the characteristics described in the preceding sections, written descriptions are given in a different order in both Standards. To bring as much consistency as possible to the soil descriptions, Fugro selected a single preferred order of terms which most closely resembled the majority of the descriptions used in Fugro offices around the world. In this description, the principal soil type is given last as the soil name, with most other terms written as adjectives. The principal soil type is given in upper-case. The preferred order of terms for a soil description are: 1. Density/compactness/strength. 2. Discontinuities. 3. Bedding. 4. Colour. 5. Secondary (composite) soil types. 6. Particle shape. 7. Particle size. 8. PRINCIPAL SOIL TYPE. with: 9. Minor constituents (can be inserted in front of the principal soil type, such as “shelly”). 10. Soil odour. For example: Firm closely-fissured dark olive grey sandy calcareous CLAY with few silt pockets. Where used, the Group Symbol is part of the soil description, e.g. loose poorly-graded fine to medium SAND with silt (SP-SM).
SOIL DESCRIPTION
Page 12 of 13 FEBV/CDE/APP/005
©
Fug
ro 1
996-
2008
ISSU
E 16
PARTICULATE DEPOSITS
The geological origin of a single particle type allows the following descriptions (optional):
Clastic: sediment transported and deposited as grains of inorganic origin. Typical clastic particles are: − quartz grains: clear or milky white and ranging from very angular to very rounded; commonly a
frosted surface for wind-blown grains − feldspar grains: varying in colour from milky white to light yellowish brown − mica flakes: varying in colour from gold-coloured to dark brown − dark mineral grains: usually of igneous or metamorphic origin with undetermined mineralogy − silicate grains: undetermined mineralogy − rock fragments: including fragments of carbonate rock − debris: deposit of rock fragments of a variety of particle sizes which may include sand and finer
fractions; typical examples are rock debris and coral debris
Organic: remains of plants and animals that consists mainly of carbon compounds Bioclastic: sediment transported and deposited as grains of organic origin. Examples of bioclastic particles are: − Calcareous algae: crustal or nodular growths or erect and branching forms produced by lime-
secreting algae; microstructures include layered, rectangular structures and internal fine tube-like structures.
− Foraminifera: hard sediment test (external skeleton) consisting of calcite or aragonite and produced by unicellular organisms; commonly less than 1 mm in diameter, multi-chambered and intact.
− Sponge spicules: spicules of siliceous sponges in a variety of rayed shapes; dimensions ranging from less than 1 mm to over 1 cm in length but usually less than 1 mm in width.
− Corals: commonly consisting of small fibres set perpendicular to the walls and septal surfaces; mainly aragonite composition for relatively recent forms; conversion of aragonite to calcite for earlier corals, usually with consequent loss of original structural details.
− Echinoids: hard part of echinoids consisting of a plate or skeletal element forming a single crystal of calcite; five-rayed internal symmetry for spines of echinoids; typical widths ranging from several mm to a few cm.
− Bryozoans: chambered cell-like structures that are considerably coarser than those of calcareous algae; either aragonite or calcite composition; possible cell in-fill consisting of clear calcite and/or micrite.
− Bivalves and Gastropods: Mollusk shells, chiefly of aragonite composition; inner layer of aragonite protected by an outer layer of calcite for some bivalve shells and gastropods.
Oolitic: sediment consisting of solid, round or oval, highly polished and smooth coated grains which may or may not have a nucleus. The coating consists of chemically precipitated aragonite, possibly converted to calcite. Ooliths have concentric structures and may also have radial structures. The grains are generally less than 2 mm diameter. Pelletal: sediment consisting of well rounded grains of ellipsoidal shape and no specific internal structure. The composition is clay to silt-sized carbonate material, which is probably the excretion product of sediment eating organisms. Pellets may have an oolitic crust. The grains are generally less than 2 mm diameter. STRUCTURE OF NON PARTICULATE DEPOSITS
Reef: soil or rock formed by in-situ accumulation or build-up of carbonate material by colonial organisms such as polyps (coral), algae (algal mats or balls) and sponges. Orthochemical: orthochemical components precipitated during or after deposition. These components can include: (1) pyrite spherulites and grains, (2) crystal euhedra of anhydride or gypsum, (3) replacement patches and nodular masses of anhydrite and gypsum. Single grains are rare.
SOIL DESCRIPTION
FEBV/CDE/APP/005 Page 13 of 13
©
Fug
ro 1
996-
2008
ISSU
E 16
GEOLOGICAL INFORMATION
Specific geological terms can assist the geotechnical soil description by providing information on stratigraphy, origin (genesis) or regional significance (optional). Examples are: − time stratigraphy, such as Eemian and Pleistocene, − lithostratigraphy, such as Yarmouth Roads Formation − depositional environment, such as Marine, Glacio-lacustrine and Residual Soil − regional significance, such as Chalk and Mud. REFERENCES ASTM International (2006), “Standard Practice for Classification of Soils for Engineering Purposes (Unified Soil Classification System)", ASTM D 2487-06. ASTM International (2006), “Standard Practice for Description and Identification of Soils (Visual-Manual Procedure)", ASTM D 2488-06. ASTM International (2002), “Standard Classification of Peat Samples by Laboratory Testing”, ASTM D4427-02. BSI British Standards Institution (1999), "Code of Practice for Site Investigations", British Standard BS 5930:1999. Casagrande, A. (1948), “Classification and Identification of Soils”, Proceedings of the American Society of Civil Engineers, Vol. 73, No. 6, pp. 783-810. Clark, A.R. and Walker, B.F. (1977), "A Proposed Scheme for the Classification and Nomenclature for use in the Engineering Description of Middle Eastern Sedimentary Rocks", Géotechnique, Vol. 27, No. 1, pp. 94-99. Gretag-Macbeth (2000), “Munsell Soil Color Charts”, Year 2000 revised washable ed., Gretag-Macbeth, New Windsor. ISO International Organization for Standardization (2002), "Geotechnical Investigation and Testing - Identification and Classification of Soil - Part 1: Identification and Description", International Standard ISO 14688-1:2002. Karim, U.F. and De Ruijter, M.R. (1993), "A Measurable Classification System for Non-calcareous Marine Soils", in Ardus, D.A. et al. (Eds.), Offshore Site Investigation and Foundation Behaviour: Papers Presented at a Conference organized by the Society for Underwater Technology and held in London, September 22-24, 1992, Advances in Underwater Technology, Ocean Science and Offshore Engineering, Vol. 28, Kluwer Academic Publishers, Dordrecht, pp. 57-76. Kolk, H.J. (2000), “Deep Foundations in Calcareous Sediments”, in Al-Shafei, K.A. (Ed.), Engineering for Calcareous Sediments: Proceedings of the Second International Conference on Engineering for Calcareous Sediments, Bahrain, 21-24 February 1999, Vol. 2, A.A. Balkema, Rotterdam, pp. 313-344. Landva, J., Remijn, M. and Peuchen, J. (2007), "Note on Geotechnical Soil Description", in Offshore Site Investigation and Geotechnics: Confronting New Challenges and Sharing Knowledge: Proceedings of the 6th International Conference, 11–13 September 2007, London, UK, Society for Underwater Technology, London, pp. 505-514.
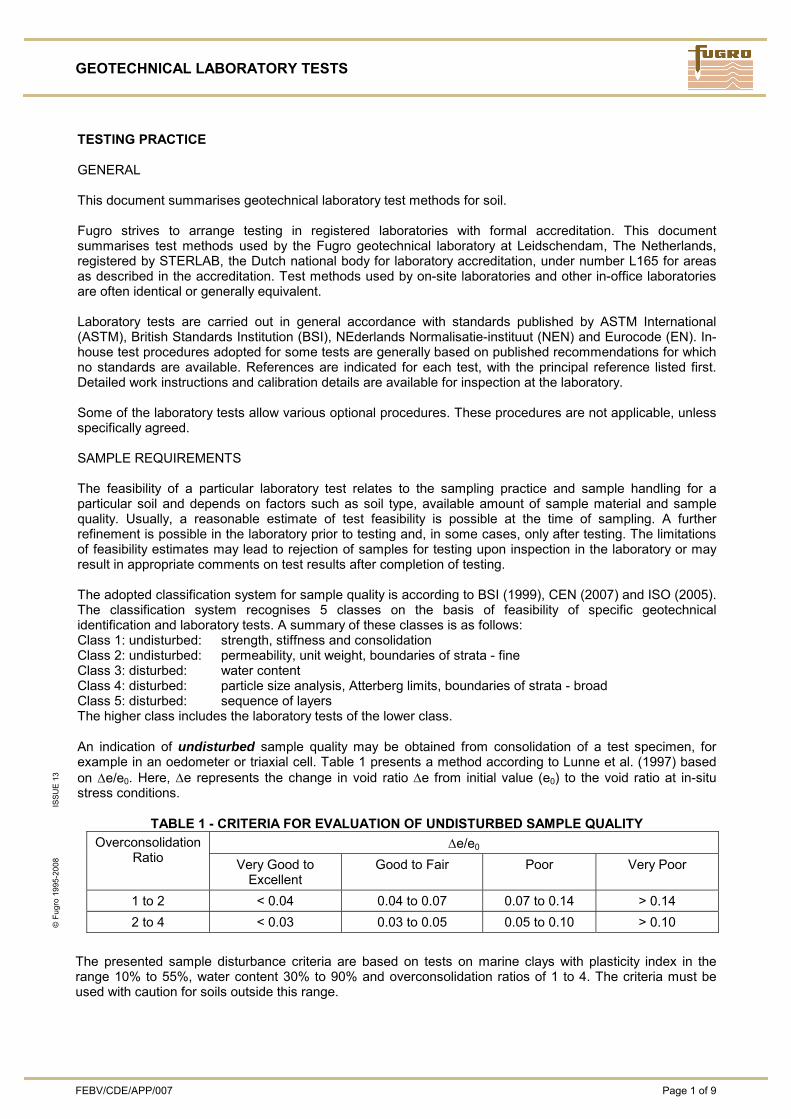
GEOTECHNICAL LABORATORY TESTS
FEBV/CDE/APP/007 Page 1 of 9
© F
ugro
199
5-20
08
ISSU
E 13
TESTING PRACTICE GENERAL This document summarises geotechnical laboratory test methods for soil. Fugro strives to arrange testing in registered laboratories with formal accreditation. This document summarises test methods used by the Fugro geotechnical laboratory at Leidschendam, The Netherlands, registered by STERLAB, the Dutch national body for laboratory accreditation, under number L165 for areas as described in the accreditation. Test methods used by on-site laboratories and other in-office laboratories are often identical or generally equivalent. Laboratory tests are carried out in general accordance with standards published by ASTM International (ASTM), British Standards Institution (BSI), NEderlands Normalisatie-instituut (NEN) and Eurocode (EN). In-house test procedures adopted for some tests are generally based on published recommendations for which no standards are available. References are indicated for each test, with the principal reference listed first. Detailed work instructions and calibration details are available for inspection at the laboratory. Some of the laboratory tests allow various optional procedures. These procedures are not applicable, unless specifically agreed. SAMPLE REQUIREMENTS The feasibility of a particular laboratory test relates to the sampling practice and sample handling for a particular soil and depends on factors such as soil type, available amount of sample material and sample quality. Usually, a reasonable estimate of test feasibility is possible at the time of sampling. A further refinement is possible in the laboratory prior to testing and, in some cases, only after testing. The limitations of feasibility estimates may lead to rejection of samples for testing upon inspection in the laboratory or may result in appropriate comments on test results after completion of testing. The adopted classification system for sample quality is according to BSI (1999), CEN (2007) and ISO (2005). The classification system recognises 5 classes on the basis of feasibility of specific geotechnical identification and laboratory tests. A summary of these classes is as follows: Class 1: undisturbed: strength, stiffness and consolidation Class 2: undisturbed: permeability, unit weight, boundaries of strata - fine Class 3: disturbed: water content Class 4: disturbed: particle size analysis, Atterberg limits, boundaries of strata - broad Class 5: disturbed: sequence of layers The higher class includes the laboratory tests of the lower class. An indication of undisturbed sample quality may be obtained from consolidation of a test specimen, for example in an oedometer or triaxial cell. Table 1 presents a method according to Lunne et al. (1997) based on Δe/e0. Here, Δe represents the change in void ratio Δe from initial value (e0) to the void ratio at in-situ stress conditions.
TABLE 1 - CRITERIA FOR EVALUATION OF UNDISTURBED SAMPLE QUALITY
Δe/e0 Overconsolidation Ratio Very Good to
Excellent Good to Fair Poor Very Poor
1 to 2 < 0.04 0.04 to 0.07 0.07 to 0.14 > 0.14 2 to 4 < 0.03 0.03 to 0.05 0.05 to 0.10 > 0.10
The presented sample disturbance criteria are based on tests on marine clays with plasticity index in the range 10% to 55%, water content 30% to 90% and overconsolidation ratios of 1 to 4. The criteria must be used with caution for soils outside this range.
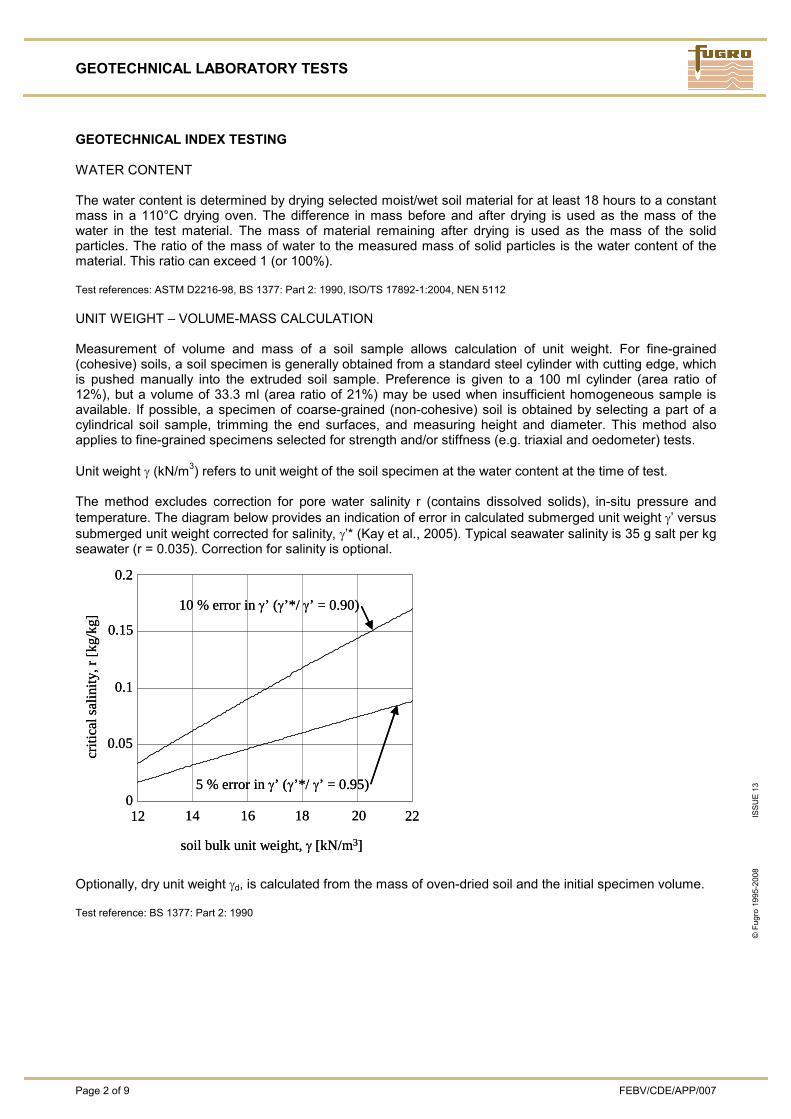
GEOTECHNICAL LABORATORY TESTS
Page 2 of 9 FEBV/CDE/APP/007
© F
ugro
199
5-20
08
ISSU
E 13
GEOTECHNICAL INDEX TESTING WATER CONTENT The water content is determined by drying selected moist/wet soil material for at least 18 hours to a constant mass in a 110°C drying oven. The difference in mass before and after drying is used as the mass of the water in the test material. The mass of material remaining after drying is used as the mass of the solid particles. The ratio of the mass of water to the measured mass of solid particles is the water content of the material. This ratio can exceed 1 (or 100%). Test references: ASTM D2216-98, BS 1377: Part 2: 1990, ISO/TS 17892-1:2004, NEN 5112 UNIT WEIGHT – VOLUME-MASS CALCULATION Measurement of volume and mass of a soil sample allows calculation of unit weight. For fine-grained (cohesive) soils, a soil specimen is generally obtained from a standard steel cylinder with cutting edge, which is pushed manually into the extruded soil sample. Preference is given to a 100 ml cylinder (area ratio of 12%), but a volume of 33.3 ml (area ratio of 21%) may be used when insufficient homogeneous sample is available. If possible, a specimen of coarse-grained (non-cohesive) soil is obtained by selecting a part of a cylindrical soil sample, trimming the end surfaces, and measuring height and diameter. This method also applies to fine-grained specimens selected for strength and/or stiffness (e.g. triaxial and oedometer) tests. Unit weight γ (kN/m3) refers to unit weight of the soil specimen at the water content at the time of test. The method excludes correction for pore water salinity r (contains dissolved solids), in-situ pressure and temperature. The diagram below provides an indication of error in calculated submerged unit weight γ’ versus submerged unit weight corrected for salinity, γ’* (Kay et al., 2005). Typical seawater salinity is 35 g salt per kg seawater (r = 0.035). Correction for salinity is optional.
Optionally, dry unit weight γd, is calculated from the mass of oven-dried soil and the initial specimen volume. Test reference: BS 1377: Part 2: 1990
0
0.05
0.1
0.15
10 % error in γ’ (γ’*/ γ’ = 0.90)
5 % error in γ’ (γ’*/ γ’ = 0.95)
criti
cal s
alin
ity, r
[kg/
kg]
0.2
18161412 20
soil bulk unit weight, γ [kN/m3]
220
0.05
0.1
0.15
10 % error in γ’ (γ’*/ γ’ = 0.90)
5 % error in γ’ (γ’*/ γ’ = 0.95)
criti
cal s
alin
ity, r
[kg/
kg]
0.2
18161412 20
soil bulk unit weight, γ [kN/m3]
22
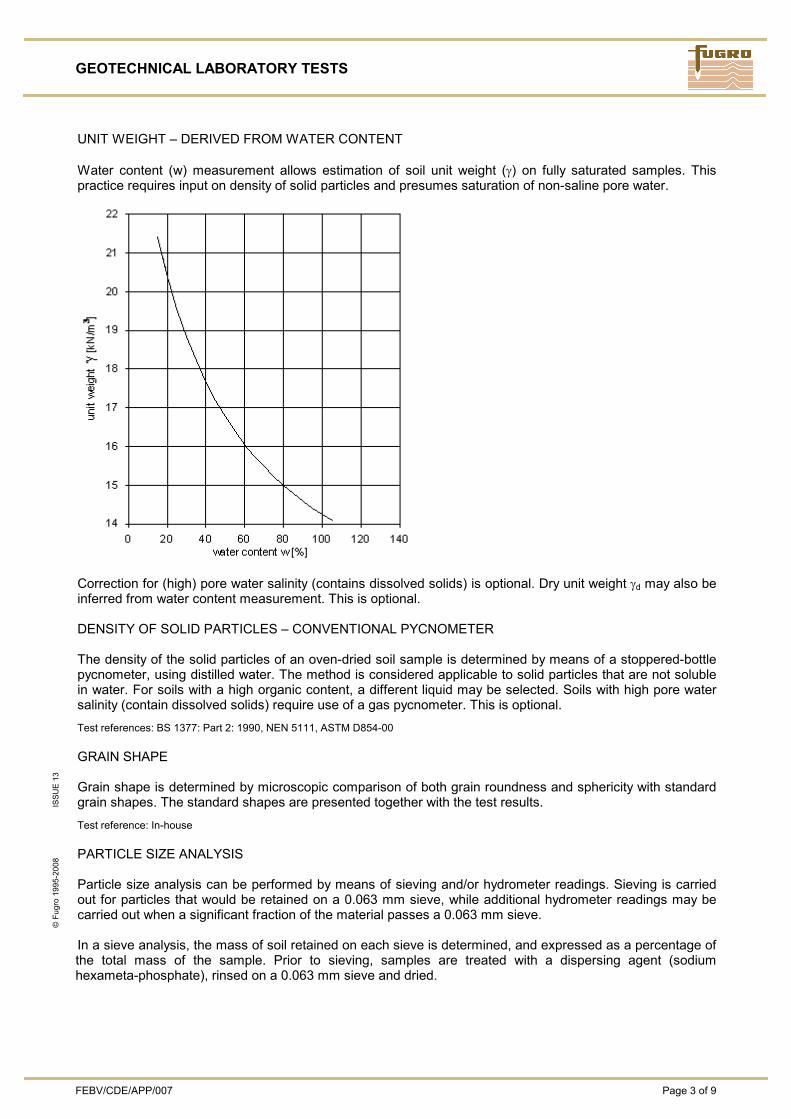
GEOTECHNICAL LABORATORY TESTS
FEBV/CDE/APP/007 Page 3 of 9
© F
ugro
199
5-20
08
ISSU
E 13
UNIT WEIGHT – DERIVED FROM WATER CONTENT Water content (w) measurement allows estimation of soil unit weight (γ) on fully saturated samples. This practice requires input on density of solid particles and presumes saturation of non-saline pore water.
Correction for (high) pore water salinity (contains dissolved solids) is optional. Dry unit weight γd may also be inferred from water content measurement. This is optional. DENSITY OF SOLID PARTICLES – CONVENTIONAL PYCNOMETER The density of the solid particles of an oven-dried soil sample is determined by means of a stoppered-bottle pycnometer, using distilled water. The method is considered applicable to solid particles that are not soluble in water. For soils with a high organic content, a different liquid may be selected. Soils with high pore water salinity (contain dissolved solids) require use of a gas pycnometer. This is optional. Test references: BS 1377: Part 2: 1990, NEN 5111, ASTM D854-00 GRAIN SHAPE Grain shape is determined by microscopic comparison of both grain roundness and sphericity with standard grain shapes. The standard shapes are presented together with the test results. Test reference: In-house PARTICLE SIZE ANALYSIS Particle size analysis can be performed by means of sieving and/or hydrometer readings. Sieving is carried out for particles that would be retained on a 0.063 mm sieve, while additional hydrometer readings may be carried out when a significant fraction of the material passes a 0.063 mm sieve. In a sieve analysis, the mass of soil retained on each sieve is determined, and expressed as a percentage of the total mass of the sample. Prior to sieving, samples are treated with a dispersing agent (sodium hexameta-phosphate), rinsed on a 0.063 mm sieve and dried.
GEOTECHNICAL LABORATORY TESTS
Page 4 of 9 FEBV/CDE/APP/007
© F
ugro
199
5-20
08
ISSU
E 13
The hydrometer method allows measurement of the density of a suspension consisting of fine-grained soil particles and distilled water, to which a dispersion agent is added. This suspension is mixed using a high speed stirrer. Testing is performed in a thermostatically controlled water bath (25° ± 0.5°). The particle size is calculated according to Stokes' Law for a single sphere, on the basis that particles of a particular diameter were at the surface of the suspension at the beginning of sedimentation and had settled to the level at which the hydrometer is measuring the density of the suspension. These calculations require a value for the density of solid particles. Generally, a value of 2.65 t/m3 is assumed. When other values are used, this is included in the laboratory report. The hydrometer results for selected particle sizes are presented as a percentage of the total mass of the soil sample. Particle size is presented on a logarithmic scale so that two soils having the same degree of uniformity are represented by curves of the same shape regardless of their positions on the particle size distribution plot. The general slope of the distribution curve may be described by the coefficient of uniformity Cu, where Cu = D60/D10, and the coefficient of curvature Cc, where Cc= (D30)2/D10×D60. D60, D30, and D10 are effective particle sizes indicating that 60%, 30%, and 10% respectively of the particles (by weight) are smaller than the given effective size. Combined presentation of results from hydrometer readings and sieving normally requires data harmonising in the area of overlap, i.e. near the 0.06 mm particle size. Test references: BS 1377: Part 2: 1990, Draft NEN 5114, ASTM D422-63 PERCENTAGE FINES The Percentage Fines test identifies the proportions of fine grained (< 0.06 mm) and coarse-grained (> 0.06 mm) particle sizes of a soil sample by wet sieving through a 0.063 mm sieve. Prior to sieving, the sample is treated with a dispersing agent. The Percentage Fines is defined as the ratio of dry mass of soil passing the 0.063 mm sieve to the dry mass of the total soil sample, expressed as a percentage.
Test references: BS 1377: Part 2: 1990, Draft NEN 5114, ASTM D422-63 ATTERBERG LIMITS Atterberg limits are determined on soil specimens with a particle size of less than 0.425 mm. If necessary, coarser material is removed by dry sieving. The Atterberg limits refer to arbitrarily defined boundaries between the liquid and plastic states (Liquid Limit, wL), and between the plastic and brittle states (Plastic Limit, wP) of fine grained soils. They are expressed as water content, in percent. The liquid limit is defined as the water content at which a pat of soil placed in a standard cup and cut by a groove of standard dimensions will flow together at the base of the groove, when the cup is subjected to 25 standard shocks. The one-point liquid limit test is usually carried out. Distilled water may be added during soil mixing to achieve the required consistency. The plastic limit is defined as the water content at which a soil can no longer be deformed by rolling into 3 mm diameter threads without crumbling. The range of water contents over which a soil behaves plastically is the Plasticity Index, IP. This is the difference between the liquid limit and the plastic limit (wL-wP). Test references: BS 1377: Part 2: 1990, ASTM D4318-00 MINIMUM INDEX UNIT WEIGHT The minimum index unit weight (γdmin) of cohesionless soil is determined from the mass of oven-dry material that is deposited by slowly withdrawing a soil-filled funnel from a standard mould of either 70 ml or 550 ml volume. Test reference: In-house
GEOTECHNICAL LABORATORY TESTS
FEBV/CDE/APP/007 Page 5 of 9
© F
ugro
199
5-20
08
ISSU
E 13
MAXIMUM INDEX UNIT WEIGHT - IMPACT COMPACTION The maximum index unit weight (γdmax) of cohesionless soil is determined from the mass of oven-dry, compacted soil in a standard mould. The soil is compacted in 5 layers, with each layer being subjected to respectively 5, 10, 20, 40 and 80 blows from a standard, hand-held hammer. Equipment dimensions are as follows. Preference is given to the large mould, but application depends on size of sample.
70 ml mould 554 ml mould Hammer mass [g] 185 750 Drop height [mm] 300 390 Cross-sectional area [mm2] 1000 38,500
Reference: In-house GEO-CHEMICAL TESTING ORGANIC MATTER CONTENT For geotechnical purposes, the organic matter content is assumed to be equal to the loss of mass of soil on ignition. An oven-dried (105°C) soil sample is heated to 550°C during 2 hours. The mass is determined before and after heating. The organic matter content is defined as the ratio of the mass loss due to heating to the original mass of the dried soil sample, and is expressed as a percentage. Test references: NEN 5754, ASTM D2974-00, BS 1377: Part 3: 1990 CARBONATE CONTENT – GAS VOLUME The carbonate content is determined by drying selected soil material to a constant mass in a 110°C drying oven, and measuring the volume of dissipated carbon dioxide (CO2) upon reaction of the soil with hydrochloric acid (HCl). The carbonate content is calculated from calibration values, and expressed as a percentage of dry mass of the original soil. Test reference: NEN 5757 CARBONATE CONTENT - GAS PRESSURE The carbonate content is determined by using a dried or a natural soil specimen and measuring the pressure of dissipated carbon dioxide (CO2) upon reaction of the soil with hydrochloric acid (HCl). The carbonate content is calculated from the mass of the specimen and the pressure increase after reaction by comparison with calibration values. For a natural soil, a correction factor is applied to correct for water content. Carbonate content is expressed as a percentage of dry mass of the original soil.
Test reference: ASTM D4373-96 COMPRESSIBILITY TESTING OEDOMETER - INCREMENTAL LOADING The oedometer test covers determination of the rate and magnitude of consolidation of a laterally restrained soil specimen, which is axially loaded in increments of constant stress until the excess pore water pressures have dissipated for each increment. Normally, each load increment is maintained for 24 hours. The test is generally carried out on undisturbed cohesive specimens using a consolidometer (oedometer) apparatus, which is placed in a thermostatically controlled room (10°C). Selection of mounting method depends on soil characteristics. Soils that show a tendency to swell, such as peat or overconsolidated clays,
GEOTECHNICAL LABORATORY TESTS
Page 6 of 9 FEBV/CDE/APP/007
© F
ugro
199
5-20
08
ISSU
E 13
are mounted dry. Moist sponges are placed in the oedometer cell to retain sample moisture conditions. Other samples are usually mounted using the wet mounting method. Distilled water is added to the cell when loads are applied to the loading arm. When required, the initial load is increased to prevent swell. Key parameters that can be obtained from this test are the preconsolidation pressure σ'p and the coefficient of consolidation cv. The preconsolidation pressure is estimated using the graphical Casagrande construction. The root time method or the log time method is used for determination of cv. Other parameters that may be derived from this test are the compression index Cc, the coefficient of volume compressibility mv and the vertical permeability kv. Test references: ASTM D2435-96, NEN 5118, BS 1377: Part 5: 1990 OEDOMETER - CONSTANT RATE OF STRAIN The Constant Rate of Strain (CRS) oedometer test covers determination of the rate and magnitude of consolidation of a laterally restrained soil specimen when it is drained axially and subjected to controlled deformation loading. The rate of deformation is selected so that excess pore water pressures are between 3% and 20% of the applied axial stress. Drainage of pore water is permitted from the top of the specimen and pore water pressures are measured at the bottom of the specimen. The test is generally carried out on undisturbed cohesive specimens using a consolidometer, in a thermostatically controlled room (20°C). Key parameters that can be obtained from this test are the preconsolidation pressure σ'p and the coefficient of consolidation cv as a function of axial stress. The preconsolidation pressure is estimated using the graphical Casagrande procedure, while the coefficient of consolidation is determined analytically from the measurements of axial stress, strain and excess pore water pressure. Other parameters that may be derived from this test are the compression index Cc, the coefficient of volume compressibility mv and the coefficient of vertical permeability kv. Test reference: ASTM D4186-98 STRENGTH INDEX TESTING TORVANE AND POCKET PENETROMETER The torvane and pocket penetrometer are small hand-held instruments for rapid strength index testing of fine grained (cohesive) soils. The torvane test is carried out by pressing a standard vane into the soil and measuring the minimum torque required to rotate the vane. The vane size can be selected to suit the expected torque up to an equivalent undrained shear strength of the soil of 250 kPa. The undrained shear strength is correlated to the measured torque by vane size and torvane spring constant. The pocket penetrometer test consists of pressing a small solid cylinder into the soil, to a specified penetration. The maximum force required for penetration is correlated to the undrained shear strength. The size of the cylinder can be selected so that undrained shear strength readings of up to 900 kPa can be taken. Test reference: CEN, EN 1997-2:2007 LABORATORY MINIATURE VANE The laboratory miniature vane test allows determination of undisturbed or remoulded specimens of cohesive soil. CEN (2007) classifies the laboratory miniature vane as strength index test. The selected specimen is tested in the sample tube in which it was taken or in a mould after extrusion from the sample tube. The sample tube or mould is mounted in the test apparatus and a rectangular vane is lowered into the soil. The vane is then rotated at 10°/min (BS 1377) or at 60°/min to 90°/min (ASTM D4648) and the maximum torsional moment is recorded. A continuous record of rotation versus torsional moment can also be made if required (optional). Various vane sizes can be selected depending on the consistency of the specimen. Calculation of undrained shear strength is based on a cylindrical failure surface for which uniform stress distributions are assumed. The equation for undrained shear strength is as follows:
GEOTECHNICAL LABORATORY TESTS
FEBV/CDE/APP/007 Page 7 of 9
© F
ugro
199
5-20
08
ISSU
E 13
⎟⎠
⎞⎜⎝
⎛ +π=
D61H
21D
Tc
2
maxU
where: cu = peak undrained shear strength [kPa] Tmax = maximum torsional moment [kNm] D = vane diameter [m] H = vane height [m]
Test references: BS 1377: Part 7: 1990, ASTM D4648-00 STRENGTH TESTING UNCONSOLIDATED UNDRAINED TRIAXIAL (UU) This type of test is usually performed on undisturbed samples of cohesive soils. CEN (2007) classifies the UU test as strength index test. Depending on the consistency of the cohesive material, the test specimen is prepared by trimming the sample or by pushing a mould into the sample. A latex membrane with a thickness of approximately 0.2 mm is placed around the specimen. A lateral confining pressure of 600 kPa to 1000 kPa is maintained during axial compression loading of the specimen. Consolidation and drainage of pore water during testing is not allowed. The test is deformation controlled (strain rate of 60%/h), single stage, and stopped when an axial strain of 15% is achieved. The deviator stress is calculated from the measured load assuming that the specimen deforms as a right cylinder. The presentation of test results includes a plot of deviator stress versus axial strain. The undrained shear strength, cu, is taken as half the maximum deviator stress. When a maximum stress has not been reached at strains of less than 15%, the stress at 15% strain is used to calculate undrained shear strength. To determine sensitivity, the test may be repeated on remoulded specimens. When possible, the tested undisturbed specimen is kneaded in the membrane, and then reshaped in a mould prior to testing. Stiff to hard specimens are cut into pieces, and reconstituted by tamping the pieces in layers into a mould, until the original specimen dimensions are obtained. The sensitivity is the ratio of shear strength of undisturbed soil to shear strength of remoulded soil, cu/cu;r.
Test references: NEN 5117, ASTM D2850-95, BS 1377: Part 7: 1990 (Clause 8) CONSOLIDATED UNDRAINED TRIAXIAL (CIU AND CAU) The consolidated undrained triaxial test offers the opportunity to derive both undrained and drained strength parameters for undisturbed or remoulded specimens. Specimens are generally prepared by trimming cohesive samples to the required dimensions. The wet mounting method is used, which includes use of wet porous disks and a water-filled drainage system. Test procedures include specimen saturation, consolidation and compression loading. For cohesive soils, filter paper strips are attached to the specimen circumference to promote drainage during consolidation. Saturation is obtained by incrementing cell pressure and back pressure. The degree of saturation is checked by the pore water pressure response to small variations in cell pressure. In case of isotropic consolidation (CIU) the specimen is usually consolidated to a stress level equivalent to the mean in-situ stress estimated for the appropriate sample depth. For anisotropic consolidation (CAU), the specimen is consolidated to the estimated vertical and horizontal effective stresses. Various consolidation stages may be adopted to simulate the consolidation history and the effects of the expected loading sequence. Specimen shearing is carried out under conditions of constant axial strain rate, while monitoring axial load and pore water pressure. A strain rate of 4%/h is generally applied, except when consolidation was slow, in which case a smaller strain rate is applied. The deviator stress is calculated from the measured load assuming the specimen deforms as a right cylinder. The shearing stage is terminated on the basis of
GEOTECHNICAL LABORATORY TESTS
Page 8 of 9 FEBV/CDE/APP/007
© F
ugro
199
5-20
08
ISSU
E 13
effective principal stress ratio (ratio of effective axial stress to effective lateral stress σ'1/σ'3), or when an axial strain of 15% is reached. The CIU test may consist of three consolidation and shearing stages of increasing stress level. These stages may be performed on a single specimen or on three separate specimens. The presentation of test results includes stress-strain curves, effective stress paths, pore water pressures and shear strength parameters. Stress paths are presented in terms of the Cambridge p'-q space where p' is the mean effective stress defined as (σ'1+2σ'3)/3 and q is the principal stress difference or deviator stress, σ'1-σ'3. The undrained shear strength is defined as half the deviator stress at failure, cu = q/2 and is reported for the following failure criteria: 1) maximum deviator stress 2) maximum stress ratio q/p'. When a maximum stress has not been reached at strains of less than 15%, the stress at 15% strain is used to calculate undrained shear strength. The secant angle of internal friction, ϕ', is determined from q = Mp' where M = (6sinϕ')/(3-sinϕ'). This definition assumes a zero effective cohesion intercept and may be applied to Mmax but also to other values of M and corresponding values of q and p'. For tests with three shearing stages, angles of internal friction may be determined for each stage separately, and from a straight line approximation of the failure points of the three stages. The latter method also provides a value for the effective cohesion intercept c'. Test references: NEN 5117, ASTM D2850-95, BS 1377: Part 8: 1990 (Clause 4, 5, 6, 7) CONSOLIDATED DRAINED TRIAXIAL (CID AND CAD) Consolidated drained triaxial compression tests are generally performed on samples of cohesionless soils. The specimen of dry soil is prepared in the rubber membrane on the base of the triaxial cell, without the use of side drains. Soil particles larger than 20% of the diameter of the specimen are removed. Specimens are prepared by tamping thin layers of soil to a density approximating the estimated in-situ dry density. To saturate the specimen, CO2 gas is used to expel the air and subsequently de-aired water is used to expel the CO2 gas. The specimen is further saturated by incrementing cell pressure and back pressure, until the pore pressure response to a cell pressure increment (B-factor) indicates saturation is complete. The specimen is then isotropically or anisotropically consolidated (CID and CAD respectively). After consolidation the sample is sheared by applying axial load at a sufficiently slow rate to permit drainage (usually 6%/h). The lateral confining pressure is kept constant during each loading stage. Pore pressure measurements are made at the bottom to check if the test is fully drained. The deviator stress is calculated from the measured load assuming the specimen deforms as a right cylinder. The CID test may have three consolidation and loading stages of increasing pressure performed on either a single specimen or on three separate specimens. The CAD test is limited to a single shearing stage. A shearing stage is terminated on the basis of effective stress ratio (ratio of effective axial stress to effective lateral stress, σ'1/σ'3), or when an axial strain of 15% is reached. Results include stress-strain curves, stress paths, and volumetric/shear strain of each loading stage. Stress paths are presented in terms of the Cambridge p'-q space where p' is the mean effective stress defined as (σ'1+2σ'3)/3 and q is the principal stress difference or deviator stress, σ'1-σ'3. The secant angle of internal friction, ϕ', is determined from q = Mp' where M = (6sinϕ')/(3-sinϕ'). This definition assumes zero effective cohesion intercept and may be applied to Mmax but also to other values of M and corresponding values of q and p'. For tests with three shearing stages, angles of internal friction may be determined for each stage separately, and from a straight line approximation of the failure points of the three stages. The latter method also provides a value for the effective cohesion intercept c'. Test reference: NEN 5117, BS 1377: Part 8: 1990 (Clause 4, 5, 6, 8)
GEOTECHNICAL LABORATORY TESTS
FEBV/CDE/APP/007 Page 9 of 9
© F
ugro
199
5-20
08
ISSU
E 13
REFERENCES ASTM International (2007), "ASTM Standards on Disc Volume 04.08: Soil and Rock (I): D 420 - D 5611", ASTM International, West Conshohocken. ASTM International (2007), "ASTM Standards on Disc Volume 04.09: Soil and Rock (II): D 5714 - Latest", ASTM International, West Conshohocken. BSI British Standards Institution (1990), "British Standard Methods of Test for Soils for Civil Engineering Purposes", BS 1377:1990. (Parts 1-9, with Amendments) BSI British Standards Institution (1999), "Code of Practice for Site Investigations", British Standard BS 5930:1999. CEN European Committee for Standardization (2007), “Eurocode 7 - Geotechnical Design – Part 2: Ground Investigation and Testing”, European Standard EN 1997-2:2007. ISO International Organization for Standardization (2005), “Geotechnical Investigation and Testing – Sampling Methods and Groundwater Measurements – Part 1: Technical Principles for Execution”, ISO/FDIS 22475-1:2005. Kay, S., Goedemoed, S.S. and Vermeijden, C.A. (2005), “Influence of Salinity on Soil Properties”, in Gourvenec, S. and Cassidy, M. (Eds.), Frontiers in Offshore Geotechnics ISFOG 2005: Proceedings of the First International Symposium on Frontiers in Offshore Geotechnics, University of Western Australia, Perth, 19-21 September 2005, Taylor & Francis, London, pp. 1087-1093. Lunne, T., Berre, T. and Strandvik, S. (1997), “Sample Disturbance Effects in Soft Low Plastic Norwegian Clay”, in Almeida, M. (Ed.), Recent Developments in Soil and Pavement Mechanics: Proceedings of the International Symposium on Recent Developments in Soil and Pavement Mechanics, Rio de Janeiro, Brazil, 25-27 June 1997, A.A. Balkema, Rotterdam, pp. 81-102. NEN Nederlands Normalisatie-instituut, “Geotechnics”. (Various Dutch NEN Standards on Geotechnical Laboratory Testing) (in Dutch).
LOCATION POSITIONING SURVEY
FEBV/CDE/APP/029 Page 1 of 8
© F
ugro
199
5-20
06
ISSU
E 09
INTRODUCTION This document describes survey of a location reference point(s) for a geotechnical and/or environmental data acquisition, as follows: − positioning survey: a survey method to determine the horizontal position of a location reference point − elevation survey: a survey method to determine the vertical position of a location reference point − water depth survey: a survey method to determine the water depth at a location reference point. The location reference point provides the basis for determination of the depths and/or elevations of samples and tests. National and international standards for geotechnical and/or environmental data acquisition, such as published by ASTM, BSI, CEN and NEN, require location survey, but do not specify details. There is a wide range of survey techniques. This document summarises the more common techniques and the corresponding terminology. SURVEY TERMS General Geodetic Terms − Geoid: equipotential surface coinciding with mean sea level in the oceans and its fictitious
continuation on land. − Spheroid: ellipsoid approximation of the earth's shape. − Projection: systematic representation of the spheroid upon a plane. − Latitude: angle between the normal to the spheroid through a point on the spheroidal surface and the
plane of the rotated major axis of the spheroid (equatorial plane). − Longitude: arc of the equator intercepted between the meridian plane passing through the earth's
axis and the meridian of Greenwich, and the plane through the earth's axis and meridian upon which the point is lying.
− Parallel: line of equal latitude. − Meridian: line of equal longitude. − Central Meridian: line where the spheroid touches the cylinder for a transverse cylindrical projection. − Universal Transverse Mercator (UTM): special case of a transverse cylindrical projection. − Geodetic Datum: datum fixed by orientation and position of the spheroid. Location Control Terms − Location Reference Point: point to be surveyed, such as borehole axis for positioning survey and/or
ground surface for elevation survey. − Ground Surface: top of natural or man-made ground, either above or below the water level, at a
particular date and time. − Water Depth: vertical distance between water level and ground surface at a particular date and time. − Water Level: elevation of free water surface at a particular date and time. − Grid: rectangular plane co-ordinate system. − Control Point: location for which the co-ordinates and/or elevation are known. − Network: geometric net of control points. − Baseline: line between two control points. − Monument: structure to mark a control point. − Benchmark: monument used as reference for vertical control and/or horizontal control. − Vertical Datum: fixed horizontal reference plane. − Elevation: vertical distance normal to a geoid. − Chart Datum: vertical datum applicable to a hydrographic, bathymetric or navigation chart. − HAT: Highest Astronomical Tide. − MHHW: Mean Highest High Water. − MHW: Mean High Water. − MSL: Mean Sea Level. − MLW: Mean Low Water. − MLLW: Mean Lowest Low Water. − LAT: Lowest Astronomical Tide. − LLWS: Low Low Water Springs.

LOCATION POSITIONING SURVEY
Page 2 of 8 FEBV/CDE/APP/029
© F
ugro
199
5-20
06
ISSU
E 09
Survey Method Terms Ground positioning – surface positioning − Direction Method: angle measurement system for horizontal control whereby the direction of a line is
given by the angle it forms with a baseline. − Angle Method: angle measurement system for horizontal control whereby individual angles between
neighbouring lines are measured independently in a number of sets. − Intersection Distance Method: distance measurement system for horizontal control whereby
distances to a location are measured from two control points. − Extension Method: distance measurement system for horizontal control whereby distances are
measured from extension of a location on a baseline to the intersection with another baseline. − Intersection Angle Method: angle measurement system for horizontal control whereby angles to a
location are measured from two control points on a baseline. − Orthogonal Method: distance and angle measurement system for horizontal control whereby
distances to a location are measured along and perpendicular to a baseline. − Polar Method: distance and angle measurement system for horizontal control whereby distance and
angle to a location are measured relative to a control point on a baseline. Satellite positioning – surface positioning − Global Positioning System (GPS): satellite-based system providing three-dimensional position and
velocity information. − Differential Global Positioning System (DGPS): GPS system with monitoring of corrections for control
points. Examples of proprietary systems are “Starfix.SPOT” and “MN8”. − High-Accuracy DGPS: DGPS system using dual frequency GPS observations and working within
network-mode using multiple reference stations. Examples of proprietary systems are “Starfix HP” and “SkyFix XP”.
− RTK Real-Time Kinematic DGPS: DGPS system using carrier-phase observations and requiring a fixed reference station within 15 km to 20 km from the location reference point.
Sub-surface positioning − Long BaseLine (LBL) system: Acoustic underwater positioning system making use of an array of
subsea transponders with known positions. Various frequency bands are available to suit range and accuracy.
− Ultra Short BaseLine (USBL) system: Acoustic underwater positioning system whereby a vessel-mounted hydrophone measures the range and bearing to a subsea transponder.
Elevation Survey − Differential Levelling: elevation survey method using levelling instrument for vertical control. − Trigonometric Levelling: elevation survey method using vertical-angle measurements. − DGPS Levelling: elevation survey method using DGPS measurements − Water Level Reduction: calculation method to determine water depth relative to a vertical datum
using height measurements relative to water level. Water Depth Survey − Direct Sounding: water depth survey method using mechanical distance devices such as hand lead,
depth pole, drill pipe. − Pressure Sensing: water depth survey method using a water pressure sensor. − Echo sounding: water depth survey method using an echosounder. EQUIPMENT General − Compass: instrument providing angle referring to magnetic North. − Gyro Compass: instrument providing angle referring to True North.
LOCATION POSITIONING SURVEY
FEBV/CDE/APP/029 Page 3 of 8
© F
ugro
199
5-20
06
ISSU
E 09
Ground Positioning Equipment − Tacheometer: special theodolite including optical distance measurement. − Electromagnetic Distance Measurement (EDM): distance measurement system comprising a
modulated signal transmitted from one end of the measured distance and reflected or retransmitted back at the other end.
− Theodolite: instrument for angle measurement. − Prism: instrument for fixed angle measurement. − Invar Subtense Bar: device used for optical determination of distance. Satellite Positioning Equipment − Transmitter: device for transmission of radio waves by means of an antenna. − Receiver: device for reception of radio waves by means of an antenna. − Station: transmitter or receiver on a permanently fixed location. − Mobile: transmitter or receiver on a temporary moving location. Sub-surface Positioning Equipment − Transducer: transmitter/receiver that sends out an interrogation signal on one frequency to get a
reply on a second frequency. − Transponder: transmitter/receiver working in conjunction with a transducer. On receipt of an
interrogation signal on one frequency the transponder sends out a reply signal on a second frequency.
Water Depth Survey Equipment − Hand Lead: direct method using marked-wire or surveying tape measurements. − Depth Pole: direct method using pole measurements. − Absolute Water Pressure Device: apparatus for determining height of water based on pressure
measurements relative to zero pressure. Examples are a CTD (Conductivity Temperature Depth) probe and a Digiquartz probe.
− Differential Water Pressure Device: apparatus for determining height of water based on pressure measurements relative to a reference pressure.
− Echosounder: acoustic underwater distance measurement device transmitting and receiving a vertical travelling pulse of acoustic energy; distance calculation is according to the time difference between the time of transmission and the time of reception of the reflected acoustic pulse.
− Single Beam Echosounder: echosounder with narrow beam typically operating with two frequencies 33 kHz and 210 kHz. The higher frequency is generally more accurate, but the operating range is limited to a few hundreds of metres.
− Multi Beam Echosounder: Echosounder with transducer producing an acoustic pulse in a wide fan (swath). The back-scattered signal is received by a transducer that segments the footprint into narrow multiple beams. The width of these beams is in the order of a few degrees.
− Bathymeter: device combining water pressure and echosounder measurements. − Motion Compensator: device for correction of echosounder measurements to compensate for heave,
pitch and roll of the echosounder. − Tide Gauge: Instrument or fixed pole used for measurement of periodic variations in water level. The RTK DGPS system provides an alternative to a conventional tide gauge. Elevation Survey Equipment − Levelling Instrument: optical device using horizontal sighting for vertical distance measurement. − Levelling Staff: graduated length measurement rod used for optical elevation survey. − Circular Level: instrument used to check verticality. − Surveying Tape: mechanical distance measurement instrument. In addition, elevation survey equipment can include a DGPS system, a tacheometer, a theodolite and an invar subtense bar.
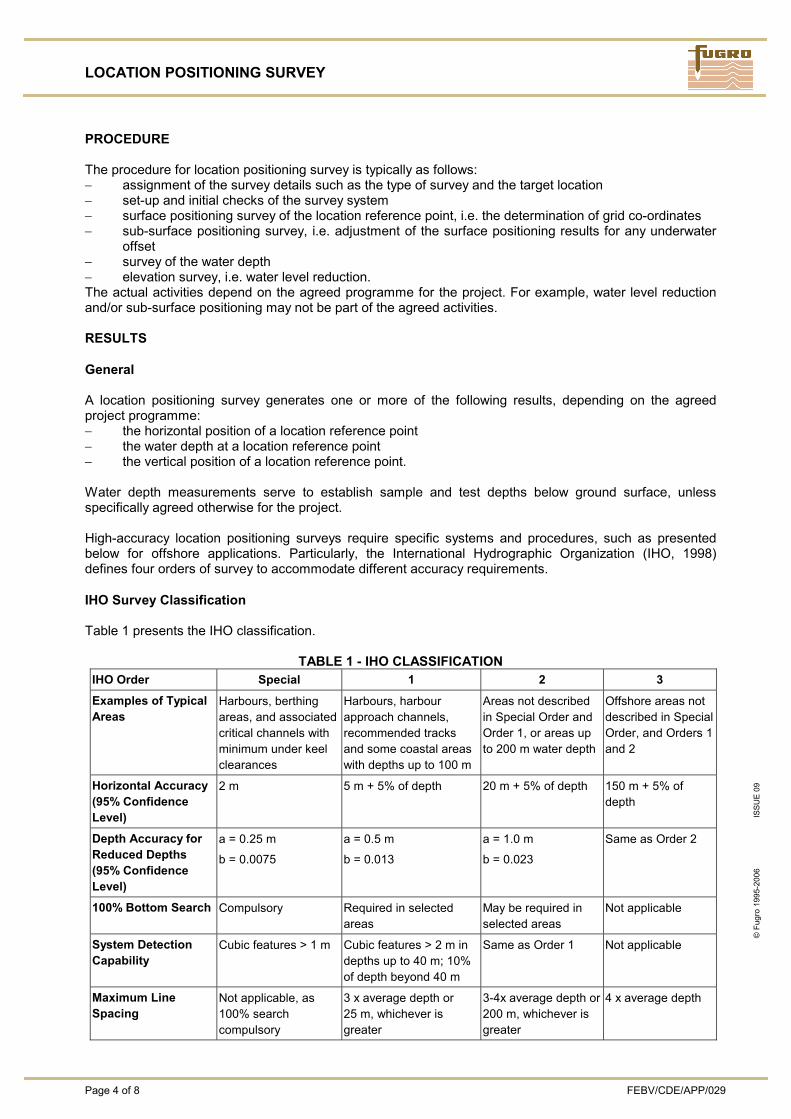
LOCATION POSITIONING SURVEY
Page 4 of 8 FEBV/CDE/APP/029
© F
ugro
199
5-20
06
ISSU
E 09
PROCEDURE The procedure for location positioning survey is typically as follows: − assignment of the survey details such as the type of survey and the target location − set-up and initial checks of the survey system − surface positioning survey of the location reference point, i.e. the determination of grid co-ordinates − sub-surface positioning survey, i.e. adjustment of the surface positioning results for any underwater
offset − survey of the water depth − elevation survey, i.e. water level reduction. The actual activities depend on the agreed programme for the project. For example, water level reduction and/or sub-surface positioning may not be part of the agreed activities. RESULTS General A location positioning survey generates one or more of the following results, depending on the agreed project programme: − the horizontal position of a location reference point − the water depth at a location reference point − the vertical position of a location reference point. Water depth measurements serve to establish sample and test depths below ground surface, unless specifically agreed otherwise for the project. High-accuracy location positioning surveys require specific systems and procedures, such as presented below for offshore applications. Particularly, the International Hydrographic Organization (IHO, 1998) defines four orders of survey to accommodate different accuracy requirements. IHO Survey Classification Table 1 presents the IHO classification.
TABLE 1 - IHO CLASSIFICATION IHO Order Special 1 2 3
Examples of Typical Areas
Harbours, berthing areas, and associated critical channels with minimum under keel clearances
Harbours, harbour approach channels, recommended tracks and some coastal areas with depths up to 100 m
Areas not described in Special Order and Order 1, or areas up to 200 m water depth
Offshore areas not described in Special Order, and Orders 1 and 2
Horizontal Accuracy (95% Confidence Level)
2 m 5 m + 5% of depth 20 m + 5% of depth 150 m + 5% of depth
Depth Accuracy for Reduced Depths (95% Confidence Level)
a = 0.25 m
b = 0.0075
a = 0.5 m
b = 0.013
a = 1.0 m
b = 0.023
Same as Order 2
100% Bottom Search Compulsory Required in selected areas
May be required in selected areas
Not applicable
System Detection Capability
Cubic features > 1 m Cubic features > 2 m in depths up to 40 m; 10% of depth beyond 40 m
Same as Order 1 Not applicable
Maximum Line Spacing
Not applicable, as 100% search compulsory
3 x average depth or 25 m, whichever is greater
3-4x average depth or 200 m, whichever is greater
4 x average depth
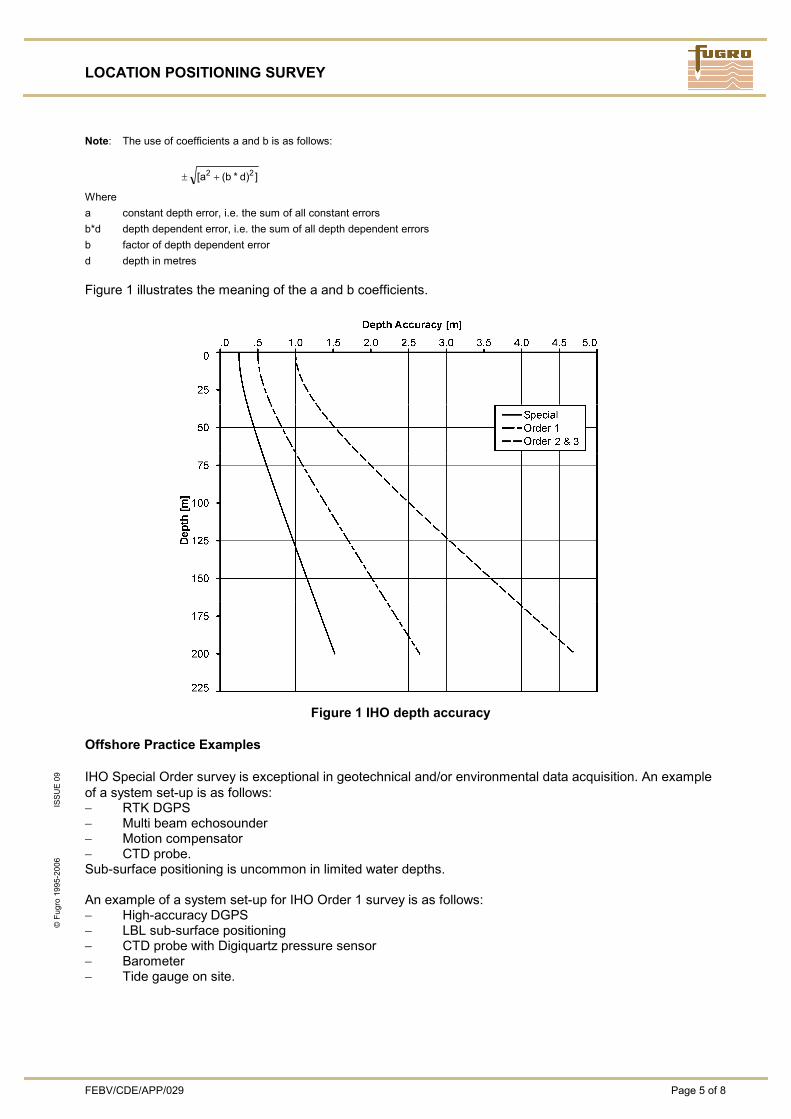
LOCATION POSITIONING SURVEY
FEBV/CDE/APP/029 Page 5 of 8
© F
ugro
199
5-20
06
ISSU
E 09
Note: The use of coefficients a and b is as follows:
])d*b(a[ 22 +±
Where a constant depth error, i.e. the sum of all constant errors b*d depth dependent error, i.e. the sum of all depth dependent errors b factor of depth dependent error d depth in metres Figure 1 illustrates the meaning of the a and b coefficients.
Figure 1 IHO depth accuracy
Offshore Practice Examples IHO Special Order survey is exceptional in geotechnical and/or environmental data acquisition. An example of a system set-up is as follows: − RTK DGPS − Multi beam echosounder − Motion compensator − CTD probe. Sub-surface positioning is uncommon in limited water depths. An example of a system set-up for IHO Order 1 survey is as follows: − High-accuracy DGPS − LBL sub-surface positioning − CTD probe with Digiquartz pressure sensor − Barometer − Tide gauge on site.
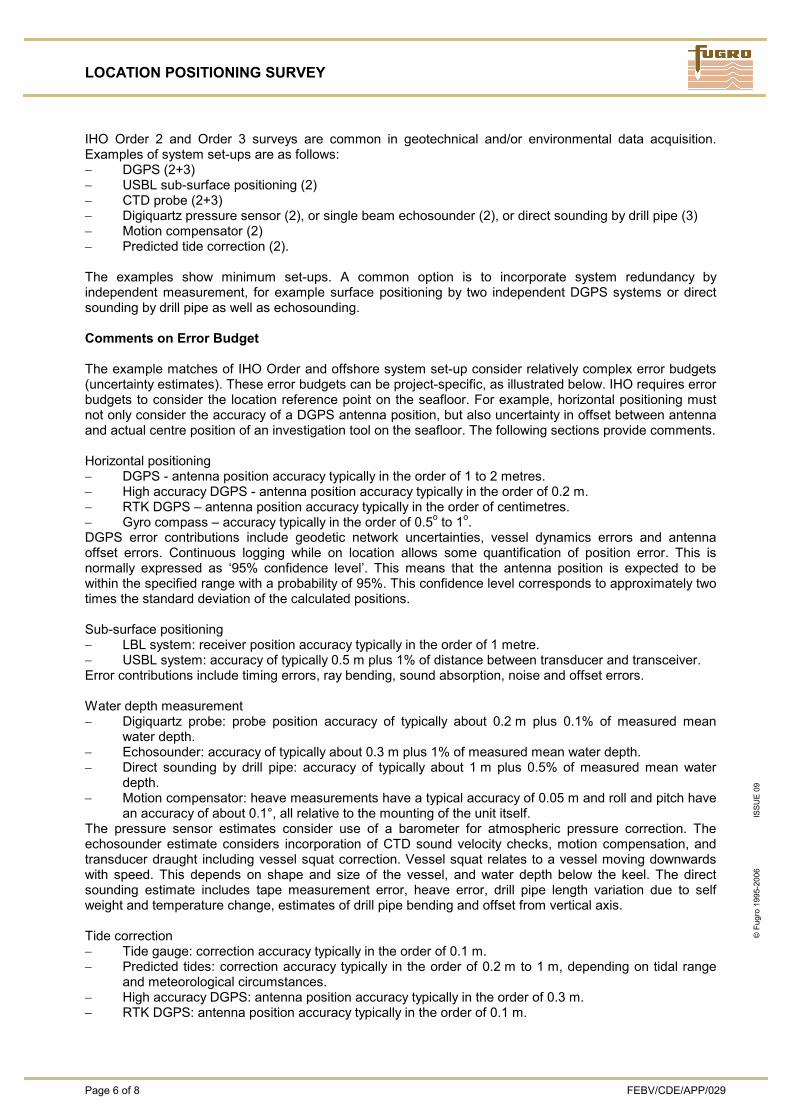
LOCATION POSITIONING SURVEY
Page 6 of 8 FEBV/CDE/APP/029
© F
ugro
199
5-20
06
ISSU
E 09
IHO Order 2 and Order 3 surveys are common in geotechnical and/or environmental data acquisition. Examples of system set-ups are as follows: − DGPS (2+3) − USBL sub-surface positioning (2) − CTD probe (2+3) − Digiquartz pressure sensor (2), or single beam echosounder (2), or direct sounding by drill pipe (3) − Motion compensator (2) − Predicted tide correction (2). The examples show minimum set-ups. A common option is to incorporate system redundancy by independent measurement, for example surface positioning by two independent DGPS systems or direct sounding by drill pipe as well as echosounding. Comments on Error Budget The example matches of IHO Order and offshore system set-up consider relatively complex error budgets (uncertainty estimates). These error budgets can be project-specific, as illustrated below. IHO requires error budgets to consider the location reference point on the seafloor. For example, horizontal positioning must not only consider the accuracy of a DGPS antenna position, but also uncertainty in offset between antenna and actual centre position of an investigation tool on the seafloor. The following sections provide comments. Horizontal positioning − DGPS - antenna position accuracy typically in the order of 1 to 2 metres. − High accuracy DGPS - antenna position accuracy typically in the order of 0.2 m. − RTK DGPS – antenna position accuracy typically in the order of centimetres. − Gyro compass – accuracy typically in the order of 0.5o to 1o. DGPS error contributions include geodetic network uncertainties, vessel dynamics errors and antenna offset errors. Continuous logging while on location allows some quantification of position error. This is normally expressed as ‘95% confidence level’. This means that the antenna position is expected to be within the specified range with a probability of 95%. This confidence level corresponds to approximately two times the standard deviation of the calculated positions. Sub-surface positioning − LBL system: receiver position accuracy typically in the order of 1 metre. − USBL system: accuracy of typically 0.5 m plus 1% of distance between transducer and transceiver. Error contributions include timing errors, ray bending, sound absorption, noise and offset errors. Water depth measurement − Digiquartz probe: probe position accuracy of typically about 0.2 m plus 0.1% of measured mean
water depth. − Echosounder: accuracy of typically about 0.3 m plus 1% of measured mean water depth. − Direct sounding by drill pipe: accuracy of typically about 1 m plus 0.5% of measured mean water
depth. − Motion compensator: heave measurements have a typical accuracy of 0.05 m and roll and pitch have
an accuracy of about 0.1°, all relative to the mounting of the unit itself. The pressure sensor estimates consider use of a barometer for atmospheric pressure correction. The echosounder estimate considers incorporation of CTD sound velocity checks, motion compensation, and transducer draught including vessel squat correction. Vessel squat relates to a vessel moving downwards with speed. This depends on shape and size of the vessel, and water depth below the keel. The direct sounding estimate includes tape measurement error, heave error, drill pipe length variation due to self weight and temperature change, estimates of drill pipe bending and offset from vertical axis. Tide correction − Tide gauge: correction accuracy typically in the order of 0.1 m. − Predicted tides: correction accuracy typically in the order of 0.2 m to 1 m, depending on tidal range
and meteorological circumstances. − High accuracy DGPS: antenna position accuracy typically in the order of 0.3 m. − RTK DGPS: antenna position accuracy typically in the order of 0.1 m.
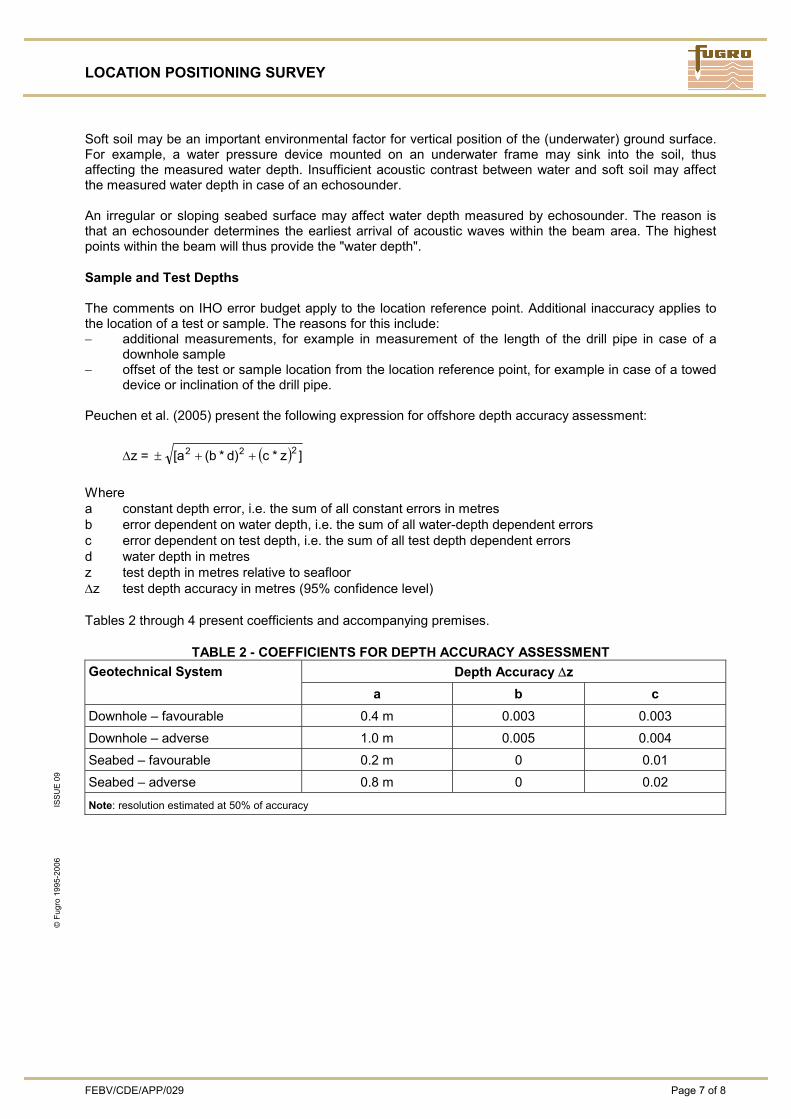
LOCATION POSITIONING SURVEY
FEBV/CDE/APP/029 Page 7 of 8
© F
ugro
199
5-20
06
ISSU
E 09
Soft soil may be an important environmental factor for vertical position of the (underwater) ground surface. For example, a water pressure device mounted on an underwater frame may sink into the soil, thus affecting the measured water depth. Insufficient acoustic contrast between water and soft soil may affect the measured water depth in case of an echosounder. An irregular or sloping seabed surface may affect water depth measured by echosounder. The reason is that an echosounder determines the earliest arrival of acoustic waves within the beam area. The highest points within the beam will thus provide the "water depth". Sample and Test Depths The comments on IHO error budget apply to the location reference point. Additional inaccuracy applies to the location of a test or sample. The reasons for this include: − additional measurements, for example in measurement of the length of the drill pipe in case of a
downhole sample − offset of the test or sample location from the location reference point, for example in case of a towed
device or inclination of the drill pipe. Peuchen et al. (2005) present the following expression for offshore depth accuracy assessment:
Δz = ( ) ]z*c)d*b(a[ 222 ++± Where a constant depth error, i.e. the sum of all constant errors in metres b error dependent on water depth, i.e. the sum of all water-depth dependent errors c error dependent on test depth, i.e. the sum of all test depth dependent errors d water depth in metres z test depth in metres relative to seafloor Δz test depth accuracy in metres (95% confidence level) Tables 2 through 4 present coefficients and accompanying premises.
TABLE 2 - COEFFICIENTS FOR DEPTH ACCURACY ASSESSMENT Depth Accuracy Δz Geotechnical System
a b c Downhole – favourable 0.4 m 0.003 0.003 Downhole – adverse 1.0 m 0.005 0.004 Seabed – favourable 0.2 m 0 0.01 Seabed – adverse 0.8 m 0 0.02
Note: resolution estimated at 50% of accuracy
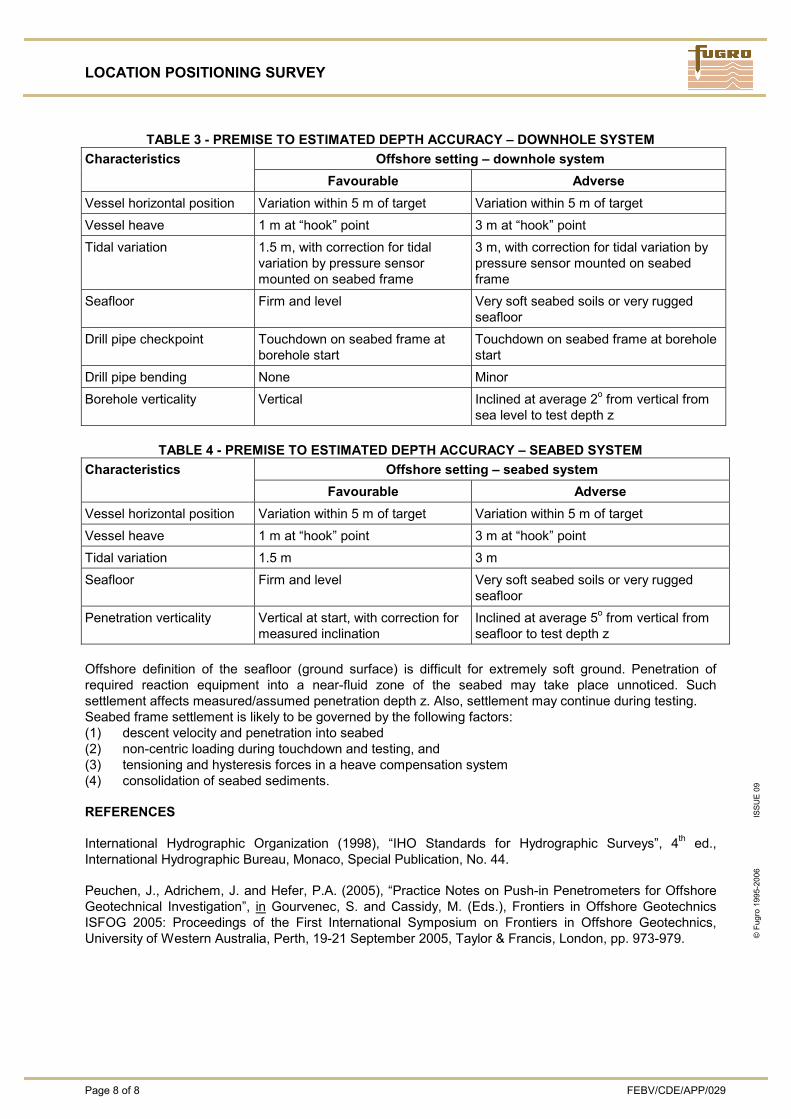
LOCATION POSITIONING SURVEY
Page 8 of 8 FEBV/CDE/APP/029
© F
ugro
199
5-20
06
ISSU
E 09
TABLE 3 - PREMISE TO ESTIMATED DEPTH ACCURACY – DOWNHOLE SYSTEM Offshore setting – downhole system Characteristics
Favourable Adverse Vessel horizontal position Variation within 5 m of target Variation within 5 m of target Vessel heave 1 m at “hook” point 3 m at “hook” point Tidal variation 1.5 m, with correction for tidal
variation by pressure sensor mounted on seabed frame
3 m, with correction for tidal variation by pressure sensor mounted on seabed frame
Seafloor Firm and level Very soft seabed soils or very rugged seafloor
Drill pipe checkpoint Touchdown on seabed frame at borehole start
Touchdown on seabed frame at borehole start
Drill pipe bending None Minor Borehole verticality Vertical Inclined at average 2o from vertical from
sea level to test depth z
TABLE 4 - PREMISE TO ESTIMATED DEPTH ACCURACY – SEABED SYSTEM Offshore setting – seabed system Characteristics
Favourable Adverse Vessel horizontal position Variation within 5 m of target Variation within 5 m of target Vessel heave 1 m at “hook” point 3 m at “hook” point Tidal variation 1.5 m 3 m Seafloor Firm and level Very soft seabed soils or very rugged
seafloor Penetration verticality Vertical at start, with correction for
measured inclination Inclined at average 5o from vertical from seafloor to test depth z
Offshore definition of the seafloor (ground surface) is difficult for extremely soft ground. Penetration of required reaction equipment into a near-fluid zone of the seabed may take place unnoticed. Such settlement affects measured/assumed penetration depth z. Also, settlement may continue during testing. Seabed frame settlement is likely to be governed by the following factors: (1) descent velocity and penetration into seabed (2) non-centric loading during touchdown and testing, and (3) tensioning and hysteresis forces in a heave compensation system (4) consolidation of seabed sediments. REFERENCES International Hydrographic Organization (1998), “IHO Standards for Hydrographic Surveys”, 4th ed., International Hydrographic Bureau, Monaco, Special Publication, No. 44. Peuchen, J., Adrichem, J. and Hefer, P.A. (2005), “Practice Notes on Push-in Penetrometers for Offshore Geotechnical Investigation”, in Gourvenec, S. and Cassidy, M. (Eds.), Frontiers in Offshore Geotechnics ISFOG 2005: Proceedings of the First International Symposium on Frontiers in Offshore Geotechnics, University of Western Australia, Perth, 19-21 September 2005, Taylor & Francis, London, pp. 973-979.
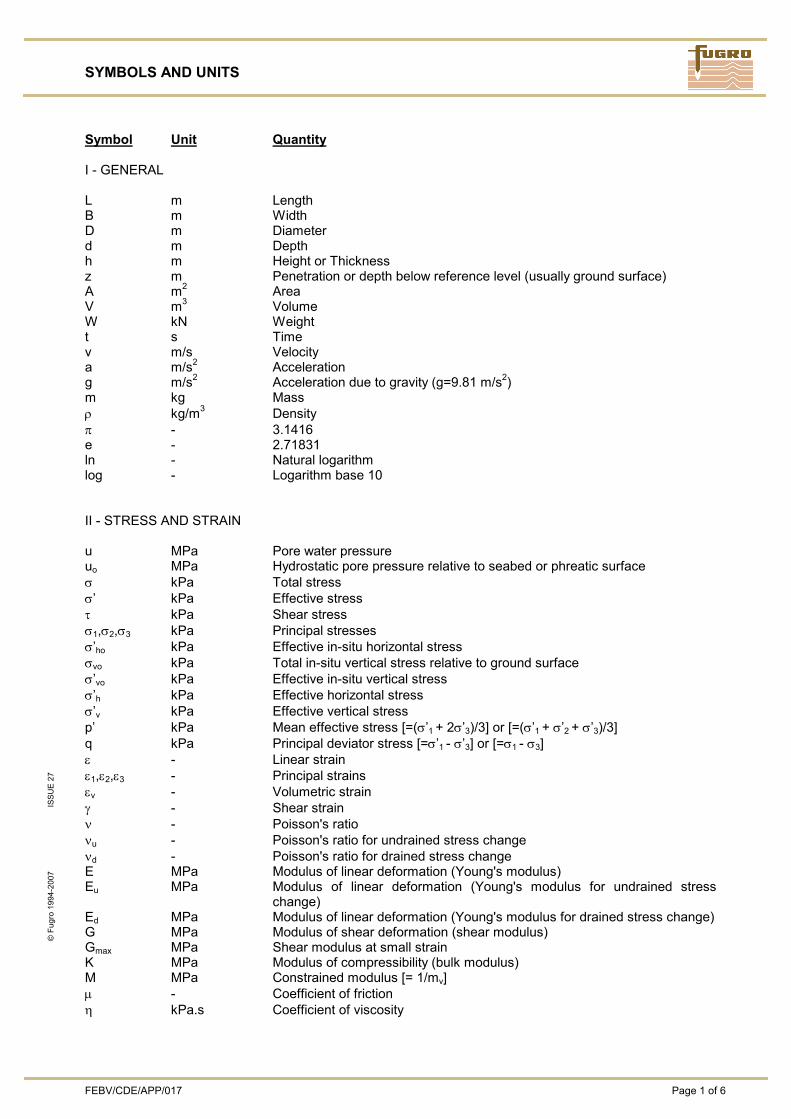
SYMBOLS AND UNITS
FEBV/CDE/APP/017 Page 1 of 6
© F
ugro
199
4-20
07
IS
SUE
27
Symbol Unit Quantity I - GENERAL L m Length B m Width D m Diameter d m Depth h m Height or Thickness z m Penetration or depth below reference level (usually ground surface) A m2 Area V m3 Volume W kN Weight t s Time v m/s Velocity a m/s2 Acceleration g m/s2 Acceleration due to gravity (g=9.81 m/s2) m kg Mass ρ kg/m3 Density π - 3.1416 e - 2.71831 ln - Natural logarithm log - Logarithm base 10 II - STRESS AND STRAIN u MPa Pore water pressure uo MPa Hydrostatic pore pressure relative to seabed or phreatic surface σ kPa Total stress σ’ kPa Effective stress τ kPa Shear stress σ1,σ2,σ3 kPa Principal stresses σ’ho kPa Effective in-situ horizontal stress σvo kPa Total in-situ vertical stress relative to ground surface σ’vo kPa Effective in-situ vertical stress σ’h kPa Effective horizontal stress σ’v kPa Effective vertical stress p’ kPa Mean effective stress [=(σ’1 + 2σ’3)/3] or [=(σ’1 + σ’2 + σ’3)/3] q kPa Principal deviator stress [=σ’1 - σ’3] or [=σ1 - σ3] ε - Linear strain ε1,ε2,ε3 - Principal strains εv - Volumetric strain γ - Shear strain ν - Poisson's ratio νu - Poisson's ratio for undrained stress change νd - Poisson's ratio for drained stress change E MPa Modulus of linear deformation (Young's modulus) Eu MPa Modulus of linear deformation (Young's modulus for undrained stress
change) Ed MPa Modulus of linear deformation (Young's modulus for drained stress change) G MPa Modulus of shear deformation (shear modulus) Gmax MPa Shear modulus at small strain K MPa Modulus of compressibility (bulk modulus) M MPa Constrained modulus [= 1/mv] μ - Coefficient of friction η kPa.s Coefficient of viscosity
SYMBOLS AND UNITS
Page 2 of 6 FEBV/CDE/APP/017
© F
ugro
199
4-20
07
IS
SUE
27
Symbol Unit Quantity III - PHYSICAL CHARACTERISTICS OF GROUND (a) Density and Unit weights γ kN/m3 Unit weight of ground γd kN/m3 Unit weight of dry ground γs kN/m3 Unit weight of solid particles γw kN/m3 Unit weight of water γpf kN/m3 Unit weight of pore fluid γdmin kN/m3 Minimum index unit weight γdmax kN/m3 Maximum index unit weight γ’ or γsub kN/m3 Unit weight of submerged ground ρ Mg/m3 [= t/m3] Density of ground ρd Mg/m3 [= t/m3] Density of dry ground ρs Mg/m3 [= t/m3] Density of solid particles ρw Mg/m3 [= t/m3] Density of water Dr -, % Relative density [= γdmax (γd-γdmin)/γd(γdmax-γdmin)] v - Specific volume [=1+e] e - Void ratio eo - Initial void ratio emax - Maximum index void ratio emin - Minimum index void ratio Id -, % Density index [= (γd-γdmin)/(γdmax-γdmin)] RD -, % Dry density ratio [= γd/γdmax] n -, % Porosity w % Water content Sr % Degree of saturation r -, g/kg Salinity of pore fluid [= ratio of mass of salt to mass of pore fluid] R g/l Salinity of fluid [= ratio of mass of salt to volume of distilled water] s g/l Salinity of fluid [= ratio of mass of salt to volume of fluid] S g/kg Salinity of seawater [= ratio of mass of salt to mass of seawater] (b) Consistency wL % Liquid limit wP % Plastic limit IP % Plasticity index [= wL - wP] IL % Liquidity index [= (w - wP)/(wL - wP)] IC % Consistency index [= (wL - w)/(wL - wP)] A -, % Activity [= ratio of plasticity index to percentage by weight of clay-size
particles] (c) Particle size D mm Particle diameter Dn mm n percent diameter [n% < D] Cu - Uniformity coefficient [=D60/D10] Cc - Curvature coefficient [= (D30)2/D10D60] (d) Dynamic Properties vp m/s P-wave velocity (compression wave velocity) vs m/s S-wave velocity (shear wave velocity) vs1 m/s S-wave velocity normalised to 100 kPa in-situ vertical stress D -, % Damping ratio of ground
SYMBOLS AND UNITS
FEBV/CDE/APP/017 Page 3 of 6
© F
ugro
199
4-20
07
IS
SUE
27
Symbol Unit Quantity (e) Hydraulic properties k m/s Coefficient of permeability kv m/s Coefficient of vertical permeability kh m/s Coefficient of horizontal permeability i - Hydraulic gradient (f) Thermal and Electrical properties T °C Temperature k W/(m.K) Thermal conductivity aL 1/°C Thermal expansion coefficient (linear) α m2/s Thermal diffusion coefficient ρ Ω.m Electrical resistivity K S/m Electrical conductivity (g) Magnetic properties B T Magnetic flux density (or magnetic induction) (h) Radioactive properties γ CPS Natural gamma ray IV - MECHANICAL CHARACTERISTICS OF GROUND (a) In-situ tests qc MPa Cone resistance qc1 MPa Cone resistance normalised to 100 kPa effective in-situ vertical stress fs MPa Sleeve friction Rf % Ratio of sleeve friction to cone resistance qn MPa Net cone resistance qt MPa Corrected cone resistance Bq - Pore pressure ratio Qt - Normalised cone resistance [= qn/σ’vo] Fr % Ratio of sleeve friction to net cone resistance Nc - Cone factor between qc and cu Nk - Cone factor between qn and cu N Blows/0.3 m SPT blowcount N60 Blows/0.3 m SPT blowcount normalised to 60% energy N1,60 Blows/0.3 m SPT blowcount normalised to 60% energy and to 100 kPa effective in-situ
vertical stress
SYMBOLS AND UNITS
Page 4 of 6 FEBV/CDE/APP/017
© F
ugro
199
4-20
07
IS
SUE
27
Symbol Unit Quantity (b) Strength of soil cu kPa Undrained shear strength cu/σ’vo - Undrained strength ratio κ kPa/m Rate of increase of undrained shear strength with depth (linear) c’ kPa Effective cohesion intercept ϕ’ °(deg) Effective angle of internal friction ϕ’cv °(deg) Effective angle of internal friction at large strain ε50 % Strain at 50% of peak deviator stress E50 MPa Young's modulus at 50% of peak deviator stress cu;r kPa Undrained shear strength of remoulded soil cR kPa Undrained residual shear strength St - Sensitivity [=cu/cu;r or cu/cR] Tx - Thixotropy ratio [Tx(t) = cu;r(t) / cu;r(t=0)] σ'c kPa Effective consolidation pressure M - Gradient of critical state line when projected onto a constant volume plane A - Pore pressure coefficient for anisotropic pressure increment B - Pore pressure coefficient for isotropic pressure increment (c) Strength of rock Is(50) MPa Point load strength index σc MPa Uni-axial compressive strength (d) Consolidation (one dimensional) σ’p kPa Preconsolidation pressure (pre-stress) σ’vy kPa Yield stress Cc - Compression index Cs - Swelling index (or re-compression) CR - Primary compression ratio [= Cc/(1+e0)] RR - Recompression ratio [= Cs/(1+e0)] e0 - Void ratio at σ’vo Cα - Coefficient of secondary consolidation (primary compression) Cαs - Coefficient of secondary consolidation (swell/re-compression) cv m2/s Coefficient of consolidation H m Drainage path length mv m2/MN Coefficient of volume compressibility M MPa Constrained modulus [= 1/mv] p kPa Vertical pressure OCR - Overconsolidation ratio [= σ’p /σ’vo] YSR - Yield stress ratio [= σ’vy /σ’vo] V - GEOTECHNICAL DESIGN (a) Partial factors γm - Material factor (partial safety factor) γf - Load factor (partial action factor) (b) Seismicity ag m/s2 Effective peak ground acceleration (design ground acceleration) dg m Peak ground displacement α - Acceleration ratio [= ag/g] τc kPa Seismic shear stress
SYMBOLS AND UNITS
FEBV/CDE/APP/017 Page 5 of 6
© F
ugro
199
4-20
07
IS
SUE
27
Symbol Unit Quantity (c) Compaction ρdmax Mg/m3 [= t/m3] Maximum dry density ρmax Mg/m3 [= t/m3] Maximum density wopt % Optimum moisture content (d) Earth pressure δ °(deg) Angle of wall or base friction K - Coefficient of lateral earth pressure Ka - Coefficient of active earth pressure Kac - Coefficient of active earth pressure for total stress analysis Kp - Coefficient of passive earth pressure Kpc - Coefficient of passive earth pressure for total stress analysis Ko - Coefficient of earth pressure at rest Konc - Ko for normally consolidated soil Kooc - Ko for overconsolidated soil (e) Foundations A m2 Total foundation area A’ m2 Effective foundation area B’ m Effective width of foundation L’ m Effective length of foundation H MN Horizontal external force or action V MN Vertical external force or action M MN.m External moment T MN.m External torsion moment Q MN Total vertical resistance of a foundation/pile Qp MN End bearing of pile Qs MN Shaft resistance of pile qp MPa Unit end bearing qs MPa Unit skin friction qlim MPa Limit unit end bearing flim kPa Limit unit skin friction ks MN/m3 Modulus of subgrade reaction p MN/m Lateral resistance per unit length of pile s m Settlement t MN/m Skin friction per unit length of pile y mm Lateral pile deflection z mm Axial pile displacement α - Adhesion factor δ - Angle of shearing resistance between ground and foundation Nc,Nq,Nγ - Bearing capacity factors Kc,Kq,Kγ - Bearing capacity correction factors for inclined actions, foundation shape
and depth of embedment ic,iq,iγ - Bearing capacity correction factors for external force inclined from vertical
shape sc,sq,sγ - Bearing capacity correction factors for foundation shape dc,dq,dγ - Bearing capacity correction factors for foundation embedment Signs: − A "prime" applies to effective stress. − A "bar" above a symbol relates to average properties. − A "dot" above a symbol denotes derivative with respect to time. − The prefix "Δ" denotes an increment or a change. − A “star” after a symbol denotes value corrected for pore fluid salinity.
SYMBOLS AND UNITS
Page 6 of 6 FEBV/CDE/APP/017
© F
ugro
199
4-20
07
IS
SUE
27
BIBLIOGRAPHY CEN European Committee for Standardization (2004), "Eurocode 7: Geotechnical Design - Part 1: General Rules", European Standard EN 1997-1:2004. CEN European Committee for Standardization (2007), “Eurocode 7 - Geotechnical Design – Part 2: Ground Investigation and Testing”, European Standard EN 1997-2:2007. DNV Det Norske Veritas (1992), “Foundations”, Classification Notes No. 30.4. ISO International Organization for Standardization (2003), "Petroleum and Natural Gas Industries - Specific Requirements for Offshore Structures - Part 4: Geotechnical and Foundation Design Considerations", International Standard ISO 19901-4:2003. ISO International Organization for Standardization (2004), "Geotechnical Investigation and Testing - Identification and Classification of Soil - Part 2: Principles for a Classification", International Standard ISO 14688-2:2004. ISSMFE Subcommittee on Symbols, Units, Definitions (1978), “List of Symbols, Units and Definitions”, in Proceedings of the Ninth International Conference on Soil Mechanics and Foundation Engineering, 1977, Tokyo, Vol. 3, Japanese Society of Soil Mechanics and Foundation Engineering, Tokyo, pp. 156-170. ISRM Commission on Terminology, Symbols and Graphic Representation (1970), "List of Symbols”. Noorany, I. (1984), “Phase Relations in Marine Soils”, Journal of Geotechnical Engineering, Vol. 110, No. 4, pp. 539-543.
GEOTECHNICAL ANALYSIS
FEBV/CDE/APP/052 Page 1 of 3
© F
ugro
199
6-20
07
ISSU
E 04
INTRODUCTION A geotechnical design situation requires verification of relevant limit states, such as the Ultimate Limit State (ULS, for example stability) and the Serviceability Limit State (SLS, for example for avoiding excessive settlement). Such verification usually involves one or more of the following approaches: − calculation models − prescriptive measures − experimental models and load tests − observational method. Features of a calculation model include: − method of analysis based on an analytical model including simplifications and modification of the results
where necessary to improve accuracy or to allow for uncertainty and systematic error − actions, such as (a sequence of) imposed loads or imposed displacements − geometrical data, such as the shape of a geotechnical structure, geometry of the ground surface, water
levels and interfaces between ground strata − characteristic geotechnical parameters of ground (soil, rock) and other materials − limiting values of, for example, deformations and vibrations − (partial) safety factors. The common analytical models rely on semi-empirical and direct methods of analysis. Prescriptive measures generally involve (1) conventional and conservative details in the design and (2) attention to specification and control of materials, workmanship, protection and maintenance procedures. Their use is often applicable where calculation models are not available or not necessary. Examples are prescriptive measures for ensuring durability against chemical attack or frost action. Experimental models and load tests can help to justify a design approach. Important considerations for evaluation of the results include differences in ground conditions, time effects and scale effects. Prediction of geotechnical behaviour is often difficult. The observational method allows carefully planned monitoring during construction and includes planned contingency actions where necessary. Assessment of the monitoring results takes place at appropriate stages. This document provides further details about the use of geotechnical parameters within the context of design philosophies for safety, serviceability and economy. DESIGN PHILOSOPHIES Design philosophies are included in standards and codes of practice. All consider that the capacity or resistance of a geotechnical system must be greater than the demand or loads on the system for an acceptable or required level of safety. The use of safety factors is common. They may vary depending on the specific design scenario including a specific geotechnical calculation model. Design philosophies for the ULS may be grouped as follows: 1. Working Stress Design (WSD). 2. Limit State Design (LSD).
a. Factored Strength. b. Factored Resistance.
The WSD method uses global safety factors applied to ultimate resistance or capacity. Loads or demands are taken at working stress, i.e. unfactored. The LSD methods use partial safety factors applied to loads and to resistance. The Factored Strength and Factored Resistance methods differ by their calculation of factored capacity. The Factored Strength method applies partial safety factors to ultimate strengths such as undrained shear strength of soil. The factored strengths are then used in the calculation model to obtain factored capacity. The Factored Resistance method uses ultimate strengths in the calculation model and then applies a partial safety factor to the calculated capacity.

GEOTECHNICAL ANALYSIS
FEBV/CDE/APP/052 Page 2 of 3
© F
ugro
199
6-20
07
ISSU
E 04
API Recommended Practice RP 2A-WSD (API, 2000) is an example of the WSD approach. Eurocode 7 Geotechnical Design (CEN, 2004; 2007) and ISO 19901-4:2003 Geotechnical and Foundation Design Considerations (ISO, 2003) provide design principles according to the Factored Strength approach. API Recommended Practice RP 2A-LRFD (API, 1993) is an example of the Factored Resistance approach. Design philosophies for the SLS typically consider global and partial safety factors set to unity (1). This means that distinction between WSD and LSD disappears. ASSIGNMENT OF GEOTECHNICAL PARAMETER VALUES DESIGN PROCESS Assignment of geotechnical parameter values is according to the following steps: 1. Ground characterisation. 2. Evaluation of derived geotechnical parameters. 3. Selection of characteristic geotechnical parameters and application in a calculation model. A specific project arrangement may be limited to 1 or 2 of these steps. The selection of characteristic values of geotechnical parameters takes place within the context of a calculation model and thus includes consideration of limit states, actions, geometry, limiting values and (partial) safety factors. Divorcing the selection of characteristic values from the actual use and evaluation of a calculation model may lead to errors. GROUND CHARACTERISATION General ground characterisation is necessary before selection of geometrical data for the ground and before evaluation of the results of specific tests and observations. Such ground characterisation comprises a general assessment of the character and basic constituents of the ground (soil and rock classification). Typical parameters for soil classification include particle size distribution, water content, carbonate content, Atterberg limits, unit weight, relative density and undrained shear strength. Typical parameters for rock classification include mineralogy, water content, unit weight and uni-axial compressive strength. Options for ground characterisation may include additional evaluation of: − parameters such as undrained shear strength and relative density on the basis of derived geotechnical
parameters (refer following section) − geological and hydro-geological setting − results of a geophysical survey − hazards such as potential instability of the ground − water levels − aggressiveness of ground and ground water. The term ”integrated study" refers to ground characterisation on the basis of ground investigation data (for example geotechnical boreholes and in-situ test results), geological setting and geophysical data. DERIVED GEOTECHNICAL PARAMETERS In-situ test and laboratory test measurements and other relevant data provide a basis for obtaining "derived values" of geotechnical parameters. Laboratory test standards often specify procedures for obtaining derived values, in particular where it is possible to obtain a derived value by means of theory. Such derived values are thus part of the laboratory test report. An example is the Unconsolidated Undrained triaxial (UU) test. Normalised load and displacement data are the basic measured values. The measured values and the use of theory allow the calculation of a derived value of undrained shear strength by consideration of principal stress conditions and a theoretical deformation model.
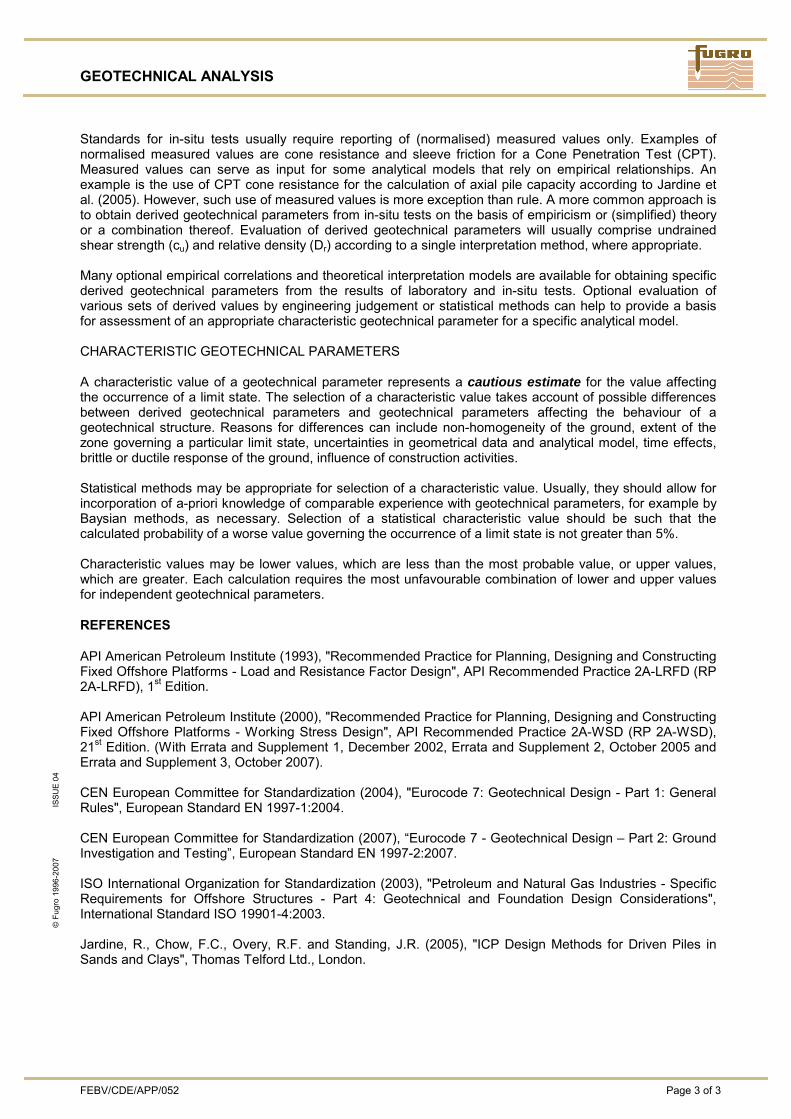
GEOTECHNICAL ANALYSIS
FEBV/CDE/APP/052 Page 3 of 3
© F
ugro
199
6-20
07
ISSU
E 04
Standards for in-situ tests usually require reporting of (normalised) measured values only. Examples of normalised measured values are cone resistance and sleeve friction for a Cone Penetration Test (CPT). Measured values can serve as input for some analytical models that rely on empirical relationships. An example is the use of CPT cone resistance for the calculation of axial pile capacity according to Jardine et al. (2005). However, such use of measured values is more exception than rule. A more common approach is to obtain derived geotechnical parameters from in-situ tests on the basis of empiricism or (simplified) theory or a combination thereof. Evaluation of derived geotechnical parameters will usually comprise undrained shear strength (cu) and relative density (Dr) according to a single interpretation method, where appropriate. Many optional empirical correlations and theoretical interpretation models are available for obtaining specific derived geotechnical parameters from the results of laboratory and in-situ tests. Optional evaluation of various sets of derived values by engineering judgement or statistical methods can help to provide a basis for assessment of an appropriate characteristic geotechnical parameter for a specific analytical model. CHARACTERISTIC GEOTECHNICAL PARAMETERS A characteristic value of a geotechnical parameter represents a cautious estimate for the value affecting the occurrence of a limit state. The selection of a characteristic value takes account of possible differences between derived geotechnical parameters and geotechnical parameters affecting the behaviour of a geotechnical structure. Reasons for differences can include non-homogeneity of the ground, extent of the zone governing a particular limit state, uncertainties in geometrical data and analytical model, time effects, brittle or ductile response of the ground, influence of construction activities. Statistical methods may be appropriate for selection of a characteristic value. Usually, they should allow for incorporation of a-priori knowledge of comparable experience with geotechnical parameters, for example by Baysian methods, as necessary. Selection of a statistical characteristic value should be such that the calculated probability of a worse value governing the occurrence of a limit state is not greater than 5%. Characteristic values may be lower values, which are less than the most probable value, or upper values, which are greater. Each calculation requires the most unfavourable combination of lower and upper values for independent geotechnical parameters. REFERENCES API American Petroleum Institute (1993), "Recommended Practice for Planning, Designing and Constructing Fixed Offshore Platforms - Load and Resistance Factor Design", API Recommended Practice 2A-LRFD (RP 2A-LRFD), 1st Edition. API American Petroleum Institute (2000), "Recommended Practice for Planning, Designing and Constructing Fixed Offshore Platforms - Working Stress Design", API Recommended Practice 2A-WSD (RP 2A-WSD), 21st Edition. (With Errata and Supplement 1, December 2002, Errata and Supplement 2, October 2005 and Errata and Supplement 3, October 2007). CEN European Committee for Standardization (2004), "Eurocode 7: Geotechnical Design - Part 1: General Rules", European Standard EN 1997-1:2004. CEN European Committee for Standardization (2007), “Eurocode 7 - Geotechnical Design – Part 2: Ground Investigation and Testing”, European Standard EN 1997-2:2007. ISO International Organization for Standardization (2003), "Petroleum and Natural Gas Industries - Specific Requirements for Offshore Structures - Part 4: Geotechnical and Foundation Design Considerations", International Standard ISO 19901-4:2003. Jardine, R., Chow, F.C., Overy, R.F. and Standing, J.R. (2005), "ICP Design Methods for Driven Piles in Sands and Clays", Thomas Telford Ltd., London.
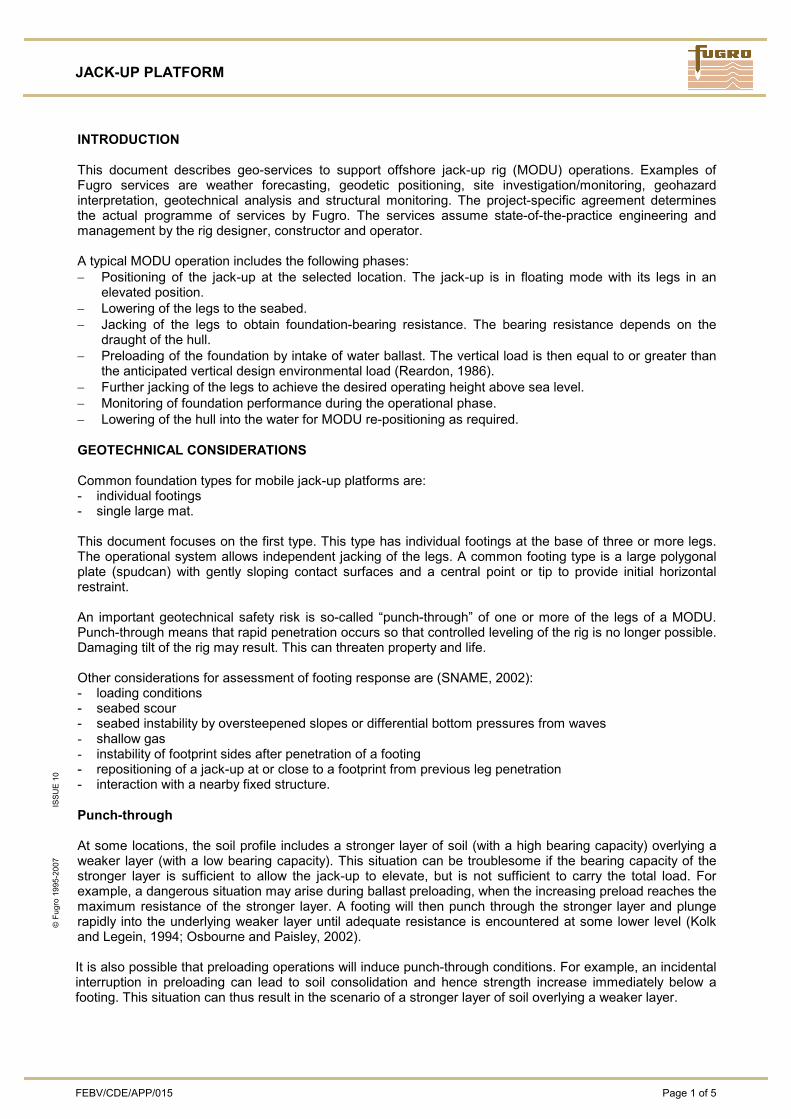
JACK-UP PLATFORM
FEBV/CDE/APP/015 Page 1 of 5
© F
ugro
199
5-20
07
ISSU
E 10
INTRODUCTION This document describes geo-services to support offshore jack-up rig (MODU) operations. Examples of Fugro services are weather forecasting, geodetic positioning, site investigation/monitoring, geohazard interpretation, geotechnical analysis and structural monitoring. The project-specific agreement determines the actual programme of services by Fugro. The services assume state-of-the-practice engineering and management by the rig designer, constructor and operator. A typical MODU operation includes the following phases: − Positioning of the jack-up at the selected location. The jack-up is in floating mode with its legs in an
elevated position. − Lowering of the legs to the seabed. − Jacking of the legs to obtain foundation-bearing resistance. The bearing resistance depends on the
draught of the hull. − Preloading of the foundation by intake of water ballast. The vertical load is then equal to or greater than
the anticipated vertical design environmental load (Reardon, 1986). − Further jacking of the legs to achieve the desired operating height above sea level. − Monitoring of foundation performance during the operational phase. − Lowering of the hull into the water for MODU re-positioning as required. GEOTECHNICAL CONSIDERATIONS Common foundation types for mobile jack-up platforms are: - individual footings - single large mat. This document focuses on the first type. This type has individual footings at the base of three or more legs. The operational system allows independent jacking of the legs. A common footing type is a large polygonal plate (spudcan) with gently sloping contact surfaces and a central point or tip to provide initial horizontal restraint. An important geotechnical safety risk is so-called “punch-through” of one or more of the legs of a MODU. Punch-through means that rapid penetration occurs so that controlled leveling of the rig is no longer possible. Damaging tilt of the rig may result. This can threaten property and life. Other considerations for assessment of footing response are (SNAME, 2002): - loading conditions - seabed scour - seabed instability by oversteepened slopes or differential bottom pressures from waves - shallow gas - instability of footprint sides after penetration of a footing - repositioning of a jack-up at or close to a footprint from previous leg penetration - interaction with a nearby fixed structure. Punch-through At some locations, the soil profile includes a stronger layer of soil (with a high bearing capacity) overlying a weaker layer (with a low bearing capacity). This situation can be troublesome if the bearing capacity of the stronger layer is sufficient to allow the jack-up to elevate, but is not sufficient to carry the total load. For example, a dangerous situation may arise during ballast preloading, when the increasing preload reaches the maximum resistance of the stronger layer. A footing will then punch through the stronger layer and plunge rapidly into the underlying weaker layer until adequate resistance is encountered at some lower level (Kolk and Legein, 1994; Osbourne and Paisley, 2002). It is also possible that preloading operations will induce punch-through conditions. For example, an incidental interruption in preloading can lead to soil consolidation and hence strength increase immediately below a footing. This situation can thus result in the scenario of a stronger layer of soil overlying a weaker layer.
JACK-UP PLATFORM
Page 2 of 5 FEBV/CDE/APP/015
© F
ugro
199
5-20
07
ISSU
E 10
Load Type The footing response must be adequate for the design static, cyclic and transient loads without excessive movements or vibrations in the platform. These loads consist of operational platform weight, variable load (gravity load) and environmental loads. Environmental loading can include some combination of wave, wind, current and occasionally ice forces. Calculation of gravity loads is reasonably accurate. Some design situations must take account jack-up tilt. Tilt may occur when the rate of leg jacking cannot fully compensate for the rate of penetration of a leg. Tilt causes a transverse shift in the centre of gravity of the platform. This can attract additional footing load. Tilt can be dangerous for a site showing a relatively small increase in soil strength with depth. Rapid additional penetration of the footing will then take place. Estimation of environmental loads typically relies on statistical data or probability (for example 50-year recurrence interval) for a specific geographic region. A limited accuracy applies. The conventional structural model for calculation of footing loads considers the footing to behave as a pin joint with no rotational restraint. Duration and Frequency of Load Jack-up preloading results provide guidance for assessment of footing behaviour during the time the jack-up is at the selected location. However, long-term soil bearing capacity may be less than short-term preloading bearing capacity. For example, silts may show lower soil resistance for long-term (drained) conditions than for short-term (undrained) conditions. A further consideration is cyclic loading imposed by wind, waves and current. Cyclic loads may cause progressive accumulation of soil strain and loss of strength. This may be exacerbated by dynamic loads transmitted by, for example, drilling machinery. Inclined Load Significant non-vertical forces on the footing usually occur during storm conditions. Introduction of a horizontal force on the footing will reduce the vertical bearing capacity. Scour Footing response problems may arise due to seabed scour around a footing. Scour will reduce the bearing area and embedment, both of which reduce footing bearing capacity. A footing will then settle until greater contact area or greater bearing capacity is again adequate to support the footing loads. Seabed scour may occur in sandy soils with high current velocities at seabed. SITE INVESTIGATION Site investigation requirements presume the application of SNAME (2002) ‘Recommended Practice for Site Specific Assessment of Mobile Jack-up Units’. This practice includes data acquisition and analysis of (1) shallow geophysical data, (2) geological data (usually desk study), and (3) geotechnical (ground) data. The acquisition and preliminary analysis of shallow geophysical data and geological data are common activities included in a site selection phase. This phase precedes the geotechnical data phase. Common requirements for the acquisition of the geotechnical ground data are as follows: - assessment of operational hazards/limitations for on-site activities on the basis of records of earlier
activities at the site and site selection data - borehole/test location(s) within 25 m of proposed footing location - minimum of one test location with a depth of at least: a) equivalent diameter of the spudcan footing plus
the expected penetration: b) criteria provided by platform insurers - maximum untested borehole section of typically less than 1.5 m
JACK-UP PLATFORM
FEBV/CDE/APP/015 Page 3 of 5
© F
ugro
199
5-20
07
ISSU
E 10
- geotechnical laboratory testing of recovered samples - monitoring of on-site data acquisition, assessment of adequacy and implementation of adjustments if
necessary. Other data acquisition and analysis may be necessary in case of specific geohazards and other difficult site conditions. Common practice is to perform geotechnical data acquisition before jack-up re-location. Some operations may demand immediate geotechnical information. The MODU itself serves as working platform. The Fugro service concept for this situation relies on team-up with the rig operator. The MODU is on location at the time of these activities, but not yet jacked to operational height. The standard of data quality is usually less than for “advance” operations using a dedicated arrangement for geotechnical data acquisition. Reduced data quality implies increased uncertainty about ground conditions. This can affect the safety and economics of the intended operations (Geer et al., 2000). GEOTECHNICAL ANALYSIS The following sections provide background information about selected geotechnical analysis procedures for footing response during preloading and inclined loading. General Ground Model Geotechnical analysis requires development of a general ground model. Steps include: - stratigraphic model developed from general integration of geology, engineering geophysical data and
ground investigation data, where feasible - correlation of laboratory and in-situ test data, as available - selection of geotechnical parameter values per stratum: (1) undrained shear strength of fine-grained soil,
(2) relative density of coarse-grained soil, (3) cementation or strength of cemented soil or rock, as applicable.
Preloading Analysis The conventional procedure for leg penetration analysis is to estimate ultimate bearing capacities of a jack-up footing at various depths below seabed. A typical result consists of a diagram showing soil resistance versus penetration. The diagram usually includes important footing dimensions. Leg penetration analysis assumes a rigid-plastic soil model (limit analysis). Closed-form solutions for this type of soil model are available only for special cases. One of these special cases is an infinitely long, vertically loaded strip footing on the surface of a uniform soil. Various adjustments are necessary to take account of factors such as soil layering, footing shape, and inclined and cyclic loading conditions. Guidance in this regard is available from the results of field measurements, model tests and theoretical analyses. Characteristics of a common model for preloading conditions are as follows: - monotonic and axial loading - stratigraphic profile, including allowance for scour on the basis of specified requirements or on the basis
of a general assessment of ground conditions only - bearing capacity factors, depth factors and footing shape factors for a single-layer soil model
(Skempton,1951; Vesic, 1975; API, 2000) - undrained soil squeezing failure for a two-layer soil model (Brown and Meyerhof, 1969) - punch-through failure for a two-layer soil model based on load spread assumptions (Young et al., 1984) - footprint collapse failure for a single-layer cohesive soil model (Meyerhof, 1972). Program JURIG (Goedemoed and Kolk, 1994) incorporates this soil model. Input parameters for the soil model include drained or undrained soil strengths. Parameter value selection considers a "best-estimate” and “cautious” interpretation of soil conditions. The soil parameter values may not be appropriate for use in other types of analysis.

JACK-UP PLATFORM
Page 4 of 5 FEBV/CDE/APP/015
© F
ugro
199
5-20
07
ISSU
E 10
Inclined Loading Analysis The ultimate vertical bearing capacity of a jack-up footing reduces with lateral loading. The results of inclined loading analysis help to assess the lateral soil resistance as a function of vertical load. A typical result consists of a graphical V-H interaction diagram. This diagram shows vertical bearing capacity versus horizontal load. The values apply to a selected vertical load and footing penetration only. Characteristics of a common model for V-H analysis are as follows: - single-layer soil model with rigid-plastic soil behaviour, as for leg penetration analysis - static loading - pinned footing support and application of conventional inclination factors for shallow footings with centric
loading (Brinch-Hansen, 1970; Det Norske Veritas, 1992; Vesic, 1975; API, 2000). This implies ignoring any passive soil resistance on inclined or vertical footing surfaces.
Program VH (Fugro, 1990) incorporates the VH model. Special analyses for fully embedded spudcans or closed legs may incorporate a contribution from passive soil resistance. Finite Element Analysis Finite Element analysis can take better account of factors such as soil layering, spudcan shape and soil drainage. Situations recommended for finite element analysis include: - conventional design method is probably unduly conservative (for example pinned footing support) - foundation design may benefit from a more thorough analysis (for example to predict displacement within
a soil mass or to estimate footing stiffness) - soil conditions are complex (for example, layered soils and calcareous soils) - loading conditions are unusual. A suite of finite element programs is available for 2-D and 3-D modelling. Some programs allow non-linear soil models and soil drainage options. Applications include: - spudcan-pile interaction (Van der Zwaag and Van Seters, 1988) - spudcan-footprint interaction - V-H diagrams for conical footings (Fugro, 1987) - skirt stress estimation. REFERENCES API American Petroleum Institute (2000), "Recommended Practice for Planning, Designing and Constructing Fixed Offshore Platforms - Working Stress Design", API Recommended Practice 2A-WSD (RP 2A-WSD), 21st Edition. (With Errata and Supplement 1, December 2002). Brinch Hansen, J. (1970), “A Revised and Extended Formula for Bearing Capacity”, The Danish Geotechnical Institute Bulletin, No. 28, pp. 5-11. Brown, J.D. and Meyerhof, G.G. (1969), “Experimental Study of Bearing Capacity in Layered Clays”, in Proceedings of the Seventh International Conference on Soil Mechanics and Foundation Engineering, Mexico, 1969, Vol. 2, Sociedad Mexicana de Mecánica de Suelos, Mexico, pp. 45-51. DNV Det Norske Veritas (1992), “Foundations”, Classification Notes No. 30.4, Section 8, pp. 44-51. Fugro (1987), "Foundation Fixity of Jack-up Units", Report of Joint Industry Study organised by Nobel Denton and Associates Ltd., London. Fugro (1990), "VH, Computer Program for the Calculation of V-H Relation for Spudcan Foundations”. Geer, D.A., Devoy, S.D. and Rapoport, V. (2000), “Effects of Soil Information on Economics of Jack-up Installation”, Offshore Technology Conference, 1-4 May 2000, Houston, Texas, U.S.A., OTC Paper 12080.
JACK-UP PLATFORM
FEBV/CDE/APP/015 Page 5 of 5
© F
ugro
199
5-20
07
ISSU
E 10
Goedemoed, S.S. and Kolk, H.J. (1994), "JURIG3 - A Computer Program for Jack-up Rig Leg Penetration Analyses”, in Proceedings Thirteenth International Conference on Soil Mechanics and Foundation Engineering, New Delhi, 5-10 January, 1994, Vol. 4, Oxford & IBH Publishing, New Delhi, pp. 1433-1436. Kolk, H.J. and Legein, J.J.D. (1994), “Punch-through Failure of Independent Jack-up Rig Legs”, in Siriwardane, H.J. and Zaman, M.M. (Eds.), Computer Methods and Advances in Geomechanics: Proceedings of the Eighth International Conference on Computer Methods and Advances in Geomechanics, Morgantown, West Virginia, USA, 22-28 May 1994, Vol. 2, A.A. Balkema, Rotterdam, pp. 1745-1750. Meyerhof, G.G. (1972), “Stability of Slurry Trench Cuts in Saturated Clay”, in Proceedings of the Specialty Conference on Performance of Earth and Earth-supported Structures, June 11-14, 1972, Lafayette, Indiana, Vol. I, Pt. 2, American Society of Civil Engineers, New York, pp. 1451-1466. Osbourne, J.J. and Paisley, J.M. (2002), “S E Asia Jack-up Punch-throughs: the Way Forward?”, in Cook, M. et al. (Eds.), Offshore Site Investigation and Geotechnics: 'Diversity and Sustainability': Proceedings of an International Conference Held in London, UK, 26-28 November 2002, Society for Underwater Technology, London, pp. 301-306. Reardon, M.J. (1986), “Review of the Geotechnical Aspects of Jack-up Unit Operations”, Ground Engineering, Vol. 19, No. 7, pp. 21-26. Skempton, A.W. (1951), “The Bearing Capacity of Clays”, in Building Research: 1st International Congress, London, Sept. 1951: Papers Division 1 and 2, pp. 180-189. SNAME Society of Naval Architects and Marine Engineers (2002), “Recommended Practice for Site Specific Assessment of Mobile Jack-up Units”, First Edition, Revision 2, Technical & Research Bulletin, 5-5A. Van der Zwaag, G.L. and Van Seters, A.J. (1988), “Seabed Movements and Their Effect on Offshore Structures”, in Kolkman, P.A., Lindenberg, J. and Pilarczyk, K.W. (Eds.), Modelling Soil-Water-Structure Interactions SOWAS 88: Proceedings of the International Symposium on Modelling Soil-Water-Structure Interactions, Delft, 29 August-2 September 1988, A.A. Balkema, Rotterdam, pp. 43-53. Vesic, A.S. (1975), “Bearing Capacity of Shallow Foundations”, in Winterkorn, H.F. and Fang, H.Y. (Eds.), Foundation Engineering Handbook, Van Nostrand Reinhold Company, New York, pp. 121-147. Young, A.G., Remmes, B.D. and Meyer, B.J. (1984), “Foundation Performance of Offshore Jack-up Drilling Rigs”, Journal of Geotechnical Engineering, Vol. 110, No. 7, pp. 841-859.