geotechnical report - nevada
TRANSCRIPT
GEOTECHNICAL REPORT
Bridge B-1610 Replacement
Nordyke Road, near Yerington, NV
June 2015


TABLE OF CONTENTS
1.0 INTRODUCTION..........................................................................................................................1
1.1 Project Location and Purpose...........................................................................................................1
1.2 Project Description........................................................................................................................ 2-3
2.0 SCOPE OF WORK AND REPORT LIMITATIONS................................................................ 4
3.0 GEOLOGIC CONDITIONS AND SEISMICITY...................................................................... 5
3.1 Local Site Geology…………………………………………………………………………….…. 5
3.2 Geologic Setting…………………………………………………………………………………..5-6
3.3 Site Classification and Seismic Parameters………………………………………………………6-8
4.0 FIELD INVESTIGATION.............................................................................................................9
4.1 Geophysical Site Investigation…………………………………………………………………...9-10
4.2 Exploratory Boreholes………………………………………………………………………….…11
5.0 LABORATORY ANALYSIS........................................................................................................12
6.0 SITE CONDITIONS AND DISCUSSION...................................................................................13
6.1 General Discussion……………………………………………………………………………. 13-16
6.2 Geologic Hazards……………………………………………………………………………… 17-18
6.3 Construction Considerations…………………………………………………..…………………. 18
7.0 FOUNDATION RECOMMENDATIONS ................................................................................. 19
7.1 General …………………………………………………………...……………………………… 19
7.2 Foundation Loads…………………………………………………………………………………..20
7.3 Driven Pile Design Recommendations.………………………………………………………… 21-30
8.0 REFERENCES…………………………………………………………………………………..31
APPENDICES
APPENDIX A....................................................................................Boring Logs
APPENDIX B……………………………………………………… Laboratory Testing Results
APPENDIX C……………………………………………………….Geophysical Test Results
APPENDIX D……………………………………………………….Seismic Design References
APPENDIX E………………………………………………………..Pile Driving Analysis
ii

B-1610 Bridge Replacement June 2015 Nordyke Road EA73762
1.0 Introduction
1.1 Project Location and Purpose
The Nevada Department of Transportation
(NDOT), in cooperation with Lyon County, will
be replacing substandard structure, B-1610, on
Nordyke Road south of Yerington, Nevada in
Township 12 North, Range 25 East, Section 22.
This structure crosses the East fork of the Walker
River roughly 6.7 miles south of Yerington, NV,
east of State Route (SR) 339 and west of SR208.
Nordyke Road is a county maintained, unpaved
road, running east to west, providing access to
local residences, agricultural land, as well as
between SR339 and SR208. Nordyke Road
crosses both the east fork and west fork of the
Walker River. The potential detour for B-1610, in the case of closure, is roughly 12 miles (Scour POA,
2010).
Figure 2: Location Map: B-1610
Figure 1: Location Map: B-1610
1
B-1610 Bridge Replacement June 2015 Nordyke Road EA73762
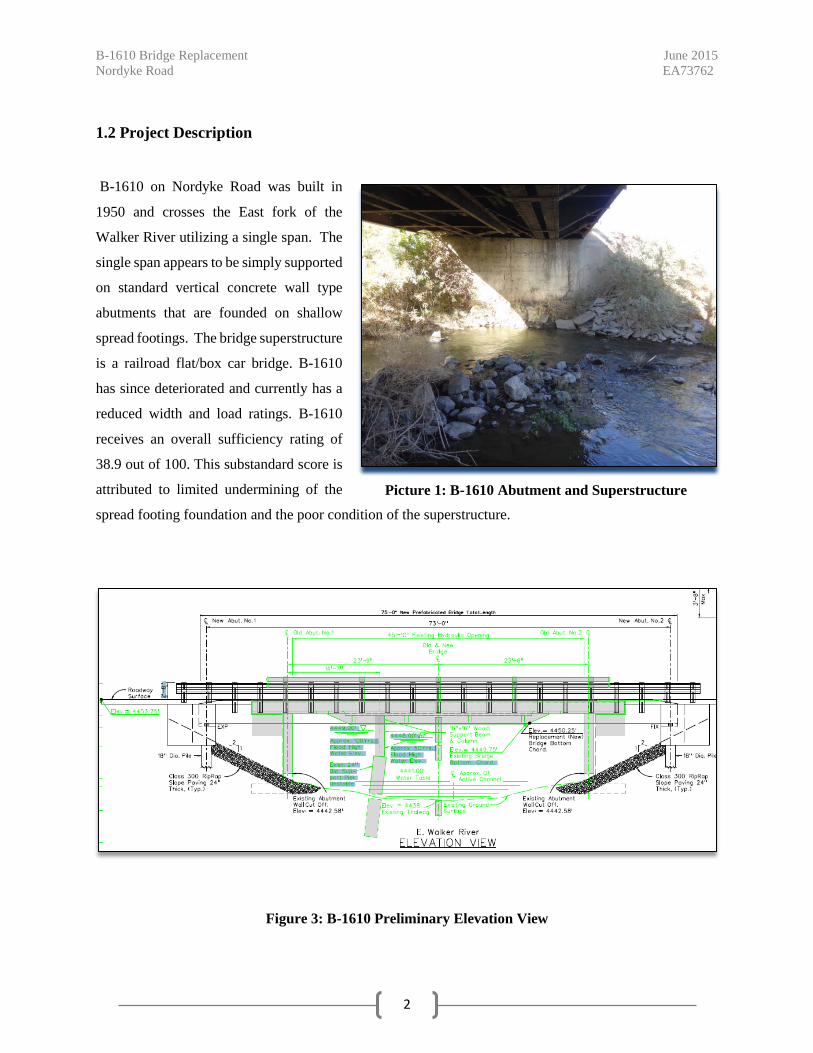
1.2 Project Description
B-1610 on Nordyke Road was built in
1950 and crosses the East fork of the
Walker River utilizing a single span. The
single span appears to be simply supported
on standard vertical concrete wall type
abutments that are founded on shallow
spread footings. The bridge superstructure
is a railroad flat/box car bridge. B-1610
has since deteriorated and currently has a
reduced width and load ratings. B-1610
receives an overall sufficiency rating of
38.9 out of 100. This substandard score is
attributed to limited undermining of the
spread footing foundation and the poor condition of the superstructure.
Figure 3: B-1610 Preliminary Elevation View
Picture 1: B-1610 Abutment and Superstructure
2
B-1610 Bridge Replacement June 2015 Nordyke Road EA73762
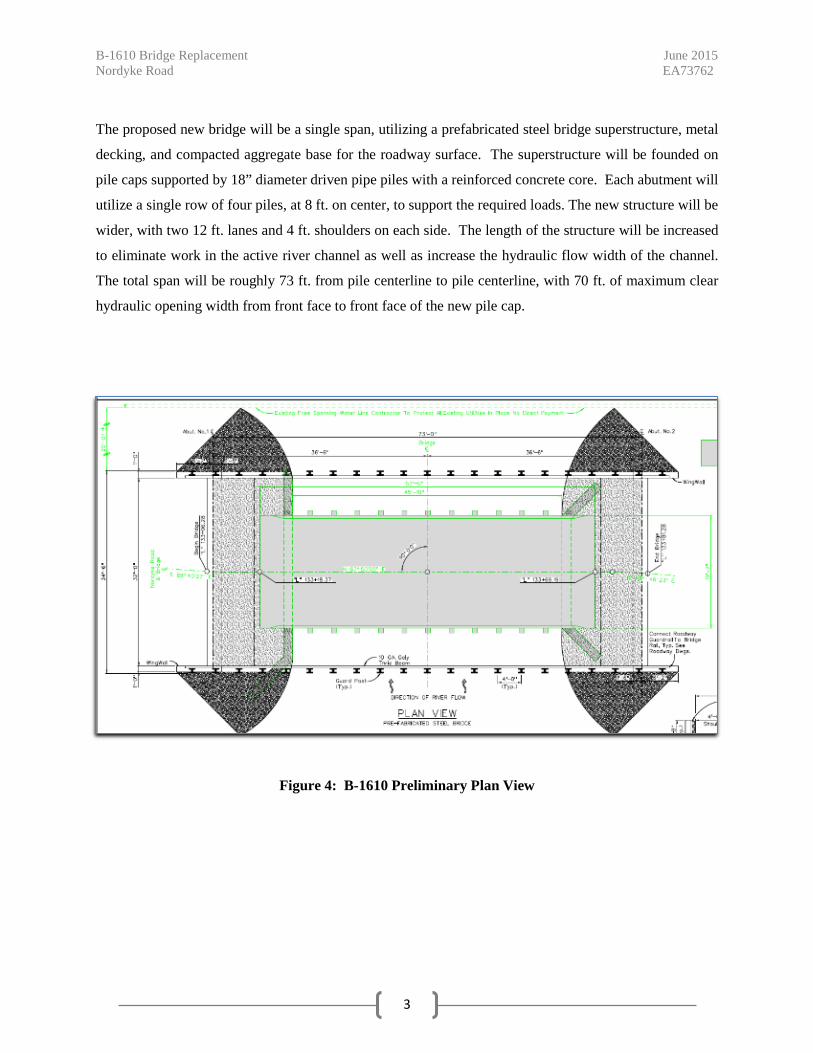
The proposed new bridge will be a single span, utilizing a prefabricated steel bridge superstructure, metal
decking, and compacted aggregate base for the roadway surface. The superstructure will be founded on
pile caps supported by 18” diameter driven pipe piles with a reinforced concrete core. Each abutment will
utilize a single row of four piles, at 8 ft. on center, to support the required loads. The new structure will be
wider, with two 12 ft. lanes and 4 ft. shoulders on each side. The length of the structure will be increased
to eliminate work in the active river channel as well as increase the hydraulic flow width of the channel.
The total span will be roughly 73 ft. from pile centerline to pile centerline, with 70 ft. of maximum clear
hydraulic opening width from front face to front face of the new pile cap.
Figure 4: B-1610 Preliminary Plan View
3

B-1610 Bridge Replacement June 2015 Nordyke Road EA73762
2.0 Scope of Work and Report Limitations
2.1 Scope of Work
The purpose of this geotechnical investigation was to determine the subsurface soil and groundwater
conditions, evaluate the feasibility of the proposed foundation type, provide recommended geotechnical
design values, and identify potential risk factors for construction. The actual scope of work completed for
this report was a review of published maps and reports, two subsurface exploratory borings, a geophysical
survey, laboratory soil testing, geotechnical engineering analysis, design, and documentation of the
findings.
The report appendices contain supporting documents including the boring logs, laboratory test summaries,
the results of geophysical testing, and preliminary calculations.
2.2 Limitations
This report follows the guidelines of generally accepted geotechnical practice. The Geotechnical Report is
based on field observations of the project Geotechnical Engineer, a summary of the subsurface exploration,
and the results of laboratory testing of collected soil samples. The report is based on our interpretations of
the findings in the two exploratory borings and other subsurface investigation methods. Therefore, this
report may not quantify the exact natural variation of in-situ soils or depth to water. Depth to water can
vary based on overall weather patterns, seasonal variations, and local agricultural practice making it
difficult to predict at any given time. Any additional analysis or interpretations of boring logs and other
test data, provided by third parties, are not the responsibility of the Department (NDOT). If conditions are
encountered during construction, which differ from those found in this report, or if the scope of construction
is significantly changed, the Geotechnical Section should be notified to provide additional
recommendations.
This report was prepared based on data available in May 2015. Any changes in project scope or timeline
may invalidate some of the assumptions or conclusions of this report.
4

B-1610 Bridge Replacement June 2015 Nordyke Road EA73762
3.0 Geologic Conditions and Seismicity
3.1 Local Site Geology
B-1610 is mapped in the geologic
unit, Qpl, Playa, Lakebed and
Floodplain deposits, which are likely
deposited in this area as Walker River
flood plain deposits, as well as lake
bed deposits from the maximum
extents of pre-late Pleistocene Lake
Lahontan. United States Department
of Agriculture Web Soil Survey
(USDA-WSS) places surface soils in
292-Fallon Fine sandy loam (SM) and
264-Dithod Loam, Saline-alkali (CL),
which matches field observations and
geologic mapping. Historic aerial
imagery indicates the possible
presence of old channel meanders which may cause variability in soil strata near the surface both laterally
and vertically.
3.2 Geologic Setting: Seismicity and Faulting
Geologic Setting
This project is generally located near the western boundary of the Basin and Range Province, which covers
the majority of the State of Nevada. The Basin and Range province is generally composed of north trending
mountain ranges separated by alluvial, normal-fault bounded basins. Regionally, the project falls on
alluvial and flood plain deposits to the East of the North trending Singatese Mountain Range.
Figure 5: Geologic Map
5

B-1610 Bridge Replacement June 2015 Nordyke Road EA73762
Seismicity and Faulting
The seismicity of Nevada varies greatly depending on the location within the state. Nevada includes all
four seismic zones specified in the AASHTO LRFD Specifications. There are several faults located in the
Mason and Smith valley area. However, the primary contributing fault is the Singatse Fault line. This fault
line is capable of producing relatively substantial ground motions. The Singatse Range fault zone is a
predominately north-striking normal fault zone along the east side of the Singatse Range.
The fault is continuous from near Wilson Hot
Springs north along west edge of Mason Valley
to west of Yerington and continues
discontinuously to the north end of the range.
Maps show Quaternary alluvium generally in
fault contact along the Singatse Range fault
zone, with over 450m of Quaternary alluvium
adjacent to the fault (Proffett and Dilles,1984).
The Singatse Range is a west-tilted mountain
block that probably began tilting in the
Miocene epoch (Stewart, 1978). Westward
tilting of Mason Valley, related to down-to-the-
east faulting along the Singatese Range fault
zone, may be ongoing because the Walker
River flows on the extreme west side of its Holocene flood plain and Quaternary alluvium is westward-
tilted adjacent to range front faults (Proffett and Dilles, 1984). The fault has an East dip of 50 degrees and
a strike of North 4 degrees West. There have been no studies to predict most recent rupture, magnitude,
reoccurrence interval, or slip rate.
3.3 Site Classification and Seismic Parameters
The seismic provisions of the AASHTO LRFD Specifications Article 3.10 are applied to bridge design in
Nevada. Earthquake force effects were determined in accordance with LRFD Article 3.10. Seismic
coefficients from the AASHTO LRFD Specifications used for design must meet or exceed the minimum
seismic coefficients shown in Figure 12.3-H of the NDOT Structures Manual unless otherwise approved by
the Chief Structures Engineer (NDOT Structures Manual, pg. 12-21).
Figure 6: Singatese Range Fault Map
6

B-1610 Bridge Replacement June 2015 Nordyke Road EA73762
AASHTO 3.10.1 recommends selecting your Peak Ground Acceleration (PGA) based on the Horizontal
Peak Ground acceleration coefficient with seven percent probability of exceedance in 75 years (Approx.
1000 year return period). The PGA and short and long period response spectral accelerations Ss and S1 for
the site were obtained using the United States Geological Survey (USGS) Design Maps Tool. For the
project site, AASHTO recommends a PGA of 0.371g, from figure 3.4.1-2, as shown in Appendix D. This
value is lower than the required minimum PGA of 0.40g from the NDOT structures manual Table 12.3-H.
Therefore, a minimum design PGA of 0.40 g should be used. These seismic design parameters are based
on Site Class B and adjustments should be made for other site classes, as needed, as shown in AASHTO
3.4.2.3.
General Seismic Design Parameters
Lyon County (Based on NDOT Structures Policy)
PGA (g) SS (g) S1 (g)
0.40 1.0 .40
Table 1: General Seismic Design Parameters for Lyon County, Nevada
The Site Class for the project location is Site Class D, in accordance with Table 3.10.3.1-1 of AASHTO
Guide Specifications for LRFD Bridge Design, based on the average shear wave velocity of the upper 100
ft. (Vs100). The average shear wave velocity was obtained utilizing Refraction MicroTremor (ReMiTM)
geophysical testing methods as discussed further below in Field Investigation.
Nordyke Road B-1610 Site Classification (Vs100) Average Shear Wave Velocity by ReMiTM Method
Seismic Line Average Shear Wave Velocity Vs100 (ft/s) Site Class
Seismic Line #1 902 Site Class D
Seismic Line #2 1007 Site Class D
Table 2: Site Classification Surface Shear Wave Velocity Measurements
7

B-1610 Bridge Replacement June 2015 Nordyke Road EA73762
The general Lyon County, NV seismic design parameters must be modified from Site Class B to Site Class
D. The final design spectrum is shown below:
• AASHTO Seismic Design Category (SDC) D and Seismic Zone 4 (AASHTO Table 3.10.6-1)
• Seismic analysis is not required for single-span bridges regardless of seismic zone
(AASHTO 4.7.4.2)
• Superstructure connections and minimum support lengths requirements shall be satisfied.
(AASHTO 3.10.9 and 4.7.4.4.)
California Department of Transportation Acceleration Response Spectra Design tool (CALTRANS-ARS)
was also used to verify the estimated Spectral Acceleration. Both the deterministic and probabilistic
response spectrums were plotted. The results from the CALTRANS ARS tool can be found in Appendix
D. CALTRANS ARS is valid for locations within 50 miles of the California state border.
0.000
0.200
0.400
0.600
0.800
1.000
1.200
0.000 0.500 1.000 1.500 2.000 2.500 3.000
Spec
tral
Acc
eler
atio
n, S
a (g
)
Period, T (seconds)
Design Response Spectrum For Nordyke Road B-1610 (Site Class D)
Site Class D : As=.44g, SDS=1.10g, SD1=.640g
Figure 7: B-1610 Design Response Spectrum
8

B-1610 Bridge Replacement June 2015 Nordyke Road EA73762
4.0 Field Investigation
• Site Reconnaissance
• Geophysical Site Investigation
• Two Exploratory Boreholes
4.1 Geophysical Site Investigation
In two locations, one east of the existing
structure and one west, seismic arrays
were used to collect noise data using a
240 ft. spread cable with 12 - 10Hz. p-
wave geophones. The noise data was
processed using Refraction Microtremor
(ReMiTM) analysis to obtain Vs100 for the
seismic site classification as well as
identify any distinct subsurface shear wave velocity, VS, trends prior to drilling.
Seismic Data Collection
For this survey, geophones were spaced 20 ft. apart for all lines. Background (ambient) noise was used to
generate seismic waves during the ReMiTM survey. Occasionally, light hammer strikes offset from the end
of the seismic line were utilized to increase the high frequency energy during noise recordings. This process
can aid interpretation of subsurface shear wave velocity at shallow depths. Occasionally, walking and other
light disturbances can be used to increase the amplitude of noise energy over a variety of frequencies when
working in quiet environments. Noise recordings for ReMiTM analysis were 30 second recording periods
with a 2ms sampling interval. Each individual record is stored in SEG-Y format. In general, 10 individual
noise recordings are made for each line. Individual records are not stacked or modified until final
processing.
Figure 8: Field Investigation Map
9

B-1610 Bridge Replacement June 2015 Nordyke Road EA73762
ReMiTM Seismic Data Analysis
The analysis and interpretation of the seismic data collected for this project was performed by a consultant,
Optim of Reno, NV. The field exploration, noise data acquisition, location survey, and preliminary data
verification was performed by Geotechnical Staff at NDOT.
The noise data collected for ReMiTM
analysis was analyzed using the
proprietary software SeisOpt ReMiTM,
developed by Optim of Reno, NV. The
analysis and interpretation of the data is
a proprietary method owned and
developed by the University of Nevada,
Reno. The process is currently licensed
exclusively to Optim of Reno, NV
(Optim Software, 2014).
The process uses ambient noise energy
to produce surface wave data, more
specifically Rayleigh waves. The
Rayleigh wave noise data is converted from time domain to frequency domain using wavefield
transformation techniques. This process produces a slowness-frequency spectral image. This image is used
to select a “fundamental mode” dispersion curve that represents the minimum phase velocity of the
Rayleigh wave energy (Optim Software, 2014).
A forward modeling process is then used to produce a shear wave velocity profile that would create the
given dispersion curve. This process can involve some individual interpretation and judgment. Other data,
such as seismic refraction and soil boring logs can be used to further constrain the shear wave velocity
model and improve the reliability of the interpretation. However, this methodology has been shown to
produce accurate average shear wave velocity in the upper 100 ft. (Vs100ft) values as well as reasonable
estimations of shear wave velocities of individual layers at depth.
Picture 2: Seismic Line #1 Layout
10

B-1610 Bridge Replacement June 2015 Nordyke Road EA73762
4.2 Exploratory Borings
The Geotechnical section at NDOT performed a subsurface investigation at the project site in May of 2014.
The subsurface exploration consisted of two exploratory borings drilled with a Deidrich D-120 truck
mounted drilling rig (NDOT Unit #1082.) NLB-1/1A was drilled to the west of the structure, offset 6 ft.
right of proposed roadway centerline. Borehole NLB-1/1A was drilled to a depth of 41.5 ft. utilizing a
combination of 6 in. Hollow Stem Auger (H.S.A) and rotary wash boring methods with a 3.5 in. tri-cone
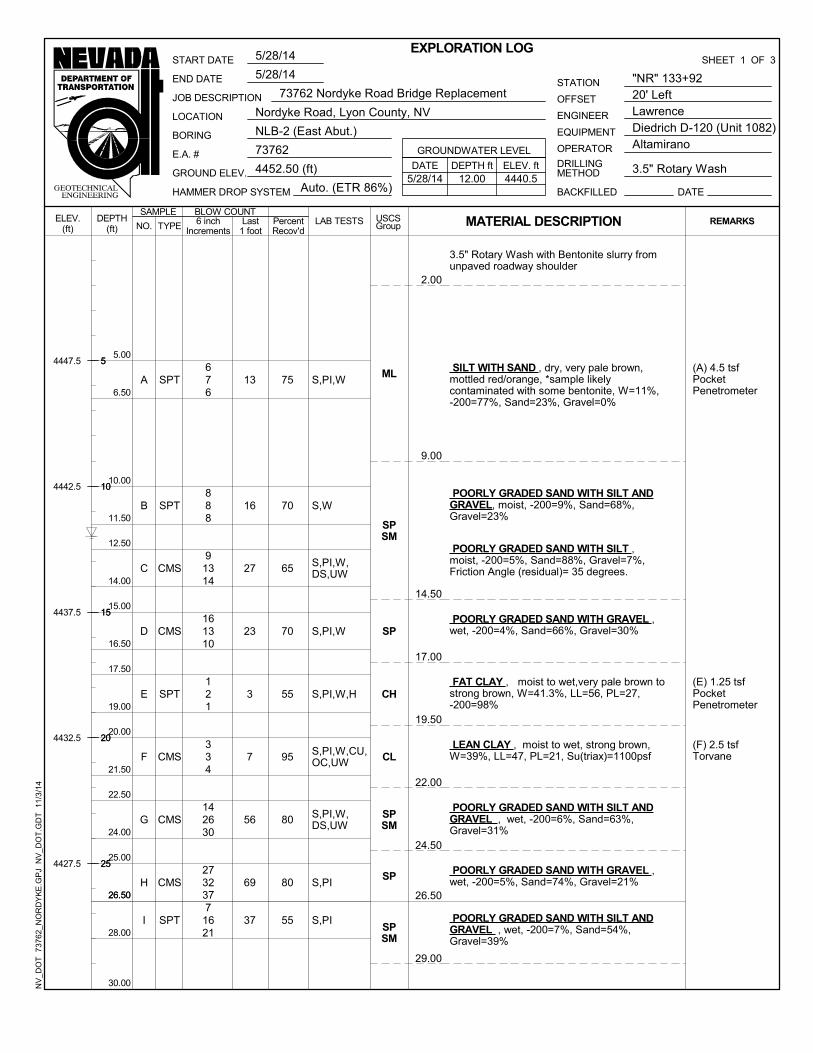
bit and Bentonite mineral slurry. Borehole NLB-2 was drilled to the East of the existing structure, offset 20
ft. left from the proposed roadway centerline. NLB-2 was drilled to a depth of 62.0 ft. using rotary wash
boring methods with a 3.5 in. tri-cone bit and Bentonite mineral slurry. A map showing the location of the
borings can be found in Figure 8.
Soil samples and standard penetration resistance values (N-values) were obtained utilizing the Standard
Penetration Test (SPT) as set forth in ASTM D1586 or AASHTO T206. This test was performed with a
sampler driven 18 inches (unless otherwise noted in logs) into the bottom of the boring using a 30 in. drop
of a 140 lb. hammer. Soil samples were collected using a Standard Penetration Test Sampler (SPT Sampler)
and ring-lined Modified California Sampler (CMS) (ASTM D3550).The uncorrected blow counts are
shown on the boring logs in Appendix A. These blow counts have not been corrected for energy, sampler
type, rod length, or hammer type. The energy transfer ratio for NDOT Unit 1082 is ETR=86%. Field CMS
blow counts can be converted to field SPT bow counts by multiplying the field CMS blow counts by a
factor of 0.62. All soil samples were classified, both visually and using laboratory testing data, using the
Unified Soil Classification System (USCS) described in ASTM test numbers D2487 and D2488.
Groundwater table location was noted in each exploratory borehole.
Borehole Depth Method Location Depth to Free
Water
NLB-1/1A 41.5 ft. H.S.A/Rotary Wash “NR” 132+90 Off. 6ft. Rt. 12 ft.
NLB-2 62.0 ft. Rotary Wash “NR” 133+92 Off. 20ft. Lt. 12 ft.
Table 3: Exploratory Borings
11

B-1610 Bridge Replacement June 2015 Nordyke Road EA73762
5.0 Laboratory Analysis
Laboratory tests were performed by the Department on the soil samples collected from the boreholes at the
proposed foundation locations. The testing program consisted of index value tests including sieve analysis,
hydrometer, moisture content, unit weight, and Atterberg limits. Multiple samples were also tested for
strength parameters using Direct Shear (ASTM D3080/ T236) and Consolidated/Undrained (CU) Tri-axial
testing with pore water pressure (PWP) measurements (ASTM D4767). Consolidation properties of
cohesive soils were tested using 1-D Odeometer testing (ASTM D2435).
The laboratory soils analysis program tested 14 samples from NLB-1/1A and 13 samples from NLB-2 for
index properties. The strength and consolidation testing program included two direct shear tests, two
consolidated-undrained (CU) triaxial tests with pore water pressure measurements, and five 1-D
consolidation tests. The samples tested for strength and consolidation properties were collected using a
hammer driven ring-lined Modified California sampler to obtain a relatively undisturbed sample. The test
results can be found in Appendix B.
Table 4: Laboratory Test Summary
Geotechnical Laboratory Tests (Number of Tests Performed)
Index Property Tests Strength and Consolidation
Tests
Borehole Moisture
Content
Atterberg
Limits
Sieve
Analysis Hydrometer
Triaxial
(CU)
Direct
Shear
1-D
Consolidation
NLB-1/1A 23 21 23 5 1 1 5
NLB-2 10 14 17 2 1 1 2
Total 33 35 40 7 2 2 7
12

B-1610 Bridge Replacement June 2015 Nordyke Road EA73762
6.0 Site Conditions and Discussion
6.1 General Discussion
Nordyke Road is an unpaved
roadway with primarily
agricultural use adjacent to either
side of the roadway. Water was
flowing in the east fork of the
Walker River both in October
2013 and May 2014 during the site
visit and exploratory borings.
Historic flow rates and other
hydraulic data can be obtained
from USGS or by contacting the
NDOT Hydraulics section.
Free water was encountered roughly 12 ft. below top of the borehole elevation in both boreholes. This
results in a water table elevation of around 4441 ft. as of May 2014. The groundwater table and stream
water flow are expected to fluctuate based on the season, recent weather conditions, agricultural use, and
overall watershed status. Numerous groundwater wells, monitoring wells, and stream flow gages exist
throughout the Walker River valley. Data can be obtained through the State of Nevada Water Resources
website or USGS.
Aerial imagery indicates the possible presence of old channel meanders throughout the area indicating some
limited channel movement over its history. This could cause variability both laterally and vertically in the
subsurface soil profile. This variability makes defining exact soil classification boundaries difficult.
When considering the density of in-situ materials, both boreholes can be characterized in roughly three
idealized layers. However, some variability exists to the depths of each layer and the exact soil
classifications. A summary of this profile is discussed below, followed by more detailed analysis of each
borehole.
Picture 3: Looking Upstream at B-1610 (pipe in foreground)
13

B-1610 Bridge Replacement June 2015 Nordyke Road EA73762
The soils found in the upper 25 ft. of the profile in this location are generally variable with silts, lean to fat
clays, and fine sands, from dry to wet, soft or loose, to medium dense/stiff. Moisture contents were
also highly variable with cohesive soils both well below and above liquid limit. Both boreholes had a zone
of soft lean and/or fat clay, between 15 ft. and 21 ft. of depth with moisture contents near or above liquid
limit. Geophysical measurements indicate average shear wave velocities, VS, in this zone from 300-600
ft./s. Below approximately 25 ft., the soils transition to mostly granular/cohesionless materials and become
more coarse and dense. Geophysical measurements indicated a pronounced increase in VS from 25 ft. to 80
ft. with average measurements from 900-1200 ft./s. These soils are mostly found to be sands and gravels
with less than 10% passing the #200 sieve.
No soil samples were obtained using a split spoon sampler in either boring below 41.5 ft. due to borehole
caving and heaving sands. Borehole cuttings were screened and collected from 41.5 ft. to 62 ft. in borehole
NLB-2 indicating the presence of coarse sands and gravel from 41.5 ft. to 62.0 ft.
NLB-1/1A Borehole Field Summary
Generally, low density materials from 0 ft. - 25 ft., primarily lean clay, with some fat clays and a 2 ft. layer
of well graded sand. Average field blow count for this zone was less than 5 blows per foot. Samples F and
G, at depths of 15 ft. and 20 ft., both lean clays, had moisture contents above Liquid Limit. At roughly 26
ft. a significant change in soil and in density occurs with primarily sands and gravels with varying amounts
of fines. The average field blow count for this zone was 30 blows per foot. Bedrock was not encountered
in this borehole.
14

B-1610 Bridge Replacement June 2015 Nordyke Road EA73762
NLB-1/1A
• 0 ft. - ≈12 ft. : N60ave=5
Primarily dry to moist lean clay (CL)
• 12 ft. - ≈15 ft. : N60ave=14
Wet poorly graded sand (SP)
• 15 ft. - ≈26 ft. : N60ave=3.5
Wet mix of lean and fat clays with low
blow counts (CL, CH)
• 26 ft. - ≈60 ft. (est.): N60ave=46
wet mix of sands and gravels with low
fines content and increasing density
with depth.
NLB-2 Borehole Field summary
This borehole, similar to NLB-1/1A, had generally lower density in the upper ≈ 25 ft. However, this
borehole showed larger amounts of silts and sands in this zone with a higher density than the same elevation
in NLB-1/1A. The average field blow count for this zone was just under 15 blows per foot. The two
boreholes were nearly identical below roughly ≈ 25 ft. where a significant change in soil and density occurs
with primarily sands and gravels with varying levels of fines. The average field blow count for this zone
was nearly 50 blows per foot. Bedrock was not encountered in this borehole.
Picture 4: NLB-1-G, CL, LL=34, W=45%
15
B-1610 Bridge Replacement June 2015 Nordyke Road EA73762
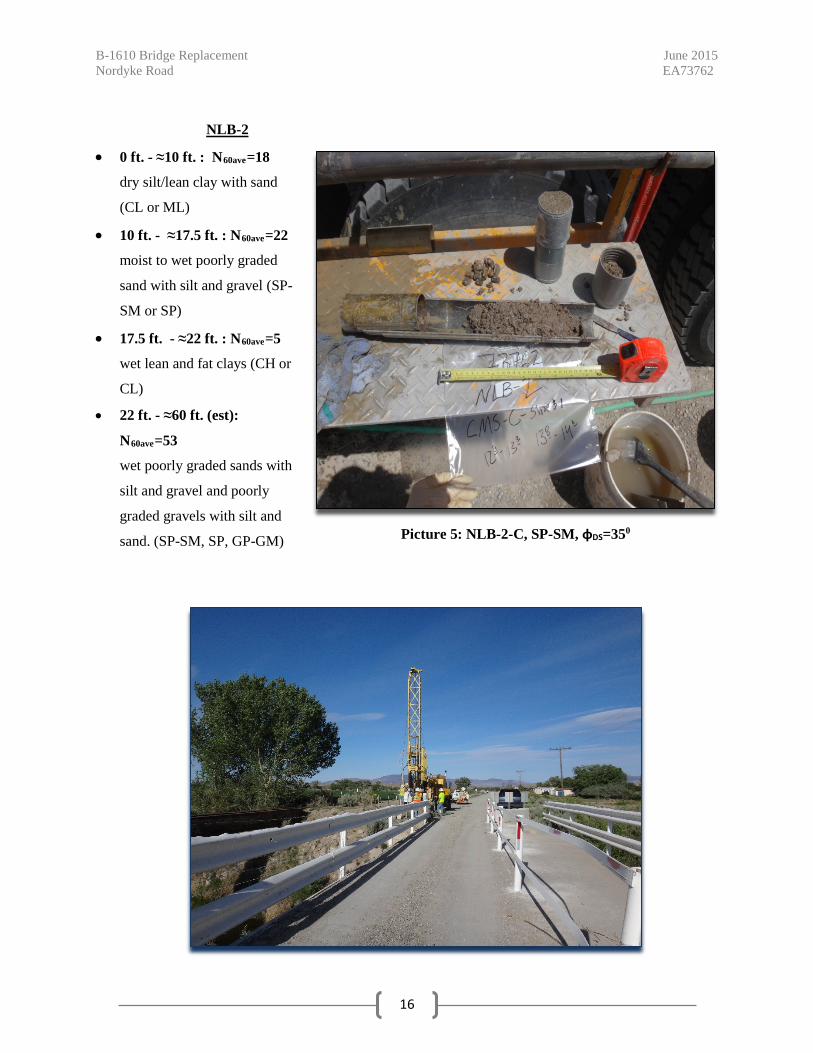
NLB-2
• 0 ft. - ≈10 ft. : N60ave=18
dry silt/lean clay with sand
(CL or ML)
• 10 ft. - ≈17.5 ft. : N60ave=22
moist to wet poorly graded
sand with silt and gravel (SP-
SM or SP)
• 17.5 ft. - ≈22 ft. : N60ave=5
wet lean and fat clays (CH or
CL)
• 22 ft. - ≈60 ft. (est):
N60ave=53
wet poorly graded sands with
silt and gravel and poorly
graded gravels with silt and
sand. (SP-SM, SP, GP-GM)
Picture 5: NLB-2-C, SP-SM, φDS=350
16
B-1610 Bridge Replacement June 2015 Nordyke Road EA73762
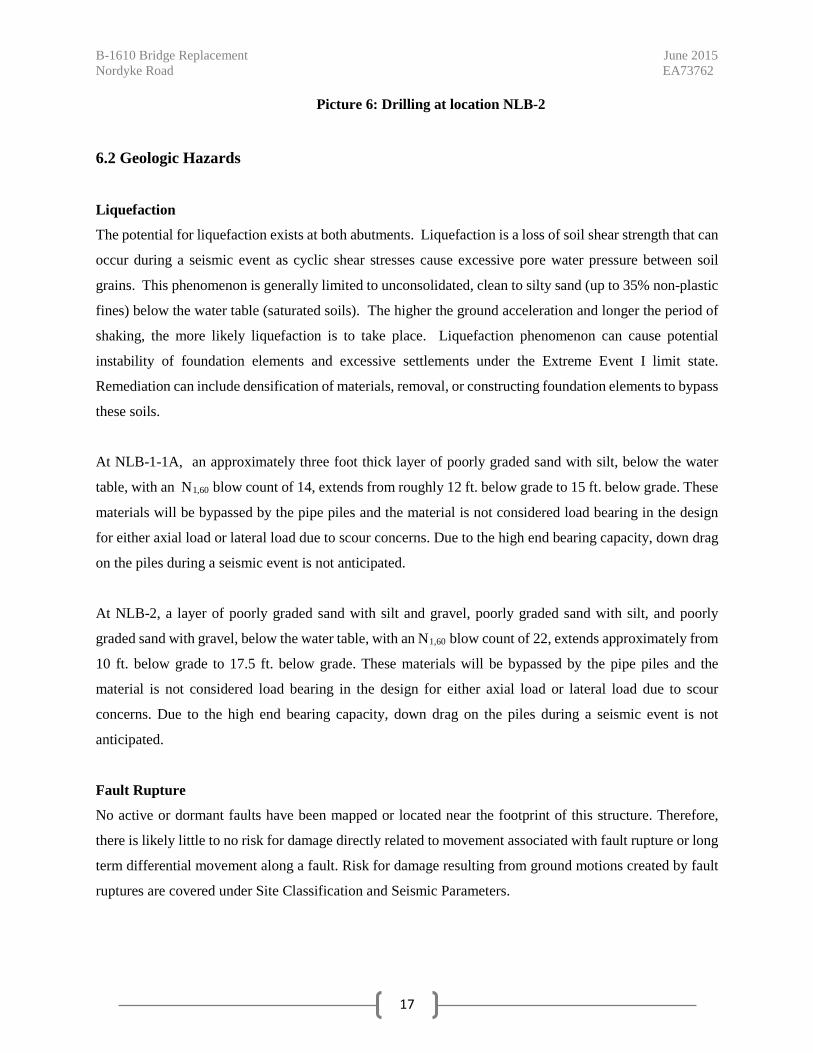
Picture 6: Drilling at location NLB-2
6.2 Geologic Hazards
Liquefaction
The potential for liquefaction exists at both abutments. Liquefaction is a loss of soil shear strength that can
occur during a seismic event as cyclic shear stresses cause excessive pore water pressure between soil
grains. This phenomenon is generally limited to unconsolidated, clean to silty sand (up to 35% non-plastic
fines) below the water table (saturated soils). The higher the ground acceleration and longer the period of
shaking, the more likely liquefaction is to take place. Liquefaction phenomenon can cause potential
instability of foundation elements and excessive settlements under the Extreme Event I limit state.
Remediation can include densification of materials, removal, or constructing foundation elements to bypass
these soils.
At NLB-1-1A, an approximately three foot thick layer of poorly graded sand with silt, below the water
table, with an N1,60 blow count of 14, extends from roughly 12 ft. below grade to 15 ft. below grade. These
materials will be bypassed by the pipe piles and the material is not considered load bearing in the design
for either axial load or lateral load due to scour concerns. Due to the high end bearing capacity, down drag
on the piles during a seismic event is not anticipated.
At NLB-2, a layer of poorly graded sand with silt and gravel, poorly graded sand with silt, and poorly
graded sand with gravel, below the water table, with an N1,60 blow count of 22, extends approximately from
10 ft. below grade to 17.5 ft. below grade. These materials will be bypassed by the pipe piles and the
material is not considered load bearing in the design for either axial load or lateral load due to scour
concerns. Due to the high end bearing capacity, down drag on the piles during a seismic event is not
anticipated.
Fault Rupture
No active or dormant faults have been mapped or located near the footprint of this structure. Therefore,
there is likely little to no risk for damage directly related to movement associated with fault rupture or long
term differential movement along a fault. Risk for damage resulting from ground motions created by fault
ruptures are covered under Site Classification and Seismic Parameters.
17

B-1610 Bridge Replacement June 2015 Nordyke Road EA73762
Flooding and Scour
The potential for flooding and bridge scour exists at this structure. High water will be maintained below
the bottom chord of the bridge superstructure during the 100 year event. No scour countermeasures are
proposed for this structure. The predicted total scour at the 100 yr. design event, including local abutment
scour and long term degradation, will be used to design the embedment of the pipe piles. A rip-rap
erosion control blanket will be placed around the new pile caps and wing walls.
6.3 Construction Considerations Excavation Soils encountered during the excavation process are anticipated to be of Type B and Type C based on
OSHA 1926 Subpart P App B. OSHA 1926 Subpart P App. B. requires sloping or benching for excavations
greater than 20 ft. deep be designed by a registered Professional Engineer. The design engineer should be
licensed to practice in the State of Nevada.
All excavation shall be performed in accordance with the NDOT 2014 Standard Specifications for Road
and Bridge Construction. The contractor shall be responsible for all necessary shoring for any excavation
and/or construction.
Cohesive soils with moisture contents near or above their Liquid Limit were encountered in both
exploratory boreholes. Sampler penetration occurred under the weight of the rods, prior to hammering,
indicating the presence of soils with low in-situ strengths. See boring logs for depth of soils encountered.
Utilities
Utilities exist in the proposed working area. The contractor is responsible for verifying the location of any
utilities and maintaining appropriate authorizations and protections to work in the vicinity of them.
18

B-1610 Bridge Replacement June 2015 Nordyke Road EA73762
7.0 Foundation Recommendations
7.1 General
We recommend a driven pipe pile foundation using closed end pipe piles with a conical or hemispherical
tip. The pipe piles should be 18 inches in diameter, have a nominal wall thickness of at least 0.5 inches,
and be constructed of Grade 3 steel with a minimum yield stress of fy >= 45 ksi.
The estimated pile lengths were determined based on bearing capacity graphs, lateral pile stability,
drivability analysis, and predicted scour calculations. The pipe piles must be driven to the required
minimum tip elevation to meet lateral stability requirements. Pre-auguring will NOT be permitted for the
installation of the piles.
This report provides the bending moment, shear, and deflection diagrams for the embedded piles under the
controlling event, Extreme Limit State Ia. The Structural Engineers need to verify that the structural
strength are in excess of the structural demands.
The proposed pile foundation arrangement by the Structural Engineers for B-1610 is as follows:
B-1610 Bridge Foundation Piles One pile row per abutment
ABUTMENT 1 4 piles per row
ABUTMENT 2 4 piles per row
Table 5: Bridge Foundation Pile Layout
The proposed bottom of the pile cap elevations are as follows:
Abutment 1: 4446.58 ft.
Abutment 2: 4446.58 ft.
19

B-1610 Bridge Replacement June 2015 Nordyke Road EA73762
7.2 Foundation Loads
The Structural Engineer provided the following foundation design loads:
Table 6: Service Loads per Pile from Structural Engineer
Table 7: Factored (Strength Limit State) Loads per pile from Structural Engineer
B-1610 Service Limit State Loads *Specified Loads are per pile
Support Axial Loads (kips)
ABUTMENT 1 140
ABUTMENT 2 140
B-1610 Strength Limit State Loads (Factored) *Specified loads are per pile
Support Axial Loads (kips)
ABUTMENT 1 204
ABUTMENT 2 204
B-1610 Extreme Event Load Combinations *Specified Loads are per pile
Support Axial (kips) Shear (kips) Moment (kip-ft.)
Long. Transverse Long. Transverse
ABUTMENT 1
Ext. Ia. 111 21 59
Ext. Ib. 115 24
Ext. II. 111
ABUTMENT 2
Ext. Ia. 111 21 59
Ext. Ib. 115 24
Ext. II. 111 1
20

B-1610 Bridge Replacement June 2015 Nordyke Road EA73762
Table 8: Extreme Limit State Loads per pile from Structural Engineer
7.3 Driven Pile Design Recommendations Geotechnical Resistance Design (Axial and Lateral Capacities) at Strength Limit State
Geotechnical resistance is the ability of the subsurface materials to support the loads transferred to it by the
pile foundation without failure of the subsurface material.
Geotechnical resistance design at Strength Limit state includes (from AASHTO 10.5.3.3):
• Axial compression for single piles • Pile group compression resistance • Uplift resistance for single piles • Uplift resistance for pile group • Lateral resistance of single pile and pile group • Constructability; including pile drivability.
Static pile axial resistance was evaluated under Strength Limit state and was checked at Service Limit and
Extreme Limit states.
Geotechnical resistance factors at the Extreme Limit states are taken as 1.0 except that for uplift resistance
of piles, the resistance factor is taken as 0.8.
The lateral resistance of pile foundation is performed using the factored loads since the Strength Limit state
is under consideration, but the soils resistance is not factored since they represent the ultimate condition.
The Strength Limit state for lateral resistance is only structural (AASHTO 10.7.3.12).
We understand that there is no lateral load (shear force) on the piles under static condition. Lateral load
due to earthquake was evaluated under Extreme I Limit state (earthquake loading).
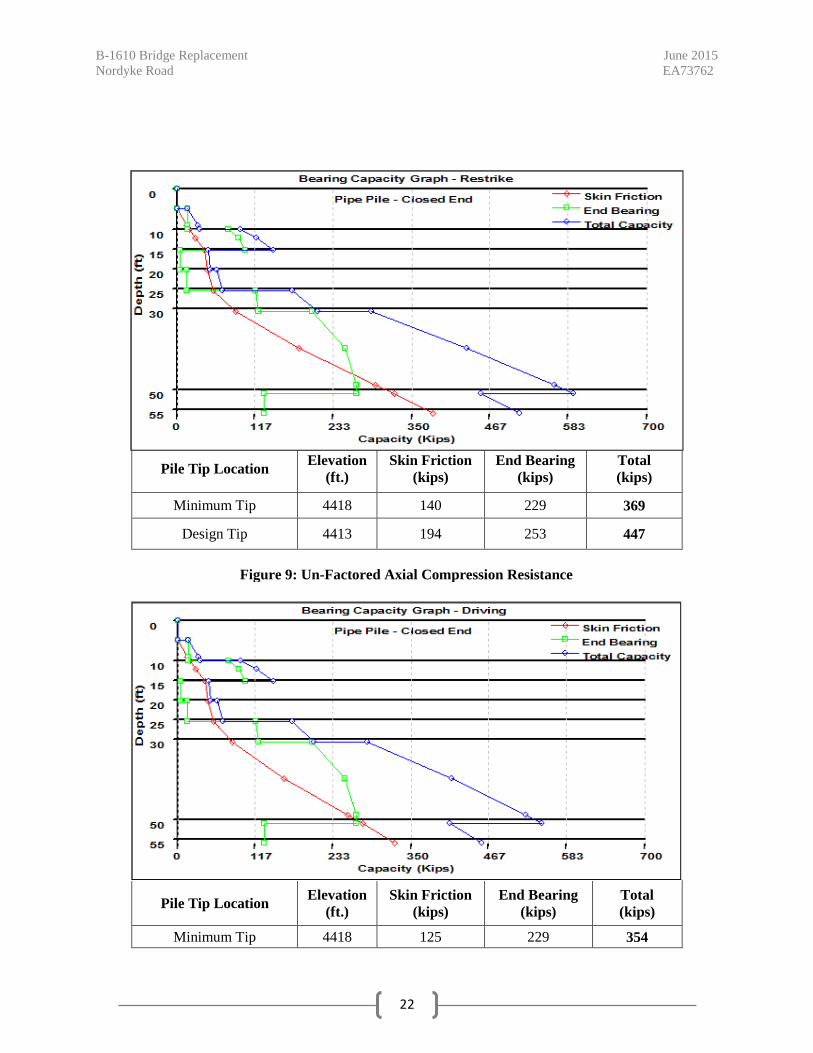
Nominal (ultimate) pile axial compression resistance was performed for the pile foundations using the
DRIVEN 2.0 program, utilizing Nordlund/Thurman and Tomlinson methods. The estimate of pile nominal
(ultimate) bearing resistance versus pile tip elevations for 18-inch closedend pile piles are presented in the
following graphs. Any frictional resistance in embankment fill has been ignored.
21
B-1610 Bridge Replacement June 2015 Nordyke Road EA73762
Pile Tip Location Elevation (ft.)
Skin Friction (kips)
End Bearing (kips)
Total (kips)
Minimum Tip 4418 140 229 369
Design Tip 4413 194 253 447
Pile Tip Location Elevation (ft.)
Skin Friction (kips)
End Bearing (kips)
Total (kips)
Minimum Tip 4418 125 229 354
Figure 9: Un-Factored Axial Compression Resistance
22
B-1610 Bridge Replacement June 2015 Nordyke Road EA73762
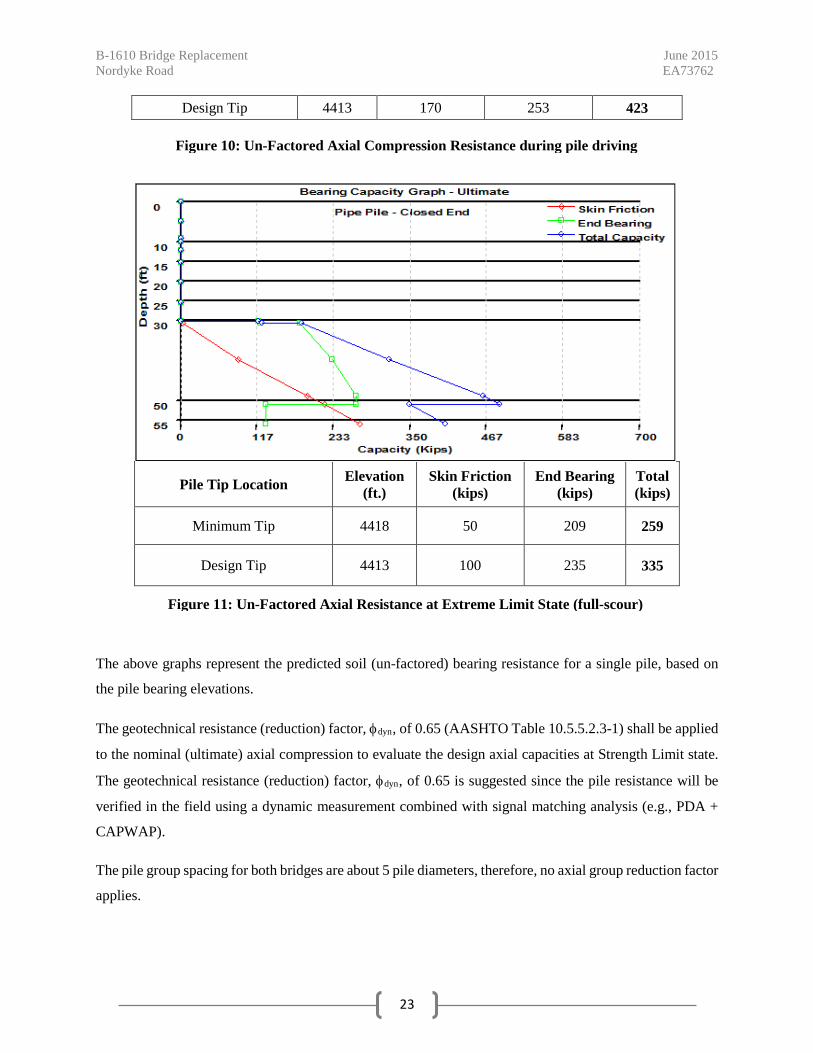
Design Tip 4413 170 253 423
The above graphs represent the predicted soil (un-factored) bearing resistance for a single pile, based on
the pile bearing elevations.
The geotechnical resistance (reduction) factor, φdyn, of 0.65 (AASHTO Table 10.5.5.2.3-1) shall be applied
to the nominal (ultimate) axial compression to evaluate the design axial capacities at Strength Limit state.
The geotechnical resistance (reduction) factor, φdyn, of 0.65 is suggested since the pile resistance will be
verified in the field using a dynamic measurement combined with signal matching analysis (e.g., PDA +
CAPWAP).
The pile group spacing for both bridges are about 5 pile diameters, therefore, no axial group reduction factor
applies.
Pile Tip Location Elevation (ft.)
Skin Friction (kips)
End Bearing (kips)
Total (kips)
Minimum Tip 4418 50 209 259
Design Tip 4413 100 235 335
Figure 10: Un-Factored Axial Compression Resistance during pile driving
Figure 11: Un-Factored Axial Resistance at Extreme Limit State (full-scour)
23

B-1610 Bridge Replacement June 2015 Nordyke Road EA73762
Limit State Resistance Factor Nominal Axial Compression Application
Strength φstat = 0.45 AASHTO Table 10.5.5.2.3-1
Strength φdyn = 0.65 Based on Field Dynamic Analysis
Service 1.0 AASHTO Table 10.5.5.2.3-1
Extreme Event 1.0 AASHTO Table 10.5.5.2.3-1
Table 10: AASHTO LRFD Resistance Factors
Check Geotechnical Resistance Design (Axial and Lateral Capacities) at Service Limit State Checking the design at the Service Limit state loading involved checking the following (from AASHTO
10.5.2.1):
• Vertical Deflection (Settlement) • Horizontal Deflection, • Overall Stability • Scour at Design Flood
The geotechnical resistance (reduction) factor,φ, of 1.0 and load factor (γ) of 1.0 is used in this limit state.
The vertical deflection (total settlement of the pile group), spaced a minimum of 5.0 pile diameter center-
to-center, is expected to be less than 1.0 in. since all the piles will be embedded in very dense soil (refer to
the boring logs).
Horizontal Deflection: Under static condition, no horizontal loading (shear force) were assigned to these
two bridges by the structural engineers. No applied moments were listed at Service Limit state. Therefore,
horizontal movement at this state is not controlling.
Overall Stability: Both bridge abutments will be supported on pile foundations which all the piles will
extend below the slope critical failure circle. The lateral loads on the abutments will be resisted by the
lateral capacity of the piles.
24

B-1610 Bridge Replacement June 2015 Nordyke Road EA73762
Scour at Design Flood: Scour at the design flood (100-year flood) was included in the pile design since no
scour countermeasures were proposed for B-1610. This case considered the total scour of 15 ft., to an
elevation of approximately 4423 ft. recommended by NDOT hydraulics.
Geotechnical Resistance Design (Axial and Lateral Capacities) at Extreme Event I Limit State Extreme I Limit state (earthquake loading) loading is the most critical loading affecting the geotechnical
limit state for this bridge. One-half of the total predicted scour under the 100 year event was considered
in addition to the earthquake loads under this limit state. The loading provided by the structural engineer
assumes the superstructure will engage each pile cap in the longitudinal direction, thereby distributing the
total seismic force between the two pile caps.
The geotechnical resistance (reduction) factor,φ, of 1.0 and factored (γEQ) loading were used in this limit
state.
The provided total applied lateral loads were entered into the computer program LPILE V2015 which was
used to calculate shear, moment, and deflection with depth. The structural engineers will evaluate these
diagrams to check that the structural strengths are in excess of the structural demand. The piles were also
checked for geotechnical lateral stability, which was satisfied at the required minimum tip elevation.
These charts represent the forces developed at the Extreme Event Ia and the behavior of a single pile in the
longitudinal direction. After discussions with the Structural Engineer, it was decided to allow larger than
normal predicted pile displacements under the scour and earthquake condition (Extreme Event Ia), as long
as the pile and overall structure remained stable. These displacements would be considered in the design of
the superstructure connections. This decision was made due to the relatively long unbraced lengths under
the proposed scour case, in combination with large seismic forces, which would have dictated two rows of
piles to bring displacements below 1 in. When earthquake loads are considered, with no scour, the
displacement is expected to be less than 1.0 in. at the pile cap in the longitudinal direction.
25

B-1610 Bridge Replacement June 2015 Nordyke Road EA73762
Figure 12: LPILE Model under Earthquake and one half scour
26
B-1610 Bridge Replacement June 2015 Nordyke Road EA73762
Figure 13: Pile Bending Moment Diagram Figure 14: Pile Shear Force Diagram
Geotechnical Resistance Design (Axial and Lateral Capacities) at Extreme Event II Limit State
The 100 year total scour was considered at Extreme Event II limit state. Axial capacity of the piles was
checked ignoring the friction contribution of the scoured soils. This limit state did not control the design
Dynamic Analysis: Pile Drivability
Pile drivability is truly a construction limit state, but it is treated as a Strength Limit state.
Driving resistance of the driven piles (the ability of the piles to withstand stresses induced during
installation) was evaluated by wave equation method, using computer program GRLWEAP 2010. In
addition, the wave equation analyses determine the driving stresses and blow counts based upon hammer
size. Thus, the wall thickness and required hammer size were determined to reach a desired capacity. In
these analyses, high strength steel (45 ksi) were used to allow for higher driving stress.
Pile driving stress (σdr) anywhere in the pile determined from the analysis shall be as:
σdr ≤ 0.9 φdafy φda: AASHTO Table 10.5.5.2.3-1
If a single acting diesel hammer is used, we recommend using Saximeter, developed by Pile Dynamics, Inc.
to be used to record hammer stroke. Alternatively, for a single acting diesel hammer, the provided equation
on the NDOT Pile Driving Record form can be used to calculate the hammer stroke.
We recommend pile driving points (shoes) be used on all the piles to minimize the pile damage during the
driving.
A trial hammer Delmag D36-32 was used in GRLWEAP 2010 to check the drivability of the piles at B-
1610. The output shows that the piles are drivable and the compression stresses on the piles are within the
limit. Appendix E presents the results of these analyses.
27

B-1610 Bridge Replacement June 2015 Nordyke Road EA73762
Table 11: Pile Driving Analysis from GRLWEAP Summary Table
We suggest that the following summary tables be included in the bridge construction plans:
BRIDGE B-1610
LOCATION
MIN.
TIP ELEVATION
(FEET)
DESIGN
TIP ELEVATION
(FEET)
REQUIRED
PILE DRIVING RESISTANCE
(KIPS)
ABUTMENT 1 4418 4413 300
ABUTMENT 2 4418 4413 300
NDOT Geotechnical Apr 22 2015 GRLWEAP Version 2010Nordy ke B-1610 : 04/01/2015 : Lawrence
Gain/Loss 1 at Shaf t and Toe 0.796 / 1.000
Ultimate End Blow Comp. Tension Depth Capacity Friction Bearing Count Stress Stress Stroke ENTHRU f t kips kips kips blows/f t ksi ksi f t kips-f t
5.0 34.7 18.8 15.9 -1.0 0.000 0.000 0.00 0.0 10.0 53.5 37.6 15.9 2.8 13.145 0.000 4.05 48.3 10.0 114.3 37.7 76.6 6.2 24.063 0.000 5.28 43.5 12.5 141.9 48.5 93.4 7.7 26.557 0.000 5.66 42.0 15.0 162.3 60.7 101.6 8.8 28.064 0.000 5.94 41.3 15.0 65.6 60.8 4.8 3.1 15.180 0.000 4.11 47.5 17.5 67.4 62.7 4.8 3.2 15.750 -0.723 4.16 47.2 20.0 69.3 64.5 4.8 3.3 16.463 -1.238 4.22 47.0 20.0 78.9 64.6 14.3 3.9 18.497 -1.067 4.43 46.1 22.5 83.3 68.9 14.3 4.1 19.619 -1.492 4.54 45.7 25.0 87.6 73.3 14.3 4.4 20.570 -1.998 4.65 45.2 25.0 190.4 73.4 117.0 10.7 30.365 0.000 6.46 40.3 27.5 205.5 86.0 119.4 11.5 31.176 0.000 6.62 40.0 30.0 221.4 99.6 121.9 12.4 32.125 0.000 6.77 39.6 30.0 302.2 99.8 202.3 19.3 35.961 0.000 7.81 37.7 35.0 368.1 139.0 229.1 25.2 37.555 0.000 8.44 36.8 40.0 436.2 183.5 252.7 32.8 40.409 0.000 9.01 35.6
Total Continuous Driv ing Time 9.00 minutes; Total Number of Blows 391
28

B-1610 Bridge Replacement June 2015 Nordyke Road EA73762
Table 12: Minimum Pile Tip and Required Driving Resistance
Lateral Earth Pressure on Abutment Walls and Wing Walls
Seat Type Abutment: we understand that the bridge abutments will be cast in place pile caps with
abutment walls supported on the pile caps. The abutment walls will be seat-type, which can deflect at the
top and cause the lateral active earth pressure to develop. The following soil parameters are
recommended for the structural design of the abutment walls:
LATERAL EARTH PRESSURE DESIGN PARAMETERS
SEAT-TYPE ABUTMENTS
(Deflection at the top of the wall is more than 0.5% of the wall height.)
(with no build-up of hydrostatic pressure)
* Where heavy static and dynamic compaction equipment is used within a distance of one-half the wall height behind the wall, the effect of additional earth pressure that may be induced by compaction shall be taken into account.
Static Active Earth Pressure Coefficient = KA = 0.278 (Coulomb’s equation for δ/φf = 0.5)
Static Active Earth Pressure = KA γ H
Static Active Earth Force by the Driving Wedge = ½ KA γ H2 ; (located at 1/3 from the bottom of the wall)
(Static + Seismic) Active Earth Pressure Coefficient = KAE (Mononobe and Okabe):
Kh = As = 0.64g
(Static + Seismic) Active Earth Pressure = KAE γ H
(Static + Seismic) Active Earth Force by the Driving Wedge = ½ KAE γ H2
Abutment Backfill Internal Friction Angle (φf) 32 degrees
Backfill Unit Weight (γf) 0.125 kcf
Interface Friction Coefficient (tan δ) for concrete cast against soil
Interface Friction Coefficient (tan δ) for precast concrete against soil
tan δ = 0.50
tan δ = 0.40
Table 13: Lateral Earth Pressure Design Parameters
29
B-1610 Bridge Replacement June 2015 Nordyke Road EA73762
General Seismic Design Parameters
B-1610 General Seismic Design Parameters
AASHTO LRFD Table 3.10.33.1-1, Site Class Definitions: the site generally can be classified as Site
Class D.
Response Modification Factor = R = varies, see AASHTO Table 3.10.7.1-1
Vertical Acceleration Coefficient = 0 [AASHTO Appendix A11]
Poisson’s ratio for granular backfill material = µ = 0.30
Young Modulus for granular backfill material (Es; AASHTO Table C10.4.6.3-1):
• Es= 0.139N160 (ksi) ≈ 4.448 ksi ; for N160 = 32 (estimated)]
Shear Modulus (G) for granular backfill material = Es / 2(1+µ) ≈1.7 ksi
Table 14: General Seismic Design Parameters
Approach Embankment Settlement Settlement at the abutment approaches was not analyzed because the bridge will be constructed to existing
grade. If limited settlement at the approach to the superstructure is a concern, a reinforced soil approach
slab could be constructed utilizing an approved woven geotextile product and crushed aggregate or roadway
base material. The geotextile should be placed at 8 in. intervals with well compacted roadway base or
crushed rock material between geotextile layers. A minimum section thickness of 24 in. is recommended.
30

B-1610 Bridge Replacement June 2015 Nordyke Road EA73762
8.0 References
1. Proffett, J.M., Jr., and Dilles, J. H., 1984, Geologic map of the Yerington district, Nevada. Nevada Bureau of Mines and Geology Map 77, scale 1:24,000.
2. Adams, K.Kenneth, and Sawyer, T.L., compilers, 1999, Fault number 1294, Singatse Range fault
zone, in Quaternary fault and fold database of the United States: U.S. Geological Survey website,
http://earthquakes.usgs.gov/hazards/qfaults, accessed 06/30/2014 02:48 PM.
3. California Department of Transportation, CALTRANS Acceleration Response Spectra (ARS),
ARS Online Version 2.3.06, accessed at, http://dap3.dot.ca.gov/ARS_Online/index.php, accessed
date: 07/29/2014.
4. American Association of State Highway and Transportation Officials (AASHTO), 2012, AASHTO
LRFD Bridge Design Specifications, Customary, U.S. Units, 6th Edition: Washington DC
5. Hunt, John H, Ayres Associates, Nevada Department of Transportation, 2010, Scour Critical
Bridge Plan of Action B-1610.
6. Crafford, A.E.J., 2007, Geologic Map of Nevada: U.S. Geological Survey Data Series 249.
7. Soil Survey Staff, Natural Resources Conservation Service, United States Department of Agriculture. Web Soil Survey. Available online at http://websoilsurvey.nrcs.usda.gov/. Accessed on 07/24/2014.
8. Optim Software, Available online at http://www.optimsoftware.com, Accessed on 12/14/2014.
9. Nevada Department of Transportation, NDOT Structures Manual, 2008.
31

APPENDIX A : Boring Logs

KEY TO BORING LOGS
USCS GROUP TYPICAL SOIL DESCRIPTION
GW GP GC SW SP SM SC ML CL OL
MH CH OH PT
Well graded gravels, gravel-sand mixtures, little or no fines Poorly graded gravels, gravel-sand mixtures, little or no fines Clayey gravels, poorly graded gravel-sand-clay mixtures Well graded sands, gravelly sands, little or no fines Poorly graded sands, gravelly sands, little or no fines Silty sands, poorly graded sand-silt mixtures Clayey sands, poorly graded sand-clay mixtures Inorganic silts and very fine sands, rock flour, silty or clayey fine sands with slight plasticity Inorganic clays of low to medium plasticity, gravelly clays, sandy clays, silty clays, lean clays Organic silts and organic silt-clays of low plasticity Inorganic silts, micaceous or diatomaceous fine sandy or silty soils, elastic silts Inorganic clays of high plasticity, fat clays Organic clays of medium to high plasticity Peat and other highly organic soils
MOISTURE CONDITION CRITERIA SOIL CEMENTATION CRITERIA
Description Criteria Description Criteria Dry Absence of moisture, dusty, Weak Crumbles or breaks with handling or little dry to touch. finger pressure.
Moist Damp, no visible free water. Moderate Crumbles or breaks with considerable Wet Visible free water, usually below finger pressure.
groundwater table. Strong Won’t break or crumble w/finger pressure
Groundwater Elevation Symbols
California Modified Sampler field
blow counts (NCMS field) for
(6< NCMS field <50) can be converted
to NSPT field by:
(NCMS field)(0.62) = NSPT field
SPT field blow counts (NSPT field)
can be converted to N60 by:
(NSPT field)(ETR/60) =N60 ETR = Energy Transfer Ratio Field blow counts from 140 lb hammer with 30 inch free fall
TEST ABBREVIATIONS
CD CONSOLIDATED DRAINED CH CHEMICAL (CORROSIVENESS) CM COMPACTION CU CONSOLIDATED UNDRAINED D DISPERSIVE SOILS DS DIRECT SHEAR E EXPANSIVE SOIL G SPECIFIC GRAVITY H HYDROMETER HC HYDRO-COLLAPSE K PERMEABILITY
O ORGANIC CONTENT OC CONSOLIDATION PI PLASTICITY INDEX RQD ROCK QUALITY DESIGNATION RV R-VALUE S SIEVE ANALYSIS SL SHRINKAGE LIMIT U UNCONFINED COMPRESSION UU UNCONSOLIDATED UNDRAINED UW UNIT WEIGHT W MOISTURE CONTENT
SAMPLER NOTATION
CMS CALIF. MODIFIED SAMPLER
CPT CONE PENETRATION TEST
CS CONTINUOUS SAMPLER
PB PITCHER BARREL
RC ROCK CORE
SH SHELBY TUBE
SPT STANDARD PENETRATION TEST
TP TEST PIT 1- I.D.= 2.421 inch
2- I.D.=3.228 inch with tube; 3.50 inch w/o tube
3- NXB I.D.= 1.875 inch
4- I.D.= 2.875 inch
5- I.D.= 1.375 inch, O.D.= 2.00 inch
SOIL COLOR DESIGNATIONS ARE FROM THE MUNSELL SOIL/ROCK COLOR CHARTS.
EXAMPLE: (7.5 YR 5/3) BROWN
Revised June 2011
PARTICLE SIZE LIMITS CLAY SILT SAND GRAVEL COBBLES BOULDERS
FINE MEDIUM COARSE FINE COARSE
.002 mm #200 #40 #10 #4 ¾ inch 3 inch 12 inch
STANDARD PENETRATION CLASSIFICATION* (after Peck, et al., 1974) GRANULAR SOIL CLAYEY SOIL
BLOWS/FT DENSITY
N60 BLOWS/FT CONSISTENCY
N60
0 - 4
5 – 10
11 - 30
31 - 50
OVER 50
VERY LOOSE
LOOSE
MEDIUM DENSE
DENSE
VERY DENSE
0 - 1 VERY SOFT
2 - 4 SOFT
5 - 8 MEDIUM STIFF
9 - 15 STIFF
16 - 30 VERY STIFF
31 - 60 HARD
OVER 60 VERY HARD * SPT N60-values are only reliable for sands, and should serve only as estimates for other materials such as gravels, silts and clays.

2.50
5.00
7.50
10.00
12.50
15.00
17.50
20.00
22.50
25.00
27.50
30.00
4.00
6.50
9.00
11.50
14.00
16.50
19.00
21.50
24.00
26.50
29.00
A
B
C
D
E
F
G
H
I
J
K
3
4
1
2
2
1
1
3
3
5
7
3
3
1
2
4
1
1
3
2
11
8
6" H.S.A (0'-29') / 3.5" Rotary Wash (29'-41.5')from unpaved roadway shoulder
LEAN CLAY , moist, dark brown, W=15% ,LL=35, PL=24, -200 = 87%
LEAN CLAY , dry to moist, very pale brown,mottled orange/red 1%, W=13%, LL=33,PL=28, -200=86%
LEAN CLAY , moist, dark brown, mottledorange/red 5%, W=26%, LL=35, PL=28,-200=93%
LEAN CLAY WITH SAND , moist to wet, darkbrown, mottled orange/red 5%, W=36%, LL=33,PL=28, -200=85%
WELL GRADED SAND WITH SILT , wet,gray to white grains (10%), -200= 7%, sand =88%, gravel = 0%
LEAN CLAY, wet, black, no odor, noorganics, W=44%, LL=42, PL=28, -200= 89%
LEAN CLAY WITH SAND , wet, black,interbedded sandy clays and fat clays, W=45%,LL=34, PL=21, -200= 95%
FAT CLAY , moist to wet, black, interbeddedsandy clays and fat clays W=40%, LL=72,PL=24FAT CLAY , moist to wet, very pale brownwith black (10%), W=40%, LL=54, PL=21
MIXED SANDY LEAN CLAY AND SANDYFAT CLAY , moist to wet, dark gray, LL=79,PL=25
SILTY SAND, wet, -200= 26%, sand=74%,gravel=0%, Friction Angle (Residual) = 32degrees
SPT(K)- No Sample Recovered- HeavingFormation
*Switch Drilling method to Mud Rotary withBentonite Slurry @ 29.0ft
* switcheddrilling methodat 29' due toshallowgroundwaterand heaving soilconditions
(D) lightorganics insample, shoewet, water tableat 12'
(F) samplerpenetrated 0.5'prior to hammer,reset hammer at0", drove 18"
(I) samplerpenetrated 0.3'prior to hammer,reset hammer at0", drove 18"
(J) samplerpenetrated 0.2'prior to hammer,reset hammerat 0", drove 18"
(K) plug bitstuck in augerwhenwithdrawinginner string,sand heavinginto hollowauger.
2.00
12.00
14.50
18.80
20.80
24.50
3
3
1
3
6
1
1
3
2
11
10
CL
SWSM
CL
CH
CL
SWSM
SPT
CMS
SPT
CMS
SPT
CMS
SPT
CMS
SPT
CMS
SPT
50
95
65
65
75
120
100
85
80
100
0
S,PI,W
S,PI,W,H,UW
S,PI,W
S,PI,W,H
S,PI,W
S,PI,W,H,UW, OC
S,PI,W
S,PI,W,H,UW,CU,OC
S,PI,W
S,PI,W,H,UW,OC,DS
6
6
2
5
10
2
2
6
4
22
18
12.00
NO.
STATION
OFFSET
ENGINEER
EQUIPMENT
OPERATOR
SHEET 1 OF 2
MATERIAL DESCRIPTION
73762 Nordyke Road Bridge Replacement
BACKFILLED
5/27/14
ELEV. ft
6 inchIncrements
5/27/14
TYPE
SAMPLE
4440.0Auto. (ETR 86%)
DEPTH ft
DATE
NLB-1/1A (West Abut.)
DRILLINGMETHOD
Nordyke Road, Lyon County, NV
PercentRecov'd
73762 GROUNDWATER LEVEL
EXPLORATION LOG
6" HSA/3.5" Rotary Wash
USCSGroupLast
1 footDEPTH
(ft)ELEV.
(ft)
DATE
REMARKSBLOW COUNT
5/27/14
LAB TESTS
4452.00 (ft)
START DATE
END DATE
JOB DESCRIPTION
LOCATION
BORING
E.A. #
GROUND ELEV.
HAMMER DROP SYSTEM
"NR" 132+906' RightLawrenceDiedrich D-120 (Unit 1082)Altamirano
4447.0
4442.0
4437.0
4432.0
4427.0
5
10
15
20
25
5
10
15
20
25
NV
_DO
T 7
3762
_N
OR
DY
KE
.GP
J N
V_D
OT
.GD
T
11/3
/14

35.00
40.00
31.50
36.50
41.50
L
M
N
15
23
5
17
43
17
WELL GRADED SAND WITH SILT ANDGRAVEL , wet, -200=7%, sand=70%,gravel=23%
* cobbles or coarse gravel @ 33' +/- based ondrill operation
POORLY GRADED GRAVEL WITH SAND ,wet, -200=4%, sand=22%, gravel=74%
* Cobbles or coarse gravel from 35'-40' basedon drill operation
POORLY GRADED GRAVEL WITH SAND ,wet, -200=4%, sand=22%, gravel=74%
END NLB-1/1A @ 41.5'
* switch to rotarywash drilling @29.0' with300gal water, 1bag bentonite
(M) +/- 2.0"gravel in sample
* slowly losingmud duringdrilling, stillcirculating
(N) - 1' +/- ofsluff measuredin hole prior todriving sampler,drove 18",possiblyunreliableblowcounts* hole cavingwhenwithdrawing drillrod @ 41.5'
32.00
41.50
17
41
27
GP
SPT
CMS
SPT
75
45
20
S,PI,W
S,PI,W
S,PI,W
34
84
44
12.00
NO.
STATION
OFFSET
ENGINEER
EQUIPMENT
OPERATOR
SHEET 2 OF 2
MATERIAL DESCRIPTION
73762 Nordyke Road Bridge Replacement
BACKFILLED
5/27/14
ELEV. ft
6 inchIncrements
5/27/14
TYPE
SAMPLE
4440.0Auto. (ETR 86%)
DEPTH ft
DATE
NLB-1/1A (West Abut.)
DRILLINGMETHOD
Nordyke Road, Lyon County, NV
PercentRecov'd
73762 GROUNDWATER LEVEL
EXPLORATION LOG
6" HSA/3.5" Rotary Wash
USCSGroupLast
1 footDEPTH
(ft)ELEV.
(ft)
DATE
REMARKSBLOW COUNT
5/27/14
LAB TESTS
4452.00 (ft)
START DATE
END DATE
JOB DESCRIPTION
LOCATION
BORING
E.A. #
GROUND ELEV.
HAMMER DROP SYSTEM
"NR" 132+906' RightLawrenceDiedrich D-120 (Unit 1082)Altamirano
4417.0
4412.0
4407.0
4402.0
4397.0
35
40
45
50
55
35
40
45
50
55
NV
_DO
T 7
3762
_N
OR
DY
KE
.GP
J N
V_D
OT
.GD
T
11/3
/14
5.00
10.00
12.50
15.00
17.50
20.00
22.50
25.00
26.50
30.00
6.50
11.50
14.00
16.50
19.00
21.50
24.00
26.50
28.00
A
B
C
D
E
F
G
H
I
6
8
9
16
1
3
14
27
7
7
8
13
13
2
3
26
32
16
3.5" Rotary Wash with Bentonite slurry fromunpaved roadway shoulder
SILT WITH SAND , dry, very pale brown,mottled red/orange, *sample likelycontaminated with some bentonite, W=11%,-200=77%, Sand=23%, Gravel=0%
POORLY GRADED SAND WITH SILT ANDGRAVEL, moist, -200=9%, Sand=68%,Gravel=23%
POORLY GRADED SAND WITH SILT ,moist, -200=5%, Sand=88%, Gravel=7%,Friction Angle (residual)= 35 degrees.
POORLY GRADED SAND WITH GRAVEL ,wet, -200=4%, Sand=66%, Gravel=30%
FAT CLAY , moist to wet,very pale brown tostrong brown, W=41.3%, LL=56, PL=27,-200=98%
LEAN CLAY , moist to wet, strong brown,W=39%, LL=47, PL=21, Su(triax)=1100psf
POORLY GRADED SAND WITH SILT ANDGRAVEL , wet, -200=6%, Sand=63%,Gravel=31%
POORLY GRADED SAND WITH GRAVEL ,wet, -200=5%, Sand=74%, Gravel=21%
POORLY GRADED SAND WITH SILT ANDGRAVEL , wet, -200=7%, Sand=54%,Gravel=39%
(A) 4.5 tsfPocketPenetrometer
(E) 1.25 tsfPocketPenetrometer
(F) 2.5 tsfTorvane
2.00
9.00
14.50
17.00
19.50
22.00
24.50
26.50
29.00
6
8
14
10
1
4
30
37
21
ML
SPSM
SP
CH
CL
SPSM
SP
SPSM
SPT
SPT
CMS
CMS
SPT
CMS
CMS
CMS
SPT
75
70
65
70
55
95
80
80
55
S,PI,W
S,W
S,PI,W,DS,UW
S,PI,W
S,PI,W,H
S,PI,W,CU,OC,UW
S,PI,W,DS,UW
S,PI
S,PI
13
16
27
23
3
7
56
69
37
12.00
NO.
STATION
OFFSET
ENGINEER
EQUIPMENT
OPERATOR
SHEET 1 OF 3
MATERIAL DESCRIPTION
73762 Nordyke Road Bridge Replacement
BACKFILLED
5/28/14
ELEV. ft
6 inchIncrements
5/28/14
TYPE
SAMPLE
4440.5Auto. (ETR 86%)
DEPTH ft
DATE
NLB-2 (East Abut.)
DRILLINGMETHOD
Nordyke Road, Lyon County, NV
PercentRecov'd
73762 GROUNDWATER LEVEL
EXPLORATION LOG
3.5" Rotary Wash
USCSGroupLast
1 footDEPTH
(ft)ELEV.
(ft)
DATE
REMARKSBLOW COUNT
5/28/14
LAB TESTS
4452.50 (ft)
START DATE
END DATE
JOB DESCRIPTION
LOCATION
BORING
E.A. #
GROUND ELEV.
HAMMER DROP SYSTEM
"NR" 133+9220' LeftLawrenceDiedrich D-120 (Unit 1082)Altamirano
4447.5
4442.5
4437.5
4432.5
4427.5
5
10
15
20
25
5
10
15
20
25
NV
_DO
T 7
3762
_N
OR
DY
KE
.GP
J N
V_D
OT
.GD
T
11/3
/14

35.00
40.00
41.50
31.50
36.50
41.50
43.00
J
K
L
M
23
18
7
7
39
18
14
14
POORLY GRADED GRAVEL WITH SILTAND SAND , wet, trace of clayey fines, -200=12%, Sand=37%, Gravel= 51%
POORLY GRADED SAND WITH SILT ANDGRAVEL , wet, -200=9%, Sand=65%,Gravel=26%
CMS(L)- *No Sample, hole caving upon drillstring withdrawl
SPT(M)- *No Sample, hole caving upon drillstring withdrawl
* Continue drilling from 43' to 62.0', cuttingsindicated sands and gravels, with likelyscattered cobbles. Most cuttings indicatedangular to subangular particle shapes. Uponcompleting the hole, drill rods were difficult toremove.
(L) 1.7' of sluffat bottom ofhole prior tosampling, drovesampler 18",possiblyunreliableblowcounts
(M) 1.0' of sluffin hole prior tosampling, drovesampler 18",possiblyunreliableblowcounts
45'- * unable tosample due tohole caving
50'- * unable tosample due tohole caving
55' - * unable tosample due tohole caving
33.00
38.00
22
31
15
28
GPGM
SPSM
CMS
SPT
CMS
SPT
80
80
0
15
S,PI
S,PI
61
49
29
42
12.00
NO.
STATION
OFFSET
ENGINEER
EQUIPMENT
OPERATOR
SHEET 2 OF 3
MATERIAL DESCRIPTION
73762 Nordyke Road Bridge Replacement
BACKFILLED
5/28/14
ELEV. ft
6 inchIncrements
5/28/14
TYPE
SAMPLE
4440.5Auto. (ETR 86%)
DEPTH ft
DATE
NLB-2 (East Abut.)
DRILLINGMETHOD
Nordyke Road, Lyon County, NV
PercentRecov'd
73762 GROUNDWATER LEVEL
EXPLORATION LOG
3.5" Rotary Wash
USCSGroupLast
1 footDEPTH
(ft)ELEV.
(ft)
DATE
REMARKSBLOW COUNT
5/28/14
LAB TESTS
4452.50 (ft)
START DATE
END DATE
JOB DESCRIPTION
LOCATION
BORING
E.A. #
GROUND ELEV.
HAMMER DROP SYSTEM
"NR" 133+9220' LeftLawrenceDiedrich D-120 (Unit 1082)Altamirano
4417.5
4412.5
4407.5
4402.5
4397.5
35
40
45
50
55
35
40
45
50
55
NV
_DO
T 7
3762
_N
OR
DY
KE
.GP
J N
V_D
OT
.GD
T
11/3
/14

END NLB-2 @ 62.0'
60'- * unable tosample due tohole caving
62' - * unable tosample due tohole caving
62.00
12.00
NO.
STATION
OFFSET
ENGINEER
EQUIPMENT
OPERATOR
SHEET 3 OF 3
MATERIAL DESCRIPTION
73762 Nordyke Road Bridge Replacement
BACKFILLED
5/28/14
ELEV. ft
6 inchIncrements
5/28/14
TYPE
SAMPLE
4440.5Auto. (ETR 86%)
DEPTH ft
DATE
NLB-2 (East Abut.)
DRILLINGMETHOD
Nordyke Road, Lyon County, NV
PercentRecov'd
73762 GROUNDWATER LEVEL
EXPLORATION LOG
3.5" Rotary Wash
USCSGroupLast
1 footDEPTH
(ft)ELEV.
(ft)
DATE
REMARKSBLOW COUNT
5/28/14
LAB TESTS
4452.50 (ft)
START DATE
END DATE
JOB DESCRIPTION
LOCATION
BORING
E.A. #
GROUND ELEV.
HAMMER DROP SYSTEM
"NR" 133+9220' LeftLawrenceDiedrich D-120 (Unit 1082)Altamirano
4387.5
4382.5
4377.5
4372.5
4367.5
65
70
75
80
85
65
70
75
80
85
NV
_DO
T 7
3762
_N
OR
DY
KE
.GP
J N
V_D
OT
.GD
T
11/3
/14

APPENDIX B : Laboratory Test Results


APPENDIX C : Geophysical Test Results

73762 Nordyke Road B-1610
Seismic Line #1: 1-D Average S-Wave Velocity
West Side of Structure
-100
-90
-80
-70
-60
-50
-40
-30
-20
-10
0
0 500 1000 1500 2000 2500 3000
Dep
th, ft
Shear-Wave Velocity, ft/s
Vs100' = 902 f t/s
Seismic Line 1: ReMi Vs Model

73762 Nordyke Road B-1610 Seismic Line #1:
ReMi Spectral Image and Dispersion Picks
0.00
500.00
1000.00
1500.00
2000.00
2500.00
3000.00
0 0.05 0.1 0.15 0.2 0.25 0.3 0.35 0.4 0.45 0.5
Ray
leig
h W
ave P
hase
Vel
ocity
,ft/s
Period, s
Dispersion Curve Showing Picks and Fit
Calculated Dispersion
Picked Dispersion
Seismic Line 1: Supportive Illustration
p-f Image with Dispersion Modeling Picks

73762 Nordyke Road B-1610 Seismic Line #2: 1-D Average S-Wave Velocity
East Side of Structure
-100
-90
-80
-70
-60
-50
-40
-30
-20
-10
00 500 1000 1500 2000 2500 3000
Dep
th, f
t
Shear-Wave Velocity, ft/s
Vs100' = 1007 f t/s
Seismic Line 2: Vs Model
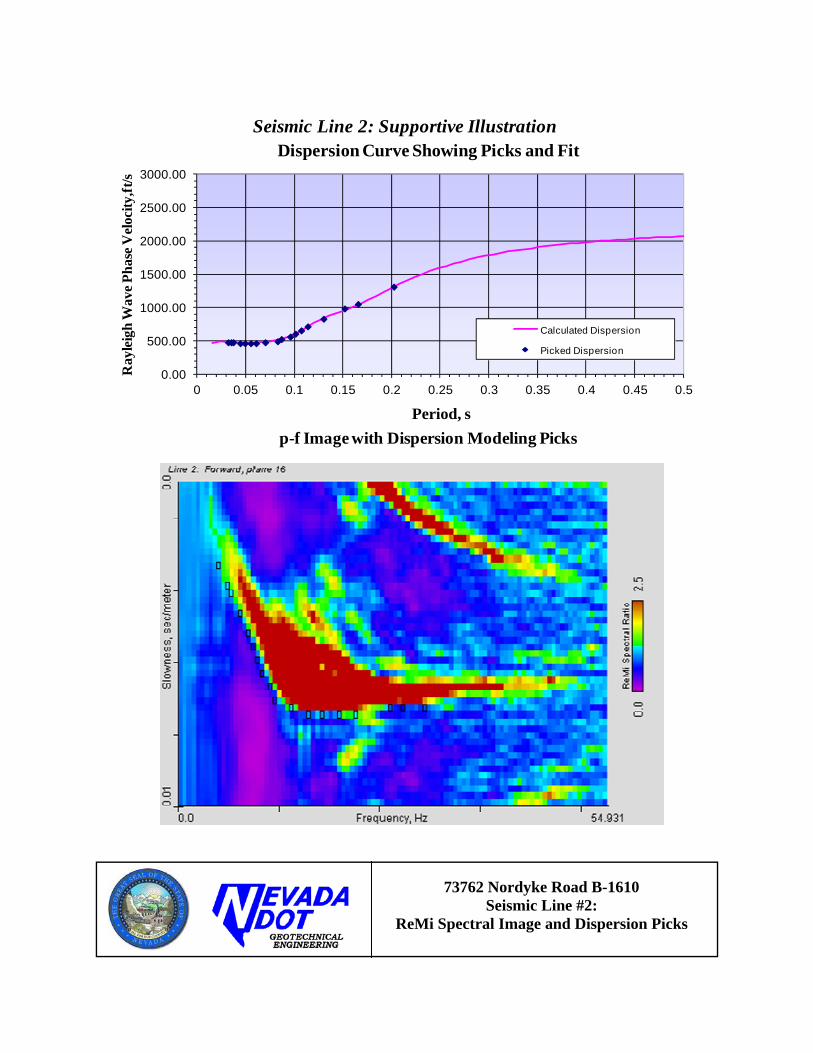
73762 Nordyke Road B-1610 Seismic Line #2:
ReMi Spectral Image and Dispersion Picks
0.00
500.00
1000.00
1500.00
2000.00
2500.00
3000.00
0 0.05 0.1 0.15 0.2 0.25 0.3 0.35 0.4 0.45 0.5
Ray
leig
h W
ave P
hase
Vel
ocity
,ft/s
Period, s
Dispersion Curve Showing Picks and Fit
Calculated Dispersion
Picked Dispersion
Seismic Line 2: Supportive Illustration
p-f Image with Dispersion Modeling Picks

APPENDIX D : Seismic Design Charts

Design Maps Summary Report
Report Title
Building Code Reference Document
Site Coordinates
Site Soil Classification
PGA = 0.371 g As = 0.419 g
SS = 0.899 g SDS = 1.025 g
S1 = 0.328 g SD1 = 0.572 g
User–Specified InputNordyke Road B-1610 (Vs 900ft/s)Mon June 30, 2014 21:04:20 UTC
2009 AASHTO Guide Specifications for LRFD Seismic Bridge Design(which utilizes USGS hazard data available in 2002)
38.88923°N, 119.17566°W
Site Class D – “Stiff Soil”
USGS–Provided Output
Although this information is a product of the U.S. Geological Survey, we provide no warranty, expressed or implied, as to the accuracy of the data contained therein. This tool is not a substitute for technical subject-matter knowledge.
Page 1 of 1Design Maps Summary Report
6/30/2014http://ehp3-earthquake.wr.usgs.gov/designmaps/us/summary.php?template=minimal&latit...

Design Maps Detailed Report
From Figure 3.4.1-2 [1]
From Figure 3.4.1-3 [2]
From Figure 3.4.1-4 [3]
2009 AASHTO Guide Specifications for LRFD Seismic Bridge Design (38.88923°N, 119.17566°W)
Site Class D – “Stiff Soil”
Article 3.4.1 — Design Spectra Based on General Procedure
Note: Maps in the 2009 AASHTO Specifications are provided by AASHTO for Site Class B.Adjustments for other Site Classes are made, as needed, in Article 3.4.2.3.
PGA = 0.371 g
SS = 0.899 g
S1 = 0.328 g
Page 1 of 7Design Maps Detailed Report
6/30/2014http://ehp3-earthquake.wr.usgs.gov/designmaps/us/report.php?template=minimal&latitude...

Article 3.4.2.1 — Site Class Definitions
The authority having jurisdiction (not the USGS), site-specific geotechnical data, and/or the default has classified the site as Site Class D, based on the site soil properties in accordance with Article 3.4.2.
Table 3.4.2.1–1 Site Class Definitions
SITE CLASS
SOIL PROFILE NAME
Soil shear wave velocity, vS, (ft/s)
Standard penetration resistance, N
Soil undrained shear strength, su, (psf)
A Hard rock vS > 5,000 N/A N/A
B Rock 2,500 < vS ≤ 5,000 N/A N/A
C Very dense soil and soft rock
1,200 < vS ≤ 2,500 N > 50 >2,000 psf
D Stiff soil profile 600 ≤ vS < 1,200 15 ≤ N ≤ 50 1,000 to 2,000 psf
E Stiff soil profile vS < 600 N < 15 <1,000 psf
E — Any profile with more than 10 ft of soil having the characteristics:
1. Plasticity index PI > 20,2. Moisture content w ≥ 40%, and3. Undrained shear strength su < 500 psf
F — Any profile containing soils having one or more of the followingcharacteristics:
1. Soils vulnerable to potential failure or collapse under seismic loading such as liquefiable soils, quick and highly sensitive clays, collapsible weakly cemented soils.
2. Peats and/or highly organic clays (H > 10 feet of peat and/or highly organic clay where H = thickness of soil)
3. Very high plasticity clays (H > 25 feet with plasticity index PI > 75)4. Very thick soft/medium stiff clays (H > 120 feet)
For SI: 1ft/s = 0.3048 m/s 1lb/ft² = 0.0479 kN/m²
Page 2 of 7Design Maps Detailed Report
6/30/2014http://ehp3-earthquake.wr.usgs.gov/designmaps/us/report.php?template=minimal&latitude...

Article 3.4.2.3 — Site Coefficients
Table 3.4.2.3-1 (for Fpga)—Values of Fpga as a Function of Site Class and Mapped Peak Ground Acceleration Coefficient
Site Class
Mapped Peak Ground Acceleration
PGA ≤ 0.10
PGA = 0.20
PGA = 0.30
PGA = 0.40
PGA ≥ 0.50
A 0.8 0.8 0.8 0.8 0.8
B 1.0 1.0 1.0 1.0 1.0
C 1.2 1.2 1.1 1.0 1.0
D 1.6 1.4 1.2 1.1 1.0
E 2.5 1.7 1.2 0.9 0.9
F See AASHTO Article 3.4.3
Note: Use straight–line interpolation for intermediate values of PGA
For Site Class = D and PGA = 0.371 g, FPGA = 1.129
Table 3.4.2.3-1 (for Fa)—Values of Fa as a Function of Site Class and Mapped Short-Period Spectral Acceleration Coefficient
Site Class Spectral Response Acceleration Parameter at Short Periods
SS ≤ 0.25 SS = 0.50 SS = 0.75 SS = 1.00 SS ≥ 1.25
A 0.8 0.8 0.8 0.8 0.8
B 1.0 1.0 1.0 1.0 1.0
C 1.2 1.2 1.1 1.0 1.0
D 1.6 1.4 1.2 1.1 1.0
E 2.5 1.7 1.2 0.9 0.9
F See AASHTO Article 3.4.3
Note: Use straight–line interpolation for intermediate values of SS
For Site Class = D and SS = 0.899 g, Fa = 1.140
Page 3 of 7Design Maps Detailed Report
6/30/2014http://ehp3-earthquake.wr.usgs.gov/designmaps/us/report.php?template=minimal&latitude...

Equation (3.4.1-1):
Equation (3.4.1-2):
Equation (3.4.1-3):
Table 3.4.2.3-2—Values of Fv as a Function of Site Class and Mapped 1-sec Period Spectral Acceleration Coefficient
Site Class Mapped Spectral Response Acceleration Coefficient at 1-sec Periods
S1 ≤ 0.10 S1 = 0.20 S1 = 0.30 S1 = 0.40 S1 ≥ 0.50
A 0.8 0.8 0.8 0.8 0.8
B 1.0 1.0 1.0 1.0 1.0
C 1.7 1.6 1.5 1.4 1.3
D 2.4 2.0 1.8 1.6 1.5
E 3.5 3.2 2.8 2.4 2.4
F See AASHTO Article 3.4.3
Note: Use straight–line interpolation for intermediate values of S1
For Site Class = D and S1 = 0.328 g, Fv = 1.744
AS = FPGA PGA = 1.129 x 0.371 = 0.419 g
SDS = Fa SS = 1.140 x 0.899 = 1.025 g
SD1 = Fv S1 = 1.744 x 0.328 = 0.572 g
Figure 3.4.1-1: Design Response Spectrum
Page 4 of 7Design Maps Detailed Report
6/30/2014http://ehp3-earthquake.wr.usgs.gov/designmaps/us/report.php?template=minimal&latitude...

Page 5 of 7Design Maps Detailed Report
6/30/2014http://ehp3-earthquake.wr.usgs.gov/designmaps/us/report.php?template=minimal&latitude...
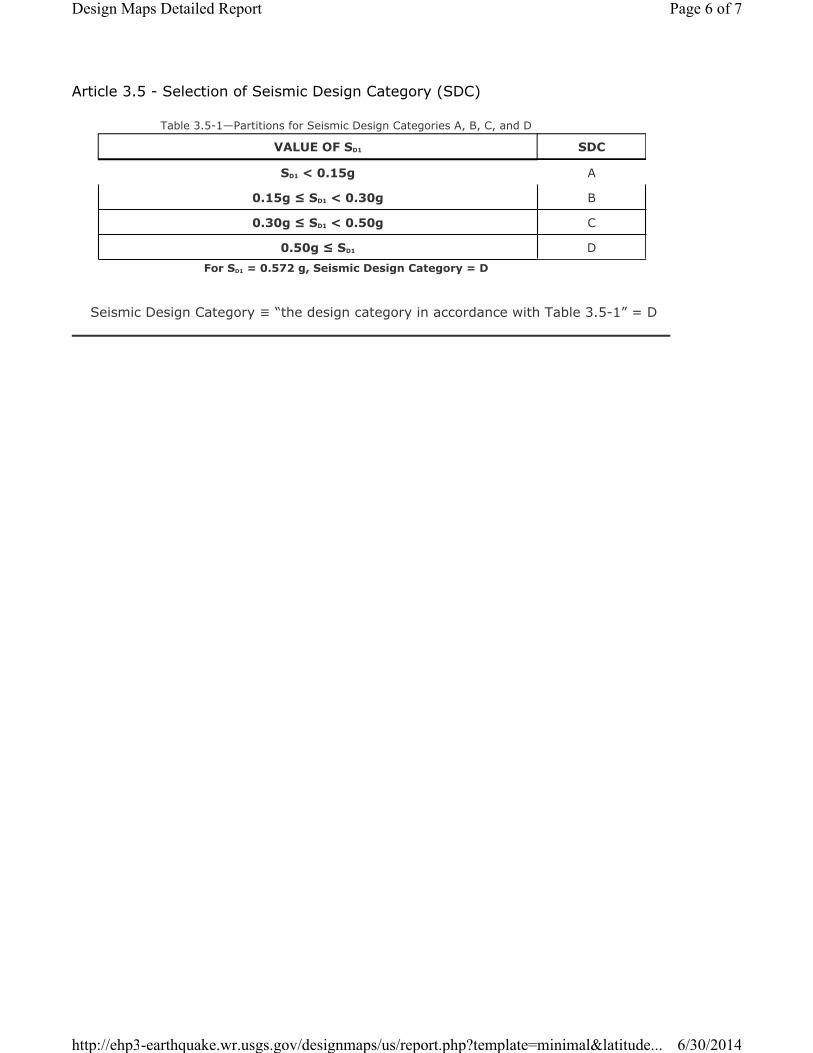
Article 3.5 - Selection of Seismic Design Category (SDC)
Table 3.5-1—Partitions for Seismic Design Categories A, B, C, and D
VALUE OF SD1 SDC
SD1 < 0.15g A
0.15g ≤ SD1 < 0.30g B
0.30g ≤ SD1 < 0.50g C
0.50g ≤ SD1 DFor SD1 = 0.572 g, Seismic Design Category = D
Seismic Design Category ≡ “the design category in accordance with Table 3.5-1” = D
Page 6 of 7Design Maps Detailed Report
6/30/2014http://ehp3-earthquake.wr.usgs.gov/designmaps/us/report.php?template=minimal&latitude...

References
1. Figure 3.4.1-2: http://earthquake.usgs.gov/hazards/designmaps/downloads/pdfs/AASHTO-2009-Figure-3.4.1-2.pdf
2. Figure 3.4.1-3: http://earthquake.usgs.gov/hazards/designmaps/downloads/pdfs/AASHTO-2009-Figure-3.4.1-3.pdf
3. Figure 3.4.1-4: http://earthquake.usgs.gov/hazards/designmaps/downloads/pdfs/AASHTO-2009-Figure-3.4.1-4.pdf
Page 7 of 7Design Maps Detailed Report
6/30/2014http://ehp3-earthquake.wr.usgs.gov/designmaps/us/report.php?template=minimal&latitude...

This web-based tool calculates both deterministic and probabilistic acceleration response spectra for any location in California based on criteriaprovided in Appendix B of Caltrans Seismic Design Criteria. More...
Caltrans ARS Online (v2.3.06)
SELECT SITE LOCATION
Latitude: 38.88849417 Longitude: -119.16784286 VS30: m/s290 Calculate
CALCULATED SPECTRA Display Curves: 3
Map data ©2014 GoogleReport a map error
Page 1 of 2ARS Online
7/29/2014http://dap3.dot.ca.gov/ARS_Online/

Conditions of Use | Privacy PolicyCopyright © 2009 State of California
Page 2 of 2ARS Online
7/29/2014http://dap3.dot.ca.gov/ARS_Online/

About
ABOUT CALTRANS ARS ONLINEThis web-based tool calculates both deterministic and probabilistic acceleration response spectra for any location in California based on criteria provided in Appendix B of Caltrans Seismic Design Criteria.
The deterministic spectrum is determined as the average of median response spectra calculated using the Campbell-Bozorgnia (2008) and Chiou-Youngs (2008) ground motion prediction equations developed under the “Next Generation Attenuation” project coordinated through the PEER-Lifelines program. These equations are applied to all faults considered to be active in the last 750,000 years (late-Quaternary age) that are capable of producing a moment magnitude earthquake of 6.0 or greater. The probabilistic spectrum is obtained from the USGS (2008) National Hazard Map for 5% probability of exceedance in 50 years. Caltrans design spectrum is based on the larger of the deterministic and probabilistic spectral values. Both the deterministic and probabilistic spectra account for soil effects through incorporation of the parameter Vs30, the average shear wave velocity in the upper 30 meters of the soil profile.
The map layer of California faults was constructed at an approximate scale of 1:750,000 (1 inch = 12 miles). Use of the zoom tool can result in a detailed satellite image and fault overlay that gives the appearance of greater precision in mapped fault locations than there really is. Therefore this map is intended for use in ground motion evaluation and should not be used for project scale fault location. The user is referred to the Technical References section of this site for updates in fault information and map errata.
THE PROJECT TEAMXing Liu ([email protected])Tom Shantz([email protected])Martha K Merriam([email protected])Loren Turner ([email protected])Brian Chiou ([email protected])
The GeoResearch GroupDivision of Research & Innovation5900 Folsom Blvd, MS-5, Sacramento CA, 95819
For questions or comments about this tool, please contact Tom Shantz by email or by phone at (916) 227-7245.
HISTORY OF THE PROJECTThe development of Caltrans ARS Online was prompted by a larger effort to update the specification of seismic loading in Caltrans Seismic Design Criteria (SDC). The update had three primary thrusts:
Faced with the added complexity associated with applying the NGA ground motion prediction models as well as the adoption of probabilistic criteria to the creation of the design spectrum, the SDC update team launched an effort to develop a user friendly web based design tool for the development of design spectra that meet SDC criteria. CaltransARS Online is the product of those efforts.
Adoption of the latest source models. This led to the adoption, deletion, or relocation of many faults relative to the 1996 Caltrans Fault Map (Mualchin, 1996)
Adoption of recently developed Next Generation Attenuation (NGA) ground motion prediction models (Earthquake Spectra, Vol.24, No.1, Special Issue on the Next Generation Attenuation Project, February 2008)
Page 1 of 2About
11/20/2014http://dap3.dot.ca.gov/ARS_Online/about.php

Inclusion of a probabilistic component in the design spectrum specification.
ACKNOWLEDGEMENTSThis project has benefited greatly by the direct or indirect involvement of many individuals. The SDC update team was led by Mike Keever. The Geotechnical Services review/implementation team was led by Hector Valencia and John Bowman. Team members included Hossain Salimi, Reza Mahallati, Mahmoud Khojasteh, and Mark Yashinsky (Office of Earthquake Engineering). GIS support was provided by Ke Zhou. Management support was provided by Mark Willian and Tom Ostrom.
The earthquake source model is based primarily on the 2005 California Geological Survey (CGS) interim revision of the 1994 Jennings fault database with additions and modifications from the United States Geological Survey (USGS), CGS, United States Bureau of Reclamation (USBR), the Community Fault Model (CFM) by Harvard University and the Southern California Earthquake Center (SCEC), and many others. Revisions to the fault database are ongoing, sought through outside comments, and will be provided in a timely manner on the website. The project team thanks the CGS, in particular Bill Bryant and Chris Wills, for assistance and helpful suggestions.
The project team is very grateful to Steve Harmsen and Mark Petersen of the US Geological Survey, Golden, Colorado for providing the probabilistic hazard data used in Caltrans ARS Online. The team is also grateful to providers of the following information:
The Southern California model basin model (Z1.0 and Z2.5) implemented in Caltrans ARS Online based entirely on the Community Velocity Model (Version 4) developed by researchers at Harvard University and the Southern California Earthquake Center (SCEC).
The Northern California basin model implemented in Caltrans ARS Online based primarily on work by Cliff Thurber (University of Wisconsin – Madison) and Tom Brocher and Brad Aagard (US Geological Survey, Menlo Park, California).
Conditions of Use | Privacy PolicyCopyright © 2009 State of California
Page 2 of 2About
11/20/2014http://dap3.dot.ca.gov/ARS_Online/about.php

APPENDIX E : Pile Driving Analysis

NDOT Geotechnical Jun 02 2015Nordyke B-1610 : 04/01/2015 : Lawrence
Gain/Loss 1 at Shaft and Toe 0.796 / 1.000GRLWEAP Version 2010
Dep
th (f
t)
0 10 20 30 40
5
10
15
20
25
30
35
40
45
50
Blow Count (blows/ft)
Dep
th (f
t)
0 200 400 600 800
5
10
15
20
25
30
35
40
45
50
Ult. Capacity (kips)
0 20 40 60 80
5
10
15
20
25
30
35
40
45
50
Tension (ksi)
0 20 40 60 80
5
10
15
20
25
30
35
40
45
50
Comp. Stress (ksi)
0 4 8 12 16
5
10
15
20
25
30
35
40
45
50
Stroke (ft)
0 20 40 60 80
5
10
15
20
25
30
35
40
45
50
ENTHRU (kips-ft)

NDOT Geotechnical Jun 02 2015 GRLWEAP Version 2010Nordyke B-1610 : 04/01/2015 : Lawrence
Gain/Loss 1 at Shaft and Toe 0.796 / 1.000
Ultimate End Blow Comp. Tension Depth Capacity Friction Bearing Count Stress Stress Stroke ENTHRUft kips kips kips blows/ft ksi ksi ft kips-ft
5.0 34.7 18.8 15.9 -1.0 0.000 0.000 0.00 0.0 10.0 53.5 37.6 15.9 2.8 13.145 0.000 4.05 48.3 10.0 114.3 37.7 76.6 6.2 24.063 0.000 5.28 43.5 12.5 141.9 48.5 93.4 7.7 26.557 0.000 5.66 42.0 15.0 162.3 60.7 101.6 8.8 28.064 0.000 5.94 41.3 15.0 65.6 60.8 4.8 3.1 15.180 0.000 4.11 47.5 17.5 67.4 62.7 4.8 3.2 15.750 -0.723 4.16 47.2 20.0 69.3 64.5 4.8 3.3 16.463 -1.238 4.22 47.0 20.0 78.9 64.6 14.3 3.9 18.497 -1.067 4.43 46.1 22.5 83.3 68.9 14.3 4.1 19.619 -1.492 4.54 45.7 25.0 87.6 73.3 14.3 4.4 20.570 -1.998 4.65 45.2 25.0 190.4 73.4 117.0 10.7 30.365 0.000 6.46 40.3 27.5 205.5 86.0 119.4 11.5 31.176 0.000 6.62 40.0 30.0 221.4 99.6 121.9 12.4 32.125 0.000 6.77 39.6 30.0 302.2 99.8 202.3 19.3 35.961 0.000 7.81 37.7 35.0 368.1 139.0 229.1 25.2 37.555 0.000 8.44 36.8 40.0 436.2 183.5 252.7 32.8 40.409 0.000 9.01 35.6
Total Continuous Driving Time 9.00 minutes; Total Number of Blows 391