geothermal development and forecas;ng for space hea;ng and
TRANSCRIPT

UPEC2016
GeothermalDevelopmentandForecas;ngforSpaceHea;ngand
ElectricityGenera;on
EgillBenediktHreinsson
UniversityofIcelandReykjavik,Iceland
UPEC201651stInterna;onalUniversi;esPowerEngineeringConference
6-9September2016,Coimbra,Portugal
1

UPEC2016
Planofthepresenta.on• Stateofgeothermalgenera;onworldwide
• ImportanceofgeothermalenergyinIceland.
• GeologicalbaseforgeothermalenergyinIceland.
• Geothermalenergyflow– Energybalance
• GeothermalU;liza;oncategories– Electricitygenera;on– Spacehea;ng– Industry– Hor;culture– Swimmingpools
• Economicimportanceofgeothermalenergy
• Geothermalforecas;ng• Discussion,Conclusions

UPEC2016
Geothermalgenera.on,1980-2012
Geothermal Development and Forecasting for SpaceHeating and Electricity Generation
Egill Benedikt HreinssonDepartment of Electrical and Computer Engineering,
University of Iceland, Hjarðarhagi 6, 107 Reykjavik, IcelandEmail: [email protected]
Abstract—Iceland is one of the countries with the highestdevelopment of geothermal energy. Geothermal energy is usedexpensively for space heating in the cold climate of Iceland inaddition to using it for electricity generation. The paper presentsa survey of this development, current status and future prospects,both the widespread use of geothermal energy for residentialspace (district) heating, and its history, especially in urbancommunities. The phenomenally rapid development in electricitygeneration is also reviewed. The paper also discusses briefly theinternational situation in geothermal energy and describes therole of geothermal energy in the fuel substitution process inIceland since the early 20th century. We also characterize majorgeothermal high temperature areas, their potential output andlocations based on the underlying geological aspects.
Furthermore, the paper presents geothermal energy forecastsand forecasting methods, in particular those published by thepublic Energy Forecasting Committee (EFC) with the mandate,since 1978 of forecasting future energy use, including the geother-mal component.
Geothermal electricity generation’s share in world electricalgeneration has been approximately constant in the last twodecades but grown explosively in Iceland. We review this highgrowth of geothermal electricity and the developed high pen-etration of space heating and industrial use in Iceland. Thiswill cast light on the importance of geothermal energy in thisvery important "geothermal country" of Iceland in internationalcontext.
I. INTRODUCTION
Figure 1 shows the world geothermal electrical generationas a fraction of total generation, while Figure 2 shows thesame relative growth process in the case of Iceland. Note theexplosive relative growth of geothermal electricity generationin Iceland in recent years, as compared to the developmentworldwide, where the geothermal share has been relativelyflat for at least the last 20 years.
These Figures are representative and reflect the uniquegeothermal situation in Iceland, which also ranks among thecountries with highest share of geothermal energy in its elec-trical energy budget. Figure 3 shows this share as a percentageof total generation for several countries, where geothermalpenetration is high in the electrical power system. The Figurealso shows the electricity generation in absolute terms in GWh.The United States here followed by the Philippines, Indonesiaand Mexico lead in terms of quantity counted in GWh per year,as of 2010. However, ranking the countries when geothermalgeneration is compared to the total electricity generation,
0.00%
0.05%
0.10%
0.15%
0.20%
0.25%
0.30%
0.35%
Worldgeothermalelectricitygenera8onasafrac8onoftotalgenera8on
1980
1982
1984
1986
1988
1990
1992
1994
1996
1998
2000
2002
2004
2006
2008
2010
2012
Figure 1. Historical development of geothermal electrical generation as afraction of total electricity generation, worldwide, 1980 - 2012. Note therapid growth in the 1980s, but since about 1990, the growth in geothermalgeneration worldwide has just kept up with total electricity generation growth.Based on publicly available data from [1].
0.0%
5.0%
10.0%
15.0%
20.0%
25.0%
30.0%
1980
1982
1984
1986
1988
1990
1992
1994
1996
1998
2000
2002
2004
2006
2008
2010
2012
Geothermal electricity generation as a fraction of total electricity generation in Iceland:
Figure 2. Historical development of geothermal electrical generation as afraction of total electricity generation for the case of Iceland 1980 - 2012.Note the explosive relative growth of geothermal in Iceland in the last 25years. Also, by comparing Figures 1 and 2, the geothermal generation as afraction of total generation is for Iceland a bout a hundred times the worldaverage. Based on publicly available data from [1].
3

UPEC2016UPEC2016
Geothermal Development and Forecasting for SpaceHeating and Electricity Generation
Egill Benedikt HreinssonDepartment of Electrical and Computer Engineering,
University of Iceland, Hjarðarhagi 6, 107 Reykjavik, IcelandEmail: [email protected]
Abstract—Iceland is one of the countries with the highestdevelopment of geothermal energy. Geothermal energy is usedexpensively for space heating in the cold climate of Iceland inaddition to using it for electricity generation. The paper presentsa survey of this development, current status and future prospects,both the widespread use of geothermal energy for residentialspace (district) heating, and its history, especially in urbancommunities. The phenomenally rapid development in electricitygeneration is also reviewed. The paper also discusses briefly theinternational situation in geothermal energy and describes therole of geothermal energy in the fuel substitution process inIceland since the early 20th century. We also characterize majorgeothermal high temperature areas, their potential output andlocations based on the underlying geological aspects.
Furthermore, the paper presents geothermal energy forecastsand forecasting methods, in particular those published by thepublic Energy Forecasting Committee (EFC) with the mandate,since 1978 of forecasting future energy use, including the geother-mal component.
Geothermal electricity generation’s share in world electricalgeneration has been approximately constant in the last twodecades but grown explosively in Iceland. We review this highgrowth of geothermal electricity and the developed high pen-etration of space heating and industrial use in Iceland. Thiswill cast light on the importance of geothermal energy in thisvery important "geothermal country" of Iceland in internationalcontext.
I. INTRODUCTION
Figure 1 shows the world geothermal electrical generationas a fraction of total generation, while Figure 2 shows thesame relative growth process in the case of Iceland. Note theexplosive relative growth of geothermal electricity generationin Iceland in recent years, as compared to the developmentworldwide, where the geothermal share has been relativelyflat for at least the last 20 years.
These Figures are representative and reflect the uniquegeothermal situation in Iceland, which also ranks among thecountries with highest share of geothermal energy in its elec-trical energy budget. Figure 3 shows this share as a percentageof total generation for several countries, where geothermalpenetration is high in the electrical power system. The Figurealso shows the electricity generation in absolute terms in GWh.The United States here followed by the Philippines, Indonesiaand Mexico lead in terms of quantity counted in GWh per year,as of 2010. However, ranking the countries when geothermalgeneration is compared to the total electricity generation,
0.00%
0.05%
0.10%
0.15%
0.20%
0.25%
0.30%
0.35%
Worldgeothermalelectricitygenera8onasafrac8onoftotalgenera8on
1980
1982
1984
1986
1988
1990
1992
1994
1996
1998
2000
2002
2004
2006
2008
2010
2012
Figure 1. Historical development of geothermal electrical generation as afraction of total electricity generation, worldwide, 1980 - 2012. Note therapid growth in the 1980s, but since about 1990, the growth in geothermalgeneration worldwide has just kept up with total electricity generation growth.Based on publicly available data from [1].
0.0%
5.0%
10.0%
15.0%
20.0%
25.0%
30.0%1980
1982
1984
1986
1988
1990
1992
1994
1996
1998
2000
2002
2004
2006
2008
2010
2012
Geothermal electricity generation as a fraction of total electricity generation in Iceland:
Figure 2. Historical development of geothermal electrical generation as afraction of total electricity generation for the case of Iceland 1980 - 2012.Note the explosive relative growth of geothermal in Iceland in the last 25years. Also, by comparing Figures 1 and 2, the geothermal generation as afraction of total generation is for Iceland a bout a hundred times the worldaverage. Based on publicly available data from [1].
4

UPEC2016
Shareofgeothermal
Iceland is at the top of the list followed by El Salvadorand Kenya. Once again, Iceland’s position is therefore ratherunique, as it is also generally considered a developed country,but is here surrounded by countries that may be considered tobe under development.
Figure 4 shows the place of geothermal among other energyresources in the overall energy development of Iceland sincebefore the middle of the 20th century. This includes bothgeothermal electricity generation and space heating, where thesmaller insert in the Figure shows fractional breakdown witha marked increasing geothermal share. From the Figure, wecan draw the conclusion, that the majority of gross energy useis from geothermal sources and also the renewable geothermaland hydroelectric indigenous energy resources have developedsubstantially in the last 30-40 years, thereby replaced importedfuel based energy.
The above Figures and conclusions cast a light on the impor-tant position geothermal energy holds in Iceland. Therefore,the purpose of this paper is threefold:
• First, to take a closer look at the geothermal development,and its position in terms of electricity generation inIceland.
• Secondly, to review the economically important appli-cation of geothermal energy in district heating. Thisactivity, which started in the early part of the 20th century,has been increasing dramatically for the last 40 years, inparticular in the 1970s.
• Last but not least, we present a review of forecasts intothe future made to map out the potential increased use ofgeothermal energy in all aspects.
Accordingly, the paper is organized as follows:• The remainder of the introductory Section I discusses the
underlying geological aspects for the geothermally richIcelandic energy resources.
• In Section II we review the development of electricitygeneration by geothermal energy in Iceland.
• In Section III we review space heating and other geother-mal applications in Iceland.
• In Section IV we present and discuss the most recentforecasts, as published by the official Energy ForecastingCommittee (EFC) [2].
• Section V presents discussions and conclusions.• Finally the paper is concluded with a references section.Before embarking on the mission of the paper, as stated
above, it is worthwhile to take a closer look at the basis of thegeothermal development from the point of view of the geologyof Iceland and the main drivers in terms of volcanic activity.
Iceland is located in the North-Atlantic ocean on the socalled Mid-Atlantic ridge, where two continental plates meet;hence its well known volcanic activity. Figure 5 shows a mapwhere the ridge runs through the country from the south andsouth-west as an active volcanic zone, shown as a ribbon withthe darkest color. Note that this to the south, this ribbon issplit into two "legs". Within this zone the majority of the mostactive volcanoes are located.
Figure 3. Percentage of the national electricity production that geothermalenergy provides in respective countries in 2010. The absolute figures in GWhfor generation are shown in front of each horizontal column. The highestcountry in absolute terms is the United States (14,974 GWh in 2010), but asa fraction of its total generation it ranks quite low. Adapted from [3].
Hydropower
Geothermal
Oil
Coal
0
50
100
150
200
250
300
1940 1945 1950 1955 1960 1965 1970 1975 1980 1985 1990 1995 2000 2005 2010 2015
Prim
aryEn
ergyUse[P
J]
OrkustofnunDataRepository:OS-2016-T002-01
Hydro-power
Geo-thermal
OilCoal
Peat
0%
20%
40%
60%
80%
100%
1940194519501955196019651970197519801985199019952000200520102015
Figure 4. Primary energy use in Iceland from 1940 - 2015 in PJ (PetaJoule).The Figure shows both electricity generation and other uses of energy,such as space heating and transportation. The different shades show Hydro,Geothermal, Oil and Coal as primary energy resources. The insert showsfractional distribution or fuel substitution, where oil originally replaced coaland how renewable energy is gradually replacing oil. Adapted from [4] and[5].
The Figure also shows two categories of geothermal areas,high temperature fields and low temperature fields. Most ofthe geothermal electric plants are located on high temperaturefields, but district heating may be based on low temperaturewells. It may also be based in connection with electricitygeneration in a high temperature field.
When comparing Figures 5 and 6 it can be seen thatgeneration is mostly at both ends of the ribbon, as previouslymentioned. This location is also closest to the major urbanareas (Reykjavik/Akureyri) and closest to the main electricitytransmission system (Not discussed here). Therefore the hightemperature wells located in or near the highlands in themiddle of Iceland are mostly unexploited.
There has been much research and discussion on sustainableutilization as in [8], [7], [9]. The prevalent view is that theunderground wells will regenerate themselves with an inflowof steam and heat and hence be replenished if the outflowinto boreholes and man made generators is below a given
Percentage of the national electricity production that geothermal energy provides in respective countries in 2010
5

UPEC2016
PrimaryenergyuseinIceland1940-2015
Iceland is at the top of the list followed by El Salvadorand Kenya. Once again, Iceland’s position is therefore ratherunique, as it is also generally considered a developed country,but is here surrounded by countries that may be considered tobe under development.
Figure 4 shows the place of geothermal among other energyresources in the overall energy development of Iceland sincebefore the middle of the 20th century. This includes bothgeothermal electricity generation and space heating, where thesmaller insert in the Figure shows fractional breakdown witha marked increasing geothermal share. From the Figure, wecan draw the conclusion, that the majority of gross energy useis from geothermal sources and also the renewable geothermaland hydroelectric indigenous energy resources have developedsubstantially in the last 30-40 years, thereby replaced importedfuel based energy.
The above Figures and conclusions cast a light on the impor-tant position geothermal energy holds in Iceland. Therefore,the purpose of this paper is threefold:
• First, to take a closer look at the geothermal development,and its position in terms of electricity generation inIceland.
• Secondly, to review the economically important appli-cation of geothermal energy in district heating. Thisactivity, which started in the early part of the 20th century,has been increasing dramatically for the last 40 years, inparticular in the 1970s.
• Last but not least, we present a review of forecasts intothe future made to map out the potential increased use ofgeothermal energy in all aspects.
Accordingly, the paper is organized as follows:• The remainder of the introductory Section I discusses the
underlying geological aspects for the geothermally richIcelandic energy resources.
• In Section II we review the development of electricitygeneration by geothermal energy in Iceland.
• In Section III we review space heating and other geother-mal applications in Iceland.
• In Section IV we present and discuss the most recentforecasts, as published by the official Energy ForecastingCommittee (EFC) [2].
• Section V presents discussions and conclusions.• Finally the paper is concluded with a references section.Before embarking on the mission of the paper, as stated
above, it is worthwhile to take a closer look at the basis of thegeothermal development from the point of view of the geologyof Iceland and the main drivers in terms of volcanic activity.
Iceland is located in the North-Atlantic ocean on the socalled Mid-Atlantic ridge, where two continental plates meet;hence its well known volcanic activity. Figure 5 shows a mapwhere the ridge runs through the country from the south andsouth-west as an active volcanic zone, shown as a ribbon withthe darkest color. Note that this to the south, this ribbon issplit into two "legs". Within this zone the majority of the mostactive volcanoes are located.
Figure 3. Percentage of the national electricity production that geothermalenergy provides in respective countries in 2010. The absolute figures in GWhfor generation are shown in front of each horizontal column. The highestcountry in absolute terms is the United States (14,974 GWh in 2010), but asa fraction of its total generation it ranks quite low. Adapted from [3].
Hydropower
Geothermal
Oil
Coal
0
50
100
150
200
250
300
1940 1945 1950 1955 1960 1965 1970 1975 1980 1985 1990 1995 2000 2005 2010 2015
Prim
aryE
nergyU
se[P
J]
OrkustofnunDataRepository:OS-2016-T002-01
Hydro-power
Geo-thermal
OilCoal
Peat
0%
20%
40%
60%
80%
100%
1940194519501955196019651970197519801985199019952000200520102015
Figure 4. Primary energy use in Iceland from 1940 - 2015 in PJ (PetaJoule).The Figure shows both electricity generation and other uses of energy,such as space heating and transportation. The different shades show Hydro,Geothermal, Oil and Coal as primary energy resources. The insert showsfractional distribution or fuel substitution, where oil originally replaced coaland how renewable energy is gradually replacing oil. Adapted from [4] and[5].
The Figure also shows two categories of geothermal areas,high temperature fields and low temperature fields. Most ofthe geothermal electric plants are located on high temperaturefields, but district heating may be based on low temperaturewells. It may also be based in connection with electricitygeneration in a high temperature field.
When comparing Figures 5 and 6 it can be seen thatgeneration is mostly at both ends of the ribbon, as previouslymentioned. This location is also closest to the major urbanareas (Reykjavik/Akureyri) and closest to the main electricitytransmission system (Not discussed here). Therefore the hightemperature wells located in or near the highlands in themiddle of Iceland are mostly unexploited.
There has been much research and discussion on sustainableutilization as in [8], [7], [9]. The prevalent view is that theunderground wells will regenerate themselves with an inflowof steam and heat and hence be replenished if the outflowinto boreholes and man made generators is below a given
6

UPEC2016
Ac.vevolcanicandhightemperatureareas
Volcanic zone
HveravellirHágöngur
Vonarskarð
Kverkfjöll
Askja
Fremrinámar
Námafjall
GjástykkiÞeistareykir
Krafla
Hrútshálsar
Grímsvötn
Torfajökull
Katla
Eyjafjallajökull
Kerlingafjöll
Geysir
Prestahnjúkar
Trölladyngja
Westman Islands
Eldvörp
Hengill
Reykjanes KrísuvíkBrennist.fjöll
Figure 5. Location and names of high temperature geothermal fields (Largercircles) in the volcanic zone in Iceland. Clusters of low temperature springs(Smaller dots) are also shown on the flanks of the volcanic zones. Thevolcanically active zone runs from the North-East to the South-West, where itis split between western part in the Reykjanes peninsula and the eastern partthrough the Katla and Eyjafjallavökull volcanoes. Adapted from [6]. See also[7].
maximum limit. However,of course, this limit is locationspecific and may be difficult to estimate, due to the lack ofmeasurable parameters. But on a long time scale, such as100 to 300 years if the wells are utilized above this limit,they should be able to be replenished by "resting" them, thatis reducing or altogether stopping the utilization for a givenperiod.
Next we turn to an overview of electricity generation inIceland from geothermal resources.
II. GEOTHERMAL ELECTRICITY GENERATION
As previously mentioned, the development of geothermalpower for electricity generation has been explosive in recentyears and the rapid growth is shown in Figure 6. The Figureshows the location of major generating plants on a map ofIceland, along with the annual electricity generation of newstations in GWh/year. The most recent plants are concentratedin the South-west Reykjanes peninsula and its volcanicallyactive areas of the south-west.
The five largest geothermal stations are presently the follow-ing, where the first four are located near Reykjavik or in theReykjanes peninsula and the last three located in the North-East [10]:
1) Hellisheiði Power Station (303 MW)2) Nesjavellir Geothermal Power Station (120 MW)3) Reykjanes Power Station (100 MW)4) Svartsengi Power Station (76.5 MW)5) Krafla Power Station (60 MW)6) Bjarnaflag (3.2 MW)7) Húsavík (2 MW)Svartsengi, Nesjavellir and Hellisheiði are combined heat
and power (CHP) plant, where geothermal water is divertedto distric heating systems in urban communities.
5001000150020002500300035004000450050005500
0
(GWh/year)Electricity generation
19771972 19871982 1992 1997 2002 2007 2012
(3) Krafla 60MW
(1) Bjarnarflag 3,2 MW
7
5
4
3
6
1
2
(2) Svartsengi 76.4 MW
(4) Nesjavellir 120 MW
(7) Hellisheiði 303 MW
(5) Húsavík 2 MW
(6) Reykjanes 100 MWReykjanes
peninsula
Figure 6. Historical development of geothermal electrical energy generationin Iceland and the location of the major geothermal stations, shown in theinsert, concentrated in two areas, the Reykjanes peninsula and the North-East.Adapted from [5].
Figure 7. Hellisheiði Power Station near Reykjavik. From the ON web-site[14].
In this paper we will not cover the geothermal technologyor cycle, but [11] reviews the Nesjavellir, [12] discusses theplant design of Hellisheiði plant and [13] discusses apparatusof Svartsengi and Reykjanes plants.
Figure 7 shows an example of a geothermal station,Hellisheiði which is operated by Orka náttúrunnar (ON) [14]a subsidiary of Reykjavik Energy (RE) the municipal utilitywith the role of generating and selling energy in Reykjavik.Direct utilization, which is the topic of the next section, isdiscussed in [15] and [16] discusses recent developments.
III. GEOTHERMAL HEATING APPLICATIONS IN ICELAND
Heating houses by geothermal water is a very importantdirect application of geothermal energy in the cold climate ofIceland. Here we will discuss two aspects of "space" heating:(A) the district heating systems and (B), another important"Icelandic" application, namely the use of geothermal waterto heat swimming pools.
In addition, a short discussion is presented of the economicsignificance of having access to the abundant resources interms of savings in import fossil fuel.
7

UPEC2016
MAJORGENERATINGSTATIONS
• 1)HellisheiðiPowerSta.on(303MW)• 2)NesjavellirGeothermalPowerSta.on(120MW)• 3)ReykjanesPowerSta.on(100MW)• 4)SvartsengiPowerSta.on(76.5MW)• 5)KraflaPowerSta.on(60MW)• 6)Bjarnaflag(3.2MW)• 7)Húsavík(2MW)
8

UPEC2016
Geothermaldevelopment
Volcanic zone
HveravellirHágöngur
Vonarskarð
Kverkfjöll
Askja
Fremrinámar
Námafjall
GjástykkiÞeistareykir
Krafla
Hrútshálsar
Grímsvötn
Torfajökull
Katla
Eyjafjallajökull
Kerlingafjöll
Geysir
Prestahnjúkar
Trölladyngja
Westman Islands
Eldvörp
Hengill
Reykjanes KrísuvíkBrennist.fjöll
Figure 5. Location and names of high temperature geothermal fields (Largercircles) in the volcanic zone in Iceland. Clusters of low temperature springs(Smaller dots) are also shown on the flanks of the volcanic zones. Thevolcanically active zone runs from the North-East to the South-West, where itis split between western part in the Reykjanes peninsula and the eastern partthrough the Katla and Eyjafjallavökull volcanoes. Adapted from [6]. See also[7].
maximum limit. However,of course, this limit is locationspecific and may be difficult to estimate, due to the lack ofmeasurable parameters. But on a long time scale, such as100 to 300 years if the wells are utilized above this limit,they should be able to be replenished by "resting" them, thatis reducing or altogether stopping the utilization for a givenperiod.
Next we turn to an overview of electricity generation inIceland from geothermal resources.
II. GEOTHERMAL ELECTRICITY GENERATION
As previously mentioned, the development of geothermalpower for electricity generation has been explosive in recentyears and the rapid growth is shown in Figure 6. The Figureshows the location of major generating plants on a map ofIceland, along with the annual electricity generation of newstations in GWh/year. The most recent plants are concentratedin the South-west Reykjanes peninsula and its volcanicallyactive areas of the south-west.
The five largest geothermal stations are presently the follow-ing, where the first four are located near Reykjavik or in theReykjanes peninsula and the last three located in the North-East [10]:
1) Hellisheiði Power Station (303 MW)2) Nesjavellir Geothermal Power Station (120 MW)3) Reykjanes Power Station (100 MW)4) Svartsengi Power Station (76.5 MW)5) Krafla Power Station (60 MW)6) Bjarnaflag (3.2 MW)7) Húsavík (2 MW)Svartsengi, Nesjavellir and Hellisheiði are combined heat
and power (CHP) plant, where geothermal water is divertedto distric heating systems in urban communities.
5001000150020002500300035004000450050005500
0
(GWh/year)Electricity generation
19771972 19871982 1992 1997 2002 2007 2012
(3) Krafla 60MW
(1) Bjarnarflag 3,2 MW
7
5
4
3
6
1
2
(2) Svartsengi 76.4 MW
(4) Nesjavellir 120 MW
(7) Hellisheiði 303 MW
(5) Húsavík 2 MW
(6) Reykjanes 100 MWReykjanes
peninsula
Figure 6. Historical development of geothermal electrical energy generationin Iceland and the location of the major geothermal stations, shown in theinsert, concentrated in two areas, the Reykjanes peninsula and the North-East.Adapted from [5].
Figure 7. Hellisheiði Power Station near Reykjavik. From the ON web-site[14].
In this paper we will not cover the geothermal technologyor cycle, but [11] reviews the Nesjavellir, [12] discusses theplant design of Hellisheiði plant and [13] discusses apparatusof Svartsengi and Reykjanes plants.
Figure 7 shows an example of a geothermal station,Hellisheiði which is operated by Orka náttúrunnar (ON) [14]a subsidiary of Reykjavik Energy (RE) the municipal utilitywith the role of generating and selling energy in Reykjavik.Direct utilization, which is the topic of the next section, isdiscussed in [15] and [16] discusses recent developments.
III. GEOTHERMAL HEATING APPLICATIONS IN ICELAND
Heating houses by geothermal water is a very importantdirect application of geothermal energy in the cold climate ofIceland. Here we will discuss two aspects of "space" heating:(A) the district heating systems and (B), another important"Icelandic" application, namely the use of geothermal waterto heat swimming pools.
In addition, a short discussion is presented of the economicsignificance of having access to the abundant resources interms of savings in import fossil fuel.
9

UPEC2016
Hellisheiðigeothermalpowersta.on
Volcanic zone
HveravellirHágöngur
Vonarskarð
Kverkfjöll
Askja
Fremrinámar
Námafjall
GjástykkiÞeistareykir
Krafla
Hrútshálsar
Grímsvötn
Torfajökull
Katla
Eyjafjallajökull
Kerlingafjöll
Geysir
Prestahnjúkar
Trölladyngja
Westman Islands
Eldvörp
Hengill
Reykjanes KrísuvíkBrennist.fjöll
Figure 5. Location and names of high temperature geothermal fields (Largercircles) in the volcanic zone in Iceland. Clusters of low temperature springs(Smaller dots) are also shown on the flanks of the volcanic zones. Thevolcanically active zone runs from the North-East to the South-West, where itis split between western part in the Reykjanes peninsula and the eastern partthrough the Katla and Eyjafjallavökull volcanoes. Adapted from [6]. See also[7].
maximum limit. However,of course, this limit is locationspecific and may be difficult to estimate, due to the lack ofmeasurable parameters. But on a long time scale, such as100 to 300 years if the wells are utilized above this limit,they should be able to be replenished by "resting" them, thatis reducing or altogether stopping the utilization for a givenperiod.
Next we turn to an overview of electricity generation inIceland from geothermal resources.
II. GEOTHERMAL ELECTRICITY GENERATION
As previously mentioned, the development of geothermalpower for electricity generation has been explosive in recentyears and the rapid growth is shown in Figure 6. The Figureshows the location of major generating plants on a map ofIceland, along with the annual electricity generation of newstations in GWh/year. The most recent plants are concentratedin the South-west Reykjanes peninsula and its volcanicallyactive areas of the south-west.
The five largest geothermal stations are presently the follow-ing, where the first four are located near Reykjavik or in theReykjanes peninsula and the last three located in the North-East [10]:
1) Hellisheiði Power Station (303 MW)2) Nesjavellir Geothermal Power Station (120 MW)3) Reykjanes Power Station (100 MW)4) Svartsengi Power Station (76.5 MW)5) Krafla Power Station (60 MW)6) Bjarnaflag (3.2 MW)7) Húsavík (2 MW)Svartsengi, Nesjavellir and Hellisheiði are combined heat
and power (CHP) plant, where geothermal water is divertedto distric heating systems in urban communities.
5001000150020002500300035004000450050005500
0
(GWh/year)Electricity generation
19771972 19871982 1992 1997 2002 2007 2012
(3) Krafla 60MW
(1) Bjarnarflag 3,2 MW
7
5
4
3
6
1
2
(2) Svartsengi 76.4 MW
(4) Nesjavellir 120 MW
(7) Hellisheiði 303 MW
(5) Húsavík 2 MW
(6) Reykjanes 100 MWReykjanes
peninsula
Figure 6. Historical development of geothermal electrical energy generationin Iceland and the location of the major geothermal stations, shown in theinsert, concentrated in two areas, the Reykjanes peninsula and the North-East.Adapted from [5].
Figure 7. Hellisheiði Power Station near Reykjavik. From the ON web-site[14].
In this paper we will not cover the geothermal technologyor cycle, but [11] reviews the Nesjavellir, [12] discusses theplant design of Hellisheiði plant and [13] discusses apparatusof Svartsengi and Reykjanes plants.
Figure 7 shows an example of a geothermal station,Hellisheiði which is operated by Orka náttúrunnar (ON) [14]a subsidiary of Reykjavik Energy (RE) the municipal utilitywith the role of generating and selling energy in Reykjavik.Direct utilization, which is the topic of the next section, isdiscussed in [15] and [16] discusses recent developments.
III. GEOTHERMAL HEATING APPLICATIONS IN ICELAND
Heating houses by geothermal water is a very importantdirect application of geothermal energy in the cold climate ofIceland. Here we will discuss two aspects of "space" heating:(A) the district heating systems and (B), another important"Icelandic" application, namely the use of geothermal waterto heat swimming pools.
In addition, a short discussion is presented of the economicsignificance of having access to the abundant resources interms of savings in import fossil fuel.
10

UPEC2016
Spacehea.ngbreak-down100%90%80%70%60%50%40%30%20%10%0% 1970 1975 19851980 1990 1995 2000 2005 2010
Geothermal
ElectricityOil
~90%
Figure 8. Fractional break-down of energy used in space heating 1970-2013in Iceland. The replacement of oil by geothermal water in the decade 1970-1980 was an important step towards independence of the economy from oilprice fluctuations. The Figure shows the complete dominance of geothermalenergy in heating buildings in 2013 with about 90% of the used energy fromgeothermal sources. Adapted from [5].
A. District heating
Historically, in the cold climate, the most important aspectof geothermal utilization is probably the space/district heatingof houses. Approximately 90% of residences and buildings inIceland are presently heated with geothermal water and morethan 90% of the population is connected to geothermal districtheating networks. Iceland is therefore the country with one ofthe highest penetration of district heating. Presently, there areabout 30 municipal district heating utilities or companies andwhere Reykjavik Energy (RE) [17] is by far the largest one[18], [19] (See Figure 16).
Drilling for hot water in Reykjavik stems from the year1928, but geothermal district heating in Reykjavík started acouple of years later, and presently the city of Reykjavikoperates the largest network in Iceland through RE. Therefore,the vast majority of the population in the capital Reykjavikand surrounding communities enjoys heating with geothermalwater, or approximately 99.9%. The population growth for theurban areas in and near Reykjavik has been high and furtherincreased this activity.
The low-temperature geothermal fields near Reykjavik arepresently almost fully utilized, and therefore RE has graduallyhad to reach further afield for its geothermal wells. Thus thefuture expansion will likely be based increasingly on high-temperature fields farther away, such as at geothermal powerstations. Also deep drilling was started in 2001 and there ishope that this research project will lead to additional energyfor space heating in the future [20].
Figure 8 shows the rapidly increasing geothermal part inthe overall energy for space heating during the last 45 years.It is notable, that in the wake of the first oil embargo in theearly 1970s, oil as an important medium for heating houseswas rapidly being replaced by geothermal water. This occurredlargely in one decade, the 1970s, as shown in Figure 8.
3%9%
7%
7% 47%
38%
7
3%
IndustryFisheries
Fish farming
Industrial use
Agriculture
Commercial and public services
Residential
Snow melting
Swimming centers and bathing
Greenhouses
9%
71%
Total 28.1PJ 3%
Space heating
2%
5%
2%
4%4%
Total 46.7 PJ (with electricity)Swimming pools
Greenhouses
Fish farming
Industry
Snow melting
43%Space heating
40%
Electricity generation
2014 2013
Figure 9. Utilization of geothermal energy in Iceland 2013 and 2014. Notethat the right side for 2013 includes electricity generation and is thereforenot comparable to the 2014 figures at the left showing heat use only. Theinner ring at left is the Eurostat categorization while the outer ring is the IGAcategorization [21]. The total use is given in PJ (Petajoule). The Figure onthe left is adapted from [21], and shows that the total energy use in 2014 was28.1 PJ. The right side of the Figure is adapted from [5].
B. Geothermal heating of swimming pools
Figure 9 is a pie chart with a break-down of the principalutilization categories for geothermal energy, both electric andnon-electric. Although electricity generation and space heatingdominate, heating of swimming pools is an important factor,comprising around 4% of the total. The total utilization peryear in 2013 was was around 46.7 PJ. Heating of pools ishere in the class with, for instance, snow melting in pavementsand walkways, and fish farming, each with a few % share.However, note that, the melting of snow and ice is generallya lower grade category, than say space heating, as it usesthe return water from house plumbing systems, where thetemperature is around 20-30 degrees (Centigrade) rather thanthe 80-90 degrees hot water that usually is needed to enterindividual houses from a district heating network.
Heating of pools is an interesting application. Figure 10shows a map of Iceland with the location of the manyswimming pools that are presently heated by geothermal water.These pools are often in smaller communities and rural areasand are popular among tourists as a destination, where oneshould bear in mind the the explosive growth of tourism inrecent years.
C. Economic significance of geothermal energy
We start by presenting two diagrams in order to illustrateas clearly as possible the economic benefit of having thesegeothermal resources.
Figure 11 illustrates the cost of hot water as compared tothe cost of oil with comparable energy contents to be usedfor space heating [22], and its evolution in the last 45 years.Geothermal water costs are derived from geothermal utilityrevenues or sales of hot water, as reported in their operationalstatement or balance sheet. Note that until the turn of thecentury, the oil price used is the average for each year. After2000 the average of January prices for two consecutive yearsis used to reflect winter prices.
Although other types of fuel - besides oil - would beconceivable, the economic benefit from having access to these
11

UPEC2016
Geothermalenergyu.liza.onin2013and2014
100%90%80%70%60%50%40%30%20%10%0% 1970 1975 19851980 1990 1995 2000 2005 2010
Geothermal
ElectricityOil
~90%
Figure 8. Fractional break-down of energy used in space heating 1970-2013in Iceland. The replacement of oil by geothermal water in the decade 1970-1980 was an important step towards independence of the economy from oilprice fluctuations. The Figure shows the complete dominance of geothermalenergy in heating buildings in 2013 with about 90% of the used energy fromgeothermal sources. Adapted from [5].
A. District heating
Historically, in the cold climate, the most important aspectof geothermal utilization is probably the space/district heatingof houses. Approximately 90% of residences and buildings inIceland are presently heated with geothermal water and morethan 90% of the population is connected to geothermal districtheating networks. Iceland is therefore the country with one ofthe highest penetration of district heating. Presently, there areabout 30 municipal district heating utilities or companies andwhere Reykjavik Energy (RE) [17] is by far the largest one[18], [19] (See Figure 16).
Drilling for hot water in Reykjavik stems from the year1928, but geothermal district heating in Reykjavík started acouple of years later, and presently the city of Reykjavikoperates the largest network in Iceland through RE. Therefore,the vast majority of the population in the capital Reykjavikand surrounding communities enjoys heating with geothermalwater, or approximately 99.9%. The population growth for theurban areas in and near Reykjavik has been high and furtherincreased this activity.
The low-temperature geothermal fields near Reykjavik arepresently almost fully utilized, and therefore RE has graduallyhad to reach further afield for its geothermal wells. Thus thefuture expansion will likely be based increasingly on high-temperature fields farther away, such as at geothermal powerstations. Also deep drilling was started in 2001 and there ishope that this research project will lead to additional energyfor space heating in the future [20].
Figure 8 shows the rapidly increasing geothermal part inthe overall energy for space heating during the last 45 years.It is notable, that in the wake of the first oil embargo in theearly 1970s, oil as an important medium for heating houseswas rapidly being replaced by geothermal water. This occurredlargely in one decade, the 1970s, as shown in Figure 8.
3%9%
7%
7% 47%
38%
7
3%
IndustryFisheries
Fish farming
Industrial use
Agriculture
Commercial and public services
Residential
Snow melting
Swimming centers and bathing
Greenhouses
9%
71%
Total 28.1PJ 3%
Space heating
2%
5%
2%
4%4%
Total 46.7 PJ (with electricity)Swimming pools
Greenhouses
Fish farming
Industry
Snow melting
43%Space heating
40%
Electricity generation
2014 2013
Figure 9. Utilization of geothermal energy in Iceland 2013 and 2014. Notethat the right side for 2013 includes electricity generation and is thereforenot comparable to the 2014 figures at the left showing heat use only. Theinner ring at left is the Eurostat categorization while the outer ring is the IGAcategorization [21]. The total use is given in PJ (Petajoule). The Figure onthe left is adapted from [21], and shows that the total energy use in 2014 was28.1 PJ. The right side of the Figure is adapted from [5].
B. Geothermal heating of swimming pools
Figure 9 is a pie chart with a break-down of the principalutilization categories for geothermal energy, both electric andnon-electric. Although electricity generation and space heatingdominate, heating of swimming pools is an important factor,comprising around 4% of the total. The total utilization peryear in 2013 was was around 46.7 PJ. Heating of pools ishere in the class with, for instance, snow melting in pavementsand walkways, and fish farming, each with a few % share.However, note that, the melting of snow and ice is generallya lower grade category, than say space heating, as it usesthe return water from house plumbing systems, where thetemperature is around 20-30 degrees (Centigrade) rather thanthe 80-90 degrees hot water that usually is needed to enterindividual houses from a district heating network.
Heating of pools is an interesting application. Figure 10shows a map of Iceland with the location of the manyswimming pools that are presently heated by geothermal water.These pools are often in smaller communities and rural areasand are popular among tourists as a destination, where oneshould bear in mind the the explosive growth of tourism inrecent years.
C. Economic significance of geothermal energy
We start by presenting two diagrams in order to illustrateas clearly as possible the economic benefit of having thesegeothermal resources.
Figure 11 illustrates the cost of hot water as compared tothe cost of oil with comparable energy contents to be usedfor space heating [22], and its evolution in the last 45 years.Geothermal water costs are derived from geothermal utilityrevenues or sales of hot water, as reported in their operationalstatement or balance sheet. Note that until the turn of thecentury, the oil price used is the average for each year. After2000 the average of January prices for two consecutive yearsis used to reflect winter prices.
Although other types of fuel - besides oil - would beconceivable, the economic benefit from having access to these
12

UPEC2016
SwimmingpoolsinIceland
Figure 10. Swimming pools in Iceland. The black circles indicate geothermalpools while the few grey circles are pools heated with other resources suchas by electricity. Adapted from [2].
020,00040,00060,000
80,000
100,000
120,000
140,000
160,000
19701975 1980 1985 1990 1995 2000 2005 2010
Million
sISK
OrkustofnunDataRepository:OS-2015-T009-01UElityrevenues Correspondingoilbill
Figure 11. The Figure shows cost of geothermal space heating comparedto oil heating if access to geothermal energy were not available. The lowergrey/red columns show the cost of geothermal space heating from utilityrevenues in Million ISK per year, where the current (March 2016) approximaterate of exchange is 130 ISK/US$. The solid higher black columns showthe corresponding cost if the energy were to be derived from imported oil.Adapted and redrawn from [22]. (Orkustofnun Data Repository: OS-2015-T009-01).
resources is substantial, as seen in the difference in thedifferent columns of Figure 11, and note the vertical axisis shown in Million Icelandic kr. (ISK). Another benefit isstabilizing effect of geothermal energy on fluctuating oil pricesand currency exchange rates.
Figure 12 from [23] shows another aspect of the benefits ofhaving these indigenous resources. It shows an estimate [23]of this benefit in the last one hundred years as a fraction ofthe Gross Domestic Product (GDP). The curve swings high inperiods of oil price hikes, but is lowered when oil prices fall.It is interesting to see this benefit as a significant fraction, or1 - 3 % of the GDP, as estimated in [23].
IV. GEOTHERMAL FORECASTING
Finally we well discuss here the geothermal forecasts madeby the EFC, as previously mentioned. The forecasts project
0%
1%
2%
3%
4%
5%
6%
7%
8%
1914
1919
1924
1929
1934
1939
1944
1949
1954
1959
1964
1969
1974
1979
1984
1989
1994
1999
2004
2009
2014
Avoide
dcostasa
percentageofGDP
Figure 12. The Figure shows a digram, stretching a whole century of history(1914-2014), showing the avoided cost in imported fuel resources, such asoil to replace geothermal space heating as a percentage of the gross domesticproducts. The Figure shows that the value of the avoided cost fluctuatesbetween about 1% of the GDP to about 6-7 % of the GDP. Adapted from[23] (Orkustofnun Data Repository: OS-2015-T009-01).
0%1%2%3%4%5%6%7%8%9%10%11%12%13%14%Percentage
Krafla
Bjarnar-flag
SvartsengiI
SvartsengiII(thermal)andIII
SvartsengiIV
SvartsengiV
SvartsengiVIReykjanes
Nesjavellir(thermal)
Nesjavellir
TheraIoofelectricalgeneraIontonetprimaryenergy
TheraIoofelectricalgeneraIontogrossprimaryenergy
(electrical)
Hellisheiði
Krafla
1977
1982
1987
1992
1997
2002
2007
Figure 13. Electricity generation in geothermal plants as a percentage of netand gross primary energy use. Adapted from Figure 11 in [18].
the future heat use of geothermal energy in Iceland. The mostrecent forecast is from 2003 [2], but before that, forecasts weremade in 1982 and 1987. From [2] we note that the last officialforecast from 2003 is 13 years old with an update hopefullycoming soon.
Next, we will briefly review the methods and results usedin the forecast, which presents a projected use of geothermalenergy in Iceland up to the year 2030. It is based on projectionsof population growth and the growth of the GDP, housingand other sectors of the economy using geothermal heat.Then the forecast summarized the projected use and includestransmission losses and unused energy.
The geothermal energy use is separated into space heating,swimming pools, snow melting, horticulture, fish farming andindustry. The heat use of energy, which was 21,5 PJ in 2001is projected to increase to a value of 32,5 PJ in the year 2030or about annual growth of 1,4% annually.
Heating of houses will continue to be the largest factor. Ap-proximately 87% of space in houses was heated by geothermalresources in 2001 and the forecast projects this to become
13

UPEC2016
Geothermalsavings
Figure 10. Swimming pools in Iceland. The black circles indicate geothermalpools while the few grey circles are pools heated with other resources suchas by electricity. Adapted from [2].
020,00040,00060,000
80,000
100,000
120,000
140,000
160,000
19701975 1980 1985 1990 1995 2000 2005 2010
MillionsISK
OrkustofnunDataRepository:OS-2015-T009-01UElityrevenues Correspondingoilbill
Figure 11. The Figure shows cost of geothermal space heating comparedto oil heating if access to geothermal energy were not available. The lowergrey/red columns show the cost of geothermal space heating from utilityrevenues in Million ISK per year, where the current (March 2016) approximaterate of exchange is 130 ISK/US$. The solid higher black columns showthe corresponding cost if the energy were to be derived from imported oil.Adapted and redrawn from [22]. (Orkustofnun Data Repository: OS-2015-T009-01).
resources is substantial, as seen in the difference in thedifferent columns of Figure 11, and note the vertical axisis shown in Million Icelandic kr. (ISK). Another benefit isstabilizing effect of geothermal energy on fluctuating oil pricesand currency exchange rates.
Figure 12 from [23] shows another aspect of the benefits ofhaving these indigenous resources. It shows an estimate [23]of this benefit in the last one hundred years as a fraction ofthe Gross Domestic Product (GDP). The curve swings high inperiods of oil price hikes, but is lowered when oil prices fall.It is interesting to see this benefit as a significant fraction, or1 - 3 % of the GDP, as estimated in [23].
IV. GEOTHERMAL FORECASTING
Finally we well discuss here the geothermal forecasts madeby the EFC, as previously mentioned. The forecasts project
0%
1%
2%
3%
4%
5%
6%
7%
8%
1914
1919
1924
1929
1934
1939
1944
1949
1954
1959
1964
1969
1974
1979
1984
1989
1994
1999
2004
2009
2014
Avoide
dcostasa
percentageofGDP
Figure 12. The Figure shows a digram, stretching a whole century of history(1914-2014), showing the avoided cost in imported fuel resources, such asoil to replace geothermal space heating as a percentage of the gross domesticproducts. The Figure shows that the value of the avoided cost fluctuatesbetween about 1% of the GDP to about 6-7 % of the GDP. Adapted from[23] (Orkustofnun Data Repository: OS-2015-T009-01).
0%1%2%3%4%5%6%7%8%9%10%11%12%13%14%Percentage
Krafla
Bjarnar-flag
SvartsengiI
SvartsengiII(thermal)andIII
SvartsengiIV
SvartsengiV
SvartsengiVIReykjanes
Nesjavellir(thermal)
Nesjavellir
TheraIoofelectricalgeneraIontonetprimaryenergy
TheraIoofelectricalgeneraIontogrossprimaryenergy
(electrical)
Hellisheiði
Krafla
1977
1982
1987
1992
1997
2002
2007
Figure 13. Electricity generation in geothermal plants as a percentage of netand gross primary energy use. Adapted from Figure 11 in [18].
the future heat use of geothermal energy in Iceland. The mostrecent forecast is from 2003 [2], but before that, forecasts weremade in 1982 and 1987. From [2] we note that the last officialforecast from 2003 is 13 years old with an update hopefullycoming soon.
Next, we will briefly review the methods and results usedin the forecast, which presents a projected use of geothermalenergy in Iceland up to the year 2030. It is based on projectionsof population growth and the growth of the GDP, housingand other sectors of the economy using geothermal heat.Then the forecast summarized the projected use and includestransmission losses and unused energy.
The geothermal energy use is separated into space heating,swimming pools, snow melting, horticulture, fish farming andindustry. The heat use of energy, which was 21,5 PJ in 2001is projected to increase to a value of 32,5 PJ in the year 2030or about annual growth of 1,4% annually.
Heating of houses will continue to be the largest factor. Ap-proximately 87% of space in houses was heated by geothermalresources in 2001 and the forecast projects this to become
14

UPEC2016
Avoidedcostbynotimpor.ngfuel
Figure 10. Swimming pools in Iceland. The black circles indicate geothermalpools while the few grey circles are pools heated with other resources suchas by electricity. Adapted from [2].
020,00040,00060,000
80,000
100,000
120,000
140,000
160,000
19701975 1980 1985 1990 1995 2000 2005 2010
MillionsISK
OrkustofnunDataRepository:OS-2015-T009-01UElityrevenues Correspondingoilbill
Figure 11. The Figure shows cost of geothermal space heating comparedto oil heating if access to geothermal energy were not available. The lowergrey/red columns show the cost of geothermal space heating from utilityrevenues in Million ISK per year, where the current (March 2016) approximaterate of exchange is 130 ISK/US$. The solid higher black columns showthe corresponding cost if the energy were to be derived from imported oil.Adapted and redrawn from [22]. (Orkustofnun Data Repository: OS-2015-T009-01).
resources is substantial, as seen in the difference in thedifferent columns of Figure 11, and note the vertical axisis shown in Million Icelandic kr. (ISK). Another benefit isstabilizing effect of geothermal energy on fluctuating oil pricesand currency exchange rates.
Figure 12 from [23] shows another aspect of the benefits ofhaving these indigenous resources. It shows an estimate [23]of this benefit in the last one hundred years as a fraction ofthe Gross Domestic Product (GDP). The curve swings high inperiods of oil price hikes, but is lowered when oil prices fall.It is interesting to see this benefit as a significant fraction, or1 - 3 % of the GDP, as estimated in [23].
IV. GEOTHERMAL FORECASTING
Finally we well discuss here the geothermal forecasts madeby the EFC, as previously mentioned. The forecasts project
0%
1%
2%
3%
4%
5%
6%
7%
8%
1914
1919
1924
1929
1934
1939
1944
1949
1954
1959
1964
1969
1974
1979
1984
1989
1994
1999
2004
2009
2014
Avoide
dcostasa
percentageofGDP
Figure 12. The Figure shows a digram, stretching a whole century of history(1914-2014), showing the avoided cost in imported fuel resources, such asoil to replace geothermal space heating as a percentage of the gross domesticproducts. The Figure shows that the value of the avoided cost fluctuatesbetween about 1% of the GDP to about 6-7 % of the GDP. Adapted from[23] (Orkustofnun Data Repository: OS-2015-T009-01).
0%1%2%3%4%5%6%7%8%9%10%11%12%13%14%Percentage
Krafla
Bjarnar-flag
SvartsengiI
SvartsengiII(thermal)andIII
SvartsengiIV
SvartsengiV
SvartsengiVIReykjanes
Nesjavellir(thermal)
Nesjavellir
TheraIoofelectricalgeneraIontonetprimaryenergy
TheraIoofelectricalgeneraIontogrossprimaryenergy
(electrical)
Hellisheiði
Krafla
1977
1982
1987
1992
1997
2002
2007
Figure 13. Electricity generation in geothermal plants as a percentage of netand gross primary energy use. Adapted from Figure 11 in [18].
the future heat use of geothermal energy in Iceland. The mostrecent forecast is from 2003 [2], but before that, forecasts weremade in 1982 and 1987. From [2] we note that the last officialforecast from 2003 is 13 years old with an update hopefullycoming soon.
Next, we will briefly review the methods and results usedin the forecast, which presents a projected use of geothermalenergy in Iceland up to the year 2030. It is based on projectionsof population growth and the growth of the GDP, housingand other sectors of the economy using geothermal heat.Then the forecast summarized the projected use and includestransmission losses and unused energy.
The geothermal energy use is separated into space heating,swimming pools, snow melting, horticulture, fish farming andindustry. The heat use of energy, which was 21,5 PJ in 2001is projected to increase to a value of 32,5 PJ in the year 2030or about annual growth of 1,4% annually.
Heating of houses will continue to be the largest factor. Ap-proximately 87% of space in houses was heated by geothermalresources in 2001 and the forecast projects this to become
15

UPEC2016
Electricitygenera.oningeothermalplantsasapercentageofnetandgrossprimaryenergyuse
Figure 10. Swimming pools in Iceland. The black circles indicate geothermalpools while the few grey circles are pools heated with other resources suchas by electricity. Adapted from [2].
020,00040,00060,000
80,000
100,000
120,000
140,000
160,000
19701975 1980 1985 1990 1995 2000 2005 2010
Million
sISK
OrkustofnunDataRepository:OS-2015-T009-01UElityrevenues Correspondingoilbill
Figure 11. The Figure shows cost of geothermal space heating comparedto oil heating if access to geothermal energy were not available. The lowergrey/red columns show the cost of geothermal space heating from utilityrevenues in Million ISK per year, where the current (March 2016) approximaterate of exchange is 130 ISK/US$. The solid higher black columns showthe corresponding cost if the energy were to be derived from imported oil.Adapted and redrawn from [22]. (Orkustofnun Data Repository: OS-2015-T009-01).
resources is substantial, as seen in the difference in thedifferent columns of Figure 11, and note the vertical axisis shown in Million Icelandic kr. (ISK). Another benefit isstabilizing effect of geothermal energy on fluctuating oil pricesand currency exchange rates.
Figure 12 from [23] shows another aspect of the benefits ofhaving these indigenous resources. It shows an estimate [23]of this benefit in the last one hundred years as a fraction ofthe Gross Domestic Product (GDP). The curve swings high inperiods of oil price hikes, but is lowered when oil prices fall.It is interesting to see this benefit as a significant fraction, or1 - 3 % of the GDP, as estimated in [23].
IV. GEOTHERMAL FORECASTING
Finally we well discuss here the geothermal forecasts madeby the EFC, as previously mentioned. The forecasts project
0%
1%
2%
3%
4%
5%
6%
7%
8%
1914
1919
1924
1929
1934
1939
1944
1949
1954
1959
1964
1969
1974
1979
1984
1989
1994
1999
2004
2009
2014
Avoide
dcostasa
percentageofGDP
Figure 12. The Figure shows a digram, stretching a whole century of history(1914-2014), showing the avoided cost in imported fuel resources, such asoil to replace geothermal space heating as a percentage of the gross domesticproducts. The Figure shows that the value of the avoided cost fluctuatesbetween about 1% of the GDP to about 6-7 % of the GDP. Adapted from[23] (Orkustofnun Data Repository: OS-2015-T009-01).
0%1%2%3%4%5%6%7%8%9%10%11%12%13%14%Percentage
Krafla
Bjarnar-flag
SvartsengiI
SvartsengiII(thermal)andIII
SvartsengiIV
SvartsengiV
SvartsengiVIReykjanes
Nesjavellir(thermal)
Nesjavellir
TheraIoofelectricalgeneraIontonetprimaryenergy
TheraIoofelectricalgeneraIontogrossprimaryenergy
(electrical)
Hellisheiði
Krafla
1977
1982
1987
1992
1997
2002
2007
Figure 13. Electricity generation in geothermal plants as a percentage of netand gross primary energy use. Adapted from Figure 11 in [18].
the future heat use of geothermal energy in Iceland. The mostrecent forecast is from 2003 [2], but before that, forecasts weremade in 1982 and 1987. From [2] we note that the last officialforecast from 2003 is 13 years old with an update hopefullycoming soon.
Next, we will briefly review the methods and results usedin the forecast, which presents a projected use of geothermalenergy in Iceland up to the year 2030. It is based on projectionsof population growth and the growth of the GDP, housingand other sectors of the economy using geothermal heat.Then the forecast summarized the projected use and includestransmission losses and unused energy.
The geothermal energy use is separated into space heating,swimming pools, snow melting, horticulture, fish farming andindustry. The heat use of energy, which was 21,5 PJ in 2001is projected to increase to a value of 32,5 PJ in the year 2030or about annual growth of 1,4% annually.
Heating of houses will continue to be the largest factor. Ap-proximately 87% of space in houses was heated by geothermalresources in 2001 and the forecast projects this to become
16
UPEC2016
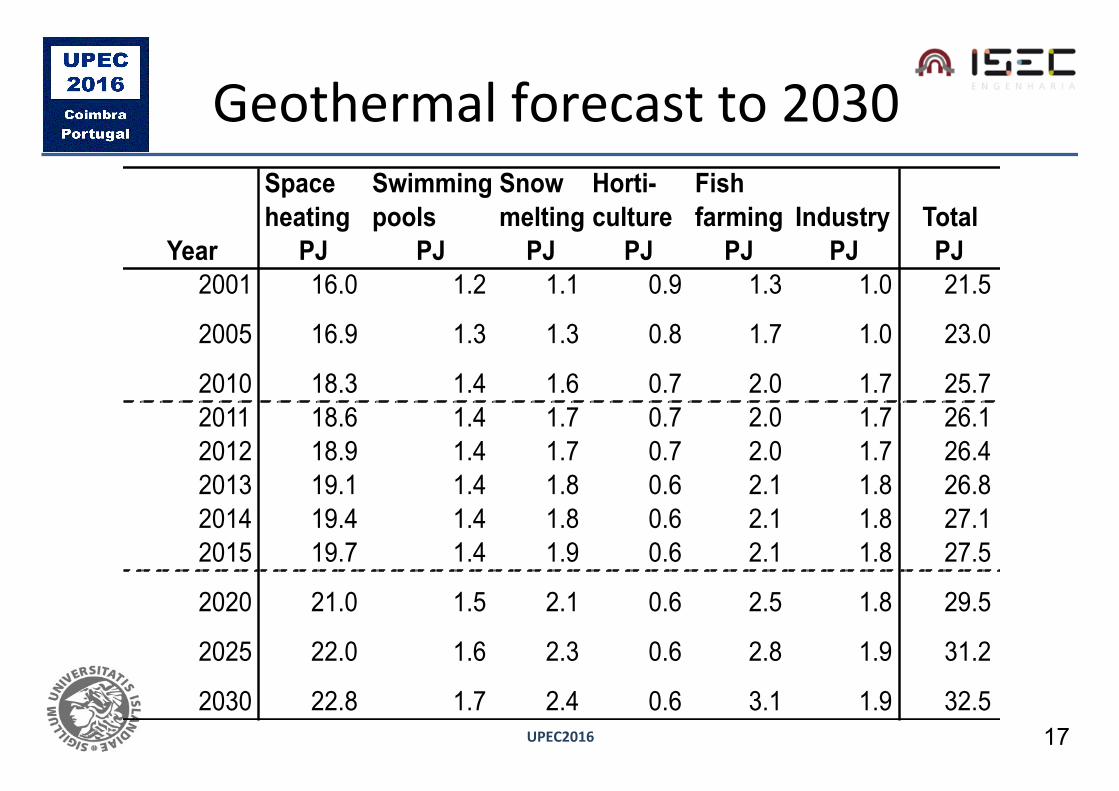
Table IGEOTHERMAL FORECAST 2003-2030 BASED ON TABLE I IN [2]. THEVALUES BETWEEN 2010 AND 2015 ARE BY LINEAR INTERPOLATION.
Space Swimming Snow Horti- Fish heating pools melting culture farming Industry Total
Year PJ PJ PJ PJ PJ PJ PJ2001 16.0 1.2 1.1 0.9 1.3 1.0 21.5
2005 16.9 1.3 1.3 0.8 1.7 1.0 23.0
2010 18.3 1.4 1.6 0.7 2.0 1.7 25.72011 18.6 1.4 1.7 0.7 2.0 1.7 26.12012 18.9 1.4 1.7 0.7 2.0 1.7 26.42013 19.1 1.4 1.8 0.6 2.1 1.8 26.82014 19.4 1.4 1.8 0.6 2.1 1.8 27.12015 19.7 1.4 1.9 0.6 2.1 1.8 27.5
2020 21.0 1.5 2.1 0.6 2.5 1.8 29.5
2025 22.0 1.6 2.3 0.6 2.8 1.9 31.2
2030 22.8 1.7 2.4 0.6 3.1 1.9 32.5
0102030405060708090
100110120130
Primary energy (PJ)
1970 1975 1980 1985 1990 1995 2000 2005
Gross energy
Energy returned to the reservoir
Net energy
Figure 14. Primary energy use in geothermal power plants in Iceland 1970-2008 in PJ (1 PJ = 1 PetaJoule = 1 · 1015 Joule). Adapted from Figure 7 of[18].
about 92% in the year 2030, where population growth was animportant contributing factor.
The share of space heating in the forecasting period isapproximately 60% and geothermal heat should increase inall categories except horticulture, as electrical lightning wasto increase. Electricity generation was excluded, as it wascovered by a separate electrical energy forecast. The results ofthe geothermal forecast [2] are shown in Table I and Figure15.
Table I uses directly results of Table I in [2], but we haveadded a linear interpolation from 2011 to 2015 to illustrate theforecasted results in more detail. How well has this forecastmade about 13 years ago held out? This question will beaddressed in the next section.
V. DISCUSSIONS AND CONCLUSIONS
A. General discussionTo answer the question of how well the 2003 forecasted
has lasted, let us examine he actual and forecasted values.As seen in Figure 9 according to [21] the actual geothermalenergy use in 2014 was 28.1 PJ while the forecasted value forthis year according to Table I is 27.1 PJ. The actual use in2014 therefore exceeds the forecast from 2003 by 1 PJ or by3.69%.
Misc. industryFish farming
HorticultureSnow meltingSwimming poolsSpace heating
PJ
10
5
15
20
25
30
1990Year 1990 - 2030
1995 2000 2005 2010 2015 2020 2025 2030
Fore
cast
ed
valu
es
Actu
al v
alue
s
Figure 15. The Figure shows the somewhat dated geothermal energy forecastfor Iceland covering the period 2003-2030. The Figure is split between thepast (In 2003 at the time of forecasting) and future. Adapted from Figure IIof [2].
01234567891011121314 Numberofgeothermal
districhea3ngu3li3esestablisedinthedecade
Decade
1940 to 1950 to 1960 to 1970 to 1980 to 1990 to 2000 to1950 1960 1970 1980 1990 2000 2010
Figure 16. The Figure shows number of established geothermal districtheating utilities established in each decade in Iceland 1940 -2010. Note thesudden peak of new geothermal activities in establishing new district heatinggeothermal utilities in the nineteen seventies, when the first oil crisis hit.Adapted from Figure 13 of [18].
Undoubtedly a comprehensive evaluation will be carried outby the EFC of how well the 2003 forecast lasted. Thereforeit will be of considerable value to get an updated forecast ofdirect geothermal use in Iceland.
It is interesting to note that, despite the setback of the eco-nomic and banking crises of 2008 in Iceland, the consumptionhas caught up with the forecast made prior to the crisis.
B. Main conclusions
The main conclusions of the paper can be summarized asfollows:
• Iceland is in many respects situated at the forefrontworldwide in geothermal energy utilization.
• Geothermal energy plays an important role in the generalenergy framework in Iceland (Figure 18), and a sharplyincreasing role in overall electricity generation.
• Geothermal energy continues to play a key role in spaceheating and is very important in the general economy of
Geothermalforecastto2030
17

UPEC2016
PrimaryenergyuseingeothermalpowerplantsinIceland1970-2008
Table IGEOTHERMAL FORECAST 2003-2030 BASED ON TABLE I IN [2]. THEVALUES BETWEEN 2010 AND 2015 ARE BY LINEAR INTERPOLATION.
Space Swimming Snow Horti- Fish heating pools melting culture farming Industry Total
Year PJ PJ PJ PJ PJ PJ PJ2001 16.0 1.2 1.1 0.9 1.3 1.0 21.5
2005 16.9 1.3 1.3 0.8 1.7 1.0 23.0
2010 18.3 1.4 1.6 0.7 2.0 1.7 25.72011 18.6 1.4 1.7 0.7 2.0 1.7 26.12012 18.9 1.4 1.7 0.7 2.0 1.7 26.42013 19.1 1.4 1.8 0.6 2.1 1.8 26.82014 19.4 1.4 1.8 0.6 2.1 1.8 27.12015 19.7 1.4 1.9 0.6 2.1 1.8 27.5
2020 21.0 1.5 2.1 0.6 2.5 1.8 29.5
2025 22.0 1.6 2.3 0.6 2.8 1.9 31.2
2030 22.8 1.7 2.4 0.6 3.1 1.9 32.5
0102030405060708090
100110120130
Primary energy (PJ)
1970 1975 1980 1985 1990 1995 2000 2005
Gross energy
Energy returned to the reservoir
Net energy
Figure 14. Primary energy use in geothermal power plants in Iceland 1970-2008 in PJ (1 PJ = 1 PetaJoule = 1 · 1015 Joule). Adapted from Figure 7 of[18].
about 92% in the year 2030, where population growth was animportant contributing factor.
The share of space heating in the forecasting period isapproximately 60% and geothermal heat should increase inall categories except horticulture, as electrical lightning wasto increase. Electricity generation was excluded, as it wascovered by a separate electrical energy forecast. The results ofthe geothermal forecast [2] are shown in Table I and Figure15.
Table I uses directly results of Table I in [2], but we haveadded a linear interpolation from 2011 to 2015 to illustrate theforecasted results in more detail. How well has this forecastmade about 13 years ago held out? This question will beaddressed in the next section.
V. DISCUSSIONS AND CONCLUSIONS
A. General discussionTo answer the question of how well the 2003 forecasted
has lasted, let us examine he actual and forecasted values.As seen in Figure 9 according to [21] the actual geothermalenergy use in 2014 was 28.1 PJ while the forecasted value forthis year according to Table I is 27.1 PJ. The actual use in2014 therefore exceeds the forecast from 2003 by 1 PJ or by3.69%.
Misc. industryFish farming
HorticultureSnow meltingSwimming poolsSpace heating
PJ
10
5
15
20
25
30
1990Year 1990 - 2030
1995 2000 2005 2010 2015 2020 2025 2030
Fore
cast
ed
valu
es
Actu
al v
alue
s
Figure 15. The Figure shows the somewhat dated geothermal energy forecastfor Iceland covering the period 2003-2030. The Figure is split between thepast (In 2003 at the time of forecasting) and future. Adapted from Figure IIof [2].
01234567891011121314 Numberofgeothermal
districhea3ngu3li3esestablisedinthedecade
Decade
1940 to 1950 to 1960 to 1970 to 1980 to 1990 to 2000 to1950 1960 1970 1980 1990 2000 2010
Figure 16. The Figure shows number of established geothermal districtheating utilities established in each decade in Iceland 1940 -2010. Note thesudden peak of new geothermal activities in establishing new district heatinggeothermal utilities in the nineteen seventies, when the first oil crisis hit.Adapted from Figure 13 of [18].
Undoubtedly a comprehensive evaluation will be carried outby the EFC of how well the 2003 forecast lasted. Thereforeit will be of considerable value to get an updated forecast ofdirect geothermal use in Iceland.
It is interesting to note that, despite the setback of the eco-nomic and banking crises of 2008 in Iceland, the consumptionhas caught up with the forecast made prior to the crisis.
B. Main conclusions
The main conclusions of the paper can be summarized asfollows:
• Iceland is in many respects situated at the forefrontworldwide in geothermal energy utilization.
• Geothermal energy plays an important role in the generalenergy framework in Iceland (Figure 18), and a sharplyincreasing role in overall electricity generation.
• Geothermal energy continues to play a key role in spaceheating and is very important in the general economy of
18

UPEC2016
Geothermalforecast2003-2030Table I
GEOTHERMAL FORECAST 2003-2030 BASED ON TABLE I IN [2]. THEVALUES BETWEEN 2010 AND 2015 ARE BY LINEAR INTERPOLATION.
Space Swimming Snow Horti- Fish heating pools melting culture farming Industry Total
Year PJ PJ PJ PJ PJ PJ PJ2001 16.0 1.2 1.1 0.9 1.3 1.0 21.5
2005 16.9 1.3 1.3 0.8 1.7 1.0 23.0
2010 18.3 1.4 1.6 0.7 2.0 1.7 25.72011 18.6 1.4 1.7 0.7 2.0 1.7 26.12012 18.9 1.4 1.7 0.7 2.0 1.7 26.42013 19.1 1.4 1.8 0.6 2.1 1.8 26.82014 19.4 1.4 1.8 0.6 2.1 1.8 27.12015 19.7 1.4 1.9 0.6 2.1 1.8 27.5
2020 21.0 1.5 2.1 0.6 2.5 1.8 29.5
2025 22.0 1.6 2.3 0.6 2.8 1.9 31.2
2030 22.8 1.7 2.4 0.6 3.1 1.9 32.5
0102030405060708090
100110120130
Primary energy (PJ)
1970 1975 1980 1985 1990 1995 2000 2005
Gross energy
Energy returned to the reservoir
Net energy
Figure 14. Primary energy use in geothermal power plants in Iceland 1970-2008 in PJ (1 PJ = 1 PetaJoule = 1 · 1015 Joule). Adapted from Figure 7 of[18].
about 92% in the year 2030, where population growth was animportant contributing factor.
The share of space heating in the forecasting period isapproximately 60% and geothermal heat should increase inall categories except horticulture, as electrical lightning wasto increase. Electricity generation was excluded, as it wascovered by a separate electrical energy forecast. The results ofthe geothermal forecast [2] are shown in Table I and Figure15.
Table I uses directly results of Table I in [2], but we haveadded a linear interpolation from 2011 to 2015 to illustrate theforecasted results in more detail. How well has this forecastmade about 13 years ago held out? This question will beaddressed in the next section.
V. DISCUSSIONS AND CONCLUSIONS
A. General discussionTo answer the question of how well the 2003 forecasted
has lasted, let us examine he actual and forecasted values.As seen in Figure 9 according to [21] the actual geothermalenergy use in 2014 was 28.1 PJ while the forecasted value forthis year according to Table I is 27.1 PJ. The actual use in2014 therefore exceeds the forecast from 2003 by 1 PJ or by3.69%.
Misc. industryFish farming
HorticultureSnow meltingSwimming poolsSpace heating
PJ
10
5
15
20
25
30
1990Year 1990 - 2030
1995 2000 2005 2010 2015 2020 2025 2030
Fore
cast
ed
valu
es
Act
ual v
alue
s
Figure 15. The Figure shows the somewhat dated geothermal energy forecastfor Iceland covering the period 2003-2030. The Figure is split between thepast (In 2003 at the time of forecasting) and future. Adapted from Figure IIof [2].
01234567891011121314 Numberofgeothermal
districhea3ngu3li3esestablisedinthedecade
Decade
1940 to 1950 to 1960 to 1970 to 1980 to 1990 to 2000 to1950 1960 1970 1980 1990 2000 2010
Figure 16. The Figure shows number of established geothermal districtheating utilities established in each decade in Iceland 1940 -2010. Note thesudden peak of new geothermal activities in establishing new district heatinggeothermal utilities in the nineteen seventies, when the first oil crisis hit.Adapted from Figure 13 of [18].
Undoubtedly a comprehensive evaluation will be carried outby the EFC of how well the 2003 forecast lasted. Thereforeit will be of considerable value to get an updated forecast ofdirect geothermal use in Iceland.
It is interesting to note that, despite the setback of the eco-nomic and banking crises of 2008 in Iceland, the consumptionhas caught up with the forecast made prior to the crisis.
B. Main conclusions
The main conclusions of the paper can be summarized asfollows:
• Iceland is in many respects situated at the forefrontworldwide in geothermal energy utilization.
• Geothermal energy plays an important role in the generalenergy framework in Iceland (Figure 18), and a sharplyincreasing role in overall electricity generation.
• Geothermal energy continues to play a key role in spaceheating and is very important in the general economy of
19

UPEC2016
Geothermaldistricthea.ngu.li.esestablishedineachdecadeinIceland1940-2010
Table IGEOTHERMAL FORECAST 2003-2030 BASED ON TABLE I IN [2]. THEVALUES BETWEEN 2010 AND 2015 ARE BY LINEAR INTERPOLATION.
Space Swimming Snow Horti- Fish heating pools melting culture farming Industry Total
Year PJ PJ PJ PJ PJ PJ PJ2001 16.0 1.2 1.1 0.9 1.3 1.0 21.5
2005 16.9 1.3 1.3 0.8 1.7 1.0 23.0
2010 18.3 1.4 1.6 0.7 2.0 1.7 25.72011 18.6 1.4 1.7 0.7 2.0 1.7 26.12012 18.9 1.4 1.7 0.7 2.0 1.7 26.42013 19.1 1.4 1.8 0.6 2.1 1.8 26.82014 19.4 1.4 1.8 0.6 2.1 1.8 27.12015 19.7 1.4 1.9 0.6 2.1 1.8 27.5
2020 21.0 1.5 2.1 0.6 2.5 1.8 29.5
2025 22.0 1.6 2.3 0.6 2.8 1.9 31.2
2030 22.8 1.7 2.4 0.6 3.1 1.9 32.5
0102030405060708090
100110120130
Primary energy (PJ)
1970 1975 1980 1985 1990 1995 2000 2005
Gross energy
Energy returned to the reservoir
Net energy
Figure 14. Primary energy use in geothermal power plants in Iceland 1970-2008 in PJ (1 PJ = 1 PetaJoule = 1 · 1015 Joule). Adapted from Figure 7 of[18].
about 92% in the year 2030, where population growth was animportant contributing factor.
The share of space heating in the forecasting period isapproximately 60% and geothermal heat should increase inall categories except horticulture, as electrical lightning wasto increase. Electricity generation was excluded, as it wascovered by a separate electrical energy forecast. The results ofthe geothermal forecast [2] are shown in Table I and Figure15.
Table I uses directly results of Table I in [2], but we haveadded a linear interpolation from 2011 to 2015 to illustrate theforecasted results in more detail. How well has this forecastmade about 13 years ago held out? This question will beaddressed in the next section.
V. DISCUSSIONS AND CONCLUSIONS
A. General discussionTo answer the question of how well the 2003 forecasted
has lasted, let us examine he actual and forecasted values.As seen in Figure 9 according to [21] the actual geothermalenergy use in 2014 was 28.1 PJ while the forecasted value forthis year according to Table I is 27.1 PJ. The actual use in2014 therefore exceeds the forecast from 2003 by 1 PJ or by3.69%.
Misc. industryFish farming
HorticultureSnow meltingSwimming poolsSpace heating
PJ
10
5
15
20
25
30
1990Year 1990 - 2030
1995 2000 2005 2010 2015 2020 2025 2030
Fore
cast
ed
valu
es
Act
ual v
alue
s
Figure 15. The Figure shows the somewhat dated geothermal energy forecastfor Iceland covering the period 2003-2030. The Figure is split between thepast (In 2003 at the time of forecasting) and future. Adapted from Figure IIof [2].
01234567891011121314 Numberofgeothermal
districhea3ngu3li3esestablisedinthedecade
Decade
1940 to 1950 to 1960 to 1970 to 1980 to 1990 to 2000 to1950 1960 1970 1980 1990 2000 2010
Figure 16. The Figure shows number of established geothermal districtheating utilities established in each decade in Iceland 1940 -2010. Note thesudden peak of new geothermal activities in establishing new district heatinggeothermal utilities in the nineteen seventies, when the first oil crisis hit.Adapted from Figure 13 of [18].
Undoubtedly a comprehensive evaluation will be carried outby the EFC of how well the 2003 forecast lasted. Thereforeit will be of considerable value to get an updated forecast ofdirect geothermal use in Iceland.
It is interesting to note that, despite the setback of the eco-nomic and banking crises of 2008 in Iceland, the consumptionhas caught up with the forecast made prior to the crisis.
B. Main conclusions
The main conclusions of the paper can be summarized asfollows:
• Iceland is in many respects situated at the forefrontworldwide in geothermal energy utilization.
• Geothermal energy plays an important role in the generalenergy framework in Iceland (Figure 18), and a sharplyincreasing role in overall electricity generation.
• Geothermal energy continues to play a key role in spaceheating and is very important in the general economy of
20

UPEC2016
Spacehea.ng1970-2008
0
15
30
45
60
0
5
10
15
20
Spacehe
a(ngpercapita
(GJ/pe
rson
)
Totalspacehea(n
guse(PJ)
Totalspacehea3nguse Spacehea3ngpercapita
1970
1972
1974
1976
1978
1980
1982
1984
1986
1988
1990
1992
1994
1996
1998
2000
2002
2004
2006
2008
Figure 17. Space heating in Iceland 1970-2008. The per capita figures inGJ/capita are shown with the grey broken line with the axis at right. Absolutefigures are at left in PJ, shown with the solid curve. Note the saturation thatis reached around 1986 for the space heating per capita. Adapted from Figure2 of [19].
Low temp-erature
heat: 29.2
Heating: 11.9
Space heating: 18.8
Industry: 11.5Industry: 11.5
Geo
ther
mal
util
ity
osse
s: 7
.4
Prim
art e
nerg
y: 1
44.2 U
seful energy: 39.1Sevices: 0.9Homes: 0.8Utilities: 0.6Acriculture: 0.2Acriculture: 0.03
Fish farming: 1.7Snow melting: 1.7Swimming pools: 1.4
Industrial use: 0.8
Horticulture: 0.7
Electrical energy: 14.5
Losses and energy not used: 105.0
Concessionutilities: 0.6
Concession utilities: 24.7Private utilities: 4.5
Hig
h te
mpe
ratu
re
heat
: 121
.7
Losses and heat not used by geothermal stations: 88.1
Heat returned to reservoir: 6.6Geo
ther
mal
pow
er p
lant
s: 1
21.7
Geo
ther
mal
ut
ilitie
s: 4
1.6
Heat returned to reservoir: 6.7
Figure 18. The flow of geothermal energy in Iceland in PJ in 2008. (1 PJ= 278 GWh). Note the difference between low temperature fields at the topand the high temperature extraction below in the Figure. There is a need toextract more useful energy from the high temperature fields and reduce unusedenergy (losses). Adapted and translated from Figure 24 of [19].
Iceland to replace fossil fuel cost tat would otherwise beincurred in the cold climate (Figure 17)
• The forecast from 2003 has lasted reasonably well whenwe compare the forecasted value for 2014 with theactual values of 2014. The actual values, even exceed theforecasted value despite the economic setback in recentyears.
REFERENCES
[1] U. E. I. Administration, “World Energy Statistics.” [Online]. Available:https://www.eia.gov/
[2] Orkuspárnefnd, [Energy forecasting commitee], “Jarðvarmaspá 2003-2030 [Geothermal energy forecast 2003-2030],” Orkustofnun [NationalEnergy Authority]„ Reykjavik, Tech. Rep., 2003. [Online]. Available:http://www.orkustofnun.is/gogn/Skyrslur/OS-2003/OS-2003-060.pdf
[3] I. B. Fridleifsson and M. Ómarsdóttir, “Geothermal Energy in Develop-ing Countries and the MDGs,” United Nations University, 2013, Down-loaded January 2016. [Online]. Available: http://unu.edu/publications/articles/geothermal-energy-in-developing-countries-and-the-mdgs.html
[4] (2016) Orkustofnun, (The National Energy Authority). [Online].Available: http://www.orkustofnun.is
[5] “Energy Statistics in Iceland 2013,” Orkustofnun, Reykjavik, Tech.Rep., 2013. [Online]. Available: http://os.is/gogn/os-onnur-rit/orkutolur_2013-enska.pdf
[6] The International Energy Agency, (IEA), “2013 Iceland CountryReport,” The International Energy Agency, Tech. Rep., 2013.[Online]. Available: http://iea-gia.org/wp-content/uploads/2014/12/IEA-GIA-Iceland-Country-Report-18Feb2015.pdf
[7] S. Björnsson, “Orkugeta jarðhita [Geothermal energy genrationcapacity],” in Ráðstefnurit orkuþings [Proceedings of theIceland energy conference]], Reykjavík, Iceland, 2006. [Online].Available: http://samorka.is/Apps/WebObjects/SW.woa/1/swdocument/1616/Orku%C3%BEingsb%C3%B3kin.pdf?wosid=false
[8] G. Axelsson, “Sustainable geothermal utilization–case histories; defini-tions; research issues and modelling,” Geothermics, vol. 39, no. 4, pp.283–291, 2010.
[9] R. Shortall, G. Axelsson, and B. Davidsdottir, “Assessing the sus-tainability of geothermal utilization,” in Sustainability Assessment ofRenewables-Based Products: Methods and Case Studies. John Wiley& Sons, 2015, p. 259.
[10] Wikipedia, “Geothermal power in Iceland,” Downloaded, January2016,. [Online]. Available: https://en.wikipedia.org/wiki/Geothermal_power_in_Iceland
[11] G. Gíslason, “Nesjavellir co-generation plant, iceland. flow of geother-mal steam and non-condensable gases,” in Proceedings World Geother-mal Congress, May 28 -June 10, 2000, Kyushu-Tohoko, Japan, 2000.
[12] M. R. Karlsdóttir, Ó. P. Pálsson, and H. Pálsson, “LCA of combinedheat and power production at Hellisheiði geothermal power plant withfocus on primary energy efficiency,” in Proceedings of The 12th Inter-national Symposium on District Heating and Cooling, Tallinn, Estonia,September 5th to September 7th, 2010.
[13] N. Yamaguchi, “Variety of Steam Turbines in Svartsengi and ReykjanesGeothermal Power Plants,” in Proceedings World Geothermal Congress2010, Bali, Indonesia, 25-29 April 2010.
[14] Orka náttúrunnar [Energy from Nature], “Orka Náttúrunnar web site,”Downloaded, March 2016. [Online]. Available: http://www.on.is
[15] J. W. Lund, “Direct utilization of geothermal energy,” Energies, vol. 3,no. 8, p. 1443, 2010.
[16] Á. Ragnarsson, “Geothermal Development in Iceland 2010-2014,” inProceedings World Geothermal Congress 2015, Melbourne, Australia,19-25 April 2015.
[17] “Orkuveita Reykjavíkur [Reykjavik Energy] web site,” Downloaded,January 2016. [Online]. Available: https://www.or.is/en/about
[18] I. G. Haraldsson and J. Ketilsson, “Frumorkunotkun jarðvarmavirkjanaog hitaveitna á Íslandi til ársins 2009 [Primary energy use of geothermalstations and untilities in Iceland to 2009],” Orkustofnun, The NationalEnergy Authority, Reykjavik, Technical report 2010/03, 2010.
[19] ——, “Jarðhitanotkun til raforkuvinnslu og beinna nota til ársins 2009[Geothermal energy for electricity generation and direct use till 2009],”Orkustofnun, The National Energy Authority, Reykjavik, Technicalreport 2010/02, 2010.
[20] Orkustofnun (The National Energy Authority), “The Iceland deepdrilling project] web site,” Downloaded, January 2016. [Online]. Avail-able: http://www.nea.is/geothermal/the-iceland-deep-drilling-project/
[21] “Energy Statistics in Iceland 2014,” Orkustofnun, Reykjavik, Tech.Rep., 2014. [Online]. Available: http://os.is/gogn/os-onnur-rit/orkutolur_2014-enska.pdf
[22] S. (Editor), “Geothermal Development and Research in Iceland,”Orkustofnun [National Energy Authority], Tech. Rep., February 2010.[Online]. Available: http://www.nea.is/media/utgafa/GD_loka.pdf
[23] “Orkusstofnun - data repository, the Nation Energy AuthorityData Repository web site,” Downloaded, January 2016. [Online].Available: http://www.nea.is/the-national-energy-authority/energy-data/data-repository/
21

UPEC2016
Geothermalenergyflow
0
15
30
45
60
0
5
10
15
20
Spacehe
a(ngpercapita
(GJ/pe
rson
)
Totalspacehea(n
guse(PJ)
Totalspacehea3nguse Spacehea3ngpercapita
1970
1972
1974
1976
1978
1980
1982
1984
1986
1988
1990
1992
1994
1996
1998
2000
2002
2004
2006
2008
Figure 17. Space heating in Iceland 1970-2008. The per capita figures inGJ/capita are shown with the grey broken line with the axis at right. Absolutefigures are at left in PJ, shown with the solid curve. Note the saturation thatis reached around 1986 for the space heating per capita. Adapted from Figure2 of [19].
Low temp-erature
heat: 29.2
Heating: 11.9
Space heating: 18.8
Industry: 11.5Industry: 11.5
Geo
ther
mal
util
ity
osse
s: 7
.4
Prim
art e
nerg
y: 1
44.2 U
seful energy: 39.1Sevices: 0.9Homes: 0.8Utilities: 0.6Acriculture: 0.2Acriculture: 0.03
Fish farming: 1.7Snow melting: 1.7Swimming pools: 1.4
Industrial use: 0.8
Horticulture: 0.7
Electrical energy: 14.5
Losses and energy not used: 105.0
Concessionutilities: 0.6
Concession utilities: 24.7Private utilities: 4.5
Hig
h te
mpe
ratu
re
heat
: 121
.7
Losses and heat not used by geothermal stations: 88.1
Heat returned to reservoir: 6.6Geo
ther
mal
pow
er p
lant
s: 1
21.7
Geo
ther
mal
ut
ilitie
s: 4
1.6
Heat returned to reservoir: 6.7
Figure 18. The flow of geothermal energy in Iceland in PJ in 2008. (1 PJ= 278 GWh). Note the difference between low temperature fields at the topand the high temperature extraction below in the Figure. There is a need toextract more useful energy from the high temperature fields and reduce unusedenergy (losses). Adapted and translated from Figure 24 of [19].
Iceland to replace fossil fuel cost tat would otherwise beincurred in the cold climate (Figure 17)
• The forecast from 2003 has lasted reasonably well whenwe compare the forecasted value for 2014 with theactual values of 2014. The actual values, even exceed theforecasted value despite the economic setback in recentyears.
REFERENCES
[1] U. E. I. Administration, “World Energy Statistics.” [Online]. Available:https://www.eia.gov/
[2] Orkuspárnefnd, [Energy forecasting commitee], “Jarðvarmaspá 2003-2030 [Geothermal energy forecast 2003-2030],” Orkustofnun [NationalEnergy Authority]„ Reykjavik, Tech. Rep., 2003. [Online]. Available:http://www.orkustofnun.is/gogn/Skyrslur/OS-2003/OS-2003-060.pdf
[3] I. B. Fridleifsson and M. Ómarsdóttir, “Geothermal Energy in Develop-ing Countries and the MDGs,” United Nations University, 2013, Down-loaded January 2016. [Online]. Available: http://unu.edu/publications/articles/geothermal-energy-in-developing-countries-and-the-mdgs.html
[4] (2016) Orkustofnun, (The National Energy Authority). [Online].Available: http://www.orkustofnun.is
[5] “Energy Statistics in Iceland 2013,” Orkustofnun, Reykjavik, Tech.Rep., 2013. [Online]. Available: http://os.is/gogn/os-onnur-rit/orkutolur_2013-enska.pdf
[6] The International Energy Agency, (IEA), “2013 Iceland CountryReport,” The International Energy Agency, Tech. Rep., 2013.[Online]. Available: http://iea-gia.org/wp-content/uploads/2014/12/IEA-GIA-Iceland-Country-Report-18Feb2015.pdf
[7] S. Björnsson, “Orkugeta jarðhita [Geothermal energy genrationcapacity],” in Ráðstefnurit orkuþings [Proceedings of theIceland energy conference]], Reykjavík, Iceland, 2006. [Online].Available: http://samorka.is/Apps/WebObjects/SW.woa/1/swdocument/1616/Orku%C3%BEingsb%C3%B3kin.pdf?wosid=false
[8] G. Axelsson, “Sustainable geothermal utilization–case histories; defini-tions; research issues and modelling,” Geothermics, vol. 39, no. 4, pp.283–291, 2010.
[9] R. Shortall, G. Axelsson, and B. Davidsdottir, “Assessing the sus-tainability of geothermal utilization,” in Sustainability Assessment ofRenewables-Based Products: Methods and Case Studies. John Wiley& Sons, 2015, p. 259.
[10] Wikipedia, “Geothermal power in Iceland,” Downloaded, January2016,. [Online]. Available: https://en.wikipedia.org/wiki/Geothermal_power_in_Iceland
[11] G. Gíslason, “Nesjavellir co-generation plant, iceland. flow of geother-mal steam and non-condensable gases,” in Proceedings World Geother-mal Congress, May 28 -June 10, 2000, Kyushu-Tohoko, Japan, 2000.
[12] M. R. Karlsdóttir, Ó. P. Pálsson, and H. Pálsson, “LCA of combinedheat and power production at Hellisheiði geothermal power plant withfocus on primary energy efficiency,” in Proceedings of The 12th Inter-national Symposium on District Heating and Cooling, Tallinn, Estonia,September 5th to September 7th, 2010.
[13] N. Yamaguchi, “Variety of Steam Turbines in Svartsengi and ReykjanesGeothermal Power Plants,” in Proceedings World Geothermal Congress2010, Bali, Indonesia, 25-29 April 2010.
[14] Orka náttúrunnar [Energy from Nature], “Orka Náttúrunnar web site,”Downloaded, March 2016. [Online]. Available: http://www.on.is
[15] J. W. Lund, “Direct utilization of geothermal energy,” Energies, vol. 3,no. 8, p. 1443, 2010.
[16] Á. Ragnarsson, “Geothermal Development in Iceland 2010-2014,” inProceedings World Geothermal Congress 2015, Melbourne, Australia,19-25 April 2015.
[17] “Orkuveita Reykjavíkur [Reykjavik Energy] web site,” Downloaded,January 2016. [Online]. Available: https://www.or.is/en/about
[18] I. G. Haraldsson and J. Ketilsson, “Frumorkunotkun jarðvarmavirkjanaog hitaveitna á Íslandi til ársins 2009 [Primary energy use of geothermalstations and untilities in Iceland to 2009],” Orkustofnun, The NationalEnergy Authority, Reykjavik, Technical report 2010/03, 2010.
[19] ——, “Jarðhitanotkun til raforkuvinnslu og beinna nota til ársins 2009[Geothermal energy for electricity generation and direct use till 2009],”Orkustofnun, The National Energy Authority, Reykjavik, Technicalreport 2010/02, 2010.
[20] Orkustofnun (The National Energy Authority), “The Iceland deepdrilling project] web site,” Downloaded, January 2016. [Online]. Avail-able: http://www.nea.is/geothermal/the-iceland-deep-drilling-project/
[21] “Energy Statistics in Iceland 2014,” Orkustofnun, Reykjavik, Tech.Rep., 2014. [Online]. Available: http://os.is/gogn/os-onnur-rit/orkutolur_2014-enska.pdf
[22] S. (Editor), “Geothermal Development and Research in Iceland,”Orkustofnun [National Energy Authority], Tech. Rep., February 2010.[Online]. Available: http://www.nea.is/media/utgafa/GD_loka.pdf
[23] “Orkusstofnun - data repository, the Nation Energy AuthorityData Repository web site,” Downloaded, January 2016. [Online].Available: http://www.nea.is/the-national-energy-authority/energy-data/data-repository/
22

UPEC2016
Discussion-conclusions• Worldposi;on.Icelandisinmanyrespectssituatedattheforefrontworldwideingeothermalenergyu.liza.on.
• Icelandenergysitua;on.GeothermalenergyplaysanimportantroleinthegeneralenergyframeworkinIcelandandasharplyincreasingroleinoverallelectricitygenera.on.
• Geothermalenergycon.nuestoplayakeyroleinspacehea.ngandisveryimportantinthegeneraleconomyofIcelandtoreplacefossilfuelcosttatwouldotherwisebeincurredinthecoldclimate

UPEC2016
Discussion–conclusions(2)
• Theforecastfrom2003haslastedreasonablywellwhenwecomparetheforecastedvaluefor2014withtheactualvaluesof2014.
• Theactualvaluesexceedtheforecastedvaluedespitetheeconomicsetbackinrecentyearsa[er2008

UPEC2016 25