gerard ramos - uncg
TRANSCRIPT
1
Usage and Efficacy of Social Media Marketing Tools: An Investigation of College Age Student’s Behaviors
By
GERARD RAMOS
Honors Thesis
Appalachian State University
Submitted to the Walker College of Business Marketing Department in partial fulfillment of the requirements for the degree of
Bachelor of Science
May, 2019 Approved By:
Neel Das, Ph.D., Thesis Director
Kyle Stevens, Ph.D., Second Reader
Lori Medders, Ph.D., Departmental Honors Director
Jefford Vahlbusch, Ph.D., Dean, Honors College
2
Abstract
This study looks at social media marketing techniques used by the world’s top
companies to determine their effectiveness on college age consumers. Social media use is
becoming increasingly important with the advent of social media platforms such as Facebook
and Twitter. This research first defines the social media marketing strategies done on social
media, and then measures the effectiveness of each strategy on college students. This
research also attempts to see if there is a relationship between personality and the
effectiveness of certain social media marketing strategies.
3
Table of Contents Introduction 4 Literary Review 6 Study 1 12 Study 2 19 Study 3 24 Conclusion/Limitations 31 Appendix 33 References 36
4
Introduction
The advent of the Internet has changed the way people communicate. As a result,
more brands are looking to improve their online presence in order to better reach consumers.
One way to do this is through social media. According to Parsons (2013), Social Media refers
to online tools where content, opinions, perspectives, insights, and media can be shared.
Social media marketing, in turn, uses social media networks to enable content sharing,
information diffusion, relationship building, and fans cohesion (Chang 2015).
Companies are picking up on the trend, and in 2014, worldwide social media
advertising expenditure was at 17.74 million dollars, a 56.2% increase from the year before
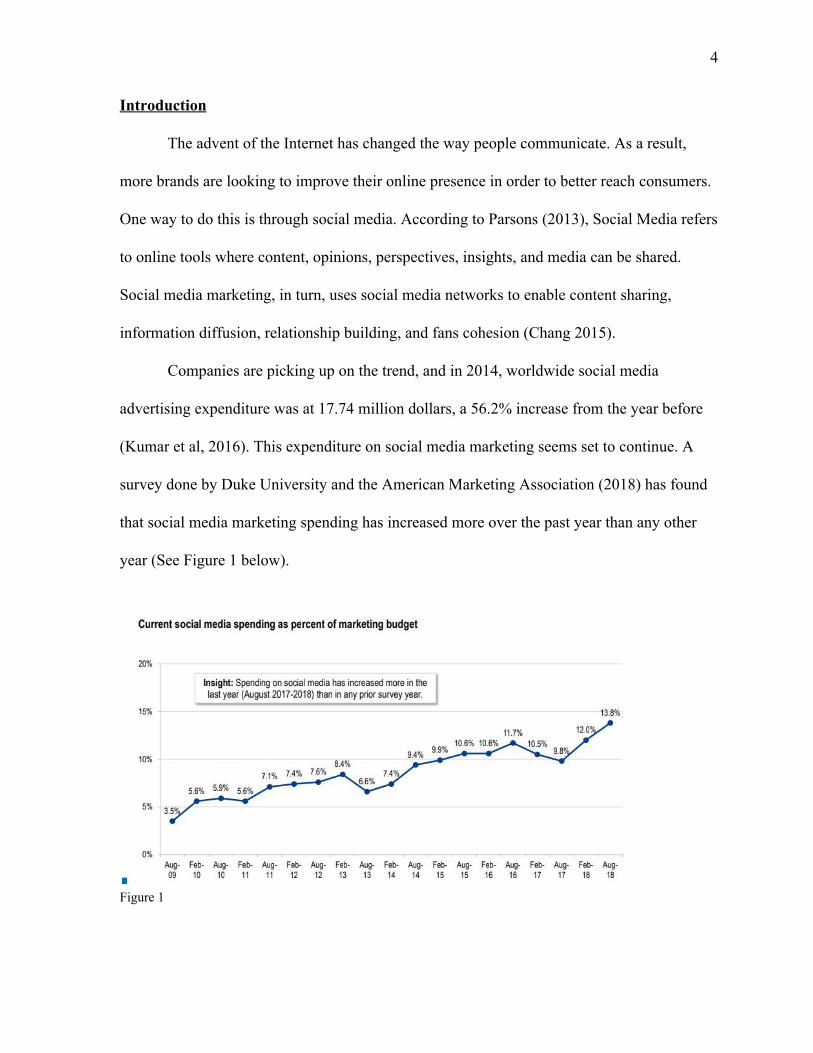
(Kumar et al, 2016). This expenditure on social media marketing seems set to continue. A
survey done by Duke University and the American Marketing Association (2018) has found
that social media marketing spending has increased more over the past year than any other
year (See Figure 1 below).
Figure 1
5
As can be seen, the increase in social media expenditure from August 2017 to August
2018 is the largest increase since the survey began in 2009. The same survey predicts that
over the next 5 years, spending on social media marketing is set to increase by 65%, with an
estimated 22.9% of a given brand’s marketing budget is expected to be for social media
marketing purposes (Duke University, 2018). The way
All of this money that companies are funneling into social media is more than likely
spent on social networking platforms. Social networking platforms, such as Facebook and
Twitter are main way people engage in social media is through. Facebook is widely assumed
to be the most used social media platform and the original social networking site. According
to Kaplan (2009), in 2009, Facebook registered 175 million active users, making them at the
time have a population almost the size of Brazil (180 million). In addition, as of 2017, 80
percent of Fortune 500 companies have an official Facebook account (John et al, 2017).
Given the fact that Facebook has a large and growing user base, it is no surprise to see
successful companies making use of social media marketing on Facebook..
Although there is previous research done on the topic of social media marketing, the
research done has focused on social media usage. There is little research done on social
media marketing when it comes to consumer attitude towards specific social media
marketing strategies. This study aims to assess consumer attitude towards social media
marketing elements (SMME) used by brands on Facebook. Brands looking to be more
competitive must take advantage of social media, and this research attempts to provide a
better insight as to how brands may likely improve their social media marketing strategies.
6
Literary Review Social Media Marketing, A General Overview
Social media marketing, though a relatively new form of marketing, has been
researched a fair amount. A starting issue for any company is whether or not to even utilize
social media marketing as a part of their business strategies. As mentioned earlier, social
media marketing spending by companies is set to increase over the next several years, yet
more research will be need to be done about how to effectively utilize it.
For example, a study by Kumar (2016) assessed social media marketing by focusing
on 3 metrics: spending, cross-buying, and customer profitability. The key finding of the study
were that social media marketing, when combined with other forms of marketing, such as
television, can create a synergistic effect and that social media marketing is effective at
strengthening customer firm relationships (Kumar, 2016).
Customer relationship management (CRM) is also the subject of another study done
by Trainor (2014). The study examines 308 firms’ social media usage and how it influences
their CRM capabilities. Similarly to the study done by Kumar (2016), the study concludes
that social media technologies, in order to be most effective, must be combined with existing
company technologies and resources (Trainor, 2014).
Both studies emphasized the point that social media marketing yields the best results
when integrated with the other resources the company already has. This suggests that when
deciding if a brand should use social media marketing, the deciding factor would be how well
social media technology fits in with the existing resources, at least in terms of CRM. This
finding is significant, given that the survey conducted by Duke University (2018) found that
7
companies are still struggling with properly integrating social media marketing as a part of
their marketing strategy.
In order to account for social media’s reliance on the other resources within a firm’s
system, brands were selected from a variety of business indexes, not just ones that are
focused on social media. This will be further explained in the methodologies section.
Also, both studies provided insight into potential uses companies have for social
media, which in for each of these cases, firms were using social media as a form of CRM.
When defining social media elements for this study, the potential for each element to build
relationships with consumers and social media users was taken into account. With businesses
using social media marketing as a form of CRM, it is only natural that research has also
studied what factors determine the effectiveness of certain social media posts.
An example of a study looking at the factors determining effectiveness of social
media posts was conducted by Chang (2015) uses the Elaboration Likelihood Model theory
(Cacippo & Petty, 1986) to explore popularity cohesion, message diffusion, and persuasive
messages in social networking groups. Elaboration Likelihood Model posits that there are
two distinct routes for processing information, the central route and the peripheral route. The
central route is applicable when the subject has an interest and the motivation to think about
the topic of discussion. In this model, the subject will be more invested in the social media
post, as opposed to the peripheral route, where the subject has little interest in the matter at
hand and therefore will not pay as much attention to the content of a particular social media
post.
8
The study focused on iCook, a Taiwanese based cooking community site that focuses
on collecting and sharing recipes. The study analyzed iCook’s Facebook page, observing the
various Facebook posts (Chang, 2015). The study concluded that the popularity of posts has
the greatest effect on users perception of usefulness on the post, with popularity affecting
both the central and peripheral routes. This posits that social media “fans” prefer social
media posts should not only be popular, but that posts should be useful and interactive, such
as including a link to the brand’s website (Chang 2015).
Survey items used for our study used were designed with factors such as popularity in
mind, and when creating items for the second survey, popularity measures such as “likes”
and “shares” on a post were set equally to remove that bias from survey takers perceptions.
Another study looking at the effects of popularity and “likes” on Facebook was done
in 2017 by John, Emrick, Gupta, and Norton. The study focused on if a user “likes” a brand
on Facebook, is it simply out of fondness for the brand, or can it lead users to have a more
positive view of the brand, leading to potentially more purchases. Research found that while
the act of “liking” a firm’s Facebook page does not directly lead to meaningful purchase
decisions, there is potential for firms that promote user interaction on their Facebook pages to
have an effect in consumer attitudes towards the brand (John, et. al 2017).
It is important to note that “likes” alone do not create value for consumers on social
media. That is why for our study, when defining social media elements, it is taken into
account how companies are trying to promote consumer interactions thus, influencing their
attitudes.
9
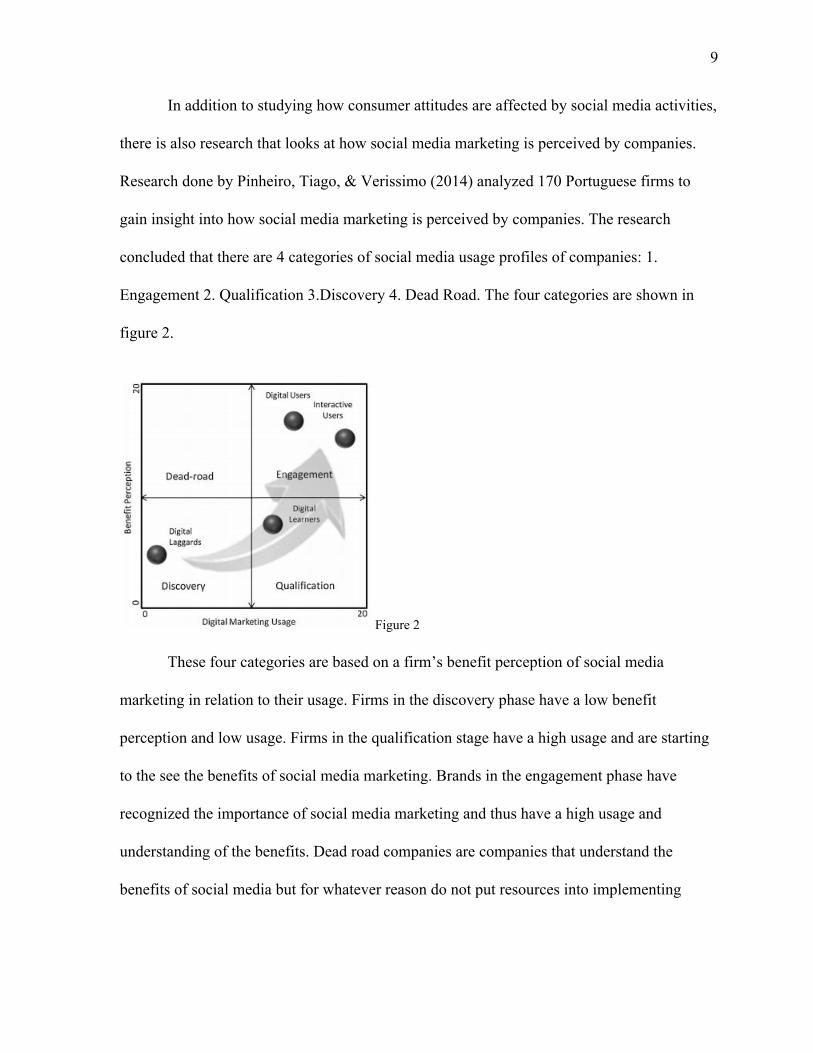
In addition to studying how consumer attitudes are affected by social media activities,
there is also research that looks at how social media marketing is perceived by companies.
Research done by Pinheiro, Tiago, & Verissimo (2014) analyzed 170 Portuguese firms to
gain insight into how social media marketing is perceived by companies. The research
concluded that there are 4 categories of social media usage profiles of companies: 1.
Engagement 2. Qualification 3.Discovery 4. Dead Road. The four categories are shown in
figure 2.
Figure 2
These four categories are based on a firm’s benefit perception of social media
marketing in relation to their usage. Firms in the discovery phase have a low benefit
perception and low usage. Firms in the qualification stage have a high usage and are starting
to the see the benefits of social media marketing. Brands in the engagement phase have
recognized the importance of social media marketing and thus have a high usage and
understanding of the benefits. Dead road companies are companies that understand the
benefits of social media but for whatever reason do not put resources into implementing
10
social media marketing. Traditionally, companies go from Discovery, to qualification, to
engagement (Pinheiro et al, 2014).
For our study, we analyzed larger brands that are assumed to be in either the
Qualification or Engagement phases were analyzed considering they were defined as
successful companies by various business indexes. The process of selecting brands for this
study as mentioned before, will be further elaborated on in the Methodologies section.
The benefits of social media, which are alluded to in Pinheiro’s (2014) research range
from CRM, which was also the subject of research mentioned earlier by Trainor (2014), to
more tangible measurements such as online sales.
A study measuring the more tangible impacts of social media marketing was done by
Zhang, Trusov, Stephen, and Jamal (2017). Zhang, et al, observes the correlation between
social media marketing activities and online shopping. The framework of their study is based
on time allocation theories, highlighting that “people allocate their time to various activities
in line with the utility impact of the commodities they derive from those activities” (Zhang,
et al. 2017). The theory was applied to social media usage and online e-commerce patterns.
According to Zhang (2017), there is correlation between social media usage and online sales.
At first, this may seem contradictory to the research done by John (2017) stating that “liking”
a social media post does not directly lead to a purchase decision. That being said, Zhang
(2017) was looking at overall usage, whereas John (2017) was looking strictly at the one
social media activity of “liking”.
11
Where this study aims to add onto the conversation is to look at a variety of social
media strategies utilized by companies on Facebook to see if there is one in particular that
which has the most positive effect on consumer attitude.
Personality and Social Media Besides social media marketing techniques and their effectiveness, the relationship
between personality and social media use is a subject that researchers are looking at as well,
and this study is no exception. Personality was chosen to be included in this study because
personality may have an influence on how consumers are affected by social media marketing.
For example, a personality trait, such as being outgoing, can possibly change how a
consumer interacts with a brand on social media. Studies by Correa, Bachmann, Hinsley, and
Zuñiga (2013) and Gosling, Augustine, Vazire, Holtman, and Gaddis (2013) both look at the
Big 5 Personality traits and their relation to social media use.
The Big 5 Personality traits refer to extraversion, openness, conscientiousness,
neuroticism, and agreeableness. The idea of a Big 5 was first popularized by research done
by Digman (1990), then was built on by Goldberg (1993). Both articles highlight the history
of the Five Factor Model and Big 5 traits that are now the subject of many studies.
While both studies focused on different aspects of the Big 5, both studies concluded
that in terms of social media usage, extraversion was the main personality indicator (Correa,
et al. 2013) (Gosling, et al. 2013). This makes sense be, given that because people who are
extraverted are more outgoing, and therefore, more likely to use social media to
communicate with others. However, this may be different when looking at different social
media platforms. More concrete research on how personality and social media use is split
between the various networking sites will need to be done.
12
While there are studies observing the relationship between personality and social
media use, our study attempts to see if there is correlation between Big 5 personality traits
and certain social media elements. A study by Gosling, Rentfrow, and Swann (2003) serves
as a way of measuring the Big 5. The aim of the study was to create a way to assess the Big 5
personality traits without the use of a long measure item test, given that often these tests are
time consuming. The study created both a five-item personality inventory (FIPI) and a
ten-item personality inventory (TIPI), which both were short measures of the Big 5
personality traits (Gosling, 2003).
Study 1: Content Analysis Purpose
The purpose for this study is to get an idea of what is currently happening with
regards to social media. By answering the “what”, further research can be used to analyze if
“what” is going on is effective. This will be done through looking at the top companies and
seeing what activities they have as far as social media strategies. Eventually, a list of
elements will be defined.
Methods
Brands were selected using a variety of business indexes, social media indexes, and
online rankings. In this way, it was assured that the brands being researched would be not
just financially successful, but also effective in using social media as a form of marketing.
These brands are assumed to be either in the Qualification on Engagement phases of
Pinheiro’s (2014) research (mentioned earlier) given their appearance on these indexes,
meaning they are not only successful companies, but companies that utilize social media.
13
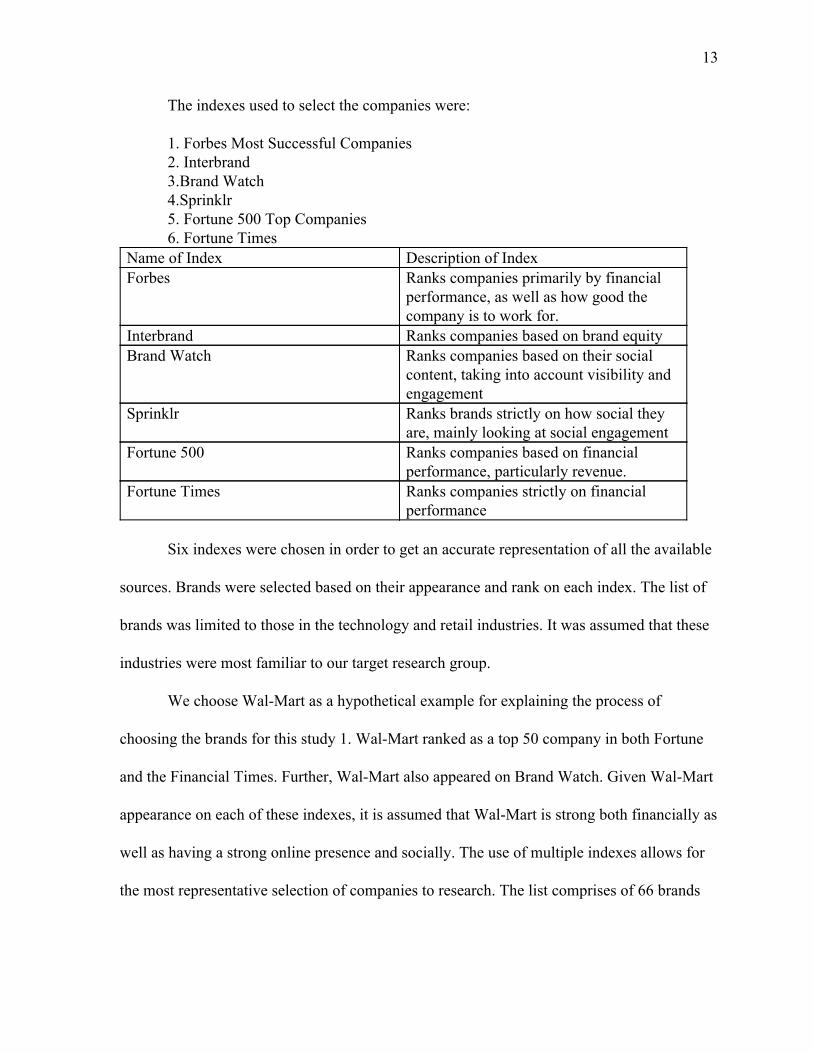
The indexes used to select the companies were:
1. Forbes Most Successful Companies 2. Interbrand 3.Brand Watch 4.Sprinklr 5. Fortune 500 Top Companies 6. Fortune Times
Name of Index Description of Index Forbes Ranks companies primarily by financial
performance, as well as how good the company is to work for.
Interbrand Ranks companies based on brand equity Brand Watch Ranks companies based on their social
content, taking into account visibility and engagement
Sprinklr Ranks brands strictly on how social they are, mainly looking at social engagement
Fortune 500 Ranks companies based on financial performance, particularly revenue.
Fortune Times Ranks companies strictly on financial performance
Six indexes were chosen in order to get an accurate representation of all the available
sources. Brands were selected based on their appearance and rank on each index. The list of
brands was limited to those in the technology and retail industries. It was assumed that these
industries were most familiar to our target research group.
We choose Wal-Mart as a hypothetical example for explaining the process of
choosing the brands for this study 1. Wal-Mart ranked as a top 50 company in both Fortune
and the Financial Times. Further, Wal-Mart also appeared on Brand Watch. Given Wal-Mart
appearance on each of these indexes, it is assumed that Wal-Mart is strong both financially as
well as having a strong online presence and socially. The use of multiple indexes allows for
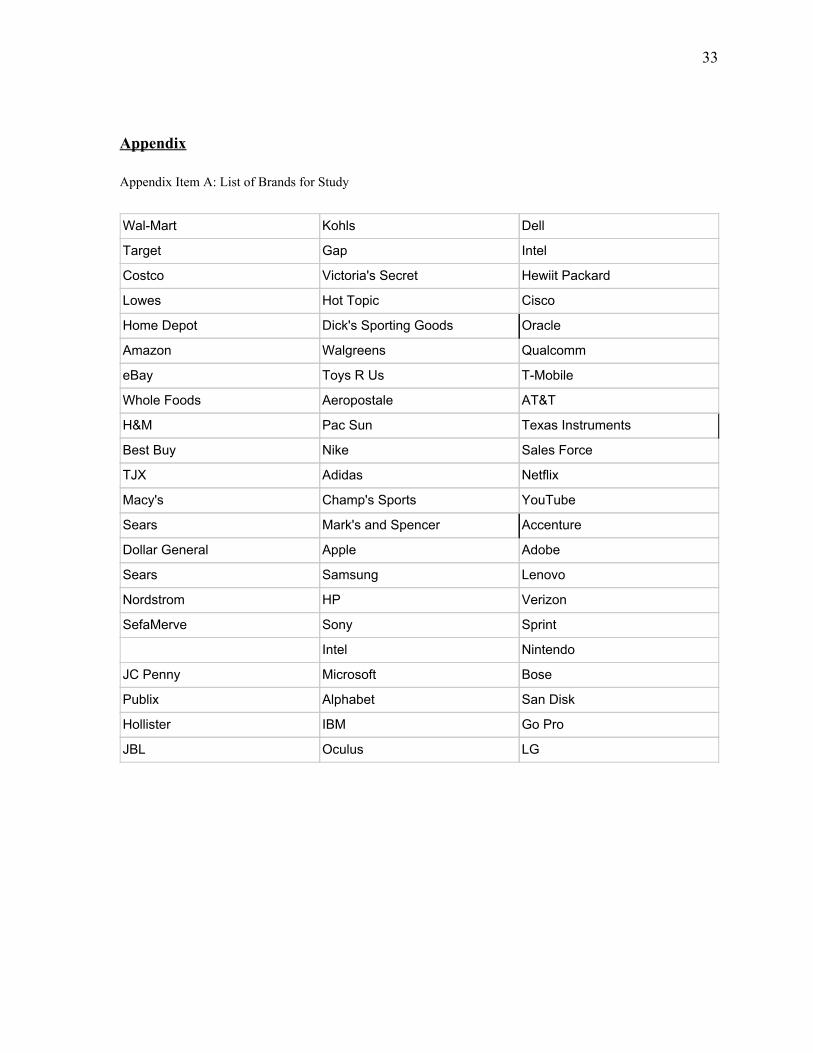
the most representative selection of companies to research. The list comprises of 66 brands
14
and is available in Appendix item A. For the purposes of this study, we decided to restrict the
brands to the first 60.
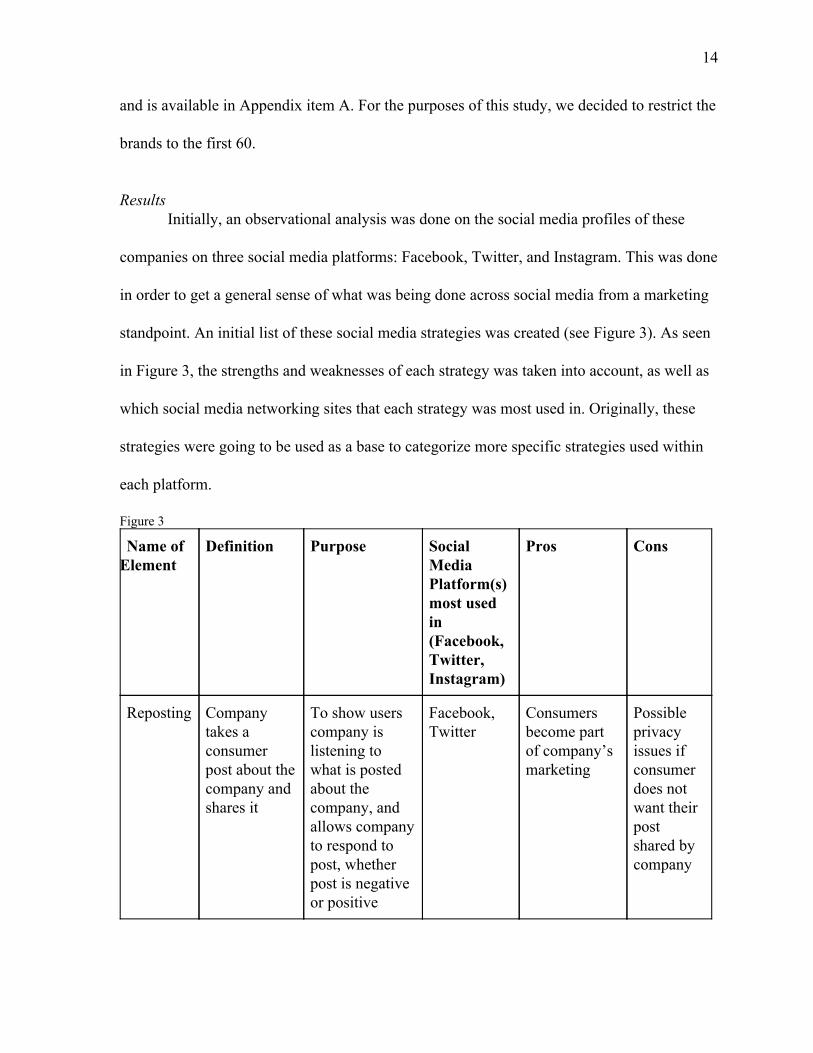
Results Initially, an observational analysis was done on the social media profiles of these
companies on three social media platforms: Facebook, Twitter, and Instagram. This was done
in order to get a general sense of what was being done across social media from a marketing
standpoint. An initial list of these social media strategies was created (see Figure 3). As seen
in Figure 3, the strengths and weaknesses of each strategy was taken into account, as well as
which social media networking sites that each strategy was most used in. Originally, these
strategies were going to be used as a base to categorize more specific strategies used within
each platform.
Figure 3
Name of Element
Definition Purpose Social Media Platform(s) most used in (Facebook, Twitter, Instagram)
Pros Cons
Reposting Company takes a consumer post about the company and shares it
To show users company is listening to what is posted about the company, and allows company to respond to post, whether post is negative or positive
Facebook, Twitter
Consumers become part of company’s marketing
Possible privacy issues if consumer does not want their post shared by company
15
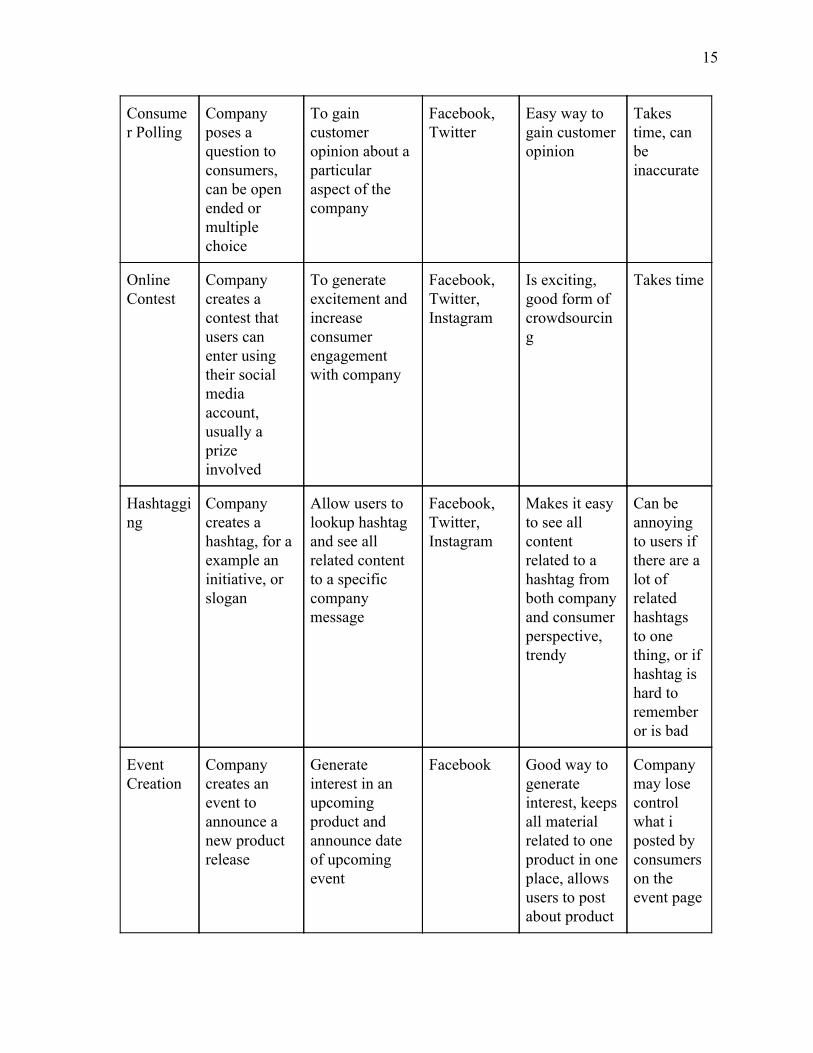
Consumer Polling
Company poses a question to consumers, can be open ended or multiple choice
To gain customer opinion about a particular aspect of the company
Facebook, Twitter
Easy way to gain customer opinion
Takes time, can be inaccurate
Online Contest
Company creates a contest that users can enter using their social media account, usually a prize involved
To generate excitement and increase consumer engagement with company
Facebook, Twitter, Instagram
Is exciting, good form of crowdsourcing
Takes time
Hashtagging
Company creates a hashtag, for a example an initiative, or slogan
Allow users to lookup hashtag and see all related content to a specific company message
Facebook, Twitter, Instagram
Makes it easy to see all content related to a hashtag from both company and consumer perspective, trendy
Can be annoying to users if there are a lot of related hashtags to one thing, or if hashtag is hard to remember or is bad
Event Creation
Company creates an event to announce a new product release
Generate interest in an upcoming product and announce date of upcoming event
Facebook Good way to generate interest, keeps all material related to one product in one place, allows users to post about product
Company may lose control what i posted by consumers on the event page
16
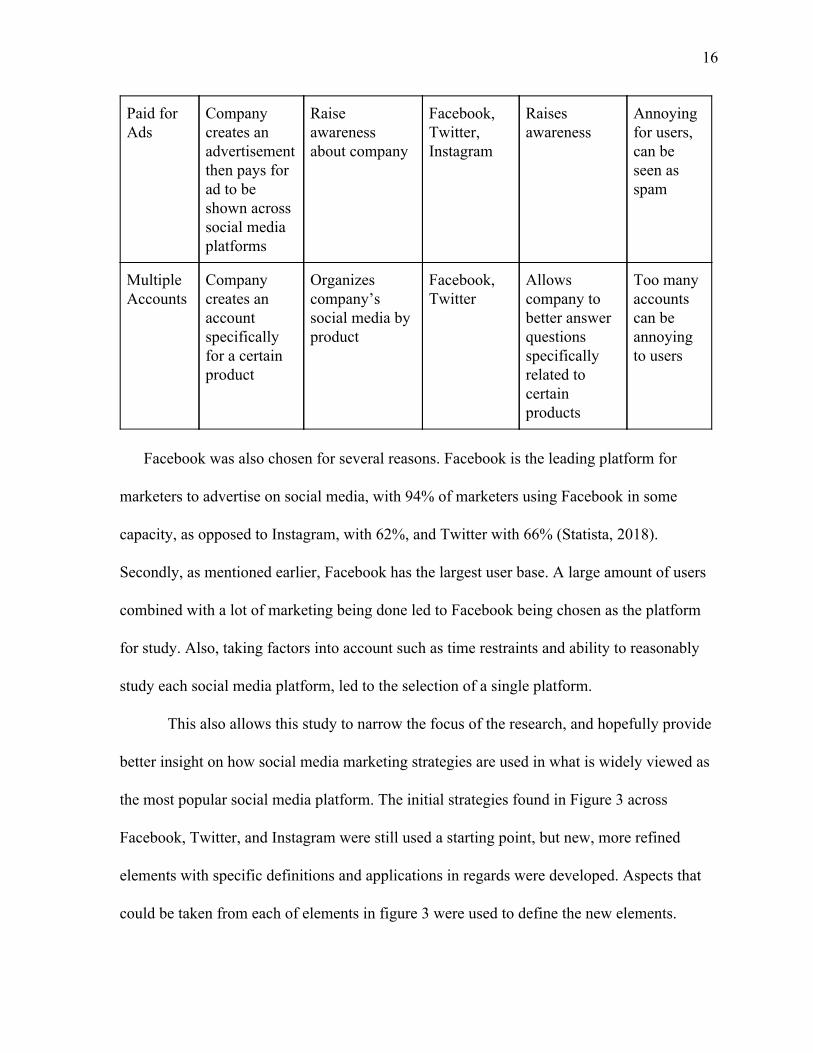
Paid for Ads
Company creates an advertisement then pays for ad to be shown across social media platforms
Raise awareness about company
Facebook, Twitter, Instagram
Raises awareness
Annoying for users, can be seen as spam
Multiple Accounts
Company creates an account specifically for a certain product
Organizes company’s social media by product
Facebook, Twitter
Allows company to better answer questions specifically related to certain products
Too many accounts can be annoying to users
Facebook was also chosen for several reasons. Facebook is the leading platform for
marketers to advertise on social media, with 94% of marketers using Facebook in some
capacity, as opposed to Instagram, with 62%, and Twitter with 66% (Statista, 2018).
Secondly, as mentioned earlier, Facebook has the largest user base. A large amount of users
combined with a lot of marketing being done led to Facebook being chosen as the platform
for study. Also, taking factors into account such as time restraints and ability to reasonably
study each social media platform, led to the selection of a single platform.
This also allows this study to narrow the focus of the research, and hopefully provide
better insight on how social media marketing strategies are used in what is widely viewed as
the most popular social media platform. The initial strategies found in Figure 3 across
Facebook, Twitter, and Instagram were still used a starting point, but new, more refined
elements with specific definitions and applications in regards were developed. Aspects that
could be taken from each of elements in figure 3 were used to define the new elements.
17
For example, the social media marketing element “A company asking consumer input
or opinion through a Facebook post” found in Figure 4 below, was based from “Consumer
Polling” in Figure 3. The strategies found from altogether Twitter, Facebook, and Instagram
were referred to when creating the new elements for just Facebook, given the features of
Facebook ecompass a lot of the ones done by Twitter and Instagram.
The Facebook profiles for each brand were analyzed through observation. The
Facebook profile of brand was studied, and the past 20 Facebook posts were recorded and
categorized. The main activities and significant actions performed by each brand on their
Facebook accounts for 3 months prior to specified date were observed and taken note of.
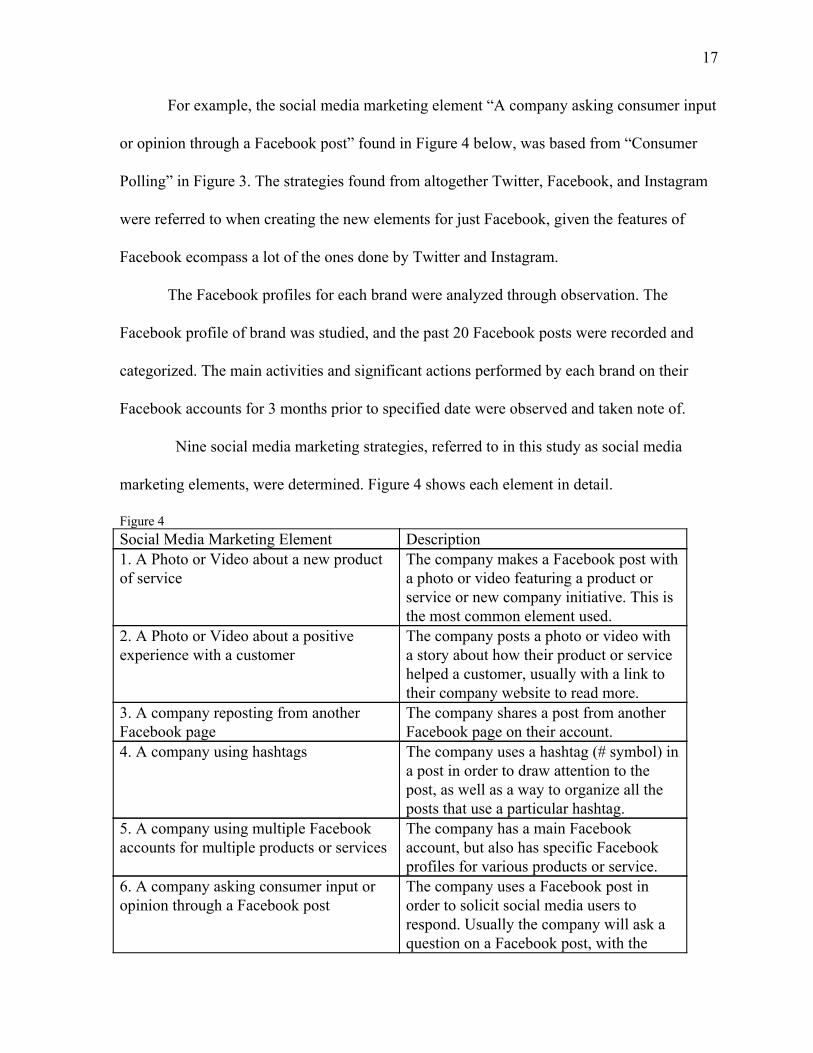
Nine social media marketing strategies, referred to in this study as social media
marketing elements, were determined. Figure 4 shows each element in detail.
Figure 4 Social Media Marketing Element Description 1. A Photo or Video about a new product of service
The company makes a Facebook post with a photo or video featuring a product or service or new company initiative. This is the most common element used.
2. A Photo or Video about a positive experience with a customer
The company posts a photo or video with a story about how their product or service helped a customer, usually with a link to their company website to read more.
3. A company reposting from another Facebook page
The company shares a post from another Facebook page on their account.
4. A company using hashtags The company uses a hashtag (# symbol) in a post in order to draw attention to the post, as well as a way to organize all the posts that use a particular hashtag.
5. A company using multiple Facebook accounts for multiple products or services
The company has a main Facebook account, but also has specific Facebook profiles for various products or service.
6. A company asking consumer input or opinion through a Facebook post
The company uses a Facebook post in order to solicit social media users to respond. Usually the company will ask a question on a Facebook post, with the
18
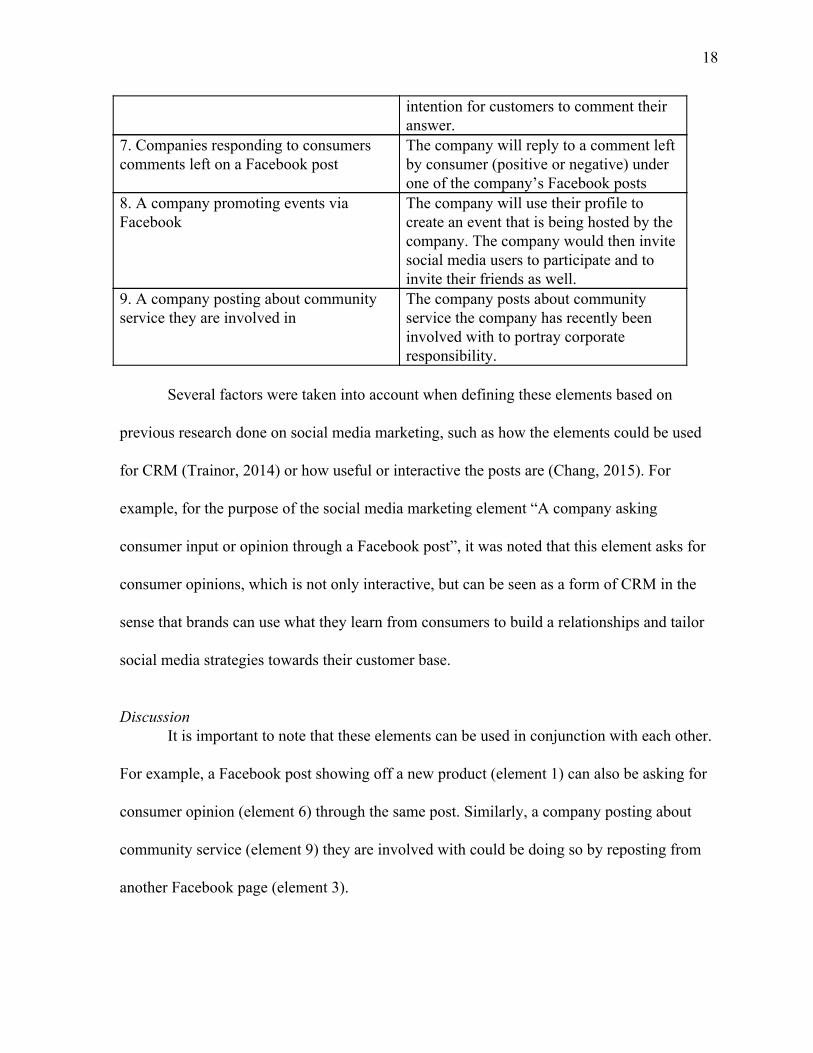
intention for customers to comment their answer.
7. Companies responding to consumers comments left on a Facebook post
The company will reply to a comment left by consumer (positive or negative) under one of the company’s Facebook posts
8. A company promoting events via Facebook
The company will use their profile to create an event that is being hosted by the company. The company would then invite social media users to participate and to invite their friends as well.
9. A company posting about community service they are involved in
The company posts about community service the company has recently been involved with to portray corporate responsibility.
Several factors were taken into account when defining these elements based on
previous research done on social media marketing, such as how the elements could be used
for CRM (Trainor, 2014) or how useful or interactive the posts are (Chang, 2015). For
example, for the purpose of the social media marketing element “A company asking
consumer input or opinion through a Facebook post”, it was noted that this element asks for
consumer opinions, which is not only interactive, but can be seen as a form of CRM in the
sense that brands can use what they learn from consumers to build a relationships and tailor
social media strategies towards their customer base.
Discussion
It is important to note that these elements can be used in conjunction with each other.
For example, a Facebook post showing off a new product (element 1) can also be asking for
consumer opinion (element 6) through the same post. Similarly, a company posting about
community service (element 9) they are involved with could be doing so by reposting from
another Facebook page (element 3).
19
While other social media marketing elements may exist, these were the 9 elements
chosen for this study. These 9 were the ones observed to be used the most on Facebook,
however how consumers view them and their effectiveness have not been tested yet. It was
decided that these 9 elements will be furthered looked at to answer how consumers feel about
these elements, and furthermore which of these elements would lead consumers to ultimately
act upon.
Study 2: Pilot Study Purpose
Study 2 was designed to understand the 9 social media marketing elements as shown
in Figure 4 from a consumer perspective. This will be done by learning both consumer
familiarity and attitude towards each of the elements found in study 1. Also, this study
attempts to see if there is a link between any of the Big 5 personality traits and consumer
attitude towards the elements. In accomplishing these objectives, this pilot study will serve as
a basis for the main study by providing a standout “best” element, and a standout “worst”
element.
Methodology: Survey Design
The initial survey was taken online via Qualtrics, with 51 respondents. Survey items
consisted of basic screening questions; such as does the survey taker have a Facebook
account. Once the initial questions were completed to determine if the participant was
eligible to participate in the survey, they were then prompted to answer questions concerning
the individual social media elements.
20
Each questionnaire(?) reads as follows. Each respondent was given the name of one
of the social media elements as well as an example of what the element would looks like. For
example, the question would read: A company posting on Facebook about community
service they are involved in, followed by an image of Facebook post by a company posting
about community service. In this way, respondents had a real life example to look at while
answering questions about each element.
The participants were then asked a series of questions about their familiarity with the
element, and then with their attitude towards the elements. The questions were asked using a
Likert scale from 1-7, with a neutral answer choice of 4. The questions were aimed at
gauging the familiarity of each element for each respondent, as well as the general attitude
each respondent had towards each specific element.
For questions concerning familiarity, respondents were ask from 1 to 7 how well they
knew the element, as well as how familiar they were with each element. This was done in
order to see if the elements are indeed being used by social media marketers on Facebook are
indeed recognizable by respondents. Responses of 1 would indicate that the respondents are
unfamiliar with the elements, with responses of 7 showing extreme familiarity. For the items
concerning attitude, respondents were similarly asked Likert scale style questions with 1
meaning the respondent had a negative attitude towards the element, and 7 meaning the
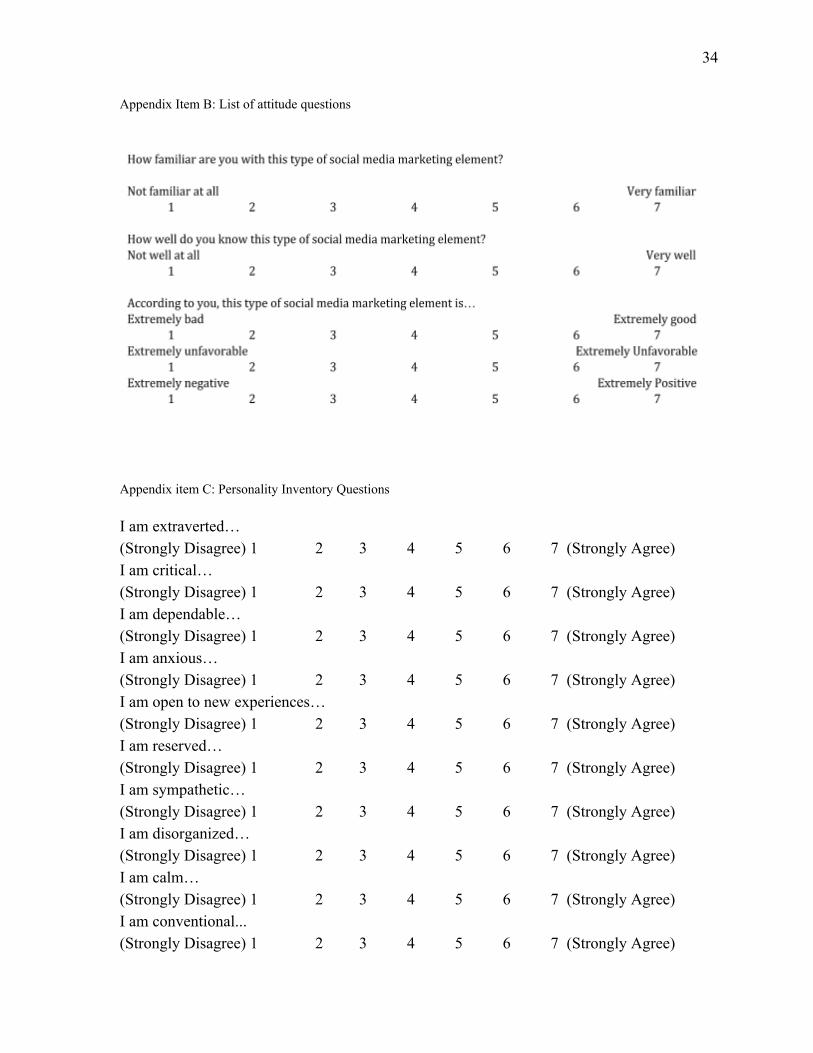
respondent had a positive one. The full list of attitude questions can be found in Appendix
item B.
The second part of the survey certain measured personality traits As mentioned
earlier, there have been several studies linking personality and social media use. That being
21
said, this study attempts to see if there is a link between certain social media elements and
any of the Big 5 Personality Traits. This study adapted the Ten Item Personality Inventory
designed by Gosling, et al (2003). The study concluded that the TIPI, though not as thorough
as a more extensive Personality inventory that could contain hundreds of items, is still a
serviceable way to measure personality.
The TIPI was selected as opposed to the FIPI for two key reasons. One being that it
was more extensive the Five Item Personality Inventory (FIPI) because the TIPI includes
“reverse terms” for each of the Big 5 personality inventory. The other key reason being that
the TIPI, though being a short measure, is still an efficient way to analyze personality.
The adopted personality inventory for this study consisted of 10 “I am” statements
that the respondent would then answer how much they agreed or disagreed with the
statement. For example, a statement would read “I am outgoing” and the respondent would
answer how much they agree or disagree with the statement. Similarly to the questions asked
in the first section concerning familiarity and attitude, a Likert scale was used with a range of
1 to 7. This way, respondents could make use of a full range of answer choices. The full
personality inventory can be found in Appendix item C.
Results
The results of the survey produced several outcomes. For starters, while over 93
percent of respondents said they have a Facebook account, only 48 percent of respondents
said they have actually went and purchased anything based on something they have seen on
22
Facebook. This posits that while consumers are using Facebook, the social media strategies
used by brands are only affecting about half of users in terms of purchasing decisions.
For the social media marketing elements themselves, each element was assigned a
familiarity score and an attitude score, which were based off of the Likert scale questions
asked in the first part of the survey. The study found that all of the elements were fairly well
known, ach scoring higher than the middle score of 4. However, as far as consumer attitude,
element 7, companies responding to consumer comments, was by and large the social media
marketing element that scored the highest, meaning it was the most favorable in the eyes of
survey respondents, with companies posting about community service (element 9) a distant
second. A company posting about a positive experience with a customer (element 2) scored
the worst in terms of attitude. Consistently in the middle was element 1, or a photo or video
promoting a product or service.
To personality inventory scores were analyzed as well, and a Pearson Correlation test
was performed to see if there was a relationship between any of the Big 5 personality traits
and the social media marketing elements. For both element 2 and element 7, the elements
scoring the worst and best in terms of attitudes respectively, conscientiousness was found to
have a significant correlation.
Discussion
All of the elements being familiar to respondents supports the findings in study one,
which aimed to answer what was being done by companies on Facebook from a social media
marketing standpoint. Though there may be other elements being used, these 9 at least were
familiar to respondents.
23
In terms of attitude, this study determined a best, worst, and neutral element. The
“best” element being companies responding to consumer comments on a Facebook post. The
“worst” being a company posting a photo or video about a positive customer experience. The
“control” element being a company posting a photo or video about a product or service.
The other important finding is that both element 2 and element 7 have a statistically
significant correlation with the personality trait of conscientiousness. Gosling (2003) defines
conscientiousness as being dependable, organized, hard working, responsible, and thorough,
while the opposites being impulsive and careless. It is possible that people exhibiting
conscientiousness have a favorable attitude towards the “best” element, companies
responding to consumer comments left on a Facebook post, because they perceive a company
that is responding to consumer comments as a company that is responsible and organized,
and as a company that cares about what their consumers have to say. For the “worst”
element, or a company posting a photo or video about a positive experience with a customer,
conscientious respondents may have felt negatively due to the motives behind why the
company would post about a positive experience with a consumer. Perhaps consumers view
the company as irresponsible and having a bad product or service, and that the company is
highlighting one case where their product has positively affected someone, as opposed to the
reality where their products really do not have this effect. More research will have to be done
to see the reasons as to why the correlation between conscientiousness and both of these
elements.
The pilot survey, having defined a “best”, “worst”, and “control” element in terms of
attitude, sets the basis to further study these elements in terms of what matters most: effect on
24
consumers. It was concluded that the main study use the 3 elements from the pilot survey as
the elements of study. Also, the main study should seek to confirm whether or not
conscientiousness still plays a role in terms of how respondents feel towards the social media
marketing elements.
Study 3: Main Study
Purpose
This third and final study serves as the main study of this research. The goal is to
determine the effectiveness of the social media marketing elements. To determine
effectiveness, buyer intention and word of mouth (WOM) are the two factors being
measured. The pilot study gave 3 social media marketing elements to work with, one scoring
the best, one scoring the worst, and one scoring in the middle in terms of respondents’
attitude towards them. This study will add on to the findings of the first 2 studies, by finding
out of if what is being done by companies on Facebook actually persuades consumers to buy.
Methods The main study was conducted using the online survey platform Qualtrics. Unlike the
pilot study, the main study only focused on 3 of the social media marketing elements. Each
respondent was assigned one condition. The conditions respondents were assigned were
either the “best”, “worst”, or “control” elements. Each of the three conditions were created
using one of the elements to represent Facebook posts by a fake company attempting to sell
headphones. In order to eliminate any bias, all of the posts were given the same amount of
likes, shares, used the same image, and were even made to have been posted at the same time
25
of day. This was done to make sure the only difference between each of the conditions are
the elements themselves.
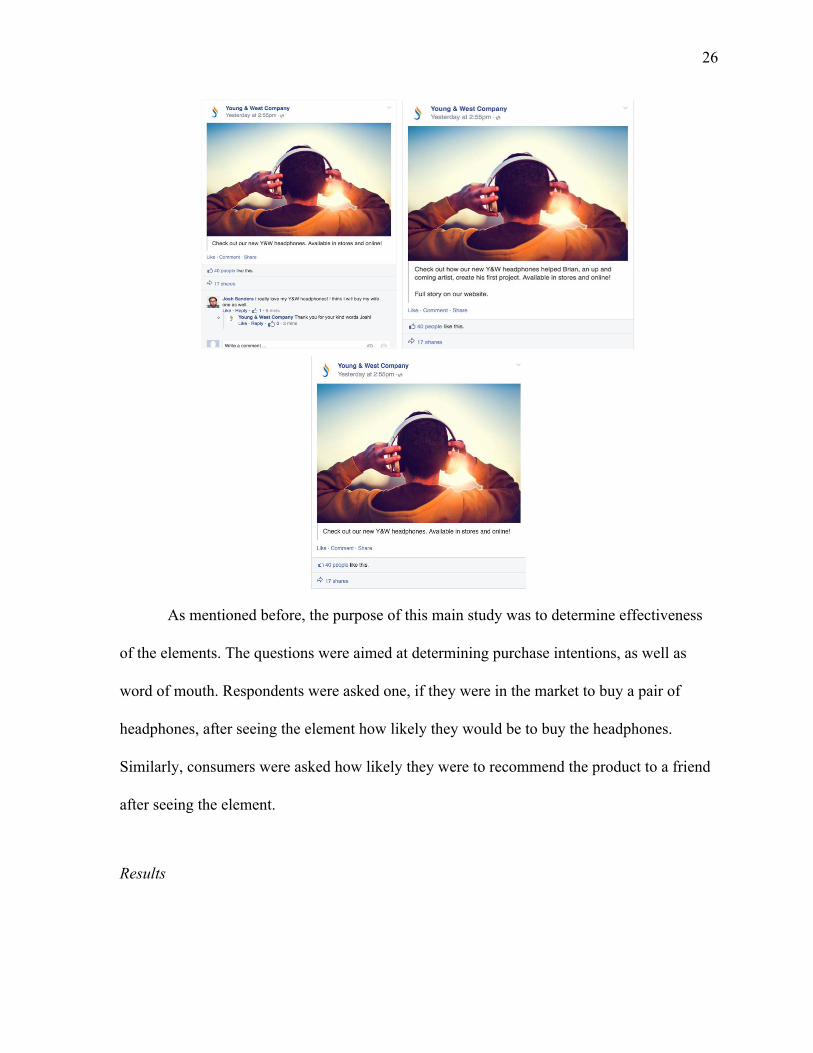
The three elements are in figure 5 shown below. The first image shown (top left)
represent the “best” element, or companies responding to consumer comments left on
Facebook post. The second image (top right) represents the “worst” element, or a company
posting about a positive customer experience. The final image (bottom) represents the
“control” element, or a photo or video about a product or service.
After seeing the element, each respondent was asked about their familiarity, as well
as their attitude towards the condition they were presented with. The questions were similar
to those asked in the first study. Personality questions concerning conscientiousness were
also asked in order to see if there was any relation between conscientiousness and how
respondents felt about the elements. This was based off the results found in study 1 possibly
linking conscientiousness and attitude.
Figure 5
26
As mentioned before, the purpose of this main study was to determine effectiveness
of the elements. The questions were aimed at determining purchase intentions, as well as
word of mouth. Respondents were asked one, if they were in the market to buy a pair of
headphones, after seeing the element how likely they would be to buy the headphones.
Similarly, consumers were asked how likely they were to recommend the product to a friend
after seeing the element.
Results
27
All of the 3 elements were found to be familiar to respondents. All of the elements on
a 7 point scale all scored higher than 5. Also, an univariate ANOVA on the dependent
variable familiarity indicated no significant difference (F (2, 158) = .418; p > .05). An univariate
ANOVA on the dependent variable of how well respondents know the element also indicated
no significant difference (F (2, 158) = 1.130; p > .05). This shows that while the elements were
well known and familiar to respondents, one was not significantly more familiar to
respondents than the others.
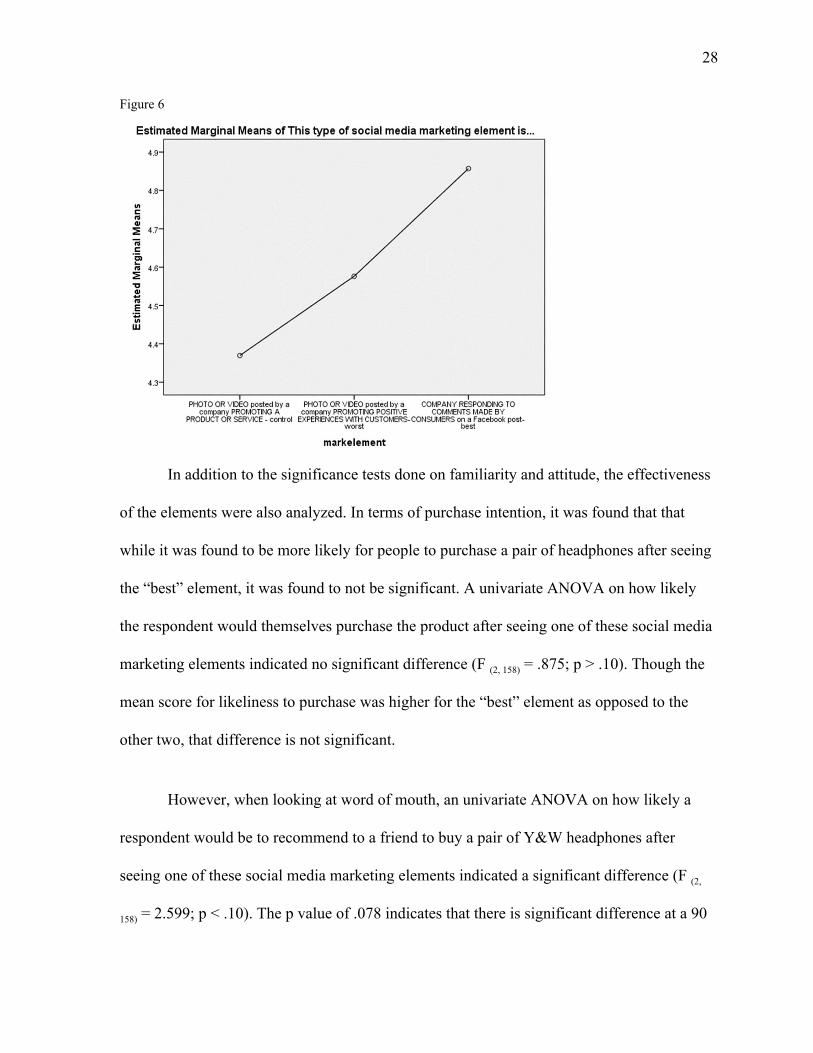
In terms of attitude, it was found that the “best” element was viewed to be more
positive than the other elements. A univariate ANOVA on how respondents viewed how
positive or negative the elements were indicated no significant difference (F (2, 158) = 2.226; p
= .11). However, the p value is marginally significant at .10 level, which likely indicates a
form of directionality. The directionality probably indicates that the element we thought
would have the most positive score (based on the results of the pilot survey) is indeed the one
that respondents feel more positively towards. Figure 6 below illustrates this directionality.
28
Figure 6
In addition to the significance tests done on familiarity and attitude, the effectiveness
of the elements were also analyzed. In terms of purchase intention, it was found that that
while it was found to be more likely for people to purchase a pair of headphones after seeing
the “best” element, it was found to not be significant. A univariate ANOVA on how likely
the respondent would themselves purchase the product after seeing one of these social media
marketing elements indicated no significant difference (F (2, 158) = .875; p > .10). Though the
mean score for likeliness to purchase was higher for the “best” element as opposed to the
other two, that difference is not significant.
However, when looking at word of mouth, an univariate ANOVA on how likely a
respondent would be to recommend to a friend to buy a pair of Y&W headphones after
seeing one of these social media marketing elements indicated a significant difference (F (2,
158) = 2.599; p < .10). The p value of .078 indicates that there is significant difference at a 90
29
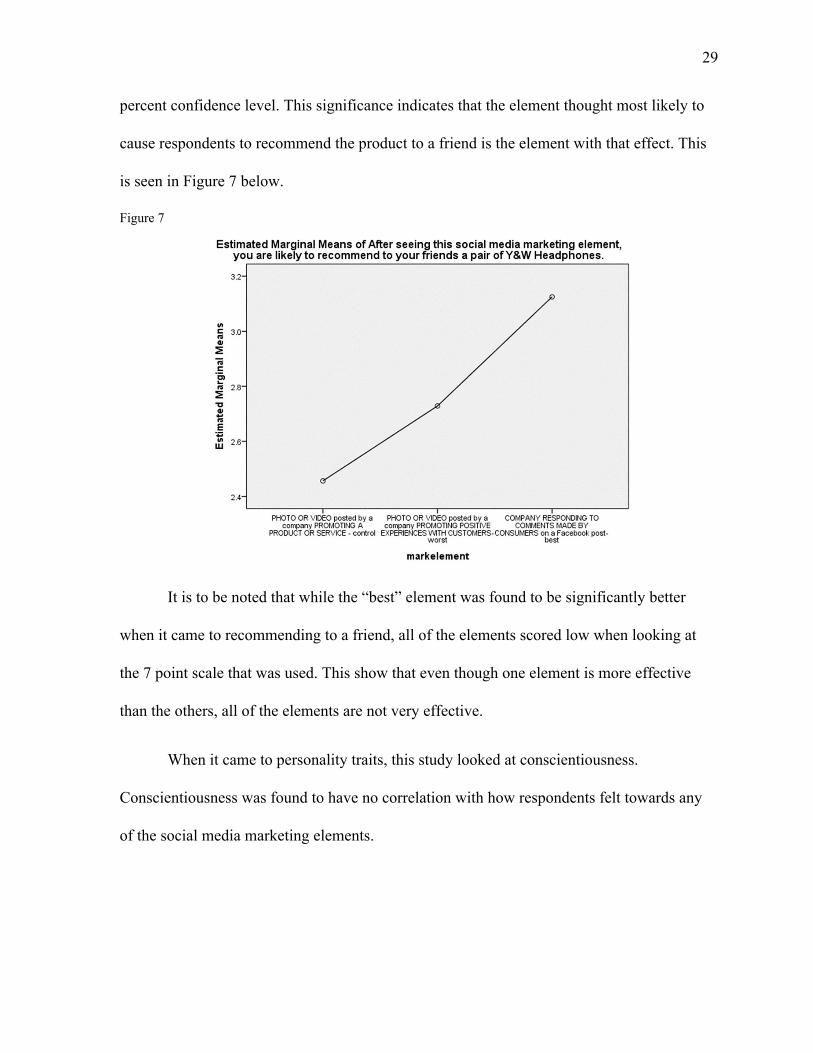
percent confidence level. This significance indicates that the element thought most likely to
cause respondents to recommend the product to a friend is the element with that effect. This
is seen in Figure 7 below.
Figure 7
It is to be noted that while the “best” element was found to be significantly better
when it came to recommending to a friend, all of the elements scored low when looking at
the 7 point scale that was used. This show that even though one element is more effective
than the others, all of the elements are not very effective.
When it came to personality traits, this study looked at conscientiousness.
Conscientiousness was found to have no correlation with how respondents felt towards any
of the social media marketing elements.
30
Discussion
When discussing the main study, it is important to first look at how the claims found
in the content analysis and pilot study translated. For starters, This study showed the “best”,
“worst”, and “control” elements as being known to respondents. This shows that the
observations done in the first study identifying the original 9 elements as actually being used
by companies on Facebook, are actually recognized and familiar to respondents. That being
said, there are other strategies used on Facebook, and while this study only defined 9 of
them, these other elements may yield different results in terms of familiarity.
When it came to personality and the elements, conscientiousness, though found to be
significant in the pilot study, was not correlated with attitude in the main study. That being
said, previous research linking attitude and personality may lead to more research to see if
personality plays a role in other social networking platforms or with other social media
marketing strategies.
Lastly, in terms of purchase intention and word of mouth, while the “best” element
proved to score the best in both categories, showing to be more effective than the others, it is
important to note two things. With purchase intention, while there was some directionality,
respondents were not significantly more likely to purchase the headphones after seeing the
element. When it came to word of mouth and recommending a friend to purchase, it was
shown to be significantly better, but still relatively ineffective when considering the 7 point
Likert scale that was used. This shows that overall what is being done by companies, at least
on Facebook and within the findings of this study, is not leading consumers to buy or
recommend the products to friends in a meaningful way.
31
Conclusion/Limitations
This research used three studies in order to answer two questions:
1. Find out what successful companies are doing on social media
2. Find out if what companies are doing on social media is effective
Each study yielded separate findings. As you may recall, 9 elements (Figure 2) were
defined by observing the social media accounts of the top companies in the tech and retail
industries. A pilot study was done to define a “best”, “worst”, and “neutral” element by
asking respondents their attitudes towards each of the 9 elements. Once the “best”, “worst”,
and “neutral” elements were decided, the main study was done in order to determine the
effectiveness of each element.
The results showed that the “best” element, which was companies responding to
consumer comments on Facebook, is effective when it comes to whether or not consumers
would recommend the company to their friends. So while the “best” element may not be
significantly more effective than the other elements when it comes to buyer intentions, but
word of mouth is still an important factor when it comes to the effectiveness of a social
media marketing element.
That being said, it is important to note that while the “best” element performed better
than the other elements in terms of effectiveness, the “best” element still was not effective
given the 7 point scale that was used. This study started by trying to discover what
companies were doing as far as a social media marketing. This study then found that while
certain elements of what companies were doing proved to be more effective than others,
overall, all of the social media elements were not very effective.
32
This posits that what companies are doing on social media is not helping the
companies from a sales point, and marginally helping them when it comes to word of mouth.
As mentioned earlier, companies are continually increasing their social media marketing
budgets. More research must be done in order to ensure that companies are properly using
their resources to generate more sales due to social media.
This research, while extensive, had several limitations. For starters, the sample was
taken from college of business students at one university in western North Carolina. Perhaps
asking a different demographic will yield different results. Also, this study identified 9 social
media marketing elements. There very well may be others used on Facebook, and for sure
there are more specific to other social media platforms. Further research into defining other
types of elements can also be done. Specifically looking at this study, the main study looked
at 3 elements, a “best”, a “worst”, and a “neutral” respectively. Research involving the other
6 elements in this study could show a clearer picture of effectiveness. Lastly, research
looking at other personality factors (outside of the Big 5) and their relation to social media
marketing may lead to other insights.
While the findings of this study did not find a definite answer to what social media
marketing elements are effective when marketing to college age consumers, this study opens
the door to new research opportunities. For example, studying social media elements over
other social media platforms, looking at other social media marketing elements, and looking
at other factors that can affect one's social media perception besides just conscientiousness
and the Big 5 personality traits. Further research is required to fully understand social media
marketing, and this research serves as a good starting point for more study into the topic.
33
Appendix Appendix Item A: List of Brands for Study Wal-Mart Kohls Dell
Target Gap Intel
Costco Victoria's Secret Hewiit Packard
Lowes Hot Topic Cisco
Home Depot Dick's Sporting Goods Oracle
Amazon Walgreens Qualcomm
eBay Toys R Us T-Mobile
Whole Foods Aeropostale AT&T
H&M Pac Sun Texas Instruments
Best Buy Nike Sales Force
TJX Adidas Netflix
Macy's Champ's Sports YouTube
Sears Mark's and Spencer Accenture
Dollar General Apple Adobe
Sears Samsung Lenovo
Nordstrom HP Verizon
SefaMerve Sony Sprint
Intel Nintendo
JC Penny Microsoft Bose
Publix Alphabet San Disk
Hollister IBM Go Pro
JBL Oculus LG
34
Appendix Item B: List of attitude questions
Appendix item C: Personality Inventory Questions I am extraverted… (Strongly Disagree) 1 2 3 4 5 6 7 (Strongly Agree) I am critical… (Strongly Disagree) 1 2 3 4 5 6 7 (Strongly Agree) I am dependable… (Strongly Disagree) 1 2 3 4 5 6 7 (Strongly Agree) I am anxious… (Strongly Disagree) 1 2 3 4 5 6 7 (Strongly Agree) I am open to new experiences… (Strongly Disagree) 1 2 3 4 5 6 7 (Strongly Agree) I am reserved… (Strongly Disagree) 1 2 3 4 5 6 7 (Strongly Agree) I am sympathetic… (Strongly Disagree) 1 2 3 4 5 6 7 (Strongly Agree) I am disorganized… (Strongly Disagree) 1 2 3 4 5 6 7 (Strongly Agree) I am calm… (Strongly Disagree) 1 2 3 4 5 6 7 (Strongly Agree) I am conventional... (Strongly Disagree) 1 2 3 4 5 6 7 (Strongly Agree)
35
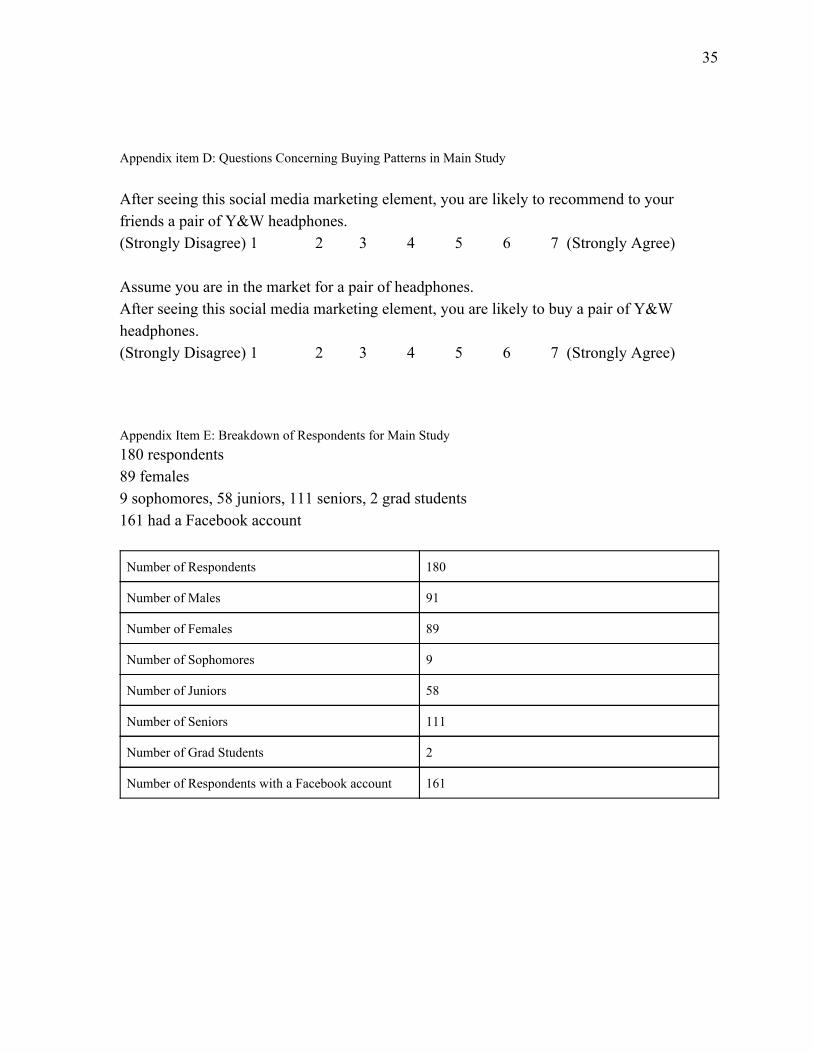
Appendix item D: Questions Concerning Buying Patterns in Main Study After seeing this social media marketing element, you are likely to recommend to your friends a pair of Y&W headphones. (Strongly Disagree) 1 2 3 4 5 6 7 (Strongly Agree) Assume you are in the market for a pair of headphones. After seeing this social media marketing element, you are likely to buy a pair of Y&W headphones. (Strongly Disagree) 1 2 3 4 5 6 7 (Strongly Agree) Appendix Item E: Breakdown of Respondents for Main Study 180 respondents 89 females 9 sophomores, 58 juniors, 111 seniors, 2 grad students 161 had a Facebook account
Number of Respondents 180
Number of Males 91
Number of Females 89
Number of Sophomores 9
Number of Juniors 58
Number of Seniors 111
Number of Grad Students 2
Number of Respondents with a Facebook account 161
36
References Chang, Y., Yu, H., & Lu, H. (2015). Persuasive messages, popularity cohesion, and message diffusion in social media marketing. Journal of Business Research, 68(4), 777-782. doi:10.1016/j.jbusres.2014.11.027 Correa, T & Bachmann, I & Hinsley, A.M. & Gil de Zúñiga, Homero. (2013). Personality and Social Media Use. 10.4018/978-1-4666-4062-9.ch003. Digman, J. M. (1990). Personality structure: Emergence of the five-factor model. Annual Review of Psychology, 41, 417-440. Goldberg, L. R. (1993). The structure of phenotypic personality traits. American Psychologist, 48, 26-34. Gosling, S. D., Augustine, A. A., Vazire, S., Holtzman, N., & Gaddis, S. (2013). Manifestations of Personality in Online Social Networks: Self-Reported Facebook-Related Behaviors and Observable Profile Information. Cyberpsychology, Behavior, and Social Networking,14(9), 483-488. doi:10.1089/cyber.2010.0087 Gosling, S. D., Rentfrow, P. J., & Swann, W. B. (2003). A very brief measure of the Big-Five personality domains. Journal of Research in Personality,37(6), 504-528. doi:10.1016/s0092-6566(03)00046-1 John, L. K., Emrich, O., Gupta, S., & Norton, M. I. (2017). Does “Liking” Lead to Loving? The Impact of Joining a Brands Social Network on Marketing Outcomes. Journal of Marketing Research,54(1), 144-155. doi:10.1509/jmr.14.0237 Kumar, A., Bezawada, R., Rishika, R., Janakiraman, R., & Kannan, P. (2016). From Social to Sale: The Effects of Firm-Generated Content in Social Media on Customer Behavior. Journal of Marketing, 80(1), 7-25. doi:10.1509/jm.14.0249 Naylor, R. W., Lamberton, C. P., & West, P. M. (2012). Beyond the “Like” Button: The Impact of Mere Virtual Presence on Brand Evaluations and Purchase Intentions in Social Media Settings. Journal of Marketing, 76(6), 105-120. doi:10.1509/jm.11.0105 Parsons, A. (2013). Using Social Media to Reach Consumers: A Content Analysis of Official Facebook Pages. Academy of Marketing Studies Journal,17, 27-36.
37
Petty, Richard & Cacioppo, John. (1986). The Elaboration Likelihood Model of Persuasion. Advances in Experimental Social Psychology. 19. 123-205. 10.1016/S0065-2601(08)60214-2. Pinheiro Melo Borges Tiago, M., & Veríssimo, J. M. (2014). Digital marketing and social media: Why bother? Business Horizons,57(6), 703-708. doi:10.1016/j.bushor.2014.07.002 Trainor, K. J., Andzulis, J. (., Rapp, A., & Agnihotri, R. (2014). Social media technology usage and customer relationship performance: A capabilities-based examination of social CRM. Journal of Business Research,67(6), 1201-1208. doi:10.1016/j.jbusres.2013.05.002