get your head into the clouds: using word clouds for analyzing qualitative assessment data
TRANSCRIPT
38 TechTrends • May/June 2014 Volume 58, Number 3
AbstractWord clouds (or tag clouds) are popular,
fun ways to display text data in graphical form; however, we contend that they can also be useful tools in assessment. Using word clouds, instructors can quickly and easily produce graphical depictions of text representing student knowledge. By investigating the patterns of words or phrases, or lack thereof, in textual student responses, instructors can evaluate if students, as a whole, have grasped or missed key concepts or have made common mistakes. Word clouds can be used to provide formative assessment feedback to students, and to identify common themes in student reflection papers. They can also be useful as a starting point or screening tool for large amounts of text data, whether related to assessment or not.
Keywords: Analyzing Text, Assessment, Qualitative Data, Tag Clouds, Word Clouds
he saying, “A picture is worth a thousand words,” continues to hold true even in the assessment world. The ability to organize
assessment data, or any data for that matter, in a graphical representation makes the data easy-to-read and comprehend. Course management systems, online surveys and other technology tools give instructors the ability to gather large amounts of data from students. However, it may be difficult for the instructor to quickly leverage these data to assess students’ learning and give
concrete information to provide a roadmap for course improvement. Is there a method for educators to summarize large amounts of data in a meaningful and efficient way? We propose using word clouds.
Word clouds are more than just an attractive visual representation of words; they can have important applications to a variety of different types of assessments. A word cloud (or a tag cloud) is a . . . “visual presentations of a set of words, typically a set of tags, in which attributes of the text such as size, weight or color can be used to represent features (e.g., frequency) of the associated terms” (Havley and Keane, 2007). Typically, a word cloud takes the most frequently used words and displays them in an appealing visual representation that identifies key words in different sizes and colors based on the frequencies. By examining frequencies in a word cloud, an instructor can look for specific patterns of words and phrases, or the lack thereof, in text data.
The effectiveness of the word cloud is theoretically grounded in the learning model of graphical organizers. “A graphic organizer is a visual communication tool that uses visual symbols to express ideas and concepts, to convey meaning” (Instructional Strategies Online, n.d.). A graphical organizer can provide an assessment picture of individual concepts along with a “big picture” assessment of the interrelationships of the individual concepts. It may also allow the viewer to discover his or her own patterns of relationships have meaning
Get Your Head intothe Clouds: Using Word Clouds forAnalyzing QualitativeAssessment DataBy Concetta A. DePaolo and Kelly Wilkinson, Indiana State University
T

Volume 58, Number 3 TechTrends • May/June 2014 39
for the viewer. Graphic organizers portray knowledge in a meaningful way, which helps bring clarity to ideas as connections are made. Fountas and Pinnell (2001) assert that when content is illustrated with pictures or figures, the information can be maintained in the mind of the viewer over a period of time.
According to Joyce, Weil and Calhoun (2000), Ausubel stated in his work that using organizers is way of presenting information in a more active format that allows the viewer to draw his/her own conclusions. Although he was an educational theorist, Ausubel saw the importance of the presentation of data to draw conclusions and construct relationships. His theory of meaningful learning can be adapted for evaluating assessment data, particularly the issues concerning: (1) how knowledge is organized; (2) how the mind works to process new information; and (3) how the assessor applies the information in meaningful ways (Joyce, Weil, & Calhoun, 2000).
We propose that a word cloud may also be considered an “infographic,” defined as “visual representations of information, data or knowledge that present complex information quickly and clearly” (Smiciklas, 2012), and/or as a “dashboards,” defined as “a graphical user interface that organizes and presents information in an easy-to-read format” (Techtarget.com, n.d.). Regardless of what one chooses to classify the word cloud as, its purpose in assessment is similar. It condenses large amounts of assessment data based on frequencies, and presents a holistic, themed picture that is easy for the user to understand and comprehend, and therefore to use in assessment decisions. Given the power of graphic organizers, infographics or dashboards to be impactful in assessment activities, we propose the use of word clouds as quick, easy and meaningful graphic dashboards in assessment. We present some ways in which word clouds can be used in assessment and show examples of actual applications to real data. We also provide some practical advice for implementing word clouds as assessment tools and provide resources for users who wish to begin using these tools.
Using Word CloudsWord clouds are useful in analyzing any
kind of text data, including essays, short answers or written responses to survey or opinion questions. In this section, several examples of uses of word clouds for assessment purposes are shown, including:• Assessing the use of key word in student short
answer responses;• Comparison of pre- and post-test responses
to show differences;• Course evaluations or midterm feedback
from students to teachers;• Graphical representations of student
knowledge or learning;• Assessing experiential learning by analyzing
student reflection papers;• Programmatic assessment using longitudinal
data; and• Formative assessment feedback to students.
Assessing the Use of Key Wordsin Student Responses
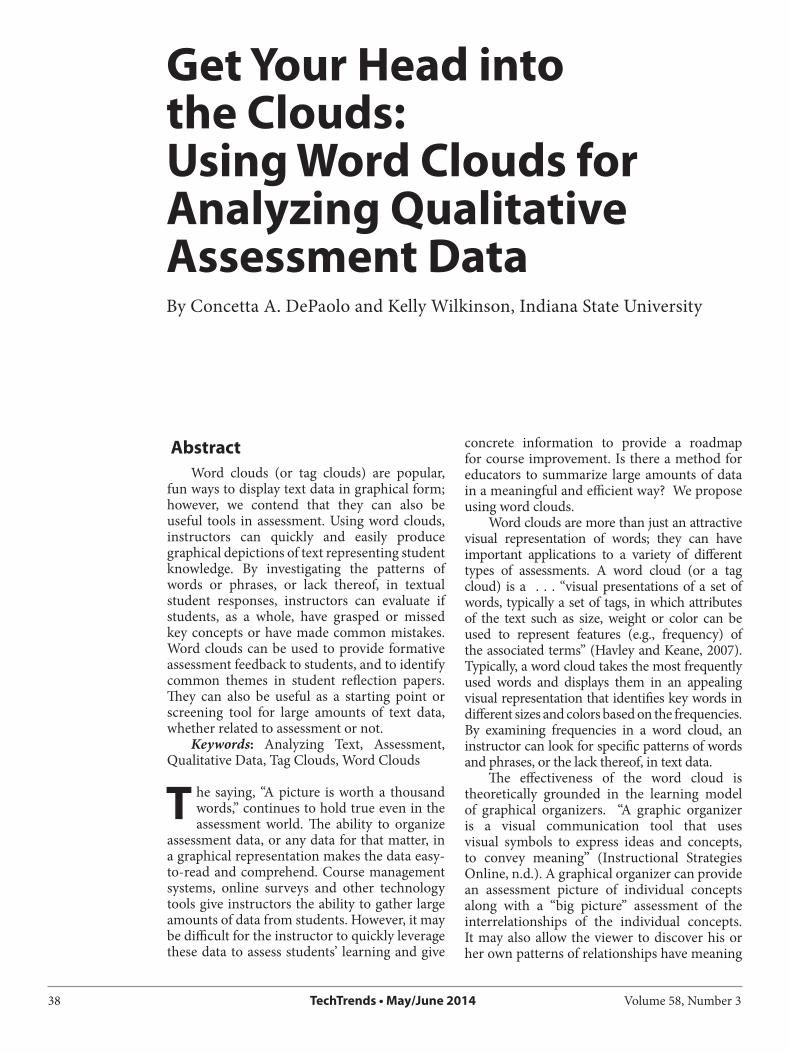
One possible way in which word clouds can be used in assessment is to gauge the use of key words in student responses to essay or short answer questions. For example, in a statistics course, an instructor wished to assess if students understand some basic concepts of linear regression. She asked students to submit electronic answers to the questions “What is regression analysis used for?” and “What is the underlying principle of calculating the regression line?”
By analyzing the resulting word clouds (see Figures 1 and 2), the instructor was able to quickly determine that students correctly used key words such as “relationship”, “variables”, “independent”, “dependent” and “predict” when answering the question “What is regression analysis used for?” She was also able to determine that students, as a whole, appeared to understand the underlying principle of calculating the regression line by observing the high frequency of the word “best” and common uses of the words “minimizes”, “squared” and “distance.” While this analysis does not substitute for a formal assessment of the number and percentage of students giving acceptable answers, it does provide a quick look for formative purposes.
Figure 1: Student responses to the question “What is regression analysis used for?”
40 TechTrends • May/June 2014 Volume 58, Number 3
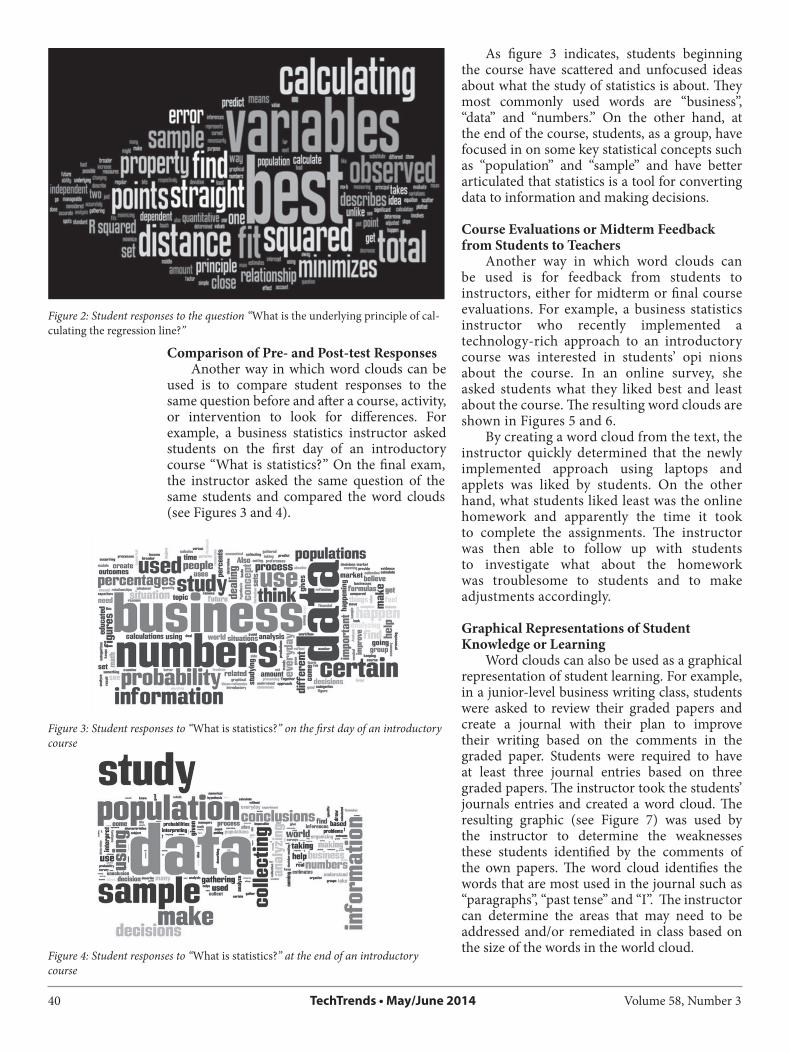
Comparison of Pre- and Post-test ResponsesAnother way in which word clouds can be
used is to compare student responses to the same question before and after a course, activity, or intervention to look for differences. For example, a business statistics instructor asked students on the first day of an introductory course “What is statistics?” On the final exam, the instructor asked the same question of the same students and compared the word clouds (see Figures 3 and 4).
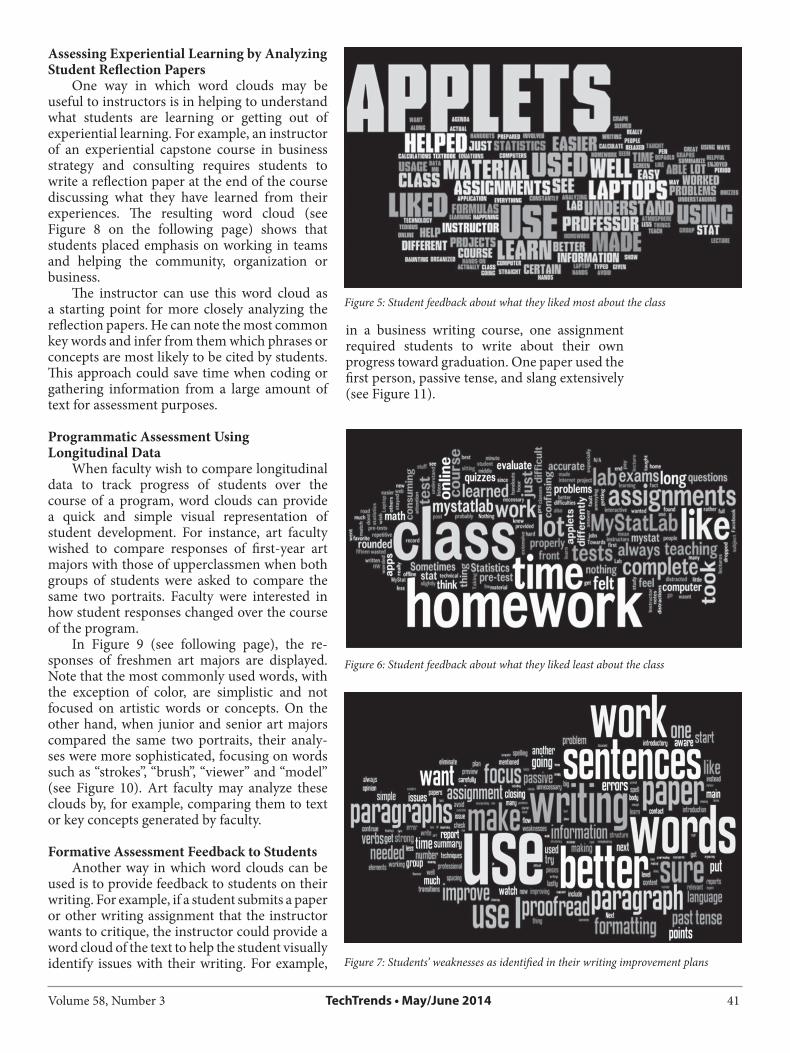
As figure 3 indicates, students beginning the course have scattered and unfocused ideas about what the study of statistics is about. They most commonly used words are “business”, “data” and “numbers.” On the other hand, at the end of the course, students, as a group, have focused in on some key statistical concepts such as “population” and “sample” and have better articulated that statistics is a tool for converting data to information and making decisions.
Course Evaluations or Midterm Feedback from Students to Teachers
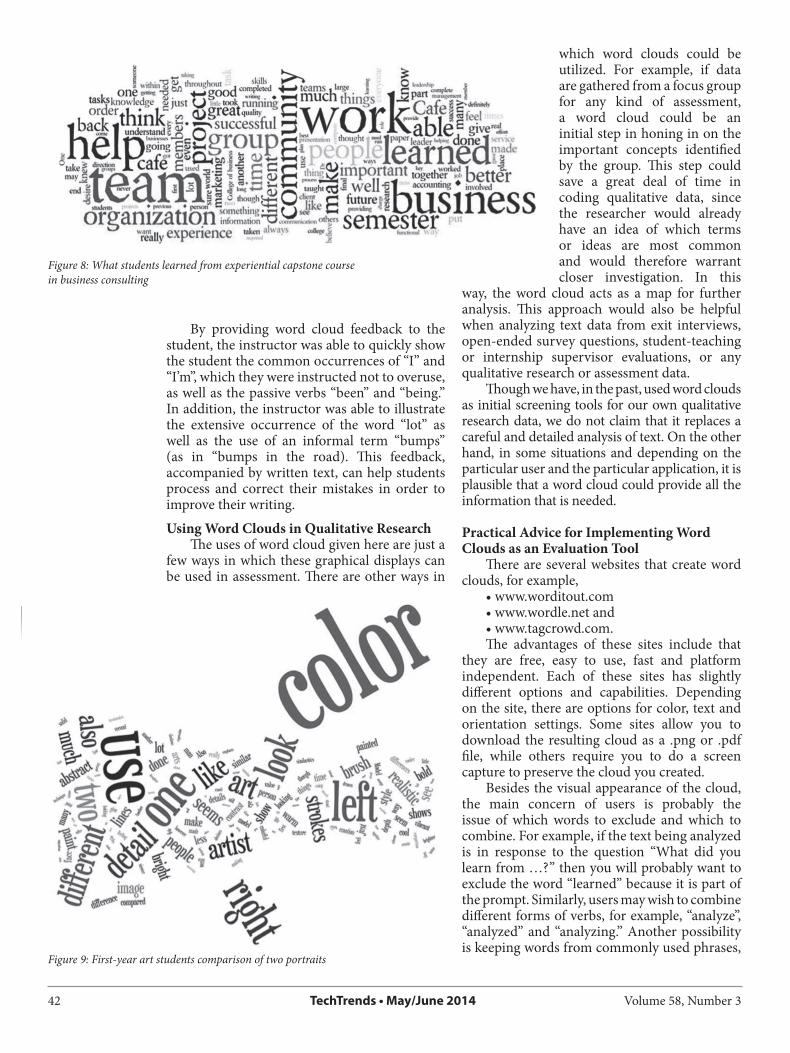
Another way in which word clouds can be used is for feedback from students to instructors, either for midterm or final course evaluations. For example, a business statistics instructor who recently implemented a technology-rich approach to an introductory course was interested in students’ opi nions about the course. In an online survey, she asked students what they liked best and least about the course. The resulting word clouds are shown in Figures 5 and 6.
By creating a word cloud from the text, the instructor quickly determined that the newly implemented approach using laptops and applets was liked by students. On the other hand, what students liked least was the online homework and apparently the time it took to complete the assignments. The instructor was then able to follow up with students to investigate what about the homework was troublesome to students and to make adjustments accordingly.
Graphical Representations of Student Knowledge or Learning
Word clouds can also be used as a graphical representation of student learning. For example, in a junior-level business writing class, students were asked to review their graded papers and create a journal with their plan to improve their writing based on the comments in the graded paper. Students were required to have at least three journal entries based on three graded papers. The instructor took the students’ journals entries and created a word cloud. The resulting graphic (see Figure 7) was used by the instructor to determine the weaknesses these students identified by the comments of the own papers. The word cloud identifies the words that are most used in the journal such as “paragraphs”, “past tense” and “I”. The instructor can determine the areas that may need to be addressed and/or remediated in class based on the size of the words in the world cloud.
Figure 2: Student responses to the question “What is the underlying principle of cal-culating the regression line?”
Figure 3: Student responses to “What is statistics?” on the first day of an introductory course
Figure 4: Student responses to “What is statistics?” at the end of an introductory course
Volume 58, Number 3 TechTrends • May/June 2014 41
Assessing Experiential Learning by Analyzing Student Reflection Papers
One way in which word clouds may be useful to instructors is in helping to understand what students are learning or getting out of experiential learning. For example, an instructor of an experiential capstone course in business strategy and consulting requires students to write a reflection paper at the end of the course discussing what they have learned from their experiences. The resulting word cloud (see Figure 8 on the following page) shows that students placed emphasis on working in teams and helping the community, organization or business.
The instructor can use this word cloud as a starting point for more closely analyzing the reflection papers. He can note the most common key words and infer from them which phrases or concepts are most likely to be cited by students. This approach could save time when coding or gathering information from a large amount of text for assessment purposes.
Programmatic Assessment Using Longitudinal Data
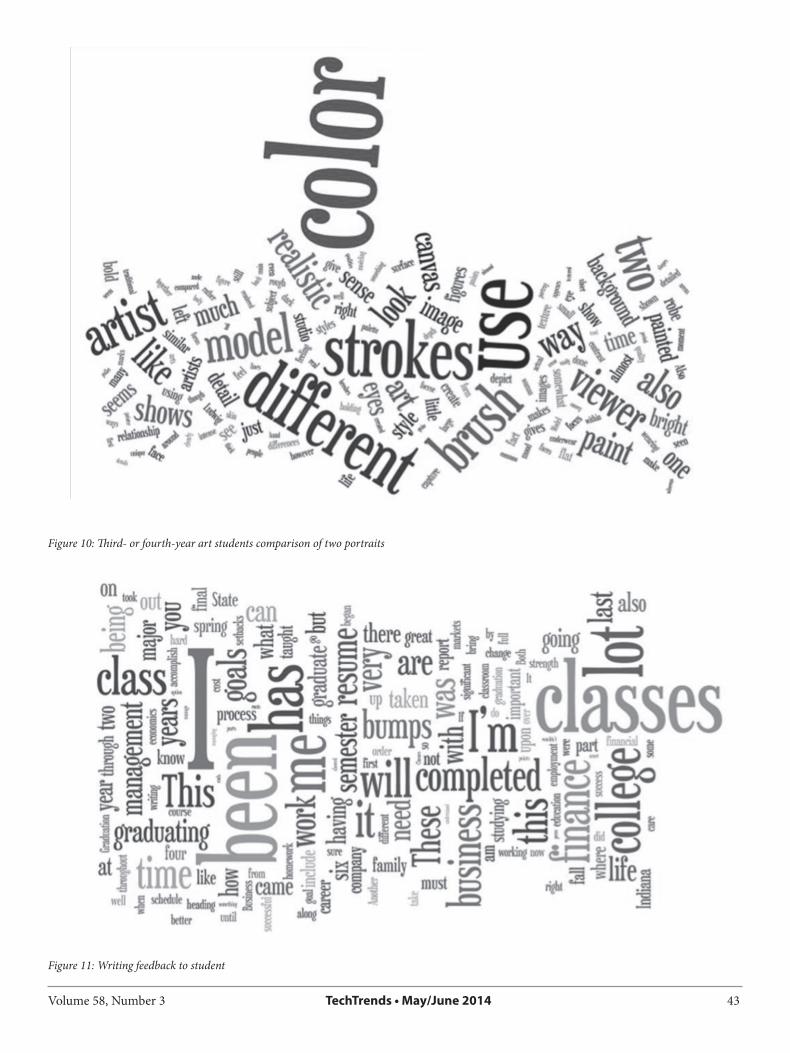
When faculty wish to compare longitudinal data to track progress of students over the course of a program, word clouds can provide a quick and simple visual representation of student development. For instance, art faculty wished to compare responses of first-year art majors with those of upperclassmen when both groups of students were asked to compare the same two portraits. Faculty were interested in how student responses changed over the course of the program.
In Figure 9 (see following page), the re-sponses of freshmen art majors are displayed. Note that the most commonly used words, with the exception of color, are simplistic and not focused on artistic words or concepts. On the other hand, when junior and senior art majors compared the same two portraits, their analy-ses were more sophisticated, focusing on words such as “strokes”, “brush”, “viewer” and “model” (see Figure 10). Art faculty may analyze these clouds by, for example, comparing them to text or key concepts generated by faculty.
Formative Assessment Feedback to StudentsAnother way in which word clouds can be
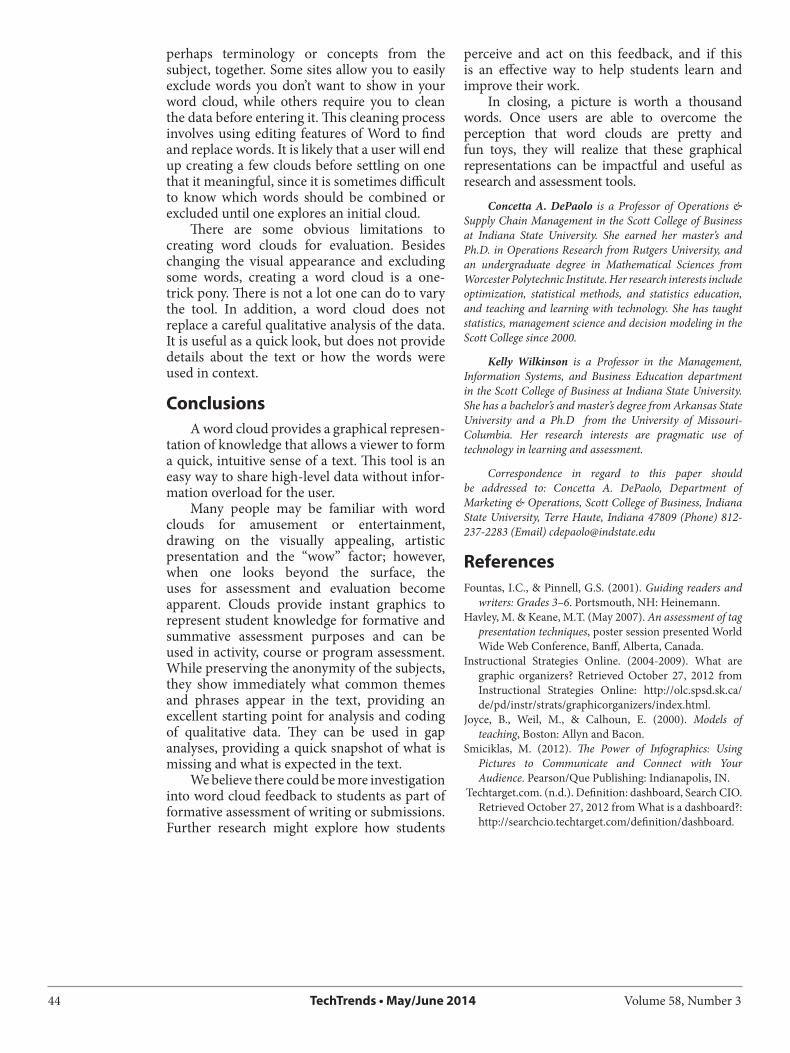
used is to provide feedback to students on their writing. For example, if a student submits a paper or other writing assignment that the instructor wants to critique, the instructor could provide a word cloud of the text to help the student visually identify issues with their writing. For example,
in a business writing course, one assignment required students to write about their own progress toward graduation. One paper used the first person, passive tense, and slang extensively (see Figure 11).
Figure 5: Student feedback about what they liked most about the class
Figure 6: Student feedback about what they liked least about the class
Figure 7: Students’ weaknesses as identified in their writing improvement plans
42 TechTrends • May/June 2014 Volume 58, Number 3
By providing word cloud feedback to the student, the instructor was able to quickly show the student the common occurrences of “I” and “I’m”, which they were instructed not to overuse, as well as the passive verbs “been” and “being.” In addition, the instructor was able to illustrate the extensive occurrence of the word “lot” as well as the use of an informal term “bumps” (as in “bumps in the road). This feedback, accompanied by written text, can help students process and correct their mistakes in order to improve their writing.
Using Word Clouds in Qualitative ResearchThe uses of word cloud given here are just a
few ways in which these graphical displays can be used in assessment. There are other ways in
which word clouds could be utilized. For example, if data are gathered from a focus group for any kind of assessment, a word cloud could be an initial step in honing in on the important concepts identified by the group. This step could save a great deal of time in coding qualitative data, since the researcher would already have an idea of which terms or ideas are most common and would therefore warrant closer investigation. In this
way, the word cloud acts as a map for further analysis. This approach would also be helpful when analyzing text data from exit interviews, open-ended survey questions, student-teaching or internship supervisor evaluations, or any qualitative research or assessment data.
Though we have, in the past, used word clouds as initial screening tools for our own qualitative research data, we do not claim that it replaces a careful and detailed analysis of text. On the other hand, in some situations and depending on the particular user and the particular application, it is plausible that a word cloud could provide all the information that is needed.
Practical Advice for Implementing Word Clouds as an Evaluation Tool
There are several websites that create word clouds, for example,
• www.worditout.com• www.wordle.net and • www.tagcrowd.com. The advantages of these sites include that
they are free, easy to use, fast and platform independent. Each of these sites has slightly different options and capabilities. Depending on the site, there are options for color, text and orientation settings. Some sites allow you to download the resulting cloud as a .png or .pdf file, while others require you to do a screen capture to preserve the cloud you created.
Besides the visual appearance of the cloud, the main concern of users is probably the issue of which words to exclude and which to combine. For example, if the text being analyzed is in response to the question “What did you learn from …?” then you will probably want to exclude the word “learned” because it is part of the prompt. Similarly, users may wish to combine different forms of verbs, for example, “analyze”, “analyzed” and “analyzing.” Another possibility is keeping words from commonly used phrases,
Figure 8: What students learned from experiential capstone coursein business consulting
Figure 9: First-year art students comparison of two portraits
Volume 58, Number 3 TechTrends • May/June 2014 43
Figure 10: Third- or fourth-year art students comparison of two portraits
Figure 11: Writing feedback to student
44 TechTrends • May/June 2014 Volume 58, Number 3
perhaps terminology or concepts from the subject, together. Some sites allow you to easily exclude words you don’t want to show in your word cloud, while others require you to clean the data before entering it. This cleaning process involves using editing features of Word to find and replace words. It is likely that a user will end up creating a few clouds before settling on one that it meaningful, since it is sometimes difficult to know which words should be combined or excluded until one explores an initial cloud.
There are some obvious limitations to creating word clouds for evaluation. Besides changing the visual appearance and excluding some words, creating a word cloud is a one-trick pony. There is not a lot one can do to vary the tool. In addition, a word cloud does not replace a careful qualitative analysis of the data. It is useful as a quick look, but does not provide details about the text or how the words were used in context.
ConclusionsA word cloud provides a graphical represen-
tation of knowledge that allows a viewer to form a quick, intuitive sense of a text. This tool is an easy way to share high-level data without infor-mation overload for the user.
Many people may be familiar with word clouds for amusement or entertainment, drawing on the visually appealing, artistic presentation and the “wow” factor; however, when one looks beyond the surface, the uses for assessment and evaluation become apparent. Clouds provide instant graphics to represent student knowledge for formative and summative assessment purposes and can be used in activity, course or program assessment. While preserving the anonymity of the subjects, they show immediately what common themes and phrases appear in the text, providing an excellent starting point for analysis and coding of qualitative data. They can be used in gap analyses, providing a quick snapshot of what is missing and what is expected in the text.
We believe there could be more investigation into word cloud feedback to students as part of formative assessment of writing or submissions. Further research might explore how students
perceive and act on this feedback, and if this is an effective way to help students learn and improve their work.
In closing, a picture is worth a thousand words. Once users are able to overcome the perception that word clouds are pretty and fun toys, they will realize that these graphical representations can be impactful and useful as research and assessment tools.
Concetta A. DePaolo is a Professor of Operations & Supply Chain Management in the Scott College of Business at Indiana State University. She earned her master’s and Ph.D. in Operations Research from Rutgers University, and an undergraduate degree in Mathematical Sciences from Worcester Polytechnic Institute. Her research interests include optimization, statistical methods, and statistics education, and teaching and learning with technology. She has taught statistics, management science and decision modeling in the Scott College since 2000.
Kelly Wilkinson is a Professor in the Management, Information Systems, and Business Education department in the Scott College of Business at Indiana State University. She has a bachelor’s and master’s degree from Arkansas State University and a Ph.D from the University of Missouri-Columbia. Her research interests are pragmatic use of technology in learning and assessment.
Correspondence in regard to this paper should be addressed to: Concetta A. DePaolo, Department of Marketing & Operations, Scott College of Business, Indiana State University, Terre Haute, Indiana 47809 (Phone) 812-237-2283 (Email) [email protected]
ReferencesFountas, I.C., & Pinnell, G.S. (2001). Guiding readers and
writers: Grades 3–6. Portsmouth, NH: Heinemann.Havley, M. & Keane, M.T. (May 2007). An assessment of tag
presentation techniques, poster session presented World Wide Web Conference, Banff, Alberta, Canada.
Instructional Strategies Online. (2004-2009). What are graphic organizers? Retrieved October 27, 2012 from Instructional Strategies Online: http://olc.spsd.sk.ca/de/pd/instr/strats/graphicorganizers/index.html.
Joyce, B., Weil, M., & Calhoun, E. (2000). Models of teaching, Boston: Allyn and Bacon.
Smiciklas, M. (2012). The Power of Infographics: Using Pictures to Communicate and Connect with Your Audience. Pearson/Que Publishing: Indianapolis, IN.
Techtarget.com. (n.d.). Definition: dashboard, Search CIO. Retrieved October 27, 2012 from What is a dashboard?: http://searchcio.techtarget.com/definition/dashboard.