getting a life: limits to health in the 21 st century
DESCRIPTION
Getting a life: limits to health in the 21 st century. CHRISTOPHER DYE. Maximizing what? Controlling environment Controlling genes & behaviour Losing control?. Maximizing what?. Industrial (r)evolution, health (r)evolution. Life expectancy in England 1600-2000. 80. Wrigley & Schofield. - PowerPoint PPT PresentationTRANSCRIPT
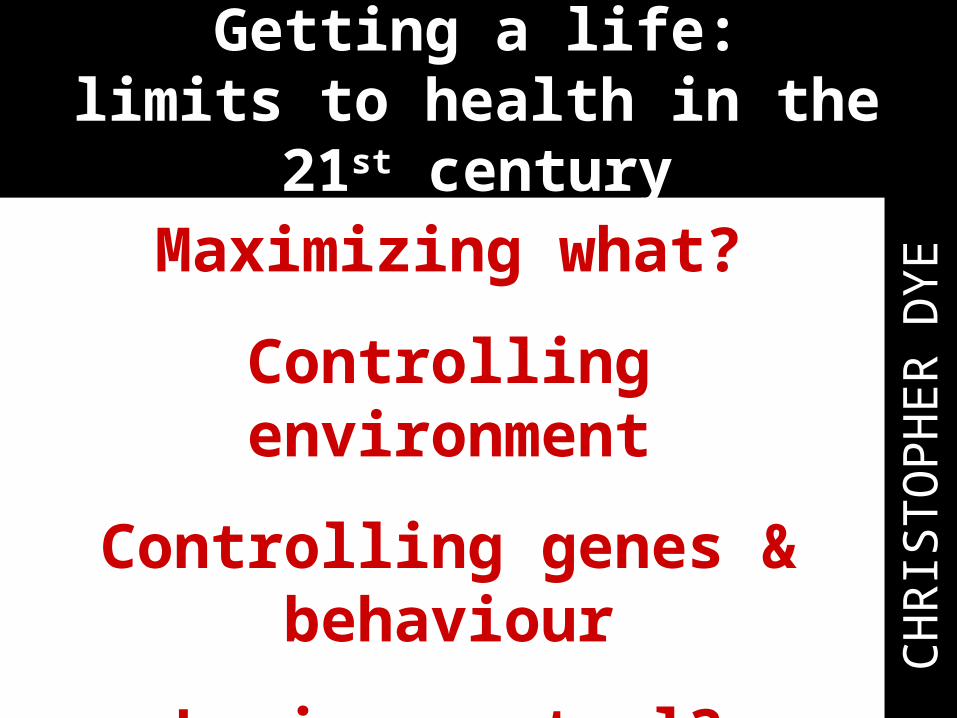
Getting a life:limits to health in the 21st century
CH
RIS
TO
PH
ER
DY
EMaximizing what?
Controlling environment
Controlling genes & behaviour
Losing control?

Maximizing what?

20
30
40
50
60
70
80
1600 1700 1800 1900 2000
Lif
e ex
pec
tan
cy a
t b
irth
(ye
ars)
Wrigley & Schofield
Human Mortality Database
Industrial (r)evolution, health (r)evolution Life expectancy in England 1600-2000

Long life, quality life?

0.0
0.2
0.4
0.6
0.8
1.0
Cardi
ovas
cula
r
Mal
igna
nt ca
ncer
Neuro
psych
iatri
c
Respira
tory
infe
ct
Respira
tory
dis
Diges
tive
Unint
l inju
ries
Diabe
tes
Genito
urinar
y
Infe
ctio
us-p
aras
itic
De
ath
s (
mill
ion
s)
W Europe: causes of death 2002

0
1
2
3
4
5
6
7
Neuro
psych
iatri
c
Sense
org
an
Musc
ulosk
elet
al
Respira
tory
dis
Cardio
vasc
ular
Diges
tive
Mal
ignan
t can
cers
Unintl
inju
ries
Diabet
es
Endocrin
e
Yea
rs o
f d
isab
ility
(m
illio
ns
)W Europe: causes of disability 2002

0
1
2
3
4
5
6
7
8
Neuro
psych
iatri
c
Mal
igna
nt ca
ncers
Cardi
ovas
cula
r
Respira
tory
dis
Mus
culo
skel
etal
Sense
org
an
Diges
tive
Unint
l inju
ries
Diabe
tes
Infe
ctio
us-p
aras
itic
DA
LY
s (
mill
ion
s)
W Europe: years of health lost

HALE and hearty?
30
40
50
60
70
80
90
100
0 20 40 60 80 100 120 140 160 180
Countries ranked
Lif
e e
xp
ec
tan
cy
(y
r)
or
% li
fe h
ea
lth
y
Healthy lifeexpectancyLife expectancyfrom birth% life healthy
Life expectancy ranges from 34-86 yrabout 80-90% life healthy everywhere

Four qualities of life?Ruut Veenhoven
Outer quality Inner quality
Livability of environment
Life-ability of person
Life chances Biotope Fitness
Market Capital
Utility of lifeAppreciation of
life
Life resultsAdaptation:
species persistence
Adaptation: long & happy
life
Public wealth Private profit

HAPPY LIFE YEARS IN 1995-2005
Top Middle range Bottom
> 60 years ± 40 years <25 years
Switzerland 63,9
Philippines 44,1
Moldova 23,7
Denmark 62,7
South Korea
43,8
Uganda 23,3
Iceland 62,2
Iran 41,4
Angola 17,6
Austria 61,0
Hungary 40,0
Tanzania 15,2
Australia 60,7
Morocco 37,9
Zimbabwe 11,5

Reclaiming our health"Diagnosis – the most common disease" (K Kraus)
• Sisi syndromeDepressed, but pretending to be active and
positive about life (GSK)• Female menopause
Hormones needed• Ageing male syndrome
Cuts down men in their prime (Jenapharm)• Attention deficit syndrome
Hippihop and the small white tablet (Novartis)

Controlling the
environment


THE SPECTRUM OF LIFE SPANS
From hunter-gatherers to…
… Japanese women

0
20
40
60
80
100
0 20 40 60 80 100
Age (years)
Pe
rce
nt
su
rviv
ing
Hunter-gatherers
Japanese women
Evolution: "Nasty, brutish..."Survival of hunter-gatherers and Japanese

Survival in England & Wales, 1840-2000
0.0
0.2
0.4
0.6
0.8
1.0
05-
9
15-1
9
25-2
9
35-3
9
45-4
9
55-5
9
65-6
9
75-7
9
85-8
9
95-9
9
Age class (years)
Su
rviv
al p
rop
ort
ion
1840
2000

Longevity in England & Wales Survival improved first in children then
in adults
0.0
0.2
0.4
0.6
0.8
1.0
1840 1860 1880 1900 1920 1940 1960 1980 2000
Fiv
e-y
ear
su
rviv
al
0-15 yr
15-60 yr
60-80 yr

England: Increase in lifespan slowed after 1950
0
10
20
30
40
50
60
70
80
90
1900 1920 1940 1960 1980 2000
Lif
e e
xpe
cta
nc
y a
t b
irth
(y
ear
s)
0
2
4
6
8
10
12
14
16
18
20
Dif
fere
nc
e W
om
en
- M
en
(y
ears
)
Women
Men
Women - Men

Causes of death, England & Wales, 1911-2003
0
200
400
600
800
1910 1920 1930 1940 1950 1960 1970 1980 1990 2000
De
ath
ra
te/1
00
,00
0/y
r
Circulatory
Respiratory
Cancer
Infections


(1) AgricultureElimination of famine in England
0
2
4
6
8
10
12
14
averagepre-17th
17th 18th 19th 20thCenturies
Nu
mb
er
of
fam
ine
s
ea
ch
ce
ntu
ry
Excess food only 20-30% pre 17th century, with same fluctuation in yield
1 Agriculture and nutritionelimination of famine in England

2 Public health "sanitation revolution"
John Snow (1813-1858) Edwin Chadwick (1800-1890) Sanitary Condition of the Labouring
Population of Great Britain (1842) On The Mode of Communication of Cholera (1855)

3 Microbiology diagnostics vaccines drugs
1890s
C17th C19th C20th

"Malnutrition-infection complex"
Better nutritionFewer infections e.g. less diarrhoea

0
50
100
150
200
250
300
1820 1840 1860 1880 1900 1920 1940 1960 1980 2000
TB
dea
ths/
100,
000/
yrBritain beat TB in the 19th and 20th centuries?
TB deaths England & Wales 1840-1991
Keats1821
E Bronte1848
C Bronte1855
Mansfield1923
Lawrence1930
Orwell1953
Leigh1967
but mostly not with drugs or vaccines

0
1
2
3
4
Low resp
irato
ry
HIV/A
IDS
Diarrh
oea
Tubercu
losi
s
Mal
aria
Mea
sles
Pertu
ssis
Tetan
us
STDs ex
c HIV
Men
ingiti
s*
Tropic
al d
isea
ses
Hepat
itis
B
Mill
ion
s o
f d
eath
s in
200
2Infectious causes of death in ICD-10
13/60m deaths in 2002 from infections 86% caused by top 5

0
1000
2000
3000
4000
5000
Wat
er &
sanit
ation
Choler
a or
rota
vacc
Oral r
ehyd
ratio
n
Breas
tfeed
ing p
rom
o
Wat
er p
ump
Latri
nes
Co
st/y
ear
hea
lth
y li
fe (
$/D
AL
Y)
Cure
Prevention
DIARRHEA: 1.8 MILLION DEATHS/YEARmethods for prevention and cure

-0.9 -0.8 -0.7 -0.6 -0.5 -0.4 -0.3 -0.2 -0.1 0
Pro-redistribution
Voter turnout
Active population (labour)
Women in workforce
Male employment
Health expenditure
Health care coverage
Income redistribution
GDP
Correlation infant mortality vs measures of democracy
More social equality = better overall healthNavarro et al, Lancet 2006
"Common consensus to invest in the future"

Controlling genes and behaviour

"…I have set before you life and death, the blessing and the curse; therefore choose life…"
Deuteronomy 30:19

0.8
1.0
1.2
1.4
1.6
1.8
2.0
2.2
17 19 21 23 25 27 29 31 33 35
Body mass index (kg/m2)
Re
lati
ve
ris
k d
ea
th
Union Army Veterans, 1900, 25-yr risk
Modern Norwegians, 7-yr risk
Relative risk of death among 50-year old men

Causes of obesity:the burden of personal choice
Evidence strength
Decreases risk of obesity Increases obesity
Very strong Increased physical activity Sedentary lifestyle, high intake of high calorie fast foods
Strong Breast feeding, parental support of healthy food choices
Intense advertising of snack foods. High intake of sweetened soft drinks
Possible Foods that are lower in simple sugars and contain more complex starches
Larger portion sizes, more food taken outside the home
Source: Parliamentary Office of Technology (postnote) Sept. 2003

FTO: gene predisposes to diabetes by increasing body mass
McCarthy, Science 2007
0.4
0.6
0.8
1
1.2
1.4
Overweight (BMI > 25) Obese (BMI > 30)
Od
ds
of b
ein
g o
verw
eig
ht/o
bes
e w
ith 1
co
py
of g
ene
16% of adults with 2 copies of gene weighed 3 kg more, with 2/3 increased risk
of obesity

THE (UNLIMITED?) POWER OF TECHNOLOGY

Growth: 1 extra year in 4
40
50
60
70
80
90
100
1820 1845 1870 1895 1920 1945 1970 1995 2020 2045 2070
Life expectancy
Maxima estimated inyear given
Inexorable growth in life expectancy?women in leading countries
source: Oeppen 2002

50
60
70
80
90
100
1950 2000 2050 2100
Lif
e ex
pec
tan
cy a
t b
irth
(ye
ars)
JapanUSASwedenUKUK projected
When will life expectancy reach 100?

1
10
100
1000
1 10 100 1000 10000 100000 1000000 10000000
Body mass (kg)
Lif
esp
an (
yr)
Life in 1/4 powers: can humans ever live to be 1000?
Lifespan mammals = 0.85 × mass1/4
Humans

1
10
100
1000
10000
1 100 10000 1000000
Body mass (g)
Bea
ts/m
inu
teHeart beat = 3.1 × mass-1/4
1.5 billion beats/lifetime

Fixing the faults of old age?"in the end costs exceed benefits"
Doug Wallace U California
"…as each life-limiting process is countered, some other process will become limiting"


Losing control?


Thomas Robert Malthus1766-1834
Principle of Population (1798)
population, if unchecked, increases geometrically
2, 4, 8, 16, 32, 64, 128…
but food supply grows arithmetically
1, 2, 3, 4, 5, 6, 7, 8…
so population outruns food supply
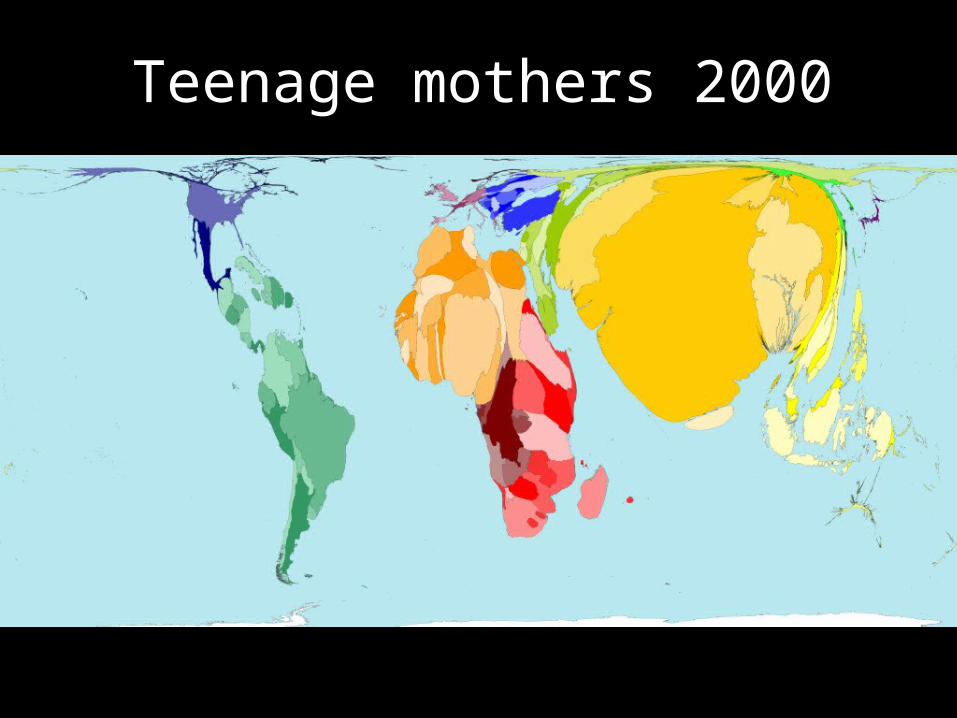
Teenage mothers 2000

Human population will stabilize in 21st century?
0
5
10
15
20
25
2000 2020 2040 2060 2080 2100 2120 2140
Bil
lion
s o
f p
eo
ple
lower fertility - lower life expectancy
higher fertility - higher life expectancy

Brucellosis
E Coli O157
Multidrug resistant Salmonella
Plague
Ebola and CCHF
Influenza H5N1
Hantavirus
Lassa fever
Monkeypox
Nipah Hendra
NV-CJD
Rift Valley Fever
SARS CoV
VEE
Yellow fever
West Nile
Emerging and re-emerging zoonoses, 1996–2004
Cryptospporidiosis
Leptospirossis
Lyme Borreliosis

Apocalypse soon?
• Unavoidable transmission route
• Highly infectious
• High proportion of people exposed
• Transmission rapid compared with response time (everyone gets infected before knowing)
• Fatal

25 years of AIDS25 years of AIDS
9 In 1991-1993, HIV prevalence in young pregnant women in Uganda and in young men in Thailand begins to decrease
10 Highly Active Antiretroviral Treatment launched
40
30
20
10
0
50
35
25
15
5
45
Mil
lio
n
1980 1985 1990 1995 2000 2005
1 2 3 45 6
8
9
11
12
13
14
1516
7
10
1 Immune deficiency in gay men in USA
2 Acquired Immune Deficiency Syndrome (AIDS) is defined
3 The Human Immune Deficiency Virus (HIV) is identified as the cause of AIDS
4 In Africa, a heterosexual AIDS epidemic is revealed
8 The first therapy for AIDS – zidovudine, or AZT -- is approved for use in the USA
People People living living with with HIVHIV
Children Children orphaned orphaned by AIDS in by AIDS in sub-sub-Saharan Saharan AfricaAfrica
1.1
HIV infected in 2005: 40 million
Died in 2005: 3 million
Total deaths: 25 million

"…limit temperature increases from global warming to 2-2.5°C above the 1750 pre-industrial level…" Scientific Expert Group Report on Climate Change, Feb 2007


Bobak, M. et al. BMJ 2004;329:767
PERILS OF SOCIAL COLLAPSESurvival from age 45 to 70 in Sweden and Russia

Getting a life

"We suffer from the asymmetry between our knowledge of
nature and our knowledge of man, between
outside awareness and self-ignorance"

How to live to 100... and enjoy itNew Sci 3 June 2006
1. Go for the burn2. Don't be a loner 3. Consider relocation4. Make a virtue out of a vice 5. Exercise the grey cells6. Smile! 7. Nurture your inner hypochondriac 8. Watch what you eat 9. Take a few risks
“If I had known I was going to live this long I would have taken better care of myself"H Doernemann, aged 110
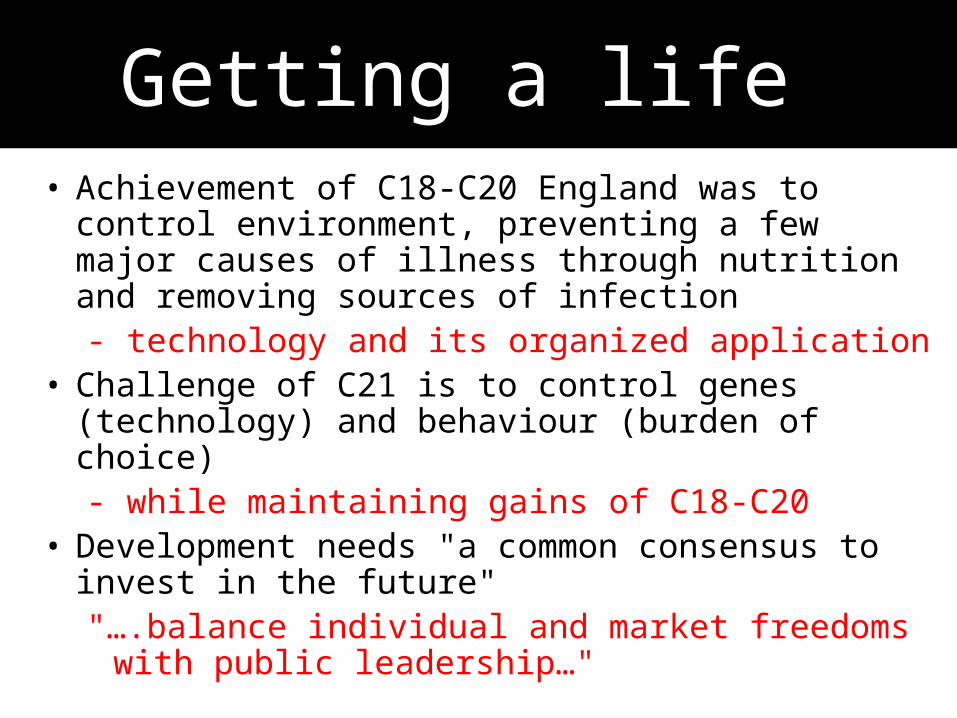
Getting a life • Achievement of C18-C20 England was to control
environment, preventing a few major causes of illness through nutrition and removing sources of infection- technology and its organized application
• Challenge of C21 is to control genes (technology) and behaviour (burden of choice)- while maintaining gains of C18-C20
• Development needs "a common consensus to invest in the future""….balance individual and market freedoms with
public leadership…"