getting quality the old-fashioned way: self confirming ... quality the old ... improvement...
TRANSCRIPT

Getting Quality the Old-Fashioned Way: SelfConfirming Attributions in the Dynamics of
Process Improvement
Nelson P. Repenningand
John D. Sterman
WP# 3952-97-MSA May, 1997

D-4684
Getting Quality the Old-Fashioned Way:Self-Confirming Attributions in the Dynamics of
Process Improvement
Nelson P. Repenning'
John D. Sterman 2
Sloan School of ManagementMassachusetts Institute of Technology
Cambridge, MA USA 02142
First Version: August 1996
Current Version (1.0): April 1997
Prepared for National Research Council workshop on Improving Theory and Research onQuality Enhancement in Organizations. Support has been provided by the National ScienceFoundation, grant SBR-9422228, and the company described in this paper. Many thanks toTim Tieman, Bill Colwell, Laura Cranmer, Dave Lazor, Vic Leo, Frank Murdock, RogerSaillant and Ron Smith for their generous assistance. We thank Bob Cole, Dick Scott and theworkshop participants for helpful comments and criticisms, along with our colleagues LotteBailyn, John Carroll, Drew Jones, Steve Graves, Liz Krahmer, Tom Malone, WandaOrlikowski, Scott Rockart, Julio Rotemberg, Ed Schein, Peter Senge, and seminar participantsat MIT.
For more information on the research program that generated this paper, visit our World Wide Web site athttp ://web.mit.edu/j sterman/www/.
1. MIT Sloan School of Management, E53-339, Cambridge, MA USA 02142. Phone 617-258-6889; Fax: 617-258-7579; <[email protected]>.
2. MIT Sloan School of Management, E53-351, Cambridge, MA USA 02142. Phone 617-253-1951; Fax: 617-258-7579; <jsterman @mit.edu>.

D-4684
Abstract
Managers, consultants, and scholars have increasingly begun to recognize the value of considering
an organization's activities in terms of processes rather than functions. Process oriented
improvement techniques such as Total Quality Management and Business Process Reengineering
have proven to be powerful tools for improving the effectiveness of many organizations.
However, while suggesting new and valuable improvement opportunities, process-focused
improvement techniques often fail, many times despite initial success. Existing theory does not
explain many of these failures in part because process improvement involves interactions among
physical structures and decision making processes in the firm while existing frameworks tend to
address one at the expense of the other. Operations research and management science focus on the
physical aspects of process improvement while organization theorists focus on the behavioral side.
In this paper the beginnings of an integrated, interdisciplinary theory are developed. Drawing on
the results of two in-depth case studies of process improvement efforts within a major US
corporation, we develop a model that integrates the basic physical structure of process
improvement with established theories on human cognition, learning, and organizational behavior
to explain the dynamics of process improvement efforts. We show how these interactions can lead
to self-confirming attributions which can thwart improvement efforts. We consider implications
for practitioners and future research.
2
D-4684
1. Introduction
Managers, consultants, and scholars have increasingly begun to recognize the value of considering
an organization's activities in terms of processes rather than functions. The current popularity of
the 'process approach' stems from its ability to drive improvement within organizations (Garvin
1995b). Starting with Total Quality Management (TQM) (Deming 1986), and continuing with
business process re-engineering (BPR) (Hammer and Champy 1993), many recent trends in
management focus on the process, rather than the function, as the critical unit of analysis for
improvement. The popularity of these approaches is one testament to the benefit of the process
view; another is the data. Many firms have made significant improvements in quality and
productivity using TQM, BPR and related techniques. Easton and Jarrell (1995) find that firms
that make a long term commitment to TQM outperform their competitors in both profitability and
stock returns. Hendricks and Singhal (1996) also find that firms that win quality awards (an
assumed outcome of successful process improvement) outperform their counterparts in terms of
share price. There has yet to be a large sample study concerning re-engineering; however, there
are reported examples of substantial improvement (Hammer and Champy 1993).
Designing, executing and improving business processes is, however, not easy. For every
successful process improvement effort there are many more failures (Ernst and Young 1991, GAO
1990). Although there have yet to be large sample studies, the results appear similar for re-
engineering (White 1996): even its proponents claim that the majority of re-engineering efforts fail
to produce significant improvement (Hammer and Champy 1993). Scholars and managers alike
have long realized the difficulty of making fundamental changes to the technology, processes, and
structures of organizations, and the process focus does not appear to mitigate these difficulties.
While suggesting new and valuable improvement opportunities, process-focused improvement
techniques still fall prey to all the barriers that limit other organizational change efforts.
In addition, even initially successful programs often fail to take hold in the organization. Kaplan
(1990a, b) and Sterman, Repenning, and Kofman (1997) describe the case of Analog Devices, a
major semi-conductor manufacturer, which doubled its effective production capacity while also
improving product quality and customer service in less than three years using TQM principles.
However, Analog's profitability fell, its share price declined, and it was forced into a major lay-
off. As a result, commitment to TQM collapsed, despite such substantial early results. Sterman et
al. argue that these effects were endogenously generated - a consequence of Analog's dramatic
success in improving manufacturing. Analog's experience is not unique: many firms have suffered
from the unanticipated side effects of successful improvement. Hendricks and Singhal (1996) find
3

D-4684
that large firms who win quality awards experience abnormally low returns in the two years
preceding the award, providing some evidence of a 'worse before better' dynamic even for
successful improvement programs. The Wallace pipe company declared bankruptcy soon after
winning the Baldrige Award; Florida Power and Light dismantled much of its TQM program after
becoming the first US company to win the prestigious Deming prize; and a study by the US GAO
(1990) found that Baldrige award finalists did no better than comparable nonfinalists in sales
growth or profitability.
Resolving the improvement paradox is important for both managers and scholars. For managers,
the ability to sustain learning and improvement is a source of competitive advantage and improved
profitability (Stata 1989, de Geus 1988). For management and organizational theorists, process
improvement efforts represent significant changes in both the structure and behaviors of the
organizations which undertake them. Deeper understanding of successful process improvement
initiatives can contribute to knowledge of organizational change more generally.
There is, however, a significant gap in the literature on process improvement. The physical design
of manufacturing and service processes has traditionally been the domain of industrial engineering,
operations research, and operations management (Chase and Aquilano 1989). TQM grew out of
the field of statistics (Shewhart 1939, Deming 1986), while re-engineering has its roots in
information technology and computer science (Hammer and Champy 1993). A common thread
running through these frameworks is a focus on modifying the physical structure of the firm's
processes and systems; less attention is paid to the concomitant organizational and behavioral
changes required to improve performance.
In contrast, organizational scholars have focused primarily on the behavioral aspects of change.
Successfully implementing organizational change remains an open and important challenge in both
the management and study of organizations, and has generated a huge literature (for overviews see
e.g. Van de Ven and Poole 1995; Huber and Glick 1993; Kanter, Jick and Stein 1992). Dean and
Bowen (1994) survey and compare research on total quality management and management theory,
showing that research on Total Quality Management stresses leadership, human resource issues,
strategic planning, and other traditional foci of organizational research. Likewise, Hackman and
Wageman (1995), working from an organizational theory perspective, analyze the conceptual
underpinnings of TQM and suggest a research agenda to study its effectiveness. However,
whereas physical theories largely ignore the behaviors of those working within the organization,
organizational theories generally do not account for the physical structure of the organization and
its processes.
4

D-4684 5
There is a clear need for an interdisciplinary theory that integrates the physical structure of
improvement with understanding of human decision making in organizations to explain the
challenge and difficulty of organizational change (see also Dean and Bowen 1994). Some leading
practitioners have also realized the need for an interdisciplinary approach to process improvement:
Michael Hammer, commenting on the engineering based approach of his best-selling book
Reengineering the Corporation, said "I was reflecting my engineering background and was
insufficiently appreciative of the human dimensions. I've learned that's critical" (White 1996).
The purpose of this paper is to develop the beginnings of such a theory. We develop a framework
that accounts for both the basic physical structure of processes and the behaviors managers
working in such systems are likely to display. In developing the physical component we draw on
the basic precepts offered by management science and the founders of the TQM philosophy (Chase
and Aquilano 1989, Deming 1986, Garvin 1988, Ishikawa 1985). On the behavioral side we rely
upon experimental studies of human decision making (Hogarth 1987; Kahneman, Slovic and
Tversky 1982; Plous 1993; Sterman 1989a, 1989b, Paich and Sterman 1993). The main tools for
theory development are intensive case study research (Eisenhardt 1989), and the development of
dynamic models capturing the rich array of interdependencies and feedback processes in the
organization and its environment (Richardson 1991, Mausch 1985, Weick 1979, Forrester 1961).
Like the structuration literature (Giddens 1984, 1993; Orlikowski 1992, 1995), we stress the
mutual, recursive causal links among technological artifacts (the physical structure), organizational
structure, and the mental models of organizational actors which guide their behavior. We go
beyond the structuration literature, however, in specifying an explicit feedback theory at the
operational level and show how those feedback processes generate organizational dynamics.
The paper is organized as follows. In section two the theoretical framework is developed. In
section three a brief overview of two initiatives we studied is provided (readers requiring more
details can consult Repenning 1996a and 1996b). In section four the initiatives are analyzed using
the framework developed in section two, and sections five and six contain discussion and
concluding thoughts.
2. The Theory
2.1 The Physical Structure of Improvement
Definition of ProcessesGarvin (1995a) provides useful definitions for the different types of processes within
organizations. He defines work processes - the physical processes that are the subject of much
attention in management science and operations research - as "...a sequence of linked,

D-4684
interdependent activities, that taken together, transform inputs into outputs." Behavioral processes
are defined as "...underlying behavior patterns...so deeply embedded and recurrent that they are
displayed by most members of the organization" and include decision making, communication, and
learning processes. Behavioral processes have "...no independent existence apart from the work
processes in which they appear" but at the same time they "...profoundly affect the form,
substance and character of activities by shaping...how they are carried out." The goal of this
analysis is to develop a theory of process improvement that integrates the physical structure of the
work process with behavioral processes to explain why techniques such as TQM and BPR can be
so successful in some organizations but fail in others.
Basic Constructs: Throughput and Defects
A process is defined here as the sequence of activities that convert inputs into the desired outputs
(Garvin 1995a). Inputs can be raw materials as in a manufacturing process or customer
requirements as in a product development setting. Outputs are then finished products or completed
product designs. The first construct in the model, Net Process Throughput, is defined as the rate at
which inputs are successfully converted into outputs (e.g. products manufactured per day or
product designs completed per month).
Net process throughput is determined by Gross Process Throughput less the rate of Defect
Introduction. Work processes sometimes fail to convert inputs into the desired outputs; items
produced incorrectly are termed Defects. 'Defect' will be used as a generic term for any
undesirable outcome of a conversion process (Schneiderman 1988). For example, a product
produced correctly but delivered late is defective if timely delivery is a desired attribute of the
conversion process. Figure 1 shows the basic physical relationship between gross process
throughput, the defect introduction rate and net process throughput in the form of a causal diagram
(Forrester 1961, Richardson and Pugh 1981, Richardson 1991, Weick 1979). In figure 1, an
increase (decrease) in gross throughput causes an increase (decrease) in net throughput (ceteris
paribus). Similarly, an increase (decrease) in defect introduction, ceteris paribus, causes a decrease
(increase) in net throughput. Causal diagrams provide a compact and precise representation of the
interdependencies in a system and are particularly useful in portraying the feedback structure of
systems. Causal loop diagrams are not intended to provide mathematical specification of the
relationships, which may be linear or non-linear, or of any time delays between cause and effect.
Specifying a formal mathematical model is often the next step in testing the theories embodied in
causal diagrams (for examples of formal feedback models of quality improvement programs, see
Repenning (1996c, 1996d) and Sterman et al. (1997)).
6

D-4684
Increasing throughput
Defects are undesirable outputs that can often be corrected through re-work (represented in figure 2
by the flow Defect Correction). Defect correction increases net process throughput: defective
outputs, once fixed, become usable. The level variable Defects connecting the Defect Introduction
rate and the Defect Correction rate represents the stock of defective products yet to be repaired.
Sometimes it is physically impossible or economically infeasible to literally repair or re-work
defective products or services. In these cases defective products are scrapped or end up in the
hands of the customer. In either case the firm incurs the cost of replacing the defective item or
must compensate the customer for the result of the defect. Such compensation may take the form
of lower prices, a poor reputation or lost market share, leading to reduced profitability, market
value, revenue, and other costs. We define defect correction to include all remedial measures a
firm can take to address the existence of defects, and thus the theory is general enough to include
those cases where literal repair is impossible.
A fundamental contribution of TQM's founders was to recognize the distinction between correcting
defects that have already been produced and preventing them from occurring (Deming 1986). The
causes of defects will be termed Process Problems, also represented as a level. Process problems
are the features of the process, either physical or behavioral, that generate defects (the TQM
literature generally refers to these problems as 'root causes' (Ishikawa 1985)). The stock of
DefectIntroduction
Net Process+ Throughput
GrossProcess
Throughput
Figure 1. Net Throughput for any process is Gross Throughput less the rate of DefectIntroduction. Arrows indicate the direction of causality. Signs ('+' or '-') at arrow heads indicatethe polarity of relationships: a '+' denotes that an increase in the independent variable causes thedependent variable to increase, ceteris paribus (and a decrease causes a decrease). That is, X--+Y
aY/IX > O0. Similarly, '-' indicates that an increase in the independent variable causes thedependent variable to decrease; that is, X-- Y> aY/aX < 0. See Richardson and Pugh 1981.
7
D-4684
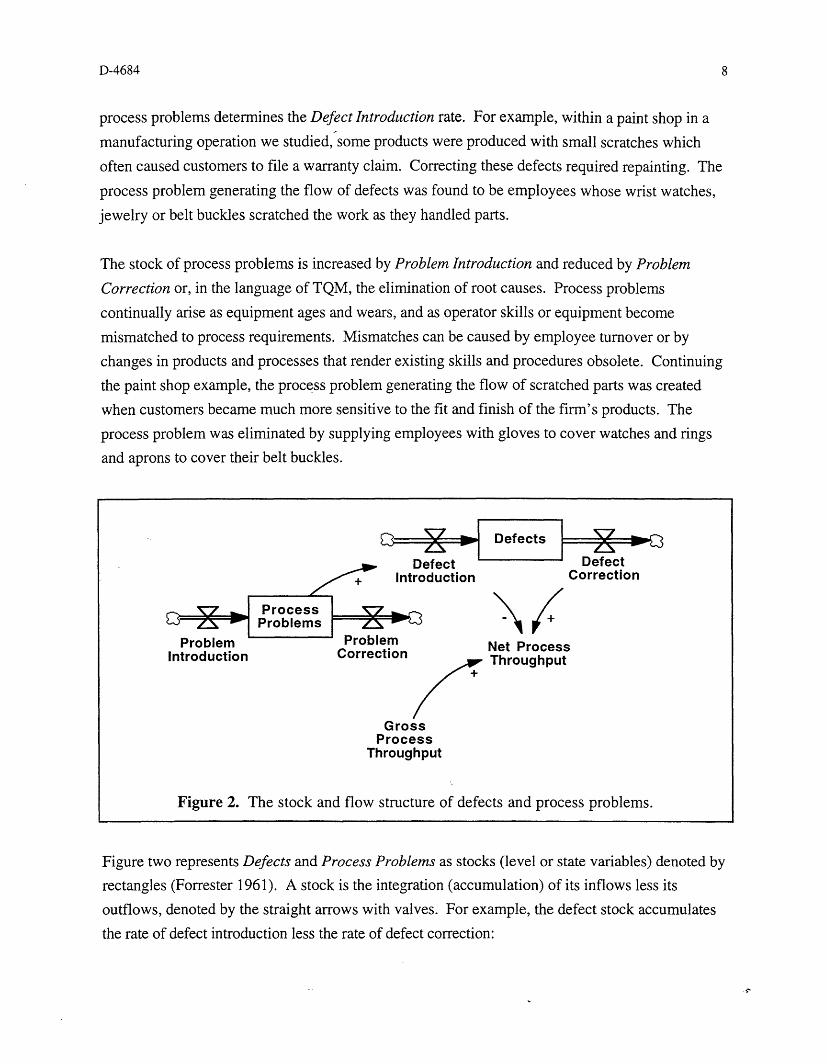
process problems determines the Defect Introduction rate. For example, within a paint shop in a
manufacturing operation we studied, some products were produced with small scratches which
often caused customers to file a warranty claim. Correcting these defects required repainting. The
process problem generating the flow of defects was found to be employees whose wrist watches,
jewelry or belt buckles scratched the work as they handled parts.
The stock of process problems is increased by Problem Introduction and reduced by Problem
Correction or, in the language of TQM, the elimination of root causes. Process problems
continually arise as equipment ages and wears, and as operator skills or equipment become
mismatched to process requirements. Mismatches can be caused by employee turnover or by
changes in products and processes that render existing skills and procedures obsolete. Continuing
the paint shop example, the process problem generating the flow of scratched parts was created
when customers became much more sensitive to the fit and finish of the firm's products. The
process problem was eliminated by supplying employees with gloves to cover watches and rings
and aprons to cover their belt buckles.
Figure two represents Defects and Process Problems as stocks (level or state variables) denoted by
rectangles (Forrester 1961). A stock is the integration (accumulation) of its inflows less its
outflows, denoted by the straight arrows with valves. For example, the defect stock accumulates
the rate of defect introduction less the rate of defect correction:
iduction Correction
Problem rroDlem Net ProcessIntroduction Correction Throughput
GrossProcess
Throughput
Figure 2. The stock and flow structure of defects and process problems.
8
C~=- = Defects FZ=O4-16 Z -Narr

D-4684
t
Defects(t) = [Defect Introduction(X) - Defect Correction(x)]dx + Defects(O)0
or, equivalently, the derivative of the defect stock is the inflow less the outflow:
d(Defects)/dt = Defect Introduction(t) - Defect Correction(t).
Explicitly portraying the stock and flow structure of processes gives insight into the power of the
TQM distinction between defect correction and defect prevention. One process problem creates a
continual inflow of defects, forever reducing net process throughput unless each and every defect
is corrected. In contrast, once a process problem is corrected, the stream of defect introduction is
forever reduced. The challenge of process improvement is to shift attention from reducing the stock
of defects to reducing the stock of process problems. However, as we discuss below, this shift
can be very difficult.
2.2 First and Second Order Improvement
Integrating the stock and flow structure with the behavioral processes governing the flows closes
the feedback loops which determine the system's dynamics (Richardson 1991, Mausch 1985,
Weick 1979, Forrester 1961). Consider the feedback loops by which managers regulate process
throughput. Managers assess the adequacy of current throughput by comparing it to Desired
Throughput (figure 3). Desired throughput is determined by the demand for the organization's
products or services. The comparison of desired and actual throughput generates the Throughput
Gap. For now desired throughput is assumed to be exogenous; later we show how throughput
goals are actually endogenous, creating important additional dynamics.
First Order Improvement
Faced with a throughput shortfall, workers and managers have three basic options: expand
capacity, utilize existing capacity more intensely, or repair defective output. Each option forms a
negative or balancing feedback loop whose goal is to eliminate the throughput gap by raising net
process throughput towards the desired rate (figure 3). First, managers can simply expand
production capacity by hiring more workers and purchasing additional plant and equipment,
boosting gross process throughput through the balancing Capacity Expansion loop BO. However,
expanding capacity involves substantial time delays, is very costly, and is generally not an option
for managers responsible for day-to-day operations. In what follows we treat the capital stock and
work force as exogenous since these decisions were beyond the authority of the participants in the
improvement programs we discuss below. For feedback models exploring capacity acquisition
dynamics see e.g. Forrester (1961), Mass (1975), and Lyneis (1980). For models of the
9

D-4684 10
interactions between process improvement and capacity see Sterman et al. (1997) and Repenning
(1996c, 1996d).
Second, to increase net process throughput workers can Work Harder (balancing loop B 1),
increasing the utilization of existing resources. Effort can be increased through greater focus on
task, shorter breaks, reduced absenteeism, and overtime. Finally, managers can allocate resources
to correct existing defects (the balancing Rework loop B2), for example, repainting scratched parts
or reworking faulty designs. Alternatively, quality standards can be reduced, "correcting" defects
by redefining them so that a larger percentage of gross throughput can be shipped, for example,
when software is released with known bugs (which are often described to customers not as bugs
but as 'features').

D-4684
Second Order Improvement
Each of the 'first order' improvement feedbacks described above can close the throughput gap, but
only at significant and recurring cost. The fundamental insight of the quality movement is that a
more effective solution is eliminating the process problems that generate defects. Such 'second
order' improvements create the negative Work Smarter loop B3 (figure 4) which closes the
throughput gap by permanently eliminating the process problems that generate defects. Making
fundamental improvements that eliminate process problems requires managers to train their work
force in improvement techniques. In addition, managers must provide the work force with release
time from their normal responsibilities so that they may participate in improvement activities. Most
important, improvement teams must have the freedom to experiment with potential solutions and
deviate from established routines to test ideas. Such experimentation and improvisation is critical
to TQM and other improvement mfiethods (Deming 1986, Wruck and Jensen 1994). Weick (1993)
and Orlikowski (1994) argue that improvisation is central to organizational change in general.
DuetectCorrection
/Training and
ProcessExperimentation A; I
'�- -J
q.+ Fffrrt 4+~~~~~~~~.,, ~Gross - %L LVGroess Net Process Correct
Process Throughput DefectsThroughputB2
1F~~~+ I + Rework
WorkWorker Harder ThroughputEffort Gap
+> V ;u+ ResourcesResources to to Correct
Process Desired Net DefectsImprovement
Figure 4. Second order improvement: Investing in improvement activity creates the negativeWork Smarter loop (B3) which enhances net throughput by reducing process problems.
Throughput
11
Defects 'V
I
F

D-4684
The Reinforcing Nature of Improvement
First and second order improvement processes are not independent, but strongly coupled. One of
the most basic interactions is created because firm resources are finite. Line workers have limited
time, which must be allocated among production, defect correction, and process improvement.
Further, improvement activities also require substantial management participation to motivate
employees, guide training, review results, and mediate conflicts. Managerial attention in any
organization is limited and must be allocated to competing activities (March and Simon
1958/1993). Process-oriented improvement programs, because they cut across traditional
organizational boundaries, intensify demands for senior management attention. The constraint on
the resources available for improvement results in two negative links: as Worker Effort rises,
Training and Process Experimentation suffer. Likewise, Resources to Process Improvement fall
when management increases Resources to Defect Correction (figure 5).
The new links close two more important feedbacks, the self-reinforcing Reinvestment loops Rla
and Rlb (figure 5). Unlike the loops described so far, the Reinvestment loops are positive
feedbacks that tend to reinforce whichever behavior currently dominates. Successful process
improvement increases net throughput by reducing defect generation. As the throughput gap falls,
workers have more time to devote to training and experimentation, leading to still more
improvement (loop Rl a). Similarly, if the organization succeeds in reducing defect generation,
then less time and effort are needed for correction, freeing up resources for fundamental
improvement, speeding the elimination of process problems and driving defects down still further
(loop Rlb): the loops operate as virtuous cycles. Conversely, if defects increase, worker effort
rises and more resources are allocated to defect correction. Improvement effort falls. Process
problems accumulate at a faster rate, leading to still more defects: the reinvestment loops operate as
vicious cycles. For example, pulling resources out of preventive maintenance to repair unexpected
equipment breakdowns can lead to more breakdowns and still greater pressure to reassign
maintenance mechanics from preventive to reactive work until the plant is trapped in a regime with
low equipment availability, high breakdown rates, high costs, and little time for preventive
maintenance (see Carroll, Marcus and Sterman (1997) for examples in the nuclear power and
chemicals industries).
Another linkage between first and second order improvement arises because improvement activity
disrupts production. The experimentation and improvisation required to generate and test ideas for
improvement take time and reduce the potential throughput of the process: machines must usually
be taken off line to conduct experiments, and inevitably many of these experiments will fail,
reducing throughput. These short-run costs of process improvement effort are captured by the
12

D-4684
negative link from Training and Process Experimentation to Gross Process Throughput. The
addition of these links closes another balancing feedback which helps workers reach their
production goals. Workers can close the throughput gap not only by Working Harder (B 1) and by
doing more Rework (B2), but also by Focusing on Throughput (B4).
1 Proton Corre
Training and AB Process
Experimentation Focus onThroughput
WorkSmarter
Defect DefectIntroduction Correction
N\ / +iem
;ction e -1
Reinvestment
iN~ Gross~ ~Effort toGross Net Process Correct
Process Throughput DefectsThroughput
. I) Rework
Work -Worker Harder ThroughputEffort Gap
ResourcesD owAAAA Resourcesrrvcebb Reinvestment to CorrectImprovement Defects
AvailableResources
Figure 5. The reinforcing feedback created by finite resources: as more time is devoted to defectcorrection, less is available to correct process problems, leading to still more defects and still less
time for improvement. Note also the balancing Focus on Throughput loop: workers can meetthroughput goals by cutting back on improvement activity.
2.3 Interactions of physical structure and behavioral decision making
Vicious or Virtuous Cycles?
What determines whether the reinforcing reinvestment loops operate as vicious or virtuous cycles?
The answer is determined in large measure by the mental models of the managers about the causes
rroDlenIntroducti
13
rx-ZZ- r%-*----L-7Z7 ,L

D-4684
of low process throughput. Given a gap in process capability, managers must choose one of two
basic options to close the gap: first order activities including working harder (B 1), reworking
defects (B2), and focusing on throughput by neglecting other activities (B4), or 'working smarter'
through second order improvement efforts to reduce process problems (loop B3).
From the discussion above it is clear that the high leverage point for improvement is allocating
effort to reducing the stock of process problems, not defect correction or capacity expansion.
Eliminating process problems reduces the generation of new defects once and for all, while
correction is never ending. And as the elimination of process problems boosts throughput, more
resources are freed up for still more investment in improvement and still greater productivity in a
virtuous cycle of continuous improvement.
Behavioral Biases Against Fundamental Improvement
Yet there are at least four reasons, rooted in basic cognitive processes, why correction efforts often
take precedence over prevention. First, defects are simply more salient and tangible than process
problems, and people have repeatedly been shown to over-weight available and salient features of
the environment (Kahneman, Slovic and Tversky 1982, Taylor and Fiske 1975). In a
manufacturing setting, for example, the stock of defective products is a pile sitting somewhere on
the production floor. It is literally in the way. In contrast, process problems are often invisible.
Processes consist of the activities and relationships that create tangible products, and cannot be
easily discerned from the products themselves (Orlikowski 1995). Process problems must usually
be inferred indirectly from the defects they create; indeed, many of the tools of TQM are designed
to ferret out root causes from observed symptoms. In the paint shop example, a defect is a
scratched product sent to the "rework hospital" and visible to all, while the underlying process
problem (a transfer line requiring workers to bend over the work, thus bringing their belt buckles
into contact with the parts) is harder to observe and diagnose.
Second, defect correction and process improvement are likely to work at different speeds. Process
improvement takes time: to document the current process, diagnose root causes, experiment with
possible changes, implement solutions, train participants in the new procedures, and so on. The
delays between the start of an improvement program and results are long, ranging from months to
years, depending on the complexity of the process (Schneiderman 1988). Defects, however,
usually are easily identified and quickly repaired. Thus, an organization under pressure to close a
throughput gap quickly is likely to choose correction over prevention even if many in the
organization understand that doing so only suppresses the symptoms without curing the disease.
14

D-4684
Third, correction efforts have a more certain outcome than prevention efforts. A defective product
is easily identifiable and it is usually clear when the defect has been corrected. In contrast, process
problems are more complex and their characterization more ambiguous. It is often unclear whether
and how a proposed process change will in fact result in fewer defects. Risk aversion is a basic
feature of human decision making, and people have also been shown to be ambiguity averse
(Einhorn and Hogarth 1985). Faced with a throughput gap, most managers will prefer the more
certain gain of correction efforts to the ambiguous, uncertain and delayed yield of an investment in
prevention.
Fourth, eliminating a process problem, while it prevents the generation of future defects, does
nothing to eliminate the stock of defects already generated. The stock of defective outputs
represents a substantial investment in materials, labor and capital. A three year project to develop a
new product is not likely to be scrapped if it isn't complete when the deadline is reached. Instead
the project will be extended as the organization seeks to correct existing problems. Further,
because defective products represent tangible investments in materials, time and effort which are
measured and reported by most accounting systems, it is relatively easy to assess the benefit of
investing in correction: if the value of a repaired product is $y and its scrap value is only $x, it is
worth investing anything up to $y-x to correct the defect. In contrast, it is more difficult to assess
the value of defect prevention. As one manager in our study said, "...nobody ever gets credit for
fixing problems that never happened." The well-known sunk cost fallacy (Arkes and Blumer
1985, Staw 1976, 1981, Thaler 1980) reinforces the bias towards correction. Decision makers
often continue a project beyond the economically rational point when they have already made a
substantial investment in time, money and reputation. In our context, the sunk cost fallacy means
managers will favor defect correction rather than defect prevention, to, as they see it, recoup past
investments in defective outputs, even though these investments are sunk costs.
Biased attributions about the causes of low throughput
Thus differences in information availability, salience and time delays bias managers against
fundamental improvement. But the situation is worse. In choosing whether to pursue first or
second order improvement managers must make a judgment about the causes of low process
throughput. If managers believe the cause lies in the physical structure of the process, then they
will focus their efforts on process improvement. However, if low throughput is thought to result
from lack of worker effort or discipline, then managers will increase production pressure or the
strength of process controls to close the throughput gap. Einhorn and Hogarth (1986) review the
'cues to causality' people use to make causal attributions, including temporal order, covariation,
15
D-4684
and contiguity in time and space. Attributing low throughput to inadequate worker effort is
consistent with all these cues: worker effort immediately precedes the production of an item;
production is highly correlated with worker effort; and workers and the items they produce are
highly contiguous in time and space. In contrast, process problems typically precede low
throughput with much longer and often unobservable delays; the correlation between process
problems and low throughput is often unobservable; and process problems can be far removed in
time and space from the detection of the defects they create. Thus managers are likely to attribute a
throughput shortfall to the attitudes and dispositions of the work force even when the true causes
are systemic features of the environment such as process problems. Attributing the cause of a
problem or behavior to individuals rather than the systems in which they are embedded is a
pervasive and robust phenomenon. In a wide variety of studies decision makers have shown a
strong tendency to attribute undesirable outcomes to people rather than the system structure - the
so-called "fundamental attribution error" (Ross 1977).
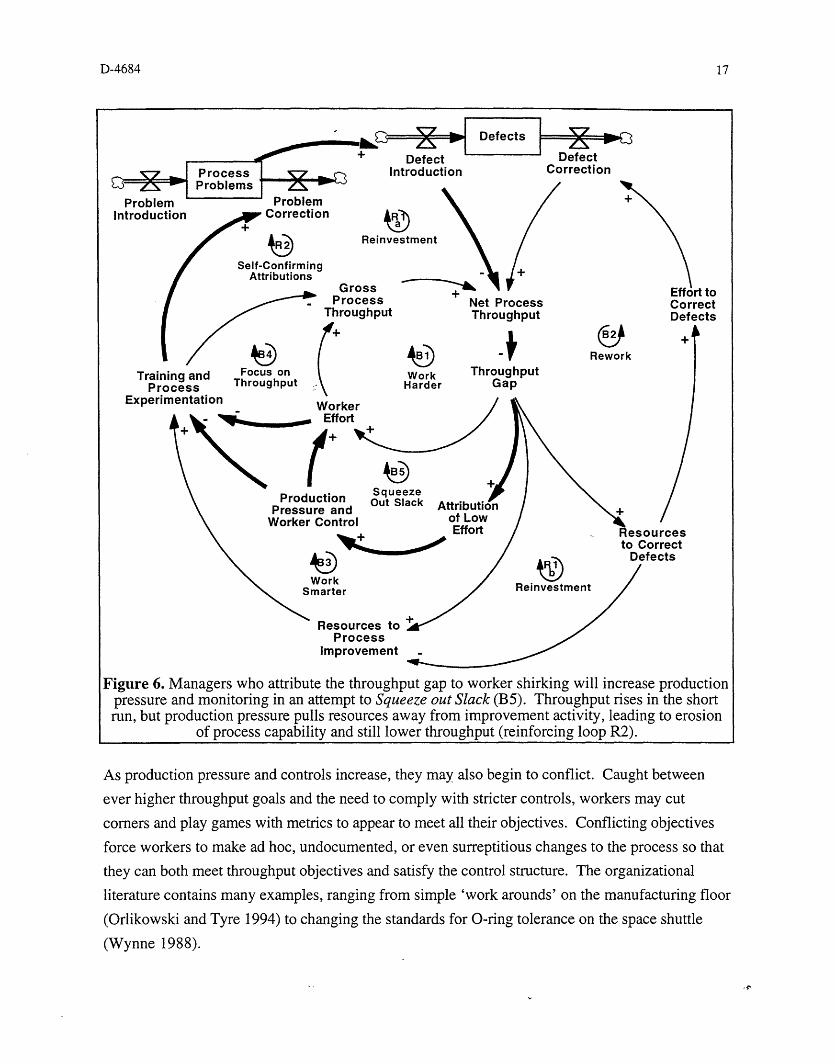
If managers believe the work force is underutilized, then the intendedly rational response is to
Squeeze out Slack by increasing Production Pressure and Worker Control (loop B5 in Figure 6).
Production pressure includes higher throughput objectives, overtime, faster line speed, and so on.
Managers can also increase the strength of controls on the workers. Worker control aggregates
three ideas: (1) the level of detail with which protocols for employee conduct are specified; (2)
how closely management monitors adherence to those protocols; and (3) the penalties imposed for
departing from procedure. For example, in a product development organization we studied, a
project manager whose subsystem was behind schedule was required by his boss to call in every
hour with a status report until the problem was resolved and the prototype met the specifications.
Naturally, the project manager and his team worked around the clock to fix the problem. One
senior manager in a firm we studied calls such behavior "getting quality the old-fashioned way."
But while increasing production pressure has the desired effect in the short run, it also yields a
long run side effect. Workers under greater scrutiny from management and greater pressure to
make production goals have less time to attend improvement team meetings and are less willing to
undertake experiments that require temporary reductions in throughput. With less effort dedicated
to process improvement fewer process problems are corrected, and the defect introduction rate
rises. Process throughput falls, and managers are forced to increase production pressure and
controls still further. These links create the Self-Confirming Attribution loop R2, a reinforcing
feedback which drives the organization to higher levels of production pressure and fewer resources
dedicated to process improvement.
16
D-4684
Defects
+ Defect DefectProcess 7 Introduction CorrectionProblems
Problem Problem +Introduc
Reinvestment
Gross q +LProcess Net Processthroughput Throughput
Rework
Effort toCorrectDefects
1lTraining and Focus on Work ThroughputProcess Throughput W Harder Gap
Experin
.+
Production
Worker ControlourcesCorrectefects
Process Improvement
Figure 6. Managers who attribute the throughput gap to worker shirking will increase productionpressure and monitoring in an attempt to Squeeze out Slack (B5). Throughput rises in the shortrun, but production pressure pulls resources away from improvement activity, leading to erosion
of process capability and still lower throughput (reinforcing loop R2).
As production pressure and controls increase, they may also begin to conflict. Caught between
ever higher throughput goals and the need to comply with stricter controls, workers may cut
corners and play games with metrics to appear to meet all their objectives. Conflicting objectives
force workers to make ad hoc, undocumented, or even surreptitious changes to the process so that
they can both meet throughput objectives and satisfy the control structure. The organizational
literature contains many examples, ranging from simple 'work arounds' on the manufacturing floor
(Orlikowski and Tyre 1994) to changing the standards for O-ring tolerance on the space shuttle
(Wynne 1988).
-
17
_ - - ..

D-4684
Dfc L
DefectIntroduction
Introduction Correction
+ ProcessIntegrity Gross
ProcessThroughput
Ad Hoc +Changes to (the Process s pr ces. s BProcess
+ Shortcut Work1+ cShortcut Worker Harder
WorkerEffort +
Conflicting Goals Double
Bind SqueezeProduction Out Slack Al
Pressure andWorker Control
Defects
DefectCorrection
f- l /EffolNet Process CoriThroughput r A Deft
ThroughputGap
ttr
+
Rework
Resourcesto Correct
Defectsof LowEffort
Figure 7. Production pressure and control over worker effort conflict, forcing workers to findwork arounds, eroding process integrity and leading to still more production pressure and still
tighter controls (reinforcing loops R3 and R4).
As shown in figure 7, such ad hoc changes increase the number of process problems. Under time
pressure and faced with multiple, incompatible objectives, workers will erode standards, cut
corners, fail to follow up and resolve problems, and fail to document their work. They will keep
these work arounds secret from management and manipulate metrics to appear to be in compliance
with objectives when they in fact are not. In one firm we studied, product development managers
improved the reported product development time not by making fundamental improvements in the
product development process but by shifting away from risky and time-consuming breakthrough
products to emphasize faster and easier line extensions. The reported product development time
fell, but at the cost of reducing the rate of innovation, threatening the competitiveness of the firm.
In another firm, manufacturing engineers facing the imminent launch of a new product made ad
hoc changes to parts and tooling to resolve problems, but were too busy to report the changes to
the design engineers. The design engineers would then develop new parts based on the erroneous
rt torectects
18
D-4684
drawings, leading to still more problems in the next generation product. These links create two
additional positive feedbacks, the Process Integrity and Double Bind loops R3 and R4 which
inadvertently erode production capacity by introducing new process problems as a side effect of
management's attempt to boost throughput.
2.5 Misperceptions of Feedback and Self-Confirming Attributions
Thus managers who attribute low process throughput to insufficient worker effort increase
production pressure and worker monitoring. However, while these actions boost throughput in
the short run, they cause process capability to erode further. An important question arises here: as
the long term consequences of boosting production pressure become apparent, wouldn't managers
realize the true cause of low process throughput was low process capability rather than lazy
employees? To the contrary, the initial attribution of low worker effort can become strongly self-
confirming, leading managers to ratchet up the pressure still further, until the organization is
trapped by low throughput, high costs, and insufficient resources for improvement.
To see how the initial attribution of low effort can be self-confirming, consider the short-run
response of the system to production pressure. As shown in figure 6, managers attributing low
throughput to inadequate worker effort respond by increasing production pressure and monitoring
workers more closely. Throughput increases. But why? At first, workers will work harder and
spend less time on non-worke related activities (the Work Harder loop B 1). If these efforts aren't
sufficient, workers also reduce the time they spend on training and fundamental improvement to
Focus on Throughput (loop B3). What do managers conclude? Because in most settings
managers cannot observe all the activities of the workers, they cannot determine how much of the
additional throughput is due to increased work effort and how much to cutting back on training,
improvement and maintenance. For example, suppose there is a throughput gap requiring an extra
six hours of productive effort per person per week. Managers, believing employees are simply not
working hard enough, increase production pressure and monitoring. Workers will focus their
activities, cutting their breaks and other nonproductive time. Suppose these responses yield two
hours per person per week in effective work effort. To close the remaining throughput gap,
workers may also reduce the time they spend on process improvement, training, and
experimentation by four hours per week. Managers observe that throughput rose by the equivalent
of six hours of productive effort. However, because the managers do not fully observe the
reduction in training, experimentation, and improvement effort (they fail to account for the Focus
on Throughput loop), they overestimate the impact of their get-tough policy on productivity; in our
example by as much as a factor of three. In the extreme case where productivity per hour of worker
effort is already at a maximum (the Work Harder loop has no further impact), the entire increase in
19
D-4684
throughput comes from a reduction in the time devoted to improvement. To the extent managers
are unaware of the process shortcuts workers take to meet their goals, the throughput gains
resulting from production pressure provide powerful evidence confirming the managers'
suspicions that workers were not giving their full effort. Managers quickly learn that boosting
production pressure works: throughput rises when they turn up the pressure.
Note that workers may unwittingly conspire in strengthening the managers' attributions. Faced
with intense production pressure and the resulting goal conflicts, workers are naturally reluctant to
tell supervisors they can't meet all their objectives. The more effectively workers are able to cover
up the process shortcuts they take to meet their throughput targets (loop B6), the less aware
managers will be of the long run costs of production pressure. Unaware that improvement
activity, maintenance, and problem solving have been cut back, throughput appears to rise without
requiring any sacrifices, providing strong evidence reinforcing management's attribution that the
workers really were lazy: squeezing out slack is the right thing to do.
The long run effects of production pressure also reinforce managers' belief that the workers are the
problem. The time required for increased production pressure and worker control to boost
throughput via the Work Harder, Focus on Throughput, and Squeeze Out Slack loops is much
shorter than the time required to detect the resulting erosion in process capability as the reinforcing
Reinvestment, Process Integrity, and Double Bind loops lead to more process problems, lower
throughput, more shortcuts and less improvement effort. The erosion of process capability caused
by production pressure is delayed, gradual and diffuse. It is distant in time and space from its
cause. Managers are unlikely to attribute the cause of a throughput gap to the extra pressure they
placed on workers months or even years before. Instead, as throughput falls they are likely to
conclude that the workers have once more become lazy, requiring them to increase production
pressure again. Boosting production pressure to elicit full effort from the slothful workers
generates powerful evidence to reinforce and 'confirm' the managers' initial, but incorrect,
attribution that the workers just need a kick in the pants. Recall that, faced with the hourly call
from his boss, the project manager and his team dropped all other activities to work nonstop on the
problem, confirming the boss's belief that they hadn't solved the problem before because they
weren't working hard enough. When the problem was finally resolved, the boss's belief that he
had acted appropriately, decisively taking charge of the situation, was confirmed, even though the
team was already working around the clock and the disruption his calls created drained precious
time from solving the problem.
20

D-4684
The feedback structure described above explains how managers erroneously learn that increasing
production pressure and worker control is a successful strategy: each time they do it, throughput
improves in the short run, even as it erodes in the long run. Such "misperceptions of feedback"
have been repeatedly observed in a wide variety of systems with even modest levels of dynamic
complexity. Dynamic complexity arises in systems with multiple feedback processes, time delays,
stocks and flows, and nonlinearities (Sterman 1989a, 1989b; Brehmer 1992, Funke 1991).
Laboratory experiments show that as the dynamic complexity of a system grows, decision maker
performance deteriorates relative to optimal; indeed, decision makers are often out-performed by
simple decision rules (Paich and Sterman 1993, Diehl and Sterman 1995). The misperceptions of
feedback and dysfunctional dynamics to which they lead arise for two basic reasons (Sterman
1994): first, our cognitive maps are grossly oversimplified, tending to omit feedbacks, time
delays, stock-and-flow structures, and nonlinearities; and second, we are unable to use our
cognitive maps to correctly infer the dynamics of the system or its likely response to policies and
perturbations. Note that these problems interact: the more complex the cognitive map, the less
accurate are our mental simulations of its behavior. Organizations have high dynamic complexity.
In the case of improvement programs, the structure of the system provides information feedback
that systematically leads managers to ever stronger, self-confirming, but erroneous beliefs about
the source of low throughput.
But the misperceptions of feedback operating here are even more insidious. As increased
production pressure chokes off process improvement and ad hoc work arounds create new process
problems, defects grow and net throughput falls. Faced with a continuing or even growing
throughput gap, managers must then further increase production pressure and worker control to
meet production targets. However, the stress of the constant crisis, extended overtime, ever more
aggressive throughput objectives and conflicting goals eventually causes fatigue and burnout
among workers, lowering productivity and quality. Absenteeism and turnover rise, eroding skills
and lowering gross throughput still more. Workers may grow to resent the control exerted by
management and the lack of trust motivating it, leading to an increasingly hostile and adversarial
relationship between superiors and subordinates, workers and management. Workers ultimately
have no choice but to evade or subvert management's controls, play games with performance
metrics, and shirk to relieve an intolerable workload. What begins as a false attribution by
management that workers are slothful, undisciplined, and untrustworthy becomes reality.
Managers' worst fears are realized as a consequence of their own actions.
Over time the physical environment adapts to both reflect and perpetuate these self-reinforcing
attributions. Managers who have come to believe that production pressure is an effective way to
21

D-4684
improve throughput will often resort to technology to further increase their control over the work
force. Such technological solutions can take the form of time cards, detailed work reporting
systems, video surveillance systems, and software that measures the key stroke rate of data entry
operators. Such systems are often controversial at first. As technology tightens controls, workers
sometimes become increasingly sophisticated in circumventing them, further confirming managers'
belief that the controls were necessary and, perhaps, even need to be augmented - another
reinforcing feedback.
Managers also resort to technological fixes to compensate for poor process capability. They can
boost the throughput of an unreliable production line by adding redundant capacity, investing in
computer systems to manage high levels of WIP inventory, and installing automated material
handling systems. One chemical manufacturer, to compensate for frequent breakdowns, installed
redundant pumps throughout its plants, reifying management's mental model that the pumps were
intrinsically unreliable (Carroll, Marcus, and Sterman 1997). Such investments divert resources
from fundamental improvement and obscure the underlying process problems, perpetuating low
process capability. Consistent with technological structuration theory (Orlikowski 1992), mental
models, behavior, and the physical structure of the system mutually reinforce and generate the
organizational dynamics. As Churchill said "...we shape our buildings; thereafter they shape us."
2.6 Summary
In this section we have outlined the beginnings of a theory of process improvement that we believe
may be helpful in explaining why process improvement efforts can be so successful in some
settings but not in others. Three methods of improving the throughput of a process are identified:
increasing work pressure and control structures, defect correction and defect prevention. The key
failure mode we identified starts with managers erroneously attributing the cause of low process
capability to worker 'laziness' or 'lack of discipline' rather than to fundamental problems within
the process. The cognitive and social psychology literature suggests that such misattributions are
likely and indeed they are observed in numerous organizations. Given this misattribution,
managers react by choosing the first option, increasing control and production pressure.
Improvement programs in such a setting fail because increasing production pressure and control
limit the effectiveness of process improvement activities, thus creating the situation, low process
capability, that managers set out to correct. Soon these beliefs become embedded in the culture,
routines, and even the physical structure of the organization, perpetuating the cycle.
22

D-4684
3. The Case Studies
A variety of field studies document the dynamics described above (Carroll, Marcus, and Sterman
1997; Krahmer and Oliva 1996; Repenning 1996a, 1996b). To illustrate how the framework can
be applied, we focus on two case studies. The field research was performed within one division of
a major American manufacturer. The division manufactures electronic components that are then
integrated into the final product at the company's main assembly facilities. The division is quite
large with over two billion dollars in annual sales and has many major manufacturing facilities.
Two process improvement initiatives were studied. The first was targeted at reducing the cycle
time of the manufacturing process - the Manufacturing Cycle Time (MCT) initiative - and the
second was designed to improve the efficiency, speed, and reliability of the product development
process - the Product Development Process (PDP) initiative.
3.1 Methodology
The main tools for theory development was intensive case study research (Eisenhardt 1989). The
research was retrospective. Both initiatives were completed at the time the research was
undertaken. While the company has undergone numerous change initiatives in the past fifteen
years, the MCT and PDP initiatives were chosen for several reasons. The MCT initiative was very
successful. During the course of the effort, the division was able to reduce its average cycle time
from more than 15 days to approximately one day. Further, the division's experience with MCT
continues to influence how other improvement efforts are implemented and managed throughout
the company. The PDP initiative was selected because it was heavily influenced by the success of
MCT. In particular, the same senior executive launched both initiatives, viewed PDP as a logical
extension of the success of MCT, and tried to use many of the same strategies that had been so
successful in the MCT initiative. The two initiatives represent a rare opportunity to control for the
effect of senior leadership.
The primary data collection method was semi-structured interviews. Over sixty interviews were
conducted with participants in the two initiatives. All levels within the organization were
represented, from the general manager of the division to development and operations engineers
who do product engineering or run production lines. The researcher visited two different
manufacturing facilities and the product development headquarters. Interviews lasted between 45
and 90 minutes and were all recorded on tape. Each interview began with the subject describing
his or her background with the organization and any relevant previous experience. Participants
were then asked to give a detailed historical description of their experience with the initiative. Once
the description was completed, subjects were asked to assess the key successes and failures of the
23
D-4684
initiative and to give any personal hypotheses for their causes. Finally, subjects were asked to
describe any lessons learned and to speculate on what they would do differently if they were to
participate in a similar initiative in the future.
The interviews were supplemented with extensive review of available archival data. We were
given access to a wide range of promotional and training material associated with each initiative
including pamphlets, newsletters, instructional books, and video and audio tapes. The historical
performance data were also reviewed. In the case of the MCT effort, extensive data on actual cycle
times, product quality, productivity and other operational variables were available. Fewer data
were available for the PDP effort.
The data were summarized in the:form of two detailed case studies (Repenning 1996a, 1996b).
The case documents describe the history of the initiatives with emphasis on both the available
quantitative and archival data and the recollections of participants. Both cases make significant use
of quotations taken from the recorded interviews. The case documents were provided to
participants for their feedback; participants were asked to review their quotations for accuracy but
were not allowed to change the content. Participants were also asked to review the entire case for
accuracy. The case documents are available from the first author upon request.
The research was also supported and enhanced by a team of company people formed specifically
for this study. Participants were drawn from multiple levels, and played a number of important
roles in the study. First, they provided access to key players in each of the initiatives. Second,
they provided valuable assistance in explaining and interpreting the organization's unique
language. Finally, the team met with the first author on a regular basis to review the case
documents for factual content and completeness and to assess the relevancy of the theory being
developed. While it is not possible to describe both cases in detail, in what follows we try to
highlight the main phases of each.
3.2 Manufacturing Cycle Time (MCT)
State of the System Prior to the Initiative
Prior to the MCT initiative, the division's manufacturing facilities were operated in a manner
similar to that of other companies whose business requires substantial capital investment and labor
expense. Line supervisors were charged with keeping each piece of equipment and each laborer
fully utilized. The company used a traditional performance measurement and evaluation system
that emphasized direct labor performance (roughly defined as the number of units produced per
person per day). The focus on utilization gave supervisors strong incentives to keep high levels of
24

D-4684
work-in-process inventory (WIP) to ensure that breakdowns and quality problems at upstream
machines would not force downstream machines to be shut down. As a result, a large portion of
each plant's floor space was dedicated to holding WIP inventory. An operations manager recalled,
Before [MCT] if you were to walk out onto the floor and ask a supervisor how things weregoing, he would say "Great, all my machines are running" and you would see tons of WIPsitting around.
The high levels of WIP inventory caused a number of problems. First, it was expensive - between
sixty and eighty percent of the division's total costs derived from purchased components. Second,
a high level of WIP delayed quality feedback - a machine could produce a large batch of defective
parts before the defect would be discovered by a downstream operation. Third, since the average
cycle time was long, it was difficult for the manufacturing facilities to change the production
schedule at short notice. Last minute changes were usually accommodated through expediting,
which destabilized the production floor by forcing operators to do more machine set-ups and
change-overs, by reducing lot size, and by increasing production pressure. The system had
evolved to be tolerant of quality and reliability problems.
Launching the Initiative
The MCT initiative was launched by a new general manufacturing manager (GM) who had worked
for a leader in the electronics industry. His first step was to analyze the existing system. He
recalled,
We analyzed [for a sample product] the time elapsed between when a part came in the backdock until the time it left the shop floor, and asked the questions "How long did it take?",and "What was the value-added?". We found out [for this product] it took 18 days to makethe product and we were adding value to the product 0.5% of the time.
Based on this analysis, the GM concluded that substantial improvement could be made by focusing
on the time products spent in between operations as opposed to the conventional focus on reducing
the time parts spent on a particular machine. Communicating this idea took some effort:
Many people thought of cycle time as the cycle time of the equipment. They were lookingat reducing the time a part spent on a particular piece of equipment from 20 seconds to 10seconds. My feeling was when you are at 18 days big improvements are not going to comefrom focusing on individual machines.
The GM spent much of his time visiting the division's manufacturing facilities, and personally
providing concrete examples of how the notions of cycle time and value added percentage could
lead to improvements in the manufacturing process. He recalls one trip where,
They [people in the plants] wanted to give me presentations in the conference room, and Iwould say "no, let's go out to the floor"... I wanted to show them examples of what I was
25

D-4684
talking about. I might look at the shipping labels in the warehouse. If it were May, Iwould usually find parts that had been received the previous August, and I would ask, "ifyou aren't using this stuff until May, why has it been sitting here since last August?"
These trips played an important role in stimulating interest in the effort. Given his senior position,
the general manufacturing manager was able to command the attention of the plant managers; his
message was sufficiently new and interesting that, at least in some cases, he was able to keep it.
Those plants interested in his message undertook an intense period of experimentation based on the
ideas of value added percentage and cycle time. Early efforts focused on simply developing
appropriate measurement systems. Improvement began almost immediately. As one plant
manager recalls,
...in the first year we started with simple counts at different times during the day, and westarted to plot them and to try and understand what was happening. Very quickly ourcreative engineering personnel came up with clever ways to control the buffers that helpedmake big improvements.
In the first year, cycle time at that plant fell by more than fifty percent.
MCE Analysis
In the middle of the second year a four-person group was created at division headquarters to
promote the initiative throughout all the plants. The group started by institutionalizing a
measurement system based on the experiment performed at the early adopter facilities. Each plant
was required to calculate a metric called Manufacturing Cycle Efficiency (MCE), defined as the
ratio of value add time (time in which function or feature was being added to the product) to total
manufacturing cycle time. The early results were not encouraging, as another plant manager
recalled, "...when we first started to calculate MCE, the numbers were so low [less than 1%] we
really wondered how relevant they were." The process of calculating the metric, however, proved
valuable. A staff member recalled,
... you had to walk through the shop floor and ask the question, "Is this value added?" forevery step in the process. By the time you were finished you had flow-charted the entireprocess and really highlighted all the value add stations....After calculating MCE, we reallystarted to understand the process flow of our products. We knew where value was beingadded, and, more importantly, where value was not being added.
Within a year, the MCE efforts helped cut the average cycle time for the division to less than five
days, down from the initial fifteen day average.
Theory of Constraints
Two years into the initiative, with the MCE analysis well underway in most facilities, the corporate
staff focused on shop floor management as the next opportunity for reducing cycle time. The MCE
26
D-4684
effort had focused on the structure of the process by eliminating non-value added operations and
identifying unneeded buffer inventories. To achieve further reductions in cycle time, the plant staff
needed better tools for process design and day-to-day management. Two challenges arose. First,
the manufacturing processes were very complex and scheduling them was difficult. The division
used a group of simulation specialists to help with process design and to develop scheduling and
coordination strategies. Second, the problem required more than just developing a better
scheduling technique - itself no easy task - but better management of the process required the
participation of manufacturing engineers, machine operators and material handlers. A supervisor
recalls,
...at the time people thought "this is important because it's important to the generalmanufacturing manager" but they didn't necessarily feel in their gut that it was importantbecause they didn't understand what was behind it....We needed more than just a definitionof MCT or MCE. People needed a better understanding of how the shop floor reallyworked.
The corporate office became interested in the offerings of the Goldratt Institute which taught the
shop floor management philosophy Theory of Constraints (TOC) developed by its founder Eli
Goldratt (Goldratt and Cox 1986). The attraction of the Goldratt group was twofold. They
offered a scheduling and coordination strategy, and, perhaps more importantly, they offered a
training program focused on developing intuition through hands-on experience with a computer
simulator. The supervisor of the manufacturing simulation group recalled,
I called it 'Shop Floor Scheduling and Coordination Awareness 101'. If you wanted toconcentrate in three days everything you would want to understand about the dynamics ofthe shop floor and how to keep the line running, this was it.
After selecting the Goldratt group, the division made a substantial commitment to disseminating the
training. Within six months of the initial contact almost every manufacturing engineer and
supervisor within the division had participated in a two day TOC class. In the following year, the
division developed a hands-on, board game version of the simulator that was used to train almost
every operator and material handler within the division. In addition, line supervisors made TOC
training a part of their daily operations. One supervisor who experienced substantial success using
TOC recalls,
We started by teaching each of the work teams how to manage their line using TOC...theclasses were useful, but I felt the real learning came from working with them on their lineson the floor. I would coach them through making actual decisions. I'd let them make thedecisions and then we would talk about the results.
Over time, TOC was widely accepted in the division and continues to play an important role in how
the manufacturing facilities are managed. In addition, it has moved responsibility for managing the
production floor down to the machine operators, as another supervisor observed,
27

D-4684
Essentially all the inventory management is now done by the operators themselves. Theydo all the counting, the majority of the analysis, and contribute to the scheduling.
By almost any measure, the MCT effort was very successful. Between 1988 and 1995 the average
manufacturing cycle time was reduced from approximately fifteen days to less than one day, the
quality of finished products was improved, and sales revenue, profit, and cash flow all increased
significantly. The manufacturing process became less elaborate and more flexible. Many facilities
are now able to change their production schedule on a daily basis, something that was impossible
before the MCT effort. Finally, the reduction in WIP created enough extra floor space within
existing manufacturing facilities that two of five planned new facilities were not needed, saving
hundreds of millions of dollars in capital expenditures.
3.3 Product Development Process (PDP)
Designing a New Development Process
The second initiative, focused on improving the division's product development process, was
initiated in large part due to the success of the MCT initiative. The general manufacturing manager
who launched the MCT effort was promoted to general manager of the division. He launched the
PDP initiative by forming a dedicated task force to design-and implement a new development
process. He describes his instructions to the group,
We need a development process that is fast, is the best in the industry, and it needs toincrease throughput by 50% in two years. And everyone must adhere to the same process.
The team assembled to develop the new process included representatives from all the major stake-
holders within the organization. The team spent almost two years designing the new process and
during that time focused on three main activities: (1) hiring an outside consultant to provide basic
methodology (2) benchmarking other companies, and (3) documenting the current process and
determining how many of the problems that occurred repeatedly had come to be part of the
process. A team member summarizes,
We spent a substantial amount of time looking at what other people did, how theystructured their processes and the problems they had. We looked at...the current state ofour process and tried to net out a process that had all the things we wanted and...allowedus to do things much more quickly.
The New Product Development Process
PDP was not the first attempt to improve the development process. Over the preceding ten years
many attempts had been made to speed product development, with mixed results. At the time PDP
was launched, two separate improvement initiatives were already in progress. During a two year
period the PDP team consolidated learning from the earlier efforts, along with benchmarking,
28
D-4684
lessons from internal analysis, and the input of many people throughout the company into a new
product development process for the division. The process is quite detailed, with numerous steps
specified. Three key elements distinguish the process from those the division used in the past.
First, PDP was a 'one pass' development process. Historically, projects were initiated with
ambiguous customer requirements and, as a result, a large number of physical prototypes were
created as the requirements for the final product were updated. Developing multiple prototypes
was time consuming and expensive. To combat this 'build and bust' cycle, PDP required detailed
documentation of customer requirements before the design process was initiated. When the
requirements were established, engineers would then do the majority of the design work using
computer engineering and design tools, thus eliminating the need for multiple physical prototypes.
The combination of detailed, up front documentation of customer requirements and use of
computer tools would allow new products to be developed with one physical prototype and little if
any redesign work, thus saving both time and engineering resources.
A second goal of PDP was to propagate learning through the use of the 'bookshelf.' The division
did not share technological learning well causing substantial effort to be duplicated. The bookshelf
was to be an engineering library of technologies, modules, and subsystems: Every time a new
technology was used it was the user's responsibility to 'bookshelf that technology by fully
documenting its uses, capabilities and limitations, and then placing it in the library. To
complement the bookshelf, PDP also specified a 'wall of innovation.' Historically, projects using
new and unproven technologies often fell behind schedule or suffered from quality problems. The
wall of innovation was the point in the development project beyond which every project had to be
based on technologies that had already been placed on the bookshelf, and was designed to prevent
projects from proceeding well into the development cycle with new technology that had not been
appropriately tested.
Third, the PDP process was designed to increase discipline. The development process was
divided into six major phases, and at the end of each phase development teams were required to
undergo a 'phase exit quality review' before proceeding to the next step. The reviews were
conducted by senior managers and required the development teams to assemble detailed
documentation on the state of the project. One important role of the phase exist quality reviews
was to enforce the wall of innovation: managers were supposed to prevent teams from proceeding
to the next phase until each of the technologies they planned to use in the project was documented
and placed on the bookshelf. Between reviews projects were to be run using standard project
management techniques such as work plans, Gantt charts, and project management software. By
29

D-4684
using project management tools, engineers would be more accountable, efficient, and better able to
meet critical milestones in the development of a given product.
Pilot Development Projects
With the new development process in hand, the design team tested the process on a number of pilot
projects. The pilots were chosen to serve two purposes. First, they provided an opportunity for
the team to identify and correct problems in the process. Second, if they were successful, the pilot
projects could be used as examples to drive the process through the organization. The first pilot
project chosen was a high profile product critical to the corporation's image and financial success.
The pilot also required the use of new and unproven technologies. As the first test of the new
process, engineers could not draw on the bookshelf, and were not able to achieve the 'one pass'
design dictated by the PDP process. Instead, much of the design was substantially reworked late
in the development cycle, increasing work pressure and stress on members of the pilot project
team.
The project suffered further since much of the support infrastructure required for the new tools was
not in place. Engineers did not have powerful enough computers to use the new CAD/CAE/CAM
software, and once the computers were obtained, the rest of the organization was not able to accept
their output due to software incompatibility. In addition, learning how to use the tools imposed a
substantial burden on the already overworked engineers. One engineer recalled,
...I had some background in CAD/CAE from my master's program and I still stayed atwork until midnight every night for a month learning how to use the tools and trying tofigure out how to get my work done....Some of the older engineers, even with training,they just have a [computer] sitting on their desks gathering dust.
While another said,
... the value of the tools was way overestimated...we never had time to take the courses andget the equipment we needed to really make this stuff work....it was really exhaustingtrying to learn how to use the tools and do the design at the same time.
The effect of these problems on the morale of the engineers was significant. Every interviewee
reported being frustrated with the process. Many felt that management had defined a development
process and then immediately gave the engineering staff a project and time line that could not be
accomplished using the process. There was also a substantial additional workload as engineers
tried to teach themselves how to use the new tools while trying to accomplish their normal work.
As a result, many of the engineers working on the pilots were forced to abandon much of the
methodology to meet the project's schedule and specifications. One engineer recalled, "...we
30
D-4684
crashed through the wall of innovation and never looked back." A common sentiment was
expressed by another who said, "...I believe PDP is a good process. Some day I'd really like to
work on a project that actually follows it."
Rolling out the Initiative
The roll-out strategy for PDP had three components: A high level awareness campaign designed to
show senior management's support, a middle level effort to create interest in the actual process,
and intensive training that would give supervisors and engineers detailed working knowledge of
the process. Components one and two were very successful. Senior management was highly
visible with respect to the project, and a number of promotional documents were created including
an audio tape, videos, and a high gloss brochure. There was also a PDP newsletter throughout the
initiative which kept people updated on the pilot projects.
Results
Evaluating the success of the PDP initiative is difficult. The time delays are sufficiently long that,
as of the fall of 1995, only the first pilots have reached the launch phase. There is little quantitative
data with which to evaluate the success of the initiative. The lack of data caused by the long cycle
times for PD projects is a key feature of the feedback structure governing the success of the
program and not just a problem for researchers. Without rapid feedback on results, people form
judgments about the effectiveness of PDP based on less reliable sources such as anecdotes,
rumors, and personal experience. Indeed, despite the lack of hard data, many people developed
strong feelings as to the successes and failures of the effort. Everybody believed that the process
as designed was good, but that the division as a whole does not follow it. The GM rates the effort
as a fifty percent success. The executive in charge of the initiative believes that they achieved
eighty to ninety percent of their objective for the use of new tools and less than twenty percent of
their objectives for documentation of customer requirements, using project management, and
developing a more rigorous and repeatable process. Members of the design team also believe the
effort failed to achieve its objectives, but hope it will provide a catalyst for future improvements.
Among the engineers interviewed, not one believed that the initiative had materially influenced his
or her job.
4. Analysis
PDP and MCT provide good examples of the paradoxical nature of process improvement efforts.
PDP was launched by a senior executive, had substantial funding, and was designed and
implemented by a cross functional co-located team. World class development processes were used
as models, and a substantial investment was made in roll out and training. Yet it was, at best, a
31
D-4684
partial success. In contrast, the MCT initiative was extremely successful even though it was
launched by a lower level executive,'had a modest budget for training, only a four person staff, no
benchmarking was done, and little money was spent on promotion or internal marketing. In this
section, the framework developed in section two is used to diagnose and explain the differing
results of the two initiatives.
4.1 Manufacturing
The Reinforcing Nature of Improvement
Prior to the MCT effort, manufacturing displayed many of the dynamics outlined in section two.
The following quotes are taken from supervisors in two different manufacturing facilities. In the
first case the supervisor discusses the difficulty of finding time for preventive maintenance:
...supervisors never had time to make improvements or do preventive maintenance on theirlines...they had to spend all their time just trying to keep the line going, but this meant itwas always in a state of flux, which in turn, caused them to want to hold lots of protectiveinventory, because everything was so unpredictable. It was a kind of snowball effect thatjust kept getting worse.
Second, a manager at a different plant discusses the inability of operators to stop the line to make
improvements that would increase yield:
In the minds of the [operations team leaders] they had to hit their pack counts. This meantif you were having a bad day and your yield had fallen ... you had to run like crazy to hityour target. You could say "you are making 20% garbage, stop the line and fix theproblem", and they would say, "I can't hit my pack count without running like crazy."They could never get ahead of the game.
Both examples can be mapped into the framework discussed previously (figure 8). Process
throughput is determined by the number of machines currently broken (broken means not operative
or producing defective product). There are two corrective actions to improve process throughput.
Broken machines can be repaired as in the first quotation (the Rework loop B2). Alternatively, as
in the second quote, operators can run their remaining machines longer or faster via the Work
Harder loop B 1, and they can refuse to stop their machines for maintenance or problem solving to
Focus on Throughput (loop B4). In either case, the time allocated to corrective efforts comes
directly at the expense of time available for prevention. Time spent by maintenance staff to repair
broken machines reduces the time they can allocate to preventive maintenance. In addition,
because preventive maintenance requires stopping working machines, any extra time spent running
machines to compensate for those that are broken also reduces time for preventive maintenance.
These links close the reinforcing Reinvestment loops Rla and Rib which drove the system until
machines were so unreliable they had to be run constantly to hit throughput objectives, eliminating
time for preventive maintenance and making the machines even less reliable.
32
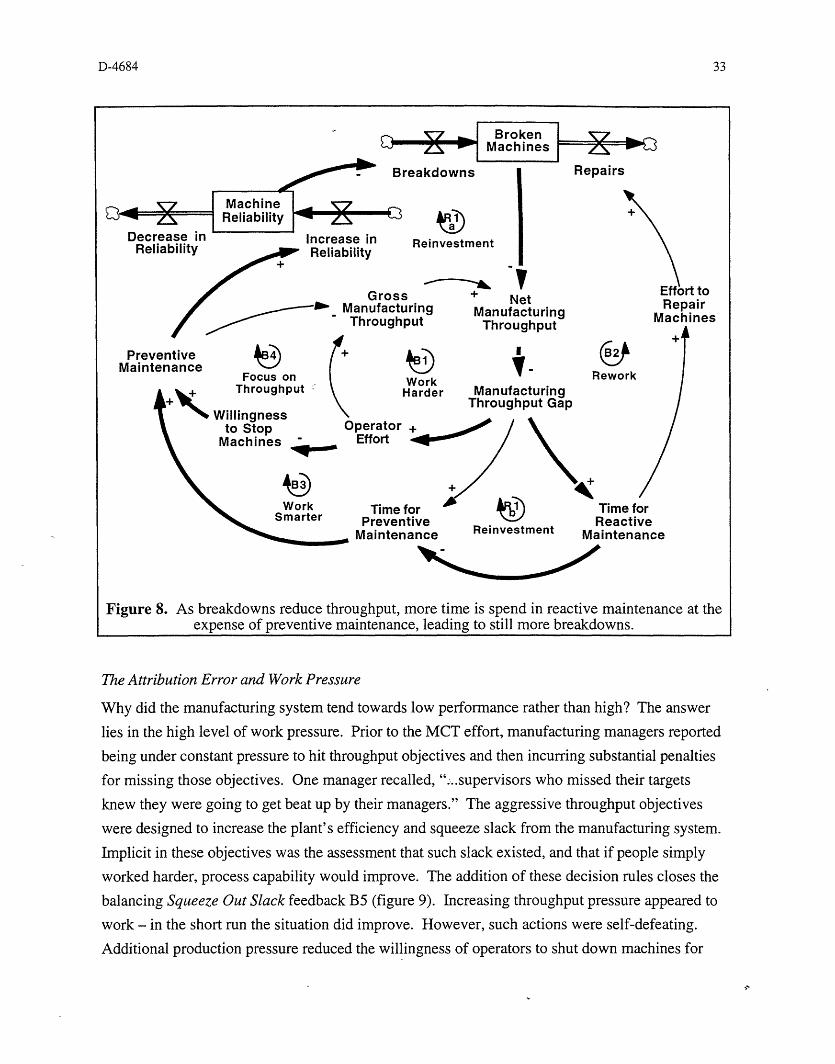
D-4684
Broken l-Machines
I Increase inReliability
. Manu-Thro
Focus onTr sr 4 '
reakdowns Repairs
Reinvestment
surinput
V+ Net
'g ManufacturingThroughput
IWork
Harder ManufacturingThroughput Gap
Rewc
)perator +Effort 4'
+
Ime lotr I' "l1 IJiPreventive Reactive
Maintenance Reinvestment Maintenance
Figure 8. As breakdowns reduce throughput, more time is spend in reactive maintenance at theexpense of preventive maintenance, leading to still more breakdowns.
The Attribution Error and Work Pressure
Why did the manufacturing system tend towards low performance rather than high? The answer
lies in the high level of work pressure. Prior to the MCT effort, manufacturing managers reported
being under constant pressure to hit throughput objectives and then incurring substantial penalties
for missing those objectives. One manager recalled, "...supervisors who missed their targets
knew they were going to get beat up by their managers." The aggressive throughput objectives
were designed to increase the plant's efficiency and squeeze slack from the manufacturing system.
Implicit in these objectives was the assessment that such slack existed, and that if people simply
worked harder, process capability would improve. The addition of these decision rules closes the
balancing Squeeze Out Slack feedback B5 (figure 9). Increasing throughput pressure appeared to
work - in the short run the situation did improve. However, such actions were self-defeating.
Additional production pressure reduced the willingness of operators to shut down machines for
PreventiveMaintenance
Effort toRepair
Machines
,rk
WorkSmarter
33
T _ 9-- T;m . f.,
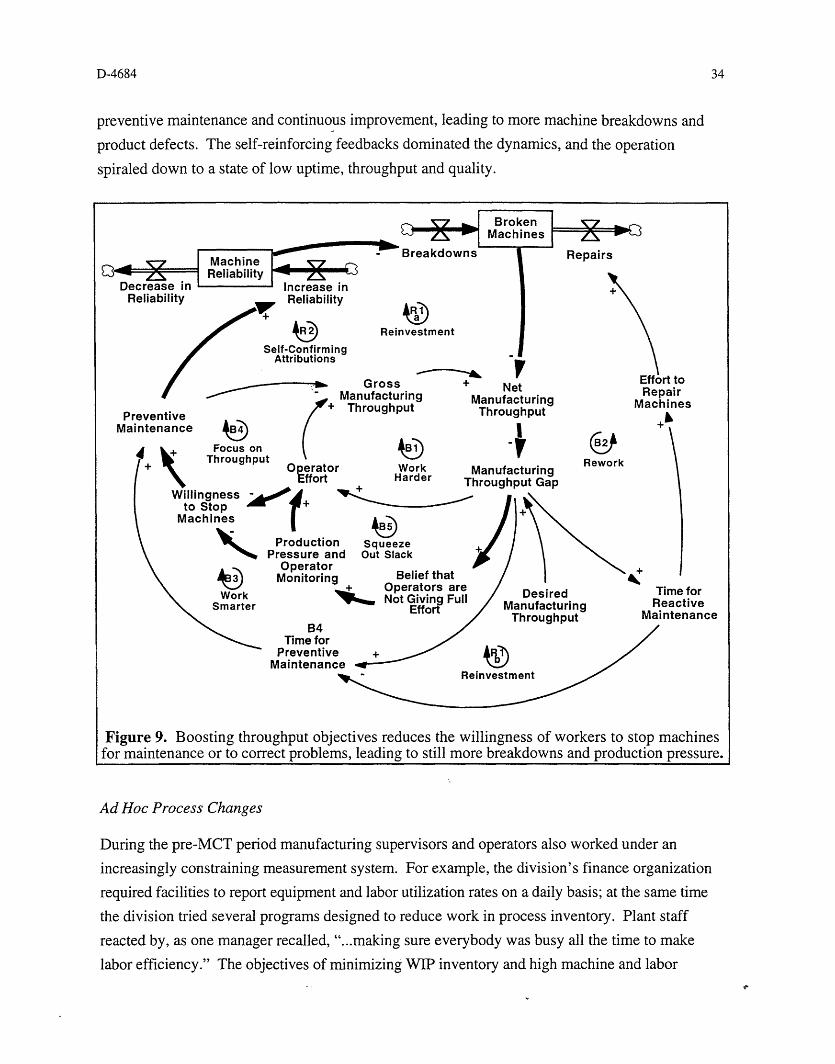
D-4684
preventive maintenance and continuous improvement, leading to more machine breakdowns and
product defects. The self-reinforcing feedbacks dominated the dynamics, and the operation
spiraled down to a state of low uptime, throughput and quality.
Machine - -Reliability
Decrease in Increase inReliabilitv Rliahilitv
Rei
V+ Net
ManufacturingTL.. . , L-..
Preventive I --- - -- r -- I rIuUIpuMaintenance ( j 4)
- 1_\ -Uit \ t) V
Operator Work Manufacturing-. 0 rde + r Throughput Gap
Production SqueezePressure and Out Slack
OperatorMonitoring Belief that
_ Operators areNot Giving Full
EffortCII
/ ThrniinhrB4 ....
Time forPreventive +
Maintenance _ /Reinvestment
Effort toRepair
Machines
Rework
Time forReactive
hiit iwlainienance
Figure 9. Boosting throughput objectives reduces the willingness of workers to stop machinesfor maintenance or to correct problems, leading to still more breakdowns and production pressure.
Ad Hoc Process Changes
During the pre-MCT period manufacturing supervisors and operators also worked under an
increasingly constraining measurement system. For example, the division's finance organization
required facilities to report equipment and labor utilization rates on a daily basis; at the same time
the division tried several programs designed to reduce work in process inventory. Plant staff
reacted by, as one manager recalled, "...making sure everybody was busy all the time to make
labor efficiency." The objectives of minimizing WIP inventory and high machine and labor
eIf-ConfirmingAttributions
Gross-_ Manufacturina, f+ Throuahnut
34
------- · ._..
-

D-4684
utilization were in direct conflict. Over time, operators and supervisors reacted by making ad hoc
changes to the manufacturing process that allowed them to appear to satisfy both objectives. Most
importantly they surreptitiously accumulated secret work-in-process inventories which allowed
them to keep every machine running, even if its output was not needed. A manager explains:
Supervisors at that time were evaluated on labor performance on a daily basis. It didn't takelong for them to develop a buffer in front of their line so that if the schedule called for 700and their line was fully utilized at 800, they could still run 800 units every day, and stillmake their labor performance.
The feedback structure is shown in figure 10.
Managers react to a throughput gap by scrutinizing machine utilization more often and then
increasing the pressure to hit pack counts to Squeeze Out Slack (loop B5). Those working on the
production line then experience a conflict between the higher throughput objective and the
imperative to reduce cycle time and improve quality. Increasing machine utilization makes it more
difficult to hit the production schedule and keep WIP low. Workers react to the conflict by taking
Process Shortcuts such as holding secret caches of WIP which allow them to satisfy their
vCycle TimengCycle Time
in WIP in WIP Process+ Integrity
Gross -
Manllfact-rinn+ w.-.-.- " NetThroughput NetThrou/pu+ Manufacturing
Holdings ofThroughputSecret _
Inventory 6\ Work+ THarder
Process Operator ManufacturingShortcut Effort Throughput Gap
Conflicting Goals
Production )*NWPressure and Squeeze
Operator Out SlackMonitoring
Belief that Operatorsare Not Giving Full
Effort
Figure 10. As throughput objectives conflict with cycle time reduction goals, workers began tohold secret caches of inventory, lengthening cycle time and reducing process capability.
ILA - -. 9- - I
1� 3
35

D-4684
utilization objectives and still appear to meet their inventory reduction goals (loop B6). However,
increasing WIP lengthens the manufacturing cycle time, delaying the detection of defective product
and reducing the capability of the manufacturing process. Management responds by further
tightening controls and increasing production pressure. These links cause the self reinforcing
Process Integrity feedback to drive the manufacturing system to higher levels of both WIP
inventory and production pressure.
Breaking the Cycle
The feedback structure described above explains why the manufacturing organization suffered
from excessive WIP inventory, low equipment reliability and product quality, and high levels of
work pressure. A critical feature of the MCT initiative was the radical reconceptualization of the
underlying cause of these problems. First, the general manufacturing manager challenged the
conventional wisdom with his simple analysis of cycle time and value added percentage. He
recalls, "When I laid this [the cycle time analysis] out for everybody...they were astonished." The
new analysis called into question people's basic understanding of the manufacturing process. A
plant manager recalls,
...we had a gut feel that our cycle times were going to be pretty long...but what really gotus was that even with the very crude definitions of value add time we were using-they aremuch stricter now-we had astoundingly low cycle efficiencies [the ratio of value add tototal production time].
Faced with the fact that value was only being added to the products less than .5% of the time,
managers could no longer attribute the low capability of the manufacturing process to the sub-
standard efforts of supervisors and operators.
The development of new understanding and new diagnoses focused on the manufacturing system
rather than on those working within it as the source of poor performance continued through the
TOC phase. The TOC philosophy and training further altered people's understanding of the basic
dynamics of the manufacturing system. By working with the TOC computer simulators managers
realized that their actions and decisions were as much a cause of low performance as the efforts of
people working on the line. One area manager recalled,
It [TOC] allowed you to step back and understand the shop floor as a system rather than asa bunch of process areas, particularly if you worked inside of one. Even though yourtraining would lead you to make decisions one way, it led you to a new intuition that helpedyou make decisions differently.
These reframings were critical to the success of MCT because they provided managers with a new
conception of the cause of low process capability, thus breaking the self-confirming attribution
36

D-4684
cycle. The initial data analysis and the TOC training pointed to physical attributes and managerial
behaviors as the cause of low capability rather than the attitudes and skills of the work force. One
manager summed up his explanation of the success of the MCT effort by saying
There are two theories. One says 'there's a problem let's fix it', the other says 'we have aproblem, someone is screwing up, let's go beat them up'. To make improvement we couldno longer embrace the second theory, we had to use the first.
The general manufacturing manager also believed finding systemic rather than attitudinal causes for
problems was critical to success. When asked what skills and talents he possessed that allowed
him to make improvements where others had failed, he recalled the following experience:
At [a previous employer] I was a plant manager. One of the things I'll never forget as longas I live...the guy I took over from blamed his people for everything [and]...there wasreally one guy in particular who he thought was the whole reason for the poor performanceof the plant. So I didn't say anything or do anything for about two or three months.Finally, I gave the guy more responsibility...as much responsibility as he'd take. Heended up being one of the best people in the plant. I guess that was probably the turningpoint for my thinking.
Active experimentation is a critical part of many improvement methodologies, particularly TQM.
However, a prerequisite for experiment-based methodologies is accepting that significant process
problems exist and can be corrected by solutions that are as yet unknown. Prior to the MCT
initiative, supervisors and operators were forced to make ad hoc departures from standard
operating procedures to satisfy conflicting objectives, but once the reinforcing attribution cycle had
been broken, open experimentation could become part of the MCT effort. Experiments add a
higher level of rigor to the improvement process and increase the chances of making favorable
process changes. Openness means harmful side effects are more likely to be anticipated and
avoided. In addition, by making the results public and observable, rather than hiding them, the
organization is able to adopt the benefits of any new learning more rapidly.
Experimentation was the fundamental mechanism of improvement. Increasing the level of
experimentation meant a decrease in the level of control managers exerted over the process. The
plant manager from a facility that was an early adopter of many of the MCT techniques described
the new environment,
If somebody had a better idea about how to manage the buffer, they could try it...everything we tried we picked up from our own people...everything from the ToyotaProduction System's Kan Ban to doing statistical process control on buffer sizes.
In addition to allowing the experiments to take place, the penalty for trying something that did not
work was reduced, a further reduction in the control that managers exerted over the process. The
same plant manager continued:
37

D-4684
...the best thing we did was that we didn't kill anybody when they shut down the line, andthat happened a lot during this period of time as we experimented with new buffermanagement systems. We certainly shut it down more than we would have otherwise, butwe were willing to do this in order to make more improvements.
4.2 Product Development
The Reinforcing Nature of ImprovementDespite large apparent differences between manufacturing and product development, the feedback
structures governing improvement in both is strikingly similar (figure 11).
I Desians on r
Rework
Designs Done DesignsIncorrectly Reworked
theBookshelf in
Design PDesignsALAA!n . ...Placed on
Bookshelf
++ Net Product
DevelopmentThroughput
ProductDevelopmentThroughput
Gap
Rewor
Reinvestment
Gross ProductDevelopmentThroughput
Time Spent 4Documenting Focus
Designs Through
WorkSmarte
onIput
DesignEngineer
Effort
r
Time forImprover
Effort.
WorkHarder
+a
Desire~+ Dev4
Inr
?d Productelopment
ReworkEfforts
rk
Time forRework
Reinvestment
Figure 11. Development engineers under pressure to meet deadlines failed to document andshare their designs. Without this learning, design error rates remained high, reinforcing schedule
pressure and limiting time for future improvement.
Engineers were directed to follow the PDP process, including learning how to use the new
CAD/CAM system, doing failure mode and effects analysis (FMEA), and documenting their work
U SO leC enr
38
I DB
Is
D-4684
and posting it to the bookshelf (the Work Smarter loop B3). However, they were also responsible
for rectifying past problems including reworking past designs found to be flawed by customers
(loop B2). Because of the large expense associated with developing and manufacturing a new
product, a high priority was placed on delivering designs on time. Correction efforts - reworking
flawed designs - took precedence over preventing problems in subsequent projects. One engineer
described the incentives facing development engineers by saying, "...the only thing they shoot you
for is missing product launch...everything else is negotiable." In addition resources are limited
since engineers were responsible for both completing existing designs and process improvement
activities like learning how to use the computer tools and placing designs on the bookshelf. Since
the engineers were already working as many hours per week as they could, the time required for
rework came directly at the expense of time for improvement, causing the Reinvestment loops to
dominate the dynamics.
Self Confirming Attributions in Product Development
Similar to the experience in the manufacturing area before MCT, product development managers
had come to believe that the cause of low process capability was the "undisciplined" nature of the
development engineers. A senior manager on the PDP design team recalls,
...we found... [the existing development process] was...poorly documented and poorlydisciplined....Engineers by trade, definition, and training, want to forever tweakthings ....It's a wild west culture.... [With PDP] we were trying to instill some rigor,repeatability, and discipline into the process.
A chief engineer explains his diagnosis,
We went through a period where we had so little discipline that we really had the 'processdu jour'. Get the job done and how you did it was up to you....It allowed many of theengineering activities to go off on their own and as long as they hit the key milestones, howthey got there wasn't that important.
Previous efforts to improve the product development process had been only partially successful.
Increasing the strength and number of product development throughput objectives, for example,
via the phase exit quality reviews, imposed additional work pressure on engineers (the Squeeze
Out Slack loop B5 in figure 12). To meet project deadlines and still comply with the reporting
requirements, engineers cut back the time spent documenting their designs to prepare for their
design review meetings (the negative link from Throughput Objectives and Monitoring to Time
Spent Documenting Designs). But because fewer designs could be properly documented and
posted to the bookshelf in a form that would be useful to others, the cumulative stock of
knowledge available to help others avoid error did not grow, perpetuating low design productivity.
As the PD organization continued to fall behind, managers imposed still more control on the
39

D-4684
process, unintentionally limiting the ability of the organization to implement the bookshelf and
other key elements of the PDP initiative. The lack of long term results only reinforced managers'
belief that the engineers were undisciplined (via the Self-Confirming Attributions loop R2).
Rework
Designs Done Designs0000~_ ~ PI s PMRwnrrl
Designs onthe . .
Bookshelf DDesignsDesign Placed on
Obsolescence Bookshelf
Self-ConfirmingAttributions
GrossDevelThrc
I'l I An\ A
nt Ting Focus on
Throughput
Irroauct
lopment)ughput
A
)esignngineerEffort
SqueOut
iM
Worklarder
+
Net ProductDevelopmentThroughput
'F
ProductDevelopment
Throughput Gap
Rew¢
,ezeilack
Belief tEngineerUndiscip
WorkSmarter Time for
ImprovementEfforts
Reinvestment
ReworkEfforts
A +rk
Time forRework
Figure 12. The belief that engineers simply needed to work harder led to aggressive throughputgoals which could only be met if the engineers failed to document and share their designs,
perpetuating low design productivity.
PDP did not break the cycle
Whereas MCT was successful in changing manager's assessment of low process capability, PDP
was not. PDP's focus on discipline and project management did not represent a fundamental
change in the core beliefs of senior managers. The result was a further increase in control which
Time SpeDocument
Design
- -
_1
40
_".. Y~ ~r·vl~rI
I
T+H
IP-
D-4684
gave engineers even less freedom to experiment and improvise ways to improve the process. The
conflict between the attributions of the managers and the experience of the engineers is most
obvious in their comments concerning project management, a key component of the PDP initiative
which failed to achieve widespread use. Managers attributed the lack of success of project
management to the attitudes of the engineers. The executive in charge of PDP said,
A lot of the engineers felt that it was no value add and that they should have spent all theirtime doing engineering and not filling out project worksheets. It's brushed off asbureaucratic.
When pressed further for an explanation of the engineers' resistance to project management, he
continued,
Program management and the disciplines associated with it continue to be a problem in myopinion in most western cultures. The people that are particularly rigorous and disciplined,the Japanese and the Germans, tend to be so by cultural norms. I can't tell you if it'shereditary or society or where it is they get it but the best engineers are those that tend to bethe most disciplined, not as individual contributors but as team based engineers. So there'sa strong push back from the western type of engineers for much of this.
Such attributions, here generalized to entire nations and ethnic groups, are typical of the
fundamental attribution error. As these attributions and experiences are shared and repeated they
become institutionalized. They become part corporate culture, and, as suggested by the quote
above, they might even become part of the national culture.
In contrast, engineers said that they had no problem with project management techniques per se,
but the combination of doing their assigned engineering tasks and all the project management and
documentation work was more than they could possibly accomplish. One engineer said,
People had to do their normal work as well as keep track of the work plan. There justweren't enough hours in the day, and the work wasn't going to wait.
Another expressed a similar sentiment,
...under this system...the new workload was all increase.... In some cases your workloadcould have doubled.... Many times you were forced to choose between doing the physicaldesign and doing the project and administrative.work. To be successful you had to do thedesign work first, but the system still required all this extra stuff.
How did engineers accommodate the substantial increase in workload imposed by the new
process? One engineer from a PDP pilot project explains,
How do we catch up? We stayed late. Most of the team was working from 7:00 a.m. to8:00 p.m. and on weekends. A lot of people worked right through the Christmas vacation.
The contrast between the mental models of the engineers and managers highlights a key failure
mode for improvement programs. Engineers report that project management failed due to lack of
41
D-4684
time and intense work pressure while managers attribute the failure to the basic attitudes and culture
of the engineering staff. In evaluating the successes and failures of project management and PDP
one chief engineer suggested that managers were actually creating the situation they were trying to
prevent,
I believe that PM is not an issue in and of itself. The problem with PM is that sometimesmanagement chooses to adhere to it, and sometimes it chooses not to adhere to it....Whenwe set out the disciplines of PDP we said "there it is, it's a very disciplined, rigid program,go follow it." Then in the very next breath we would say, "I want you to ignore all thatand bring this project home in half the time." That just didn't go down very well.
Ad Hoc Process Changes
The conflict between trying to get work done and following PDP was pronounced. Almost every
engineer expressed feelings similar to the one who said, "I believe PDP is a good process. Some
day I'd really like to work on a project that actually follows it." As in manufacturing prior to
MCT, the conflict between the throughput goals and process adherence goals forced participants to
work around the process. These departures took the form of neglecting documentation, not
placing technologies on the bookshelf, or not filling out a detailed work plan. Another chief
engineer gives an example,
...writing [computer] code on the back of an envelope is a lot faster than documenting it.Of course the quality of code went up if you documented it and fixed things that mightrequire rework later, but that only shows up in speed after the fact.
Another manager observed, "...in the long run [inadequate documentation] prevented us from
being able to deploy the reusability concepts that we were looking for." These behaviors create a
structure very similar to that found in the pre-MCT manufacturing environment (see figure 13).
Upon observing low process capability, managers' belief that engineers are undisciplined is
confirmed. They react by increasing both pressure to hit product launch dates and by stiffening
documentation and reporting requirements. The increase in production pressure and process
control leads to a conflict in the objectives of the engineers. On the one hand, they are being asked
to follow the process in a disciplined manner that, at least in the short run, reduces their
productivity. On the other, they have an aggressive objective for completing their work. They
react to the conflict by taking short cuts and departing from the process, causing the self-
reinforcing Double Bind and Process Integrity loops to operate as vicious cycles. Another engineer
summed up the effect that work pressure had on the success of PDP:
To be perfectly honest, I really don't think PDP changed the way engineers did their jobs.In many ways we worked around the system. Good, bad, or indifferent that's whathappened. We had a due date and we did whatever it took to hit it.
42

D-4684
Rework
Designs Done DesignsIncorrectly Reworked
ProcessIntegrity
Process +Shortcuts Process
e \3I.rr - c : \
Integrity
Gross Product Net ProductDevelopment DevelopmentThroughput Throughput
Design Work: Engineer Harder Product
Effort Development,+ A Throughput Gap
Conflicting EngineerEngineering Throughput
Goals + Objectives andMonitoring
Time Required to DoubleSatisfy Bind
Requirements
Strength ofDocumentation
and ReportRequirements
SqueezeOut Slac
_M.-- -
k
Belief thatEngineers areUndisciplined
Figure 13. Managers, believing engineers were undisciplined, increased throughput objectivesand specified additional reporting and documentation requirements. To resolve the conflict,
engineers cut corners, reducing the integrity of the process, leading to still more defects and stilllower productivity. Management's belief that engineers were undisciplined was reinforced.
5. Discussion
The framework presented provides some insight into the differing levels of success of MCT and
PDP, and identifies some key differences between the two initiatives that led to the different
outcomes. However a basic question remains unanswered: Why were the strategies used in MCT
not used in PDP? If the successful MCT effort was predicated on developing better understanding
of the system among the front line managers and encouraging their experiments to improve it, why
was this approach abandoned in the PDP effort? If the same senior level executive kicked off both
Rework
Rework
Time forRework
--
43
Ij

D-4684
initiatives, and the MCT effort preceded PDP, why was the MCT strategy not replicated in the PDP
effort? The answers to these questions lie in the different physical structure of the two processes
and resulting unanticipated interactions between them.
5.1 Differential Time Delays
Manufacturing and product development work at different speeds. In both areas, the short term
positive effects of increasing control and work pressure can be observed quickly - people work
harder, they spend more time at their jobs, or they follow the process more closely. However,
there is a significant difference in the times required to observe the negative, long term effects. At
its worst, the average cycle time in manufacturing was less than a month - the consequence of any
change in the structure or operation of the manufacturing floor could be assessed within a few
weeks. Product development projects typically took over three years - the benefits of fundamental
changes made during the PDP effort could not be observed for a year or more.
Early in the MCT program, managers reported being able to see improvements in cycle time within
months of starting the effort. Once the attribution loop was broken - managers decreased control
and relaxed production pressure - only a few months were required before the reinforcing loops
R1-R3 began producing observable improvement. In addition to quickly confirming the value of
the new strategy - a behavioral effect - early results also increased potential throughput - a
physical change. Extra manufacturing capacity played an important role in the continued success
of the initiative for at least three reasons. First, additional capacity allowed the plants to hit their
production targets while running at less than one hundred percent utilization, further reducing
production pressure, and permitting more resources to be allocated to improvement. Second,
additional capacity makes the operations more robust to the variability and disruptions inevitably
caused by experiments with new processes and procedures. Third, slack resources also mitigate
the 'worse before better' trade-offs associated with improvement initiatives. For example,
preventive maintenance requires shutting down operable machines and reducing gross throughput.
With excess capacity this can be done without risk of missing the production schedule.
In contrast to the short time delays in manufacturing, a year or more was required to observe and
reap the potential benefits of PDP. In the meantime, managers were under continual pressure to
improve throughput. Under such production pressure, it was difficult to undertake experiments
and make investments in innovations such as the bookshelf with long-term pay-offs. Further,
even if these dynamics were fully understood by engineers and project supervisors, it would have
been difficult to convince senior leadership to be patient for such a long period of time. The
44
D-4684
executive in charge of the PDP effort discussed the difficulty of making such a long term
commitment,
Imagine at the end of the year the general manager going up in front of the president andsaying, "We missed our profitability numbers because we spent extra money developingour new design process that won't be fully deployed and rolled out till five years from nowbut wasn't that a good move?"
Thus the long cycle time for generating improvements in product development intensified the
period of reduced throughput caused by efforts to improve the process, and, as a consequence the
product development system was more likely to suffer from self-confirming attribution error
dynamics. More subtly, these differences in physical structure interacted with managers' decision
making to undercut the success of the PDP initiative. The benefits of changing the policies that led
to high levels of production pressure and control would not have been observed for a substantial
period of time, weakening the evidence that might contradict prevailing mental models. Whereas in
manufacturing a six month 'experiment' with reducing control and production pressure might
produce favorable results, in product development the organization would need to commit to the
new policy for two years or more. Experimental studies have shown that the quality of decision
making declines rapidly as the time delays between actions and consequences increase (Diehl and
Sterman 1995, Brehmer 1992). The longer the delay between improvement effort and results, the
longer investments in improvement must be sustained before any benefits are realized; and the
greater the loss of time available to bring new products to market. The throughput gap builds.
Managers respond by increasing pressure on the engineers to meet their design deadlines. The
engineers respond by focusing on throughput, and the effort devoted to improvement falls before
the design productivity improves enough to free up resources which might be reinvested in further
improvement.
As each improvement program fails, the self-confirming attribution errors that thwart the
implementation of new development processes become stronger. As these attributions are
repeatedly confirmed they become embedded in the organization's norms and culture.
Management, more firmly convinced that engineers as a group lack discipline and fail to
understand the realities of business, increasingly focuses new improvement efforts on compliance
with ever more detailed procedures and ever more stringent reporting requirements. Engineers
become cynical about the value of new improvement programs and suspicious of management's
motives. Dilbert cartoons appear on cubicles (Adams 1996). The vicious cycles of self-
confirming attributions dominate the dynamics. New improvement efforts are more and more
likely to fail.
45

D-4684
5.2 The Relationship Between Manufacturing and Product Development
So far the manufacturing and product development initiatives have been discussed separately. As
in most large firms, the improvement initiatives in manufacturing and product development were
undertaken independently. Such decomposition is almost necessary: the manufacturing
organization is large, with eight facilities spread throughout the world; product development is
comparably sized and divided into multiple, semi-autonomous functions. However,
manufacturing and product development are intimately intertwined with one another. These
linkages were not appreciated or attended to in the improvement strategy.
Because of the inherently shorter time delays for improvement in manufacturing, the MCT effort
progressed faster than PDP. In addition, PDP was started two years after MCT, and in large
measure as a result of MCT's success. As the general manager said,
When I started out I was only the manufacturing manager so I did everything I could to fixthe manufacturing side. When I became the general manager [in 1991] I realized that, inpart because of what we had done in manufacturing, our plants were half empty. If wecouldn't [generate new business] we were going to have empty plants, which meantunaffordable plants.
Thus, because MCT was so successful early on, substantial excess capacity was created in the
manufacturing facilities. The capacity could be used to generate more revenue only if the product
development organization could generate new products to bring in additional business.
Because the demand facing the manufacturing plants was constrained by the slow rate of product
introduction, early improvements in manufacturing generated slack, allowing the plants to hit their
production targets using less than 100% of their available resources. The underutilized resources
could then be dedicated to more training and experimentation. The manufacturing plants were able
to reinvest some of their early productivity gains in further improvement because the demand for
their products was determined by the capacity of the product development organization. Excess
capacity meant managers in manufacturing could both satisfy their production objectives and
achieve their improvement targets. No difficult choices had to be made. In contrast, when PDP
started, product development was the bottleneck on the demand for the division's products -
demand could only grow to the extent that new products could be designed and launched. Unlike
the managers in manufacturing, product developers faced an acute tradeoff between improvement
and throughput: investing in improvement activity directly reduced the time available to bring new
products to market. Under intense pressure to utilize the excess capacity created by MCT, the
development organization aggressively sought new business, weakening the reinforcing
reinvestment loops that are fundamental to sustained improvement. As one manager said,
46

D-4684
....there was tremendous pressure to grow and there was tremendous pressure for newproducts, new technology and new customers. We were trying to sell very, veryaggressively to the outside. So we would get ourselves in situations where we would havea success with an outside customer which translated into a resource problem for theengineers. We typically never said no.
Thus, the very success of the MCT effort intensified the problems faced by PDP. Not only did the
product development process have longer time delays, but because of the excess capacity in
manufacturing, they were under intense pressure to boost throughput. As a result, managers often
increased work pressure, monitoring, and controls to hit their short term objectives, undercutting
the feedback processes leading to cumulative improvement and locking the development
organization into a state of low capability and high work pressure.
The feedback structure linking manufacturing and product development can be seen in figure 14.
Manufacturing Product Development
Figure 14. Linkages between manufacturing and product development.
The Reinvestment in Manufacturing loop R-M is a high-level representation of the self-reinforcing
feedbacks driving improvement in manufacturing. Given product demand, initial improvement
boosts potential manufacturing throughput. Fewer resources are needed to meet production
schedules. The extra resources can be dedicated to experimentation and process improvement,
decreasing the level of process problems, further enhancing production capacity and creating even
more slack. An identical structure exists in product development, shown as loop R-PD. The only
difference between the two loops is that the delays between improvement effort and results are
much longer in product development. Manufacturing and product development are linked because
47

D-4684
excess capacity depends on the potential throughput of the manufacturing operation relative to
product demand. Product demand, in turn, is augmented as new products are developed and
introduced to the market.
The self-reinforcing feedbacks coupling manufacturing and product development destabilize the
organization and lead to progressively greater imbalances between production capacity and the
ability to generate demand. In the case of MCT and PDP, rapid progress in manufacturing coupled
with slow improvements in product development enabled the manufacturing organization to
reinvest their initial productivity gains in further improvement, strengthening loop R-M. As plant
utilization fell, management urgently sought ways to utilize the excess capacity created by
successful improvement to prevent morale-shattering lay-offs which would undercut the gains of
MCT. The development organization faced enormous pressure to get new products to market.
Development engineers didn't have time to experiment and improve the process, perversely
slowing the rate of new product introduction and leading to still more pressure. The initial success
in manufacturing led to still more success while simultaneously choking off gains in product
development. Ultimately the self-reinforcing imbalance between manufacturing and product
development led to layoffs in manufacturing.
The positive feedbacks coupling manufacturing and product development highlight the dangers of
successful improvement. Manufacturing, with its shorter cycle times and comparatively low
complexity, has a shorter improvement half life than product development. In addition, TQM and
similar improvement techniques are more highly developed for manufacturing settings than for
product development. In most firms, the quality revolution came first to manufacturing and only
later spread to product development (Cole 1997). Thus quality improvement in most firms is likely
to come earlier and more rapidly in manufacturing. But the more successfully a firm improves
manufacturing, the faster capacity will grow. Unless demand grows rapidly as well, improvement
will create excess capacity, leading to pressure for layoffs. The disruption and loss of morale
caused by downsizing can destroy commitment to further improvement - few people want to work
themselves into the unemployment line (Sterman et al. 1997 and Repenning 1996c and 1996d
provide theory and examples). However, the linkages between manufacturing and product
development virtually ensure that excess capacity will arise: the more successfully manufacturing
improves, the faster excess capacity builds up, speeding further improvement. At the same time
excess capacity creates powerful pressure to develop new products. The time available to redesign
the product development process shrinks further, limiting process improvement, and slowing the
growth of demand. Excess capacity grows further. The more effectively these reinforcing
48

D-4684
feedbacks spin the virtuous cycle of process improvement in manufacturing, the more likely the
same loops will operate as vicious cycles in product development.
5.3 Robust Strategies for Improvement
Thus while the PDP initiative had many of the ingredients for success, unanticipated interactions
between manufacturing and product development prevented the effort from breaking the self-
confirming attribution error dynamics that had thwarted previous efforts. The interaction between
the manufacturing and product development processes is subtle, and could not have easily been
anticipated by management given the organization's structure and the tools available to design
improvement programs. Prior to the dramatic changes in productivity created by the MCT effort,
the organization had been able to bring development and manufacturing capacity into rough balance
through hiring and capital expansion. Manufacturing and product development were effectively
decoupled because each was operating at full capacity with high work pressure. There was little
evidence to indicate the existence of the strong, latent couplings between functions. Further,
improvement initiatives had always been undertaken and managed separately. Independent
management of the programs was a wise strategy given two apparently loosely coupled
organizations each with its own needs, staff, training organization, culture, and history.
Decomposition is a time honored and popular strategy for solving complex problems (Simon
1969). The structure of large organizations is predicated on such a strategy as different functions
are defined and compartmentalized. And decomposition often works. The approach led to the
undeniably successful MCT effort, and while it did not accomplish all its objectives, PDP was also
responsible for at least one important change within the development organization, the widespread
use of CAD/CAM/CAE tools. However, functionally based organizations often optimize the
pieces at the expense of the organization's objectives. The power of the process view, embodied
in techniques like TQM and BPR, lies in the ability to cut across traditional functional boundaries
(Garvin 1995a). The very ability of process improvement techniques to make dramatic
improvements, however, means they can destabilize relationships between processes upon which
other organizational structures and routines are predicated. Structures and routines which slowly
co-evolved to high effectiveness can become dysfunctional as other processes upon which they
depend change faster than they can adapt. Organizational routines far from the locus of
improvement efforts can be invalidated even when they appear to be unrelated to the process being
reengineered.
Successfully improving a process can alter the strength of critical feedback loops created by the
couplings among processes, and different feedback processes can become dominant in the
49

D-4684
redesigned and improved processes. Feedbacks that previously stabilized the organization can be
weakened, while previously dormant loops can become dominant, pushing the organization into
new dynamic regimes for which existing structures, mental models, and experience are ineffective
or even harmful. In the PDP and MCT cases, rapid improvement in manufacturing upset the
balance between manufacturing and product development, leading to a self-reinforcing cycle of
continuous improvement in manufacturing and higher levels of work pressure and worker control
in product development. The result: excess capacity in manufacturing (ultimately leading to some
lay-offs despite high growth in demand), failure to implement many of components of the
promising PDP process, and high levels of work pressure that persist to this day.
The dynamics are not unique to the company discussed here. Sterman et al. (1997) describe the
case of a major semiconductor manufacturer in which rapid improvement in manufacturing
conflicted with long established price-setting routines by rapidly altering the ratio of indirect to
direct costs. The result was substantial short term decline in operating profit and share price,
culminating in the first lay-off in the company's history and the premature end of an otherwise
successful improvement program.
Despite the advantages of the process view, in practice process oriented improvement techniques
are not capable of identifying the multiple, delayed, and non-linear consequences of their use. For
example, TQM is predicated on a static view of the world in which different process problems are
assumed to be separable and, as result, can be attacked independently. Reengineering, with its
reliance on process mapping, is good at identifying unneeded activities, but weak at identifying
latent feedback processes which may only become dominant once the reengineered process is
deployed. There is a clear need to develop robust process improvement and change strategies
which enable managers to understand these complex dynamics and design policies to prevent
harmful side effects of improvement. Such strategies would account for the both the physical and
behavioral aspects of improvement efforts and the interrelationships of the different processes
involved.
Elements of such robust strategies can be found. McPherson (1995) and Krahmer and Oliva
(1996) describe the case of the Network Systems Division of Lucent Technologies (formerly
AT&T), documented as a part of our research, which successfully improved both product
development and manufacturing using strategies very different from those promoted in the PDP
effort. Sitkin, Sutcliffe and Schroeder (1994) propose a contingency theory of improvement that
also may help account for the different physical and organizational structure of manufacturing and
development processes. Repenning (1996c, 1996d) develops the beginnings of such strategies
50

D-4684
through the analysis of game theoretic and behavioral simulation models. Carroll et al. (1997)
discuss a successful effort at the du Pont Corporation to boost maintenance productivity and
equipment reliability using a management flight simulator as the key tool to communicate insights
and develop shared mental models.
6. Conclusion
6.1 SummaryProcess improvement and redesign efforts have both physical and behavioral dimensions but past
scholarly work in this area has focused on one at the expense of the other. In contrast,
practitioners of TQM and re-engineering offer both technical and organizational tools, but provide
no explicit theoretical framework to support their suggestions. The purpose of this paper is to
develop a grounded theory of improvement and redesign that captures both its physical and
organizational dimensions and their interactions. Through the development explicit feedback
models, a representation of both the physical and organizational structures of improvement is
developed.
The failure modes discussed result from an error of attribution made by managers in assessing the
causes of low process throughput. Specifically, if managers attribute low performance to the
attitudes and disposition of employees, they react in a manner that makes such an attribution self-
fulfilling. The dynamic leads to an environment characterized by increasing levels of production
pressure, a high degree of managerial control over the process, and workers who are forced to
make ad hoc, covert changes to the process to achieve their throughput goals. Improvement is
difficult in such an environment since a large portion of the available resources are dedicated to
correction efforts and production pressure prevents the experimentation and adaptation needed for
improvement.
The results from two case studies of process improvement, one successful, the other less so, were
presented to support and explicate the theory. Both processes suffered from the problems
discussed above. In both settings, managers initially attributed the cause of low performance to the
attitudes and dispositions of the work force. They reacted by increasing production pressure and
control, inadvertently worsening the situation they were trying to correct. The successful effort
overcame these difficulties by providing numerous tools that aided managers in understanding the
causes of low process capability at a deeper level. In contrast, in the unsuccessful effort, further
attempts were made to control those who worked within the process. The antagonistic relationship
between managers and process participants was never resolved because the dominant attribution of
51

D-4684
low capability was never challenged; indeed the failure of the program further widened the gulf
between the mental models of the minagers and engineers.
6.2 Implications for Research and Practice
ResearchersThe analysis and conclusions have important implications for researchers. For operations
researchers and management theorists, it suggests that the work of designing better processes
cannot be disentangled from the work of implementing them. A complete theory of process
improvement requires the integration of both operations research and organizational theory.
Models and tools to develop real-world intuition behind these systems proved critical in the
successful initiative, and operations research and management science have much more to
contribute in this area. Early efforts, including the development of simulation games and
management flight simulators, are promising. Participatory simulations were critical in the MCT
effort, and such management flight simulators have proved successful in many applications
(Morecroft and Sterman 1994). For organizational scientists, the analysis suggests that future
studies of organizational change need to explicitly consider the physical environment in which the
change is taking place. Time delays, feedback processes, and interdependencies all play an
important role in determining the outcome of a change effort.
Practitioners
The ideas presented here offer a complementary perspective to many of the ideas advocated by
practitioners. In many ways the PDP effort was more consistent with much of the current thinking
on organizational change and process improvement than was MCT. However, the MCT effort was
substantially more successful. Two key difference account for the different outcomes. First,
while PDP focused on laying out a specific process and creating structures to make participants
adhere to that process, the MCT effort focused on improving managers' and operators'
understanding of the dynamics of the manufacturing system. PDP drew on many of the currently
popular change strategies, but none of these were sufficient to overcome managers' flawed
understanding of the dynamics of the development system. Second, the interaction of the
behavioral processes with the physical structure of product development and with other activities in
the organization created feedback processes which counteracted the intended effects of the
program. Whereas managers often focus on the detail complexity of their organization, it is often
the dynamic complexity that is more daunting. Future change efforts need to be focused on
improving managers' understanding of the feedbacks between the structure and behavior of the
processes they are trying to improve.
__1___1____�__�___________�__
52

D-4684
References
Adams, S. (1996) The Dilbert Principle. New York: Harper Collins.
Arkes, H. R., & Blumer, C. (1985). The psychology of sunk cost. Organizational Behavior andHuman Decision Processes, 35, 124-40.
Brehmer, B., (1992). Dynamic Decision Making: Human Control of Complex Systems, ActaPsychologica, 81,211-241.
Carroll, J., J. Sterman, and A. Markus (1997). Playing the Maintenance Game: How MentalModels Drive Organization Decisions. R. Stern and J. Halpern (eds.) Debating Rationality:Nonrational Elements of Organizational Decision Making. Ithaca, NY, ILR Press.
Chase, R.B. and N.J. Aquilano (1989). Production and Operations Management, Fifth Edition,Homewood, IL. Irwin.
Cole, R. (1997). Market Pressures and Institutional Forces: The Early Years of the QualityMovement. Present at NRC Workshop for Improving Theory and Research on QualityEnhancement in Organizations, May.
de Geus, Arie (1988) "Planning as Learning," Harvard Business Review, March-April, 70-74.
Dean, J. W. and D. Bowen (1994). "Management Theory and Total Quality: Improving Researchand Practice Through Theory Development, Academy of Management Review, 19(3): 392-418.
Deming, W. E. (1986). Out of the Crisis. Cambridge: MIT Center for Advanced EngineeringStudy, Cambridge, MA.
Diehl, E. and J.D. Sterman (1995). Effects of Feedback Complexity on Dynamic DecisionMaking, Organizational Behavior and Human Decision Processes, 62(2): 198-215.
Easton, G. and S. Jarrell (1995). 'The Effects of Total Quality Management on CorporatePerformance: An Empirical Investigation'. Working Paper, University of Chicago, Chicago,Illinois, 60637.
Einhorn, H. J. & R. M. Hogarth (1985). Ambiguity and uncertainty in probabilistic inference,Psychological Review, 92, 433-461.
Einhorn, H. J., & Hogarth, R. M. (1986). Judging probable cause. Psychological Bulletin, 99(1),3-19.
Eisenhardt, K.M. (1989). Building Theories from Case Study Research, Academy of ManagementReview, Vol. 14, No. 4, 532-550.
Ernst and Young (1991). 'International Quality Study - Top Line Findings' and "InternationalQuality Study - Best Practices Report" Ernst and Young/American Quality Foundation,Milwaukee, WI.
Forrester, J. W. (1961). Industrial Dynamics. Cambridge, MA: The MIT Press.
Funke, J. (1991). Solving Complex Problems: Exploration and Control of Complex Systems, inR. Sternberg and P. Frensch (eds.), Complex Problem Solving: Principles and Mechanisms.Hillsdale, NJ: Lawrence Erlbaum Associates.
Garvin, D. A. (1988) Managing Quality. New York: The Free Press.
Garvin, D. (1995a). The Process of Organization and Management. Working Paper #94-084,Harvard Business School, Boston MA 02163.
Garvin, D. (1995b). Leveraging Processes for Strategic Advantage, Harvard Business Review,September-October, pp. 77-90.
53

D-4684 54
General Accounting Office (1991). 'US companies improve performance through quality efforts'.GAO/NSIAD-9-190 (2 May). -
Giddens, A. (1993). New Rules of Sociological Method. 2nd Edition. Stanford, CA: StanfordUniversity Press.
Giddens, A. (1984). The Constitution of Society: Outline of the Theory of Structure. Berkeley,CA: University of California Press.
Goldratt, E. M. and J. Cox (1986). The Goal: A Process of Ongoing Improvement (revisededition). Croton on Hudson, NY: North River Press.
Hackman, J. and R. Wageman (1995). Total Quality Management: Empirical, Conceptual, andPractical Issues, Administrative Science Quarterly, 40: 309-342.
Hammer, H. and J. Champy (1993). Re-engineering the Corporation. New York, NY: HarperCollins.
Hendricks, K.B., and V.R. Singhal (1996). Quality Awards and the Market Value of the Firm: AnEmpirical Investigation, Management Science. 42(3), 415-436.
Hogarth, R. M. (1987). Judgment and Choice: The Psychology of Decision (2nd ed.). New York:Wiley.
Huber, G.P. and W.H. Glick (1993), Organizational Change and Redesign: Ideas and Insights forImproving Performance. New York, Oxford University Press.
Ishikawa, K. (1985) What is Total Quality Control? Englewood Cliffs, NJ: Prentice Hall.
Kahneman, D., Slovic, P., & Tversky, A. (Ed.). (1982). Judgment under uncertainty: Heuristicsand biases. Cambridge: Cambridge Univ. Press.
Kanter, R.M., T.D. Jick, and R.A. Stein (1992). The Challenge of Organizational Change. NewYork, Free Press.
Kaplan, R. (1990a). Analog Devices: The Half-Life System, Case 9-191-061, Harvard BusinessSchool.
Kaplan, R. (1990b). Analog Devices: The Half-Life System, Teaching Note 5-191-103, HarvardBusiness School.
Krahmer, E. & R. Oliva (1996). Improving Product Development Interval at AT&T MerrimackValley Works. Case history available from authors, MIT Sloan School of Management,Cambridge, MA 02142.
Lyneis, J. M. (1980). Corporate Planning and Policy Design. Cambridge, MA: ProductivityPress.
March, J. G. and H. A. Simon (1958/1993) Organizations. 2nd ed. Oxford: Blackwell.
Mass, N. J. (1975) Economic Cycles: An Analysis of Underlying Causes. Cambridge, MA: TheMIT Press.
Mausch, M. (1985). Vicious Cycles in Organizations, Administrative Science Quarterly, 30:14-33.
McPherson, A. (1995). Total Quality Management at AT&T. Unpublished MS Thesis, MIT SloanSchool of Management.
Morecroft, J. and J. Sterman (eds) (1994). Modeling for Learning Organizations. Portland, OR:Productivity Press.
Orlikowski, W.J. (1992). The Duality of Technology: Rethinking the Concept of Technology inOrganizations, Organization Science, Vol. 3, No. 3.

D-4684
Orlikowski, W.J. (1994). Improvising Organizational Transformation over Time: A SituatedChange Perspective, forthcoming in Information Systems Research.
Orlikowski, W.J. (1995). Action and Artifact: The Structuring of Technologies in Use. MITSloan School of Management Working Paper WP 3867-95.
Orlikowski, W.J. and M.J. Tyre (1994). Windows of Opportunity: Temporal Patterns ofTechnological Adaptation, Organization Science, 5, 1:98-118.
Paich, M. and Sterman, J. (1993). Boom, Bust, and Failures to Learn in Experimental Markets.Management Science, 39(12), 1439-1458.
Plous, S. (1993). The Psychology of Judgment and Decision Making, New York, McGraw-Hill.
Repenning, N. (1996a). Reducing Manufacturing Cycle Time at Ford Electronics, Case Studyavailable from author, MIT Sloan School of Management, Cambridge MA 02142.
Repenning, N. (1996b). Reducing Product Development Time at Ford Electronics, Case Studyavailable from author, MIT Sloan School of Management, Cambridge MA 02142.
Repenning, N. (1996c). Agency Problems in Process Improvement Efforts. Working Paperavailable from author, MIT Sloan School of Management, Cambridge MA 02142.
Repenning, N. (1996d). Modeling the Failure of Productivity Improvement Programs. WorkingPaper available from author, MIT Sloan School of Management, Cambridge MA 02142.
Richardson, G. P. (1991). Feedback Thought in Social Science and Systems Theory.Philadelphia: University of Pennsylvania Press.
Richardson, G. P. and Alexander Pugh (1981). Introduction to System Dynamics Modeling withDYNAMO. Cambridge: MIT Press.
Ross, L. 1977. The intuitive psychologist and his shortcomings: Distortions in the attributionprocess. In L. Berkowitz (ed.), Advances in experimental social psychology, vol. 10. NewYork: Academic Press.
Shewhart, W. (1939) Statistical method from the viewpoint of quality control. Washington, DC:US Department of Agriculture.
Schneiderman, A. (1988) Setting Quality Goals, Quality Progress. April, 55-57.
Simon, H.A.(1969). The Sciences of the Artificial. Cambridge, MA: The MIT Press.
Sitkin, S., K. Sutcliffe, and R. Schroeder (1994). Distinguishing Control from Learning in TotalQuality Management: A Contingency Perspective, Academy of Management Review, Vol. 19,No. 3:537-564.
Stata, R. (1989). "Organizational Learning: The Key to Management Innovation," SloanManagement Review, 30(3), Spring, 63-74.
Staw, B. M. (1976). Knee-deep in the big muddy: A study of escalating commitment to a chosencourse of action. Organizational Behavior and Human Performance, 16, 27-44.
Staw, B. M. (1981). The escalation of commitment to a course of action. Academy ofManagement Review, 6, 577-587.
Sterman, J.D. (1994). "Learning in and about Complex Systems", System Dynamics Review,Vol. 10., No. 2-3:291-330.
Sterman, J. D. (1989a). Misperceptions of Feedback in Dynamic Decision Making. OrganizationalBehavior and Human Decision Processes 43 (3): 301-335.
Sterman, J. D. (1989b). Modeling Managerial Behavior: Misperceptions of Feedback in a DynamicDecision Making Experiment. Management Science 35 (3): 321-339.
55
D-4684
Sterman, J., N. Repenning, and F. Kofman (1997). Unanticipated Side Effects of SuccessfulQuality Programs: Exploring a Paradox of Organizational Improvement. Management Science,
Taylor, S. E. and S. T. Fiske (1975) Point of view and perceptions of causality. Journal ofPersonality and Social Psychology. 32, 439-445.
Thaler, R. (1980). Towards a positive theory of consumer choice. Journal of Economic Behaviorand Organization, 1, 39-60.
Van de Ven, A., and M.S. Poole (1995). Explaining Development and Change and Organizations,Academy of Management Review, Vol. 20, No. 3, 510-540.
Weick, K.E. (1979). The Social Psychology of Organizing, Second Edition, New York, RandomHouse.
Weick, K. E. (1993). "Organizational Redesign as Improvisation" in Huber, G.P. and W.H.Glick (eds.) Organizational Change and Redesign., New York, Oxford University Press.
White, J.B. (1996). "Re-Engineering Gurus Take Steps to Remodel Their Stalling Vehicles",Wall Street Journal, 26 November, 1.
Wruck, K.H., and M.C. Jensen (1994). 'Science, Specific Knowledge, and Total QualityManagement', Journal of Accounting and Economics, 18, 247-287.
Wynne, B. (1988). "Unruly Technology: Practical Rules, Impractical Discourse and PublicUnderstanding", Social Studies of Science, 18, 147-167.
56