getting up to speed on the financial crisis: a one...
TRANSCRIPT
Getting up to Speed on the Financial Crisis: A One‐Weekend‐Reader’s Guide
Gary Gorton, Yale and NBER
Andrew Metrick, Yale and NBER
January 11, 2012
Abstract
All economists should be conversant with “what happened?” during the financial crisis of 2007‐2009.
We select and summarize 16 documents, including academic papers and reports from regulatory and
international agencies. This reading list covers the key facts and mechanisms in the build‐up of risk, the
panics in short‐term‐debt markets, the policy reactions, and the real effects of the financial crisis.
Thanks to Janet Currie (the editor) and Patrick McCabe for helpful comments, and to Jeanne Helene Gobat, Campbell Harvey, Arvind Krishnamurthy, Nellie Liang, Patrick McCabe, Zoltan Pozsar, Carmen Reinhart, Kenneth Rogoff, and Alan Taylor for assistance with the figures.

1
1. Introduction
The first financial crisis of the 21st century has not yet ended, but the wave of research on the crisis has
already exceeded any single reader’s capacity, with the pace of new work only making this task harder.
Many professional economists now find themselves answering questions from their students, friends,
and relatives on topics that did not seem at all central until a few years ago, and we are collectively
scrambling to catch up.
This article is intended to serve as a starting point for economists who want to get up to speed on the
literature of the crisis, without having to go into a cave and read for a whole year. To this end, the
reading list is restricted to 16 documents, a list that an ambitious reader could cover in one weekend or
at a more leisurely pace over a few weeks. Thus, this article is not a complete survey in any shape or
form, and many interesting papers have been omitted. The coverage is from 2007 to 2009, and while
the scope is global during this time period, it does not include any papers or discussion about the still
ongoing Euro‐currency and sovereign‐debt crisis. The list is also confined to readings with significant
empirical content, as we hope that this collection can at least answer the “what happened?” question
about the crisis, even if the “why?” is not yet settled. In addition to a good number of papers from top
journals, the final collection includes several reports from international agencies, a speech and a
congressional testimony from Chairman Bernanke, and several as‐yet‐unpublished papers. We have
tried hard to avoid repetition, and on several occasions chose one paper among several worthy
contenders on the same topic. Thus, this is an unusual paper for the Journal of Economic Literature in
that citations and the reference list include only the 16 documents covered in the review.
The proposed reading list and article are divided into eight sections. Following this introduction, Section
2 provides an overview and timeline of the crisis, with suggested readings that cover that same broad
range. The three documents in that section can be thought of as an even briefer reading list, for people
who only have an afternoon to spend on the project: 2010 testimony from Ben Bernanke in front of the
Financial Inquiry Crisis Commission, and report chapters from the International Monetary Fund (2010)
and Bank for International Settlements (2009) containing overviews of different aspects of the crisis.
Section 3 gives a historical perspective on financial crises, which we believe crucial for understanding the
recent one. The two papers covered here, Reinhart and Rogoff (2011) and Schularick and Taylor (2012),
are the products of Herculean data collection efforts on long historical time series about government
and private debt. Both of these papers demonstrate the strong association between accelerations in

2
economy‐wide leverage and subsequent banking crises. That finding deserves emphasis as the main
empirical fact about historical predicates to financial crises.
Section 4 covers the build‐up to the crisis. In retrospect, the experience of the 2000s looks ominously
like the prelude to other large crises. Pozsar (2011) documents the important role played by
“institutional cash pools”, which grew rapidly in the decade before the crisis. These pools, with a scale
unique to history, created a large demand for safe and liquid short‐term debt, a demand met in part by
securitization and other financial innovations. Bernanke (2005) foreshadowed some dynamics of the
crisis when describing and naming the “global savings glut”. The resulting growth in sovereign‐wealth
funds, a new institution of the 21st century, also added to the demand for short‐term debt. By 2007,
system‐wide leverage had reached critical levels, but the historical aggregate‐credit data necessary for
“early‐warning” models would not be built until after the damage was done. Coincident with the
increase in leverage was a large run‐up in housing prices. While historical cross‐country data on housing
prices is not as comprehensive as the data on credit aggregates, Reinhart and Rogoff (2008) find sharp
increases in housing prices prior to the five largest financial crises of recent history, with the previous
decade in the United States comparable (or worse) than those previous crises. Case and Shiller (2003),
in a remarkably prescient paper, provide evidence that the United States was already experiencing a
housing bubble well before the crisis began.
Section 5 discusses three papers about the two “panic” phases of the crisis – August 2007 and
September‐October 2008 – between which the crisis expanded from a relatively narrow slice of financial
markets focused on subprime mortgages into a broad‐based run on many types of short‐term debt. The
three papers in this section focus on three different components of short‐term funding markets: Covitz,
Liang, and Suarez (2011) on asset‐backed commercial paper, McCabe (2010) on money‐market mutual
funds, and Gorton and Metrick (2012) on repurchase agreements and securitization. The combination
of these three papers provides a narrative of contagion where each step drains the banking system of
hundreds of billions of dollars and induces higher risk premia for banks to replace those funds.
Section 6 analyzes the various government responses, where opinion remains divided between views of
government as savior or culprit. There are now many papers focusing on specific policy actions, but few
comprehensive surveys. We chose Chapter III of the IMF’s Financial Stability Report of October 2009,
which includes a taxonomy and analyses of policy actions across 13 countries from 2007 to 2009. The
report finds a few bright spots for policy, with actions to support the liquidity of short‐term debt
markets most effective during the pre‐Lehman period of the crisis (before September 2008), and capital

3
injections into banks most effective in the post‐Lehman period.
For some economists, the financial crisis only becomes interesting if it has effects for the real economy,
a topic discussed in Section 7. To measure such effects, it is important to distinguish between shocks to
credit supply (where a direct line can be drawn to the crisis) and to credit demand (which may have
other causes). The papers in this section all attack this problem in creative ways and present persuasive
evidence of the channel from financial shocks to real activity. Scharfstein and Ivashina (2010) analyze
the syndicated loan market in the United States and find that decreases in lending were related to a
banks’ reliance on short‐term funding and by indirect exposure to a Lehman bankruptcy shock. Puri,
Rocholl, and Steffen (2012) exploit differential exposures of German banks to subprime securities and
find that shocks to credit supply reduced the propensity to make consumer loans. Campello, Graham,
and Harvey (2010) use detailed survey evidence to show that firms with credit constraints pulled back
on investment.
Section 8 concludes the paper.
2. Overview and Timeline of the Crisis
The Financial Crisis of 2007‐2009 began in early August with runs in several short‐term markets formerly
considered “safe”. As Ben Bernanke (2010) put it: “Should the safety of their investments come into
question, it is easier and safer to withdraw funds—‘run on the bank’—than to invest time and resources
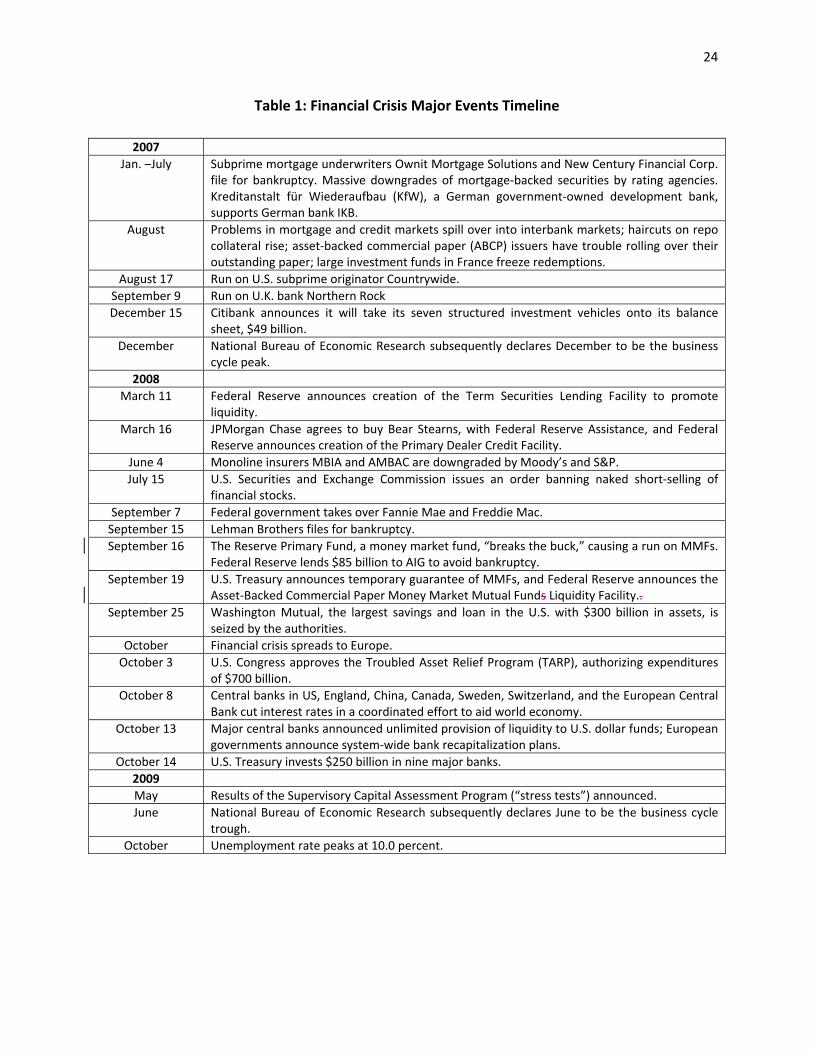
to evaluate in detail whether their investment is, in fact, safe” (p. 3). Table 1 is an abbreviated timeline
of the major events of the crisis. The crisis had been building for some time before August: During the
first half of 2007 problems in the subprime market became increasingly visible and included the failure
of several subprime originators. And even before that there was a credit boom, steeply rising home
prices, and global imbalances in foreign trade.
In this section we will briefly provide an overview of the crisis, focused on three documents. The first is
Ben Bernanke’s testimony before the Financial Crisis Inquiry Commission, September 2, 2010. Bernanke
provides a lucid overview of the crisis, the causes, the policy responses, and the ongoing issues. The
second is Chapter II from the International Monetary Fund’s (IMF) Financial Stability Report (2010),
“Systemic Liquidity Risk: Improving the Resilience of Financial Institutions and Markets.” Finally, the
third is Chapter II of the Bank for International Settlements (BIS) 79th Annual Report, “The Global
Financial Crisis.” From just these three items, a clear picture of the crisis emerges.

4
Bernanke makes several important points in developing the idea that the crisis was a like an old‐
fashioned run. First, he distinguishes between triggers and vulnerabilities. Losses on subprime
mortgages, or more accurately, the prospect of such losses, after house prices started to decline, were a
trigger for the crisis. But, they cannot explain the crisis. As Bernanke puts it, “. . . judged in relation to
the size of global financial markets, prospective subprime losses were clearly not large enough on their
own to account for the magnitude of the crisis” (p. 2). Somehow the prospective losses had to be
amplified to generate the crisis.
A second point that Bernanke makes is that the systemic vulnerabilities in large part were due to
changes that had occurred in the financial sector of the economy. The financial crisis was a bank run, but
in sectors of the money markets where financial institutions provided bank‐like debt products to
institutional investors. These financial institutions were mostly shadow banks. Bernanke (2010, p. 4):
Shadow banks are financial entities other than regulated depository institutions
(commercial banks, thrifts, and credit unions) that serve as intermediaries to channel
savings into investment … Before the crisis, the shadow banking system had come to
play a major role in global finance; with hindsight, we can see that shadow banking was
also the source of key vulnerabilities. (p. 4; emphasis in original)
The main vulnerability was short‐term debt, mostly repurchase agreements and commercial paper.
These markets had grown enormously. Bernanke notes that “repo liabilities of U.S. broker dealers
increased 2 ½ times in the four years before the crisis” (p. 5). And, the IMF also notes that “The repo
market has represented the fastest growing component of the wholesale funding markets. . . “ (p. 64).
Not only were these markets large, but they were unregulated, as both Bernanke and the IMF point out.
A repo transaction is a collateralized deposit in a “bank,” as follows. The depositor or lender puts
money in the bank for a short‐term, usually overnight. The bank promises to pay the overnight repo
rate on the deposited money. To ensure the safety of the deposit, the bank provides collateral that the
depositor takes possession of. Depositors are large institutional investors, money market funds, non‐
financial firms, states or municipalities, and other large investors. The size of their deposits is too big for
an insured account at a bank, and hence the need for collateral to try to protect the deposit. If the bank
fails, then the depositor can sell the collateral to recover the value of the deposit. If the deposit is $100

5
million and the collateral has a market value of $100 million, then there is said to be no “haircut” on the
collateral. If the deposit is $90 million, and the collateral is $100 million, then there is said to be a 10
percent haircut. The IMF (2010, p. 71, 73) discusses some details about how the repo market works.
Though not a subject of academic research (prior to the crisis), the repo market is not a small, esoteric,
market. IMF (2010) estimates total outstanding repo in U.S. markets at between 20 and 30 percent of
U.S. GDP in each of the years from 2002 to 2007. Their estimates for the European Union are even
higher, with a low of 30 percent and a peak just above 50 percent of E.U. GDP during the same time
period. While these measurements are imprecise, it is clear that the repo market is sizeable in the
advanced economies.
It was not only in the United States that there were problems of this sort. Disruptions in the U.S. short‐
term debt markets created a shortage of U.S. dollars in global markets. IMF (p. 61): “U.S. dollar funding
was required especially by banks in Europe (e.g., Dutch, German, Swiss, and U.K. banks), but also by
banks in Korea, to roll over short‐term funding of longer‐term U.S. dollar assets. The shortage in U.S.
dollars also affected the foreign exchange swap market, with the U.S. dollar being used as the main
swap currency for cross‐currency funding.”
The bankruptcy filing of Lehman Brothers in September 2008 (see the Timeline) enormously
exacerbated the situation. The BIS summarizes what happened:
The tipping point came on Monday 15 September, when Lehman Brothers Holdings Inc.
filed for Chapter 11 bankruptcy protection: what many had hoped would be merely a
year of manageable market turmoil then escalated into a full‐fledged global crisis.
Suddenly, with markets increasingly in disarray, a growing number of financial
institutions were facing the risk of default. The resulting crisis of confidence quickly
spread across markets and countries . . . (p. 23).
Most importantly, the failure of Lehman led to a run on money market mutual funds after one large
fund “broke the buck” (see IMF, p. 65 ff; BIS, p. 25‐26). The U.S. Treasury then announced a temporary
guarantee of money market mutual funds. Confidence in the stability of the financial systems in the U.S.
and Europe was lost. The resulting turmoil led to banks hoarding liquidity, and this will play an important
role in transmitting the crisis to the real sector and internationally. In this way, the prospective losses in

6
the subprime market were amplified. Bernanke: “Ultimately, the disruptions to a range of financial
markets and institutions proved far more damaging than the subprime losses themselves” (2010; p. 3).
Central banks engaged in unprecedented interventions and the U.S. Congress eventually passed the
Troubled Asset Relief Program (TARP). On October 8, 2008 there was a coordinated reduction in policy
rates by six major central banks; see BIS, p. 30. But, this was not the end. As the BIS explained:
Although the global crisis of confidence had come to an end, policy action continued on
an international scale as governments sought to support market functioning and to
cushion the blow of rapid economic contraction. Even so, with many details unspecified,
questions about the design, impact and consistency of these measures remained. As a
result, financial markets were roiled by increasingly dire macroeconomic data releases
and earnings reports, punctuated by short‐lived period of optimism–often in response
to the announcement of further government interventions. (p. 31).
Eventually, there were signs of stabilization, from mid‐March 2009; see BIS, p. 34 ff. But, the real effects
have persisted.
3. Historical Background
The recent crisis is often described as being the worst global crisis since the Great Depression, and the
evidence supports this label. But the gap between crises of this magnitude means we must look towards
long historical time series to gain perspective on patterns of global crises. We are fortunate that several
teams embarked upon massive data‐gathering projects prior to this crisis, so that some of their results
are available now to give us that necessary perspective. In this section, we review two important
contributions to this literature: Reinhart and Rogoff (2011) and Schularick and Taylor (2012). Both
papers identify accelerations in debt as the key antecedent to banking crises, with Reinhart and Rogoff
focusing on public and private debt and Schularick and Taylor on the structure of banking sector. Both
sets of authors have developed important new data series to enable their analyses, and both provide a
rich collection of historical details that make their papers worthy of close reading.
Reinhart and Rogoff define a banking crisis by the existence of one of two types of events: “(1) bank runs
that lead to the closure, merging, or takeover by the public sector of one or more financial institutions;
or (2) if there are no runs, the closure, merging, takeover, or large‐scale government assistance of an
important financial institution (or group of institutions), that marks the start of a string of similar
7
outcomes for other financial institutions.” Using this definition, the historical “incidence of banking
crises is about the same for advanced economies as for emerging markets”, and while this incidence has
been lower since World War II, as of their writing only Portugal had been spared in that interval.
They find several interesting results. First, external debt increases sharply in advance of banking crises.
Second, banking crises tend to lead sovereign‐debt crises. In fact, not only does external debt rise
sharply, but so does domestic government debt – a new data series built by the authors for their
analysis. The second finding – that banking crises lead sovereign debt crises – is also supported by a VAR
analysis. Although the direction of causality cannot be conclusively determined from such analyses, the
consistent findings across many different countries and time periods suggests that banking crises play an
important accelerator role in broader debt crises.
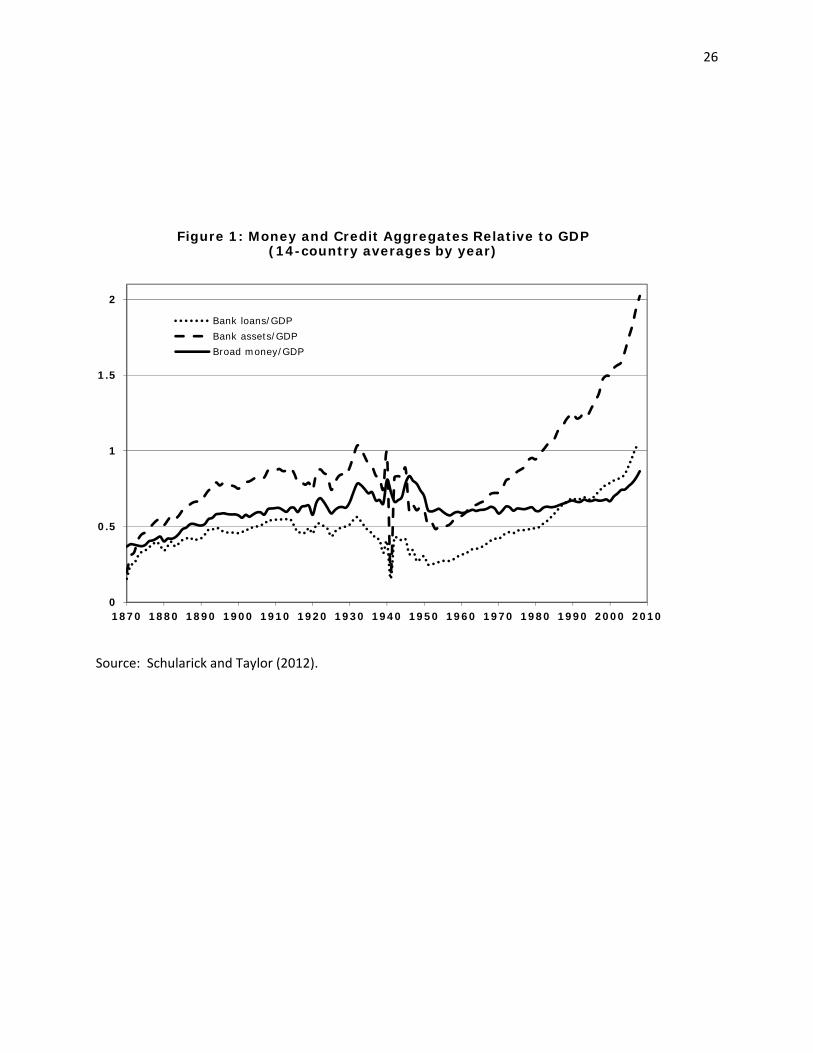
Schularick and Taylor (2012) provide another important historical perspective, analyzing the relationship
of financial crises with overall credit growth in the economy. They begin by building a 140‐year panel
data set for 14 (currently) developed countries. The main novelty of their data set is the construction of
credit and bank‐asset series for each country, where aggregate credit is defined as the total amount of
bank loans outstanding, and bank assets are defined as the sum of the balance‐sheet assets for all
banks. These “new” measures can then be compared to broad money aggregates (M2 or M3), which
have long been available for most countries.
The basic time series of credit, assets, and broad money compared to GDP is shown in Figure 1, taken
from their paper. Prior to the Great Depression, all three money and credit aggregates have a stable
relationship with GDP. All three increase sharply just before the depression and then collapse in its
aftermath. As pointed out by the authors, prior to 1950 the stability of these series would be consistent
with the monetarist view, and would not suggest any need to analyze broader credit aggregates.
Things get more interesting in the post‐WWII period, when both bank loans and bank assets begin to
steadily increase relative to GDP, while the ratio of GDP to broad money remained stable. This striking
change – unknown until their work – is described by the authors as heralding a “second financial era”
where “credit itself then started to decouple from broad money and grew rapidly, via a combination of
increased leverage and augmented funding via the nonmonetary liabilities of banks.”
Their paper goes on to explore the impact of this change on the incidence and severity of financial
crises. Their analysis adopts an “early‐warning signal” approach that is standard in this literature, where
macro variables are used to predict the onset of a crisis. While this early‐warning approach has been

8
used extensively on emerging markets for the post‐1970 period, only the data collection efforts of these
authors allow for an extension to a longer time series while including credit aggregates as regressors.
The results show that changes in credit supply (bank loans) are a strong predictor of financial crises,
particularly when these changes are accelerating, an echo of the findings in Reinhart and Rogoff for
external debt. Furthermore, broad money aggregates do not have the same predictive power,
particularly in the post‐WW II period. This finding motivates the title of their paper and their description
of financial crises as “Credit Booms Gone Bust”.
Reinhart and Rogoff (2011) and Schularick and Taylor (2012) provide a consistent picture of the run‐up
to a financial crisis: an acceleration of debt from both governments and financial intermediaries are the
most important antecedents.
4. The Crisis Build‐Up
On the build‐up to the crisis, we review four documents, two that were written before the crisis, but are
quite prescient.
The four are “Institutional Cash Pools and the Triffin Dilemma of the U.S. Banking System,” by Zoltan
Pozsar (2011); Ben Bernanke’s 2005 Sandridge Lecture, “The Global Savings Glut and the U.S. Current
Account Deficit;” “Is There a Bubble in the Housing Market,” by Karl Case and Robert Shiller (2003); and
Carmen Reinhart and Kenneth Rogoff’s 2008 paper “Is the 2007 U.S. Sub‐Prime Financial Crisis so
Different? An International Historical Comparison.”
As discussed in the previous section, crises are often preceded by credit booms. In the case of the U.S.
in the recent crisis, the credit boom took the form of an increase the issuance of asset‐backed securities,
particularly mortgage‐backed securities. This is related to the development and functioning of the
shadow banking system. The growth in the shadow banking system was the outcome of several forces.
The traditional banking model became less profitable in the face of competition from money market
mutual funds and junk bonds. Securitization, the sale of loan pools to special purpose vehicles that
finance the purchase of the loan pools via issuance of asset‐backed securities in the capital markets, was
an important response. Figure 2 shows the growth of U.S. private‐label securitization issuance during
2000‐2010:Q1. Although securitization began in the 1990s, the figure makes clear the explosive growth
in the six or seven years before the crisis, a growth consistent with the notion of a credit boom. Over
the period portrayed in the figure, the private‐label securitization market grew from under $500 billion
in issuance to over $2 trillion in issuance in 2006, the year before the crisis.

9
Securitization is off‐balance sheet financing for banks and other financial intermediaries. But, if these
intermediaries are not going to finance these loan pools on balance sheet, who is going to buy the asset‐
backed securities? Pozsar describes institutional cash pools: “. . . they are large (typically at least $1
billion in size) and centrally managed. The central management of cash pools refers to the aggregation
(or pooling) of cash balances from all subsidiaries worldwide in the case of global corporations, or all
funds (including mutual and hedge funds and separate accounts) in the case of asset managers.
Furthermore, the investment decisions that pertain to pooled balances are performed by a single
decision maker (typically a treasurer) and through a fund that is a single legal person, but one that
manages the cash balances of many legal persons” (p. 5; emphasis in original). Pozsar documents a
striking rise in the funds managed by these pools, from about $200 million in 1990 to nearly $4 trillion
on the eve of the crisis.
The key point about the growth of institutional cash pools is that they have an associated demand for
liquidity; in particular, they have a demand for insured deposit alternatives (Pozsar’s terminology). The
amounts of money that they wanted to allocated to “safe” asset classes far exceeded the amount that
could be insured in a demand deposit account. The problem was that there were not enough safe
assets, U.S. Treasuries, for the pools to hold. Pozsar estimates “that between 2003 and 2008,
institutional cash pools’ demand for insured deposit alternatives exceeded the outstanding amount of
short‐term government guaranteed instruments not held by foreign official investors by a cumulative of
at least $1.5 trillion; the ‘shadow’ banking system rose to fill this gap” (p. 3; emphasis in original).
Foreign official investors hold large amounts of U.S. Treasuries. And this is where the effects of the
current account imbalance may have played a role. Bernanke (2005): “If a country’s saving exceeds its
investment during a particular year, the difference represents excess saving that can be lent on
international capital markets. By the same token, if a country’s saving is less than the amount required
to finance domestic investment, the country can close the gap by borrowing from abroad. In the United
States, national saving is currently quite low and falls considerably short of U.S. capital investment. Of
necessity, this shortfall is made up by foreign net borrowing‐ ‐ ‐“ (p. 3). There were large and persistent
capital inflows from foreigners seeking U.S. assets as a store of value. It is not so clear why the
foreigners want riskless assets, rather than, say, buy land and property in the U.S.
With large amounts of U.S. Treasuries held abroad, institutional cash pools had to find substitutes. The
substitutes were of two forms. First, short‐term bank debt‐like products, such as repurchase agreements
and asset‐backed commercial paper provided collateral that substituted for government guarantees.

10
Second, there were indirect holdings of unsecured private money market instruments through money
market mutual funds, where the funds’ asset portfolio was short‐term and globally diversified.
The joining together of the supply of asset‐backed securities with the demand for private alternatives to
insured deposits led to the shadow banking system, a genuine banking system providing products with a
convenience yield, short‐term debt of intermediaries, often based on privately‐produced collateral.
Historically, for the private production of high quality asset‐backed securities, mortgages have been the
preferred collateral. The increase in the production of asset‐backed securities appears to be a credit
boom. In credit booms, households and firms are borrowing money. What are they doing with this
money? One possibility is that they are buying houses. Credit booms seem to often coincide with house
price increases. The causality is not clear. Is it that financial intermediaries lower their lending standards
and fuel house price increases? Or, are house prices going up (for some other reason) and
intermediaries are willing to lend against collateral that is then more valuable? This is an area for future
research.
House prices were rising during the credit boom. Karl Case and Robert Shiller documented the house
price increases in 2003. As the title of their article suggests, their main question concerns the nature of
the house price increases: Is it a bubble? As they point out, “. . . the mere fact of rapid price increases is
not in itself conclusive evidence of a bubble” (p. 300). They think of a bubble as “a situation in which
excessive public expectations of future price increases cause prices to be temporarily elevated” (p. 299).
How do we determine if expectations of large future price increases can account for price increases
today? Case and Shiller examine two kinds of evidence to suggest that “fundamentals” cannot account
for the price increases. They first examine U.S. state data on home prices and fundamentals, such as
income and employment, over 1985 to 2002, seventy‐one quarters. Secondly, they directly elicit the
views of home buyers based on a survey conducted in 2003 of people who bought homes in 2002 in four
metropolitan areas: Los Angeles, San Francisco, Boston, and Milwaukee. The survey replicates a 1988
survey of the same metropolitan areas. For both analyses, Case and Schiller find evidence broadly
consistent with a bubble. While there is clearly more research to be done on bubbles, keep in mind that
this paper was published in 2003. From the vantage point of hindsight, after the financial crisis and the
very significant decline in house prices, the Case‐Shiller evidence is indeed very provocative.
House price run‐ups prior to crises are common. This is shown by Reinhart and Rogoff (2008). Their
research shows that there are important similarities across crises. They study eighteen bank‐centered

11
financial crises from the post‐War period, including a subset which they call “The Five Big Crises” of
Spain (1977), Norway (1987), Finland (1991), Sweden (1991), and Japan (1992) (starting year in
parenthesis). The Big Five crises occurred in developed economies, and were prolonged events with
large declines in economic performance over extended periods.
Although they examine a number of different series, we focus on the run‐up in housing prices. Figure 3
shows the relationship between real housing prices and banking crises. Date t is the first year of the
financial crisis, and t‐1, t‐2, and so on, to t‐4 indicates the previous four years, and t+1 etc. are the post‐
crisis years. The figure confirms that there was a run‐up in housing prices in the U.S. that, in fact,
exceeded the run up prior to the Big Five.
It is not only house prices, Reinhart and Rogoff further show striking similarities with respect to real
rates of growth in equity price indices, current account balance‐to‐GDP ratios, real GDP growth per
capita, and public debt growth and crises. It is hard to escape the conclusion that the financial crisis of
2007‐2009 was not special, but follows a pattern of build‐ups of fragility that is typical.
5. The Panics
This section discusses papers relating to the two main panic periods of the financial crisis: August 2007
and September‐October 2008. We discuss three papers that each focus on a different component of the
short‐term debt market. Covitz, Liang, and Suarez (2011) analyze runs on the asset‐backed commercial
paper market that began in August 2007, which represented the first major event of the financial crisis.
McCabe (2010) analyzes money market mutual funds (MMFs) and contrasts their behavior in August
2007 (when MMFs largely avoided runs) and in September 2008 (when they did experience runs). An
important link between these two crises worked through the repo market, which weakened
considerably in August 2007, limped along for a year, and then partially collapsed after the failure of
Lehman. Gorton and Metrick (2012) analyze these dynamics and tie them to the changes in unsecured
interbank‐lending markets.
Commercial paper (CP) has been an important security for the financing of industrial firms for many
decades. In the traditional CP market, highly rated firms can quickly issue debt with minimal transactions
costs, and typically cover the risk that investors will suddenly disappear by obtaining a backup line of
credit from a commercial bank. Demand for CP is high enough that financial intermediaries have
increasingly made use of the market to finance long‐term financial assets, in which case the debt is
known as “asset‐backed commercial paper”, or just ABCP. When CP is used this way, financial

12
institutions can bundle mortgages, credit‐card receivables, and other loans into off‐balance‐sheet
vehicles. Like the related structure of securitization, such vehicles can be more transparent than full
bank balance sheets, which can then enable lower funding costs. More cynically, such vehicles can be
used to move assets off balance sheets in name only, allowing banks to save on regulatory capital.
Whatever the reason, by July 2007 there was approximately $1.2 trillion of ABCP outstanding. With the
majority of this paper held by MMFs, the ABCP market was deeply connected with more familiar parts of
the financial system (Covitz, Liang, and Suarez, 2011).
Covitz, Liang, and Suarez describe the unraveling of this market in great detail, drawing the analogy
between a “run” on an ABCP program and a traditional bank run. Conceptually, an ABCP program would
suffer a “run” if lenders – equivalent to depositors in a bank – are unwilling to refinance CP when it
comes due. Mechanically, the authors define a run as occurring in any week where a program does not
issue any new paper despite having at least ten percent of its CP maturing. If a program is unable to
issue new paper, then it must either rely on backup support from the program sponsor (typically a bank
or group of banks), or it is forced to sell assets.
Figure 4, reproduced from their paper, shows the pattern of runs at ABCP programs during 2007. Here,
the panic in August 2007 is clear. Beginning in the week of August 7, the frequency of runs increased
dramatically, and the likelihood of exiting a run with later issuance fell in tandem. By the end of 2007,
about 40 percent of programs were in a run and unable to finance themselves in their traditional short‐
term markets.
A nice feature of the ABCP data is that it allows for a cross‐sectional analysis on the determinants of
runs. Such analysis is rarely possible for bank runs, since the historical record does not allow for the
same detail as is present in this modern data. This cross‐sectional analysis yields a set of interesting
findings, making this paper a unique contribution to the literature of bank runs, above and beyond its
import for the study of the recent crisis. This analysis shows that programs were more likely to
experience a run if they had high credit risk (from holdings of subprime‐related securities) or high
liquidity risk (from a missing or incomplete liquidity support from the plan sponsor). But, importantly, in
the first few weeks of August, there was also a high level of run activity unrelated to program‐specific
measures. Taken together, the evidence indicates that vulnerability to runs is strongly related to
fundamentals, but it takes some time for investors to figure things out. Even in this market, with
relatively sophisticated investors, the first few weeks could fairly be characterized as a “panic”.
13
Overall, the ABCP market fell by $350 billion in the second half of 2007. Most programs relied on backup
support from their sponsors to cover this shortfall, with a significant impact on the balance sheets of
those sponsors. Some programs made use of contractual options to extend the maturity of their paper,
effectively reducing the returns for their lenders as compared to market rates. To understand the
contagion of the financial crisis, it is necessary to trace these impacts through the system. McCabe
(2010) is the next link in this chain, with a focus on MMFs, a major holder of ABCP and other securities
directly related to the now‐troubled housing sector.
We have earlier mentioned the key role played by the Reserve Primary Fund, a large MMF that “broke
the buck” after the failure of Lehman in September 2008. Less well known are the struggles of MMFs in
the August 2007 panic. As the main holders of ABCP, MMFs saw the values of their stakes decline when
ABCP yields rose for outstanding paper. Furthermore, shrinking ABCP programs were forced to sell their
underlying assets, placing further downward pressure on asset classes held by many MMFs. As a result
of these dynamics, at least 43 MMFs required assistance from their sponsors in order to avoid breaking
the buck. Essentially, these funds were “bailed out” by the banks or fund families that managed them.
McCabe analyses the drivers of these bailouts and find that they were significantly more likely to occur
when the funds held ABCP and when they had previously earned above average yields on their portfolio.
While such sponsor assistance had occurred in earlier stress periods, the scale of intervention in 2007
was unprecedented.
The sponsor‐based rescue of MMFs in 2007 prevented any runs by investors on those funds that year,
but may have also solidified the expectation that MMFs would always be bailed out by their sponsors.
Such expectations add to the belief that MMFs are super‐safe money‐like instruments that require no
due diligence by investors. In that environment, investors can chase the highest‐yielding funds without
any perceived risk. Figure 5, taken from McCabe (2010), illustrates this dynamic.
Panel A of the figure shows the growth of MMFs from 1998 to 2010. Funds are broken into three
categories – Tax‐exempt, government‐only, and prime – where the last category is the least restrictive
on investments and also by far the largest. The total assets of MMFs were over $2 trillion before the
ABCP crisis, after which assets actually rose significantly for both prime and government‐only funds. The
flight‐to‐safety in August 2007 benefitted both types of funds, as investors sought a safe haven from
riskier asset classes. By September 2008, MMF assets had increased more than 50 percent since the
ABCP panic.

14
The Lehman bankruptcy was a major shock to MMFs. The drop from parity of the Reserve Primary Fund
led to a run on similar funds, with Figure 5 showing the sharp outflow from prime MMFs, with an almost
one‐for‐one transfer into government‐only funds. This transfer caused significant disruption in funding
markets. Prime MMFs are a crucial supplier of funds to corporations and to financial intermediaries.
When these investors moved to government‐only MMFs, this liquidity supply was lost from private
credit markets.
Panels B and C of Figure 5 show how Reserve Primary Fund, traditionally a conservative fund, began to
take on more and more risk in the years before the crisis. Prior to 2001, the net yield to investors from
the fund was always below average for prime funds. (McCabe finds no evidence that yield is related to
investment skill in these funds; increases in yield seem driven entirely by increases in risk.) Beginning in
2001, however, relative yields began to creep upwards, and then increased sharply in 2007 and 2008.
For MMFs, an increase in yields attracts new investors, and these new investors tend to be of the
return‐chasing type that are willing to rapidly leave if performance slips. The figure shows that Reserve
Primary’s assets and relative market share rose in tandem with its net yields.
As a holder of Lehman commercial paper, Reserve Primary was unable to maintain its value after the
Lehman bankruptcy. McCabe’s analysis shows that the subsequent runs on MMFs happened
disproportionately at funds that, like Reserve Primary, had high relative yields, had recently attracted
new performance‐sensitive investors, and had riskier financial institutions (as measured by CDS spreads)
as sponsors. The runs only stopped after government action to explicitly guarantee MMFs.
The papers by McCabe and by Covitz, Liang and Suarez are comprehensive analyses of the breakdowns
in two major components of short‐term debt markets, and the linking of ABCP and MMFs helps to show
how contagion in these markets can spread. But there is still a missing piece, because the initial ABCP
panic was driven by a weakness in subprime mortgages, whereas the eventual run on MMFs was
triggered by the bankruptcy of Lehman. Indeed, the MMF market showed that it was capable of
absorbing the ABCP losses – albeit at significant cost. So how did the real losses in mortgages eventually
lead to the much more significant failure of Lehman Brothers and near collapse of the whole financial
system? We argue in Gorton and Metrick (2012) that the repo markets played a key role in this
contagion.
As discussed earlier, repo is the shadow‐banking equivalent of a deposit market. Large institutional
money pools, whose cash holdings far exceed insured deposit limits, can lend short‐term to a financial

15
institution and receive collateral as protection. For every $100 of collateral, an institution can receive
$(100‐x) in loans, with $x representing the “haircut” and 1/x the allowable leverage. Precise estimates
for the total size of the repo market are not available, and imprecise estimates can differ by a lot, but
the order of magnitude is always in the trillions of dollars. The main piece of evidence in Gorton and
Metrick is the rising “haircut index” on various types of repo collateral, as illustrated in Figure 6.
At the beginning of 2007, average haircuts were near zero on most types of collateral, allowing for very
high leverage for holdings of these securities. Haircuts get their first shock at the time of the ABCP
panic, and continue a steady rise throughout the next year. For every trillion dollars in the repo market
for these non‐government assets, each one percent increase in haircuts is equivalent to a $10 billion
withdrawal of liquidity from the system, so a 25 percent rise from July 2007 to the eve of the Lehman
failure represents a large drain. Following the Lehman failure, the index rose by an additional 20
percentage points, including 100 percent haircuts (= no trade at all) for some assets.
It is important to note that haircuts rose – and prices fell – for many assets that had no direct
connection to subprime securities. This is the key step than can allow contagion from one asset class to
the broader market that includes many other types of (seemingly unrelated) short‐term debt. The main
regressions in Gorton and Metrick (2012) show that the value of non‐subprime assets moved closely
with measures of distress in interbank funding markets, and not with an index of default risk on
subprime securities.
How did the decline in subprime securities – a relatively small corner of the financial sector – eventually
lead to the near collapse of global financial institutions many times the size? The papers discussed in
this section trace one important vector of this contagion. First, the subprime failure had a direct effect
on many ABCP programs, with runs that began in August 2007 eventually affecting 40 percent of that
$1.2 trillion market. These runs and related price drops in other subprime‐related securities caused
unprecedented problems for MMFs, where at least 43 funds required support from their sponsors.
After the initial panic of August 2007, interbank markets were slow to recover, with spreads between
secured and unsecured funding remaining at high levels throughout the next year. This pressure also
manifested itself in repo markets, where haircuts grew steadily throughout the year, adding to the
funding pressure on financial intermediaries. When this pressure finally claimed Lehman Brothers as a
victim, the stressed interbank markets nearly collapsed, and only recovered after significant government
intervention. This intervention is discussed in the next section.

16
6. Policy Responses
Beginning in August 2007, governments of all advanced nations took a variety of actions to mitigate the
financial crisis. Given the chaotic environment and the wide variety of interventions, it is unlikely we will
ever have a complete evaluation of these policies. Given that the economics profession is still debating
the efficacy of actions during the Great Depression, it would be a tall order to hope for clarity on our
recent crisis. So our goal here is only to provide an overview of the types of policy actions undertaken,
along with a brief review of the evidence on the short‐term impact of these policies. In addition to the
broad overview provided here, the timeline of the crisis shown in Table 1 includes some of the major
policy actions taken in the United States.
IMF (2009) analyzes the effectiveness of policy responses in 13 developed economies. They divide the
crisis into three periods: Period 1 (“Pre‐Lehman”), from June 1, 2007 to September 15, 2008; Period 2
(“Global Crisis 1”), from September 15, 2008 to December 31, 2008; Period 3 (“Global Crisis 2”), from
January 1, 2009 to June 30, 2009. In each of these three periods, they employ event‐study methodology
to measure the impact of five different kinds of policy actions, each of which was widely used across
many countries in the sample. Table 2, reproduced from the IMF report, summarizes and classifies these
actions.
With this classification as a guide, they identify 153 separate policy actions across their 13 countries. In
the United States alone, they identify 49 actions, covering almost every subtype from Table 2 in each of
the three crisis periods. There are many future PhD dissertations to be written on these interventions,
and the work to date can only scratch the surface. Our only hope at this point is to get some guidance
about short‐term efficacy, and even there we will need to confine ourselves to a narrow set of outcome
measures. The IMF report is an excellent start on this work, using event studies to evaluate the short‐
run impact of each type of policy (listed in Table 2), with results tabulated separately for each crisis
subperiod.
To evaluate the efficacy of interest rate cuts, the IMF looked at the short‐term reaction of both an
“economic stress index” (ESI) and a “financial stress index” (FSI). The ESI is a composite of confidence
measures (business and consumer), credit spreads, and stock prices of nonfinancial companies. The FSI
is a composite of several measures of bank credit, spreads, and stock prices. Central banks in all regions
cut interest rates in all three crisis periods, but the IMF finds no evidence of short‐run impact of interest‐

17
rate cuts on the ESI, and only limited evidence of a positive effect on the FSI. Of course, event studies
will not identify any effects if these changes are anticipated – a major limitation when evaluating central
bank actions. The story is better for liquidity support – the second category in Table 2 – where such
actions often had a significant positive effect on interbank spreads and on the broader FSI measure
during the first (pre‐Lehman) period. In later periods, announcements of liquidity support did not have
reliable effects, either because such announcements were anticipated or because concerns were more
about solvency than liquidity.
To measure the short‐term impacts of other financial sector policies – recapitalizations, liquidity
guarantees, and asset purchases – the IMF looks to both the FSI and to an index of credit default swaps
on domestic banks in the relevant country. Of these types of interventions, recapitalizations are found
to be particularly effective, with significant improvements in an index of bank CDS spreads in almost all
countries during the second and third crisis periods. (There were few recapitalizations in the first
period.) These results are not as strong when the broader FSI is used as the outcome measure, which
may be because the benefits of recapitalizations fall mostly to bondholders. Asset purchases and
liability guarantees also show weaker results, with the exception of notable successes in the U.K.’s asset
protection scheme (announced January 2009) and in the Swiss government’s purchase of UBS assets.
Overall, the evidence suggests that liquidity support – in the forms described in Table 2 – was effective
at calming interbank credit markets in the early stages of the crisis, but not after the fall of Lehman. In
these later stages, capital injections were the most effective policy.
7. Real Effects of the Financial Crisis
The run on short‐term debt created fear across the financial intermediary sector, especially after the
failure of Lehman Brothers. The widespread loss of confidence, concerns about solvency and liquidity of
counterparties, reached the real sector of the economy when intermediaries began to hoard cash and
stop lending. The real effects of the financial crisis were global in nature. In this section we review
three papers that document these phenomena. These papers are “Bank Lending during the Financial
Crisis of 2008,” by Ivashina and Scharfstein (2010); “Global Retail Lending in the Aftermath of the U.S.
Financial Crisis: Distinguishing between Supply and Demand Effects,” by Puri, Rocholl and Steffen (2012);
and “The Real Effects of Financial Constraints: Evidence from a Financial Crisis,” by Campello, Graham,
and Harvey (2010.
18
Ivashina and Scharfstein study the supply of credit during the crisis in order to understand the real
effects of the panic on the corporate sector. They look at syndicated loans, a market which has evolved
over the last thirty years to become the main portal for large corporations to get loans. The market
includes banks, but also a wide range of entities other than regulated commercial banks, such as
investment banks, institutional investors, hedge funds, mutual funds, insurance companies and pension
funds. Their first finding is that “syndicated lending started to fall in mid‐2007, with the fall accelerating
during the banking panic that began in September 2008. Lending volume in the fourth quarter of 2008
(2008:Q4) was 47% lower than it was in the prior quarter and 79% lower than at the peak of the credit
boom (2007:Q2). Lending fell across all types of loans: investment grade and non‐investment grade;
term loans and credit lines; and those used for corporate restructuring as well as those used for general
corporate purposes and working capital” (p. 320).
Syndicated lending fell, but commercial and industrial loans reported by the U.S. regulated banking
sector rose by about $100 billion from September to mid‐October 2008. But, Ivashina and Scharfstein
show that this increase was not due to an increase in new loans. Instead it was corporate borrowers
drawing down existing credit lines, that is, credit lines that had been negotiated prior to the crisis.
To show the effects of the crisis the authors first show that banks that were more vulnerable to a run,
those that were to a greater extent financed by short‐term debt other than insured deposits, cut their
syndicated lending by more. They find that: “A bank with the median deposits‐to‐assets ratio reduced
its monthly number of loan originations by 36% in the period August and December of 2008, relative to
the prior year. However, a bank with a deposits‐to‐assets ratio one standard deviation above the mean
reduced its loan by 49%, while a bank with deposits ratio one standard deviation above the mean
reduced its loan originations lending by only 21%” (p. 320).
It is harder to demonstrate the effects of credit‐line drawdowns on syndicated lending because there
are no data measuring credit‐line drawdowns. The authors consider the possibility that banks in
syndicated credit lines where Lehman Brothers was part of the syndicate might experience larger credit‐
line drawdowns after the failure of Lehman. The idea is that commitments that would otherwise have
been met by the other members of the syndicate would be more likely to be drawn on. They, in fact,
find “that banks that co‐syndicated a large fraction of their credit lines with Lehman reduced their
lending more” (p. 320).

19
An important issue for these findings has to do with the fact that in a recession the demand for credit
falls. To account for the above findings, the fall in demand must also explain why the more vulnerable
banks reduced the lending more than the other banks. But, as the authors point out, this may be the
case. They point to the example of investment banks, which have no demand deposit funding, lending
more for corporate acquisitions. Since corporate acquisitions declined in the recession, perhaps this fall
in demand accounts for the results, rather than the supply of loans. The authors find, however, that the
results continue to hold for commercial banks and for loans that are not used for acquisitions. Their
main conclusion then is that the decline in lending was in large part an effect of reduced bank loan
supply.
The issue of the supply of credit is also the focus of Puri, Rocholl and Steffen (2012) who examine the
effects of the U.S. financial crisis on lending to retail customers in Germany. They are also interested in
whether there are detectable reductions in the supply of credit by banks, even when overall demand is
going down. The setting they study is German savings banks, which operate in defined geographical
areas and are mandated by law to serve only their local customers. In each geographical area there is a
regional bank, a Landesbank, owned by the savings banks in that area. These German Landesbanken
(the regional banks, each in a province) had exposures to U.S. subprime mortgages to varying degrees.
The authors exploit the fact that the Landesbanken suffer to different extents due to their exposures to
U.S. subprime mortgages. Importantly, the savings banks had to guarantee or make equity injections
into some of the stricken Landesbanken. The authors make use of this natural experiment in which
some savings banks faced a shock because their Landesbanken had to be assisted. The authors’
empirical strategy is to look at whether savings banks that are affected at the onset of the crisis
(because their Landesbanken needed help) reduce their lending by more than the (relatively) unaffected
savings banks. The data are especially rich, including the universe of all loan applications and the credit
scores, and information about which applications were granted and which were turned down.
There was an overall decrease in demand for consumer loans, as measured by applications to both
affected and unaffected savings banks. But, with respect to the supply of credit, “the average rejection
rate of affected savings banks is significantly higher than of non‐affected savings banks” (p. 3‐4). The
effect is stronger for mortgages, as compared to consumer loans. If a borrower had a prior relationship
with the savings bank, the effect is mitigated, that is, those customers are less likely to have their
applications rejected compared to new customers. Overall, their evidence is consistent with that of
Ivashina and Scharfstein: banks reduced the supply of credit.

20
What effect did a reduced bank loan supply have on the real economy, on the activities of non‐financial
firms? This brings us to the study of Campello, Graham and Harvey (2010). To answer this question of
effects on non‐financial firms, these authors directly ask 1,050 chief financial officers in 39 countries in
North America, Europe and Asia in December 2008 whether they were financially constrained during the
crisis. Their survey asks about the cost and availability of credit, and about the effects on their decisions
and actions, as well as many other questions. The survey asks whether a firm’s operations are “not
affected,” “somewhat affected,” or “very affected” by the turmoil in the credit markets. Firms that
described themselves as “somewhat affected” or “very affected” were then further probed with
questions concerning the nature of the effects, e.g., higher costs of external funds, limitations on credit.
For U.S. firms, 244 indicated that they were unaffected by credit constraints, 210 indicated that they
were somewhat affected, and 115 said they were very affected (In Europe, the numbers respectively
were 92, 71, and 26; and in Asia, the numbers were 147, 112, and 24).
Figure 7, from Campello, Graham and Harvey (2010), gives a sense of the effects of credit constraints.
The figure shows averages for each type of action for the constrained firms and the unconstrained firms
(“constrained” is only “very affected,” while “unconstrained” is the other two categories). While all
firms cut back on expenditure and dividend payments and see their cash holdings and the number of
employees decline, the constrained firms contract these policies much more, in a very noticeable (and
statistically significant way). For example, unconstrained firms reduce the number of their employees
by 2.7 percent on average, while constrained firms reduce the number of their employees by almost 11
percent.
What are the constraints that firms face? Eighty‐one percent of the very affected firms reported that
they experienced less access to credit; twenty percent cite problems with lines of credit. In other words,
it seems that the reductions in credit that Ivashina and Scharfstein reported in their study of banks
result in the constraints studied by Campello, Graham and Harvey.
The categorization of firms into “constrained” and “unconstrained” may confound a number of factors.
The authors address this problem econometrically by matching constrained firms with an unconstrained
“match” based on size, ownership form, credit rating, profitability, and so on, so that there is a sample
of firms that only differs on the degree of access to credit. Tests based on this approach show the
differential effect of financial constraints on corporate policies. Firms that are constrained show
important differences even before the crisis, and increase very noticeably during the peak of the crisis.

21
The authors also delve into firms’ liquidity management and investment decisions. For example, the
Ivashina and Scharfstein result that there was a run on the banks, by firms drawing down on their credit
lines “just in case,” is confirmed. Thirteen percent of the constrained firms said that they would draw
down on their credit lines now to have cash in the futures. And 17 percent drew down their credit lines
as a precaution, compared to six percent of the unconstrained firms. With respect to investment during
the crisis, 86 percent of constrained U.S. firms reported that they bypassed attractive investments,
compared to 44 percent of unconstrained firms.
Overall, the evidence suggests that banks cut back on credit supply, although the demand for credit also
fell. The resulting reduction in credit supply had significant impacts on credit‐constrained firms.
8. Conclusion
The financial crisis of 2007‐2009 was perhaps the most important economic event since the Great
Depression. All professional economists need a working knowledge of the key details of this crisis. This
paper summarizes these details using 16 papers, reports, and other documents. From these documents,
a narrative emerges that is very similar to historical crises, while cloaked in institutional detail novel to
this century.
One strong similarity to history comes in the acceleration of system‐wide leverage just before the crisis,
the strongest predictor of crises in the past two centuries. Furthermore, the recent crisis was preceded
by rapid increases in housing prices, also a feature of all major crises since World War II. At this macro
level, the pattern (but not the scale) of our crisis is very ordinary.
The crisis was exacerbated by panics in the banking system, where various types of short‐term debt
suddenly became subject to runs. This, also, was a typical part of historical crises. The novelty here was
in the location of runs, which took place mostly in the newly evolving “shadow banking” system,
including money‐market mutual funds, commercial paper, securitized bonds, and repurchase
agreements. This new source of systemic vulnerability came as a surprise to policymakers and
economists, and some knowledge of its details is necessary for understanding the contagion that
eventually spread to the real economy.

22
References
Bank for International Settlements (BIS) (2009), 79th Annual Report (April 1, 2008 – March 31, 2009);
See http://www.bis.org/publ/arpdf/ar2009e2.pdf .
Bernanke, Ben (2005), “The Global Saving Glut and the U.S. Current Account Deficit,” The Sandridge
Lecture, April 14, 2005;
see http://www.federalreserve.gov/boarddocs/speeches/2005/200503102/ .
Bernanke, Ben (2010), “Causes of the Recent Financial and Economic Crisis,” Statement by Ben S.
Bernanke, Chairman, Board of Governors of the Federal Reserve System, before the Financial
Crisis Inquiry Commission, Washington D.C. (September 2, 2010);
see http://www.federalreserve.gov/newsevents/testimony/bernanke20100902a.htm
Campello, Murillo, John R. Graham, and Campbell Harvey (2010), “The Real Effects of Financial
Constraints: Evidence from a Financial Crisis,” Journal of Financial Economics 97, 470‐487.
Case, Karl and Robert Shiller (2003), “Is There a Bubble in the Housing Market?,” Brookings Papers on
Economic Activity 2, 299‐362.
Covitz, Daniel, Nellie Liang, and Gustavo Suarez (2011), “The Evolution of a Financial Crisis: Panic in the
Asset‐Backed Commercial Paper Market,” Federal Reserve Board, Finance and Discussion Series
#2009‐36; see http://www.federalreserve.gov/pubs/feds/2009/200936/200936pap.pdf .
Gorton, Gary and Andrew Metrick (2012), “Securitized Banking and the Run on Repo,” Journal of
Financial Economics, forthcoming.
International Monetary Fund (2009), Navigating the Financial Challenges Ahead (October 2009), Chapter
III; see http://www.imf.org/external/pubs/ft/gfsr/2009/02/index.htm .
International Monetary Fund (2010), Global Financial Stability Report: Sovereigns, Funding, and Systemic
Liquidity (October 2010); see http://www.imf.org/external/pubs/ft/gfsr/2010/02/index.htm .
Ivashina, Victoria and David Scharfstein (2010), “Bank Lending during the Financial Crisis of 2008,”
Journal of Financial Economics 97, 319‐338.

23
McCabe, Patrick (2010), “The Cross Section of Money Market Fund Risks and Financial Crises,” Federal
Reserve Board, Finance and Economics Discussion Series #2010‐51; see
http://www.federalreserve.gov/pubs/feds/2010/201051/201051pap.pdf .
Pozsar, Zoltan (2011), “Institutional Cash Pools and the Triffin Dilemma of the U.S. Banking System,”
International Monetary Fund, working paper #WP/11/190;
see http://www.imf.org/external/pubs/cat/longres.aspx?sk=25155 .
Puri, Manju, Jörg Rocholl and Sascha Steffen (2012); “Global Retail Lending in the Aftermath of the U.S.
Financial Crisis: Distinguishing between Supply and Demand Effects,” Journal of Financial
Economics, forthcoming.
Reinhart, Carmen and Kenneth Rogoff (2008), “Is the 2007 U.S. Subprime Financial Crisis So Different?
An International Comparison,” American Economic Review 98, 339‐344.
Reinhart, Carmen and Kenneth Rogoff (2011), “From Financial Crash to Debt Crisis,” American Economic
Review 101, 1676‐1706.
Schularick, Moritz and Alan M. Taylor (2012), “Credit Booms Gone Bust: Monetary Policy, Leverage
Cycles and Financial Crises, 1870‐2008,” American Economic Review, forthcoming.
24
Table 1: Financial Crisis Major Events Timeline
2007 Jan. –July Subprime mortgage underwriters Ownit Mortgage Solutions and New Century Financial Corp.
file for bankruptcy. Massive downgrades of mortgage‐backed securities by rating agencies. Kreditanstalt für Wiederaufbau (KfW), a German government‐owned development bank, supports German bank IKB.
August Problems in mortgage and credit markets spill over into interbank markets; haircuts on repo collateral rise; asset‐backed commercial paper (ABCP) issuers have trouble rolling over their outstanding paper; large investment funds in France freeze redemptions.
August 17 Run on U.S. subprime originator Countrywide.September 9 Run on U.K. bank Northern RockDecember 15 Citibank announces it will take its seven structured investment vehicles onto its balance
sheet, $49 billion. December National Bureau of Economic Research subsequently declares December to be the business
cycle peak. 2008
March 11 Federal Reserve announces creation of the Term Securities Lending Facility to promote liquidity.
March 16 JPMorgan Chase agrees to buy Bear Stearns, with Federal Reserve Assistance, and Federal Reserve announces creation of the Primary Dealer Credit Facility.
June 4 Monoline insurers MBIA and AMBAC are downgraded by Moody’s and S&P. July 15 U.S. Securities and Exchange Commission issues an order banning naked short‐selling of
financial stocks. September 7 Federal government takes over Fannie Mae and Freddie Mac. September 15 Lehman Brothers files for bankruptcy.September 16 The Reserve Primary Fund, a money market fund, “breaks the buck,” causing a run on MMFs.
Federal Reserve lends $85 billion to AIG to avoid bankruptcy. September 19 U.S. Treasury announces temporary guarantee of MMFs, and Federal Reserve announces the
Asset‐Backed Commercial Paper Money Market Mutual Funds Liquidity Facility.. September 25 Washington Mutual, the largest savings and loan in the U.S. with $300 billion in assets, is
seized by the authorities. October Financial crisis spreads to Europe.October 3 U.S. Congress approves the Troubled Asset Relief Program (TARP), authorizing expenditures
of $700 billion. October 8 Central banks in US, England, China, Canada, Sweden, Switzerland, and the European Central
Bank cut interest rates in a coordinated effort to aid world economy. October 13 Major central banks announced unlimited provision of liquidity to U.S. dollar funds; European
governments announce system‐wide bank recapitalization plans. October 14 U.S. Treasury invests $250 billion in nine major banks.
2009 May Results of the Supervisory Capital Assessment Program (“stress tests”) announced.June National Bureau of Economic Research subsequently declares June to be the business cycle
trough. October Unemployment rate peaks at 10.0 percent.

25
Table 2: Classification of Events
Central Bank – Monetary Policy and Liquidity Support
Interest rate change Reduction of interest rates
Liquidity support
Reserve Requirements, longer funding terms, more auctions and/or higher credit lines Government – Financial Sector Stabilization Measures Recapitalization
Capital injection (common stock / preferred equity) Capital injection (subordinated debt) Liability guarantees1
Enhancement of depositor protection Debt guarantee (all liabilities) Debt guarantee (new liabilities) Government lending to an individual institution Asset purchases2
Asset purchases (individual assets, bank by bank) Asset purchases (individual “bad bank”) Provisions of liquidity in context of bad asset purchases/removal On‐balance‐sheet “ring‐fencing” with toxic assets kept in the bank Off‐balance‐sheet “ring‐fencing” with toxic assets moved to a “bad bank” Asset guarantees
Source: Table 3.1, IMF (2009)
1Includes the Federal Reserve’s liquidity support to AIG for toxic asset removal to a special‐purpose vehicle, coupled with government’s loss sharing.
2Includes business loan guarantees as part of financial sector stabilization measures (e.g. the United Kingdom, Germany); for some countries, asset purchases were not conducted by the government, but (also) by the central bank (or a central‐bank sponsored) agent such as the United States and Switzerland.
26
Source: Schularick and Taylor (2012).
0
0.5
1
1.5
2
1870 1880 1890 1900 1910 1920 1930 1940 1950 1960 1970 1980 1990 2000 2010
Bank loans/GDP
Bank assets/GDP
Broad money/GDP
Figure 1: Money and Credit Aggregates Relative to GDP(14-country averages by year)

27
0
500
1000
1500
2000
2500
2000 2001 2002 2003 2004 2005 2006 2007 2008 20092010Q1
Figure 2: U.S. Private‐Label Term Securitization Issuance by Type(In billions of U.S. dollars)
CDO2
CDO
RMBS
ABS
Sources: IMF (2010).

28
Source: Reinhart and Rogoff (2008).
95
100
105
110
115
120
125
130
135
t‐4 t‐3 t‐2 t‐1 T t+1 t+2 t+3
Inde
xFigure 3: Real Housing Prices and Banking Crises
Average for banking crises in
US, 2003=100
Index t-4=100 Average for the "Big 5" Crises

29
Figure 4: Runs on Asset‐Backed Commercial Paper Programs
The solid line plots the percent of programs experiencing a run. We define that a program experiences a run in weeks when it does not issue paper but has at least 10% of paper maturing or when the program continues to not issue after experiencing a run in the previous week (see equation (1) in the text). The dotted line plots the unconditional probability of not experiencing a run in a given week after having experienced a run in the previous week (i.e., the hazard rate of leaving the run state). The figure is based on weekly data from DTCC on paper outstanding, maturities, and issuance for 339 ABCP programs in 2007.
Source: Covitz, Liang, and Suarez (2011).
0
10
20
30
40
50
603-
Jan-
07 17-…
31-…
14-…
28-…
14-…
28-…
11-…
25-… 9-…
23-… 6-…
20-…
4-Ju
l-07
18- … 1-…
15-…
29-…
12-…
26-…
10-…
24-… 7-…
21-… 5-…
19-…
Perc
ent
Fraction of ABCP programs experiencing runs
Weekly

30
Figure 5: Money Market Funds (McCabe (2010))

31
Figure 6: Average Haircuts (on nine asset classes; equally weighted)
Source: Gorton and Metrick (2012).
0%
5%
10%
15%
20%
25%
30%
35%
40%
45%
50%
Percen
tage

32
Figure 7: Plans of Constrained vs. Unconstrained Firms
Source: Campello, Graham and Harvey (2010).
‐22
‐9‐9.1
‐0.6
‐32.4
‐4.5
‐10.9
‐2.7
‐15
‐2.7
‐14.2
‐2.9
‐40
‐30
‐20
‐10
0
10
% Cha
nge
Constrained Unconstrained
Tech expenditures Capital expenditures
Marketing expenditures Number of employees
Cash holdings Dividend payments