gis database (geo-database)
TRANSCRIPT

GIS Database (Geo-database)
CSCE 253-Database
Presented to: Dr. Awad Khalil
Presented by: Sarah Kholousi
Yousra Habib

WHAT IS GIS?
Data capturing
Relationships & patterns

TOP 5 BENEFITS OF GIS 1) Cost savings & increased efficiency

TOP 5 BENEFITS OF GIS 2) Better Decision Making

TOP 5 BENEFITS OF GIS 3) Improved Communication
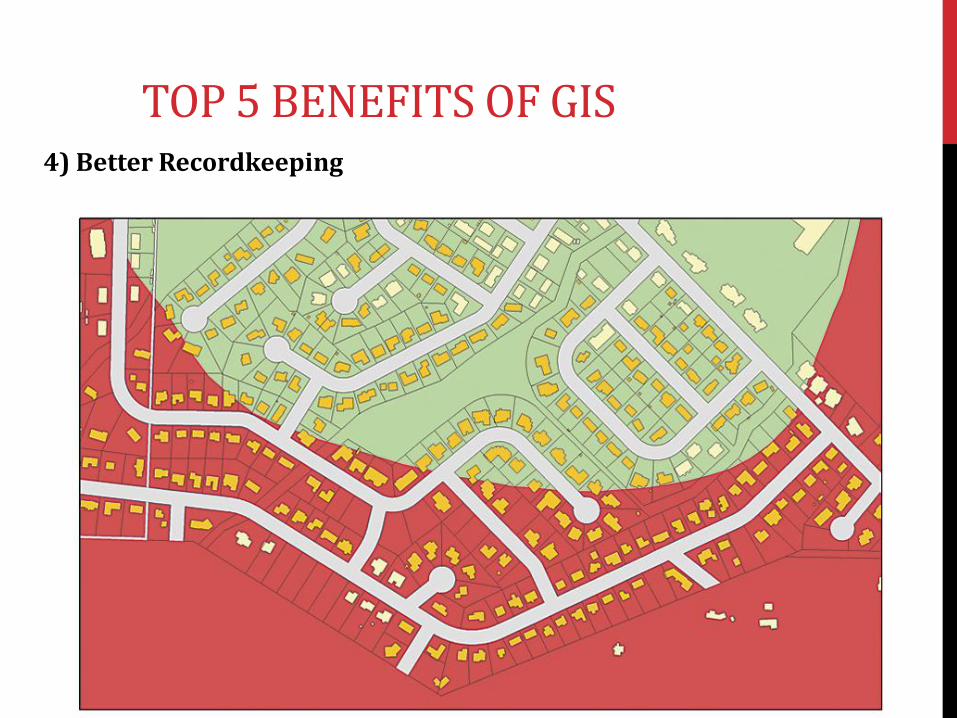
TOP 5 BENEFITS OF GIS 4) Better Recordkeeping

TOP 5 BENEFITS OF GIS 5) Managing geographically

GIS COMPONENTS

1) Frame the Question
2) Find Data
3) Examine the Data
4) Analyze the Data
5) Share Results
Five steps of the Geographic Approach

DATA REPRESENTATION

FUNDAMENTAL DATASETS IN GEODATABASE

FUNDAMENTAL DATASETS IN GEODATABASE
1) Feature Classes
a) point b) line c) area d) annotation e) Dimension f) Multipoint g) Multipatches

TYPES OF FEATURE CLASSES

2) Tables
FUNDAMENTAL DATASETS IN GEODATABASE (CONT.)

3) Raster Dataset
FUNDAMENTAL DATASETS IN GEODATABASE (CONT.)

COMBINATION OF RASTER & VECTOR

GEODATABASE STORAGE IN TABLES & FILES
Oracle
IBM DB2
IBM Informix
Microsoft SQL Server

MODELING ANALYSIS

MODELING ANALYSIS EXAMPLE (CONT’D)
Project Data
Zone
Tool
Classify (Zone=Residential)
Derived Data: Residential
Zone
Project Data
Density
Tool
Classify (Density >=500)
Derived Data: Areas with
Density >=500
Project Data
K-12 Schools
Tool
Buffer (0.25 miles)
Derived Data: Area within 0.25 miles of Schools
Tool
Join
Derived Data: Residential Zones with high density youth areas and
Areas close to schools.

TYPES OF SPATIAL ANALYSIS 1) Queries
a) Attribute Queries
b) Spatial Queries

TYPES OF SPATIAL ANALYSIS b) Spatial Queries

Required from maps in 2 forms (Distance/Area)
Hand-Made (messy/inaccurate)
Usage of GIS tools and digital databases
• Provide speed
• More current data
• Reliability
• Accuracy
• Easier to adjust and edit
• Better visualization
Types of Spatial Analysis
2) Measurements

Distance:
• Between two points on a map
A- B: Alor Setar - Kuala Lumpur
360 KM
B- C: Kuala Lumpur - Kuantan
270 KM
TOTAL: 630 KM

POLYGONAL FEATURES (AREA)
•Perimeter
•The addition of segments length of a closed polygon.
•Area
•Quantitative expression of a surface

3) GEO-PROCESSING
① Buffer
② Overlay
① Clip
② Append
③ Erase
④ Select
⑤ Split
⑥ Dissolve

BUFFER
Creating a zone of specified distance around the point, line or polygon
• Fixed Distance Dissolve
• Fixed Distance overlapping
• Centric
• Variable Distance
Fixed Distance Dissolve
Fixed Distance Overlapping
Centric Variable Distance

OVERLAY
Stacking of layers over each other.
Overlay vector and/or raster data.
Using different layers to determine potential locations for some facilities.

OVERLAY (CONTINUED)

APPLICATIONS
1st application
Land O'Lakes Purina Feed, LLC,
• Manufacture and sell animal feed for 26 different species.
• Expand into new market areas specifically California
Objective: Find established retail feed locations to potentially approach for providing pet food.
1) Collected Demographic variables and internal sales data from different group
Demographic variables • Population
• Age,
• Ethnicity
• Total households income levels
• Marital status and industry data
APPLICATIONS (CONTINUED)
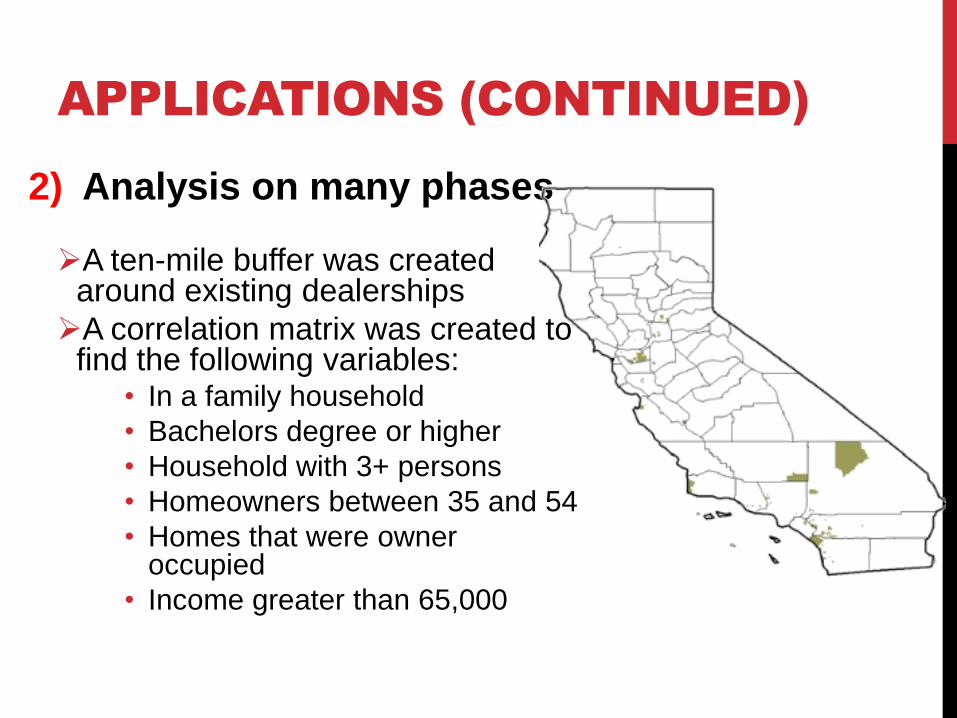
2) Analysis on many phases
A ten-mile buffer was created around existing dealerships
A correlation matrix was created to find the following variables:
• In a family household
• Bachelors degree or higher
• Household with 3+ persons
• Homeowners between 35 and 54
• Homes that were owner occupied
• Income greater than 65,000

3) Figure out the areas where animal population is of greater density.
Surveys to estimate pet ownerships at state level.
Formulas were generated at neighborhood level. Households’ size, household income and ownership and pet
owning households.
Average feeding rate was calculated for each animal
Gross revenue was calculated using the total feed
Top 25% in gross revenue only as they are the most
profitable

Areas with the
top 25% pet
feed gross
revenue.
Areas with
the top
25% horse
feed gross
revenue.
APPLICATIONS (CONTINUED)

APPLICATIONS (CONTINUED)
Greatest gross revenue areas +
customer profile
Result: Suitable and most preferable
areas for market expansion

APPLICATIONS (CONTINUED)
Possible locations for the Land O’Lakes pet feed shop
were generated in a list as they are in the proximity to
the areas of interest.
Benefits of this study: Their Customer profile
Areas of demographic make-up that is
relevant to them
Areas with high gross revenue in both
pet feed and horse feed
Areas with a highly favored
demographic composition in pet and
horse feed.
Lists of feed dealers in those areas of
interest.
An untapped/undeserved market in
which a feed retail location would be
favorable.

APPLICATIONS (CONTINUED)
2nd Application
Amari Studios,
Guitar instruction business located in South Dakota
Objective: Analyze demographics to locate census blocks with
highest percentage of Amari Studio’s identified target market
outside their current service area.
Define Customer profile
Locate consumer groups geographically
Identify Target customer segment’s demographic and
socioeconomic characteristics

APPLICATIONS (CONTINUED)
Census block Variables
Age, sex, race, and population
Variables extracted and added to the ArcGIS.
Collected Data (US census data, Amari Studio’s
current data and Google maps) was converted.
Census blocks were ranked based on desired
attributes giving “high enrollment potential” to
“low enrollment potential” in the form of map.
High enrollment potential were converted into
their own layer for additional analysis.

APPLICATIONS (CONTINUED)
The dark blue areas -high
enrollment potential
The lighter shade- have low
enrollment potential
• Lack an overall large
population or consists of a
percentage of inhabitants
under the age of 15.

APPLICATIONS (CONTINUED)
Further analysis to narrow the potential
areas and focus the client base
Highest five scoring census blocks
were selected
• Initiation of marketing and advertising
campaign could be considered.

APPLICATIONS (CONTINUED)
Testing on the areas of high enrollment
• To check accuracy of results
• Direct mail was sent with different phone codes to
two areas
• Area 1: Census block with highest enrollment potential
• Area 2: Houses that didn’t have the preferable
demographic characteristics.
Response of the potential customers to the
promotional flyer allowed for displaying the level
of interest with the target market chosen.

APPLICATIONS (CONTINUED)
Top five service area
census blocks contained
high number of potential
customers and located
near highly trafficked
public areas.
• Conduct outside
advertising campaigns of
various sorts.

APPLICATIONS (CONTINUED)
Benefits of Analysis to Amari Studios:
Ability to integrate their own customer data,
and create new customer profiles as well as
having Google Maps.
Enhancement of their market research
Reduction of huge costs expense in terms
of analysis and any losses

4) CRIME MAPPING
BUILDING SAFER COMMUNITIES
http://www.crimemapping.com/map.aspx?aid=80d850e3-22ff-
45f9-bdc3-169502e1984d
Developed by the Omega Group
Help law enforcement agencies throughout North America
provide the public with valuable information about recent
crime activity in their neighborhood.
Assist police departments in reducing crime through a
better-informed citizenry.

